Orogenic Gold in Transpression and Transtension Zones: Field and Remote Sensing Studies of the Barramiya–Mueilha Sector, Egypt


Abstract
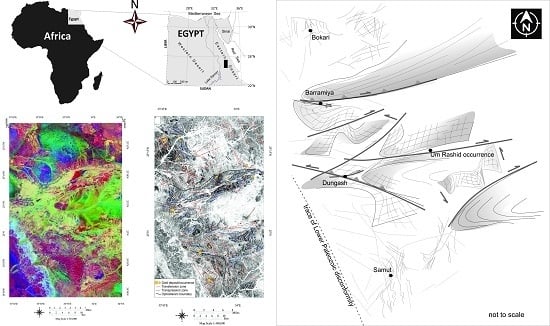
1. Introduction
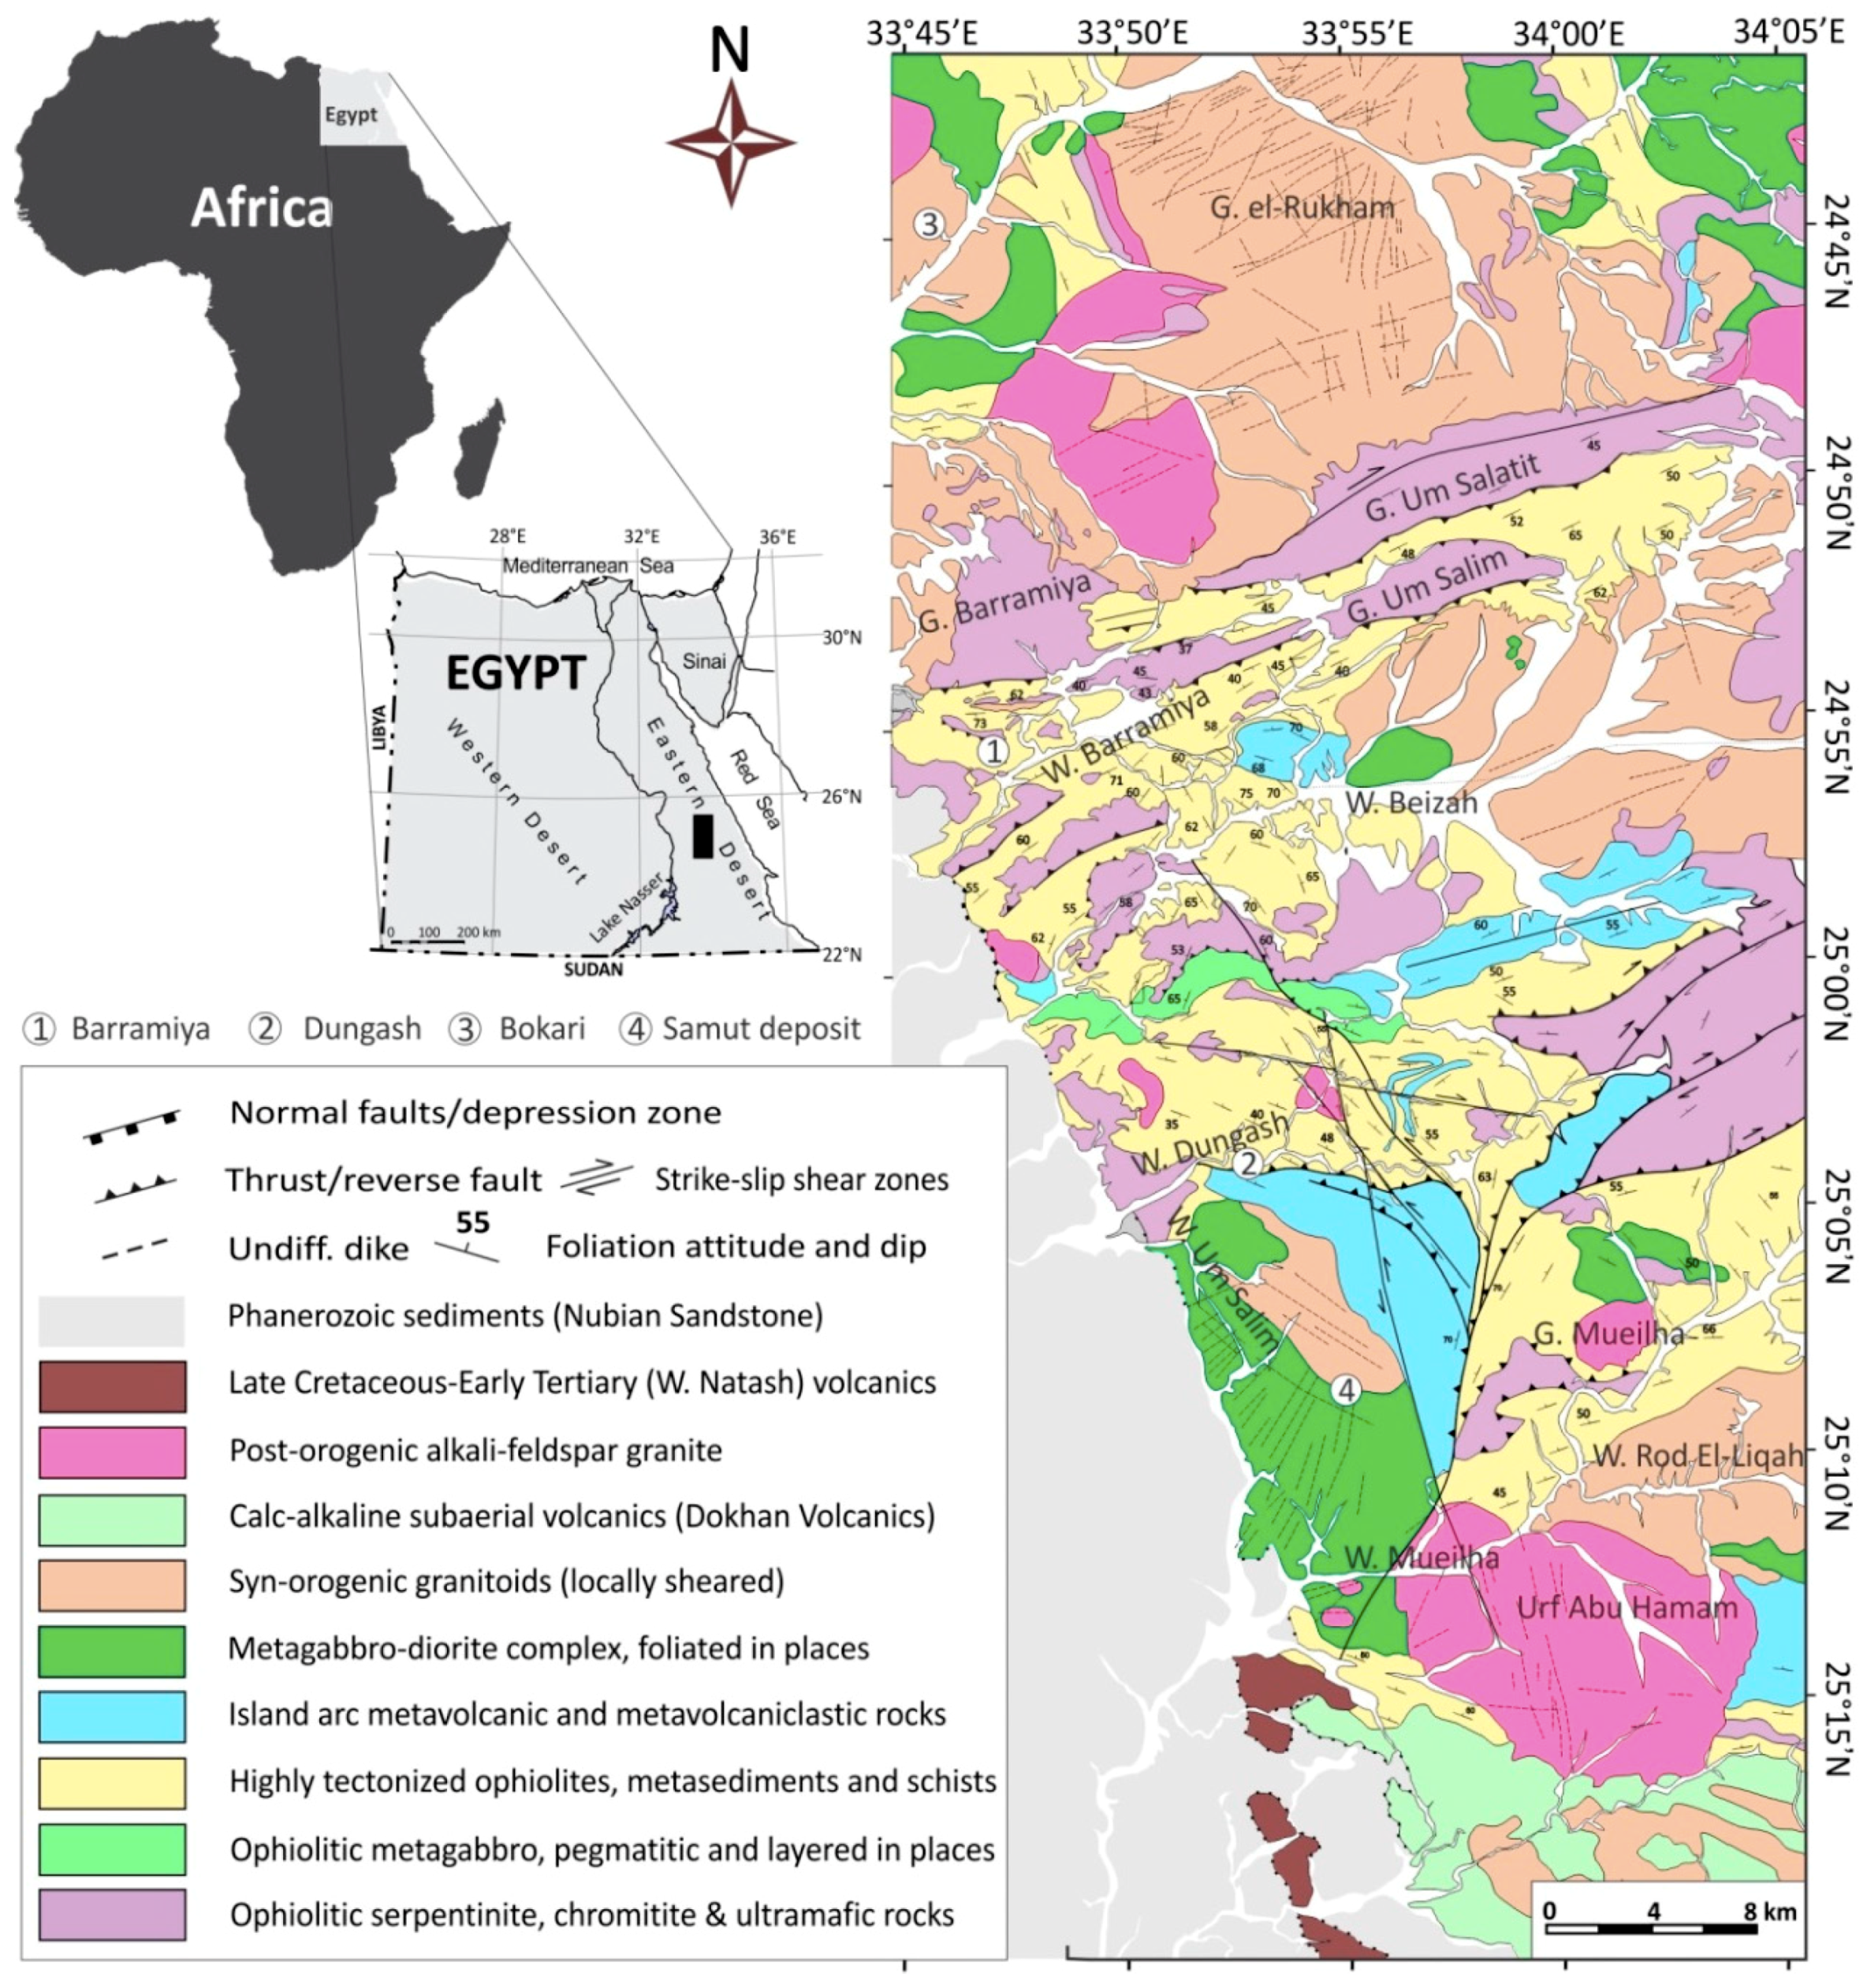
2. Geologic Setting
3. Materials and Methods: SAR and Multispectral Satellite Data
3.1. Data Characteristics
3.2. Pre-Processing Methods
3.3. Image Processing Methods
4. Results
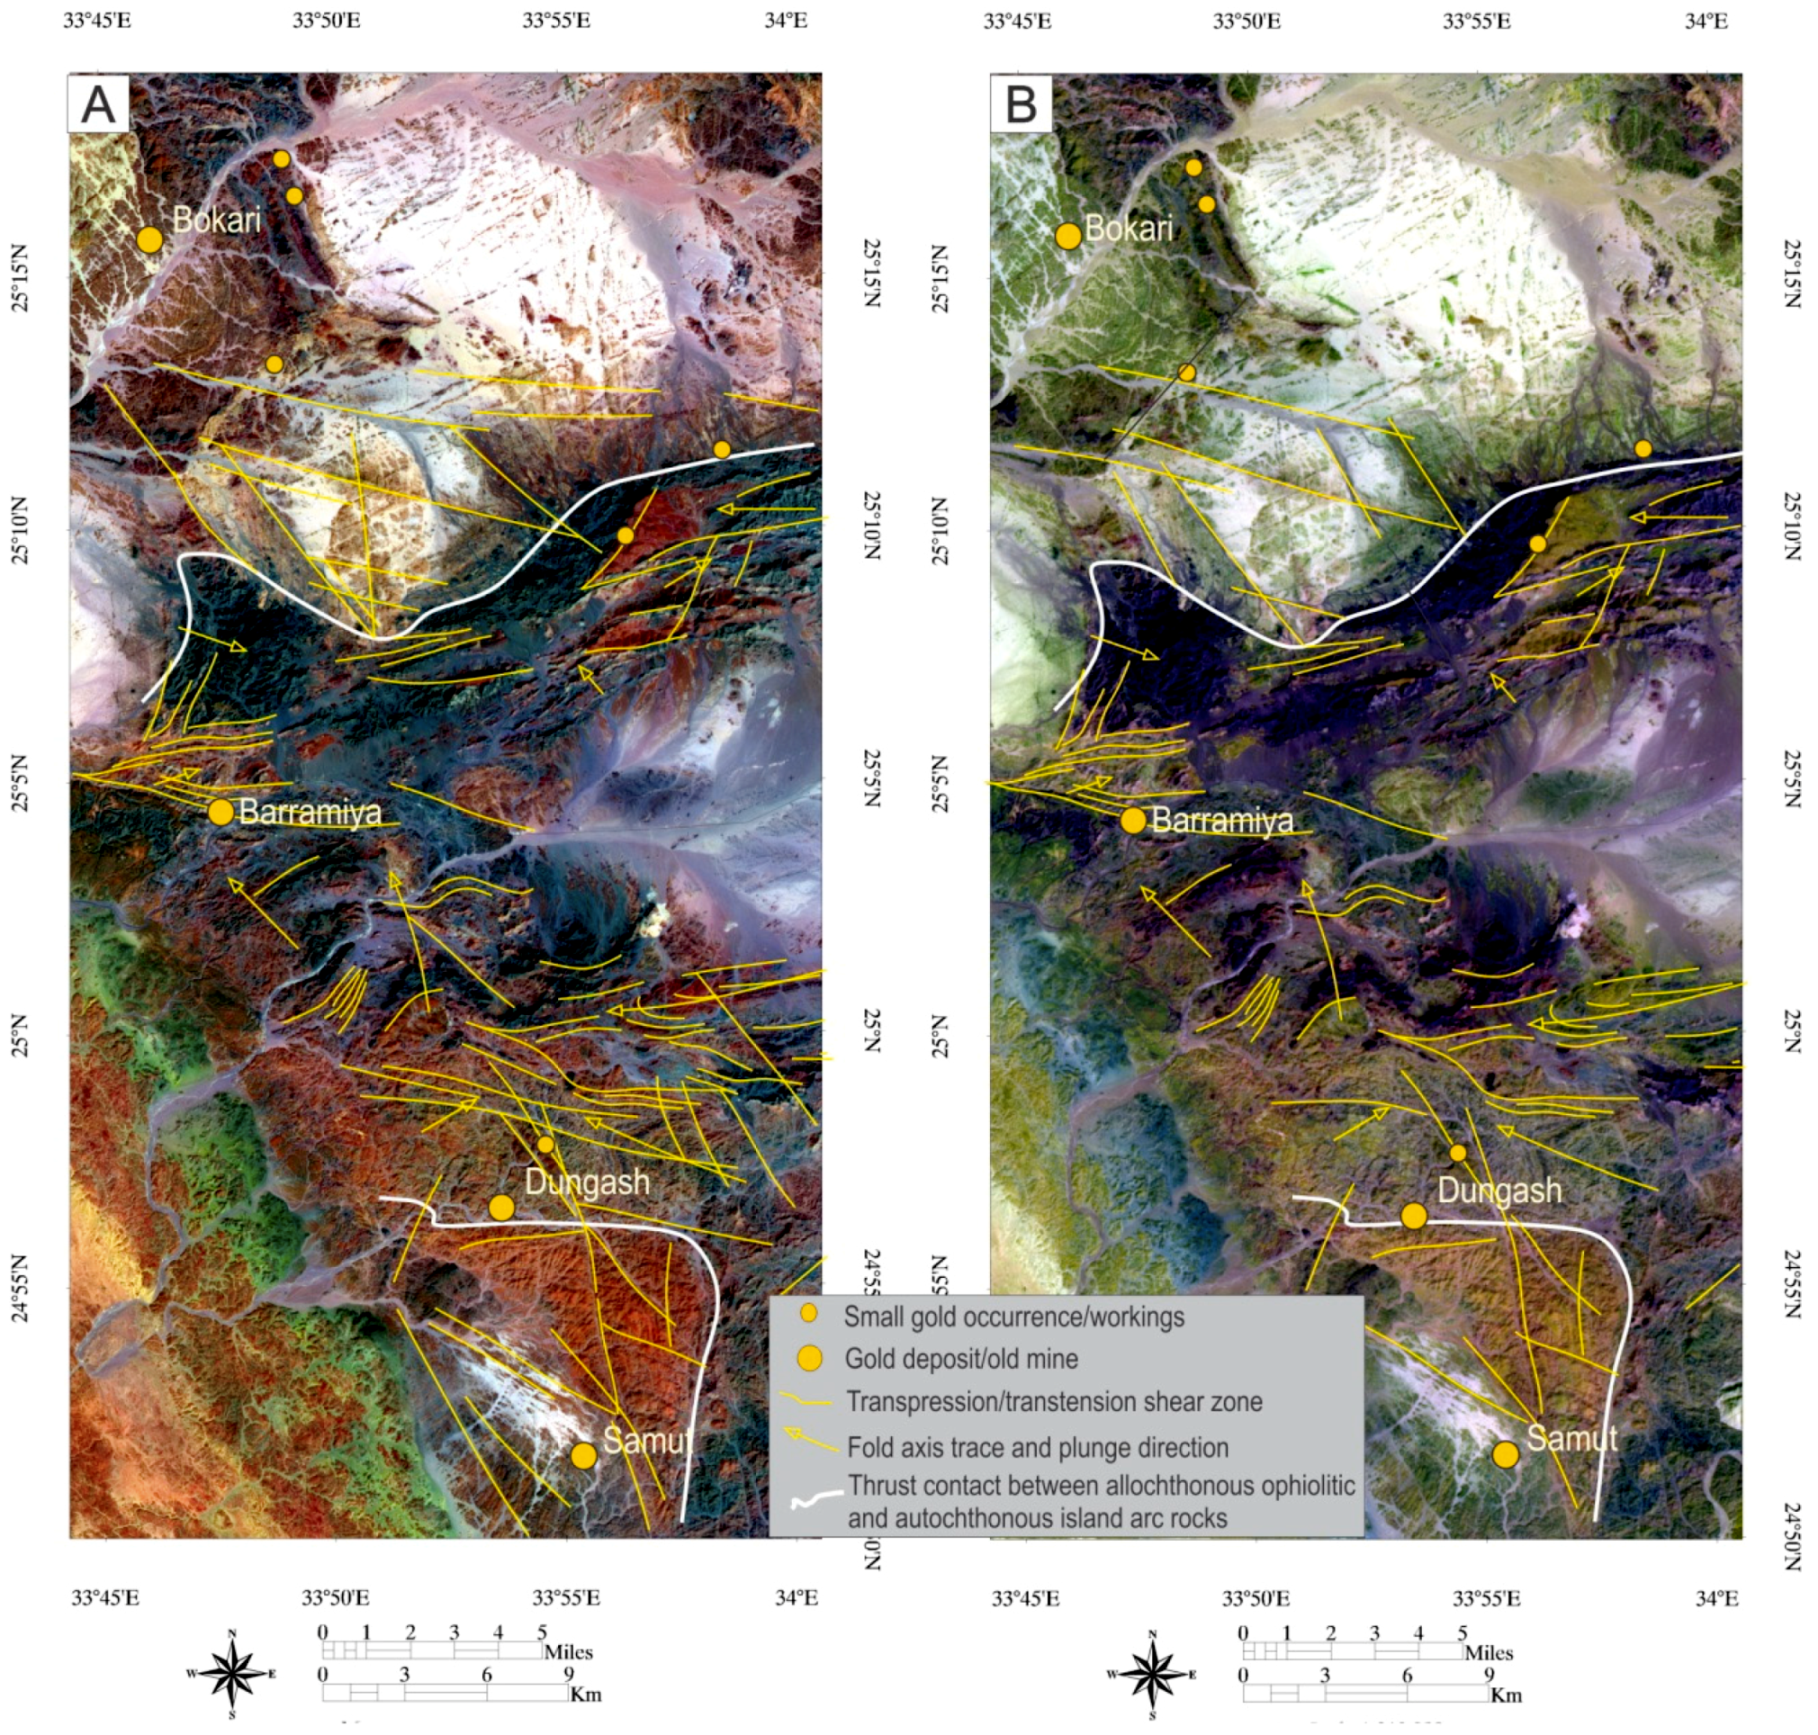
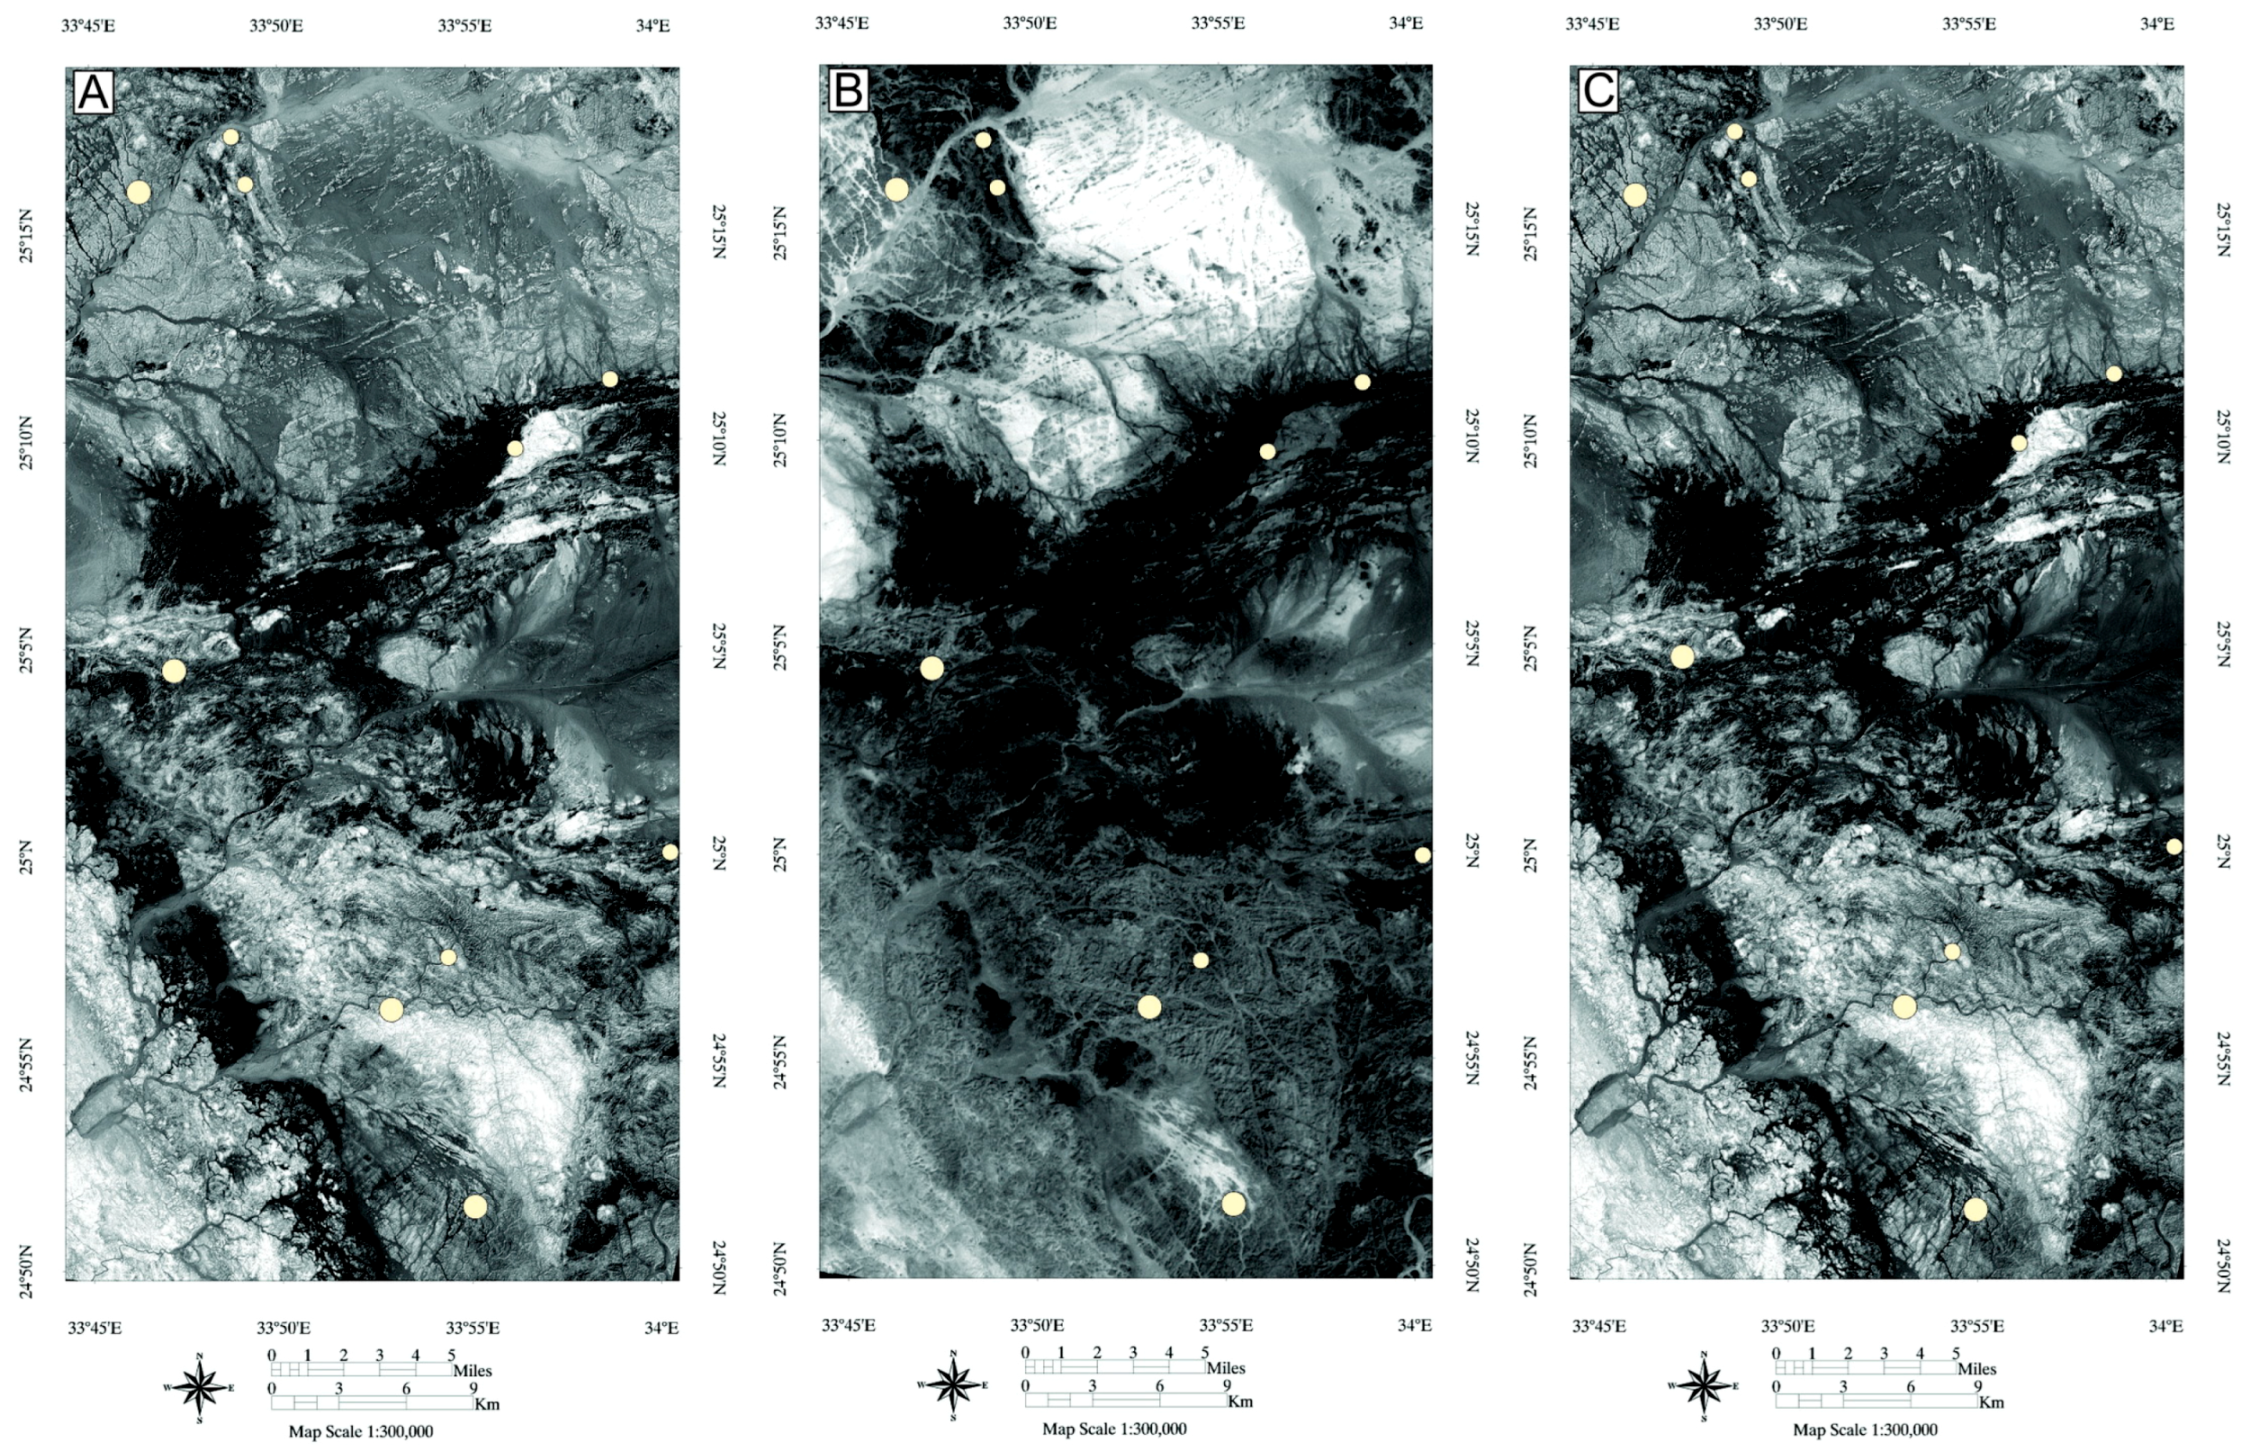
4.1. Remote Sensing Data Analysis
4.2. Fieldwork Data Analysis
4.2.1. Structural Evolution of the Barramiya–Mueilha Area
4.2.2. NNW–SSE Shortening and Southward Tectonic Transport
4.2.3. NNE-SSW Shortening Structures
4.2.4. E–W Oblique Convergence
4.2.5. Exhumation Tectonics
4.2.6. Gold Occurrences in the Barramiya–Mueilha Area
Barramiya Gold Deposit
Dungash Gold Deposit
Bokari Gold Occurrence
Samut Gold Deposit
5. Discussion
6. Conclusions
Author Contributions
Funding
Acknowledgments
Conflicts of Interest
References
- Zoheir, B.A.; Emam, A. Field and ASTER imagery data for the setting of gold mineralization in Western Allaqi-Heiani belt, Egypt: A case study from the Haimur. J. Afr. Earth Sci. 2014, 66–67, 22–34. [Google Scholar] [CrossRef]
- Zoheir, B.A.; Emam, A.; El-Amawy, M.; Abu-Alam, T. Auriferous shear zones in the central Allaqi-Heiani belt: Orogenic gold in post-accretionary structures, SE Egypt. J. Afr. Earth Sci. 2018, 146, 118–131. [Google Scholar] [CrossRef]
- Testa, F.J.; Villanueva, C.; Cooke, D.R.; Zhang, L. Lithological and hydrothermal alteration mapping of epithermal, porphyry and tourmaline breccia districts in the Argentine Andes using ASTER imagery. Remote Sens. 2018, 10, 203. [Google Scholar] [CrossRef]
- Pour, A.B.; Park, T.S.; Park, Y.; Hong, J.K.; Zoheir, B.; Pradhan, B.; Ayoobi, I.; Hashim, M. Application of multi-sensor satellite data for exploration of Zn-Pb sulfide mineralization in the Franklinian Basin, North Greenland. Remote Sens. 2018, 10, 1186. [Google Scholar] [CrossRef]
- Noori, L.; Pour, B.A.; Askari, G.; Taghipour, N.; Pradhan, B.; Lee, C.-W.; Honarmand, M. Comparison of Different Algorithms to Map Hydrothermal Alteration Zones Using ASTER Remote Sensing Data for Polymetallic Vein-Type Ore Exploration: Toroud–Chahshirin Magmatic Belt (TCMB), North Iran. Remote Sens. 2019, 11, 495. [Google Scholar] [CrossRef]
- Sheikhrahimi, A.; Pour, B.A.; Pradhan, B.; Zoheir, B. Mapping hydrothermal alteration zones and lineaments associated with orogenic gold mineralization using ASTER remote sensing data: A case study from the Sanandaj-Sirjan Zone, Iran. Adv. Space Res. 2019, 63, 3315–3332. [Google Scholar] [CrossRef]
- Woodhouse, I.H. Introduction to Microwave Remote Sensing; CRC Press: Boca Raton, FL, USA; Taylor & Francis Group: Boca Raton, FL, USA, 2006. [Google Scholar]
- Abdelsalam, M.G.; Robinson, C.; El-Baz, F.; Stern, R. Application of orbital imaging radar for geologic studies in arid regions: The Saharan Testimony. Photogramm. Eng. Remote Sens. 2000, 66, 717–726. [Google Scholar]
- Kusky, T.M.; Ramadan, T.M. Structural controls on Neoproterozoic mineralization in the South Eastern Desert, Egypt: An integrated field, Landsat TM, and SIR-C/X SAR approach. J. Afr. Earth Sci. 2002, 35, 107–121. [Google Scholar] [CrossRef]
- Pour, A.B.; Hashim, M. Structural geology mapping using PALSAR data in the Bau gold mining district, Sarawak, Malaysia. Adv. Space Res. 2014, 54, 644–654. [Google Scholar] [CrossRef]
- Pour, A.B.; Park, Y.; Crispini, L.; Läufer, A.; Kuk Hong, J.; Park, T.-Y.S.; Zoheir, B.; Pradhan, B.; Muslim, A.M.; Hossain, M.S.; et al. Mapping Listvenite Occurrences in the Damage Zones of Northern Victoria Land, Antarctica Using ASTER Satellite Remote Sensing Data. Remote Sens. 2019, 11, 1408. [Google Scholar] [CrossRef]
- Pour, A.B.; Hashim, M.; Park, Y.; Hong, J.K. Mapping alteration mineral zones and lithological units in Antarctic regions using spectral bands of ASTER remote sensing data. Geocarto Int. 2018, 33, 1281–1306. [Google Scholar] [CrossRef]
- Pour, A.B.; Hashim, M.; Hong, J.K.; Park, Y. Lithological and alteration mineral mapping in poorly exposed lithologies using Landsat-8 and ASTER satellite data: North-eastern Graham Land, Antarctic Peninsula. Ore Geol. Rev. 2019, 108, 112–133. [Google Scholar] [CrossRef]
- Pour, B.A.; Hashim, M. Structural mapping using PALSAR data in the Central Gold Belt, Peninsular Malaysia. Ore Geol. Rev. 2015, 64, 13–22. [Google Scholar] [CrossRef]
- Pour, A.B.; Hashim, M.; Makoundi, C.; Zaw, K. Structural Mapping of the Bentong-Raub Suture Zone Using PALSAR Remote Sensing Data, Peninsular Malaysia: Implications for Sediment-hosted/Orogenic Gold Mineral Systems Exploration. Resour. Geol. 2016, 66, 368–385. [Google Scholar] [CrossRef]
- Adiri, Z.; Harti, A.; Jellouli, A.; Lhissou, R.; Maacha, L.; Azmi, M.; Zouhair, M.; Bachaoui, M. Comparison of Landsat-8, ASTER and Sentinel 1 satellite remote sensing data in automatic lineaments extraction: A case study of Sidi Flah-Bouskour inlier, Moroccan Anti Atlas. Adv. Space Res. 2017, 60, 2355–2367. [Google Scholar] [CrossRef]
- Hamimi, Z.; El-Fakharani, A.; Emam, A.; Barreiro, J.G.; Abdelrahman, E.; Abo-Soliman, M.Y. Reappraisal of the kinematic history of Nugrus shear zone using PALSAR and microstructural data: Implications for the tectonic evolution of the Eastern Desert tectonic terrane, northern Nubian Shield. Arab. J. Geosci. 2018, 11, 494. [Google Scholar] [CrossRef]
- Javhar, A.; Chen, X.; Bao, A.; Jamshed, A.; Yunus, M.; Jovid, A.; Latipa, T. Comparison of Multi-Resolution Optical Landsat-8, Sentinel-2 and Radar Sentinel-1 Data for Automatic Lineament Extraction: A Case Study of Alichur Area, SE Pamir. Remote Sens. 2019, 11, 778. [Google Scholar] [CrossRef]
- Hunt, G.R.; Ashley, P. Spectra of altered rocks in the visible and near infrared. Econ. Geol. 1979, 74, 1613–1629. [Google Scholar] [CrossRef]
- Clark, R.N.; King, T.V.V.; Klejwa, M. and Swayze, G.A. High spectral resolution reflectance spectroscopy of minerals. J. Geophys. Res. 1990, 95, 12653–12680. [Google Scholar] [CrossRef]
- Huntington, J.F. The role of remote sensing in finding hydrothermal mineral deposits on Earth. Evol. Hydrother. Ecosyst. Earth Mars 1996, 21, 214–234. [Google Scholar]
- Kruse, F.A.; Perry, S.L. Mineral mapping using simulated Worldview-3 short-wave-infrared imagery. Remote Sens. 2013, 5, 2688–2703. [Google Scholar] [CrossRef]
- Askari, G.; Pour, A.B.; Pradhan, B.; Sarfi, M.; Nazemnejad, F. Band Ratios Matrix Transformation (BRMT): A Sedimentary Lithology Mapping Approach Using ASTER Satellite Sensor. Sensors 2018, 18, 3213. [Google Scholar] [CrossRef]
- Haselwimmer, C.E.; Riley, T.R.; Liu, J.G. Assessing the potential of multispectral remote sensing for lithological mapping on the Antarctic Peninsula: Case study from eastern Adelaide Island, Graham Land. Antarct. Sci. 2010, 22, 299–318. [Google Scholar] [CrossRef]
- van der Werff, H.; van der Meer, F. Sentinel-2 for Mapping Iron Absorption Feature Parameters. Remote Sens. 2015, 7, 12635–12653. [Google Scholar] [CrossRef]
- van der Werff, H.; van der Meer, F. Sentinel-2A MSI and Landsat 8 OLI Provide Data Continuity for Geological Remote Sensing. Remote Sens. 2016, 8, 883. [Google Scholar] [CrossRef]
- Ibrahim, E.; Barnabé, P.; Ramanaidou, E.; Pirarda, E. Mapping mineral chemistry of a lateritic outcrop in new Caledonia through generalized regression using Sentinel-2 and field reflectance spectra. Int. J. Appl. Earth Obs. Geoinf. 2018, 73, 653–665. [Google Scholar] [CrossRef]
- El Ramly, M.F.; Greiling, R.O.; Rashwan, A.A.; Rasmy, A.H. Explanatory note to accompany the geological and structural maps of Wadi Hafafit area, Eastern Desert of Egypt. Geol. Surv. Egypt 1993, 9, 1–53. [Google Scholar]
- Gabra, S.Z. Gold in Egypt. A commodity package: Minerals, petroleum and groundwater assessment program. USAID project 363-0105. Geol. Surv. Egypt 1986. [Google Scholar]
- El-Gaby, S.; List, F.K.; Tehrani, R. Geology, evolution and metallogenesis of thePan-African Belt in Egypt. In The Pan-African Belt of Northeast Africa and Adjacent Areas; El Gaby, S., Greiling, R.O., Eds.; Friedrich Vieweg Sohn: Braunschweig, Germany, 1988; pp. 17–68. [Google Scholar]
- Hussein, A.A. Mineral deposits. In The Geology of Egypt: Rotterdam; Said, R., Ed.; A.A. Balkema: Avereest, The Netherlands, 1990; pp. 511–566. [Google Scholar]
- Botros, N.S. A new classification of the gold deposits of Egypt. Ore Geol. Rev. 2004, 25, 1–37. [Google Scholar] [CrossRef]
- Zoheir, B.A. Characteristics and genesis of shear zone-related gold mineralization in Egypt: A case study from the Um El Tuyor mine, south Eastern Desert. Ore Geol. Rev. 2008, 34, 445–470. [Google Scholar] [CrossRef]
- Zoheir, B.A. Structural controls, temperature-pressure conditions and fluid evolution of orogenic gold mineralisation in Egypt: A case study from the Betam gold mine, south Eastern Desert. Miner. Depos. 2008, 43, 79–95. [Google Scholar] [CrossRef]
- Zoheir, B.A.; Lehmann, B. Listvenite–lode association at the Barramiya gold mine, Eastern Desert, Egypt. Ore Geol. Rev. 2011, 39, 101–115. [Google Scholar] [CrossRef]
- Zoheir, B.A.; Weihed, P. Greenstone-hosted lode-gold mineralization at Dungash mine, Eastern Desert, Egypt. J. Afr. Earth Sci. 2014, 99, 165–187. [Google Scholar] [CrossRef]
- Abd El-Wahed, M.A.; Harraz, H.Z.; El-Behairy, M.H. Transpressional imbricate thrust zones controlling gold mineralization in the Central Eastern Desert of Egypt. Ore Geol. Rev. 2016, 78, 424–446. [Google Scholar] [CrossRef]
- Zoheir, B.A.; Emam, A.; Abd El-Wahed, M.; Soliman, N. Gold endowment in the evolution of the Allaqi-Heiani suture, Egypt: A synthesis of geological, structural, and space-borne imagery data. Ore Geol. Rev. 2019, in press. [Google Scholar] [CrossRef]
- Zoheir, B.A. Transpression zones in ophiolitic mélange terranes: Potential exploration targets for gold in South Eastern Desert of Egypt. J. Geochem. Explor. 2011, 111, 23–38. [Google Scholar] [CrossRef]
- Moore, J.M.M.; Shanti, A.M. The use of stress trajectory analysis in the elucidation of part of the Najd Fault System, Saudi Arabia. Proc. Geol. Assoc. 1973, 84, 383–403. [Google Scholar] [CrossRef]
- Sultan, M.; Arvidson, R.E.; Duncan, I.J.; Stern, R.; El Kaliouby, B. Extension of the Najd Fault System from Saudi Arabia to the central Eastern Desert of Egypt based on integrated field and Landsat observations. Tectonics 1988, 7, 1291–1306. [Google Scholar] [CrossRef]
- El Gaby, S.; List, F.K.; Tehrani, R. The basement complex of the Eastern Desert and Sinai. In The Geology of Egypt; Rushdi, S., Ed.; Balkema: Rotterdam, The Netherlands, 1990; pp. 175–184. [Google Scholar]
- Ali-Bik, M.W.; Taman, Z.; El Kalioubi, B.; Abdel Wahab, W. Serpentinite-hosted talc–magnesite deposits of Wadi Barramiya area, Eastern Desert, Egypt: Characteristics, petrogenesis and evolution. J. Afr. Earth Sci. 2012, 64, 77–89. [Google Scholar] [CrossRef]
- Abd El-Wahed, M.A. Oppositely dipping thrusts and transpressional imbricate zone in the Central Eastern Desert of Egypt. J. Afr. Earth Sci. 2014, 100, 42–59. [Google Scholar] [CrossRef]
- Abu El-Ela, A.M. Geology of Wadi Mubarak district, Eastern Desert, Egypt. Ph.D. Thesis, Tanta University, Tanta Chicago, IL, USA, 1985. [Google Scholar]
- Zoheir, B.; Steele-MacInnis, M.; Garbe-Schönberg, D. Orogenic gold formation in an evolving, decompressing hydrothermal system: Genesis of the Samut gold deposit, Eastern Desert, Egypt. Ore Geol. Rev. 2019, 105, 236–257. [Google Scholar] [CrossRef]
- Abdel-Karim, A.M.; El-Mahallawi, M.M.; Fringer, F. The Ophiolite Mélange of Wadi Dunqash and Wadi Arayis, Eastern Desert of Egypt: Petrogenesis and tectonic evolution. Acta Mineral. Petrogr. (SzegedHung.) 1996, 47, 129–141. [Google Scholar]
- Aboelkhair, H.; Ninomiya, Y.; Watanabe, Y.; Sato, I. Processing and interpretation of ASTER TIR data for mapping of rare-metal-enriched albite granitoids in the Central Eastern Desert of Egypt. J. Afr. Earth Sci. 2010, 58, 141e151. [Google Scholar] [CrossRef]
- Abu El-Rus, M.A.; Mohamed, M.A.; Lindh, A. Mueilha rare metals granite, Eastern Desert of Egypt: An example of a magmatic-hydrothermal system in the Arabian-Nubian Shield. Lithos 2017, 294–295, 362–382. [Google Scholar] [CrossRef]
- Crawford, W.A.; Coulter, D.H.; Hubbard, H.B. The areal distribution, stratigraphy and major element chemistry of the Wadi Natash volcanic series, Eastern Desert, Egypt. J. Afr. Earth Sci. 1984, 2, 119–128. [Google Scholar] [CrossRef]
- Mohamed, F.I.-I. The Natash alkaline volcanic field, Egypt: Geological and mineralogical inference on the evolution of a basalt to rhyolite eruptive suit. J. Volcan Geotherm. Res. 2001, 105, 291–322. [Google Scholar] [CrossRef]
- Torres, R.; Snoeij, P.; Davidson, M.; Bibby, D.; Lokas, S. The Sentinel-1 mission and its application capabilities. IEEE Int. Geosci. Remote Sens. Symp. 2012. [Google Scholar] [CrossRef]
- Balzter, H.; Cole, B.; Thiel, C.; Schmullius, C. Mapping CORINE Land Cover from Sentinel-1A SAR and SRTM Digital Elevation Model Data using Random Forests. Remote Sens. 2015, 7, 14876–14898. [Google Scholar] [CrossRef]
- Attema, E.; Bargellini, P.; Edwards, P.; Levrini, G.; Lokas, S.; Moeller, L.; Rosich-Tell, B.; Secchi, P.; Torres, R.; Davidson, M.; et al. Sentinel-1: The Radar Mission for GMES Operational Land and Sea Services. Bulletin 2007, 131, 10–17. [Google Scholar]
- Igarashi, T. ALOS Mission requirement and sensor specification. Adv. Space Res. 2001, 28, 127–131. [Google Scholar] [CrossRef]
- Rosenqvist, A.; Shimada, M.; Watanabe, M.; Tadono, T.; Yamauchi, K. Implementation of systematic data observation strategies for ALOS PALSAR, PRISM and AVNIR-2. In Proceedings of the 2004 IEEE International IEEE International Geoscience and Remote Sensing Symposium, Anchorage, AK, USA, 20–24 September 2004. [Google Scholar]
- Earth Remote Sensing Data Analysis Center (ERSDAC). PALSAR User’s Guide, 1st ed. 2019. Available online: http://www.eorc.jaxa.jp/ALOS/en/doc/alos_userhb_en.pdf (accessed on 25 April 2019).
- Drusch, M.; Del Bello, U.; Carlier, S.; Colin, O.; Fernandez, V.; Gascon, F.; Hoersch, B.; Isola, C.; Laberinti, P.; Martimort, P.; et al. Sentinel-2: ESA’s optical high-resolution mission for GMES operational services. Remote Sens. Environ. 2012, 120, 25–36. [Google Scholar] [CrossRef]
- van der Meer, F.D.; van der Werff, H.M.A.; van Ruitenbeek, F.J.A. Potential of ESA’s Sentinel-2 for geological applications. Remote Sens. Environ. 2014, 148, 124–133. [Google Scholar] [CrossRef]
- Sheng, Y.; Xia, Z.G. A comprehensive evaluation of filters for radar speckle suppression. In Proceedings of the 1996 International Geoscience and Remote Sensing Symposium, Lincoln, NE, USA, 31 May 1996; pp. 1559–1561. [Google Scholar]
- Lee, J.-S. Digital Image Enhancement and Noise Filtering by Use of Local Statistics. IEEE Trans. Pattern Anal. Mach. Intell. 1980, 2, 165–168. [Google Scholar] [CrossRef] [PubMed]
- Lopes, A.; Touzi, R.; Nezry, E. Adaptive speckle filter and scene heterogeneity. IEEE Trans. Geosci. Remote Sens. 1990, 28, 992–1000. [Google Scholar] [CrossRef]
- Ben-Dor, E.; Kruse, F.A.; Lefkoff, A.B.; Banin, A. Comparison of three calibration techniques for the utilization of GER 63 channel scanner data of Makhtesh Ramon, Negev, Israel. Photogramm. Eng. Remote Sens. 1994, 60, 1339–1354. [Google Scholar]
- Paganelli, F.; Grunsky, E.C.; Richards, J.P.; Pryde, R. Use of RADARSAT-1 principal component imagery for structural mapping: A case study in the Buffalo Head Hills area, northern central Alberta, Canada. Can. J. Remote Sens. 2003, 29, 111–140. [Google Scholar] [CrossRef]
- Pal, S.K.; Majumdar, T.J.; Bhattacharya, A.K. ERS-2 SAR and IRS-1C LISS III data fusion: A PCA approach to improve remote sensing based geological interpretation. ISPRS J. Photogramm. Remote Sens. 2007, 61, 281–297. [Google Scholar] [CrossRef]
- Cheng, Q.; Jing, L.; Panahi, A. Principal component analysis with optimum order sample correlation coefficient for image enhancement. Int. J. Remote Sens. 2006, 27, 3387–3401. [Google Scholar]
- Gupta, R.P.; Tiwari, R.K.; Saini, V.; Srivastava, N. A simplified approach for interpreting principal component images. Adv. Remote Sens. 2013, 2, 111–119. [Google Scholar] [CrossRef]
- Kalinowski, A.; Oliver, S. ASTER Mineral Index Processing Manual. Technical Report; 2004; Geoscience Australia. Available online: http://www.ga.gov.au/image_cache/GA7833.pdf (accessed on 1 June 2019).
- Mars, J.C.; Rowan, L.C. Regional mapping of phyllic- and argillic-altered rocks in the Zagros magmatic arc, Iran, using Advanced Spaceborne Thermal Emission and Reflection Radiometer (ASTER) data and logical operator algorithms. Geosphere 2006, 2, 161–186. [Google Scholar] [CrossRef]
- Abdelsalam, M.G.; Stern, R.J. Sutures and shear zones in the Arabian–Nubian Shield. J. Afr. Earth Sci. 1996, 23, 289–310. [Google Scholar] [CrossRef]
- Abdelsalam, M.G.; Stern, R.J.; Copeland, P.; Elfaki, E.M.; Elhur, B.; Ibrahim, F.M. The Neoproterozoic Keraf Suture in Ne Sudan: Sinistral Transpression along the Eastern Margin of West Gondwana. J. Geol. 1998, 106, 133–148. [Google Scholar] [CrossRef]
- Abdelsalam, M.G.; Abdeen, M.M.; Dwaidar, H.M.; Stern, R.J. Structural evolution of the Neoproterozoic western Allaqi-Heiani Suture, southeastern Egypt. Precambrian Res. 2003, 124, 87–104. [Google Scholar] [CrossRef]
- Loizenbauer, J.; Wallbrecher, E.; Fntz, H.; Neumayr, P.; Khudeir, A.A.; Kloetzil, U. Structural geology, single zircon ages and fluid inclusion studies of the Meatiq metamorphic core complex. Implications for Neoproterozoic tectonics in the Eastern Desert of Egypt. Precambrian Res. 2001, 110, 357–383. [Google Scholar] [CrossRef]
- Fritz, H.; Dalmeyer, D.R.; Wallbrecher, E.; Loizenbauer, J.; Hoinkes, G.; Neumayr, P.; Khudeir, A.A. Neoproterozoic tectonothermal evolution of the Central Eastern Desert, Egypt: A slow velocity tectonic process of core complex exhumation. J. Afr. Earth Sci. 2002, 34, 543–576. [Google Scholar] [CrossRef]
- Shalaby, A.; Stüwe, K.; Makroum, F.; Fritz, H.; Kebede, T.; Klotzli, U. The Wadi Mubarak belt, Eastern Desert of Egypt: A Neoproterozoic conjugate shear system in the Arabian-Nubian Shield. Precambrian Res. 2005, 136, 27–50. [Google Scholar] [CrossRef]
- Abd El-Wahed, M.A. Thrusting and transpressional shearing in the Pan-African nappe southwest El-Sibai core complex, Central Eastern Desert, Egypt. J. Afr. Earth Sci. 2008, 50, 16–36. [Google Scholar] [CrossRef]
- Bailo, T.; Schandelmeier, H.; Franz, G.; Sun, C.-H.; Stern, R. Plutonic and metamorphic rocks from the Keraf Suture (NE Sudan): A glimpse of Neoproterozoic tectonic evolution on the NE margin of W. Gondwana. Precambrian Res. 2003, 123, 67–80. [Google Scholar] [CrossRef]
- Klemm, R.; Klemm, D. Gold and Gold Mining in Ancient Egypt and Nubia. Geoarchaeology of the Ancient Gold Mining in the Egyptian and Sudanese Eastern Deserts; Springer Science & Business Media: Berlin/Heidelberg, Germany, 2013; 649p. [Google Scholar]
- Sabet, A.H.; Tscogoev, V.B.; Bordonosov, V.P.; Badourin, L.M.; Zalata, A.A.; Francis, M.H. On Gold mineralization in the Eastern Desert of Egypt Annals of the Geological. Surv. Egypt 1976, 6, 201–212. [Google Scholar]
- Osman, A. The mode of occurrence of gold-bearing listvenite at El Barramiya gold mine, Eastern desert, Egypt. Middle East Research Centre. Ain Shams University. Earth Sci. Ser. 1995, 9, 93–103. [Google Scholar]
- Osman, A. The gold metallotect in the Eastern Desert of Egypt. In Mineral Deposits at the Beginning of the 21st Century; Piestrzyński, A., Pieczonka, J., A. Głuszek, A., Eds.; Swets & Zeitinger: Lisse, Belgium, 2001; pp. 795–798. [Google Scholar]
- Helba, H.A.; Khalil, K.I.; Abdou, N.M. Alteration patterns related to hydrothermal gold mineralization in meta-andesites at Dungash area, Eastern Desert Egypt. Resour. Geol. 2001, 51, 19–30. [Google Scholar] [CrossRef]
- Khalil, I.K.; Helba, H.A.; Mücke, A. Genesis of the gold mineralization at the Dungash gold mine area, Eastern Desert, Egypt: A mineralogical–microchemical study. J. Afr. Earth Sci. 2003, 37, 111–122. [Google Scholar] [CrossRef]
- Hassan, M.M.; Soliman, M.M.; Azzaz, S.A.; Attawiya, M.Y. Geological studies on gold mineralization at Sukkari, Um Ud, and Samut, Eastern Desert, Egypt. Ann. Geol. Surv. Egypt 1990, 16, 89–95. [Google Scholar]
- Dewey, J.E.; Holdsworth, R.E.; Strachan, R.A. Transpression and transtension zones. In Continental Transpressional and Transtensional Tectonics. Geological Society; Holdsworth, R.E., Strachan, R.A., Dewey, J.E., Eds.; Special Publications: London, UK, 1998; Volume 135, pp. 1–14. [Google Scholar]
- Goldfarb, R.J.; Taylor, R.D.; Collins, G.S.D.; Goryachev, N.A.; Orlandini, O.F. Phanerozoic continental growth and gold metallogeny of Asia. Gondwana Res. 2014, 25, 48–102. [Google Scholar] [CrossRef]
- Harland, W.B. Tectonic transpression in Caledonian Spitsbergen. Geol. Mag. 1971, 108, 27–42. [Google Scholar] [CrossRef]
- Fossen, H.; Tikoff, B.; Teyssier, C.T. Strain modeling of transpressional and transtensional deformation. Nor. Geol. Tidsskrifl 1994, 74, 134–145. [Google Scholar]
- Jones, R.R.; Holdsworth, R.E.; Clegg, P.; McCaffrey, K.; Travarnelli, E. Inclined transpression. J. Struct. Geol. 2004, 30, 1531–1548. [Google Scholar] [CrossRef]
- Sarkarinejad, K.; Faghih, A.; Grasemann, B. Transpressional deformations within the Sanandaj–Sirjan metamorphic belt (Zagros Mountains, Iran). J. Struct. Geol. 2008, 30, 818–826. [Google Scholar] [CrossRef]
- Abd El-Wahed, M.A.; Ashmawy, M.H.; Tawfik, H.A. Structural setting of Cretaceous pull-apart basins and Miocene extensional folds in Quseir-Umm Gheig region, northwestern Red Sea, Egypt. Lithosphere 2010, 2, 13–32. [Google Scholar] [CrossRef]
- Abd El-Wahed, M.A.; Kamh, S.; Ashmawy, M.; Shebl, A. Transpressive Structures in the Ghadir Shear Belt, Eastern Desert, Egypt: Evidence for Partitioning of Oblique Convergence in the Arabian-Nubian Shield during Gondwana Agglutination. Acta Geol. Sin.-Engl. Ed. 2019. [Google Scholar] [CrossRef]
- Abd El-Wahed, M.A.; Kamh, S.Z. Pan African dextral transpressive duplex and flower structure in the Central Eastern Desert of Egypt. Gondwana Res. 2010, 18, 315–336. [Google Scholar] [CrossRef]
- Abd El-Wahed, M.A.; Kamh, S.Z. Evolution of conjugate strike-slip duplexes and wrench-related folding in the Central part of Al Jabal Al Ahkdar, NE Libya. J. Geol. 2013, 121, 173–195. [Google Scholar] [CrossRef]
- Li, S.; Wilde, S.A.; Wanga, T.; Guo, Q. Latest Early Permian granitic magmatism in southern Inner Mongolia, China: Implications for the tectonic evolution of the southeastern Central Asian Orogenic Belt. Gondwana Res. 2016, 29, 168–180. [Google Scholar] [CrossRef]
- Zaw, K.; Meffre, S.; Lai, C.K.; Burrett, C.; Santosh, M.; Graham, I.; Manaka, T.; Salam, A.; Kamvong, T.; Cromie, P. Tectonics and metallogeny of mainland Southeast Asia -A reviewand contribution. Gondwana Res. 2014, 26, 5–30. [Google Scholar]
- Goldfarb, R.J.; Baker, T.; Dube, B.; Groves, D.I.; Hart, C.J.R.; Gosselin, P. Distribution, character, and genesis of gold deposits in metamorphic terranes. In Economic geology one hundredth anniversary volume 1905–2005; Goldfarb, R.J.; Baker, T.; Dube, B.; Groves, D.I.; Hart, C.J.R.; Gosselin, P. Society of Economic Geologists: Littleton, CO, USA, 2005; pp. 407–450. [Google Scholar]
- Reinhardt, M.C.; Davison, I. Structural and lithological controls on gold deposition in the shear zone-hosted Fazenda Brasileiro Mine, Bahia state, Northeast Brazil. Econ. Geol. 1990, 85, 952–967. [Google Scholar] [CrossRef]
- Almond, D.C.; Shaddad, M.Z. Setting of gold mineralization in the northern Red Sea Hills of Sudan. Econ. Geol. 1984, 79, 389–392. [Google Scholar] [CrossRef]
- El-Samani, Y.; Al-Muslem, A.; El Tokhi, M. Geology and geotectonic classification of Pan-African gold mineralizations in the Red Sea Hills, Sudan. Int. Geol. Rev. 2001, 43, 1117–1128. [Google Scholar] [CrossRef]
- Zoheir, B.A.; El-Shazly, A.K.; Helba, H.; Khalil, K.I.; Bodnar, R.J. Origin and evolution of the Um Egat and Dungash orogenic gold deposits, Egyptian eastern desert: Evidence from fluid inclusions in quartz. Econ. Geol. 2008, 103, 405–424. [Google Scholar] [CrossRef]
- Murr, A. Geologische Kartierung der Goldlagerstättenbezirke Fatira und Dungash in der Ostwüste Ägyptens. unpubl. Master thesis, LMUUniversity, Munich, Germany, 1994. [Google Scholar]


| Eigenvector | VH | VV | VH/VV | VH + VV |
|---|---|---|---|---|
| FPCS 1 | 0.230369 | 0.563194 | 0.563194 | 0.563194 |
| FPCS 2 | 0.783316 | −0.591162 | 0.591162 | 0.591162 |
| FPCS 3 | −0.003523 | −0.003523 | 0.999990 | 0.999990 |
| FPCS 4 | −0.999990 | −0.577350 | −0.000000 | 0.577350 |
| Eigenvector | HH | HV | HH/HV | HH + HV |
|---|---|---|---|---|
| FPCS 1 | 0.589359 | 0.194688 | 0.004823 | 0.784047 |
| FPCS 2 | −0.564816 | 0.792703 | −0.025923 | 0.227887 |
| FPCS 3 | 0.017490 | −0.019617 | −0.999652 | −0.002127 |
| FPCS 4 | −0.577350 | −0.577350 | 0.000000 | 0.577350 |
| Eigenvector | Band 1 | Band 2 | Band 3 | Band 4 | Band 5 | Band 6 | Band 7 | Band 8 | Band 9 |
|---|---|---|---|---|---|---|---|---|---|
| PCA 1 | −0.286530 | −0.343729 | −0.329190 | −0.329130 | −0.309398 | −0.316583 | −0.363650 | −0.381071 | −0.331134 |
| PCA 2 | 0.549949 | 0.503725 | 0.370167 | −0.145513 | −0.182937 | −0.175862 | −0.266600 | −0.302618 | −0.242021 |
| PCA 3 | −0.226565 | 0.135415 | 0.271478 | −0.498784 | −0.406829 | −0.358883 | 0.207509 | 0.453128 | 0.255251 |
| PCA 4 | −0.608617 | 0.126442 | 0.533556 | 0.496999 | −0.100609 | −0.083579 | −0.132278 | −0.102609 | −0.191767 |
| PCA 5 | −0.296023 | 0.110156 | 0.237883 | −0.545338 | 0.291567 | 0.563536 | −0.300481 | −0.167608 | 0.159023 |
| PCA 6 | −0.023765 | −0.166820 | 0.260418 | −0.267115 | 0.557757 | −0.291015 | 0.480996 | −0.115227 | −0.438202 |
| PCA 7 | 0.126345 | −0.329776 | 0.249486 | 0.076552 | 0.288319 | −0.444288 | −0.282746 | −0.222119 | 0.630381 |
| PCA 8 | −0.297947 | 0.666275 | −0.453618 | 0.008140 | 0.296406 | −0.318394 | 0.056334 | −0.184583 | 0.187068 |
| PCA 9 | 0.027941 | 0.033903 | −0.061731 | 0.005964 | 0.357891 | −0.178985 | −0.575640 | 0.650058 | −0.283134 |
| Eigenvector | Band 2 | Band 3 | Band 4 | Band 5 | Band 6 | Band 7 | Band 8 | Band 8a | Band 11 | Band 12 |
|---|---|---|---|---|---|---|---|---|---|---|
| PCA 1 | −0.130767 | −0.195965 | −0.294453 | −0.305036 | −0.323206 | −0.340531 | −0.332815 | −0.346959 | −0.421500 | −0.368126 |
| PCA 2 | 0.219830 | 0.283259 | 0.314141 | 0.182452 | 0.160849 | 0.138366 | 0.241307 | 0.086667 | −0.547330 | −0.573705 |
| PCA 3 | −0.330657 | −0.392816 | −0.335883 | 0.295142 | 0.344046 | 0.361373 | −0.324495 | 0.361036 | −0.123340 | −0.191365 |
| PCA 4 | −0.504592 | −0.418581 | 0.185161 | −0.229417 | −0.109091 | −0.024353 | 0.653589 | 0.124095 | −0.162823 | 0.040942 |
| PCA 5 | −0.104777 | −0.066455 | 0.061494 | −0.025064 | 0.018281 | −0.049037 | 0.088132 | −0.110870 | 0.690943 | −0.692817 |
| PCA 6 | 0.250524 | 0.098325 | −0.259140 | −0.241083 | −0.368827 | −0.148165 | 0.049876 | 0.789284 | 0.055270 | −0.125685 |
| PCA 7 | −0.074844 | −0.061944 | 0.038226 | 0.476730 | 0.238402 | −0.824566 | 0.033654 | 0.150443 | −0.015442 | 0.032866 |
| PCA 8 | 0.306221 | −0.016038 | −0.648371 | −0.181613 | 0.458534 | −0.044668 | 0.453038 | −0.186550 | −0.015476 | −0.008441 |
| PCA 9 | −0.054521 | 0.038123 | 0.324790 | −0.643651 | 0.579072 | −0.165281 | −0.282445 | 0.182228 | −0.008348 | 0.010264 |
| PCA 10 | 0.628125 | −0.729531 | 0.263138 | 0.025161 | −0.024824 | 0.011445 | −0.046073 | −0.021424 | 0.006267 | −0.000219 |
© 2019 by the authors. Licensee MDPI, Basel, Switzerland. This article is an open access article distributed under the terms and conditions of the Creative Commons Attribution (CC BY) license (http://creativecommons.org/licenses/by/4.0/).
Share and Cite
Zoheir, B.; El-Wahed, M.A.; Pour, A.B.; Abdelnasser, A. Orogenic Gold in Transpression and Transtension Zones: Field and Remote Sensing Studies of the Barramiya–Mueilha Sector, Egypt. Remote Sens. 2019, 11, 2122. https://doi.org/10.3390/rs11182122
Zoheir B, El-Wahed MA, Pour AB, Abdelnasser A. Orogenic Gold in Transpression and Transtension Zones: Field and Remote Sensing Studies of the Barramiya–Mueilha Sector, Egypt. Remote Sensing. 2019; 11(18):2122. https://doi.org/10.3390/rs11182122
Chicago/Turabian StyleZoheir, Basem, Mohamed Abd El-Wahed, Amin Beiranvand Pour, and Amr Abdelnasser. 2019. "Orogenic Gold in Transpression and Transtension Zones: Field and Remote Sensing Studies of the Barramiya–Mueilha Sector, Egypt" Remote Sensing 11, no. 18: 2122. https://doi.org/10.3390/rs11182122
APA StyleZoheir, B., El-Wahed, M. A., Pour, A. B., & Abdelnasser, A. (2019). Orogenic Gold in Transpression and Transtension Zones: Field and Remote Sensing Studies of the Barramiya–Mueilha Sector, Egypt. Remote Sensing, 11(18), 2122. https://doi.org/10.3390/rs11182122