Monitoring Drought Impact on Annual Forage Production in Semi-Arid Grasslands: A Case Study of Nebraska Sandhills

 , , ,
, , ,  , , and
Abstract
1. Introduction
2. Background, Materials and Methods
2.1. Study Area
2.2. Drought Indices
2.3. PRISM Weather Dataset
2.4. Site Potential
2.5. Suitable Areas for Training Pixels
2.6. Data Analysis
2.6.1. Actual Ecosystem Performance (AEP)
2.6.2. EEP, EB, and Interannual Biomass Deviation
2.6.3. Validation of the EEP Model
2.6.4. Correlation Analysis of Drought Indices
2.6.5. The Predictive Model
3. Results
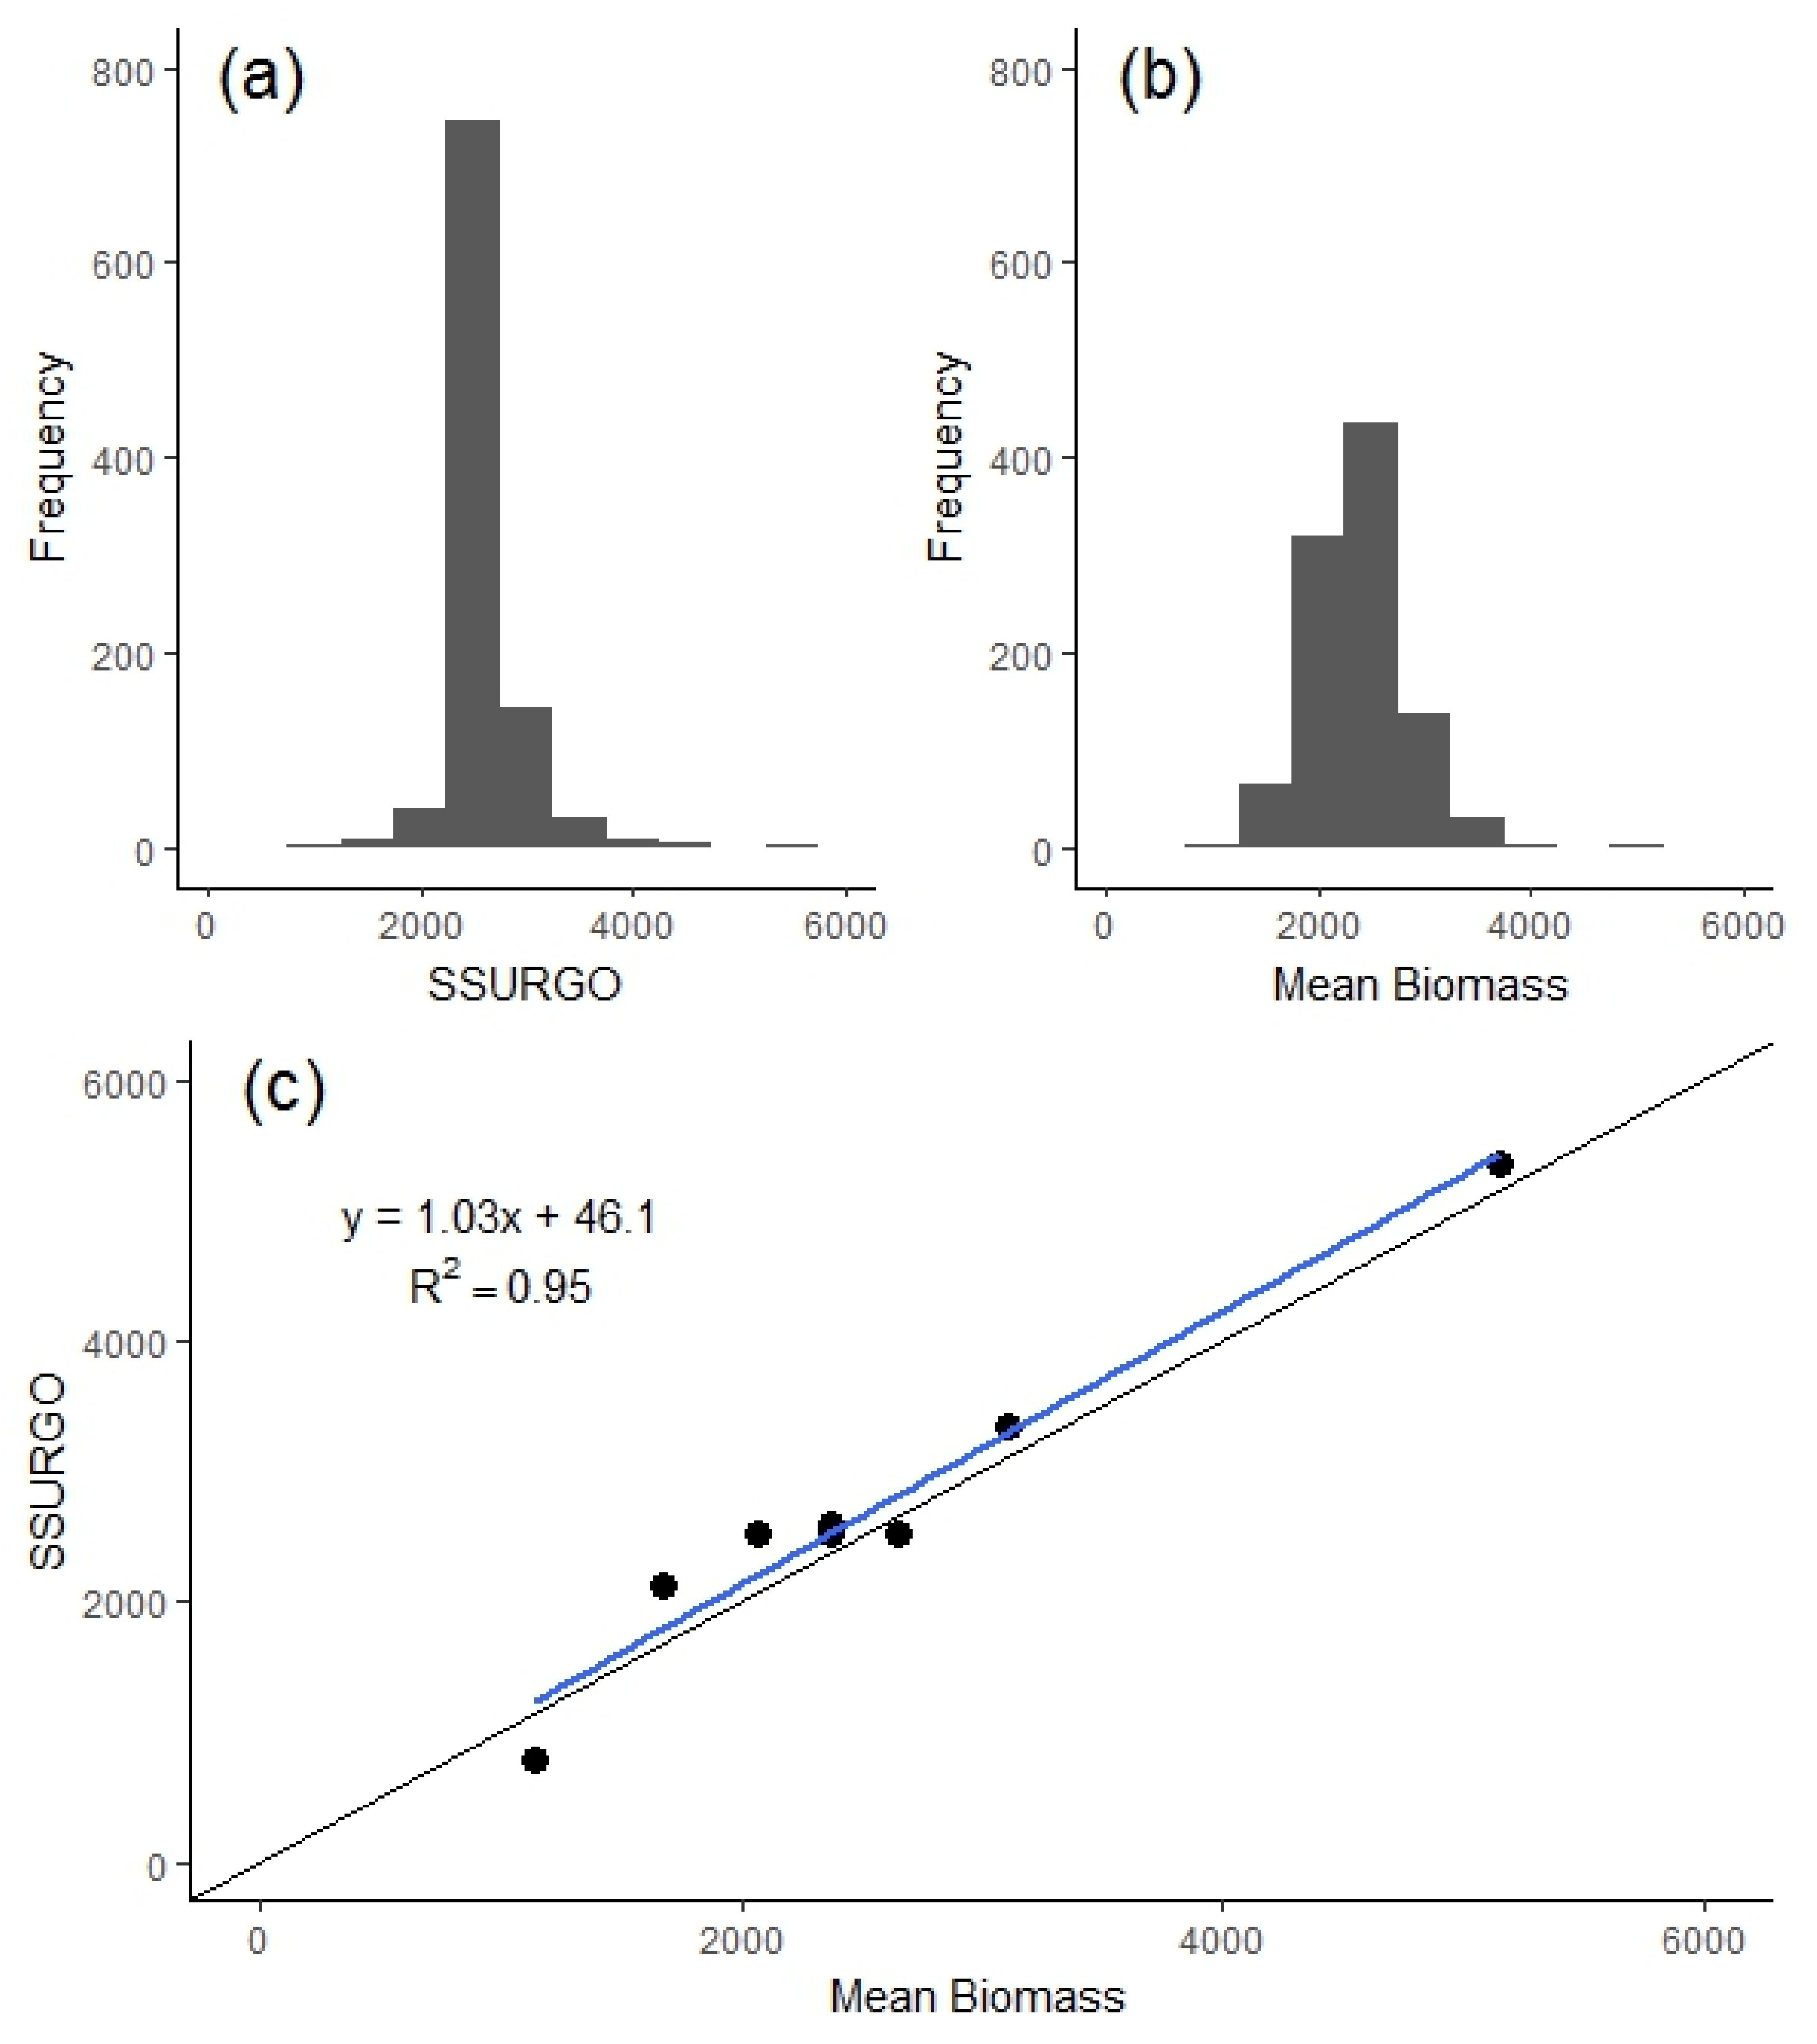
3.1. Site Potential
3.2. EEP Model
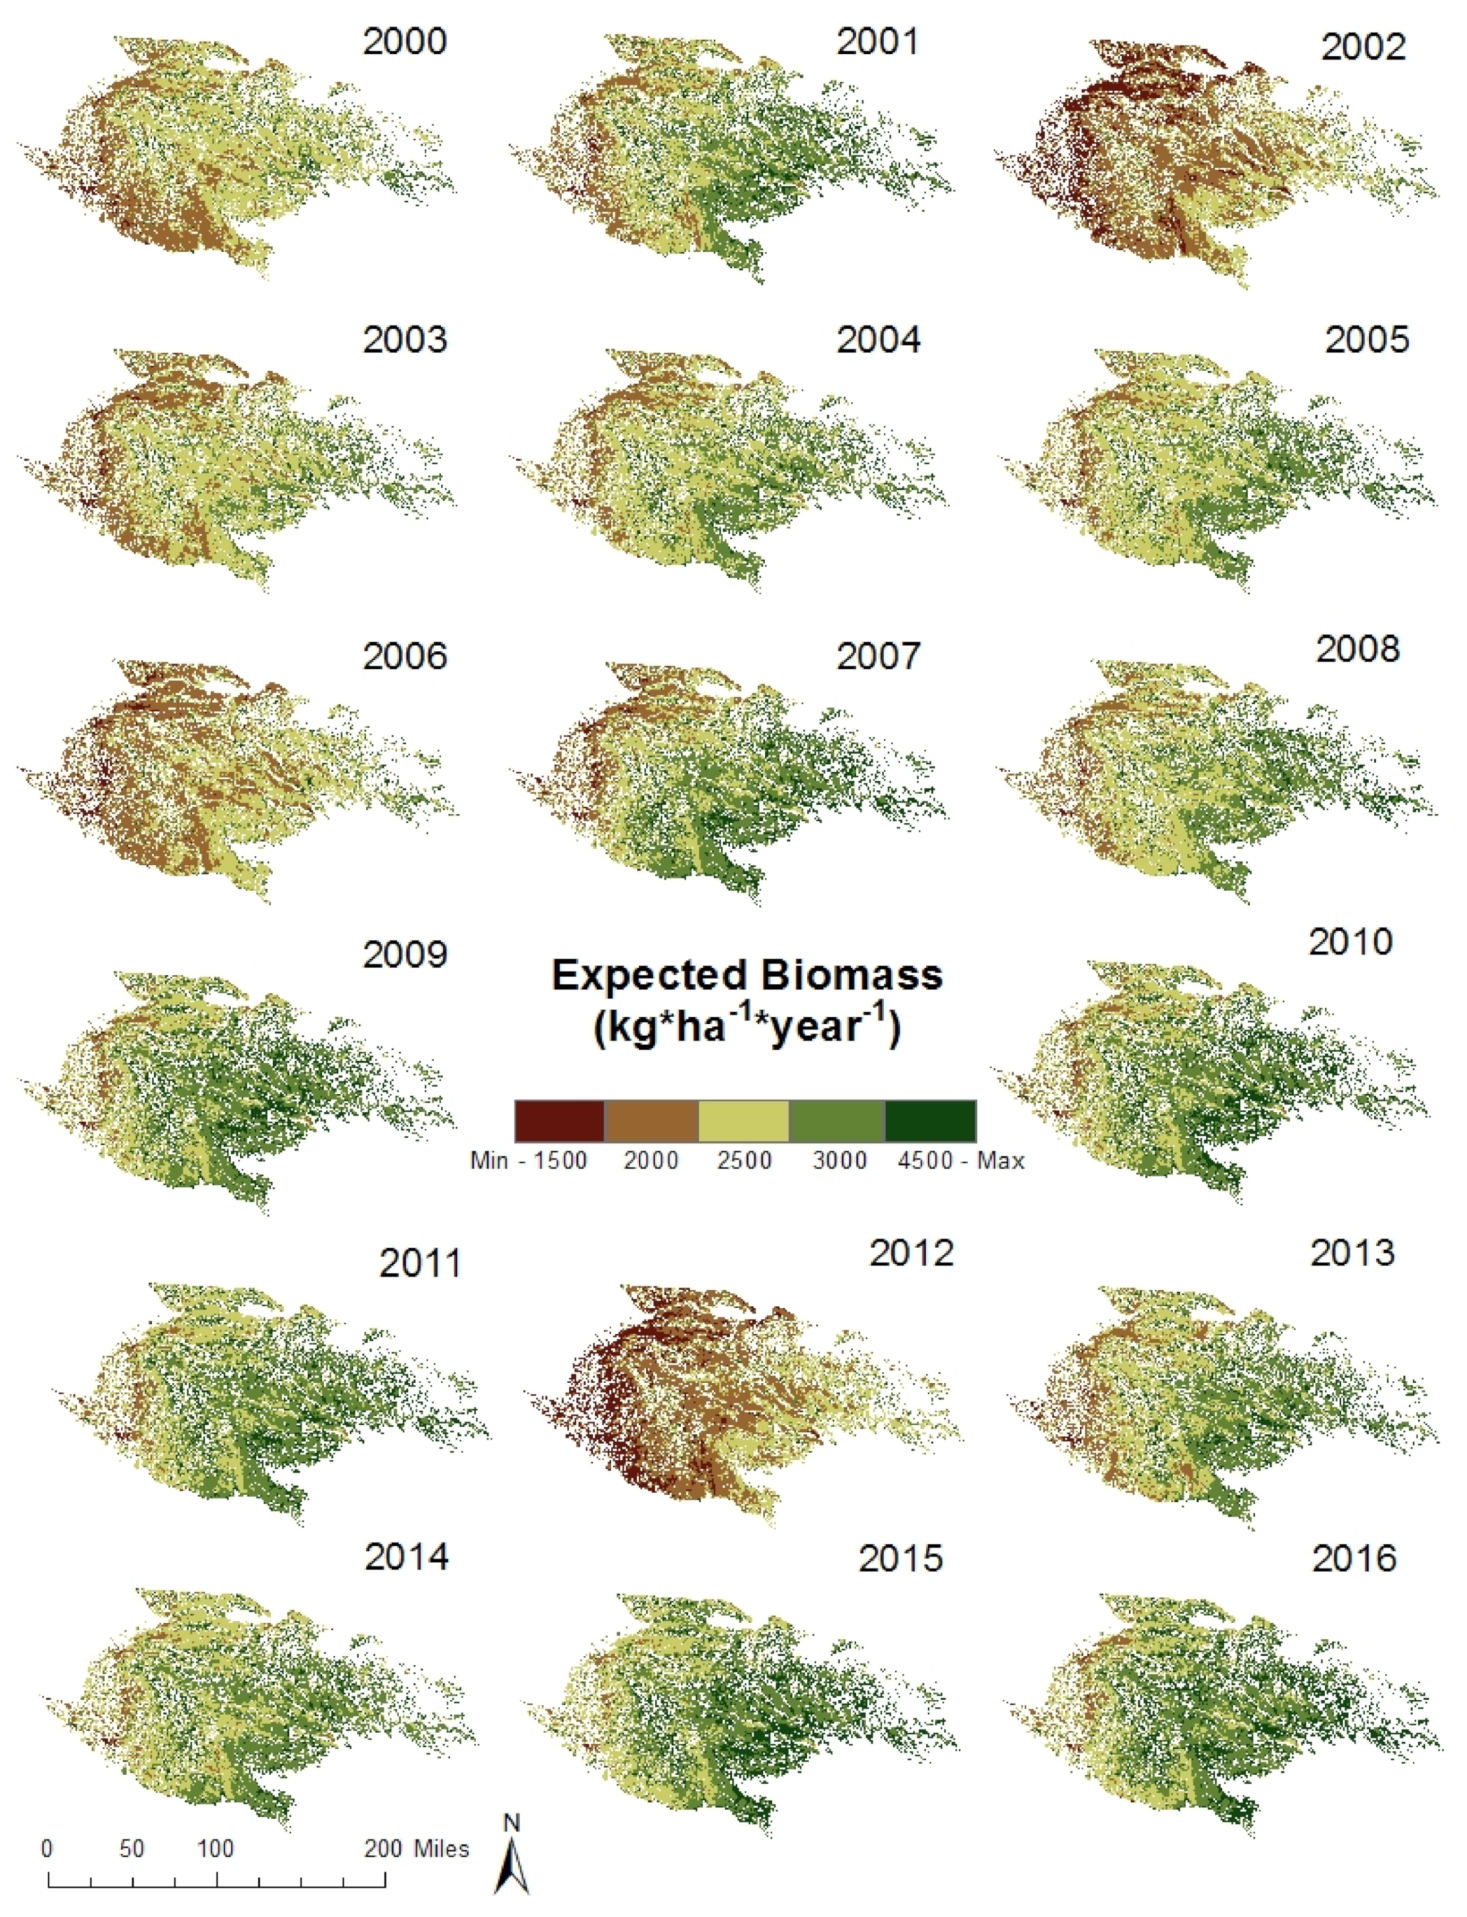
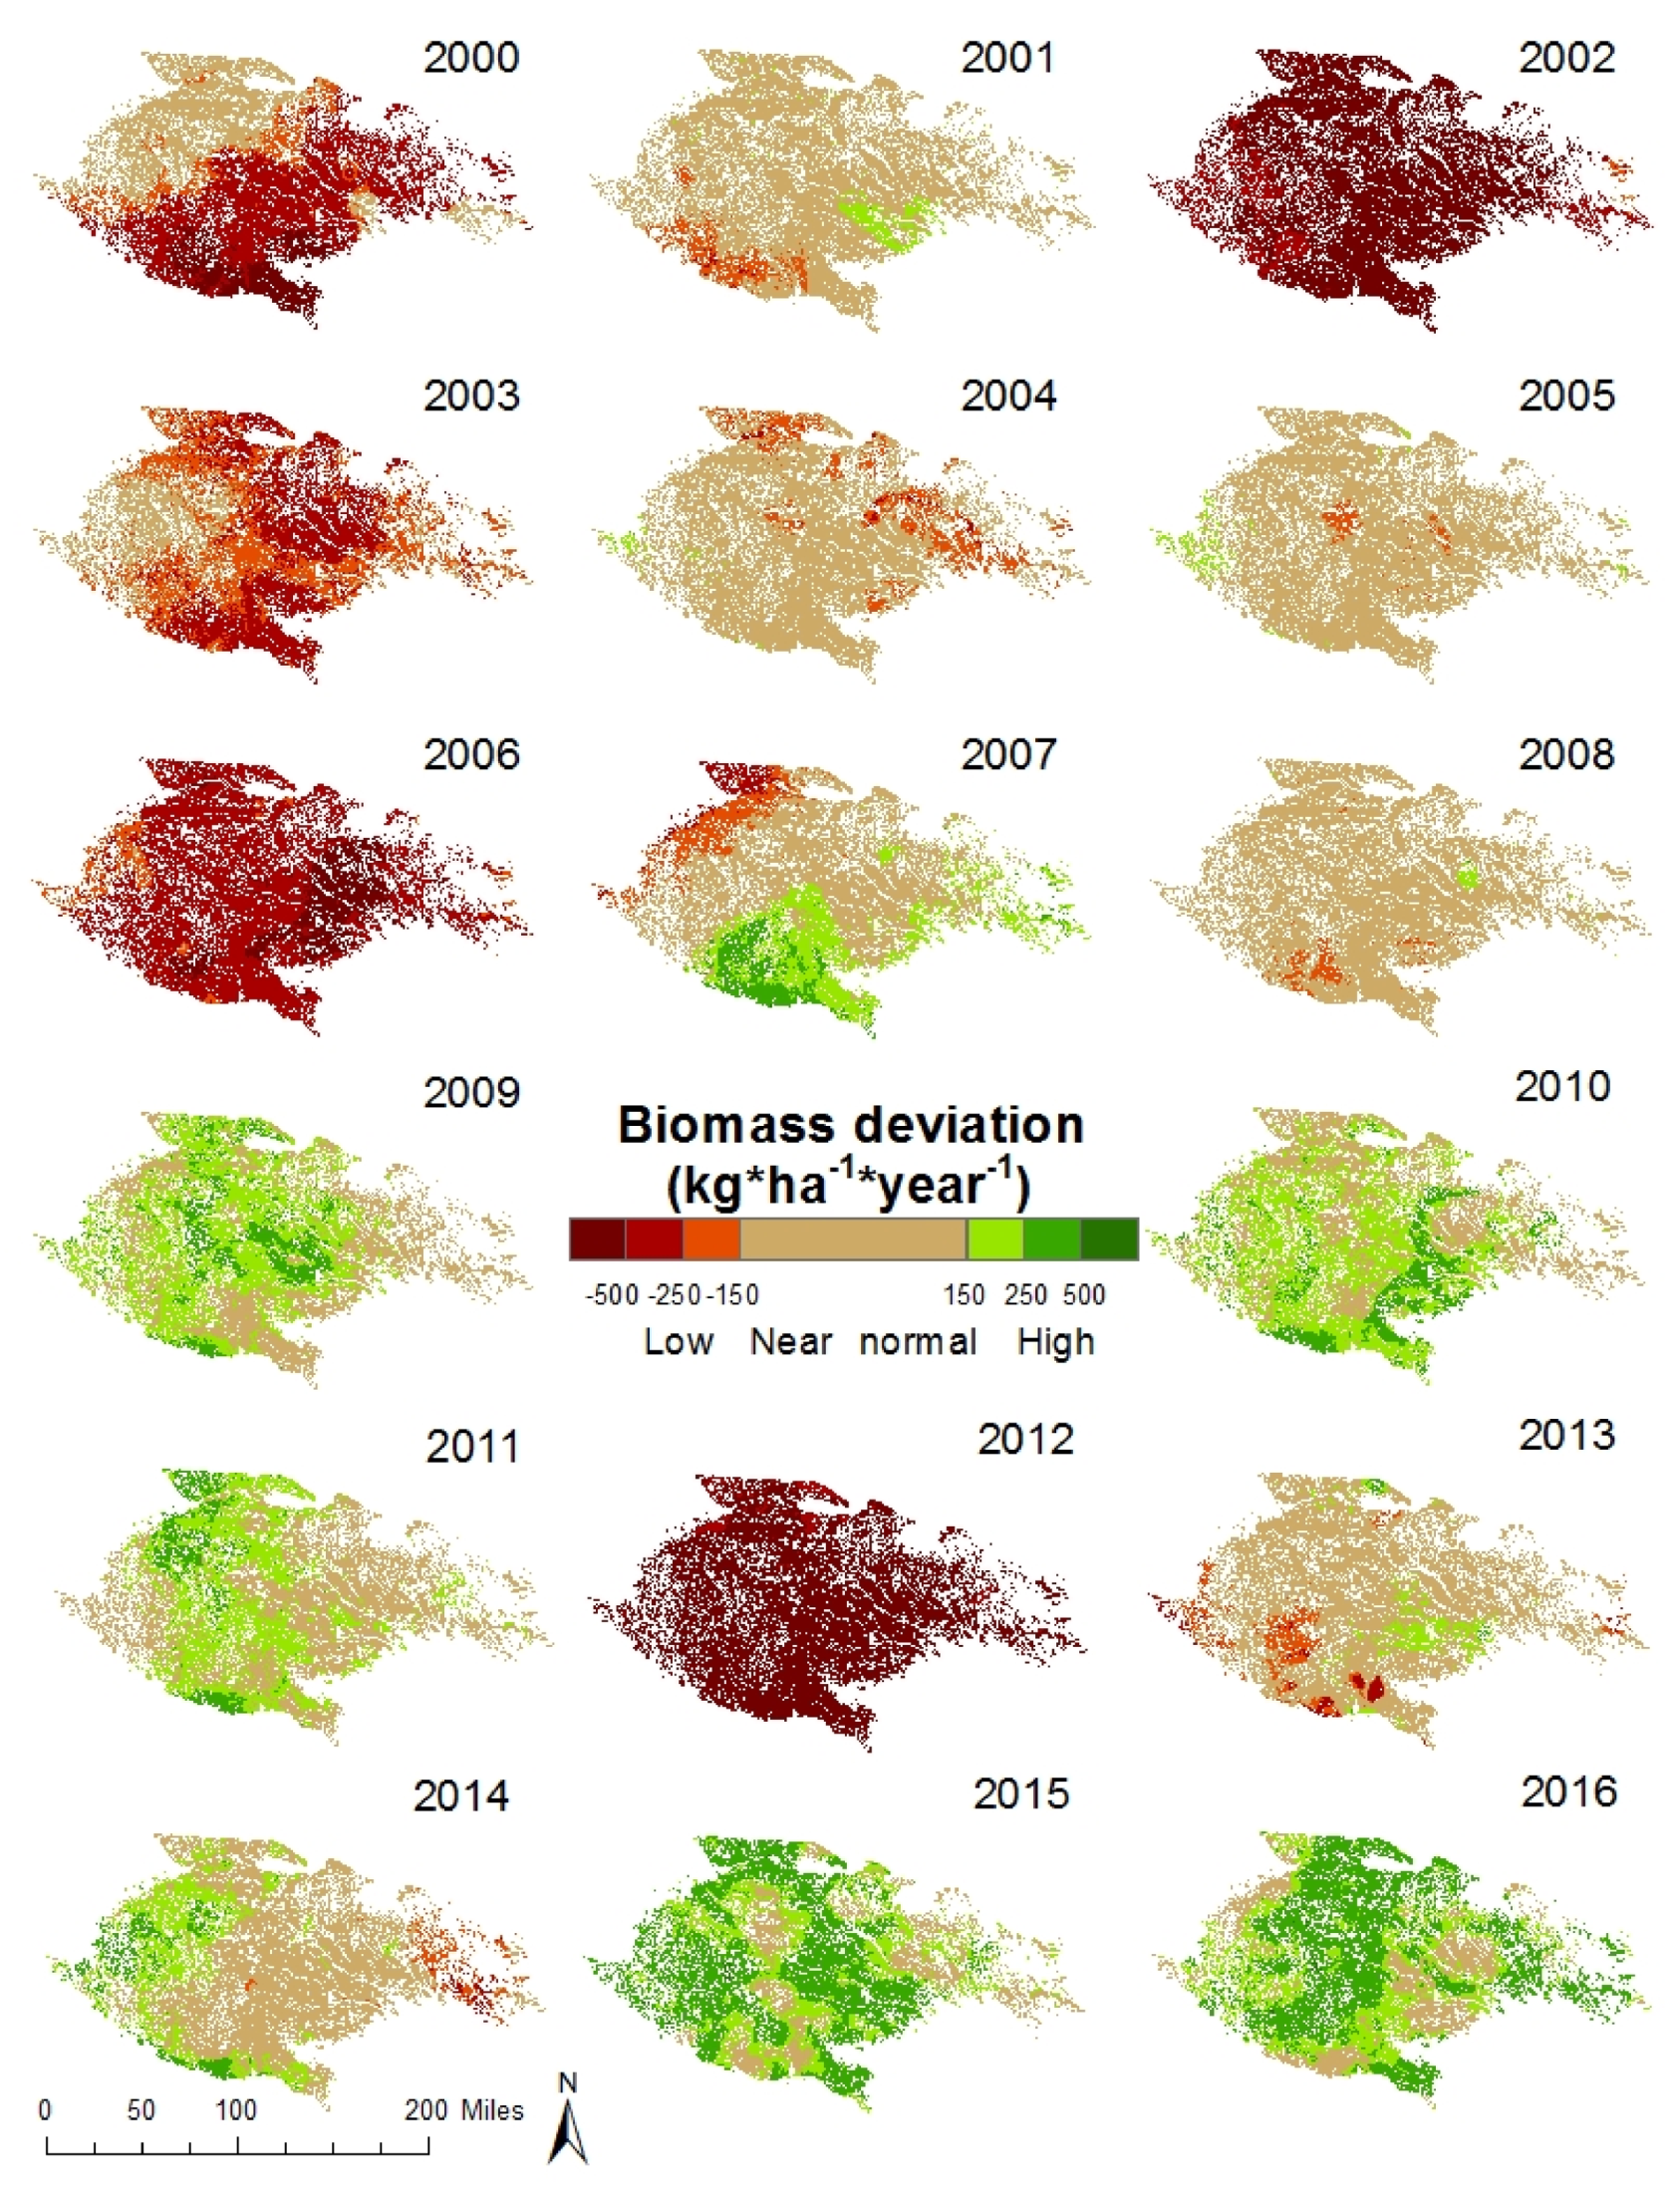
3.2.1. EB and Interannual Biomass Deviation
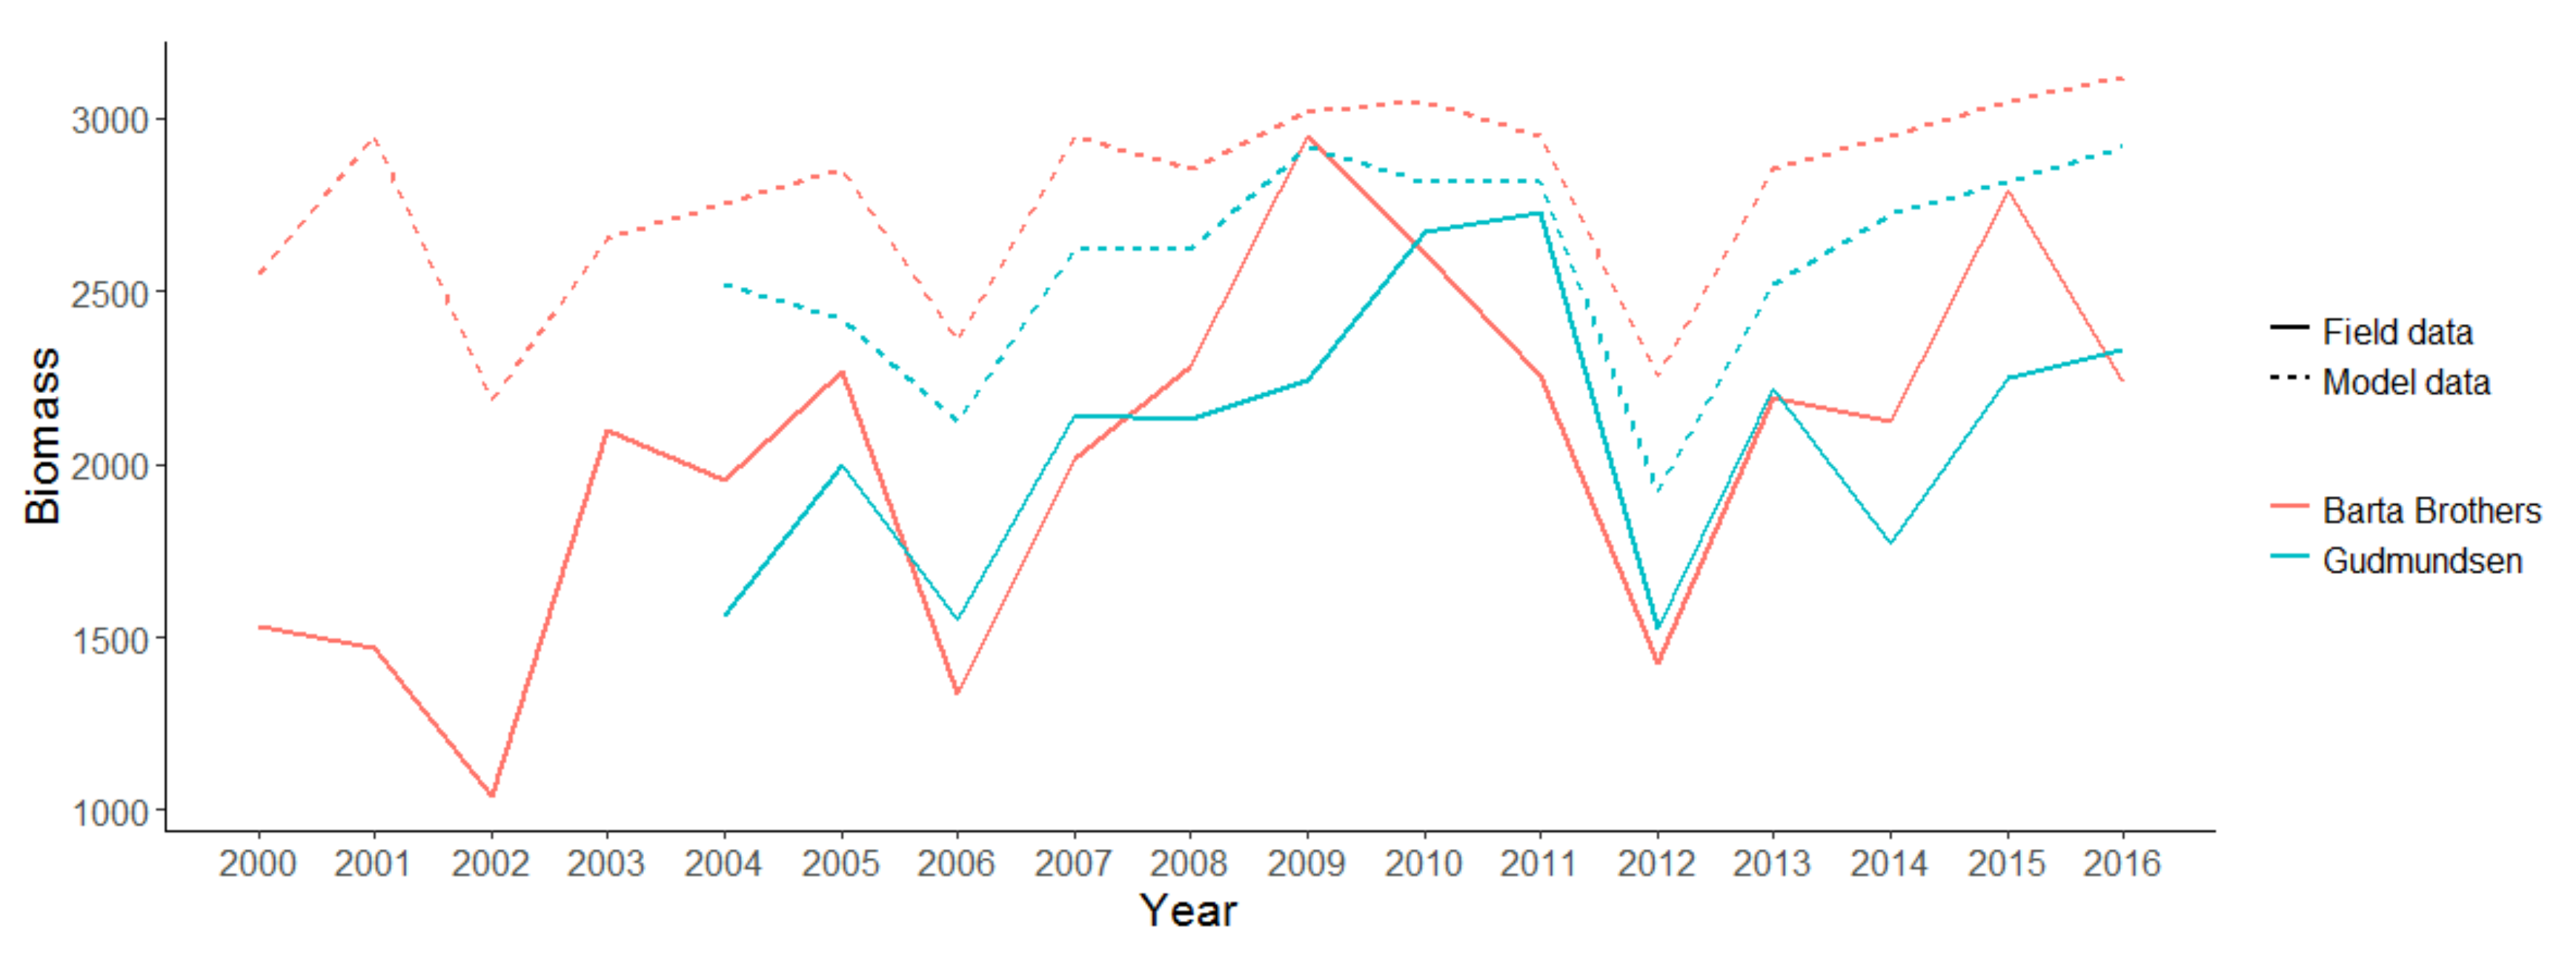
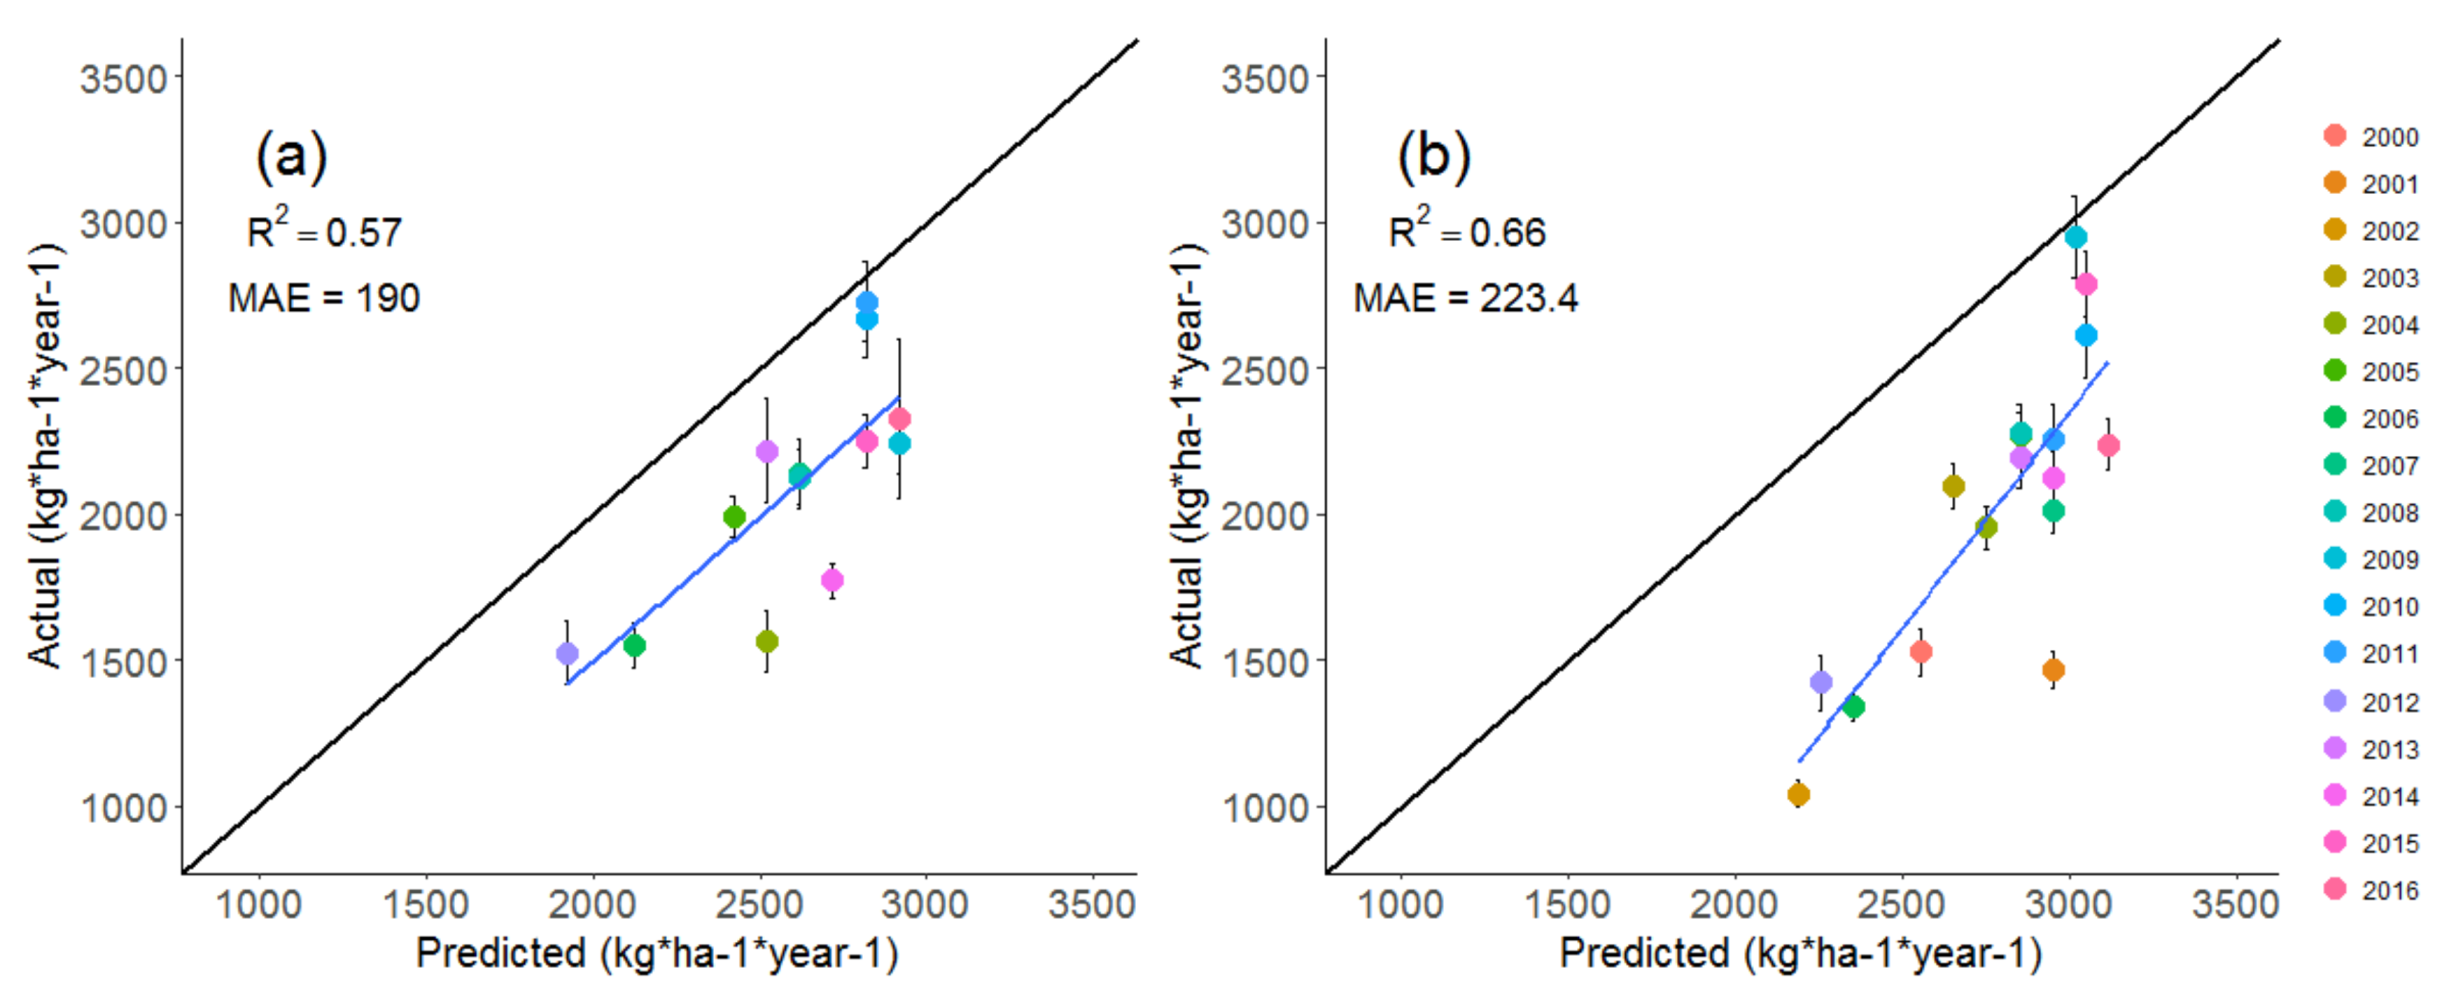
3.2.2. Validation of the EEP Model
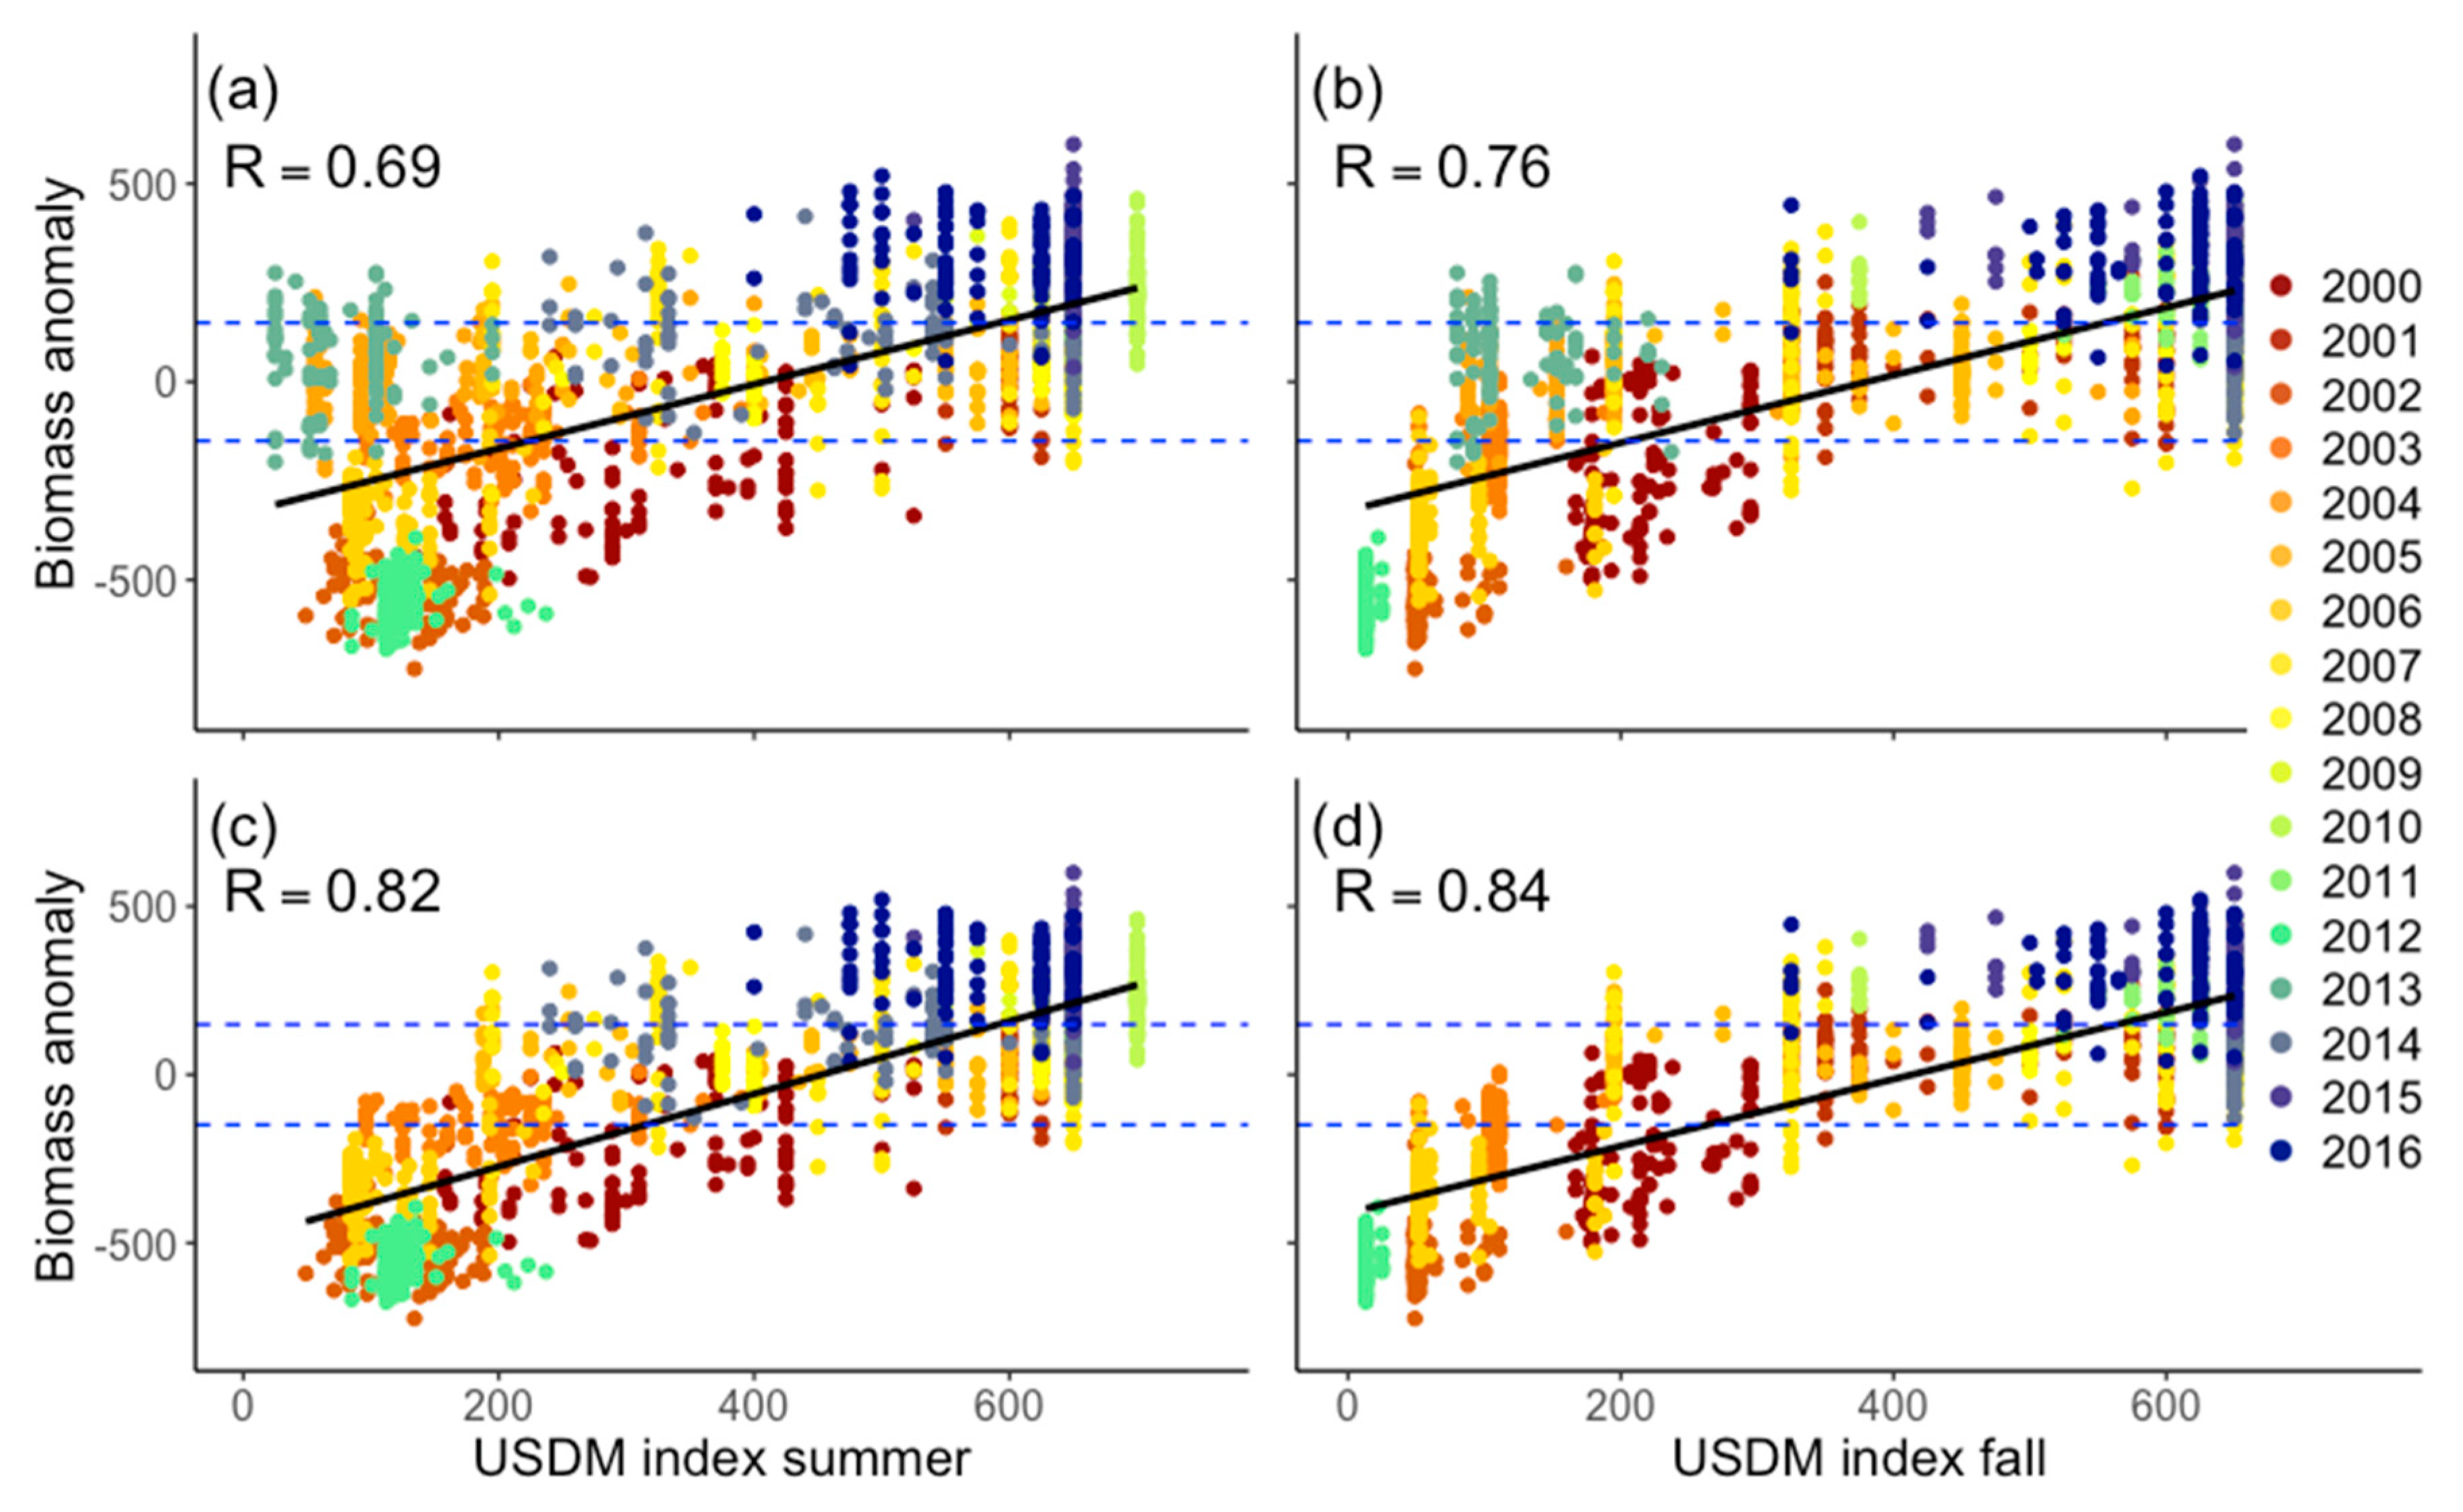
3.3. Correlation of Drought Indices
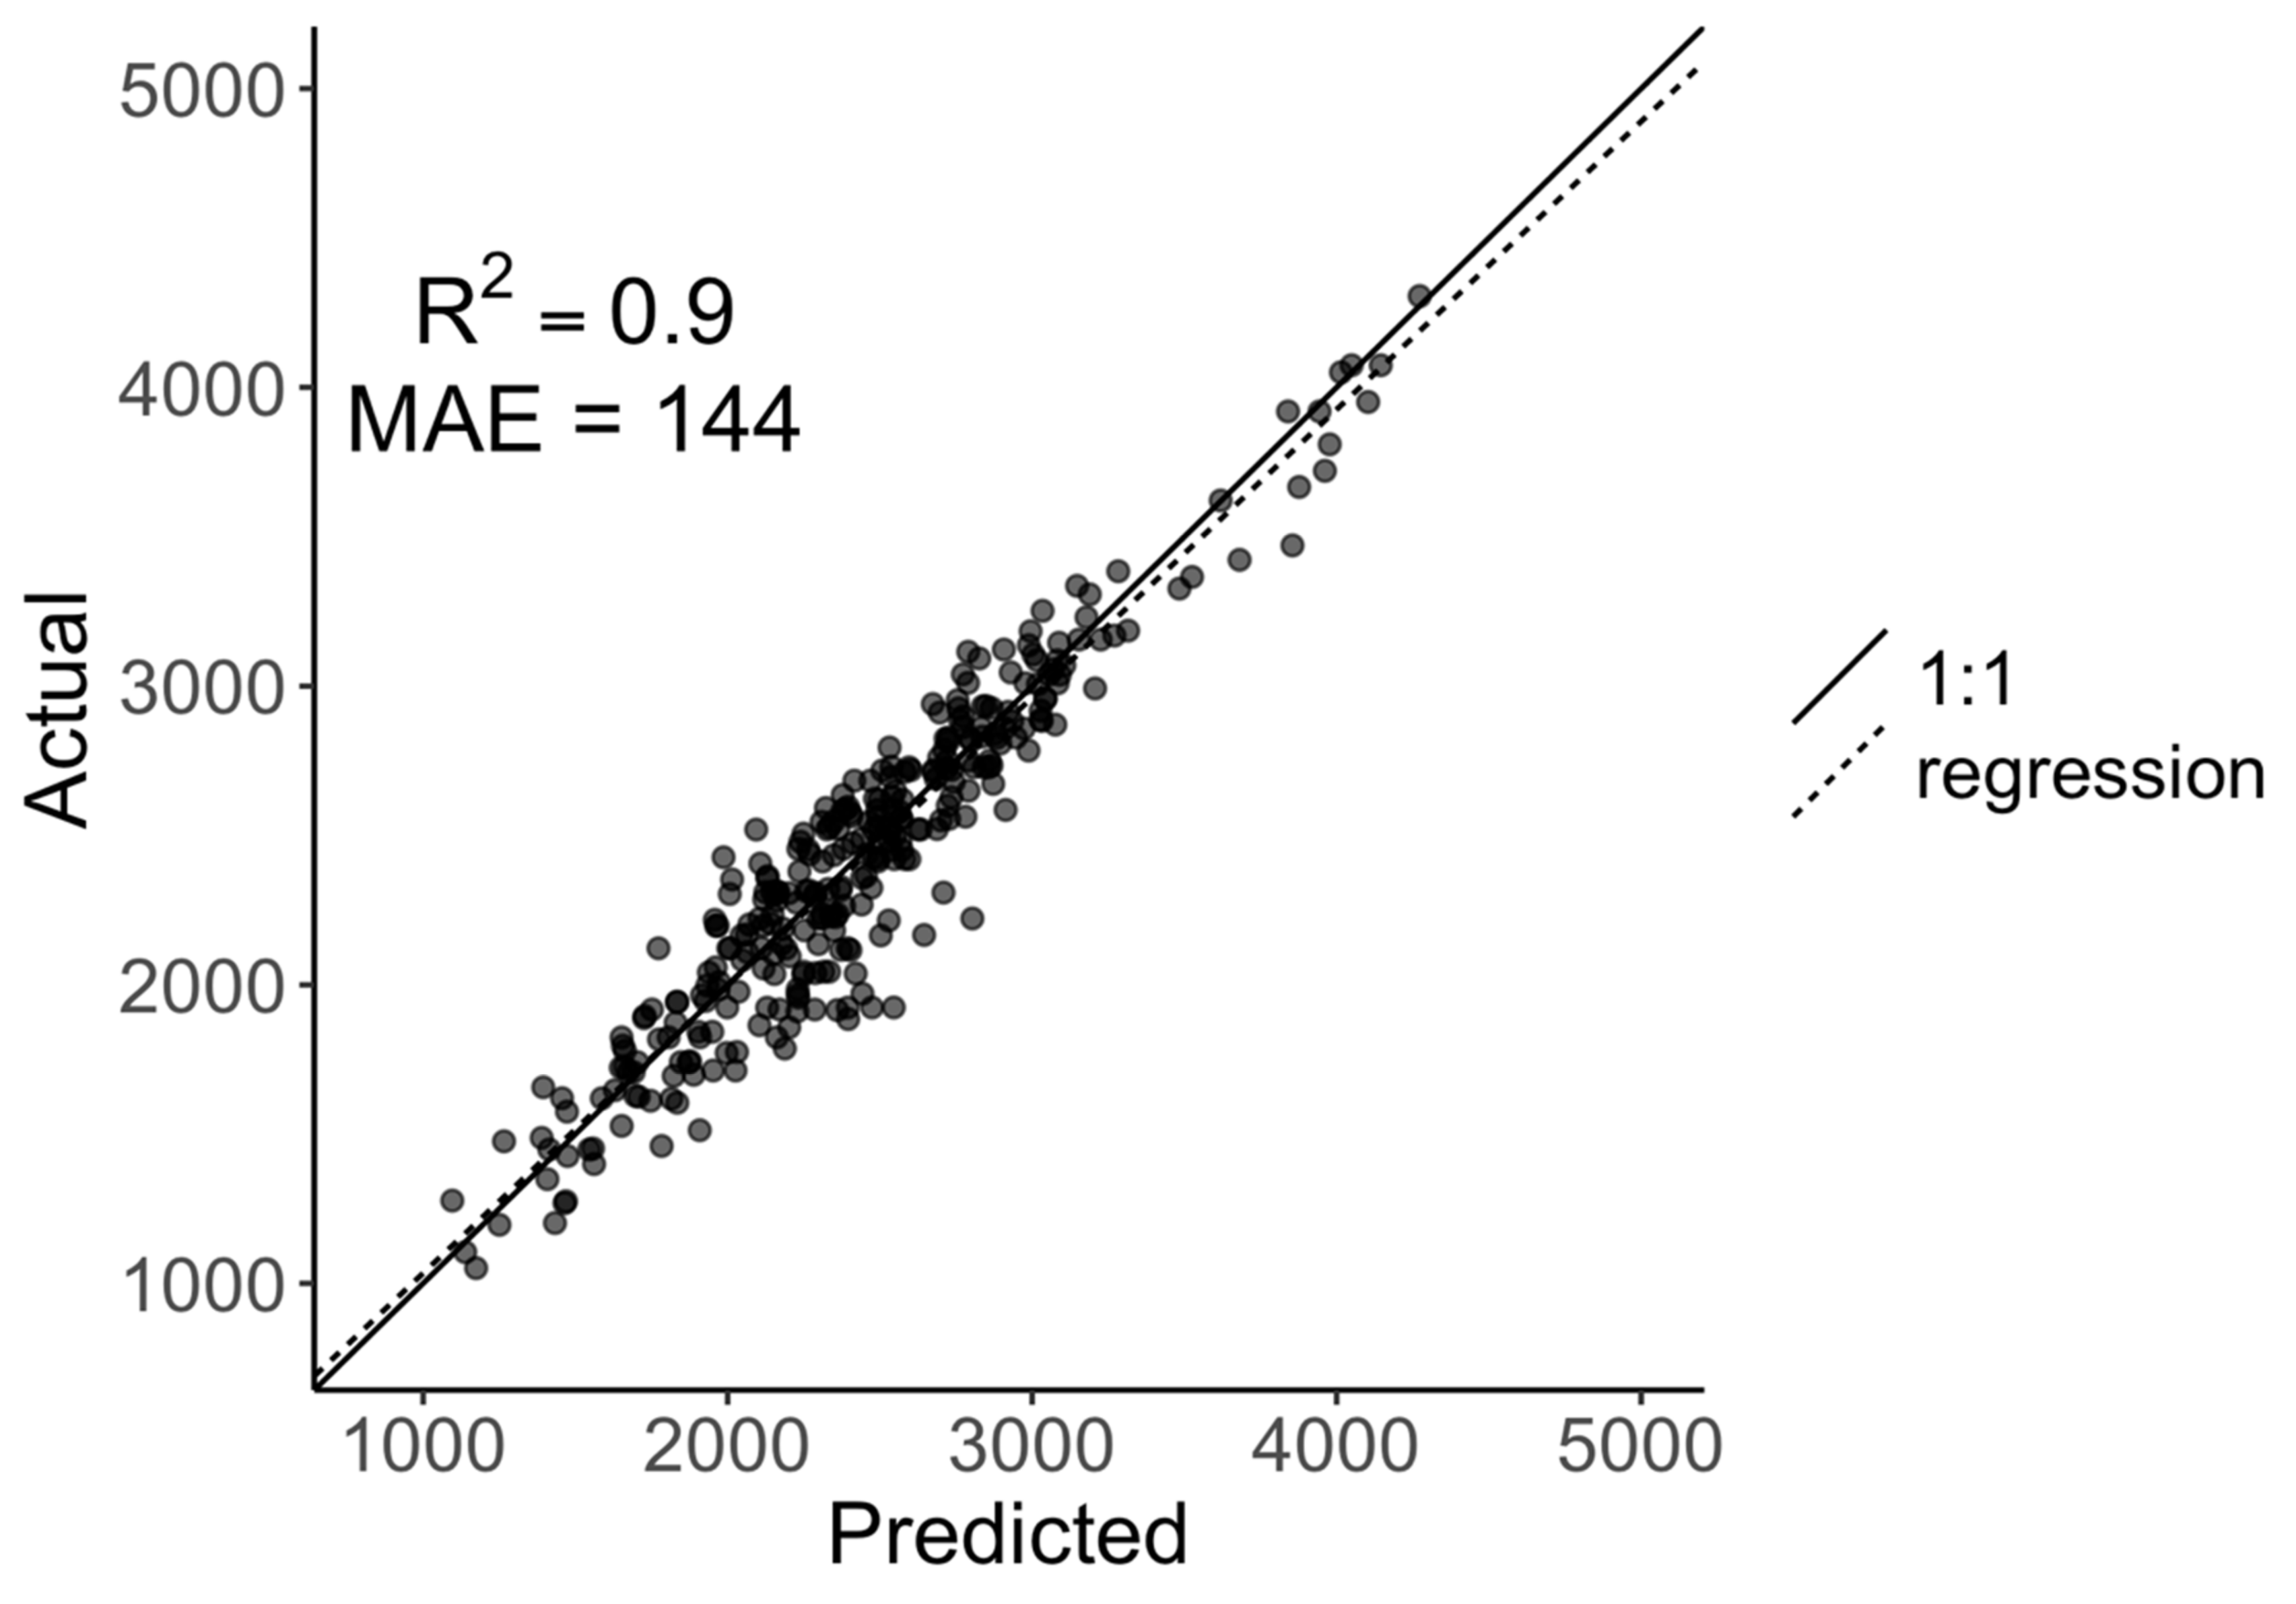
3.4. The Predictive Model
4. Discussion
5. Conclusions
Supplementary Materials
Author Contributions
Funding
Acknowledgments
Conflicts of Interest
References
- World Economic Forum. The Global Risks Report 2019; World Economic Forum: Geneva, Switzerland, 2019. [Google Scholar]
- Van Loon, A.F.; Van Lanen, H.A.J. Making the distinction between water scarcity and drought using an observation-modeling framework. Water Resour. Res. 2013, 49, 1483–1502. [Google Scholar] [CrossRef]
- NOAA National Centers for Environmental Information U.S. Billion-Dollar Weather and Climate Disasters. Available online: https://www.ncdc.noaa.gov/billions/summary-stats (accessed on 7 May 2019).
- Nebraska Department of Agriculture. Nebraska Agriculture Facts Brochure; Nebraska Department of Agriculture: Lincoln, NE, USA, 2016.
- Nebraska Department of Agriculture. Nebraska Agricultural Fact Card; Nebraska Department of Agriculture: Lincoln, NE, USA, 2018.
- Stanke, C.; Kerac, M.; Prudhomme, C.; Medlock, J.; Murray, V. Health effects of drought: A systematic review of the evidence. PLoS Curr. 2013. [Google Scholar] [CrossRef] [PubMed]
- Knutson, C.L.; Haigh, T.R. Ranchers in the United States, scientific information, and drought risk. In Drought, Risk Management, and Policy: Decision-Making Under Uncertainty; Botterill, L.C., Cockfield, G., Eds.; CRC Press: Boca Raton, FL, USA, 2013; p. 171. [Google Scholar]
- NOAA National Centers for Environmental Information State of the Climate: Drought for August 2012. Available online: https://www.ncdc.noaa.gov/sotc/drought/201208 (accessed on 15 April 2019).
- National Drought Mitigation Center U.S. Drought Monitor—Time Series. Available online: http://droughtmonitor.unl.edu/Data/Timeseries.aspx (accessed on 30 April 2018).
- Lauenroth, W.K.; Burke, I.C.; Paruelo, J.M. Patterns of production and precipitation-use efficiency of winter wheat and native grasslands in the central Great Plains of the United States. Ecosystems 2000, 3, 344–351. [Google Scholar] [CrossRef]
- Stephenson, M.B.; Volesky, J.D.; Schacht, W.H.; Lawrence, N.C.; Soper, J.; Milby, J. Influence of Precipitation on Plant Production at Different Topographic Positions in the Nebraska Sandhills. Rangel. Ecol. Manag. 2019, 72, 103–111. [Google Scholar] [CrossRef]
- Ji, L.; Peters, A.J. Assessing vegetation response to drought in the northern Great Plains using vegetation and drought indices. Remote Sens. Environ. 2003, 87, 85–98. [Google Scholar] [CrossRef]
- Wilhite, D.A.; World Meteorological Organization; Global Water Partnership; National Drought Mitigation Center. National Drought Management Policy Guidelines a Template for Action; National Drought Mitigation Center Faculty Publications: Lincoln, NE, USA, 2014. [Google Scholar]
- Brown, J.F.; Wardlow, B.D.; Tadesse, T.; Hayes, M.J.; Reed, B.C. The Vegetation Drought Response Index (VegDRI): A New Integrated Approach for Monitoring Drought Stress in Vegetation. GISci. Remote Sens. 2008, 45, 16–46. [Google Scholar] [CrossRef]
- Hayes, M.J.; Svoboda, M.D.; Wardlow, B.D.; Anderson, M.C.; Kogan, F. Drought monitoring: Historical and cultural perspectives. In Remote Sensing of Drought: Innovative Monitoring Approaches; Wardlow, B.D., Anderson, M.C., Verdin, J.P., Eds.; CRC Press: Boca Raton, FL, USA, 2012; ISBN 978-1-4398-3557-9. [Google Scholar]
- Peck, D.; Derner, J.; Parton, W.; Hartman, M.; Fuchs, B. Flexible stocking with Grass-Cast: A new grassland productivity forecast to translate climate outlooks for ranchers. West. Econ. Forum 2019, 17, 24–39. [Google Scholar]
- Natural Resources Conservation Service US Department of Agriculture Range & Pasture. Available online: https://www.nrcs.usda.gov/wps/portal/nrcs/main/sd/technical/landuse/pasture/ (accessed on 12 June 2019).
- AghaKouchak, A.; Farahmand, A.; Melton, F.S.; Teixeira, J.; Anderson, M.C.; Wardlow, B.D.; Hain, C.R. Remote sensing of drought: Progress, challenges and opportunities. Rev. Geophys. 2015, 53, 452–480. [Google Scholar] [CrossRef]
- Wylie, B.K.; Johnson, D.A.; Laca, E.; Saliendra, N.Z.; Gilmanov, T.G.; Reed, B.C.; Tieszen, L.L.; Worstell, B.B. Calibration of remotely sensed, coarse resolution NDVI to CO2 fluxes in a sagebrush-steppe ecosystem. Remote Sens. Environ. 2003, 85, 243–255. [Google Scholar] [CrossRef]
- Wylie, B.K.; Harrington, J.A.; Prince, S.D.; Denda, I. Satellite and ground-based pasture production assessment in Niger: 1986–1988. Int. J. Remote Sens. 1991, 12, 1281–1300. [Google Scholar] [CrossRef]
- Ji, L.; Wylie, B.K.; Nossov, D.R.; Peterson, B.; Waldrop, M.P.; McFarland, J.W.; Rover, J.; Hollingsworth, T.N. Estimating aboveground biomass in interior Alaska with Landsat data and field measurements. Int. J. Appl. Earth Obs. Geoinf. 2012, 18, 451–461. [Google Scholar] [CrossRef]
- Wylie, B.; Meyer, D.; Tieszen, L.; Mannel, S. Satellite mapping of surface biophysical parameters at the biome scale over the North American grasslands: A case study. Remote Sens. Environ. 2002, 79, 266–278. [Google Scholar] [CrossRef]
- Heim, R.R., Jr. A review of twentieth-century drought indices used in the United States. Bull. Am. Meteorol. Soc. 2002, 83, 1149–1166. [Google Scholar] [CrossRef]
- Wessels, K.J.; Prince, S.D.; Malherbe, J.; Small, J.; Frost, P.E.; VanZyl, D. Can human-induced land degradation be distinguished from the effects of rainfall variability? A case study in South Africa. J. Arid Environ. 2007, 68, 271–297. [Google Scholar] [CrossRef]
- Sala, O.E.; Parton, W.J.; Joyce, L.A.; Lauenroth, W.K. Primary production of the central grassland region of the United States. Ecology 1988, 69, 40–45. [Google Scholar] [CrossRef]
- Gu, Y.; Wylie, B.K.; Bliss, N.B. Mapping grassland productivity with 250-m eMODIS NDVI and SSURGO database over the Greater Platte River Basin, USA. Ecol. Indic. 2013, 24, 31–36. [Google Scholar] [CrossRef]
- Tieszen, L.L.; Reed, B.C.; Bliss, N.B.; Wylie, B.K.; DeJong, D.D. NDVI, C3 and C4 production, and distributions in Great Plains grassland land cover classes. Ecol. Appl. 1997, 7, 58–78. [Google Scholar]
- Wang, J.; Rich, P.M.; Price, K.P.; Kettle, W.D. Relations between NDVI, grassland production, and crop yield in the central Great Plains. Geocarto Int. 2005, 20, 5–11. [Google Scholar] [CrossRef]
- Wylie, B.K.; Zhang, L.; Bliss, N.; Ji, L.; Tieszen, L.L.; Jolly, W.M. Integrating modelling and remote sensing to identify ecosystem performance anomalies in the boreal forest, Yukon River Basin, Alaska. Int. J. Digit. Earth 2008, 1, 196–220. [Google Scholar] [CrossRef]
- Wilhelmi, O.V.; Wilhite, D.A. Assessing vulnerability to agricultural drought: A Nebraska case study. Nat. Hazards 2002, 25, 37–58. [Google Scholar] [CrossRef]
- Natural Resources Conservation Service US Department of Agriculture. Land Resource Regions and Major Land Resource Areas of the United States, the Caribbean, and the Pacific Basin; United States Department of Agriculture: Washington, DC, USA, 2006.
- Sridhar, V.; Hubbard, K.G.; Wedin, D.A. Evaluating the simulation of a simple hydrology model using long-term soil moisture measurements in the Nebraska Sand Hills. In Proceedings of the ASAE Annual International Meeting, Tampa, FL, USA, 17–20 July 2005. [Google Scholar]
- Schacht, W.H.; Volesky, J.D.; Bauer, D.; Smart, A.J.; Mousel, E.M. Plant Community Patterns on Upland Prairie in the Eastern Nebraska Sandhills; University of Nebraska – Lincoln, Agronomy & Horticulture Faculty Publications: Lincoln, NE, USA, 2000. [Google Scholar]
- Gosselin, D.C.; Sridhar, V.; Harvey, F.E.; Goeke, J.W. Hydrological effects and groundwater fluctuations in interdunal environments in the Nebraska Sandhills. Gt. Plains Res. 2006, 16, 17–28. [Google Scholar]
- Wilhite, D.A.; Hayes, M.J.; Svoboda, M.D. Drought monitoring and assessment: Status and trends in the United States. In Drought and Drought Mitigation in Europe; Springer: Dordrecht, The Netherlands, 2000; pp. 149–160. [Google Scholar]
- McKee, T.B.; Doesken, N.J.; Kleist, J. The relationship of drought frequency and duration to time scales. In Proceedings of the Eighth Conference on Applied Climatology, Anaheim, CA, USA, 17–22 January 1993; American Meteorological Society: Boston, MA, USA, 1993; pp. 179–184. [Google Scholar]
- Anderson, M.C.; Norman, J.M.; Mecikalski, J.R.; Otkin, J.A.; Kustas, W.P. A climatological study of evapotranspiration and moisture stress across the continental United States based on thermal remote sensing: 1. Model formulation. J. Geophys. Res. Atmos. 2007. [Google Scholar] [CrossRef]
- Hobbins, M.T.; Wood, A.; McEvoy, D.J.; Huntington, J.L.; Morton, C.; Anderson, M.; Hain, C. The evaporative demand drought index. Part I: Linking drought evolution to variations in evaporative demand. J. Hydrometeorol. 2016, 17, 1745–1761. [Google Scholar] [CrossRef]
- World Meteorological Organization (WMO); Global Water Partnership (GWP). Handbook of Drought Indicators and Indices; Svoboda, M., Fuchs, B.A., Eds.; Integrated Drought Management Programme (IDMP), Integrated Drought Management Tools and Guidelines Series 2; World Meteorological Organization: Geneva, Switzerland, 2016. [Google Scholar]
- Clark, J.S.; Iverson, L.; Woodall, C.W.; Allen, C.D.; Bell, D.M.; Bragg, D.C.; D’Amato, A.W.; Davis, F.W.; Hersh, M.H.; Ibanez, I.; et al. The impacts of increasing drought on forest dynamics, structure, and biodiversity in the United States. Glob. Chang. Biol. 2016, 22, 2329–2352. [Google Scholar] [CrossRef]
- McKee, T.B.; Doesken, N.J.; Kleist, J. Drought monitoring with multiple time scales. In Proceedings of the Ninth Conference on Applied Climatology, Dallas, TX, USA, 15–20 January 1995; American Meteorological Society: Boston, MA, USA, 1995; pp. 233–236. [Google Scholar]
- Hayes, M.; Svoboda, M.; Wall, N.; Widhalm, M. The Lincoln declaration on drought indices: Universal meteorological drought index recommended. Bull. Am. Meteorol. Soc. 2011, 92, 485–488. [Google Scholar] [CrossRef]
- National Drought Mitigation Center U.S. Drought Risk Atlas. Available online: https://droughtatlas.unl.edu/ (accessed on 21 July 2019).
- Anderson, M.C.; Hain, C.; Wardlow, B.; Pimstein, A.; Mecikalski, J.R.; Kustas, W.P. Evaluation of drought indices based on thermal remote sensing of evapotranspiration over the continental United States. J. Clim. 2011, 24, 2025–2044. [Google Scholar] [CrossRef]
- ServirGlobal Evaporative Stress Index (ESI). Available online: https://gis1.servirglobal.net/data/esi/ (accessed on 25 January 2018).
- McEvoy, D.J.; Huntington, J.L.; Hobbins, M.T.; Wood, A.; Morton, C.; Anderson, M.; Hain, C. The evaporative demand drought index. Part II: CONUS-wide assessment against common drought indicators. J. Hydrometeorol. 2016, 17, 1763–1779. [Google Scholar] [CrossRef]
- NOAA Earth System Research Laboratory Evaporative Demand Drought Index. Available online: https://www.esrl.noaa.gov/psd/eddi/ (accessed on 20 January 2019).
- Svoboda, M.; Lecomte, D.; Hayes, M.; Heim, R.; Gleason, K.; Angel, J.; Rippey, B.; Tinker, R.; Palecki, M.; Stooksbury, D.; et al. The Drought Monitor. Bull. Am. Meteorol. Soc. 2002, 83, 1181–1190. [Google Scholar] [CrossRef]
- NDMC United States Drought Monitor. Available online: https://droughtmonitor.unl.edu/ (accessed on 13 February 2019).
- PRISM Climate Group PRISM Climate Group. Available online: http://prism.oregonstate.edu/ (accessed on 18 December 2018).
- Boyte, S.P.; Wylie, B.K.; Major, D.J. Mapping and monitoring cheatgrass dieoff in rangelands of the Northern Great Basin, USA. Rangel. Ecol. Manag. 2015, 68, 18–28. [Google Scholar] [CrossRef]
- Knapp, A.K.; Smith, M.D. Variation among biomes in temporal dynamics of aboveground primary production. Science 2001, 291, 481–484. [Google Scholar] [CrossRef]
- Knapp, A.K.; Carroll, C.J.W.; Denton, E.M.; La Pierre, K.J.; Collins, S.L.; Smith, M.D. Differential sensitivity to regional-scale drought in six central US grasslands. Oecologia 2015, 177, 949–957. [Google Scholar] [CrossRef] [PubMed]
- Homer, C.; Dewitz, J.; Yang, L.; Jin, S.; Danielson, P.; Xian, G.; Coulston, J.; Herold, N.; Wickham, J.; Megown, K. Completion of the 2011 national land cover database for the conterminous United States—Representing a decade of land cover change information. Photogramm. Eng. Remote Sens. 2015, 81, 345–354. [Google Scholar]
- Henebry, G.M.; Putz, B.C.; Vaitkus, M.R.; Merchant, J.W. The Nebraska Gap Analysis Project Final Report; University of Nebraska - Lincoln: Lincoln, NE, USA, 2005. [Google Scholar]
- Wardlow, B.D.; Egbert, S.L.; Kastens, J.H. Analysis of time-series MODIS 250 m vegetation index data for crop classification in the U.S. Central Great Plains. Remote Sens. Environ. 2007, 108, 290–310. [Google Scholar] [CrossRef]
- Gu, Y.; Wylie, B.K. Detecting ecosystem performance anomalies for land management in the Upper Colorado River Basin using satellite observations, climate data, and ecosystem models. Remote Sens. 2010, 2, 1880–1891. [Google Scholar] [CrossRef]
- Rigge, M.; Wylie, B.; Gu, Y.; Belnap, J.; Phuyal, K.; Tieszen, L. Monitoring the status of forests and rangelands in the Western United States using ecosystem performance anomalies. Int. J. Remote Sens. 2013, 34, 4049–4068. [Google Scholar] [CrossRef]
- RuleQuest Research Cubist; Version 2.07; RuleQuest Research Pty Ltd.: NSW, Australia, 2008.
- Soil Survey Staff, Natural Resources Conservation Service, U.S. Department of Agriculture. Soil Series Classification Database. Available online: https://nrcs.app.box.com/v/soils (accessed on 6 January 2019).
- Jenkerson, C.; Maiersperger, T.; Schmidt, G. eMODIS: A User-Friendly Data Source; Open-File Report; U.S. Geological Survey: Reston, VA, USA, 2010.
- Swets, D.L.; Reed, B.C.; Rowland, J.D.; Marko, S.E. A weighted least-squares approach to temporal smoothing of NDVI. In Proceedings of the from Image to Information, ASPRS Annual Conference, Portland, OR, USA, 17–21 May 1999. [Google Scholar]
- Gu, Y.; Wylie, B.K.; Boyte, S.P.; Picotte, J.; Howard, D.M.; Smith, K.; Nelson, K.J. An optimal sample data usage strategy to minimize overfitting and underfitting effects in regression tree models based on remotely-sensed data. Remote Sens. 2016, 8, 943. [Google Scholar] [CrossRef]
- Natural Resources Conservation Service US Department of Agriculture Description of STATSGO2 database. Available online: https://www.nrcs.usda.gov/wps/portal/nrcs/detail/soils/survey/geo/?cid=nrcs142p2_053629 (accessed on 7 July 2019).
- RuleQuest Research an Overview of Cubist. Available online: https://www.rulequest.com/cubist-win.html (accessed on 19 July 2019).
- Wylie, B.K.; Boyte, S.P.; Major, D.J. Ecosystem performance monitoring of rangelands by integrating modeling and remote sensing. Rangel. Ecol. Manag. 2012, 65, 241–252. [Google Scholar] [CrossRef]
- Yang, L.; Wylie, B.K.; Tieszen, L.L.; Reed, B.C. An analysis of relationships among climate forcing and time-integrated NDVI of grasslands over the U.S. northern and central Great Plains. Remote Sens. Environ. 1998, 65, 25–37. [Google Scholar] [CrossRef]
- Boyte, S.P.; Wylie, B.K.; Major, D.J. Validating a Time Series of Annual Grass Percent Cover in the Sagebrush Ecosystem. Rangel. Ecol. Manag. 2019, 72, 347–359. [Google Scholar] [CrossRef]
- Wylie, B.K.; DeJong, D.D.; Tieszen, L.L.; Biondini, M.E. Grassland canopy parameters and their relationships to remotely sensed vegetation indices in the nebraska sand hills. Geocarto Int. 1996, 11, 39–52. [Google Scholar] [CrossRef]
- Wylie, B.K.; Pastick, N.J.; Picotte, J.J.; Deering, C.A. Geospatial data mining for digital raster mapping. GISci. Remote Sens. 2019, 56, 406–429. [Google Scholar] [CrossRef]
- Natural Resources Conservation Service US Department of Agriculture Ecological Site Description System. Available online: https://esis.sc.egov.usda.gov/ESDReport/fsReport.aspx?id=R065XY033NE&rptLevel=communities&approved=yes&repType=regular&scrns=&comm= (accessed on 21 July 2019).
- Volesky, J.D. (University of Nebraska—Lincoln, North Platte, NE, USA). Personal Communication, July 2019.
- Bachmair, S.; Tanguy, M.; Hannaford, J.; Stahl, K. How well do meteorological indicators represent agricultural and forest drought across Europe? Environ. Res. Lett. 2018, 13, 034042. [Google Scholar] [CrossRef]
- Smart, A.J.; Dunn, B.H.; Johnson, P.S.; Xu, L.; Gates, R.N. Using weather data to explain herbage yield on three great plains plant communities. Rangel. Ecol. Manag. 2007, 60, 146–153. [Google Scholar] [CrossRef]
- Poděbradská, M.; Wylie, B.K.; Dahal, D. Time Series of Expected Nebraska Sandhills Livestock Forage (2000–2016); U.S. Geological Survey Data Release: Reston, VA, USA, 2019. [Google Scholar] [CrossRef]


| Index | Description | Spatial Resolution | Timescales | Justification | References |
|---|---|---|---|---|---|
| SPI | Measures the rarity of a dry or wet event based on probability | Gridded at 0.125° | 1, 3, 6 months | Recommended by World Meteorological Organization as a global measure of meteorological drought. | [36,41,42,43] |
| ESI | Quantifies anomalies of ET to PET* | 5 km | 4, 12 weeks | Provides an indication of water stress on vegetation. | [37,44,45] |
| EDDI | Measures anomalies of E0* to reference evapotranspiration | Gridded at 0.125° | 1, 3 months | Not limited by cloud or snow cover; expected to detect drought earlier than other indices. | [38,46,47] |
| VegDRI | Integrates climate, vegetation stress, and biophysical data | 1 km | Weekly | Indicates plant stress specifically due to drought. | [14] |
| USDM | Synthesizes quantitative drought data with qualitative local expertise | Sub-county vector data converted to raster at 500 m | Weekly | Comprehensive indicator of drought; informs USDA drought relief payments. | [48,49] |
| Driving Variable | Overall Importance |
|---|---|
| Summer Precipitation | 100 |
| Site Potential | 87 |
| Winter Precipitation | 63.5 |
| Minimum Spring Temperature | 50 |
| Maximum Spring Temperature | 44.5 |
| Mean Summer Temperature | 43 |
| Spring Precipitation | 36.5 |
| Minimum Summer temperature | 34 |
| Mean Spring Temperature | 33 |
| Mean Winter Temperature | 26 |
| Previous Fall Precipitation | 20.5 |
| Maximum Summer Temperature | 10 |
| Model Structure | 6 rules, 80% training points |
| Training Dataset | |
| R2 | 0.86 |
| Average Error | 1.5 |
| Relative Error | 0.36 |
| Testing Dataset | |
| R2 | 0.86 |
| Average Error | 1.6 |
| Relative Error | 0.36 |
| 1-Month Time Span | SPI 1 m | EDDI 1 m | ESI 1 m | 3-Month Time Span | SPI 3 m | EDDI 3 m | ESI 3 m | 6-Month Time Span | SPI 6 m | VegDRI | |||
|---|---|---|---|---|---|---|---|---|---|---|---|---|---|
| 1-Mar | 1-Apr | 0.07 | 0.16 | 0.11 | 1-Jan | 1-Apr | 0.20 | −0.17 | 0.27 | 1-Oct | 1-Apr | 0.42 | NA |
| 8-Mar | 8-Apr | 0.18 | 0.01 | 0.22 | 8-Jan | 8-Apr | 0.21 | −0.15 | 0.28 | 8-Oct | 8-Apr | 0.38 | NA |
| 15-Mar | 15-Apr | 0.45 | −0.29 | 0.35 | 15-Jan | 15-Apr | 0.40 | −0.19 | 0.25 | 15-Oct | 15-Apr | 0.48 | NA |
| 22-Mar | 22-Apr | 0.36 | −0.45 | 0.33 | 22-Jan | 22-Apr | 0.30 | −0.18 | 0.27 | 22-Oct | 22-Apr | 0.40 | NA |
| 29-Mar | 29-Apr | 0.30 | −0.43 | 0.32 | 29-Jan | 29-Apr | 0.26 | −0.16 | 0.28 | 29-Oct | 29-Apr | 0.34 | 0.27 |
| 6-Apr | 6-May | 0.40 | −0.43 | 0.38 | 5-Feb | 6-May | 0.42 | −0.17 | 0.34 | 5-Nov | 6-May | 0.48 | 0.21 |
| 13-Apr | 13-May | 0.40 | −0.37 | 0.48 | 12-Feb | 13-May | 0.49 | −0.21 | 0.46 | 12-Nov | 13-May | 0.57 | 0.30 |
| 20-Apr | 20-May | 0.57 | −0.50 | 0.58 | 19-Feb | 20-May | 0.57 | −0.28 | 0.53 | 19-Nov | 20-May | 0.61 | 0.40 |
| 27-Apr | 27-May | 0.62 | −0.61 | 0.64 | 26-Feb | 27-May | 0.60 | −0.33 | 0.65 | 26-Nov | 27-May | 0.63 | 0.41 |
| 3-May | 3-Jun | 0.61 | −0.66 | 0.68 | 5-Mar | 3-Jun | 0.67 | −0.44 | 0.67 | 3-Dec | 3-Jun | 0.70 | 0.47 |
| 10-May | 10-Jun | 0.65 | −0.60 | 0.71 | 12-Mar | 10-Jun | 0.74 | −0.54 | 0.73 | 10-Dec | 10-Jun | 0.73 | 0.47 |
| 17-May | 17-Jun | 0.61 | −0.60 | 0.71 | 19-Mar | 17-Jun | 0.76 | −0.62 | 0.73 | 17-Dec | 17-Jun | 0.75 | 0.55 |
| 24-May | 24-Jun | 0.58 | −0.56 | 0.73 | 26-Mar | 24-Jun | 0.77 | −0.68 | 0.77 | 24-Dec | 24-Jun | 0.76 | 0.62 |
| 1-Jun | 1-Jul | 0.55 | −0.63 | 0.74 | 2-Apr | 1-Jul | 0.78 | −0.74 | 0.79 | 31-Dec | 1-Jul | 0.77 | 0.65 |
| 8-Jun | 8-Jul | 0.54 | −0.56 | 0.76 | 9-Apr | 8-Jul | 0.78 | −0.73 | 0.81 | 7-Jan | 8-Jul | 0.79 | 0.68 |
| 15-Jun | 15-Jul | 0.62 | −0.64 | 0.79 | 16-Apr | 15-Jul | 0.81 | −0.70 | 0.83 | 14-Jan | 15-Jul | 0.79 | 0.69 |
| 22-Jun | 22-Jul | 0.61 | −0.63 | 0.81 | 23-Apr | 22-Jul | 0.80 | −0.70 | 0.84 | 21-Jan | 22-Jul | 0.80 | 0.71 |
| 29-Jun | 29-Jul | 0.60 | −0.65 | 0.83 | 30-Apr | 29-Jul | 0.80 | −0.72 | 0.85 | 28-Jan | 29-Jul | 0.81 | 0.68 |
| 5-Jul | 5-Aug | 0.62 | −0.67 | 0.80 | 7-May | 5-Aug | 0.78 | −0.74 | 0.84 | 4-Feb | 5-Aug | 0.81 | 0.69 |
| 12-Jul | 12-Aug | 0.61 | −0.68 | 0.77 | 14-May | 12-Aug | 0.78 | −0.72 | 0.85 | 11-Feb | 12-Aug | 0.82 | 0.71 |
| 19-Jul | 19-Aug | 0.43 | −0.66 | 0.72 | 21-May | 19-Aug | 0.73 | −0.69 | 0.83 | 18-Feb | 19-Aug | 0.82 | 0.70 |
| 26-Jul | 26-Aug | 0.27 | −0.50 | 0.62 | 28-May | 26-Aug | 0.69 | −0.68 | 0.82 | 25-Feb | 26-Aug | 0.82 | 0.70 |
| 2-Aug | 2-Sep | 0.20 | −0.34 | 0.58 | 4-Jun | 2-Sep | 0.69 | −0.67 | 0.81 | 3-Mar | 2-Sep | 0.84 | 0.64 |
| 9-Aug | 9-Sep | −0.07 | −0.18 | 0.47 | 11-Jun | 9-Sep | 0.60 | −0.62 | 0.80 | 10-Mar | 9-Sep | 0.82 | 0.68 |
| 16-Aug | 16-Sep | 0.05 | −0.08 | 0.45 | 18-Jun | 16-Sep | 0.56 | −0.62 | 0.78 | 17-Mar | 16-Sep | 0.84 | 0.66 |
| 23-Aug | 23-Sep | 0.21 | −0.11 | 0.30 | 25-Jun | 23-Sep | 0.53 | −0.60 | 0.75 | 24-Mar | 23-Sep | 0.84 | 0.67 |
| 30-Aug | 30-Sep | 0.20 | −0.02 | 0.20 | 2-Jul | 30-Sep | 0.48 | −0.54 | 0.70 | 31-Mar | 30-Sep | 0.80 | 0.66 |
| 7-Sep | 7-Oct | 0.50 | 0.03 | 0.06 | 9-Jul | 7-Oct | 0.48 | −0.48 | 0.63 | 7-Apr | 7-Oct | 0.80 | 0.68 |
| 14-Sep | 14-Oct | 0.50 | 0.00 | 0.06 | 16-Jul | 14-Oct | 0.42 | −0.40 | 0.55 | 14-Apr | 14-Oct | 0.77 | 0.67 |
| 21-Sep | 21-Oct | 0.41 | 0.07 | 0.03 | 23-Jul | 21-Oct | 0.39 | −0.30 | 0.41 | 21-Apr | 21-Oct | 0.74 | 0.73 |
| 28-Sep | 28-Oct | 0.12 | 0.26 | −0.16 | 30-Jul | 28-Oct | 0.29 | −0.12 | 0.27 | 28-Apr | 28-Oct | 0.71 | NA |
| Driving Variable | Overall Importance |
|---|---|
| Site Potential | 82 |
| SPI 3m Spring | 66.5 |
| USDM Previous Year | 50.5 |
| SPI 3m winter | 47 |
| EDDI Spring | 46.5 |
| USDM Winter | 46.5 |
| USDM Spring | 37 |
| ESI Spring | 33.5 |
| EDDI winter | 33 |
| ESI winter | 6.5 |
| Model Structure | 24 total rules, 3 committee models, 80% training points |
| Training Dataset | |
| R2 | 0.9 |
| Average Error | 129.83 |
| Relative Error | 0.31 |
| Testing Dataset | |
| R2 | 0.9 |
| Average Error | 143.67 |
| Relative Error | 0.32 |
© 2019 by the authors. Licensee MDPI, Basel, Switzerland. This article is an open access article distributed under the terms and conditions of the Creative Commons Attribution (CC BY) license (http://creativecommons.org/licenses/by/4.0/).
Share and Cite
Poděbradská, M.; Wylie, B.K.; Hayes, M.J.; Wardlow, B.D.; Bathke, D.J.; Bliss, N.B.; Dahal, D. Monitoring Drought Impact on Annual Forage Production in Semi-Arid Grasslands: A Case Study of Nebraska Sandhills. Remote Sens. 2019, 11, 2106. https://doi.org/10.3390/rs11182106
Poděbradská M, Wylie BK, Hayes MJ, Wardlow BD, Bathke DJ, Bliss NB, Dahal D. Monitoring Drought Impact on Annual Forage Production in Semi-Arid Grasslands: A Case Study of Nebraska Sandhills. Remote Sensing. 2019; 11(18):2106. https://doi.org/10.3390/rs11182106
Chicago/Turabian StylePoděbradská, Markéta, Bruce K. Wylie, Michael J. Hayes, Brian D. Wardlow, Deborah J. Bathke, Norman B. Bliss, and Devendra Dahal. 2019. "Monitoring Drought Impact on Annual Forage Production in Semi-Arid Grasslands: A Case Study of Nebraska Sandhills" Remote Sensing 11, no. 18: 2106. https://doi.org/10.3390/rs11182106
APA StylePoděbradská, M., Wylie, B. K., Hayes, M. J., Wardlow, B. D., Bathke, D. J., Bliss, N. B., & Dahal, D. (2019). Monitoring Drought Impact on Annual Forage Production in Semi-Arid Grasslands: A Case Study of Nebraska Sandhills. Remote Sensing, 11(18), 2106. https://doi.org/10.3390/rs11182106