Article

Studying the Impact on Urban Health over the Greater Delta Region in Egypt Due to Aerosol Variability Using Optical Characteristics from Satellite Observations and Ground-Based AERONET Measurements

1
Computational and Data Sciences Graduate Program, Schmid College of Science and Technology, Chapman University, Orange, CA 92866, USA
2
Department of Environmental Sciences, Suez University, Suez 43511, Egypt
3
Department of Environmental Studies, National Authority for Remote Sensing and Space Sciences, Cairo 1564, Egypt
4
Egyptian Environmental Affairs Agency (EEAA), Cairo 11728, Egypt
5
Faculty of African postgraduate studies, Cairo University, Giza 12613, Egypt
6
Center of Excellence in Earth Systems Modeling and Observations, Chapman University, Orange, CA 92866, USA
7
Schmid College of Science and Technology, Chapman University, Orange, CA 92866, USA
8
Department of Environmental Sciences, Faculty of Science, Alexandria University, Moharem Bek, Alexandria 21522, Egypt
*
Author to whom correspondence should be addressed.
Remote Sens. 2019, 11(17), 1998; https://doi.org/10.3390/rs11171998
Submission received: 17 July 2019 / Revised: 20 August 2019 / Accepted: 21 August 2019 / Published: 24 August 2019
(This article belongs to the Special Issue Remote Sensing for Urban Human Health)

Abstract

:
This research addresses the aerosol characteristics and variability over Cairo and the Greater Delta region over the last 20 years using an integrative multi-sensor approach of remotely sensed and PM10 ground data. The accuracy of these satellite aerosol products is also evaluated and compared through cross-validation against ground observations from the AErosol RObotic NETwork (AERONET) project measured at local stations. The results show the validity of using Multi-angle Imaging Spectroradiometer (MISR) and Moderate Resolution Imaging Spectroradiometer (MODIS) sensors on the Terra and Aqua platforms for quantitative aerosol optical depth (AOD) assessment as compared to Ozone Monitoring Instrument (OMI), Sea-viewing Wide Field-of-view Sensor (SeaWiFS), and POLarization and Directionality of the Earth’s Reflectances (POLDER). In addition, extracted MISR-based aerosol products have been proven to be quite effective in investigating the characteristics of mixed aerosols. Daily AERONET AOD observations were collected and classified using K-means unsupervised machine learning algorithms, showing five typical patterns of aerosols in the region under investigation. Four seasonal aerosol emerging episodes are identified and analyzed using multiple indicators, including aerosol optical depth (AOD), size distribution, single scattering albedo (SSA), and Ångström exponent (AE). The movements and detailed aerosol composition of the aforementioned episodes are demonstrated using NASA’s Goddard Space Flight Center (GSFC) back trajectories model in collaboration with aerosol subtype products from the Cloud-Aerosol Lidar and Infrared Pathfinder Satellite Observation (CALIPSO) mission. These episodes indicate that during the spring, fall, and summer, most of the severe aerosol events are caused by dust or mixed related scenarios, whereas during winter, aerosols of finer size lead to severe heavy conditions. It also demonstrates the impacts of different aerosol sources on urban human health, which are presented by the variations of multiple parameters, including solar radiation, air temperature, humidity, and UV exposure. Scarce ground PM10 data were collected and compared against satellite products, yet owed to their discrete nature of availability, our approach made use of the Random Decision Forest (RDF) model to convert satellite-based AOD and other meteorological parameters to predict PM10. The RDF model with inputs from the Modern-Era Retrospective analysis for Research and Applications version 2 (MERRA-2) and Global Land Data Assimilation System (GLDAS) datasets improves the performance of using AOD products to estimate PM10 values. The connection between climate variability and aerosol intensity, as well as their impact on health-related PM2.5 over Egypt is also demonstrated.

Graphical Abstract

1. Introduction

Air pollution is reported as one of the most severe environmental problems for the Greater Delta region of Egypt [1,2,3]. Over the past few decades, Egypt has been introduced to numerous activities, including unplanned urbanization, air polluting industries, and energy production that contributed to excessive air pollution with gases, particulates, and aerosols at levels often exceeding the World Health Organization (WHO) guidelines [3,4]. The Greater Delta region, especially its largest city, Cairo, is a densely populated region with all of the above activities that requires a better understanding of its atmospheric aerosol characteristics considering its high aerosol loading, as well as recently more frequent emerging aerosol events occurring at all seasons, which is different from past years [1,3]. On the other hand, the rural and suburban parts of the Nile Delta have higher ventilation due to the mass of agricultural land together with higher wind speeds [5]. As it is similar to other developing countries, there are diverse sources of air pollution in Egypt; however, comparing to industrialized countries, the formation and levels of coal ash, mineral dust, and other small particles in Egypt is more pronounced [6]. The key variables for air quality are nitrogen dioxide (NO2), carbon monoxide (CO), sulfur dioxide (SO2), suspended particulate matter (SPM), lead (Pb), and ozone (O3) [7]. Such levels of dust, fine particles, and soot are reported to be more characteristic in Egypt than those found in industrialized countries [4], which is due to the industries and traffic within downtown Cairo and its surrounding regions emitting particles incessantly throughout the year [8]. It is worth noting that over the past two decades, there has been a seasonal air pollution episode locally known as the “black cloud”. The black cloud is a dark smoke and haze that covers the Greater Cairo and the Nile Delta [9,10]. This episode has been associated with commonly known illegal local practices of burning rice husk leftovers after the growing season together with other contributing factors [1,2,6,9,11,12].
In 2007, the World Bank characterized the air quality in Cairo as the “worst” in the world with regard to particulate matter concentration [13]. Much higher and frequent air pollution episodes were recorded recently in Cairo, threatening the public health of its over 20 million population [3], since human lungs can be severely damaged by the dust, the tiny soot fragments, and pollutant particulates [14]. Besides the emission of air pollutants, naturally, Cairo is at the apex of the Nile Delta that is bounded by the Mokattam Hills and the western heights. During the strong spring wind events, the Mokattam Hills produce large concentrations of airborne sand [6,15]. A study of aerosol profiles in Cairo and Alexandria found that it includes “pollution-like”, “background pollution”, and “dust-like” components [10,12]. For further understanding of the aerosol profile, it is necessary to analyze the chemical composition of aerosols, which is found to be highly dominated by mineral dust over 100 μgm−3 in winter and spring, comparing to over 50 μgm−3 in summer and autumn [16]. Natural dust storms also play a role in the level of the aerosols particularly in the “Khamsin” period [17,18,19]. Moreover, dust deposition over water bodies, while traveling across continents, affects different marine habitats such as those of the Red Sea, the Mediterranean Sea, and the Atlantic Ocean [20,21,22,23].
From the above, it is evident that the frequent aerosol activities in Cairo and the Greater Delta region require detailed investigation of their characteristics, optical properties, and dynamics. For that purpose, we are expanding the usage of the well-established and the most influential aerosol observation network, the AErosol RObotic NETwork (AERONET) [24]. AERONET is a ground-based aerosol network set up by National Aeronautics and Space Administration (NASA) and LOA-PHOTONS Centre National de la Researche Scientifique (CNRS) and is significantly extended by associates from national offices, foundations, colleges, singular researchers, and accomplices. The system comprises an excess of 500 globally distributed sun and sky-scanning automated radiometers. AEROENT data is characterized by its high frequency (every 15 min) and low uncertainty observations. It provides long-term and continuous spectral properties of aerosols derived by the Sun photometer; its data products have three available levels (Level-1.0 (unscreened), Level-1.5 (cloud-screened and quality controlled), and Level-2.0 (quality-assured)) based on their different processing of cloud screening and quality control. Both cloud-screened and quality control have been applied to the Level-2.0 dataset, whereas the Level-1.5 dataset is only processed with cloud-screened but without quality assurance. Level-1.0 has neither cloud screening nor quality control. Therefore, Level-2.0 is regarded as the most accurate dataset, and thus is used in this research.
On October 2004, Cairo University hosted an AERONET sun photometer for air quality assessment followed by another campaign conducted by the Egyptian Meteorological Authority (EMA) from April 2005 until March 2006. Since April 2010, EMA has been routinely maintaining the third AERONET site, which was named EMA2 until now. As mentioned before, AERONET measurements occur several times a day and provide various products that are used for air quality assessment. However, the AERONET datasets in Cairo are relatively lacking (only since 2004), also considering the four-year missing observations between 2006–2010. To overcome this limitation, various remotely sensed data collected on board satellites are used and have been proven to be effective tools to achieve a regional/global and temporal characterization of aerosols, playing a key role in studying the horizontal variation of aerosols in the Greater Delta region [2]. Several algorithms have been developed using: for example, POLarization and Directionality of the Earth’s Reflectances (POLDER), Moderate Resolution Imaging Spectroradiometer (MODIS) (both on board the Terra and Aqua satellites), Ozone Monitoring Instrument (OMI) (on board the Aura satellite), Multi-angle Imaging Spectroradiometer (MISR) (on board the Terra satellite), and Sea-viewing Wide Field-of-view Sensor (SeaWiFS) (on board the SeaStar satellite) [25,26,27,28,29], to retrieve the global aerosol optical depth (AOD). For example, MODIS and the MISR are the most commonly used sensors to observe AOD. Using these satellite data and ground-based observations, many studies have been investigated to reveal the mechanism of the increased pollution and dust activities in Cairo [2,8,9,10,11,15,16,30,31,32,33]. Additionally, the remotely sensed AOD products have been developed and applied to estimate the concentration of fine particulate matters (such as PM10 and PM2.5) for the air quality research [34,35,36,37].
However, the accuracy of satellite aerosol products is challenged by diverse uncertainties, including cloud contamination, complex surfaces in different regions, and the different retrieving process among aerosol models [25,26,38,39,40,41]. Therefore, satellite measurements need to be validated using ground-based observations, such as the AERONET dataset, to make the best use of their aerosol-related products for the Cairo region [42,43,44]. Hence, this paper focuses on the classification of different aerosol microphysical and optical properties using AERONET data while evaluating the best remotely sensed aerosol datasets through cross-validation against the in situ measurements from the AERONENT observations. We also investigate and compare the typical aerosol emerging episodes in each season to describe their different origins and composition, as well as their impacts on the human health.

2. Materials and Methods
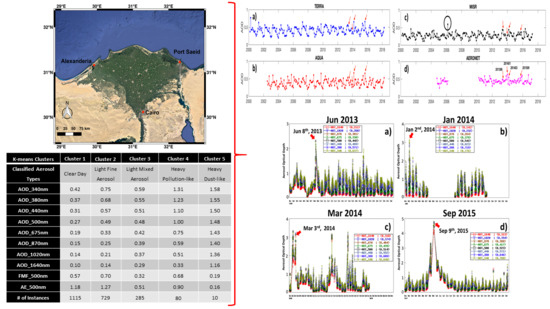
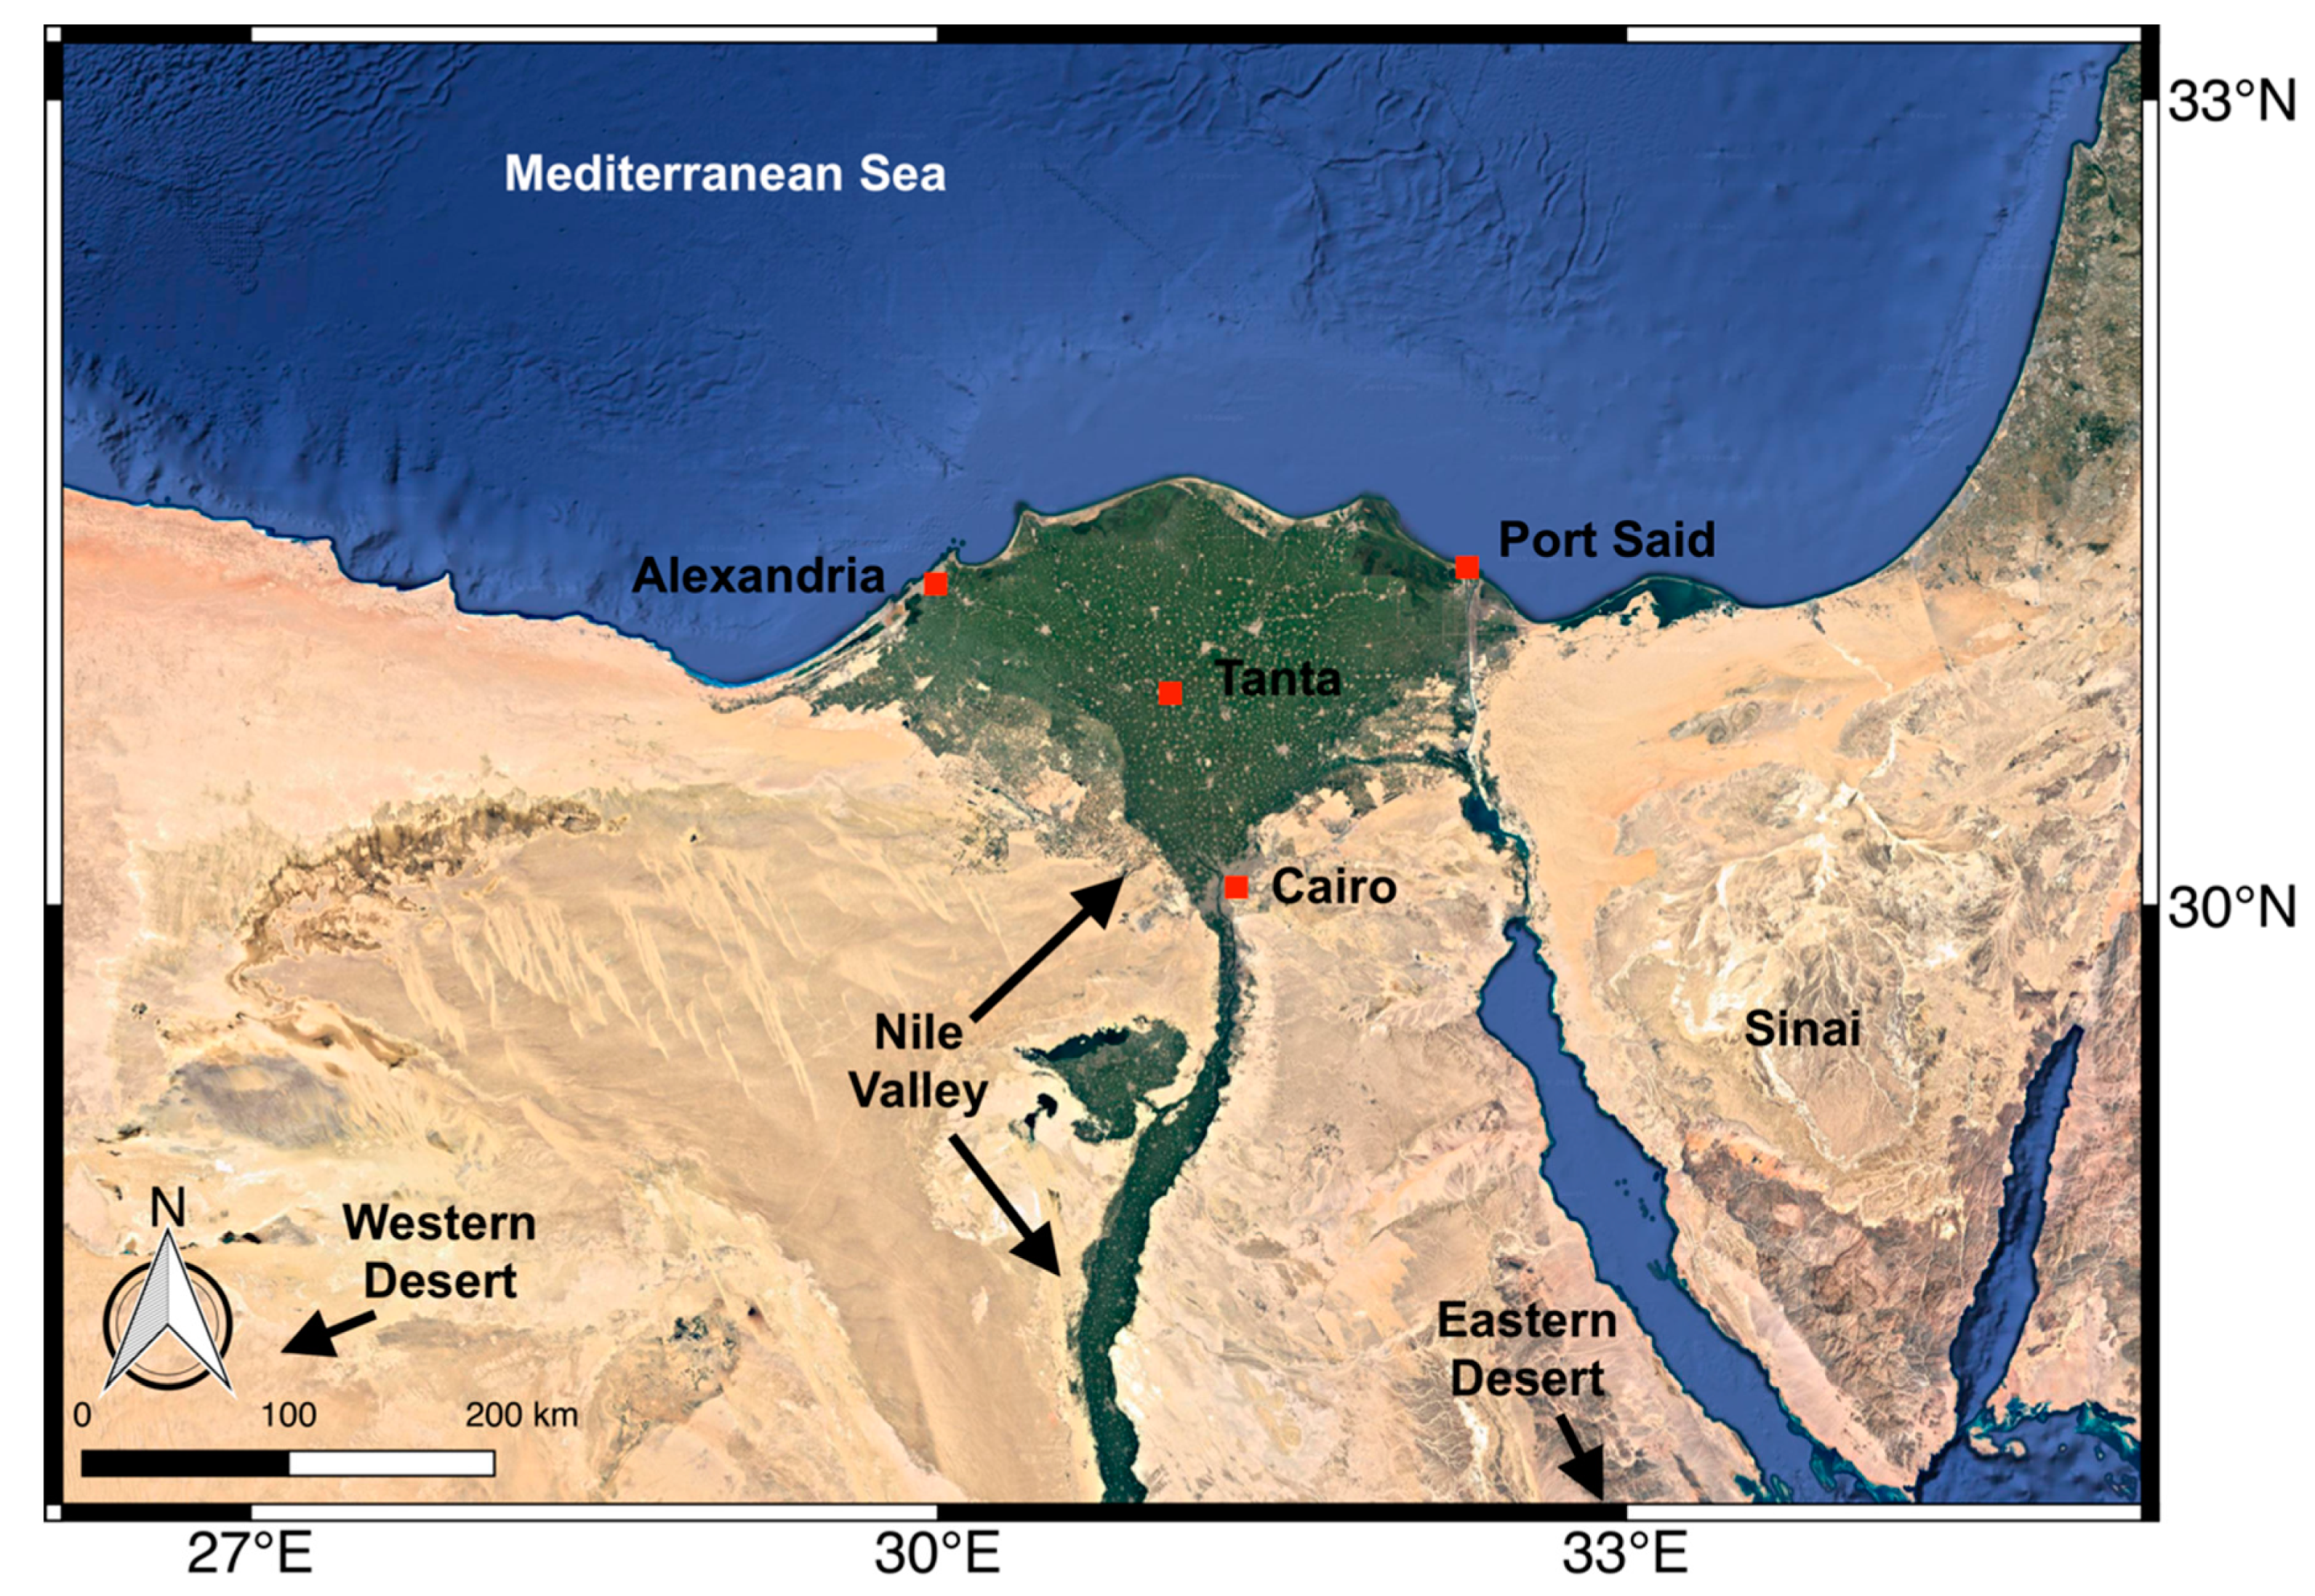
2.1. Study Area

The area of study geographically covers the Nile Delta, which is bounded by the Mediterranean Sea to the north, the Western Desert to the west, the Eastern Desert and Sinai to the east, and the Nile Valley to the south. The area is approximately 35,000 km2 and includes major urbanized cities such as Cairo, Alexandria, and Tanta. However, the majority is rural areas and agricultural land. The Nile Delta is a typical arcuate delta with Cairo City in the apex. It accommodates about 55% of the population and it secures the food for the population via agriculture (Figure 1).

2.2. AERONET and Satellite Aerosol Products

The ground-based AERONET aerosol-related products were collected from the sites in Cairo area, including: Cairo University (30.026167°N, 31.207317°E), Egyptian Meteorological Authority (EMA) (30.080767°N, 31.290067°E), and EMA2 (30.080767°N, 31.290067°E). Here, we used some of the AERONET products addressing aerosol characteristics, namely, spectral-based values of aerosol optical depth (AOD), single scattering albedo (SSA), aerosol size distribution, and Ångström exponent (AE) with a temporal variability component. The spectral deconvolution algorithm (SDA) [45] applied to the AOD analysis calculates the fine mode fractions to the total aerosols (FMF) by yielding fine and coarse aerosols at a standard wavelength of 500 nm. This parameter proves to be a quite effective indicator of the size distribution of the observed aerosols. It is known that high AE values present a higher abundance of finer aerosol particles, while a set of low AE values corresponds to aerosols with coarser particle sizes [12]. The aerosols in fine mode are mostly generated from gas-to-particle conversion [46], while carbonaceous and sulfate aerosols are generated from biomass burning and urban/industrial activities. On the other hand, aerosols in coarse mode are mainly from mineral dust or sea salt [12]. Therefore, either a decrease in the number of larger particles or an increase in the number of smaller particles can cause an increase in the value of AE and FMF. All the products are accessed from the AERONET Data Synergy Tool (https://aeronet.gsfc.nasa.gov/cgi-bin/bamgomas_interactive).
Monthly AOD Version 3 Level-2.0 data [47] collected at EMA was used to validate the AOD retrievals from the multiple satellite sensors using the Multi-sensor Aerosol Products Sampling System (MAPSS) [48]. The MAPSS provides a direct cross-validation between the aerosol products from multiple spaceborne sensors and well-characterized co-located AERONET ground-based data through generating spatial statistics such as linear regression analysis (number of observations, outliers, the coefficient of determination denoted as R2, root mean square deviation as RMSE), with flexible options (including/excluding outliers, quality control). The sensors used in the validation process are listed in the Table 1.
Here, we used the data provided from the stations of EMA (April 2005–March 2006) and Cairo University (October 2004–March 2005) for cross-validation purposes and the time series analysis, although with a shorter record, while not using observations from the EMA2 station for cross-validation but only for time series analysis. This is because the EMA2 station, although with a longer record (April 2010 until now), is not included in the MAPSS system that is used for the evaluation of satellite products. The validation result will be presented in Section 3.1 as the scatter plots of AERONET AOD against satellite AOD with key linear regression parameters, filtering outlier values with the quality control option. Additionally, we also demonstrate the advantage of using the satellite-derived aerosol plumes analysis from the MISR Interactive eXplorer (MINX) tool [49,50] to obtain AERONET-like aerosol products such as spectral-based AOD, AE, and SSA.
EMA2 daily spectral based AOD observations at multiple bands (340 nm, 380 nm, 440 nm, 500 nm, 675 nm, 870 nm, and 1020 nm) as well as FMF and AE at band 550 nm are used to determine typical aerosol patterns in Cairo through the K-means classification method. The aerosol information collected at EMA2 is also used to analyze the aerosol properties of the four typical AOD episodes for each season (DJF = Dec–Feb, MAM = Mar–May, JJA = Jun–Aug, SON = Sep–Nov). The episodes are selected based on the AERONET aerosol Level-2.0 data during the available observation periods: Cairo University (October 2004–March 2005), EMA (April 2005–March 2006), and EMA2 (April 2010–March 2017). For each episode, NASA’s Goddard Space Flight Center (GSFC) seven days Back-kinematic trajectory analysis product [51,52] generated twice a day (00:00 UTC and 12:00 UTC), is used to compute simple air parcel backward trajectories to analyze the aerosol tracking for origin attribution. Following their traveling path, the aerosols’ vertical structure and subtypes are observed and measured by CALIOP (Cloud-Aerosol Lidar with Orthogonal Polarization) [53,54] on board the Cloud-Aerosol Lidar and Infrared Pathfinder Satellite Observation (CALIPSO) mission. The CALIOP profile ranged from the Earth’s surface to 40 km with a high spatial resolution of 30–60 m in the vertical and 333 m in the horizontal. CALIPSO data has shown potential application for the human health assessment. For example, the synergy usage of MODIS, CALIPSO, and AERONENT observations demonstrated the evidence of the transport mechanisms of Candida fungus, which causes the annual spike of Kawasaki disease in Japan [55].

2.3. Environemntal Indicators Related to Public Health

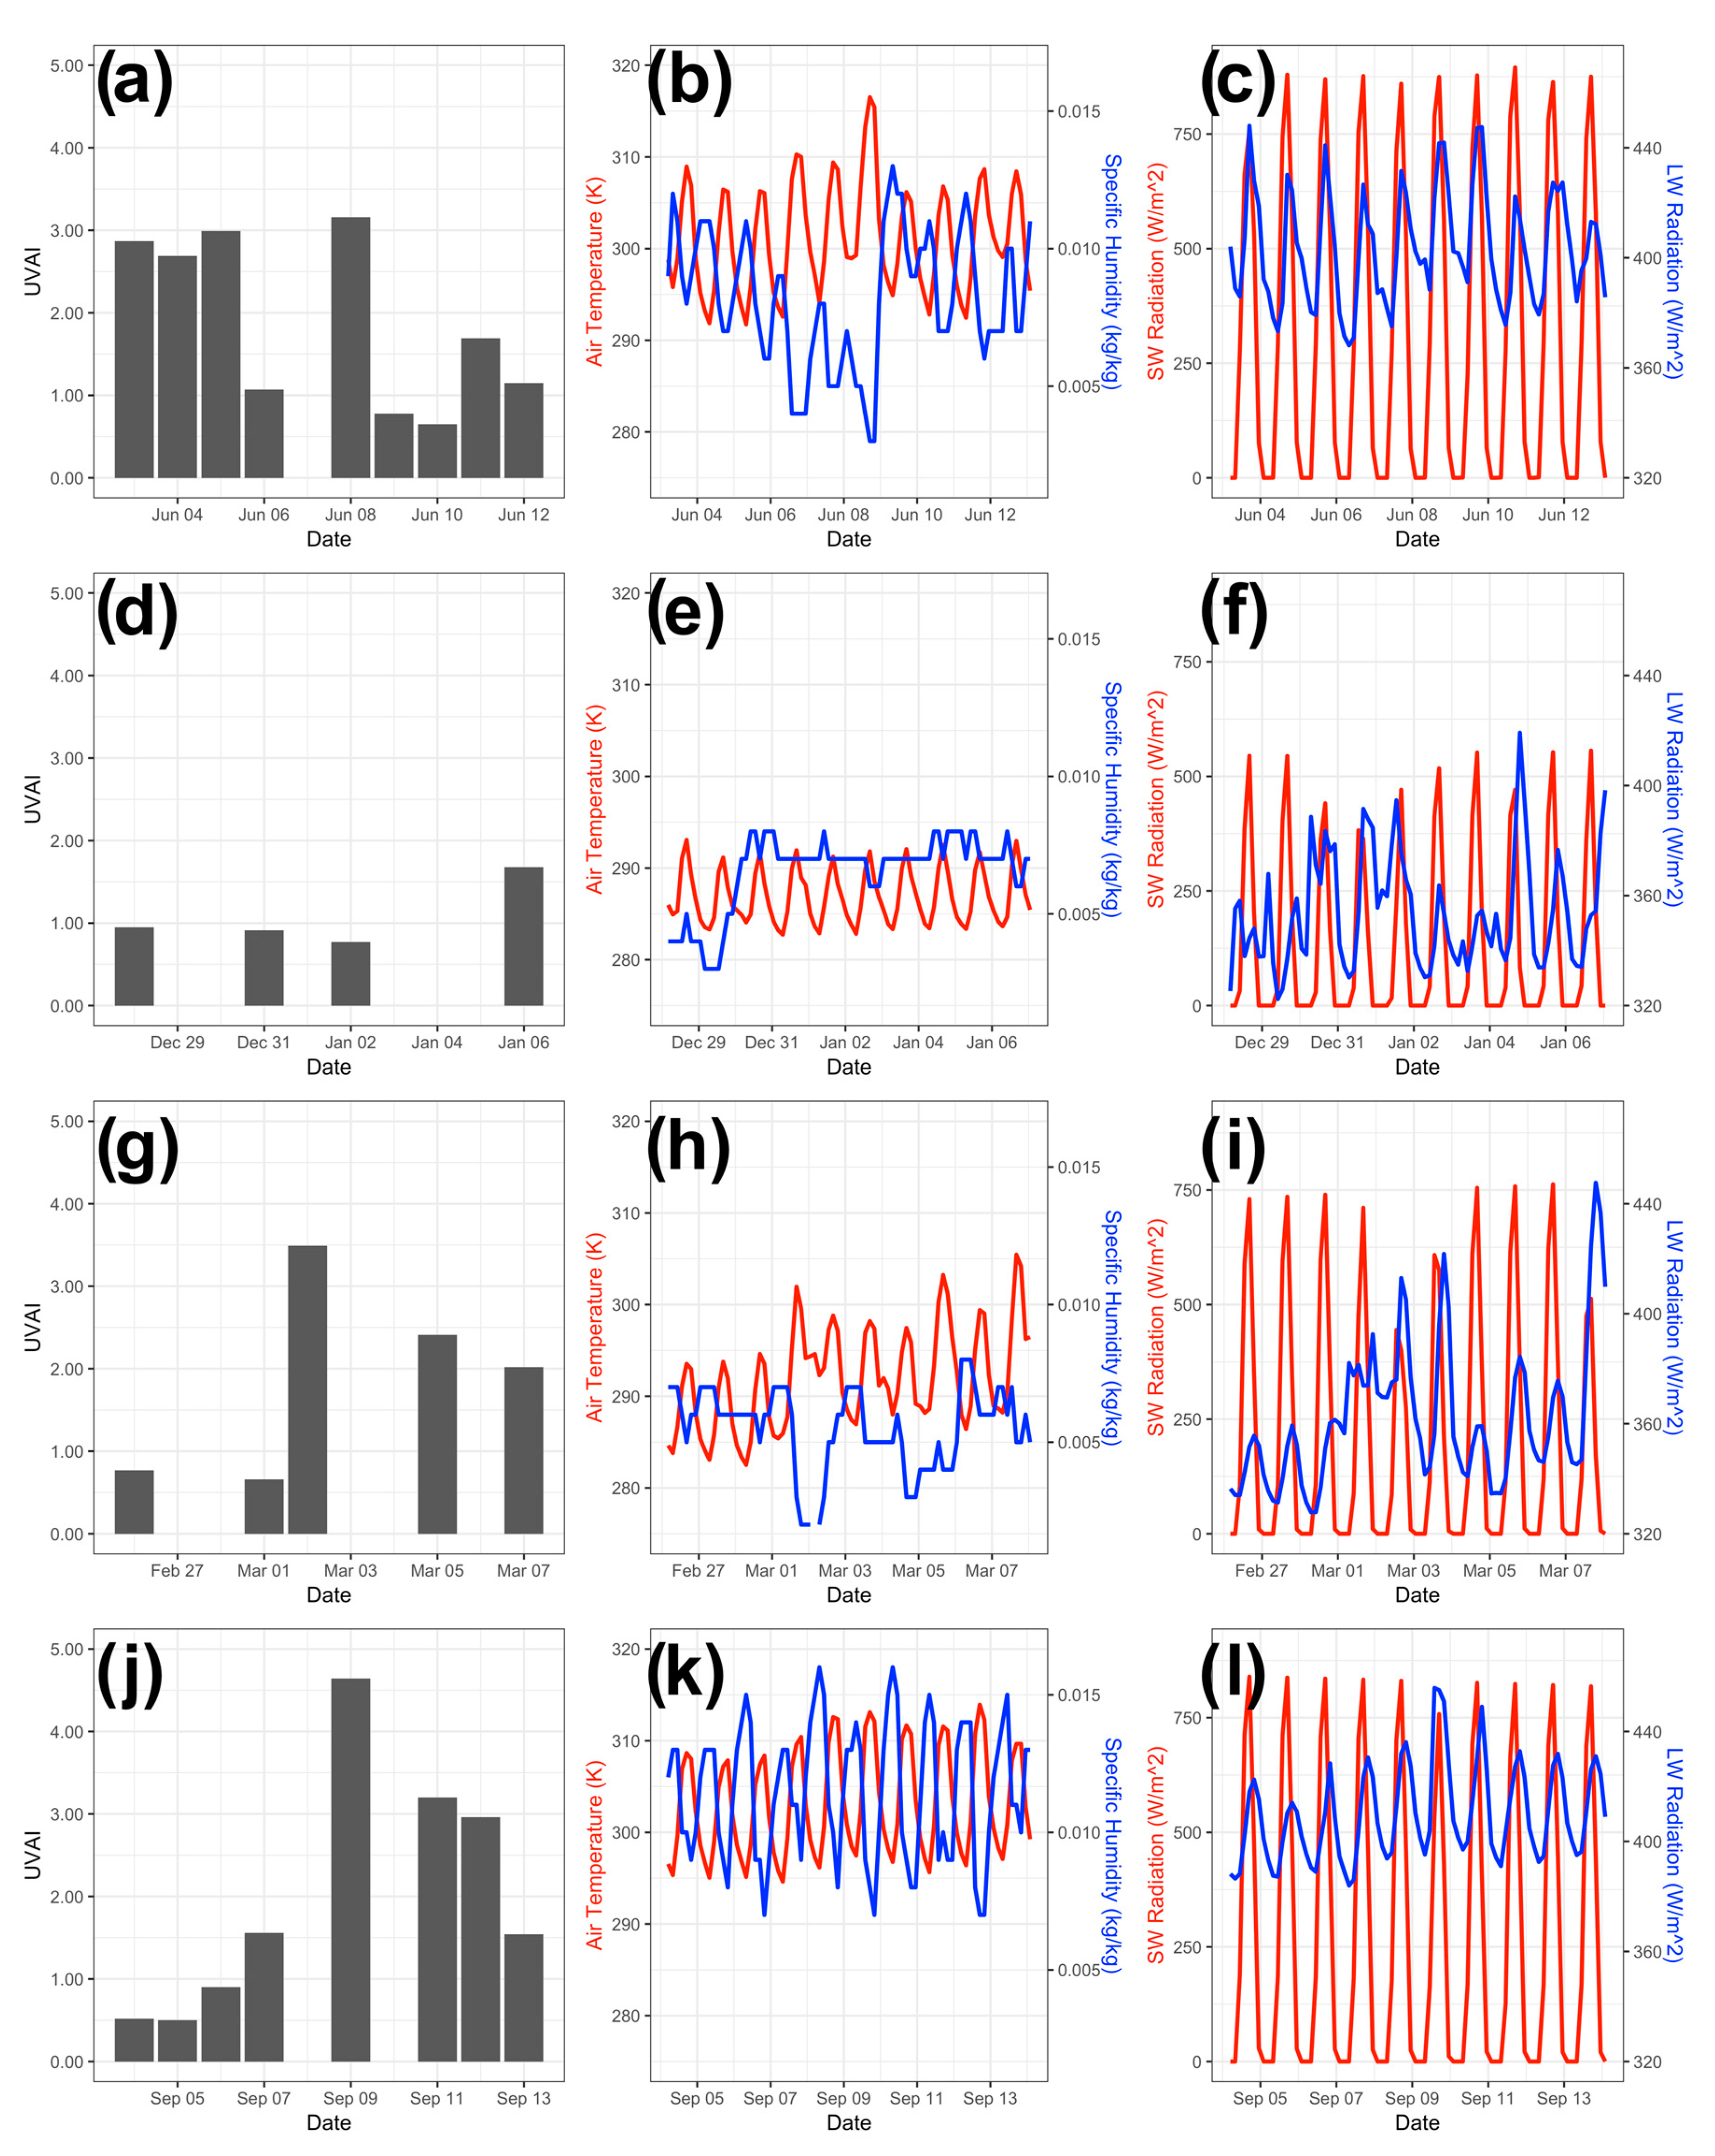
2.3.1. UV Aerosol Index

Ultraviolet (UV) rays form a type of electromagnetic radiation spectrum with wavelengths from 10 nm to 400 nm, which are longer than X-rays but shorter than visible light. The studies revealed that a long exposure to the UV rays causes serious public health problems, such as cataracts and other damage to the eye [56]. About 65% to 90% of melanoma of the skin, which accounts for three-fourths of all skin cancer deaths, was also reported to be caused by UV rays [57,58]. On the other hand, UV rays also impacts the circulation of vitamin D, which has been reported as a protective factor against rectum and colon cancer [59].
In this study, the Ultra Violet Aerosol Index (UVAI) is accessed from the Level-3 daily global Total Ozone Mapping Spectrometer (TOMS)-Like Total Column Ozone gridded product OMTO3d [60] at 1-degree spatial resolution. The UVAI is an index that detects the presence of UV-absorbing aerosols, which are calculated as the difference between the observations and model calculations of absorbing and non-absorbing spectral radiance ratios. The negative or small values of UVAI represent non-absorbing aerosols or clouds, while larger positive values represent absorbing aerosols such as dust or smoke. Here, we analyze the UVAI variations during the selected aerosol episodes to demonstrate the impact of aerosols on UV exposure.

2.3.2. Solar Spectral Radiation and Modeling Datasets

As we know, the incoming shortwave solar radiation together with the radiation reflected, absorbed, and emitted by the Earth system make up the Earth’s radiation budget. Larger atmospheric aerosol particles scatter and absorb some of the shortwave radiation, leading to atmospheric warming. The heated atmosphere in turn emits longwave infrared radiation, some of which reaches the Earth surface, which can increase the land surface temperature and change the surface air humidity. Besides the previously mentioned urbanization impacts (e.g., land surface modification), a portion of the outgoing longwave radiation (OLR) from the Earth’s surface is absorbed by greenhouse gases (e.g., water vapor), which in turn contributes to the “Urban Heat Island” effects, posing more impact on the public health of the inhabitants in the greater Cairo region [61,62,63,64,65].
To investigate the aerosols’ impact on the solar radiation and air temperature, we used the Global Land Data Assimilation System (GLDAS) version 2.1 dataset [66] for the radiation analysis. GLDAS uses advanced land surface modeling to generate optimal fields of land surface fluxes and states through assimilating both satellite and ground-based observational data products. In this research, we used the Google Earth Engine [67] tool to obtain and process GLDAS products, including specific humidity (Qair_f_inst in the unit of kg/kg) (the ratio of water vapor mass to total moist air parcel mass), air temperature (Tair_f_inst in the unit of Kelvin), downward longwave radiation flux (LWdown_f_tavg in the unit of W/m2), downward shortwave radiation flux (SWdown_f_tavg in the unit of W/m2), wind speed (Wind_f_inst in the unit of m/s), average surface skin temperature (AvgSurfT_inst in the unit of K), net longwave radiation flux (Lwnet_tavg in the unit of W/m2), pressure (Psurf_f_inst in the unit of Pa), and net shortwave radiation flux (Swnet_tavg in the unit of W/m2). Google Earth Engine proved to be an effective cloud online computing and analysis tool for the environmental research in Egypt and the Middle East and North Africa regions [20,21,68].
In order to assess the role of aerosol-related impacts and their connection to air pollution in the study region, the gridded data of the Modern-Era Retrospective analysis for Research and Applications version 2 (MERRA-2) is used in this research. The MERRA-2 dataset is an atmospheric reanalysis dataset produced by the National Aeronautics and Space Administration (NASA) and released by NASA Global Modeling and Assimilation Office (GMAO) in 2017. The monthly means of the “Dust Extinction AOT 550 nm—PM2.5”, “Sea Salt Extinction AOT 550 nm”, “Surface Air Temperature”, and “Surface Wind Speed”, as well as daily mean of “Total Aerosol Extinction AOT 550 nm” at 0.5° × 0.625° resolution covering the period from the year 1998 to 2016 are obtained and processed [69,70].

2.3.3. PM10 and PM2.5 Datasets

The PM10 dataset is provided by the Egyptian Environmental Affairs Agency (EEAA), including the hourly observations in eight locations (Abuzabal, Shubra, Qualaly, AlainyPH, Abasseya, NasrCity, NewEgypt, and Helwan) of the Greater Cairo region during 2018. In addition, to show the annually PM2.5 variability in Egypt, satellite-based geographically weighted regression (GWR) PM2.5 product [71] is used and obtained from the Socioeconomic Data and Applications Center (SEDAC) (https://sedac.ciesin.columbia.edu/data/set/sdei-global-annual-gwr-pm2-5-modis-misr-seawifs-aod/data-download).

3. Results

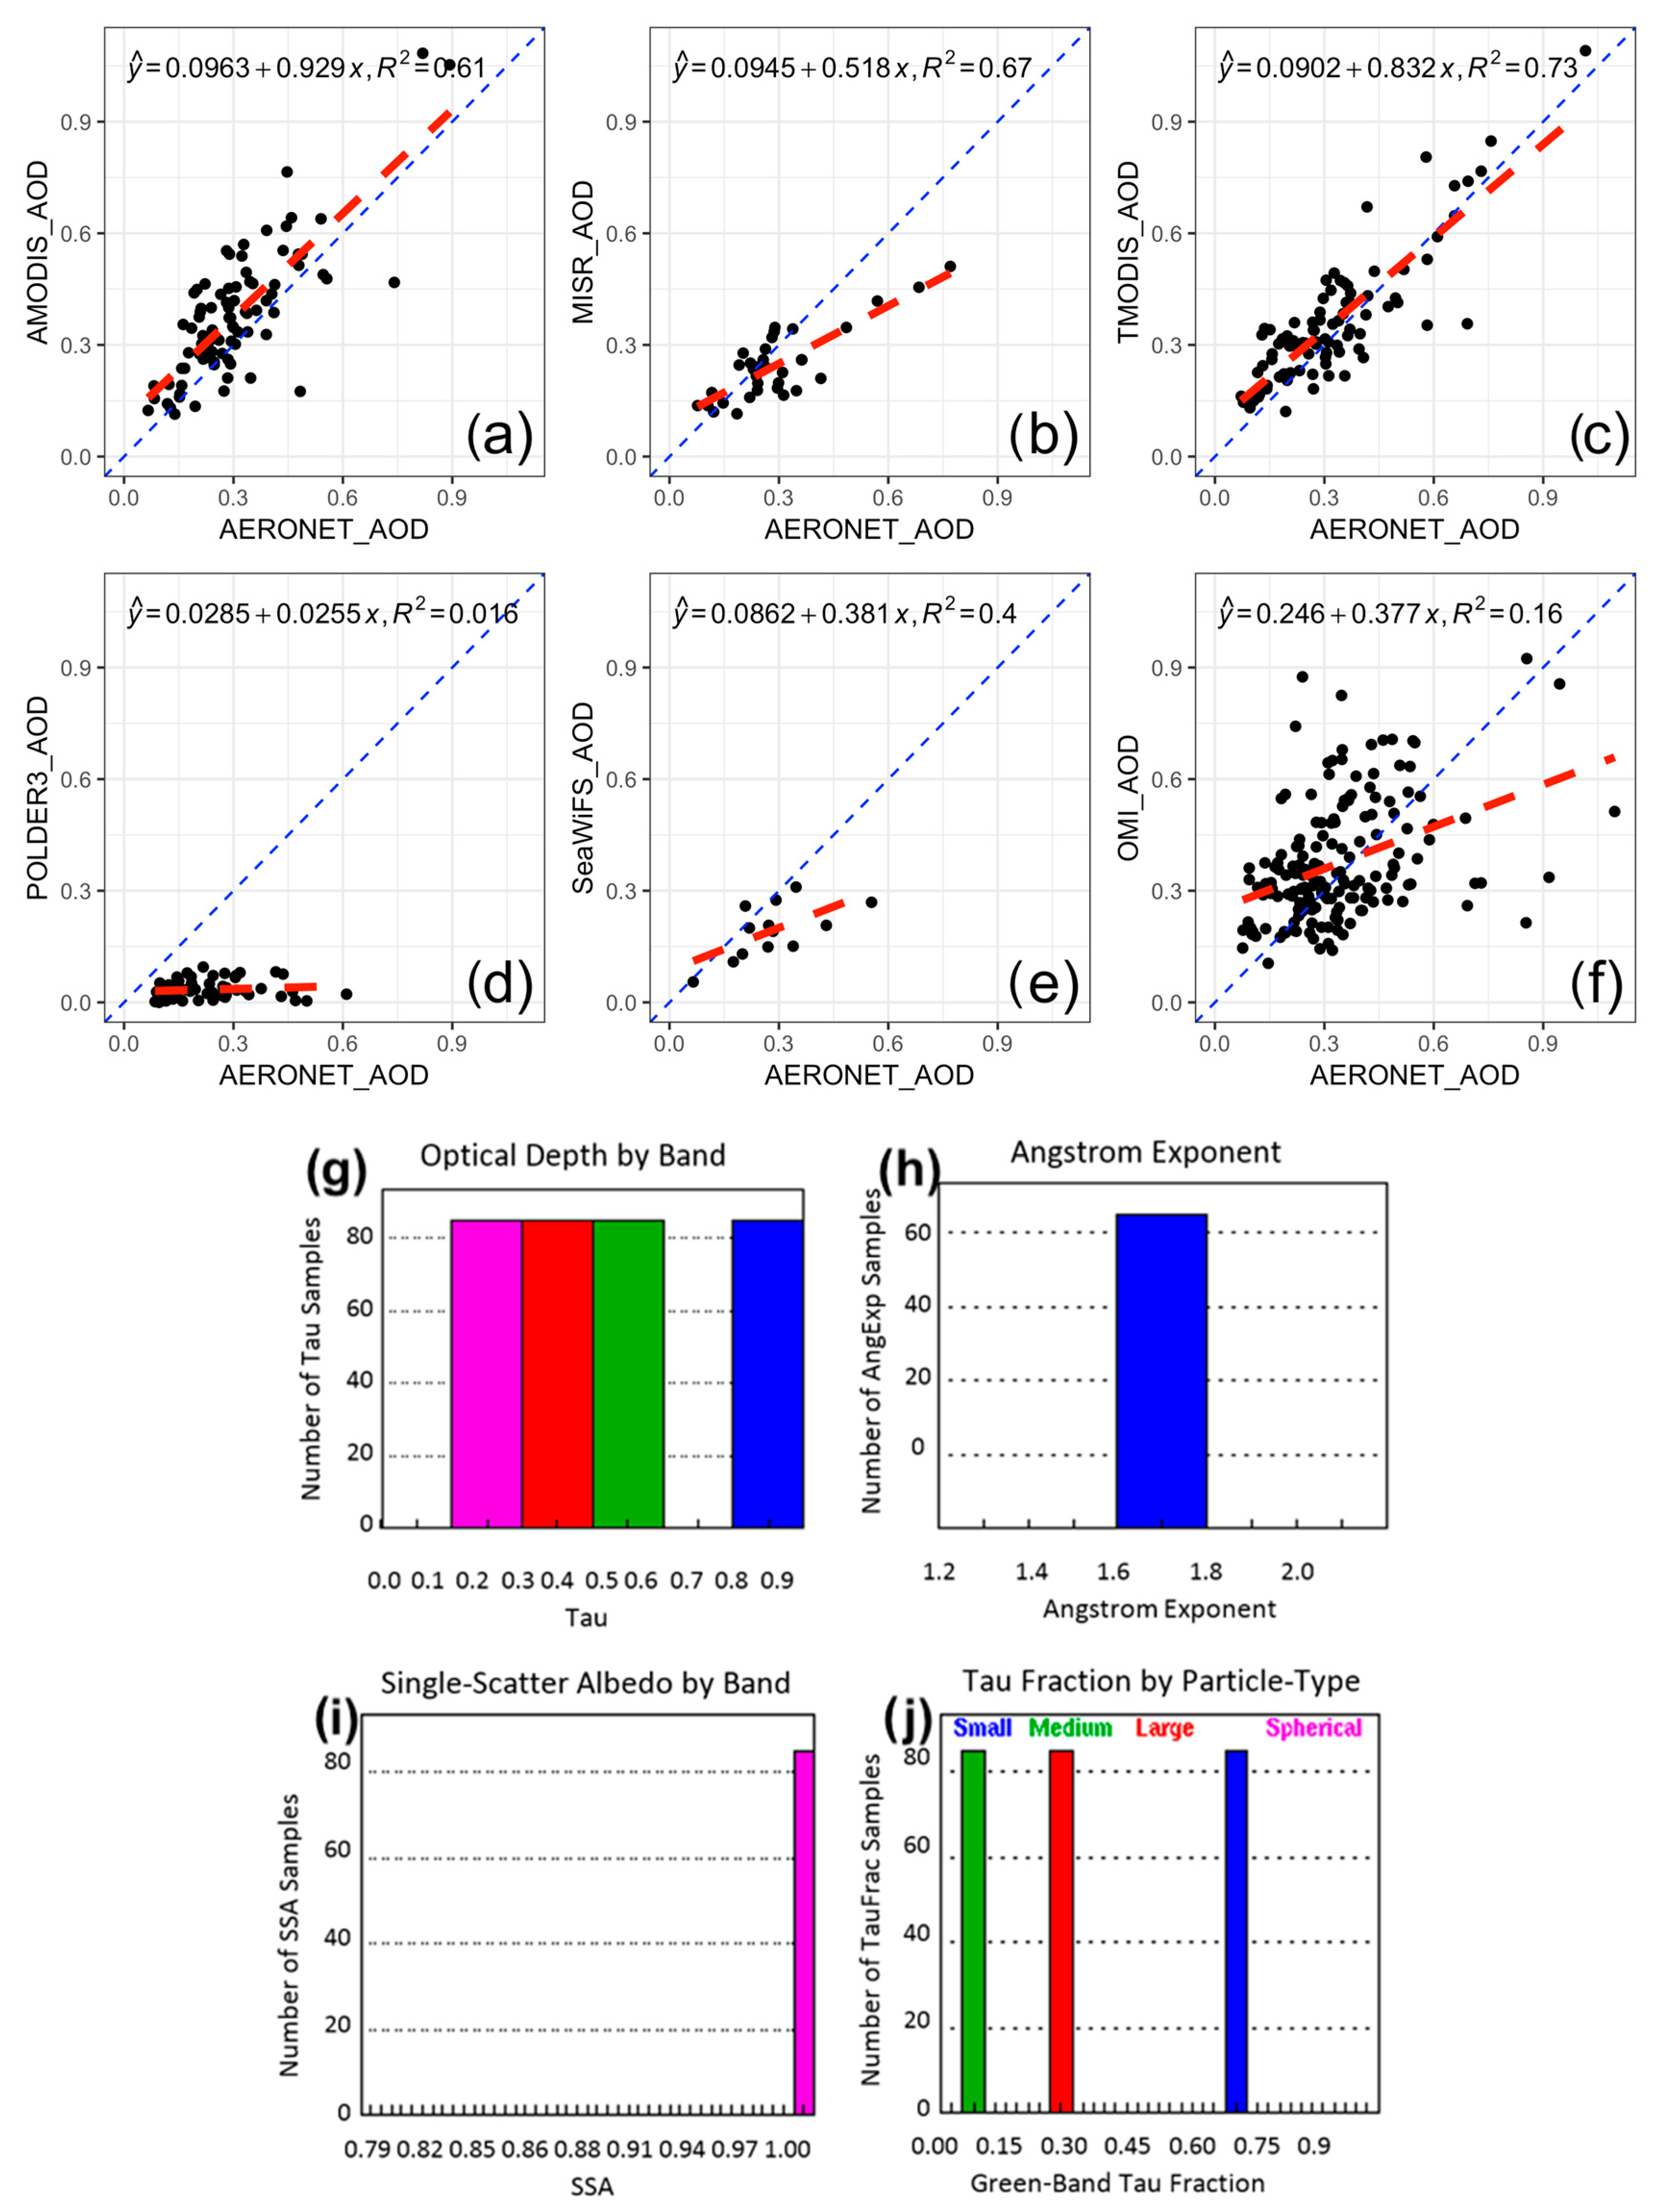
3.1. Validation of Satellite Sensors for Aerosol Analysis in Cairo

Here, the fitness of various satellite aerosol products in measuring Cairo’s regional aerosol conditions is investigated as compared with AERONET measurements during 2004–2006. The AOD products of POLDER3 (Figure 2d), SeaWiFS (Figure 2e), and OMI (Figure 2f) are less dependent on AERONET measurements (R2 <0.5). This inconsistency may result from the lower efficiency of AOD retrieval algorithms, or limited observations (e.g., only 13 observations for SeaWiFS). However, the updated products (e.g., merged Dark Target and Deep Blue MODIS Collection 6.1) of Aqua MODIS (Figure 2a) and Terra MODIS (Figure 2c) [72,73,74,75,76], as well as MISR (Figure 2b) have achieved a high consistency with AERONET measurements (R2 >0.6). Therefore, these products are validated to study the aerosol variability along with AERONET products, especially over the Mediterranean region [77,78]. Moreover, the MISR could provide an analysis of aerosols plumes microphysics. Aerosol products such as AE, SSA, and AOD fraction by particle can disclose the particle properties of the plumes during their moving over the region. For example, Figure 2g–j show aerosol-related histograms of a plume over Egypt on 14 September 2008. Optical depth bars (Figure 2g) contain different spectral bands, as exhibited by the different colors, which represent the composition of different pollution sources. This aerosol plume has high SSA (>0.95) (Figure 2i), which indicates generally a cooling effect to the land surface [79]. A high AE value (>1.7) validates the sources from industrial pollution and biomass burning (Figure 2h). Over industrial regions, such as North America and Europe, or urban centers (our case), the SSA is identified to be about 0.98, which is caused by large supplements of black carbon and sulfate from biomass burning (Figure 2i) [80], whereas SSA is lower over the dusty regions, such as Sahara Desert. The histogram in Figure 2j illustrates the fraction of the green-band optical depth values by different particle sizes: small (blue bar at 0.7), medium (green bar near 0), and large (red bar at 0.3), which shows that this plume is mainly composed of small aerosol particles. Figure 2j also indicates the non-existence of spherical particles, as no purple bar appears in this figure. It is worth noting that the data samples for MISR are also relatively small, but given the high consistency shown by the MISR, and the effective application of MISR in the Cairo region for aerosol analysis [1,2], we still employ MISR in the research.

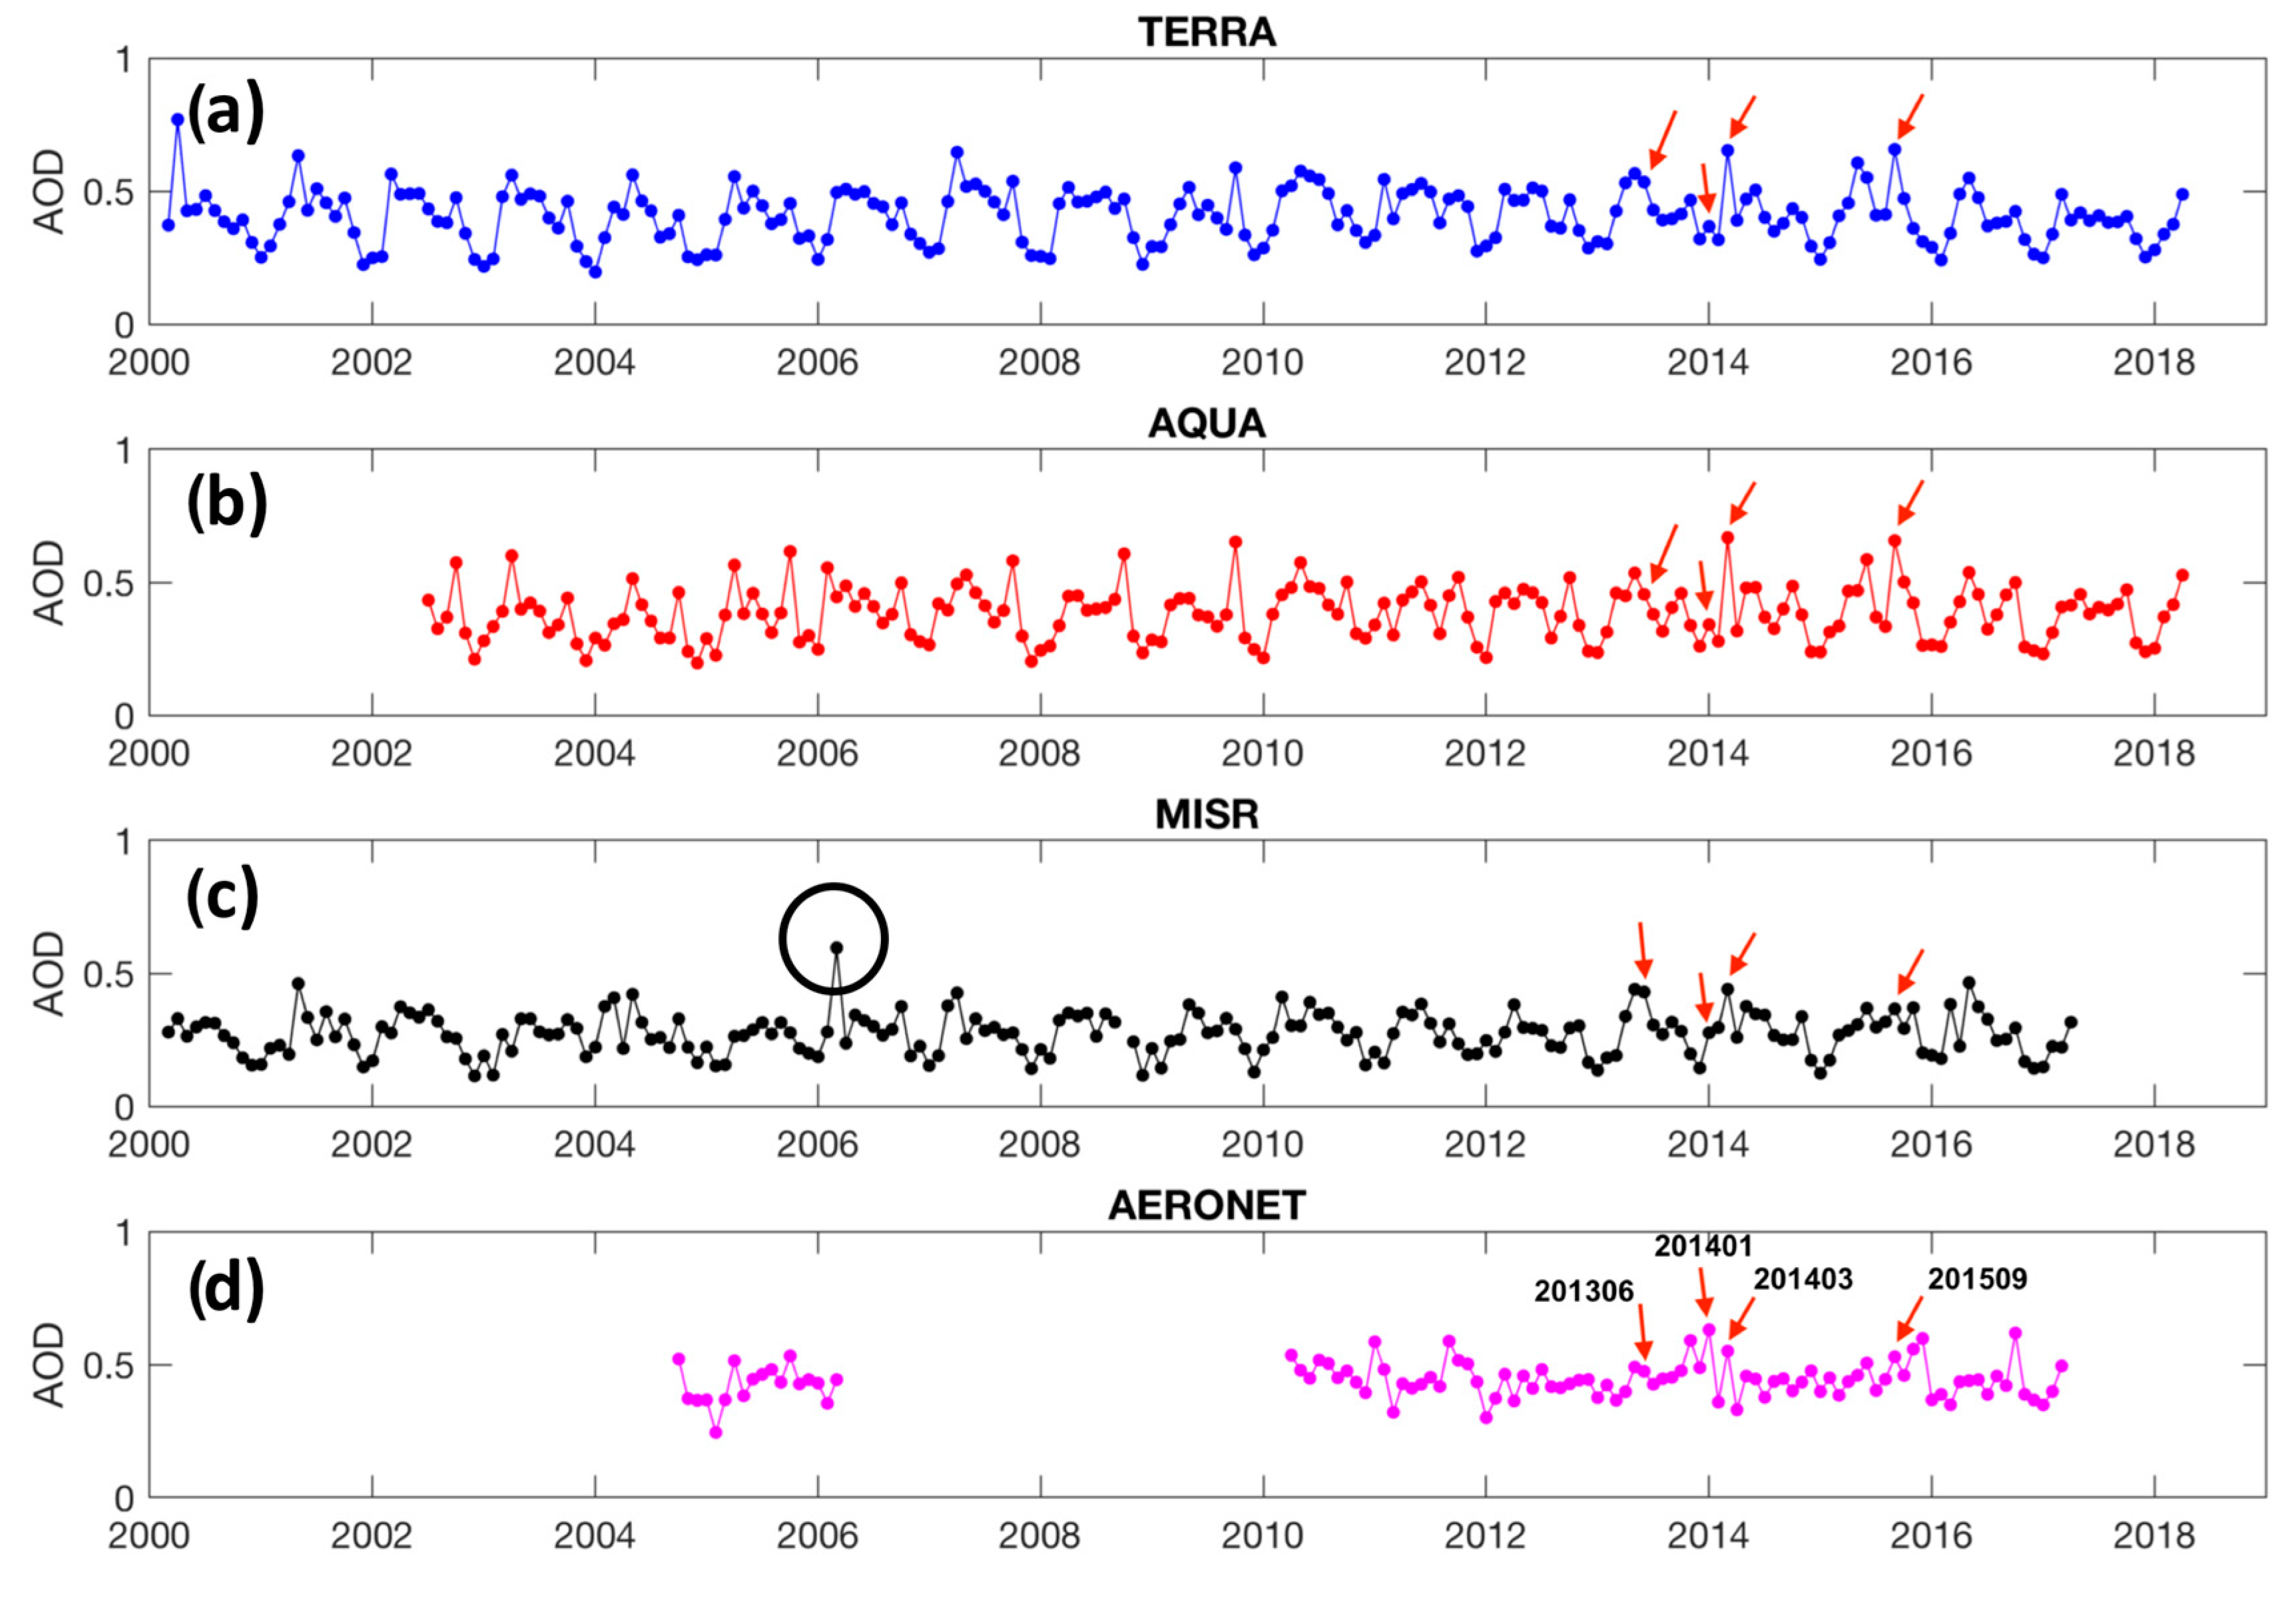
3.2. Time-Series Analysis of Observations of AERONET and Multi Sensors

Figure 3 shows the monthly AOD values over the Cairo area, as displayed from a time series analysis of Terra MODIS (Figure 3a), Aqua MODIS (Figure 3b), MISR (Figure 3c), and AERONET (Figure 3d) from 2000 until 2018. The obvious periodic characteristics are indicated in Figure 3—high AOD values occur in summer and low in winter, which also could be found from the ARONET measurements. The AOD variability as depicted from the time series of Terra MODIS and Aqua MODIS is more coherent, since both datasets are retrieved with same retrieval algorithms. Some emerging AOD events recorded by MISR (such as March 2003, which is located by a black circle) are not found in the Terra MODIS and Aqua MODIS series. Therefore, to choose the typical seasonal emerging AOD events, months with high AOD values agreed by all three datasets are selected for analysis, including June 2013 (summer), January 2014 (winter), March 2014 (spring), and September 2015 (fall), which are marked by the red arrows.
In Figure 4, the red arrows show the dates of the aerosol emerging events for the selected months, which are 8 June 2013, 2 January 2014, 3 March 2014, and 9 September 2015. They are either the highest AOD values observed during the month (such as 9 September), or the date of one of the highest record of the month (such as 3 March), which could be considered as the main contributor to the emerging monthly AOD value for the month. Detailed analysis for each event will be discussed in Section 3.3.

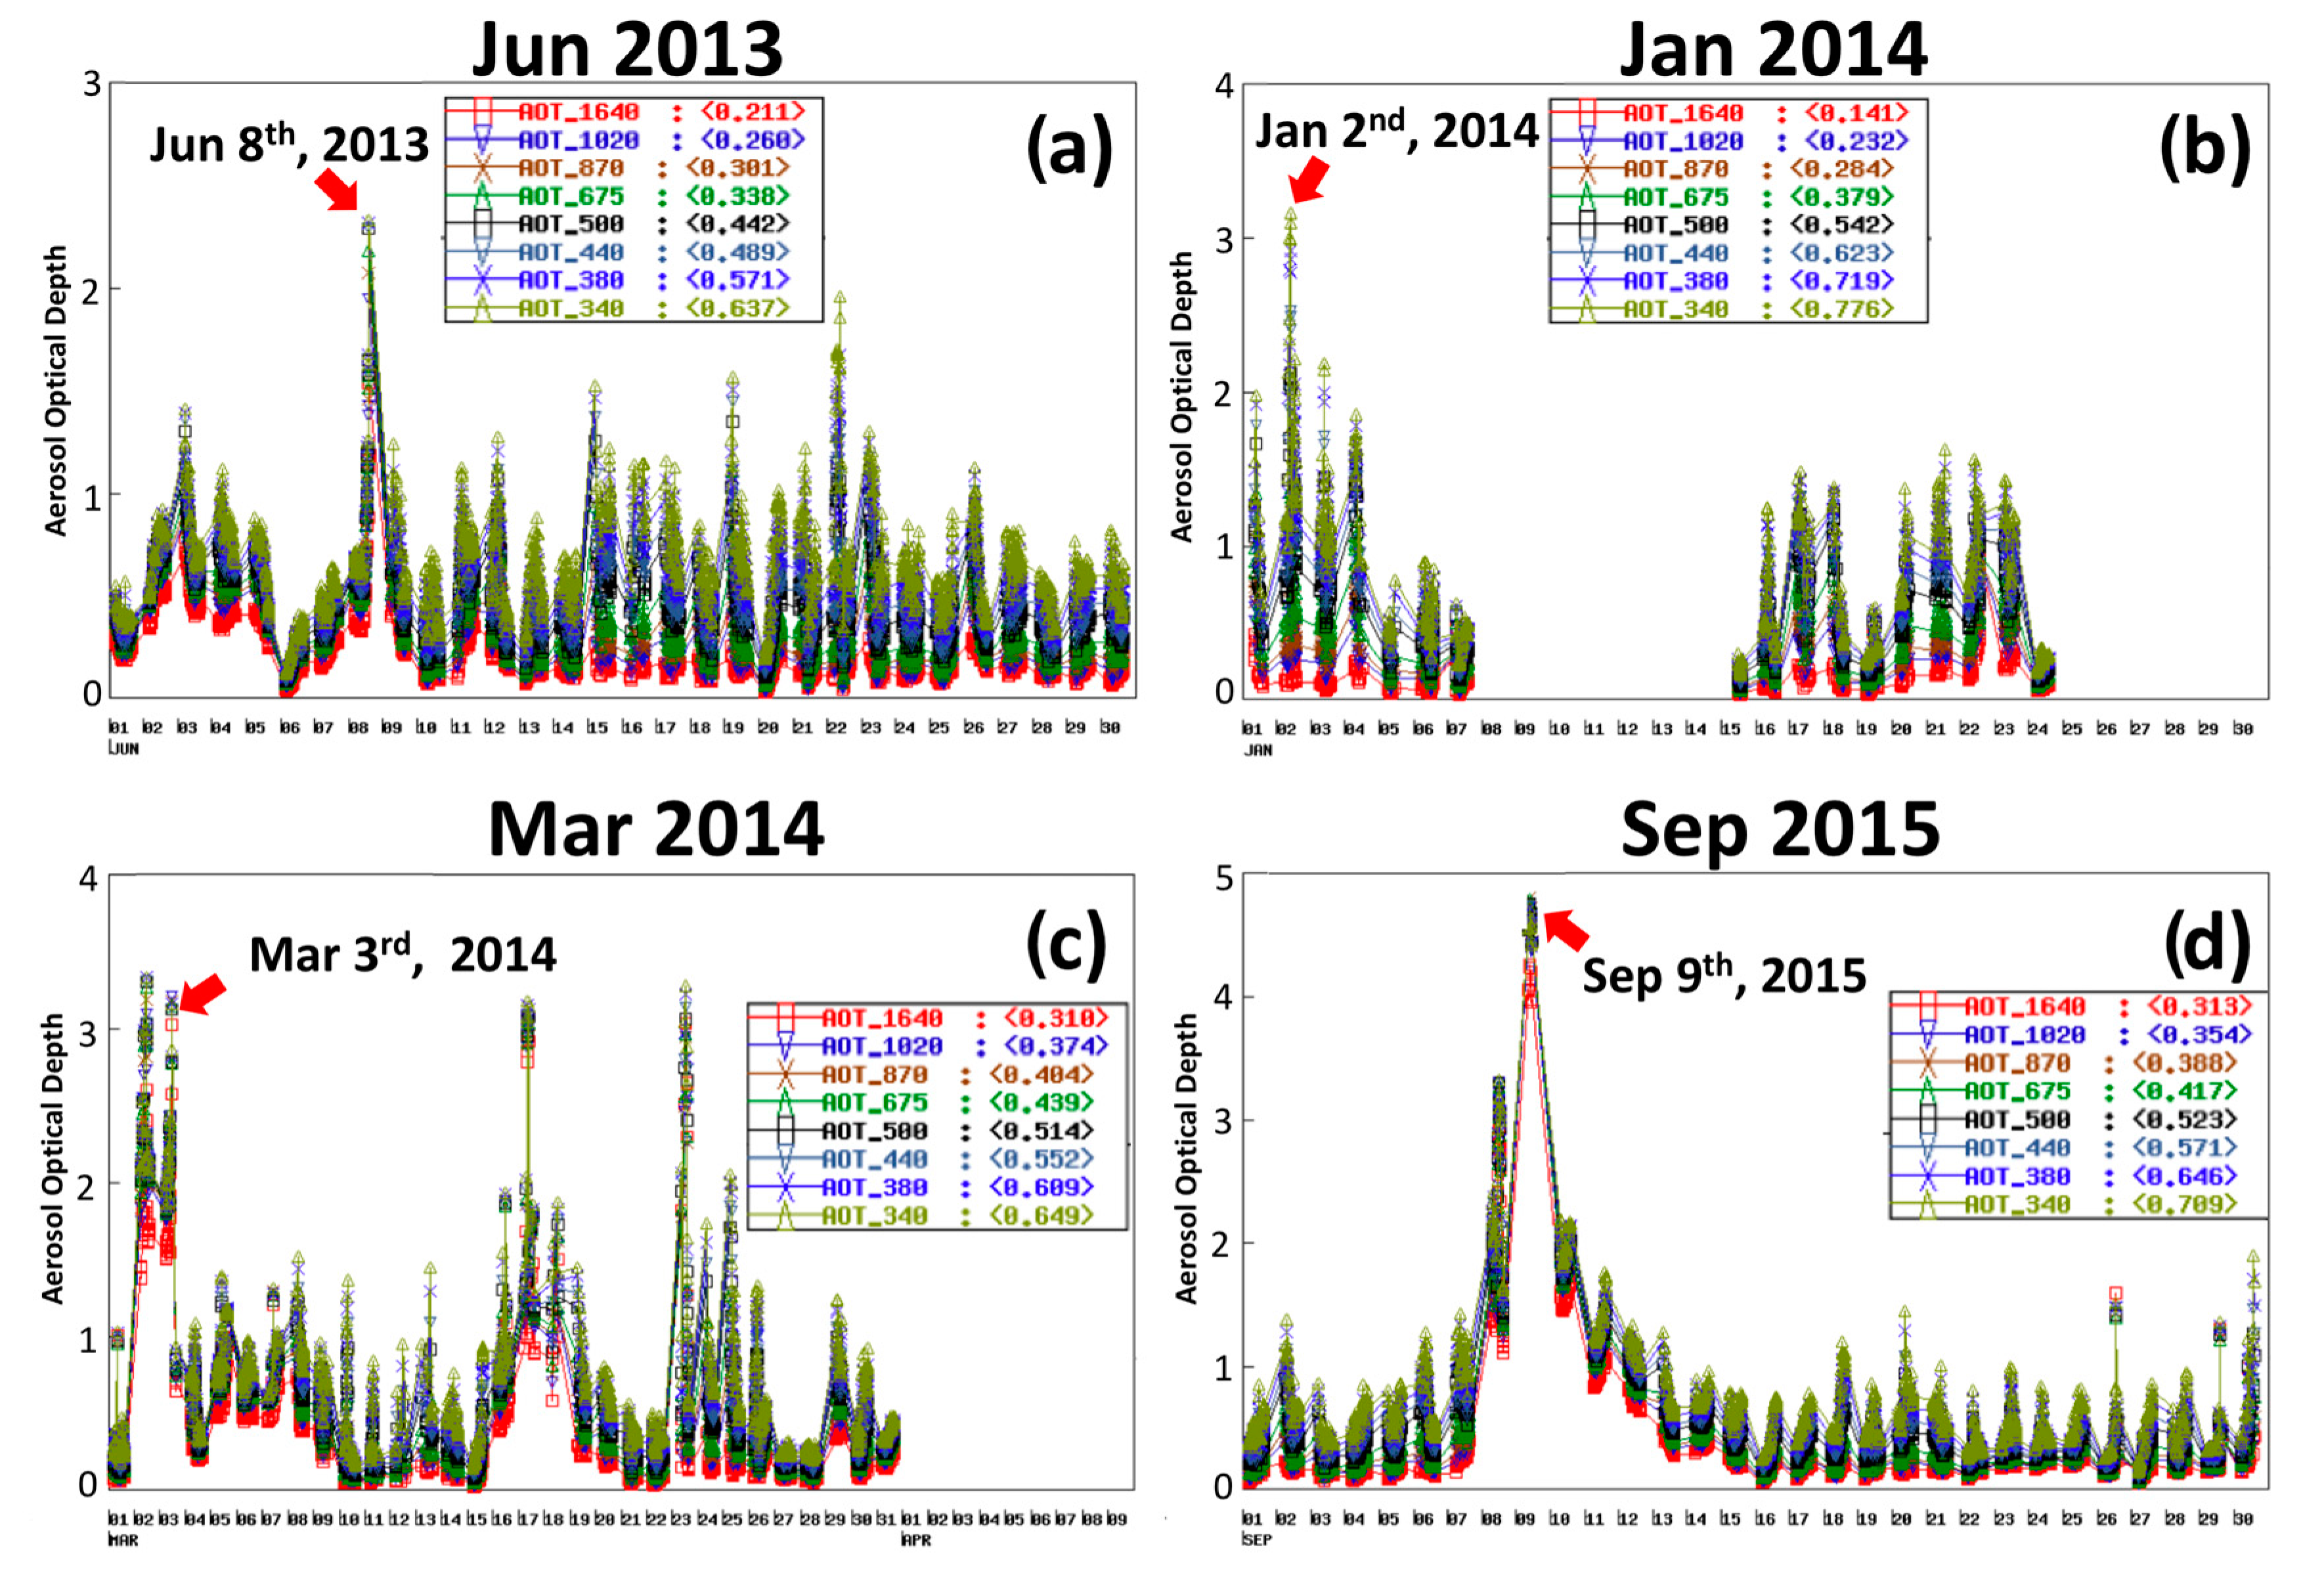
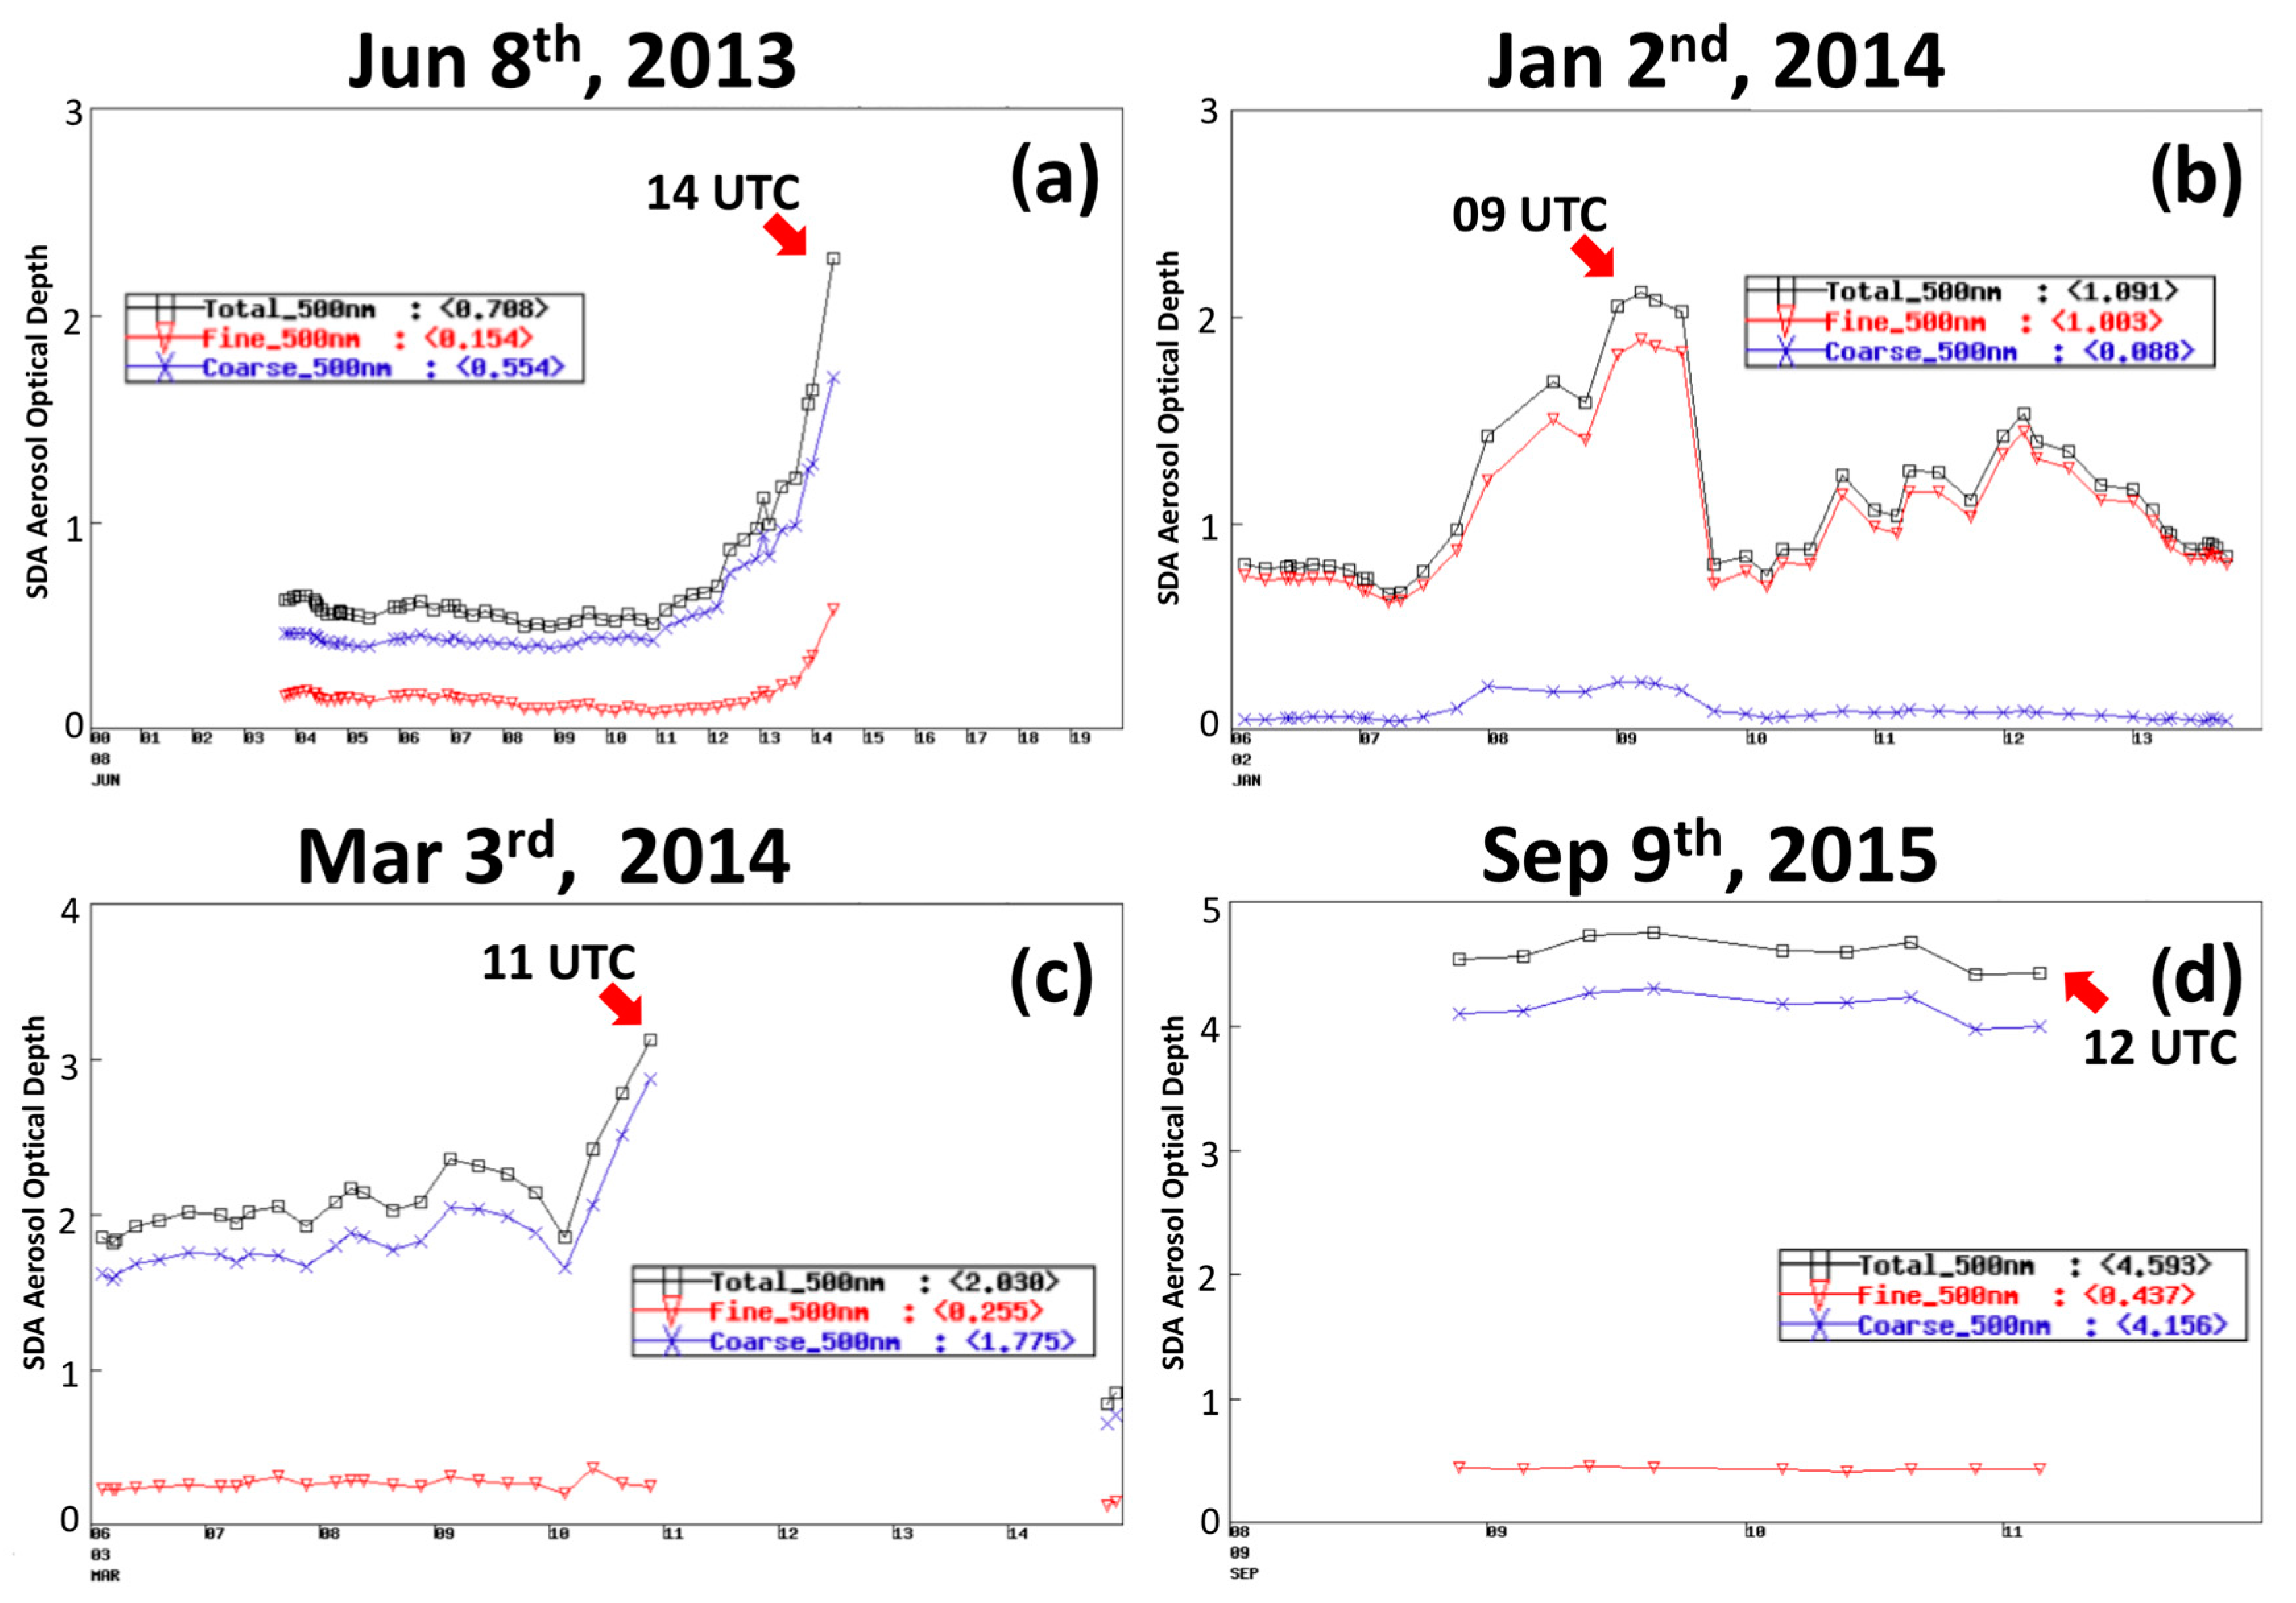
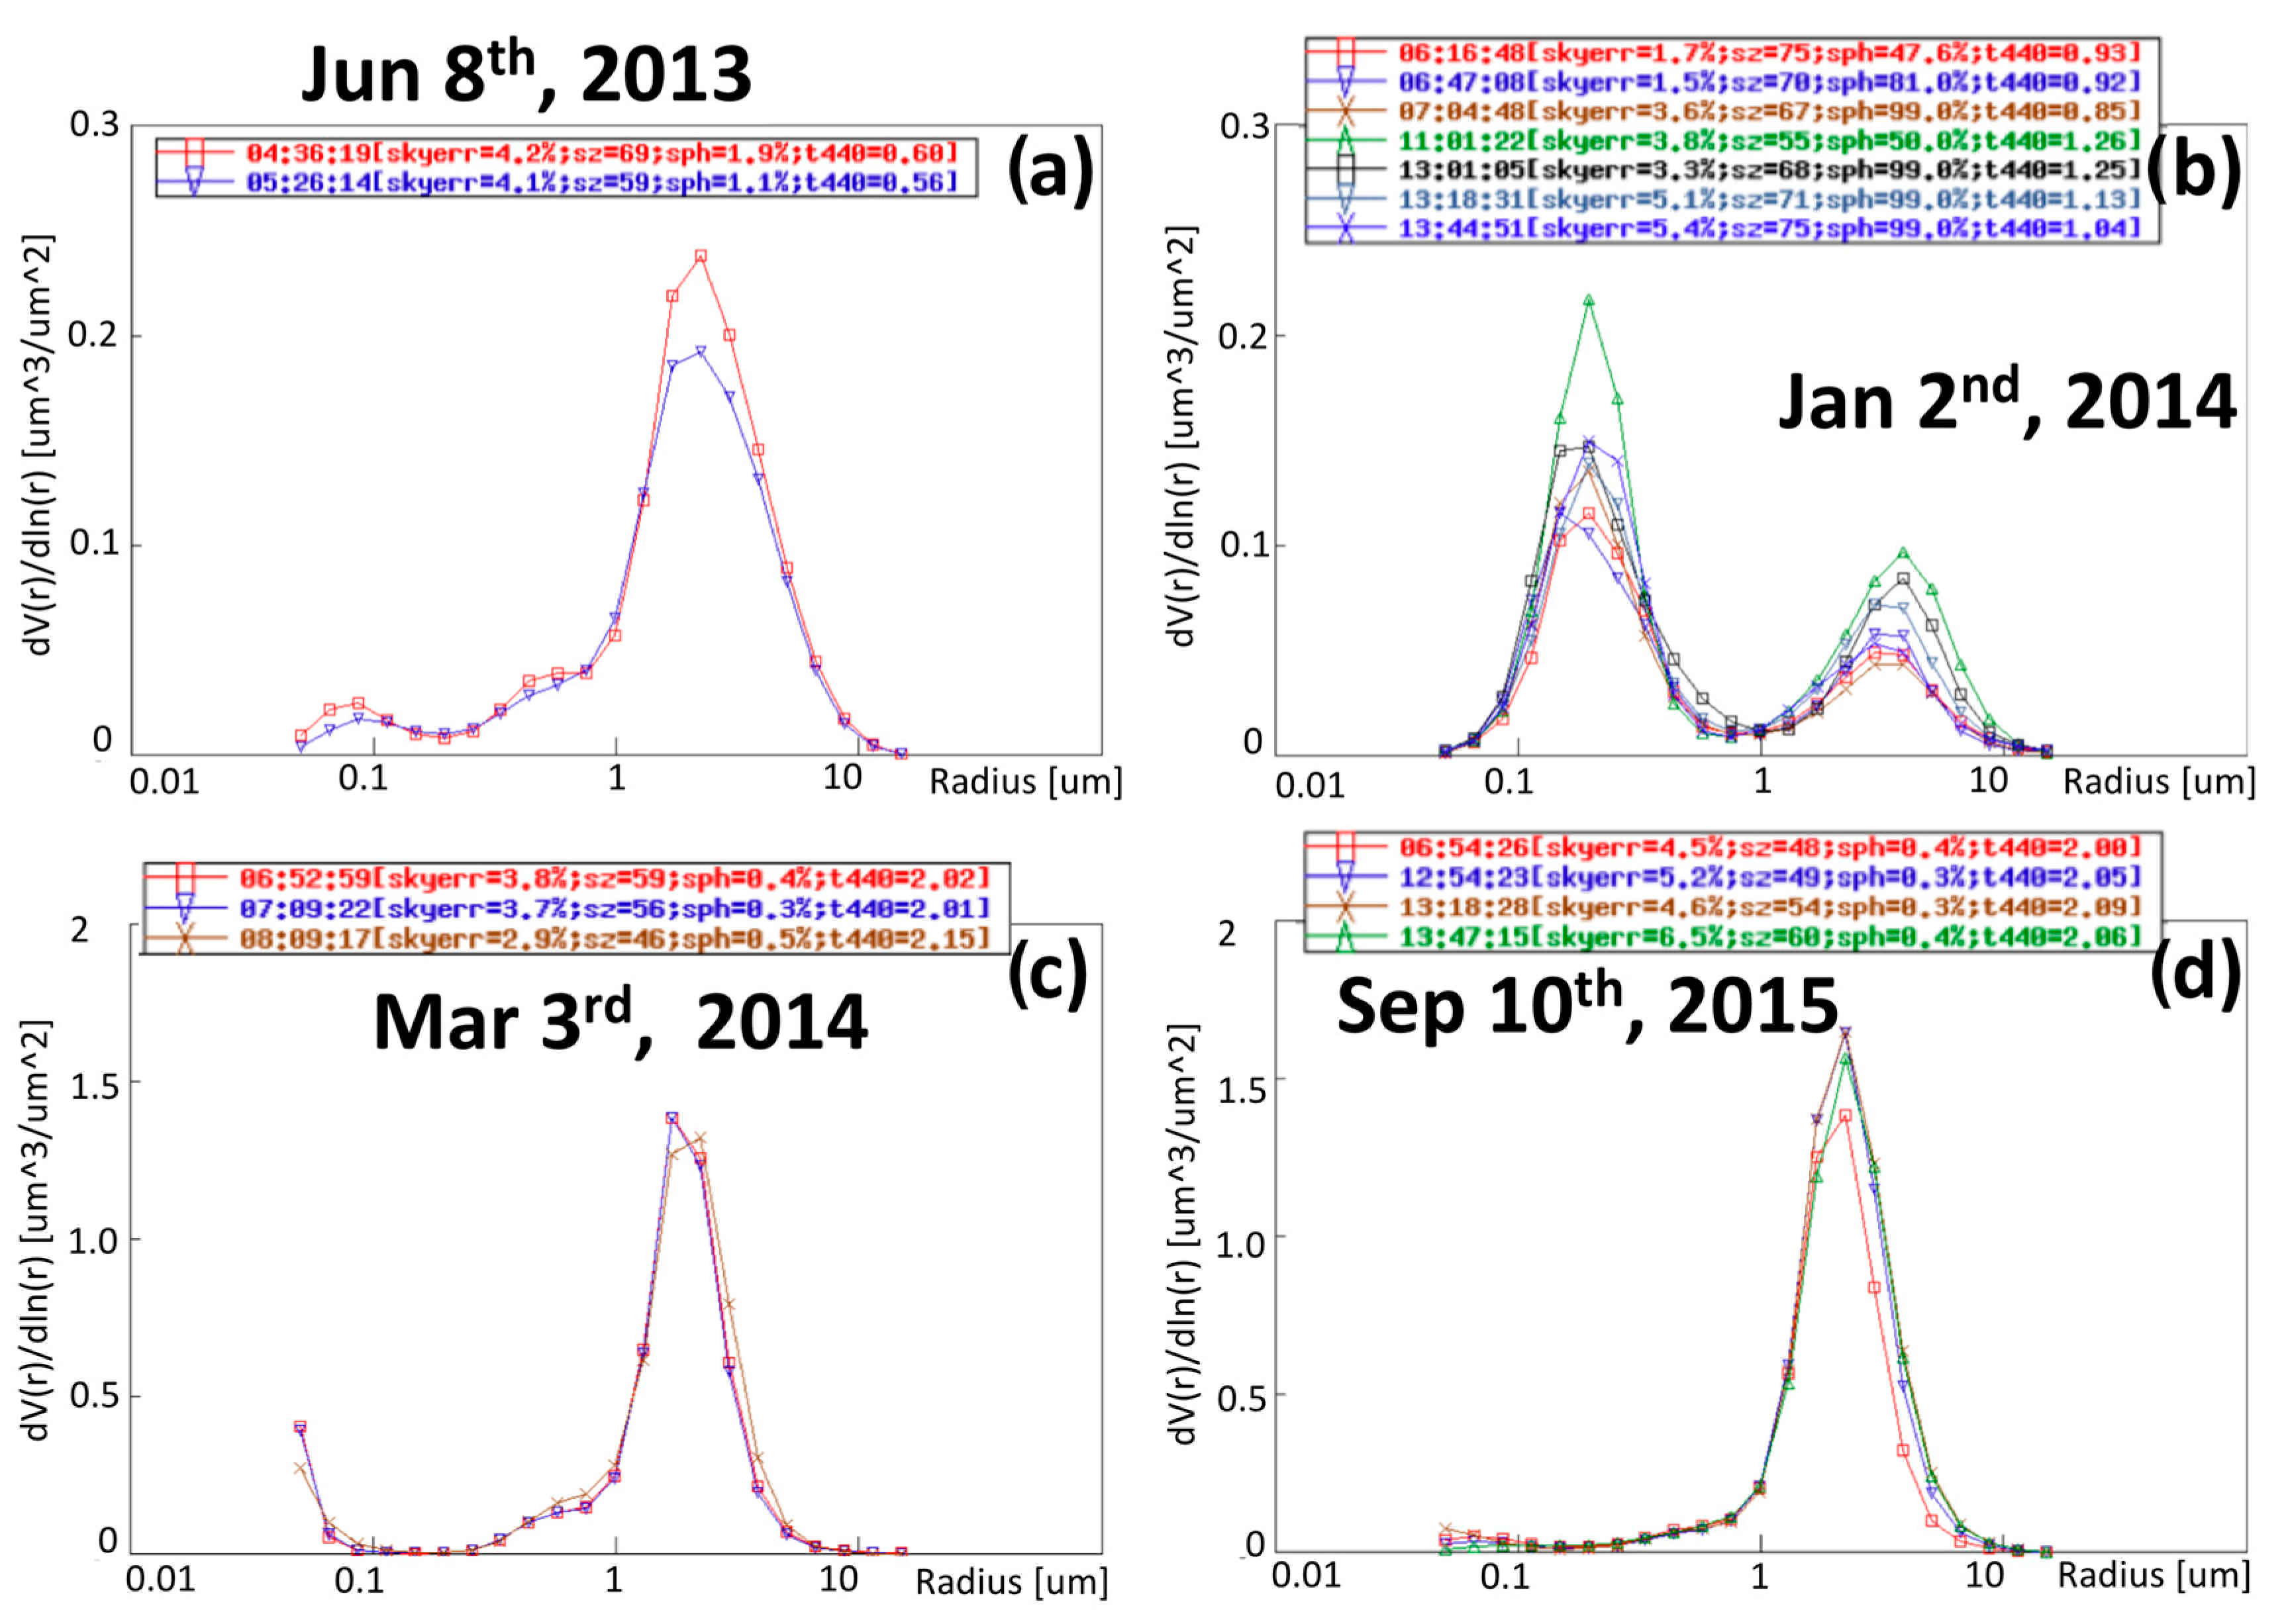
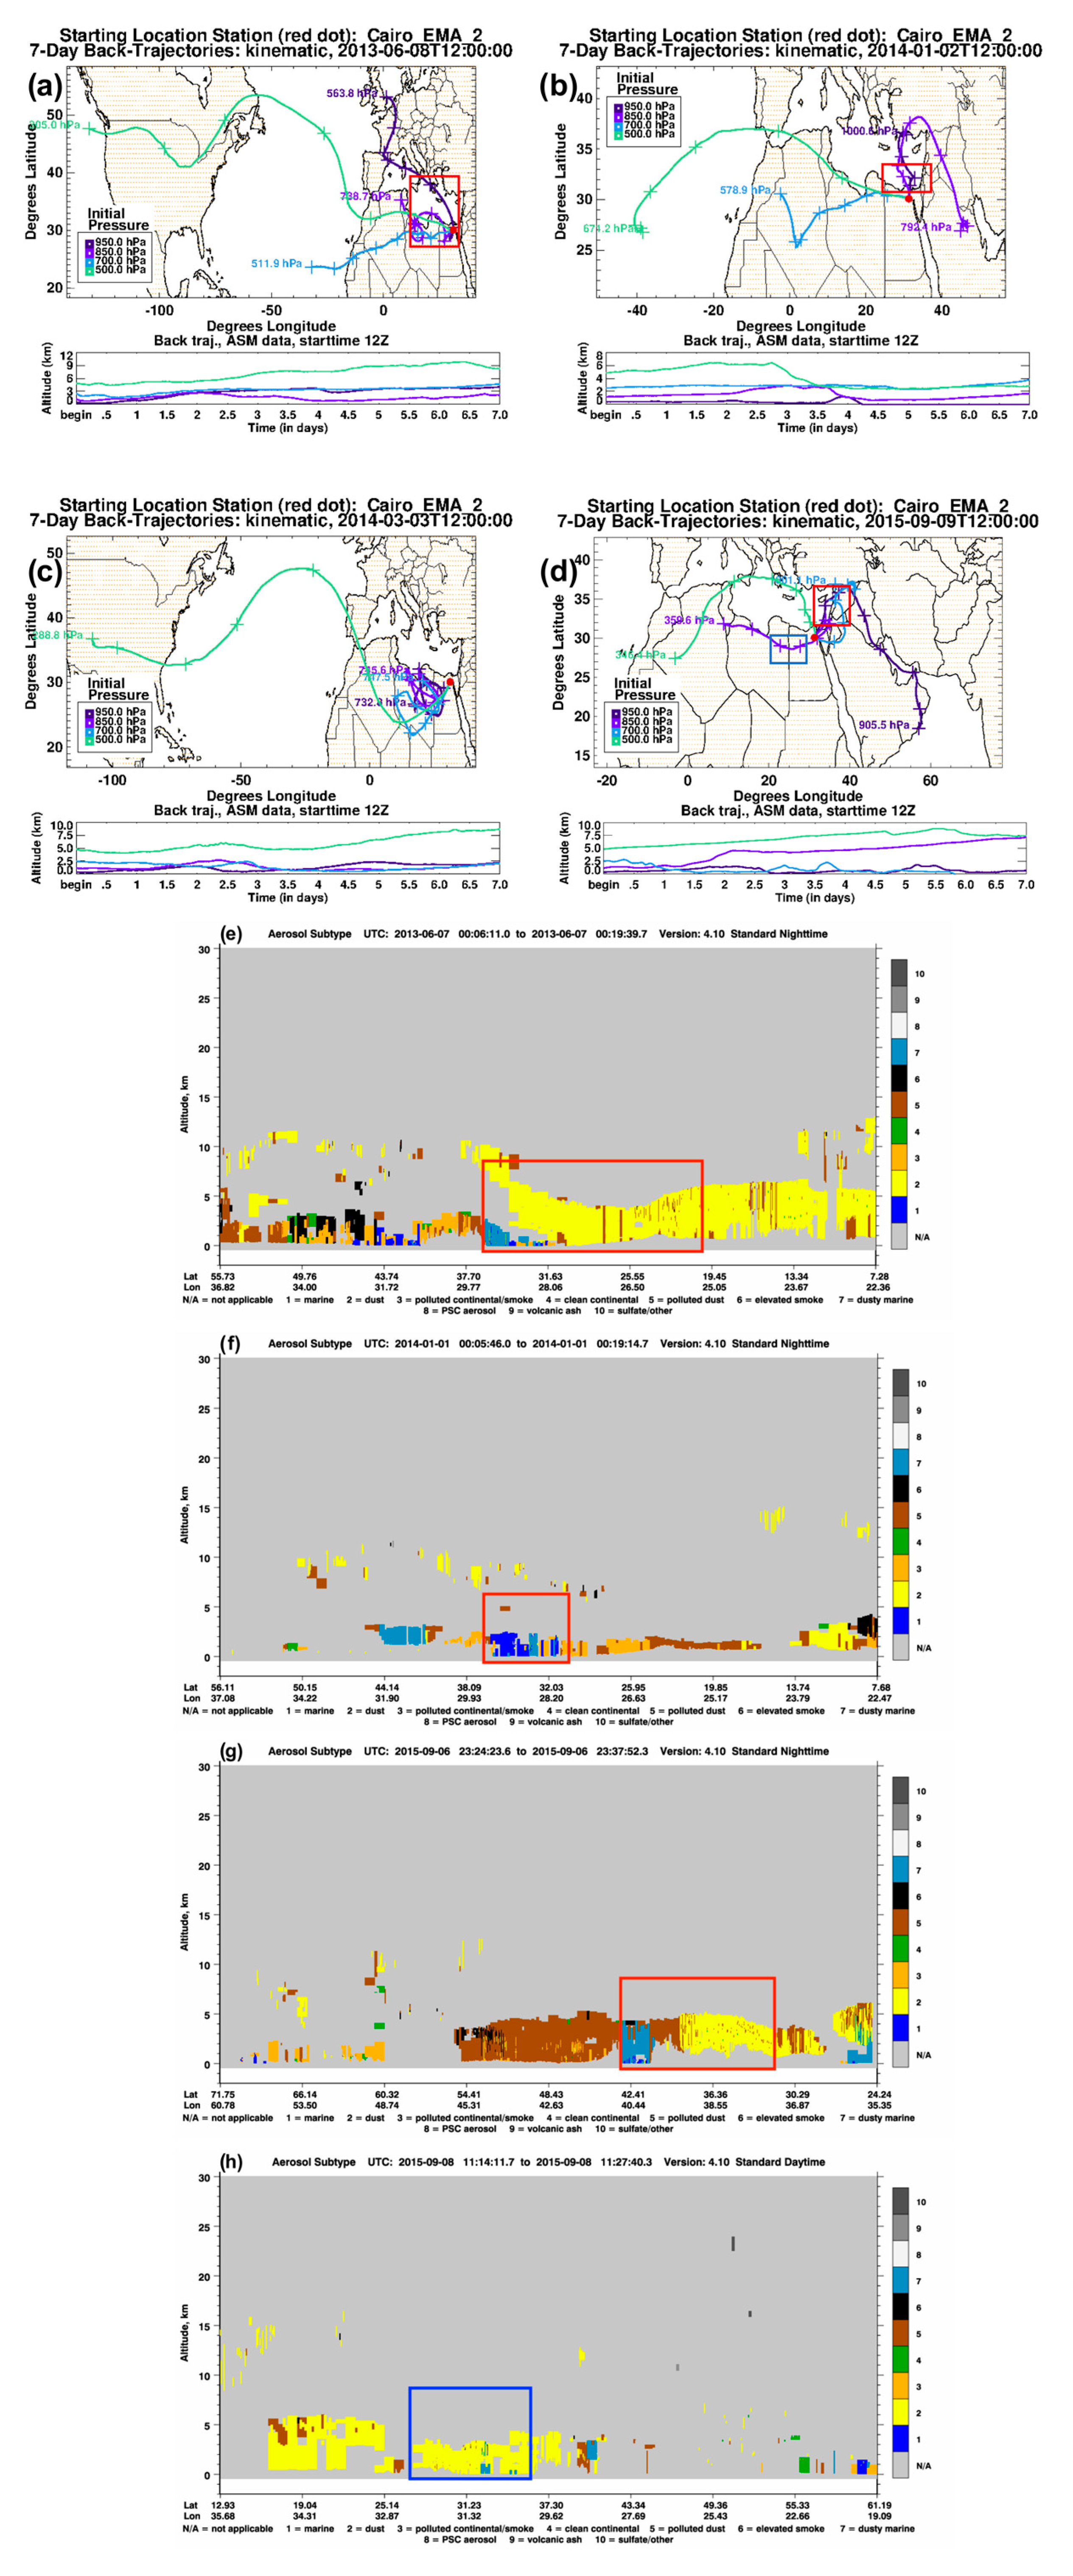
3.3. Analysis of Seasonal Aerosol Emerging Episodes

In Figure 5, the SDA time series show the starting times for seasonal aerosol soaring are: 14 UTC at 8 June 2013, 09 UTC at 2 January 2014, 11 UTC at 3 March 2014, and 12 UTC at 9 September 2015. Both fine and coarse aerosols were contributors to the total aerosol amount, as indicated by the aerosol composition analysis. However, the total aerosols at 2 January 2014 is mainly composed of fine aerosols, whereas coarse aerosols (mainly dust from sandstorms) are the dominant aerosol component for the other three events.
In Figure 6, most of the aerosol particles measured during the 2 January 2014 event fall in the radius range of 0.1 to 1 µm (fine aerosols), and some fell into the radius range of 1 to 10 µm (coarse aerosols). This result indicates that the Cairo region is affected by aerosols with a complex mixture of air pollution types during autumn, when biomass burning contributes to a background of urban pollution and desert dust [1]. In addition, the aerosol particles in the other three emerging events are sized in the range of 1 to 10 µm, which is close to the size of dust. It’s worth noting that the aerosol size distribution of 10 September 2015 is used to substitute the missing observations during 9 September 2015, considering that the aerosol particles measured in both dates have similar properties.
Figure 7 demonstrates the aerosols’ transportation path (GSFC back trajectory maps in Figure 7a–d) and their composition (CALIPSO aerosol subtypes in Figure 7e–h) for each of the seasonal aerosol episodes. The subtypes product was not available for 3 March 2014; therefore, both Figure 7g,h are presenting the 9 September 2015 case, since the two origins are clear. Figure 7a shows that the aerosols episode during 8 June 2013 originated from Libya and Algeria, extending to the Western Desert (blue 700 hPa and light purple 850 hPa paths), while the other aerosols extend from regions in southern and western Europe traveling across the Mediterranean Sea (dark purple 950 hPa). This is confirmed in the highlighted region of Figure 7e, showing that aerosols were mainly composed of mineral dust and partially polluted dust and dusty marine particulates. Figure 7b also illustrates the aerosols during 2 January 2014 originating from the same regions, while the dark purple path (950 hPa) shows some aerosols crossing closely to the water surface of the Mediterranean Sea, potentially transporting water vapor and other marine aerosols. This is also confirmed in the highlighted region of Figure 7f, showing that aerosols mostly were classified as marine, dusty marine, and polluted continental/smoke, with a small portion of dust in higher altitudes. Figure 7c clearly shows that aerosols originated and were even “stirred up” in the western deserts; therefore, it is valid to speculate that these aerosols are mostly composed of mineral dusts. It is worth noting that the CALIPSO data is not available to access during the 3 March 2014. Figure 7d demonstrates the two components of dust east and west origins for the 9 September 2015 episode: one from the western desert (light purple path) and another from the Mesopotamia and Mediterranean region (dark purple and blue paths). Figure 7g,h show that both sides were dominated mainly by mineral dust, while the marine and polluted dust might come from the Mediterranean and nearby regions. It is plausible to conclude that the western deserts of North Africa are the main origins for the selected seasonal aerosol events, while the existence of contributors from the Mediterranean and eastern regions cannot be ignored for their characteristic types and properties.
In order to investigate the aerosols’ impact on the human living environment, such as air temperature, UV exposure, solar radiation, and humidity, Figure 8 illustrates the variation of listed parameters for the selected seasonal aerosols episodes. The higher values of UVAI during the events in Figure 8a,g,j show the increased UV absorption, indicating the dusts’ protective ability to excessive skin UV exposure. Figure 8d shows the lower UVAI values throughout the whole periods, indicating the limited capability of marine-dominated aerosols to the UV absorption. A pronounced negative relationship between air temperature and humidity is suggested by Figure 8b,h,k. This is because dust storms are drying the air and warming the temperature. However, it is noticeable that in Figure 8b, the humidity bounced back to regular values. This may resulted from the effects of the marine aerosols depicted in Figure 7e. The negative relationship is also clear between longwave and shortwave radiations, especially in Figure 8i,l showing rise of longwave radiation and fall of the shortwave radiation values. In contrast to the marine aerosols, the dust aerosols are suggested to absorb or scatter the shortwave radiation and then emit the longwave radiation to warm up the land surface, while fortunately decreasing the humidity and thus not making the warming effect even worse. Figure 8 also demonstrates the seasonal differences among the listed parameters, highlighting the relatively moderate environment during the winter season with lower temperature, humidity, and solar radiation.

3.4. Aerosol Patterns In Cairo

As shown in Section 3.3, aerosol patterns, namely types and sources, are different in the Greater Cairo region, posing divergent impacts on the UVAI and air temperature that indirectly relate to human health. The dataset of AOD in multiple spectral bands is calibrated from Cairo EMA2 from 2010 to 2017 with as many as 2219 observations. The unsupervised K-means algorithm is used to classify AOD measurements with different bands (340–1640 nm), FMF, and AE, since the aerosol types can be conjectured from their different optical properties [10,12]. The result shows five different patterns of aerosols, represented by the five kinds of clusters summarized in Table 2, in which Cluster 1 indicates a clear, low AOD atmospheric environment. Its values for each band are low but its AE value is high, representing fine aerosols. Cluster 2 represents less severe aerosol events composed of fine aerosols such as industrial pollution and sea salt. Cluster 3 also represents less severe aerosol events, but mainly consists of coarse aerosols. This could be known by its low FMF and AE values, indicating rich dust composition. Cluster 4 represents severe aerosol events induced mainly by fine aerosols (such as the event during 2 January 2014), because of its high values in the 340–500 nm bands, and high values of both FMF and AE to show that the aerosols are mainly composed of finer particles. This pattern is indicating the “pollution-like” mechanisms of aerosols both from air pollution and mixtures with other type of small size aerosols, as previously discussed [10,12]. Finally, Cluster 5 represents the severe events caused by the coarse aerosols (mainly dust storms), which is characterized by a high value in each of the bands, and both low FMF and AE values. This pattern is matching the “dust-like” mechanisms of aerosol released by wind erosion in the Sahara [10,12].

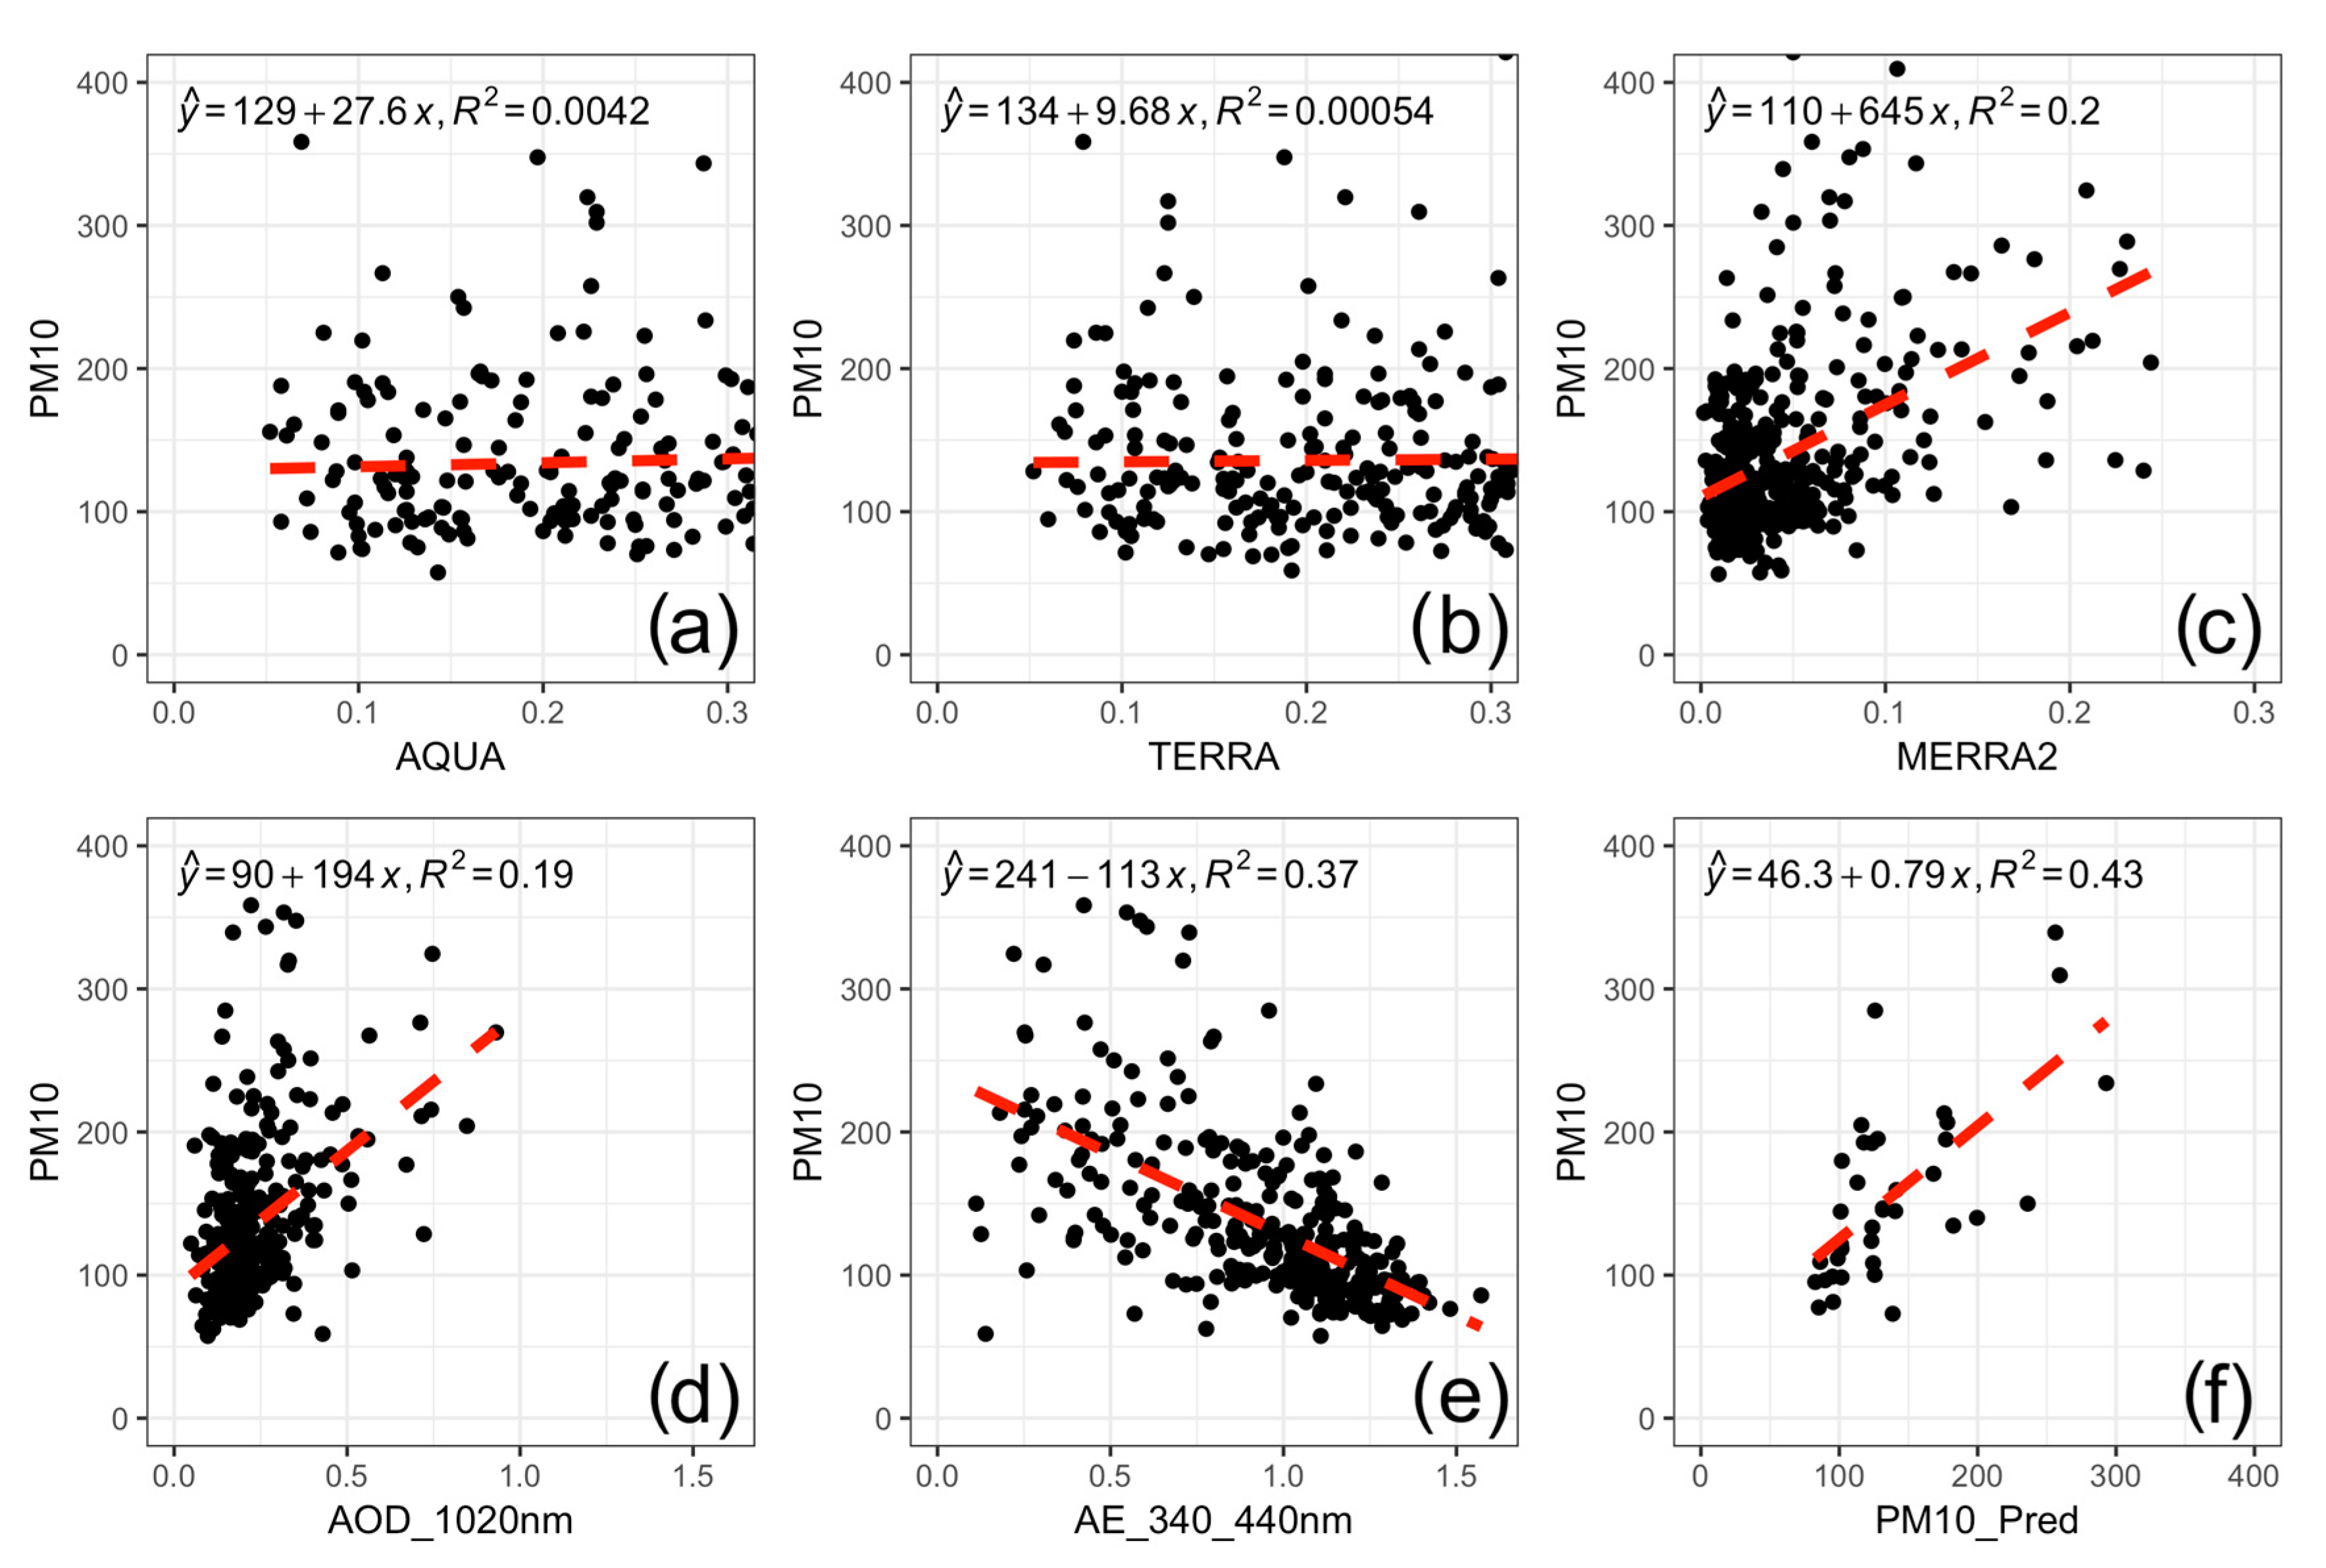
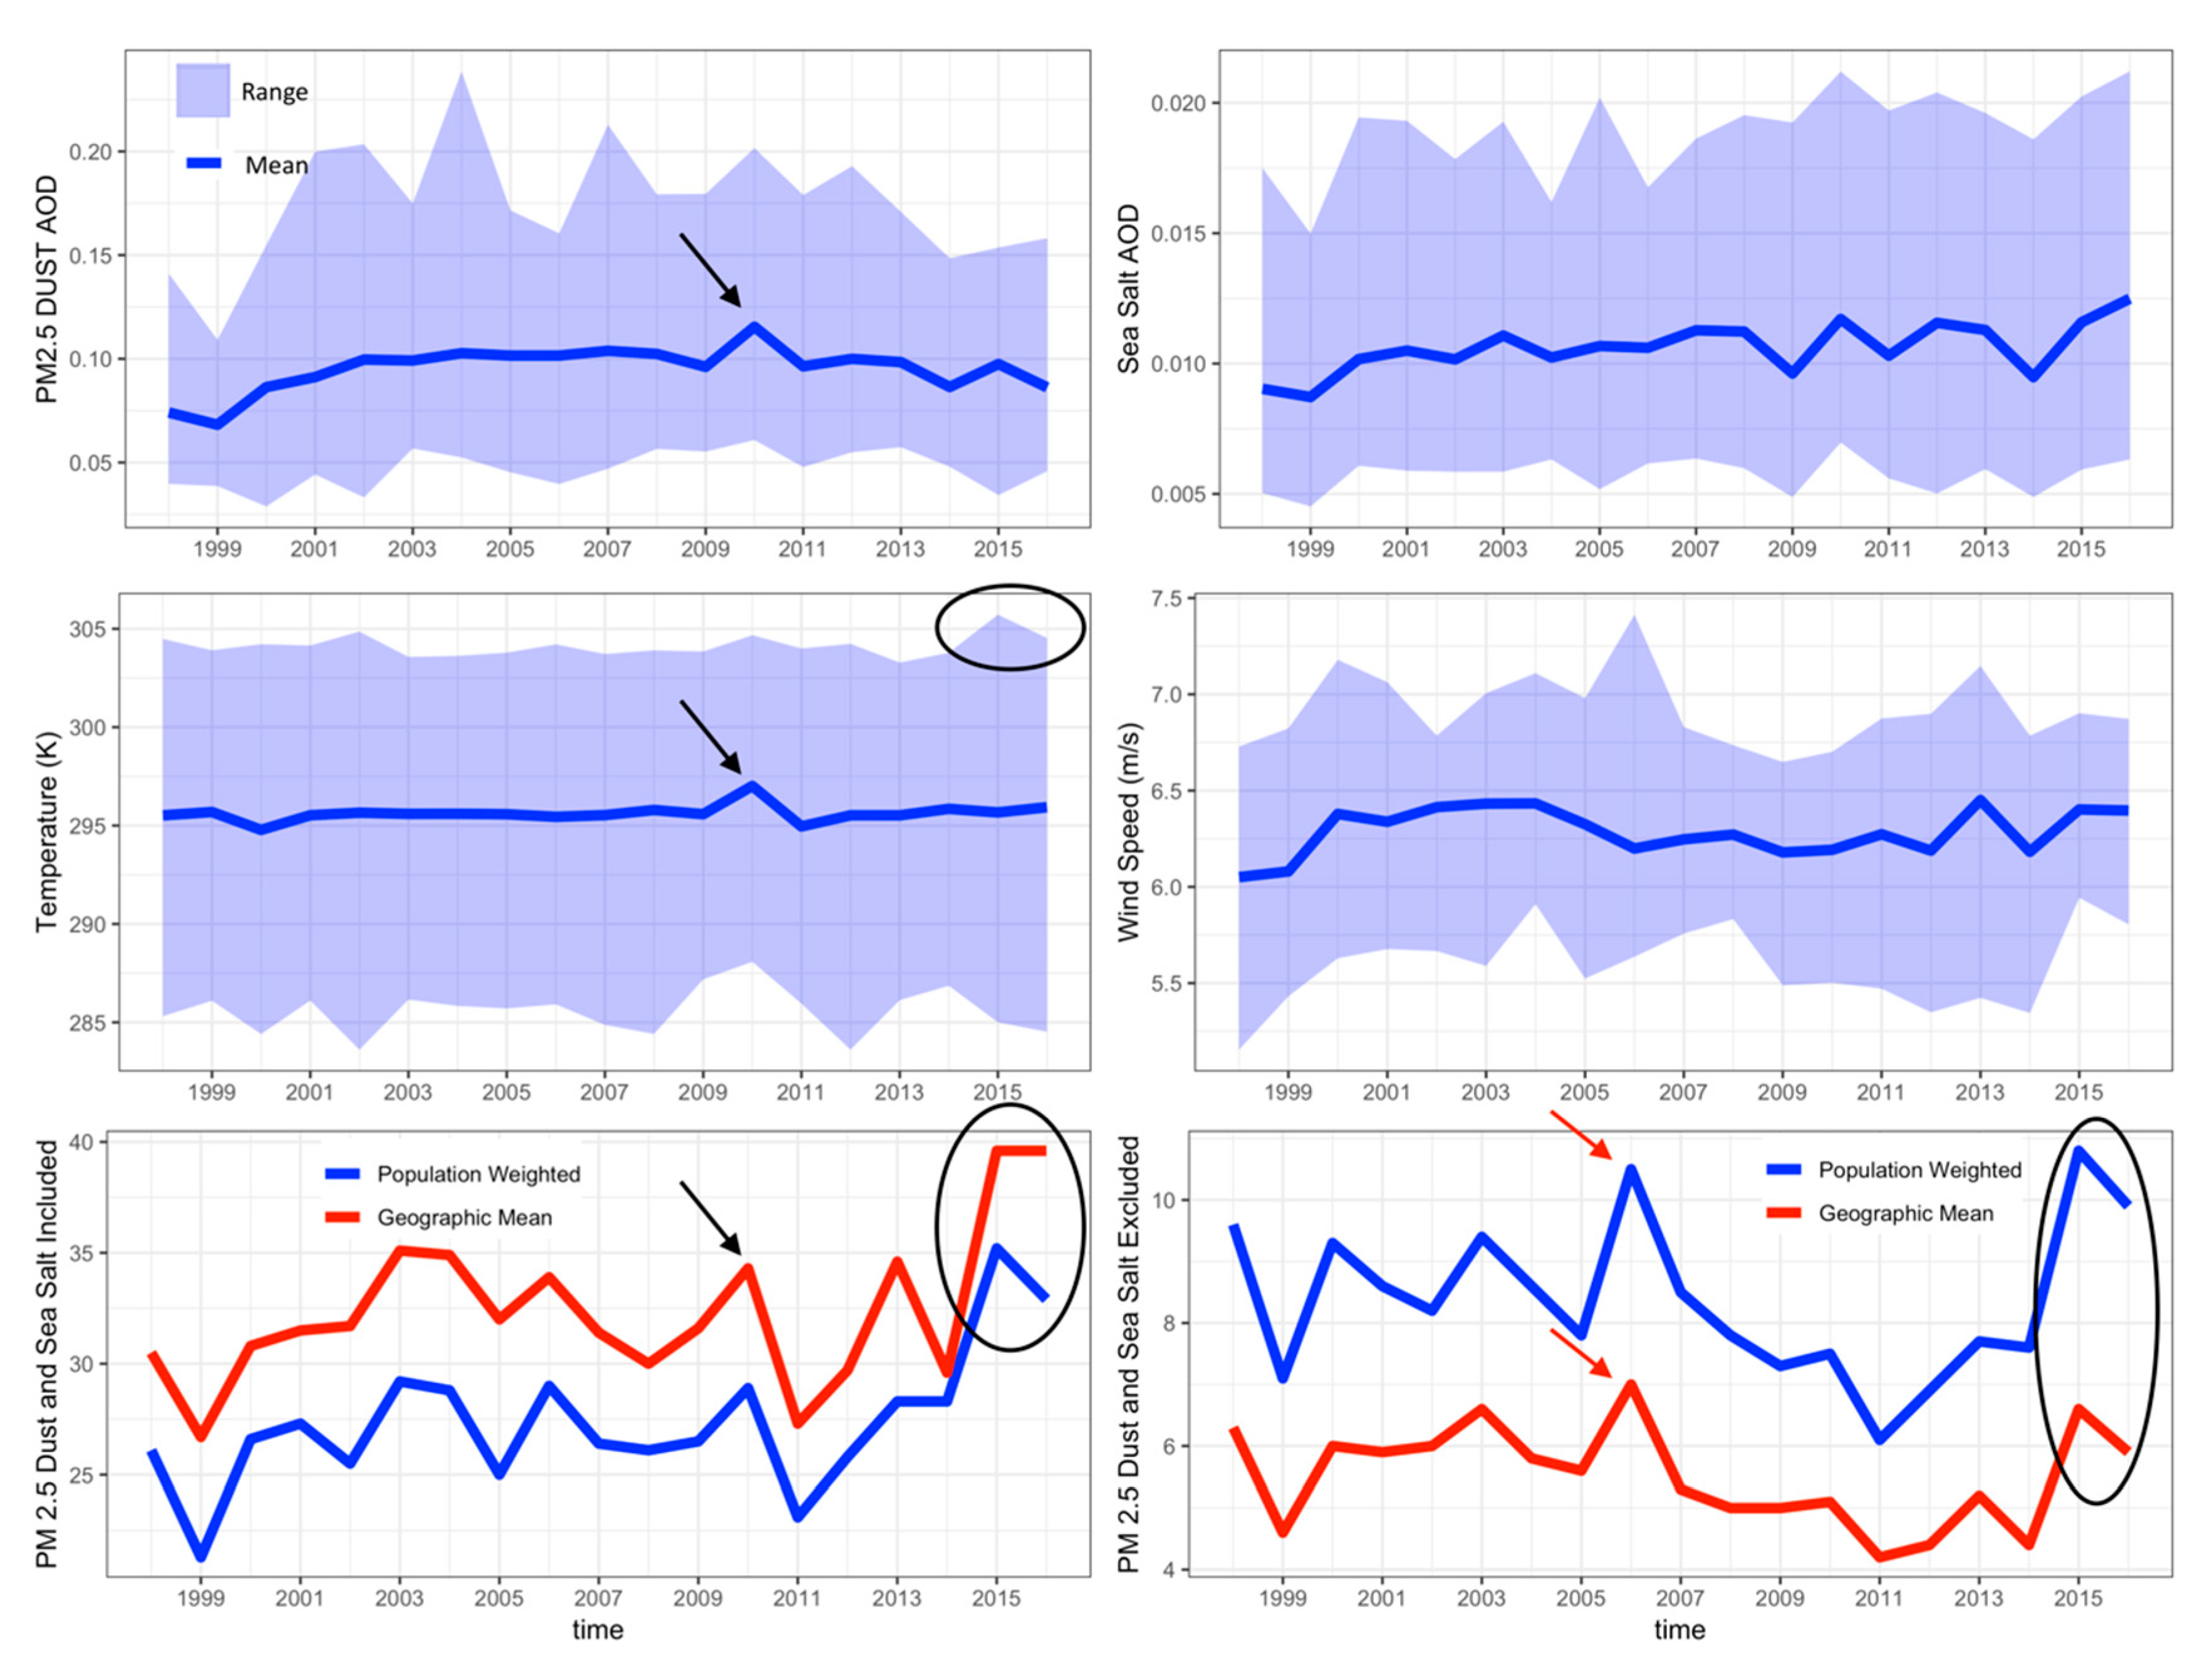
3.5. Connection between Particulate Matters, Aerosol’s Optical Charactareristcs, and Meteorological Paramaters

Figure 9a–c exhibits the relationships between PM10 and aerosol’s optical characteristics, using MODIS Aqua and Terra AOD daily observations and MERRA-2 model outputs, during the periods from 1 January 2018 to 31 December 2018. Eight PM10 stations, with hourly data, were included to generate the daily PM10 averages used here. The difference in the data acquisition frequency of satellite-based AOD observations against the hourly PM10 data collection accounts for lack of a direct relationship. Hence, using MODIS-based AOD values to represent daily PM10 might be problematic, since PM10 values vary greatly during the day, while the MODIS sensors can only capture AODs in limited time periods. On the other hand, a weak positive relationship was found between the modeled MERRA-2 AOD and PM10. This connection indicates that the PM10 value could be converted based on MERRA-2 outputs along with other meteorological parameters. Additionally, the AERONET observations provide more reliable evaluation for the relationship between the aerosol optical characteristics and PM10. Therefore, the AOD and Ångström exponent (AE) daily values are collected from the AERONET EMA2 Station in different spectral bands (1020 nm, 870 nm, 675 nm, 500 nm, 440 nm, 380 nm, and 340 nm) for the same period. Figure 9d demonstrates the positive relationship between PM10 and AOD at 1020 nm, which is the AOD that is mostly related to PM10 among all the bands. In contrast, Figure 9e shows the negative relationship between AE at 340/440 nm and PM10, showing the strong linkage between PM10 and coarse aerosols. It suggests that the AOD and AE observations can be used to estimate the extent of PM10 pollutions.
To be able to model PM10 data, machine learning methods are applied here to achieve better accuracy estimation of PM10 values from the MERRA-2 AOD along with multiple meteorological parameters obtained from the GLDAS model. The dataset has total 364 observations, where each observation has 10 input parameters namely: (MERRA-2_AOD, month, AvgSurfT_inst, LWdown_f_tavg, Lwnet_tavg, Psurf_f_inst, SWdown_f_tavg, Swnet_tavg, Tair_f_inst, and Wind_f_inst). These fields were used to generate the modeled PM10, which was then validated against the objective field (ground-based daily PM10). The dataset is randomly split by the ratio (9:1) into a training dataset (327 observations) and testing dataset (37 observations), respectively. We built various supervised machine learning models, each assigned different parameters, including 97 random decision forests, one decision tree, one linear regression, and two artificial neural networks. The models use R2 values and MAE (mean absolute error) as the training metrics and cross-validation for the evaluation process. The selected best models of each model category are listed in Table 3. Among them, the best Random Decision Forest achieves the best performance with highest R2 value (0.58825) and lowest MAE (27.37317). Therefore, this model was selected to predict the PM10 values based on the aforementioned input parameters using the testing dataset. The comparison between the predicted PM10 and actual PM10 values is illustrated in Figure 9f. The result demonstrates the higher R2 value (0.43) than all of the R2 values in Figure 9a–e, which shows the improvement of the predictability using AOD with meteorological parameters. Since this approach only deploys lower temporal (daily) and spatial resolution (MERRA-2 of 0.5° × 0.625° and GLDAS of 0.25° × 0.25°), it promotes potential further optimizations by using finer spatial and temporal resolution inputs.
Figure 10 shows the average annual PM2.5 for all of Egypt using GWR datasets to compare with monthly MERRA-2 datasets (min, max, and mean values) of PM2.5 dust AOD and sea salt AOD, as well as surface air temperature and wind speed during the period from the year 1998 to 2016. Since the majority of Egypt is covered with depopulated desert regions, the population weighted PM2.5 is apparently lower than the geographic mean PM2.5 for all the types of PM2.5 components. However, with dust and sea salt excluded, the population-weighted PM2.5 is higher than that of the geographic mean due to the PM2.5 particles mainly coming from civilization, such as industrial and transport emissions and burnt agriculture waste. The black arrows point to the 2010 PM2.5 including dust and sea salt, showing the impact of anomalous high temperature, particularly during cool months, on the rising of PM2.5 dust aerosols. The black circles suggest the relationship between both record-breaking hot months and emergently increased PM2.5, regardless of the dust and sea salt components. The red arrows show the severely high PM2.5 in 2006, which is explained by the excessively numerous fire events during the “black cloud” season [2,3].

4. Discussion

The consequence of the accelerated economic growth of Egypt in the past decades makes Cairo the largest city of Africa with more than 20 million people, as well as one of the most air-polluted mega cities globally [81], which puts people living in urban areas into a more vulnerable situation of environment-related and public health issues. Additionally, the pollution over such a dense population severely impacts not only the residents but also tourists from many countries. The factors deteriorating air quality include natural sources from the surrounding deserts and anthropogenic sources such as vehicles, industries, agriculture waste burning, and even the formation of secondary aerosols [15]. The complexity of identifying the pollution types, sources, and trajectories is even enhanced by Cairo’s special geographical and meteorological characteristics, which introduces complications in the managerial strategies. However, the period of the worst air quality condition over Cairo is identified in the fall season, when the wind currents are weak [9,15]. The warmer and lighter air mass stays over the colder air to make the bowl-like Cairo even more stagnant without air movement, trapping the air pollutant close to the ground. This high ambient concentration of air pollutants is known as the “black cloud”. The rare appearance of rainstorms in this season makes the situation even more severe. It also brings public debates around the major contributors to the locally known “black cloud” episode—urban pollutants (industries and vehicles) or agriculture waste burning, which is banned by the government. The study [2] found that smoke from the agriculture waste contributed to the urban air pollution as well as from the open fires generated at sunset (when it is less likely to get observed), which is the worst time for Cairo’s air quality. Besides, it is reported that Cairo’s increased ozone during summer is transported from Europe [82], and the CO increases as a result of the Khamsin events and industrial pollution [14]. A study also showed that the anticyclone flow of the Asian summer monsoon can transport the pollution from Asia toward Africa [83]. These studies suggest that the urban air quality control needs efforts from urban, rural, and even international collaborations. Moreover, other significant effects of aerosols (e.g., effects on the visibility, the nutrient balance, and acidity of soil) have also been reported [84,85].
As it is illustrated in Figure 10, the rapid increase of air temperatures, possibly driven by climate changes, can intensify both the AOD and PM2.5 in Egypt. The usage of machine learning to improve the estimation and prediction of meteorological parameters, such as precipitation, has been validated in the previous research [86]. On the other hand, the tropospheric aerosols can both alter the direct and indirect radiative forcing to the Earth’s surface as the feedback to impact the warming process [87]. However, the knowledge of the aerosols’ characteristics and sources is critical not only for human health, but also for the understanding of their interaction with regional and global climate change, particularly the radiation balance of the Earth’s system. For instance, the direct global dust–climate feedback is calculated as approximate range of −0.04 to +0.02 Wm−2 K−1, which can potentially shape the major dust sources of the future climate, as has likely occurred in the past [88,89]. The absorption of SW and LW radiation, as well as scattering LW radiation back to the Earth’s surface, causes a dust-warming effect, which results from the coarse dust and is intensified by the bright surfaces, such as the desert region of the Middle East [90,91]. In contrast, the scattering of SW radiation induces a cooling effect, which results from the fine dust and is enhanced over the dark surfaces [91]. However, past investigations of the responses of the dust cycle to the climate changes yielded divergent results, because of many uncertainties regarding parameters in quantifying the dust–climate feedback [90,92,93,94,95,96]. Therefore, there is no solid consensus on whether the dust activities will enhance or weaken future climate changes [95,96,97,98]. Recently, a study investigated the annual patterns and episodes of the Cairo’s air pollution using satellite-based measurements from the tropospheric emission spectrometer (TES) on board the Aura [3] to demonstrate multiple pollutants’ seasonal variation.

5. Conclusions

This study extends the work with more accurate ground-based AERONET observations focusing on the atmospheric aerosols. In this research, the combination of AERONET ground-based and satellite observations (e.g., MISR and Aqua and Terra MODIS) are used to study different compositions of aerosol loadings over Cairo and Nile Delta during a near 20-year period from 1999 to 2018. Our analysis validated the better performance of MISR and MODIS sensors in observing local aerosol events in Cairo. Aerosol products from the AERONET portal (such as SDA and the GSFC model) as well as CALIPSO aerosol subtypes tool are used to study the emerging aerosol episodes for each season. The result indicates that during the spring, fall, and summer, the selected aerosols events are caused by dust-related storms, whereas during winter, pollution and marine-related finer aerosols could also lead to severe aerosol conditions. The seasonal episodes also revealed the unassociated impacts on human health through altering the UV exposure, air temperature, humidity, and solar radiation intensities. Aerosols in different conditions (clear, fine, coarse, and mixed aerosols) are well distinguished using a multi-band AOD spectrum, as well as derived AE and FMF products using the K-means method over AERONET observations. The PM2.5 is indicated to be connected with air temperature and aerosol activities over the Egypt region. The Random Decision Forest model has been proved to improve the accuracy of estimating PM10 based on AOD and meteorological parameters, while future work is suggested to develop advanced algorithms to optimize the air quality predictions that are critical to human health.

Author Contributions

Conceptualization, W.L., H.E.-A., I.A.E.-M. and E.A.; Data curation, W.L. and M.M.M.; Funding acquisition, H.E.-A.; Methodology, W.L., H.E.-A., I.A.E.-M. and E.A.; Validation, W.L. and M.M.M.; Writing—Original Draft, W.L., H.E.-A., I.A.E.-M. and E.A.; Writing—Review & Editing, W.L., H.E.-A.

Funding

This research was partly funded by the COST Action “InDust” under grant agreement CA16202, supported by COST (European Cooperation in Science and Technology) and more specifically the Short Term Scientific Mission project “Finding”.

Acknowledgments

Thanks to Tom L. Kucsera (GESTAR/USRA) at NASA/Goddard for back-trajectories available at the aeronet.gsfc.nasa.gov website. The authors would like to also extend their appreciation to the EEAA agency for providing the hourly PM10 data set used in this research.

Conflicts of Interest

The authors declare no conflict of interest.

References

  1. Marey, H.S.; Gille, J.C.; El-Askary, H.M.; Shalaby, E.A.; El-Raey, M.E. Aerosol climatology over Nile Delta based on MODIS, MISR and OMI satellite data. Atmos. Chem. Phys. 2011, 11, 10637–10648. [Google Scholar] [CrossRef] [Green Version]
  2. Marey, H.S.; Gille, J.C.; El-Askary, H.M.; Shalaby, E.A.; El-Raey, M.E. Study of the formation of the “black cloud” and its dynamics over Cairo, Egypt, using MODIS and MISR sensors. J. Geophys. Res. 2010, 115, D21. [Google Scholar] [CrossRef]
  3. Aboel Fetouh, Y.; El Askary, H.; El Raey, M.; Allali, M.; Sprigg, W.A.; Kafatos, M. Annual Patterns of Atmospheric Pollutions and Episodes over Cairo Egypt. Adv. Meteorol. 2013, 2013, 984853. [Google Scholar] [CrossRef]
  4. Moussa, M.; Abdelkhalek, A. Meteorological Analysis for Black Cloud (Episodes) Formation and Its Monitoring by Remote Sensing. J. Appl. Sci. Res. 2007, 3, 147–154. [Google Scholar]
  5. Robaa, S. Urban-Suburban/Rural Differences over Greater Cairo, Egypt. Atmósfera 2003, 16, 157–171. [Google Scholar]
  6. El-Askary, H. Air pollution impact on aerosol variability over mega cities using remote sensing technology: Case study, Cairo, Egypt. Egypt. J. Remote Sens. Space Sci. 2006, 9, 31–40. [Google Scholar]
  7. Chen, T.-M.; Kuschner, W.G.; Gokhale, J.; Shofer, S. Outdoor Air Pollution: Nitrogen Dioxide, Sulfur Dioxide, and Carbon Monoxide Health Effects. Am. J. Med. Sci. 2007, 333, 249–256. [Google Scholar] [CrossRef] [PubMed]
  8. Abu-Allaban, M.; Lowenthal, D.H.; Gertler, A.W.; Labib, M. Sources of PM10 and PM2.5 in Cairo’s ambient air. Environ. Monit. Assess. 2007, 133, 417–425. [Google Scholar] [CrossRef] [PubMed]
  9. El-Askary, H.; Kafatos, M. Dust storm and black cloud influence on aerosol optical properties over Cairo and the Greater Delta region, Egypt. Int. J. Remote Sens. 2008, 29, 7199–7211. [Google Scholar] [CrossRef]
  10. El-Metwally, M.; Alfaro, S.C.; Abdel Wahab, M.; Chatenet, B. Aerosol characteristics over urban Cairo: Seasonal variations as retrieved from Sun photometer measurements. J. Geophys. Res. 2008, 113, D14. [Google Scholar] [CrossRef]
  11. Prasad, A.K.; El-Askary, H.; Kafatos, M. Implications of high altitude desert dust transport from Western Sahara to Nile Delta during biomass burning season. Environ. Pollut. 2010, 158, 3385–3391. [Google Scholar] [CrossRef] [PubMed]
  12. El-Askary, H.; Farouk, R.; Ichoku, C.; Kafatos, M. Transport of dust and anthropogenic aerosols across Alexandria, Egypt. Ann. Geophys. 2009, 27, 2869–2879. [Google Scholar] [CrossRef] [Green Version]
  13. Swanson, E. World Development Indicators 2007; World Development Indicators; World Bank: Washington, DC, USA, 2007. [Google Scholar]
  14. Florentina, I.; Io, B. The Effects of Air Pollutants on Vegetation and the Role of Vegetation in Reducing Atmospheric Pollution. In The Impact of Air Pollution on Health, Economy, Environment and Agricultural Sources; Khallaf, M., Ed.; InTechOpen: London, UK, 2011; ISBN 978-953-307-528-0. [Google Scholar] [Green Version]
  15. Zakey, A.S.; Abdelwahab, M.M.; Makar, P.A. Atmospheric turbidity over Egypt. Atmos. Environ. 2004, 38, 1579–1591. [Google Scholar] [CrossRef]
  16. Favez, O.; Cachier, H.; Sciare, J.; Alfaro, S.C.; El-Araby, T.M.; Harhash, M.A.; Abdelwahab, M.M. Seasonality of major aerosol species and their transformations in Cairo megacity. Atmos. Environ. 2008, 42, 1503–1516. [Google Scholar] [CrossRef]
  17. El-Askary, H.M.; Sarkar, S.; Kafatos, M.; El-Ghazawi, T.A. A multisensor approach to dust storm monitoring over the nile delta. IEEE Trans. Geosci. Remote Sens. 2003, 41, 2386–2391. [Google Scholar] [CrossRef]
  18. Barnaba, F.; Gobbi, G.P. Aerosol seasonal variability over the Mediterranean region and relative impact of maritime, continental and Saharan dust particles over the basin from MODIS data in the year 2001. Atmos. Chem. Phys. 2004, 4, 2367–2391. [Google Scholar] [CrossRef] [Green Version]
  19. Zakey, A.S.; Omran, M.A. 1st LAS/WMO International Symposium on Sand and Dust Storms; WMO Programme on Weather Prediction Research Report Series Project No. 10; Technical Document No. 864; World Meteorological Organization (WMO): Geneva, Switzerland, 1997. [Google Scholar]
  20. Li, W.; El-Askary, H.M.; Qurban, M.; Allali, M.; Manikandan, K.P. On the Drying Trends Over the MENA Countries Using Harmonic Analysis of the Enhanced Vegetation Index. In Advances in Remote Sensing and Geo Informatics Applications; El-Askary, H.M., Lee, S., Heggy, E., Pradhan, B., Eds.; Springer International Publishing: Cham, Switzerland, 2019; pp. 243–245. ISBN 978-3-030-01439-1. [Google Scholar]
  21. El-Askary, H.M.; Li, W.; El-Nadry, M.; Awad, M.; Mostafa, A.R. Strong Interactions Indicated Between Dust Aerosols and Precipitation Related Clouds in the Nile Delta. In Advances in Remote Sensing and Geo Informatics Applications; El-Askary, H.M., Lee, S., Heggy, E., Pradhan, B., Eds.; Springer International Publishing: Cham, Switzerland, 2019; pp. 3–6. ISBN 978-3-030-01439-1. [Google Scholar]
  22. Li, W.; El-Askary, H.; ManiKandan, K.; Qurban, M.; Garay, M.; Kalashnikova, O. Synergistic Use of Remote Sensing and Modeling to Assess an Anomalously High Chlorophyll-a Event during Summer 2015 in the South Central Red Sea. Remote Sens. 2017, 9, 778. [Google Scholar] [CrossRef]
  23. El-Askary, H.; Li, J.; Li, W.; Piechota, T.; Ta, T.; Jong, A.; Zhang, X.; Yang, T. Impacts of Aerosols on the Retreat of the Sierra Nevada Glaciers in California. Aerosol Air Qual. Res. 2018, 18, 1317–1330. [Google Scholar] [CrossRef] [Green Version]
  24. Holben, B.N.; Eck, T.F.; Slutsker, I.; Tanré, D.; Buis, J.P.; Setzer, A.; Vermote, E.; Reagan, J.A.; Kaufman, Y.J.; Nakajima, T.; et al. AERONET—A Federated Instrument Network and Data Archive for Aerosol Characterization. Remote Sens. Environ. 1998, 66, 1–16. [Google Scholar] [CrossRef]
  25. Kahn, R.A. Multiangle Imaging Spectroradiometer (MISR) global aerosol optical depth validation based on 2 years of coincident Aerosol Robotic Network (AERONET) observations. J. Geophys. Res. 2005, 110, D01. [Google Scholar] [CrossRef]
  26. Kahn, R.A.; Gaitley, B.J.; Garay, M.J.; Diner, D.J.; Eck, T.F.; Smirnov, A.; Holben, B.N. Multiangle Imaging SpectroRadiometer global aerosol product assessment by comparison with the Aerosol Robotic Network. J. Geophys. Res. 2010, 115, D23. [Google Scholar] [CrossRef]
  27. Kaufman, Y.J.; Tanré, D.; Remer, L.A.; Vermote, E.F.; Chu, A.; Holben, B.N. Operational remote sensing of tropospheric aerosol over land from EOS moderate resolution imaging spectroradiometer. J. Geophys. Res. Atmos. 1997, 102, 17051–17067. [Google Scholar] [CrossRef]
  28. Mishchenko, M.I.; Geogdzhayev, I.V. Satellite remote sensing reveals regional tropospheric aerosol trends. Opt. Express 2007, 15, 7423–7438. [Google Scholar] [CrossRef] [Green Version]
  29. Remer, L.A.; Kaufman, Y.J.; Tanré, D.; Mattoo, S.; Chu, D.A.; Martins, J.V.; Li, R.-R.; Ichoku, C.; Levy, R.C.; Kleidman, R.G.; et al. The MODIS Aerosol Algorithm, Products, and Validation. J. Atmos. Sci. 2005, 62, 947–973. [Google Scholar] [CrossRef] [Green Version]
  30. Mahmoud, K.F.; Alfaro, S.C.; Favez, O.; Wahab, M.A.; Sciare, J. Origin of black carbon concentration peaks in Cairo (Egypt). Atmos. Res. 2008, 89, 161–169. [Google Scholar] [CrossRef]
  31. Abu-Allaban, M.; Gertler, A.W.; Lowenthal, D.H. A preliminary apportionment of the sources of ambient PM10, PM2.5, and VOCs in Cairo. Atmos. Environ. 2002, 36, 5549–5557. [Google Scholar] [CrossRef]
  32. Alfaro, S.C.; Wahab, M.A. Extreme Variability of Aerosol Optical Properties: The Cairo Aerosol Characterization Experiment Case Study. In Remote Sensing of the Atmosphere for Environmental Security; Perrin, A., Ben Sari-Zizi, N., Demaison, J., Eds.; Springer: Dordrecht, The Netherlands, 2006; pp. 285–299. ISBN 978-1-4020-5089-3. [Google Scholar]
  33. Konsta, D.; Binietoglou, I.; Gkikas, A.; Solomos, S.; Marinou, E.; Proestakis, E.; Basart, S.; García-Pando, C.P.; El-Askary, H.; Amiridis, V. Evaluation of the BSC-DREAM8b regional dust model using the 3D LIVAS-CALIPSO product. Atmos. Environ. 2018, 195, 46–62. [Google Scholar] [CrossRef]
  34. Wang, J. Intercomparison between satellite-derived aerosol optical thickness and PM 2.5 mass: Implications for air quality studies. Geophys. Res. Lett. 2003, 30, 21. [Google Scholar] [CrossRef]
  35. van Donkelaar, A.; Martin, R.V.; Brauer, M.; Kahn, R.; Levy, R.; Verduzco, C.; Villeneuve, P.J. Global Estimates of Ambient Fine Particulate Matter Concentrations from Satellite-Based Aerosol Optical Depth: Development and Application. Environ. Health Perspect. 2010, 118, 847–855. [Google Scholar] [CrossRef] [Green Version]
  36. Kloog, I.; Chudnovsky, A.A.; Just, A.C.; Nordio, F.; Koutrakis, P.; Coull, B.A.; Lyapustin, A.; Wang, Y.; Schwartz, J. A new hybrid spatio-temporal model for estimating daily multi-year PM2.5 concentrations across northeastern USA using high resolution aerosol optical depth data. Atmos. Environ. 2014, 95, 581–590. [Google Scholar] [CrossRef] [Green Version]
  37. Ma, Z.; Hu, X.; Sayer, A.M.; Levy, R.; Zhang, Q.; Xue, Y.; Tong, S.; Bi, J.; Huang, L.; Liu, Y. Satellite-Based Spatiotemporal Trends in PM2.5 Concentrations: China, 2004–2013. Environ. Health Perspect. 2016, 124, 184–192. [Google Scholar] [CrossRef]
  38. Yoon, J.; von Hoyningen-Huene, W.; Kokhanovsky, A.A.; Vountas, M.; Burrows, J.P. Trend analysis of aerosol optical thickness and Ångström exponent derived from the global AERONET spectral observations. Atmos. Meas. Tech. 2012, 5, 1271–1299. [Google Scholar] [CrossRef]
  39. Mehta, M. A study of aerosol optical depth variations over the Indian region using thirteen years (2001–2013) of MODIS and MISR Level 3 data. Atmos. Environ. 2015, 109, 161–170. [Google Scholar] [CrossRef]
  40. Levy, R.C.; Remer, L.A.; Kleidman, R.G.; Mattoo, S.; Ichoku, C.; Kahn, R.; Eck, T.F. Global evaluation of the Collection 5 MODIS dark-target aerosol products over land. Atmos. Chem. Phys. 2010, 10, 10399–10420. [Google Scholar] [CrossRef] [Green Version]
  41. Zhang, J.; Reid, J.S. A decadal regional and global trend analysis of the aerosol optical depth using a data-assimilation grade over-water MODIS and Level 2 MISR aerosol products. Atmos. Chem. Phys. 2010, 10, 10949–10963. [Google Scholar] [CrossRef] [Green Version]
  42. Xiao, N.; Shi, T.; Calder, C.A.; Munroe, D.K.; Berrett, C.; Wolfinbarger, S.; Li, D. Spatial characteristics of the difference between MISR and MODIS aerosol optical depth retrievals over mainland Southeast Asia. Remote Sens. Environ. 2009, 113, 1–9. [Google Scholar] [CrossRef]
  43. He, Q.; Li, C.; Tang, X.; Li, H.; Geng, F.; Wu, Y. Validation of MODIS derived aerosol optical depth over the Yangtze River Delta in China. Remote Sens. Environ. 2010, 114, 1649–1661. [Google Scholar] [CrossRef]
  44. Cheng, T.; Xu, C.; Duan, J.; Wang, Y.; Leng, C.; Tao, J.; Che, H.; He, Q.; Wu, Y.; Zhang, R.; et al. Seasonal variation and difference of aerosol optical properties in columnar and surface atmospheres over Shanghai. Atmos. Environ. 2015, 123, 315–326. [Google Scholar] [CrossRef]
  45. O’Neill, N.T. Spectral discrimination of coarse and fine mode optical depth. J. Geophys. Res. 2003, 108, D17. [Google Scholar] [CrossRef]
  46. Ramachandran, S. Spectral aerosol optical characteristics during the northeast monsoon over the Arabian Sea and the tropical Indian Ocean: 1. Aerosol optical depths and their variabilities. J. Geophys. Res. 2004, 109, D19. [Google Scholar] [CrossRef]
  47. Giles, D.M.; Sinyuk, A.; Sorokin, M.G.; Schafer, J.S.; Smirnov, A.; Slutsker, I.; Eck, T.F.; Holben, B.N.; Lewis, J.R.; Campbell, J.R.; et al. Advancements in the Aerosol Robotic Network (AERONET) Version 3 database—Automated near-real-time quality control algorithm with improved cloud screening for Sun photometer aerosol optical depth (AOD) measurements. Atmos. Meas. Tech. 2019, 12, 169–209. [Google Scholar] [CrossRef]
  48. Petrenko, M.; Ichoku, C.; Leptoukh, G. Multi-sensor Aerosol Products Sampling System (MAPSS). Atmos. Meas. Tech. 2012, 5, 913–926. [Google Scholar] [CrossRef] [Green Version]
  49. Nelson, D.L.; Chen, Y.; Kahn, R.A.; Diner, D.J.; Mazzoni, D. Example Applications of the Misr Interactive Explorer (Minx) Software Tool to Wildfire Smoke Plume Analyses; Hao, W.M., Ed.; SPIE: San Diego, CA, USA, 2008; p. 708909. [Google Scholar]
  50. Nelson, D.L.; Averill, C.; Boland, S.; Morford, R.; Garay, M.; Thompson, C.; Hall, J.; Diner, D.; Camphell, H. MISR Interactive Explorer (MINX) v1.0 User’s Guide; NASA Jet Propulsion Laboratory: Pasadena, CA, USA, 2008. [Google Scholar]
  51. Schoeberl, M.R.; Newman, P.A. A multiple-level trajectory analysis of vortex filaments. J. Geophys. Res. 1995, 100, 25801–25815. [Google Scholar] [CrossRef]
  52. Pickering, K.E.; Thompson, A.M.; Kim, H.; DeCaria, A.J.; Pfister, L.; Kucsera, T.L.; Witte, J.C.; Avery, M.A.; Blake, D.R.; Crawford, J.H.; et al. Trace gas transport and scavenging in PEM-Tropics B South Pacific Convergence Zone convection. J. Geophys. Res. Atmos. 2001, 106, 32591–32607. [Google Scholar] [CrossRef] [Green Version]
  53. Winker, D.M.; Hunt, W.H.; Hostetler, C.A. Status and Performance of the CALIOP Lidar; Singh, U.N., Ed.; SPIE: Maspalomas, Canary Islands, Spain, 2004; p. 8. [Google Scholar]
  54. McGill, M.J.; Vaughan, M.A.; Trepte, C.R.; Hart, W.D.; Hlavka, D.L.; Winker, D.M.; Kuehn, R. Airborne validation of spatial properties measured by the CALIPSO lidar. J. Geophys. Res. 2007, 112, D20. [Google Scholar] [CrossRef]
  55. El-Askary, H.; LaHaye, N.; Linstead, E.; Sprigg, W.A.; Yacoub, M. Remote sensing observation of annual dust cycles and possible causality of Kawasaki disease outbreaks in Japan. Glob. Cardiol. Sci. Pract. 2017, 2017, e201722. [Google Scholar] [CrossRef]
  56. World Health Organization. Ultraviolet Radiation and Human Health. December 2009. Available online: http://www.who.int/mediacentre/factsheets/fs305/en/index.html (accessed on 17 November 2018).
  57. Centers for Disease Control and Prevention. Basic Information about Skin Cancer. 24 April 2012. Available online: http://www.cdc.gov/cancer/skin/basic_info/ (accessed on 17 November 2018).
  58. National Cancer Institute. Skin Cancer. Available online: http://www.cancer.gov/cancertopics/types/skin (accessed on 27 January 2019).
  59. Portier, C.; Tart, K.T.; Carter, S.; Dilworth, C.; Grambsch, A.; Gohlke, J.; Hess, J.; Howard, S.; Luber, G.; Lutz, J.; et al. A Human Health Perspective on Climate Change: A Report Outlining Research Needs on the Human Health Effects of Climate Change. Environ. Health Perspect. 2010, 6, 621–710. [Google Scholar] [CrossRef]
  60. Bhartia, P.K. OMI/Aura TOMS-Like Ozone, Aerosol Index, Cloud Radiance Fraction Daily L3 Global 1.0x1.0 Deg; Goddard Earth Sciences Data and Information Services Center (GES DISC): Greenbelt, MD, USA, 2012.
  61. Solecki, W.D.; Rosenzweig, C.; Parshall, L.; Pope, G.; Clark, M.; Cox, J.; Wiencke, M. Mitigation of the heat island effect in urban New Jersey. Environ. Hazards 2005, 6, 39–49. [Google Scholar] [CrossRef]
  62. Li, Y.; Zhao, X. An empirical study of the impact of human activity on long-term temperature change in China: A perspective from energy consumption: Human impact on temperature change. J. Geophys. Res. Atmos. 2012, 117, D21. [Google Scholar] [CrossRef]
  63. Imhoff, M.L.; Zhang, P.; Wolfe, R.E.; Bounoua, L. Remote sensing of the urban heat island effect across biomes in the continental USA. Remote Sens. Environ. 2010, 114, 504–513. [Google Scholar] [CrossRef] [Green Version]
  64. Amanollahi, J.; Tzanis, C.; Ramli, M.F.; Abdullah, A.M. Urban heat evolution in a tropical area utilizing Landsat imagery. Atmos. Res. 2016, 167, 175–182. [Google Scholar] [CrossRef]
  65. Streutker, D.R. A remote sensing study of the urban heat island of Houston, Texas. Int. J. Remote Sens. 2002, 23, 2595–2608. [Google Scholar] [CrossRef]
  66. Rodell, M.; Houser, P.R.; Jambor, U.; Gottschalck, J.; Mitchell, K.; Meng, C.-J.; Arsenault, K.; Cosgrove, B.; Radakovich, J.; Bosilovich, M.; et al. The Global Land Data Assimilation System. Bull. Am. Meteorol. Soc. 2004, 85, 381–394. [Google Scholar] [CrossRef] [Green Version]
  67. Gorelick, N.; Hancher, M.; Dixon, M.; Ilyushchenko, S.; Thau, D.; Moore, R. Google Earth Engine: Planetary-scale geospatial analysis for everyone. Remote Sens. Environ. 2017, 202, 18–27. [Google Scholar] [CrossRef]
  68. Li, W.; El-Askary, H.; Qurban, M.A.; Li, J.; ManiKandan, K.P.; Piechota, T. Using multi-indices approach to quantify mangrove changes over the Western Arabian Gulf along Saudi Arabia coast. Ecol. Indic. 2019, 102, 734–745. [Google Scholar] [CrossRef]
  69. Modeling, G. MERRA-2 tavgM_2d_aer_Nx: 2d, Monthly Mean, Time-Averaged, Single-Level, Assimilation, Aerosol Diagnostics V5.12.4; Goddard Earth Sciences Data and Information Services Center (GES DISC): Greenbelt, MD, USA, 2015.
  70. Modeling, G. MERRA-2 tavgM_2d_flx_Nx: 2d, Monthly Mean, Time-Averaged, Single-Level, Assimilation, Surface Flux Diagnostics V5.12.4; Goddard Earth Sciences Data and Information Services Center (GES DISC): Greenbelt, MD, USA, 2015.
  71. Van Donkelaar, A. Global Annual PM2.5 Grids from MODIS, MISR and SeaWiFS Aerosol Optical Depth (AOD) with GWR, 1998–2016; Goddard Earth Sciences Data and Information Services Center (GES DISC): Greenbelt, MD, USA, 2018.
  72. Hsu, N.C.; Jeong, M.-J.; Bettenhausen, C.; Sayer, A.M.; Hansell, R.; Seftor, C.S.; Huang, J.; Tsay, S.-C. Enhanced Deep Blue aerosol retrieval algorithm: The second generation: ENHANCED DEEP BLUE AEROSOL RETRIEVAL. J. Geophys. Res. Atmos. 2013, 118, 9296–9315. [Google Scholar] [CrossRef]
  73. Levy, R.C.; Mattoo, S.; Munchak, L.A.; Remer, L.A.; Sayer, A.M.; Patadia, F.; Hsu, N.C. The Collection 6 MODIS aerosol products over land and ocean. Atmos. Meas. Tech. 2013, 6, 2989–3034. [Google Scholar] [CrossRef] [Green Version]
  74. Levy, R.C.; Munchak, L.A.; Mattoo, S.; Patadia, F.; Remer, L.A.; Holz, R.E. Towards a long-term global aerosol optical depth record: Applying a consistent aerosol retrieval algorithm to MODIS and VIIRS-observed reflectance. Atmos. Meas. Tech. 2015, 8, 4083–4110. [Google Scholar] [CrossRef]
  75. Sayer, A.M.; Munchak, L.A.; Hsu, N.C.; Levy, R.C.; Bettenhausen, C.; Jeong, M.-J. MODIS Collection 6 aerosol products: Comparison between Aqua’s e-Deep Blue, Dark Target, and “merged” data sets, and usage recommendations. J. Geophys. Res. Atmos. 2014, 119, 13965–13989. [Google Scholar] [CrossRef]
  76. Sayer, A.M.; Hsu, N.C.; Bettenhausen, C.; Jeong, M.-J.; Meister, G. Effect of MODIS Terra radiometric calibration improvements on Collection 6 Deep Blue aerosol products: Validation and Terra/Aqua consistency. J. Geophys. Res. Atmos. 2015, 120, 23. [Google Scholar] [CrossRef]
  77. Georgoulias, A.K.; Alexandri, G.; Kourtidis, K.A.; Lelieveld, J.; Zanis, P.; Amiridis, V. Differences between the MODIS Collection 6 and 5.1 aerosol datasets over the greater Mediterranean region. Atmos. Environ. 2016, 147, 310–319. [Google Scholar] [CrossRef]
  78. Georgoulias, A.K.; Alexandri, G.; Kourtidis, K.A.; Lelieveld, J.; Zanis, P.; Pöschl, U.; Levy, R.; Amiridis, V.; Marinou, E.; Tsikerdekis, A. Spatiotemporal variability and contribution of different aerosol types to the aerosol optical depth over the Eastern Mediterranean. Atmos. Chem. Phys. 2016, 16, 13853–13884. [Google Scholar] [CrossRef] [Green Version]
  79. Hansen, J.; Johnson, D.; Lacis, A.; Lebedeff, S.; Lee, P.; Rind, D.; Russell, G. Climate Impact of Increasing Atmospheric Carbon Dioxide. Science 1981, 213, 957–966. [Google Scholar] [CrossRef] [Green Version]
  80. El-Askary, H. On the Detection and Monitoring of the Transport of an Asian Dust Storm Using Multi-Sensor Satellite Remote Sensing. J. Environ. Inform. 2015, 25, 99–116. [Google Scholar] [CrossRef]
  81. Molina, M.J.; Molina, L.T. Megacities and Atmospheric Pollution. J. Air Waste Manag. Assoc. 2004, 54, 644–680. [Google Scholar] [CrossRef]
  82. Duncan, B.N.; West, J.J.; Yoshida, Y.; Fiore, A.M.; Ziemke, J.R. The influence of European pollution on ozone in the Near East and northern Africa. Atmos. Chem. Phys. 2008, 8, 2267–2283. [Google Scholar] [CrossRef] [Green Version]
  83. Barret, B.; Ricaud, P.; Mari, C.; Attié, J.-L.; Bousserez, N.; Josse, B.; Le Flochmoën, E.; Livesey, N.J.; Massart, S.; Peuch, V.-H.; et al. Transport pathways of CO in the African upper troposphere during the monsoon season: A study based upon the assimilation of spaceborne observations. Atmos. Chem. Phys. 2008, 8, 3231–3246. [Google Scholar] [CrossRef]
  84. Yun, H.-J.; Yi, S.-M.; Kim, Y.P. Dry deposition fluxes of ambient particulate heavy metals in a small city, Korea. Atmos. Environ. 2002, 36, 5449–5458. [Google Scholar] [CrossRef]
  85. Amanollahi, J.; Tzanis, C.; Abdullah, A.M.; Ramli, M.F.; Pirasteh, S. Development of the models to estimate particulate matter from thermal infrared band of Landsat Enhanced Thematic Mapper. Int. J. Environ. Sci. Technol. 2013, 10, 1245–1254. [Google Scholar] [CrossRef] [Green Version]
  86. Le, J.A.; El-Askary, H.M.; Allali, M.; Struppa, D.C. Application of recurrent neural networks for drought projections in California. Atmos. Res. 2017, 188, 100–106. [Google Scholar] [CrossRef] [Green Version]
  87. Haywood, J.; Boucher, O. Estimates of the direct and indirect radiative forcing due to tropospheric aerosols: A review. Rev. Geophys. 2000, 38, 513–543. [Google Scholar] [CrossRef]
  88. Kok, J.F.; Ward, D.S.; Mahowald, N.M.; Evan, A.T. Global and regional importance of the direct dust-climate feedback. Nat. Commun. 2018, 9, 241. [Google Scholar] [CrossRef]
  89. Williams, R.H.; McGee, D.; Kinsley, C.W.; Ridley, D.A.; Hu, S.; Fedorov, A.; Tal, I.; Murray, R.W.; deMenocal, P.B. Glacial to Holocene changes in trans-Atlantic Saharan dust transport and dust-climate feedbacks. Sci. Adv. 2016, 2, e1600445. [Google Scholar] [CrossRef]
  90. Kok, J.F.; Ridley, D.A.; Zhou, Q.; Miller, R.L.; Zhao, C.; Heald, C.L.; Ward, D.S.; Albani, S.; Haustein, K. Smaller desert dust cooling effect estimated from analysis of dust size and abundance. Nat. Geosci. 2017, 10, 274–278. [Google Scholar] [CrossRef]
  91. Liao, H.; Seinfeld, J.H. Radiative forcing by mineral dust aerosols: Sensitivity to key variables. J. Geophys. Res. Atmos. 1998, 103, 31637–31645. [Google Scholar] [CrossRef]
  92. Evan, A.T.; Flamant, C.; Gaetani, M.; Guichard, F. The past, present and future of African dust. Nature 2016, 531, 493–495. [Google Scholar] [CrossRef]
  93. Fu, Q.; Feng, S. Responses of terrestrial aridity to global warming. J. Geophys. Res. Atmos. 2014, 119, 7863–7875. [Google Scholar] [CrossRef]
  94. Kok, J.F.; Mahowald, N.M.; Fratini, G.; Gillies, J.A.; Ishizuka, M.; Leys, J.F.; Mikami, M.; Park, M.-S.; Park, S.-U.; Van Pelt, R.S.; et al. An improved dust emission model—Part 1: Model description and comparison against measurements. Atmos. Chem. Phys. 2014, 14, 13023–13041. [Google Scholar] [CrossRef]
  95. Mahowald, N.M. Anthropocene changes in desert area: Sensitivity to climate model predictions. Geophys. Res. Lett. 2007, 34, 18. [Google Scholar] [CrossRef]
  96. Tegen, I.; Werner, M.; Harrison, S.P.; Kohfeld, K.E. Relative importance of climate and land use in determining present and future global soil dust emission: Soil dust emissions and land use. Geophys. Res. Lett. 2004, 31, 5. [Google Scholar] [CrossRef]
  97. Mahowald, N.M.; Muhs, D.R.; Levis, S.; Rasch, P.J.; Yoshioka, M.; Zender, C.S.; Luo, C. Change in atmospheric mineral aerosols in response to climate: Last glacial period, preindustrial, modern, and doubled carbon dioxide climates: Dust response to climate. J. Geophys. Res. Atmos. 2006, 111, D10. [Google Scholar] [CrossRef]
  98. Woodward, S.; Roberts, D.L.; Betts, R.A. A simulation of the effect of climate change-induced desertification on mineral dust aerosol: Effects of desertification on dust. Geophys. Res. Lett. 2005, 32, 18. [Google Scholar] [CrossRef]
Figure 1. Nile Delta area of study and four main cities (Cairo, Alexandria, Tanta, and Port Said) in each Delta corner and center (background remotely sensed image from Google Earth).
Remotesensing 11 01998 g001
Figure 2. Scatter plots of Cairo AErosol RObotic NETwork (AERONET) aerosol optical depth (AOD) observations as to AOD data from (a) Aqua MODIS, (b) MISR, (c) Terra MODIS, (d) POLDER3, (e) SeaWiFS, and (f) OMI in EMA and Cairo University stations. Aerosol histograms with no cloud contamination where color indicates band for (g) optical depth, (h) Ångström exponent, (i) single scattering albedo (SSA), and (j) Tau (AOD) fraction by particle over Egypt on 14 September 2008.
Remotesensing 11 01998 g002
Figure 3. Time series plot of AOD in Cairo during 2000 to 2018 for (a) Terra MODIS, (b) Aqua MODIS, (c) MISR, and (d) AERONET, respectively. Red arrows point to the high AOD anomalies indicated during June 2013 (summer), January 2014 (winter), March 2014 (spring), and September 2015 (fall).
Remotesensing 11 01998 g003
Figure 4. Time series of AERONET monthly AOD during (a) June 2013, (b) January 2014, (c) March 2014, and (d) September 2015. Red arrows point to the high AOD anomalies events during each month: 8 June, 2 January, 3 March, and 9 September, respectively.
Remotesensing 11 01998 g004
Figure 5. Time series of AERONET Daily 500-nm AOD spectral deconvolution algorithm (SDA) retrievals during (a) 8 June 2013, (b) 2 January 2014, (c) 3 March 2014, and (d) 9 September 2015, respectively. Black/blue/red lines represent total/coarse/find aerosols, respectively.
Remotesensing 11 01998 g005
Figure 6. Size distributions of aerosols during (a) 8 June 2013 (b) 2 January 2014, (c) 3 March 2014, and (d) 10 September 2015, respectively. Lines in different colors represent different observations during the day.
Remotesensing 11 01998 g006
Figure 7. Back-trajectories analysis during (a) 8 June 2013, (b) 2 January 2014, (c) 3 March 2014, and (d) 9 September 2015, respectively, as well as the Cloud-Aerosol Lidar and Infrared Pathfinder Satellite Observation (CALIPSO) aerosol subtype classifications for the same scenes (a,b,d) with their associated highlighted region of interest: (e) red box: the Greater Delta and Mediterranean region (at 00:06 to 00:19 UTC 6 June 2013); (f) red box: the Greater Delta and Mediterranean region (at 00:05 to 00:19 UTC 2 January 2014); (g) red box: the Mesopotamia region (at 23:24 to 23:37 UTC 3 March 2014) and (h) blue box: the Egypt’s Western Desert region (at 11:14 to 11:27 UTC 9 September 2015). The missing CALIPSO aerosol subtype analysis for 3 March 2014 (c) due to data unavailability.
Remotesensing 11 01998 g007
Figure 8. The Ultra Violet Aerosol Index (UVAI) (a,d,g,j), air temperature, and specific humidity (b,e,h,k), shortwave (SW) and longwave (LW) radiation (c,f,i,l) values recorded before and after five days for each aerosol episode: 8 June 2013 (ac); 2 January 2014 (df); 3 March 2014 (gi); and 9 September 2015 (jl).
Remotesensing 11 01998 g008
Figure 9. The relationship between the daily average of PM10 and multiple products: (a) MODIS Aqua AOD; (b) MODIS Terra AOD; (c) Modern-Era Retrospective analysis for Research and Applications version 2 (MERRA-2) AOD; (d) AERONET AOD at 1020 nm; (e) AERONET Ångström exponent (AE) at 340 nm/440 nm; (f) predicted PM10 values from the Random Decision Forest model output.
Remotesensing 11 01998 g009
Figure 10. Egypt’s average annual population weighted and geographic mean PM2.5 using geographically weighted regression (GWR) datasets to compare with monthly MERRA-2 datasets (min, max, and mean values) of PM2.5 dust AOD and sea salt AOD, as well as surface air temperature and wind speed during the period from 1998 to 2016.
Remotesensing 11 01998 g010
Table 1. The spaceborne sensors validated against observations of the Egyptian Meteorological Authority (EMA) station. MODIS: Moderate Resolution Imaging Spectroradiometer, MISR: Multi-angle Imaging Spectroradiometer, POLDER3: POLarization and Directionality of the Earth’s Reflectances, SeaWiFS: Sea-viewing Wide Field-of-view Sensor, OMI: Ozone Monitoring Instrument.
StationsPeriod of Available DataNumber of ObservationOutliers
Aqua MODIS13 April 2005–21 March 2006662
MISR1 May 2005–19 January 2006230
Terra MODIS13 April 2005–22 March 2006682
POLDER314 April 2005–21 March 2006574
SeaWiFS14 May 2005–6 February 2006110
OMI13 April 2005–22 March 20061181
Table 2. AERONET AOD bands, fine mode fraction (FMF), Ångström exponent (AE), and number of instances values for five clusters.
K-Means ClustersCluster 1Cluster 2Cluster 3Cluster 4Cluster 5
Classified Aerosol TypesClear DayLight Fine AerosolLight Mixed AerosolHeavy Pollution-LikeHeavy Dust-Like
AOD_340 nm0.420.750.591.311.58
AOD_380 nm0.370.680.551.231.55
AOD_440 nm0.310.570.511.101.50
AOD_500 nm0.270.490.481.001.48
AOD_675 nm0.190.330.420.751.43
AOD_870 nm0.150.250.390.591.40
AOD_1020 nm0.140.210.370.511.36
AOD_1640 nm0.100.140.290.331.16
FMF_500 nm0.570.700.320.680.19
AE_500 nm1.181.270.510.900.16
# of Instances11157292858010
Table 3. The selected model per category. MAE: mean absolute error.
RankingAlgorithm NameR2MAE
1Random Decision Forest0.5882527.37317
2Artificial Neural Network0.3795529.91710
3Linear Regression0.2884828.41857
4Decision Tree0.2511537.64001

