Article

Urban Health Related Air Quality Indicators over the Middle East and North Africa Countries Using Multiple Satellites and AERONET Data

1
Department of Environmental Science, Faculty of Science, Moharam Beek, Alexandria University, Alexandria 21522, Egypt
2
Computational and Data Sciences Graduate Program, Schmid College of Science and Technology, Chapman University, Orange, CA 92866, USA
3
Center of Excellence in Earth Systems Modeling and Observations, Chapman University, CA 92866, USA
4
Schmid College of Science and Technology, Chapman University, Orange, CA 92866, USA
*
Author to whom correspondence should be addressed.
Remote Sens. 2019, 11(18), 2096; https://doi.org/10.3390/rs11182096
Submission received: 24 July 2019 / Revised: 6 September 2019 / Accepted: 6 September 2019 / Published: 8 September 2019
(This article belongs to the Special Issue Remote Sensing for Urban Human Health)

Abstract

:
Air pollution is reported as one of the most severe environmental problems in the Middle East and North Africa (MENA) region. Remotely sensed data from newly available TROPOMI - TROPOspheric Monitoring Instrument on board Sentinel-5 Precursor, shows an annual mean of high-resolution maps of selected air quality indicators (NO2, CO, O3, and UVAI) of the MENA countries for the first time. The correlation analysis among the aforementioned indicators show the coherency of the air pollutants in urban areas. Multi-year data from the Aerosol Robotic Network (AERONET) stations from nine MENA countries are utilized here to study the aerosol optical depth (AOD) and Ångström exponent (AE) with other available observations. Additionally, a total of 65 different machine learning models of four categories, namely: linear regression, ensemble, decision tree, and deep neural network (DNN), were built from multiple data sources (MODIS, MISR, OMI, and MERRA-2) to predict the best usable AOD product as compared to AERONET data. DNN validates well against AERONET data and proves to be the best model to generate optimized aerosol products when the ground observations are insufficient. This approach can improve the knowledge of air pollutant variability and intensity in the MENA region for decision makers to operate proper mitigation strategies.

Graphical Abstract

1. Introduction

According to World Health Organization (WHO), cities of the Middle East and North Africa (MENA) fared among the worst in terms of air quality [1], with some of the air pollutant components exceeding five to ten times of the WHO limits. For developing countries, 98 percent of the cities with over than 100,000 population did not meet the WHO air quality standard. Over the past few decades, the air quality in the MENA regions has further deteriorated with nearly doubled emission of carbon dioxide (CO2) [2]. Some major MENA cities are listed among the world’s most air polluted cities [3]. For instance, Riyadh in Saudi Arabia ranked 7th with highest PM10 concentrations of around 368 μg/m3 and Bahrain ranked 11th with 318 μg/m3, whereas the list also included other cities such as Cairo and Dammam [1]. Additionally, according to Arab Forum for Environment and Development (AFED) 2017 report, the United Arab Emirates (UAE) was the world’s most polluted country with regard to small particulate matter [4], having the highest exposure to PM2.5 emissions around 80 μg/m3. The AFED report in 2008 [5] demonstrated that air quality degradation in major MENA cities and urban regions mainly resulted from transportation sector (e.g., vehicles emission of carbon monoxide, nitrogen oxides, and ozone gas in Bahrain [6]) and energy sector such as thermal power plants emitting high quantities of greenhouse gases [7]. The major emitted air pollutants include carbon monoxide, sulfur oxides, nitrogen oxides, lead, ozone, and volatile organic compounds (VOCs).
It is well-known that air quality degradation has both short- and long-term effects on human health. For instance, premature mortality cases in Egypt have been reported and linked to outdoor air pollution (5 out of 10,000 people) [8]. More frequent and intense air pollution episodes have been observed recently in different cities of MENA region. These pollution episodes can be quite costly reaching up to five percent of GDP in developing countries and two percent in developed countries, including mortality, chronic illness, lower industrial and agricultural productivity, and hospital admissions [9]. For example, Cairo population suffers from major cardiovascular and respiratory health impacts [10], where human respiratory systems can be severely damaged by dust, tiny soot fragments, and pollutant particulates. Human health in these areas fluctuates, mirroring the natural and financial circumstance of the various nations. A few nations, where neediness is high, have high infant mortality rates. Moreover, it is noteworthy that further effects are expected because of environmental factors, for example, heat and pressure contributing to potential increase in vector-borne (e.g., intestinal sickness) and waterborne infections. Atmospheric and climate models show temperature increase by 1 °C–2 °C by 2030–2050, with more severe related atmospheric incidents and particulate loadings in late springs. As extraordinary temperatures are as of now happening in the MENA region, even a little ascent in temperature can have a drastic impact on human health and their wellbeing. More heat wave and extreme warmth related mortality cases are expected to constantly increase. Moreover, satellite observations with model projections show great precipitation fluctuations on different regions within the MENA posing higher risk to water accessibility and nourishment generation, which will prompt a bigger wholesome and cleanliness issues [11]. A hotter atmosphere can extend the scope of bearers of jungle fever, yellow fever, dengue fever, and other vector-borne maladies. The absence of solid general wellbeing framework in certain nations, especially in sub-Saharan Africa and the MENA, will render them progressively powerless against anticipated increase in the lengths of plague seasons and geographic scope of the previously mentioned vector-borne ailments [12]. Among the human wellbeing, impacts of dust storms are respiratory disorders (counting asthma, tracheitis, pneumonia, unfavorably susceptible rhinitis and silicosis), cardiovascular scatters (counting stroke), conjunctivitis, skin disturbances, meningococcal meningitis, valley fever, infections related to harmful algal blossoms and other wounds identified with transport mishaps [13].
Previously launched satellite sensors, such as ozone monitoring instrument (OMI) and atmospheric infrared sounder (AIRS) both on board of the NASA Aura spacecraft [14,15], measure key air quality indicators such as nitrogen oxides (NOx), carbon monoxide (CO), sulfur oxides (SOx), ozone (O3), and other aerosols’ related products. However, the low resolution of these products (as fine as 0.25 degree) limits their applicability to regional air quality studies, particularly at the district level of urban cities and centers.
Geographically, the MENA region is halfway situated in the purported dust-belt [16] and hence, is unequivocally affected by characteristics sources. This is evident from the high aerosol optical depth (AOD) values recorded from these satellite observations [17]. The AOD parameter, sometimes referred to as aerosol optical thickness (AOT), shows the termination of a light emission as it goes through a layer of atmosphere that contains aerosols. Progressively, natural dust is enhanced nearby local anthropogenic emanations related to the financial and populace development on the Arabian Peninsula, which adds to the pollution beginning from Europe, Asia, and Africa. Since North African region contains the Sahara Desert, the biggest dust source on the planet, it contributes up to 18 percent of the worldwide dust emission [18,19,20], as well as to pollutant transport with the blowing dust [21,22]. This is in addition to the uncommon monetary development, a blasting oil and gas industry. Therefore, air quality over the MENA region has gotten noteworthy consideration amid the previous 15 years and yet the air pollution contemplates are still a long way from complete.
This situation also adds complications when investigating the origin and composition of the emerging aerosols, since natural and anthropogenic aerosols suspended in the atmosphere are portrayed by their various sources, fluctuating particle dynamics, lifetimes, interactive mechanisms, and surface, and column disseminations. Distinguishing blends containing distinctive aerosol types like dust, carbon, sea salt, sulfate, or nitrogen are achieved through the synergistic approaches of spaceborne and in situ observations [22,23]. Optical strategies are utilized to gauge particle sizes; nonetheless, deciding particle types requires more data with respect to aerosol sources, directions, local geography, and atmospheric conditions. As for radiative impacts, aerosol properties and types are the main input parameters for acquiring exact climate forecasts [24,25,26].
Since the turn of the 21st century, an upward pattern of remotely detected and ground-based AOD and air poisons was seen over the MENA [23,27,28,29,30,31]. This positive pattern is ascribed to the expansion in the Middle Eastern residue movement because of changes in wind speed and soil dampness [32,33]. For its wide spatial and worldly information, accessibility space-conceived sensors are vital sources to comprehend aerosols’ attributes and transport under some physical conditions and high surface reflectivity. On the other hand, low aerosol optical depth can constrain satellite data application in describing properties of airborne particles, particularly over the MENA region.
This work sheds light on using updated high-resolution remotely sensed data to address multiple components of air pollutant over the MENA area and their associated health impacts. The available ground station measurements of aerosols’ characteristics are used here to outline the aerosol variability among selected MENA countries. Additionally, we combined the most recent 20 years of satellite data with available ground data to improve the creation of AOD products over the MENA countries using the optimize machine learning algorithms to be used whenever ground observations are missing.

2. Materials and Methods
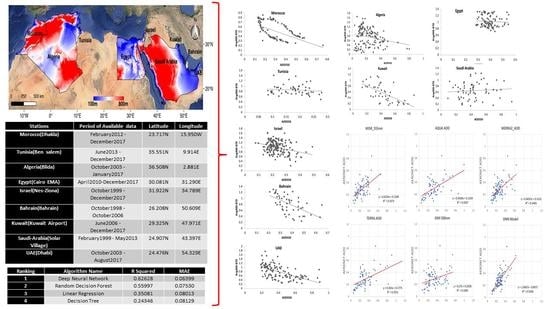
2.1. Study Area

The MENA region, housing 28 nations and with 357.3 million inhabitants, is seen as a major player with increasing importance and contribution to the global economy. Geographically, it is partiality located between Europe and Asia, and is one of the world’s richest regions in terms of resources, since it includes oil-rich countries. Among the challenges faced by the MENA region, the constant increase of population, lack of sustainable management strategies for resources along with water scarcity issues associated with different lifestyles are crucial. Additionally ongoing environmental changes would pose further risks particularly with the continuing trends of lesser precipitation and increasing temperature anomalies [34,35,36]. For instance, in 1989–2009, the Northwestern Sahara experienced 40–50 heat wave days of the year, while there is an anticipated increase in this number of warmth wave days to be around 173 days out of each year over the 21st century [35]. In this work, we focus our analysis on only nine nations within the MENA region (Figure 1).

2.2. TROPOMI Sentilnel-5P Dataset

The European Space Agency (ESA) launched Sentinel-5 Precursor satellite on October 13, 2017 to monitor the global air pollution using the onboard sensor referred to as TROPOMI (TROPOspheric Monitoring Instrument) [37]. The datasets provide two versions Near Real-Time (NRTI) and Offline (OFFL). In this research, we used the Google Earth Engine (GEE) [38] tool to process the air quality datasets of TROPOMI products, including OFFL CO column density (CO_column_number_density in the unit of mol/m^2), NRTI NO2 column density (NO2_column_number_density in the unit of mol/m^2), NRTI O3 column density (O3_column_number_density in the unit of mol/m^2), NRTI SO2 column density (SO2_column_number_density in the unit of mol/m^2), and Ultraviolet (UV) Aerosol Index (UVAI), whose negative or small values representing non-absorbing aerosols while larger positive values representing absorbing aerosols (e.g., dust or smoke) (absorbing_aerosol_index as unitless). Among them the SO2 product is only used in the time series example of subregions’ differences within urban Cairo, since the SO2 data is only available after October 2, 2018. The NO2, CO, O3, and ultraviolet aerosol index (UVAI) products are used to generate the annual averaged map of MENA region during July 11, 2018 till July 10, 2019, as well as correlation analysis using their anomalies value X a   i s   calculated as:
X a = X   X ¯
where X is the daily value and X ¯ is the monthly mean value. The Google Earth Engine is an effective tool for environmental research in the MENA regions as it is confirmed by previous studies [39,40,41].

2.3. AERONET Data Measurement

Aerosol optical properties in the atmospheric column are routinely observed within the AERONET (Aerosol RObotic NETwork) [42] program. This is an organization of ground-based remote sensing aerosol networks set up by National Aeronautics and Space Administration (NASA) and LOA-PHOTONS Centre National de la Researche Scientifique (CNRS) and is significantly extended by associates from national offices, foundations, colleges, singular researchers, and accomplices. The system comprises of in excess of 500 globally distributed sun and sky-scanning automated radiometers. The institutionalized system techniques of instrument upkeep, alignment, cloud screening, and information preparing take into account the quantitative correlation of the airborne information acquired at various occasions and areas [42,43]. These instruments can just recover information amid daytime, since they depend on termination estimations of the immediate and dissipated sun oriented radiation at a few ostensible wavelengths (340, 380, 440, 500, 675, 870 and 1020 nm in addition to a 936 nm water vapor band). During calibration periods, the instrument is out of activity while important yearly adjustment is completed. Therefore the information inclusion in a given station is regularly constrained to 100–250 days of the year. The typical uncertainty in the AOD estimated by AERONET instruments ranges from 0.01 to 0.02 and is spectrally dependent with higher errors in the UV spectral range [42,44]. This data is provided in three categories: Level 1.0 (unscreened), Level 1.5 (cloud-screened and quality controlled), and Level 2.0 (quality-assured). Inversions, precipitable water, and other AOD-dependent products are derived from these levels and may implement additional quality checks [43,45] and are used to derive the extinction Ångström exponent (α) utilizing the measured aerosol optical properties and AOD spectral dependence (text) with wavelength (λ).
Since one objective of this work is to get an aerosol characterization over a substantial district with standardized measurements, quality-guaranteed direct-sun information in the 550 nm wavelength run is utilized since these channels are profoundly exacted and are accessible in most AERONET instruments. In order to accomplish a decent spatial inclusion, stations which provided data covering at least the 12 months of the yearly cycle within the October 1998–December 2017 period were chosen (Table 1).

2.4. Modeling of AOD Using Satellite and Ground-Based Datasets

The satellites and ground-based instruments can be utilized to quantify AOD in the atmosphere, yet inside similar transient directions and geographic area distinctive instruments could create diverse recoveries [46,47,48,49]. In addition, these instruments can accurately retrieve aerosol particle properties, such as aerosol’s morphology and radiative absorption [50], in order to provide key role in studying the horizontal variation and characteristics of aerosols [51].
In this research, we used five different aerosol AOD monthly dataset sources, including MODIS (both on board of the Terra and Aqua satellites), MISR (on board of the Terra satellite), Ozone Monitoring Instrument (OMI) (on board of the Aura satellite) and AOD monthly values derived from MERRA2 (The Modern Era Retrospective-Analysis for Research and Applications) model [46,52,53,54,55], to build various machine learning models and evaluated by the same periods of AERONET available observations of the selected stations. A total of 939 observations are selected in the dataset, where each observation have five input parameters (MERRA2_AOD, MISR_555 nm, TERRA AOD, AQUA AOD and OMI 500 nm), as well as the objective field (AERONET_AOD_550 nm). The input parameters are selected based on their different types (model and satellite observations) and different bands (e.g., 500 nm and 550 nm), as well as different satellite capturing times (e.g., Terra and Aqua visit same location at different times during the day) that provide adequate information of the daily AOD situation. The dataset is split by the ratio (9:1) into training dataset and testing dataset, respectively. The training dataset has 845 observations but some missing values exist in some parameters (0 missing value of MERRA2_AOD, 108 missing values observation of MISR_555 nm, 145 missing values of TERRA AOD, 186 missing values of AQUA AOD and 145 missing values of OMI 500 nm). The testing dataset has 94 observations but also with missing values in parameters (0 missing value of MERRA2_AOD, 12 missing values observation of MISR_555 nm, 21 missing values of TERRA AOD, 27 missing values of AQUA AOD and 15 missing values of OMI 500 nm). The missing values may have impact on the evaluation process but the result is still acceptable for the sufficient values of testing dataset.
Machine learning methods have been applied to achieve better accuracy of measurements of dust aerosols (AOD and Ångström exponent) in previous studies [56,57,58,59]. Here, we built various supervised machine learning models, each assigned different parameters, including 61 Ensemble including Random Decision Forests, 1 Decision Tree, 1 Linear Regression, and 2 DNN. The models used R-squared values and MAE (mean absolute error) as the training metrics and cross validation for the evaluation process.
Different supervised learning algorithms can be used to solve the same classification and regression problem. However, the model performance highly depends on the data characteristics (e.g., the linear/non-linear relationships between the predictors and the objective). Even the best algorithm for the data characteristics has been selected; very different results can be yielded with the infinite combinations of its parameter values. Traditionally, it requests intensive manual experimentation to perform model selection and parametrization, since it is very difficult to know in advance which model is the most suitable for the problem until the researches try all of them. Therefore, the automated optimization methods, such as sequential model-based algorithm configuration (SMAC) [60] used in this study, have been proposed to overcome this difficulty. In this study, we perform the Bayesian parameter optimization for the model selection and parameter tuning using the OptiML platform (https://bigml.com/api/optimls), which sequentially tries groups of parameters training and evaluating models using them, then tries a new group of parameters based on the updated results. During the process, the Monte Carlo cross-validation [61] is iteratively performed on those models close to the optimum, where the platform iteratively makes new train and test splits of the original dataset for the top half of the models and discards the rest half models for poor performance. The advantage of this method (over k-fold cross validation) is that the proportion of the training and validation subsets is not dependent on the number of iterations (k-folds). OptiML tries different supervised models for solving the regression problems, including: linear regression, decision trees, ensembles (up to 256 trees), and deep neural networks (DNN).
The linear regression is a simple supervised machine learning method that implements multiple linear regression where the objective field is modeled as the following linear combination:
y = b 0 + b 1 × x 1 + b 2 × x 2 + b n × x n
where the equation produces an estimate value from the coefficient values b 0 ,…, b n using a least-squares fit on the training data of the predictors x 1 ,…, x n in numeric values.
The decision tree is a class of machine learning algorithms used to solve both regression and classification problems. The nodes and branches form a tree graph as a model of decision. The nodes representing the predictors or labels influence the predictive path, and the branches represent the rules followed by different algorithms to make a given prediction.
The ensemble is a strategy that groups a number of models together to create a stronger model, which can significantly boost the predictive performance for single models using the same data while the improvement depends the nature of your data and the specific parameters of the ensemble. OptiML provides the ensemble models with the following three techniques: bagging, random decision forests, and gradient tree boosting. Bagging, aka. bootstrap aggregating [62], is a simple but effective ensemble-based strategy to use a different random subset of the original dataset for each model in the ensemble. Random decision forests [63] is another strategy that, essentially, selects a new random set of the input fields at each split while an individual model is being built instead of considering all the input fields. The gradient tree boosting is the third strategy that with boosted trees; tree outputs are additive rather than averaged (or decided by majority vote) and each tree modifies the predictions of the previously grown tree. It differs from previous two strategies since it does not try to predict the objective field directly but to fit a “gradient” to correct mistakes made in previous iterations.
The deep neural networks are implemented as a class of supervised learning algorithms to solve regression and classification problems. The input features are fed to one or several groups “nodes,” each group of nodes form a “layer”. Each node is essentially a function on the input that transforms the input features into another value or collection of values. This process continues layer by layer, until we reach the final output (prediction), an array of per-class probabilities for classification problems or a single, real value for regression problems.

3. Results

3.1. Comparision of Air Pollutant Components among Differences Regions within Urban Cairo Area

Figure 2 illustrates the application of using high-resolution products of TROPOMI for detecting the differences within the urban region—the example of three locations (central, south, and north) of metropolitan Cairo area. The selected locations are all separated from each other by less than 25 km, which is the spatial resolution of OMI product. Apparent differences between the locations are found except the O3 products. The emerging SO2 event of March 20th occurred in central location but was not observed in the south and east locations. Such disagreements are also found in the NO2 values during April 3rd and UVAI values during March 5th. These values would otherwise turn out to be the same if the OMI data is used in the same assessment. The advantage of using TROPOMI products is therefore confirmed when compared with coarse resolution remotely sensed products.

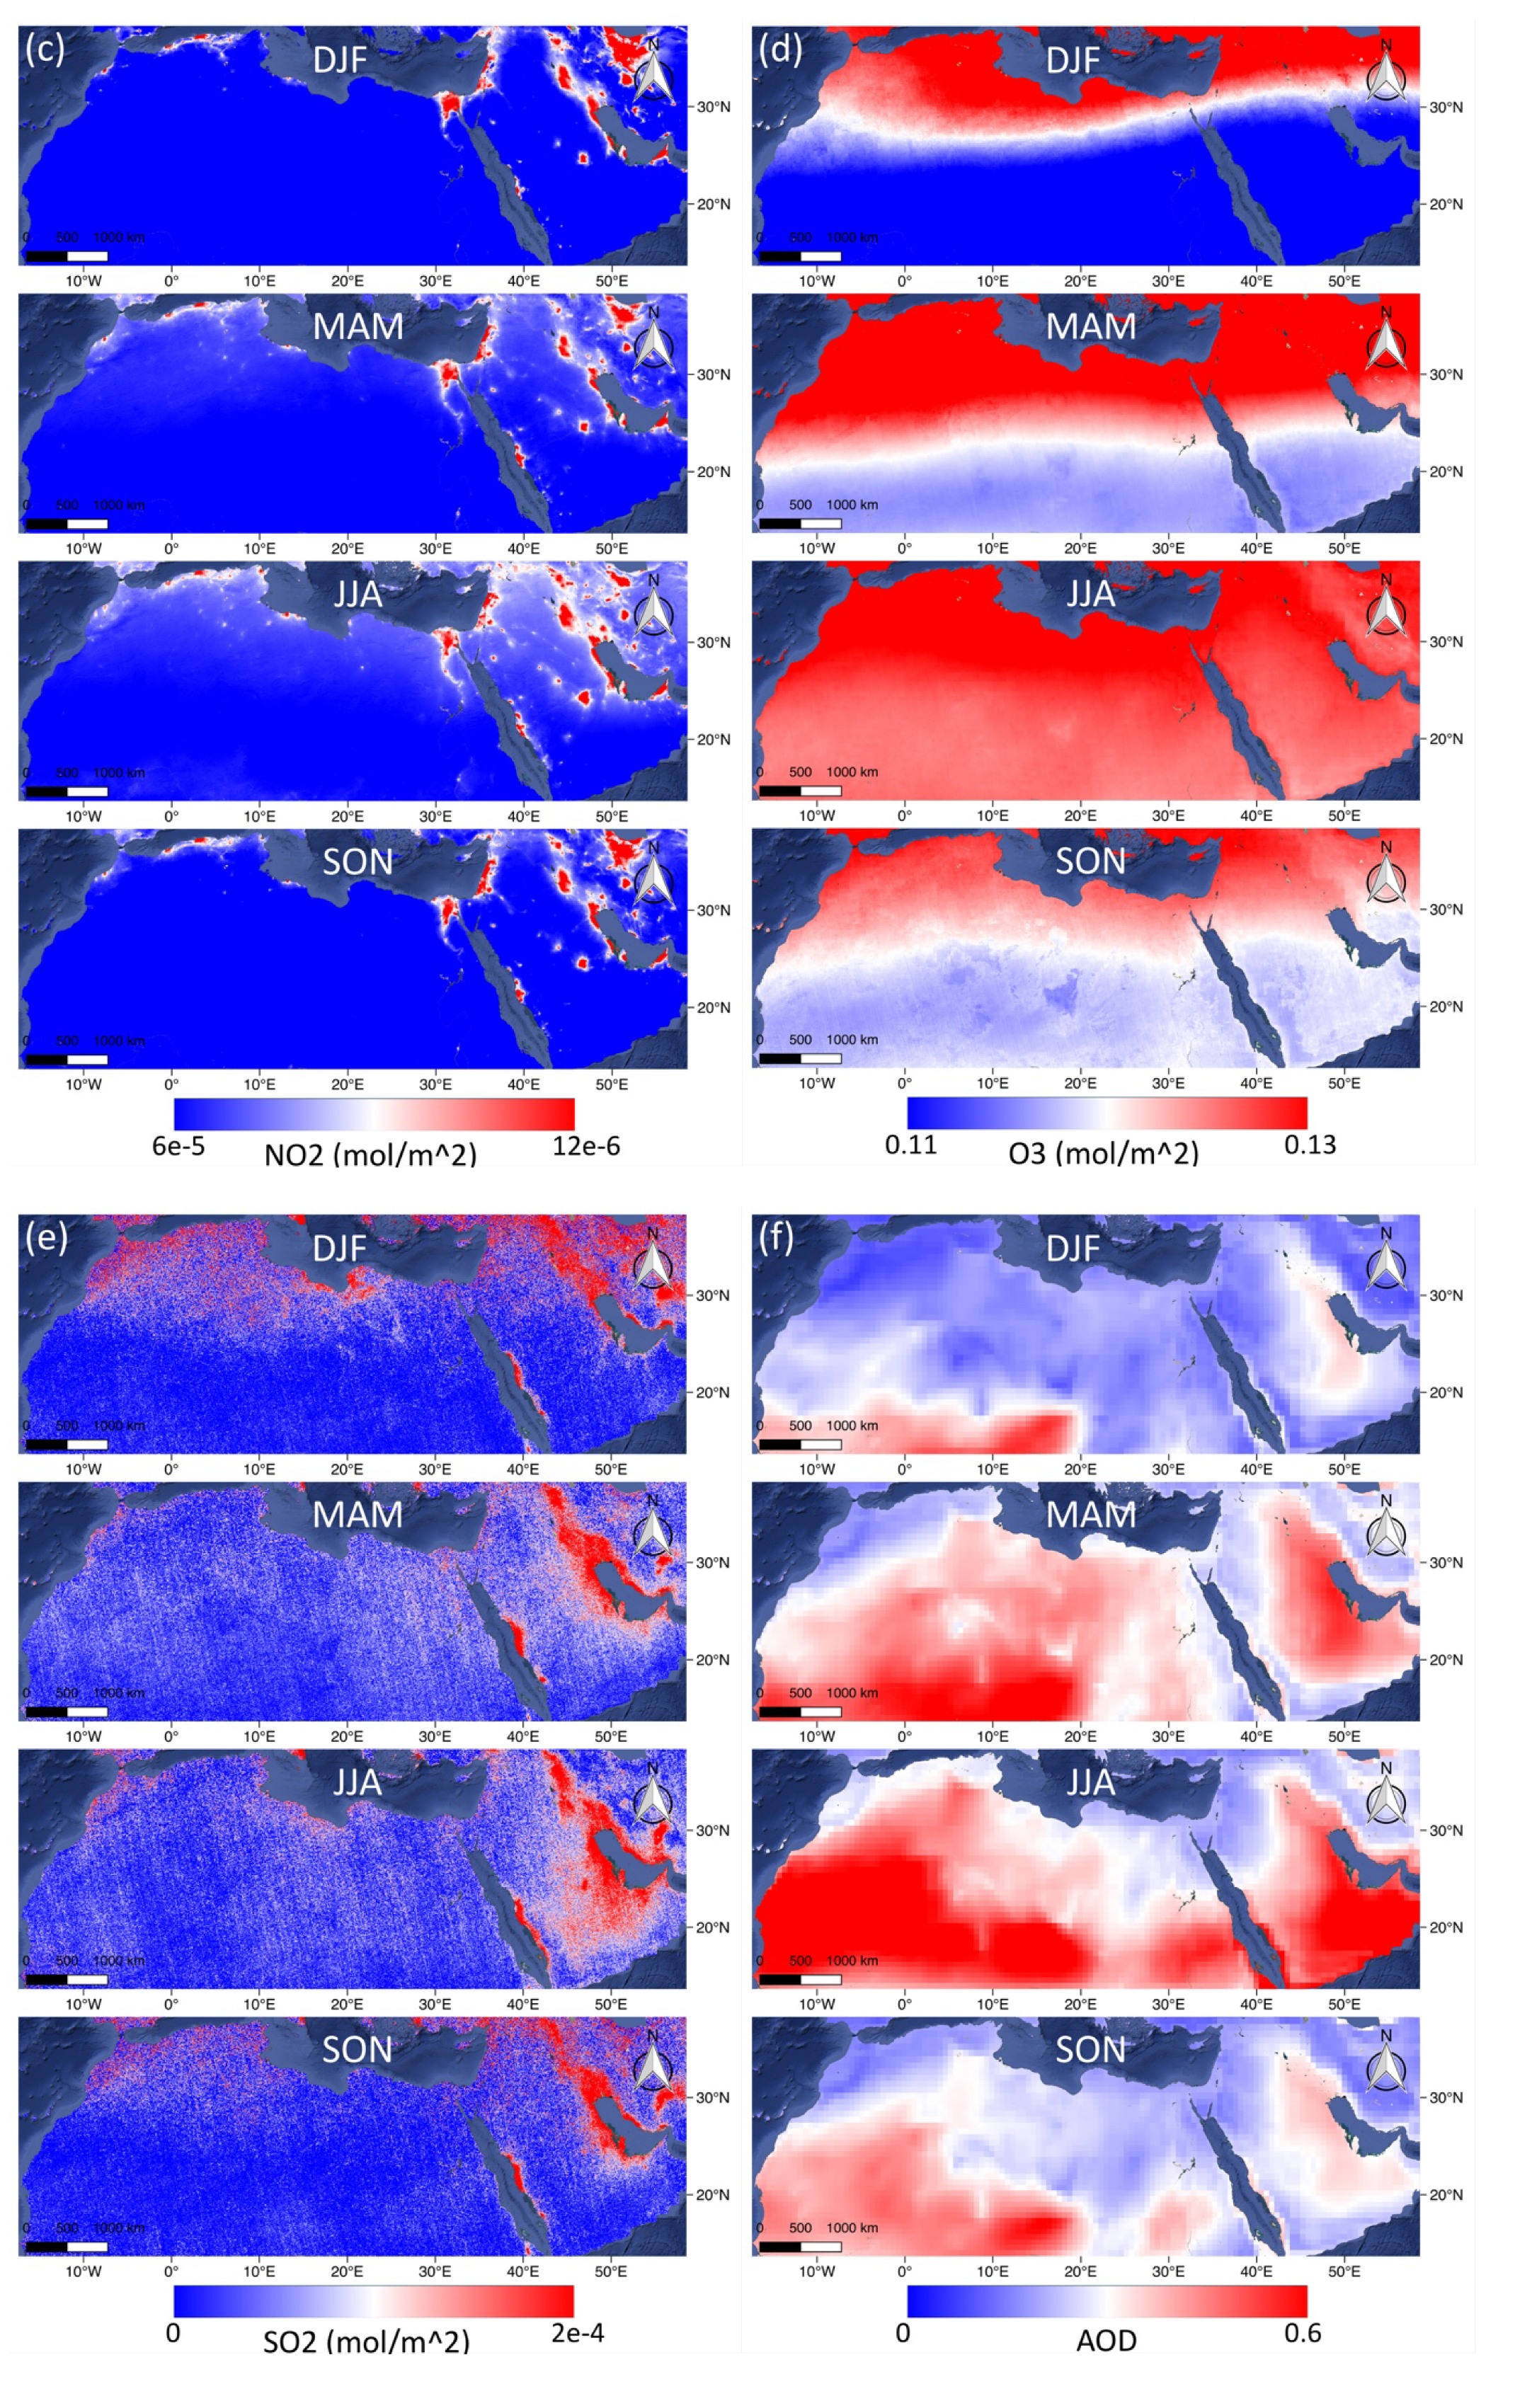
3.2. Seasonal Air Polluant Climatology Distribution over MENA Region Using Sentinel 5P TROPOMI and MERRA-2 AOD Products

Figure 3 shows the seasonal (DJF = Dec–Feb, MAM = Mar–May, JJA = Jun–Aug, SON = Sep–Nov) maps of the air quality parameters from TROPOMI (UVAI, CO, NO2, O3 SO2) during July 11, 2018 to July 10, 2019, as well as MERRA-2 AOD during 1980 to 2018 in the MENA region. Apparent coherency is found between the UVAI (Figure 3a) and AOD (Figure 3f) maps, suggesting UVAI can be an indicator to AOD, and vice versa. High CO area usually distributes in the regions with lower altitude, yet covering the entire MENA during MAM. No significant seasonal variation is observed in NO2 and SO2 maps, while numerous red spots in the SO2 map are randomly distributed noised values, which may be due to the lack of observations shown in Figure 2. Meanwhile, the O3 map shows a seasonal variation in a greater scale mainly governed by the stratospheric circulation [64], yet not altered by urban pollution, which is also illustrated in the Cairo’s O3 timeseries in Figure 2. Therefore, we did not use TROPOMI SO2 and O3 data for the following research.

3.3. Annual Air Polluant Distribution over the Selected Countries Using Sentinel 5P TROPOMI Product

In the Figure 4, the concentration of CO among the countries shows a pattern of distribution affected by the topography—the higher CO values are located in the lower altitude such as the coast of the Gulf region (Bahrain, Kuwait, UAE), the Nile Delta region, and the coastal region of Red Sea and Mediterranean Sea (Israel, Tunisia, Saudi Arabia), which are also the populated regions. Additionally, high CO values are also distributed in the deserts such as Western Desert of Egypt and eastern province of Saudi Arabia.
Compared to CO, the NO2 map in Figure 5 demonstrates a distribution significantly related to human settlements, indicating the NO2 emission is mostly contributed by industries and vehicles in the region. The concentrated NO2 (red areas) is located in the populated cities such as Bahrain, Morocco (Casablanca), Tunisia (Tunis), Egypt (the Delta region) and multiple cities in Saudi Arabia. Different from CO, the depopulated desert regions are always characterized as low NO2.
In Figure 6, the negative UVAI values are found in some relatively humid regions such as the Mediterranean coastal of Algeria, Tunis, and Morocco, as well as Nile Delta region, but high in the arid regions with high dust loadings. Here we suggest that the UVAI product may be affected by the greenness or humidity of the target area. Besides, UVAI is also altered by the land topography indicated by Figure 1, showing lower UVAI values exist in the region with high attitude (mountain areas of Saudi Arabia and Algeria).
Figure 7 demonstrates the correlation between the air pollutants over the selected MENA countries. Strong positive correlation between CO and NO2 is found in the urban areas: the Nile Delta region centered Cairo, the cities near the coast of the Gulf and Red Sea and Riyadh in Saudi Arabia (Figure 5). This is due to the fact that the vehicles and industries in the listed urban regions usually emit both pollutants simultaneously. The CO and UVAI are showing a weak relationship in most regions except the negative correlation observed in the south of the Nile Delta close to Cairo. Meanwhile, the correlation map between UVAI and NO2 also shows a generally weak relationship between them.

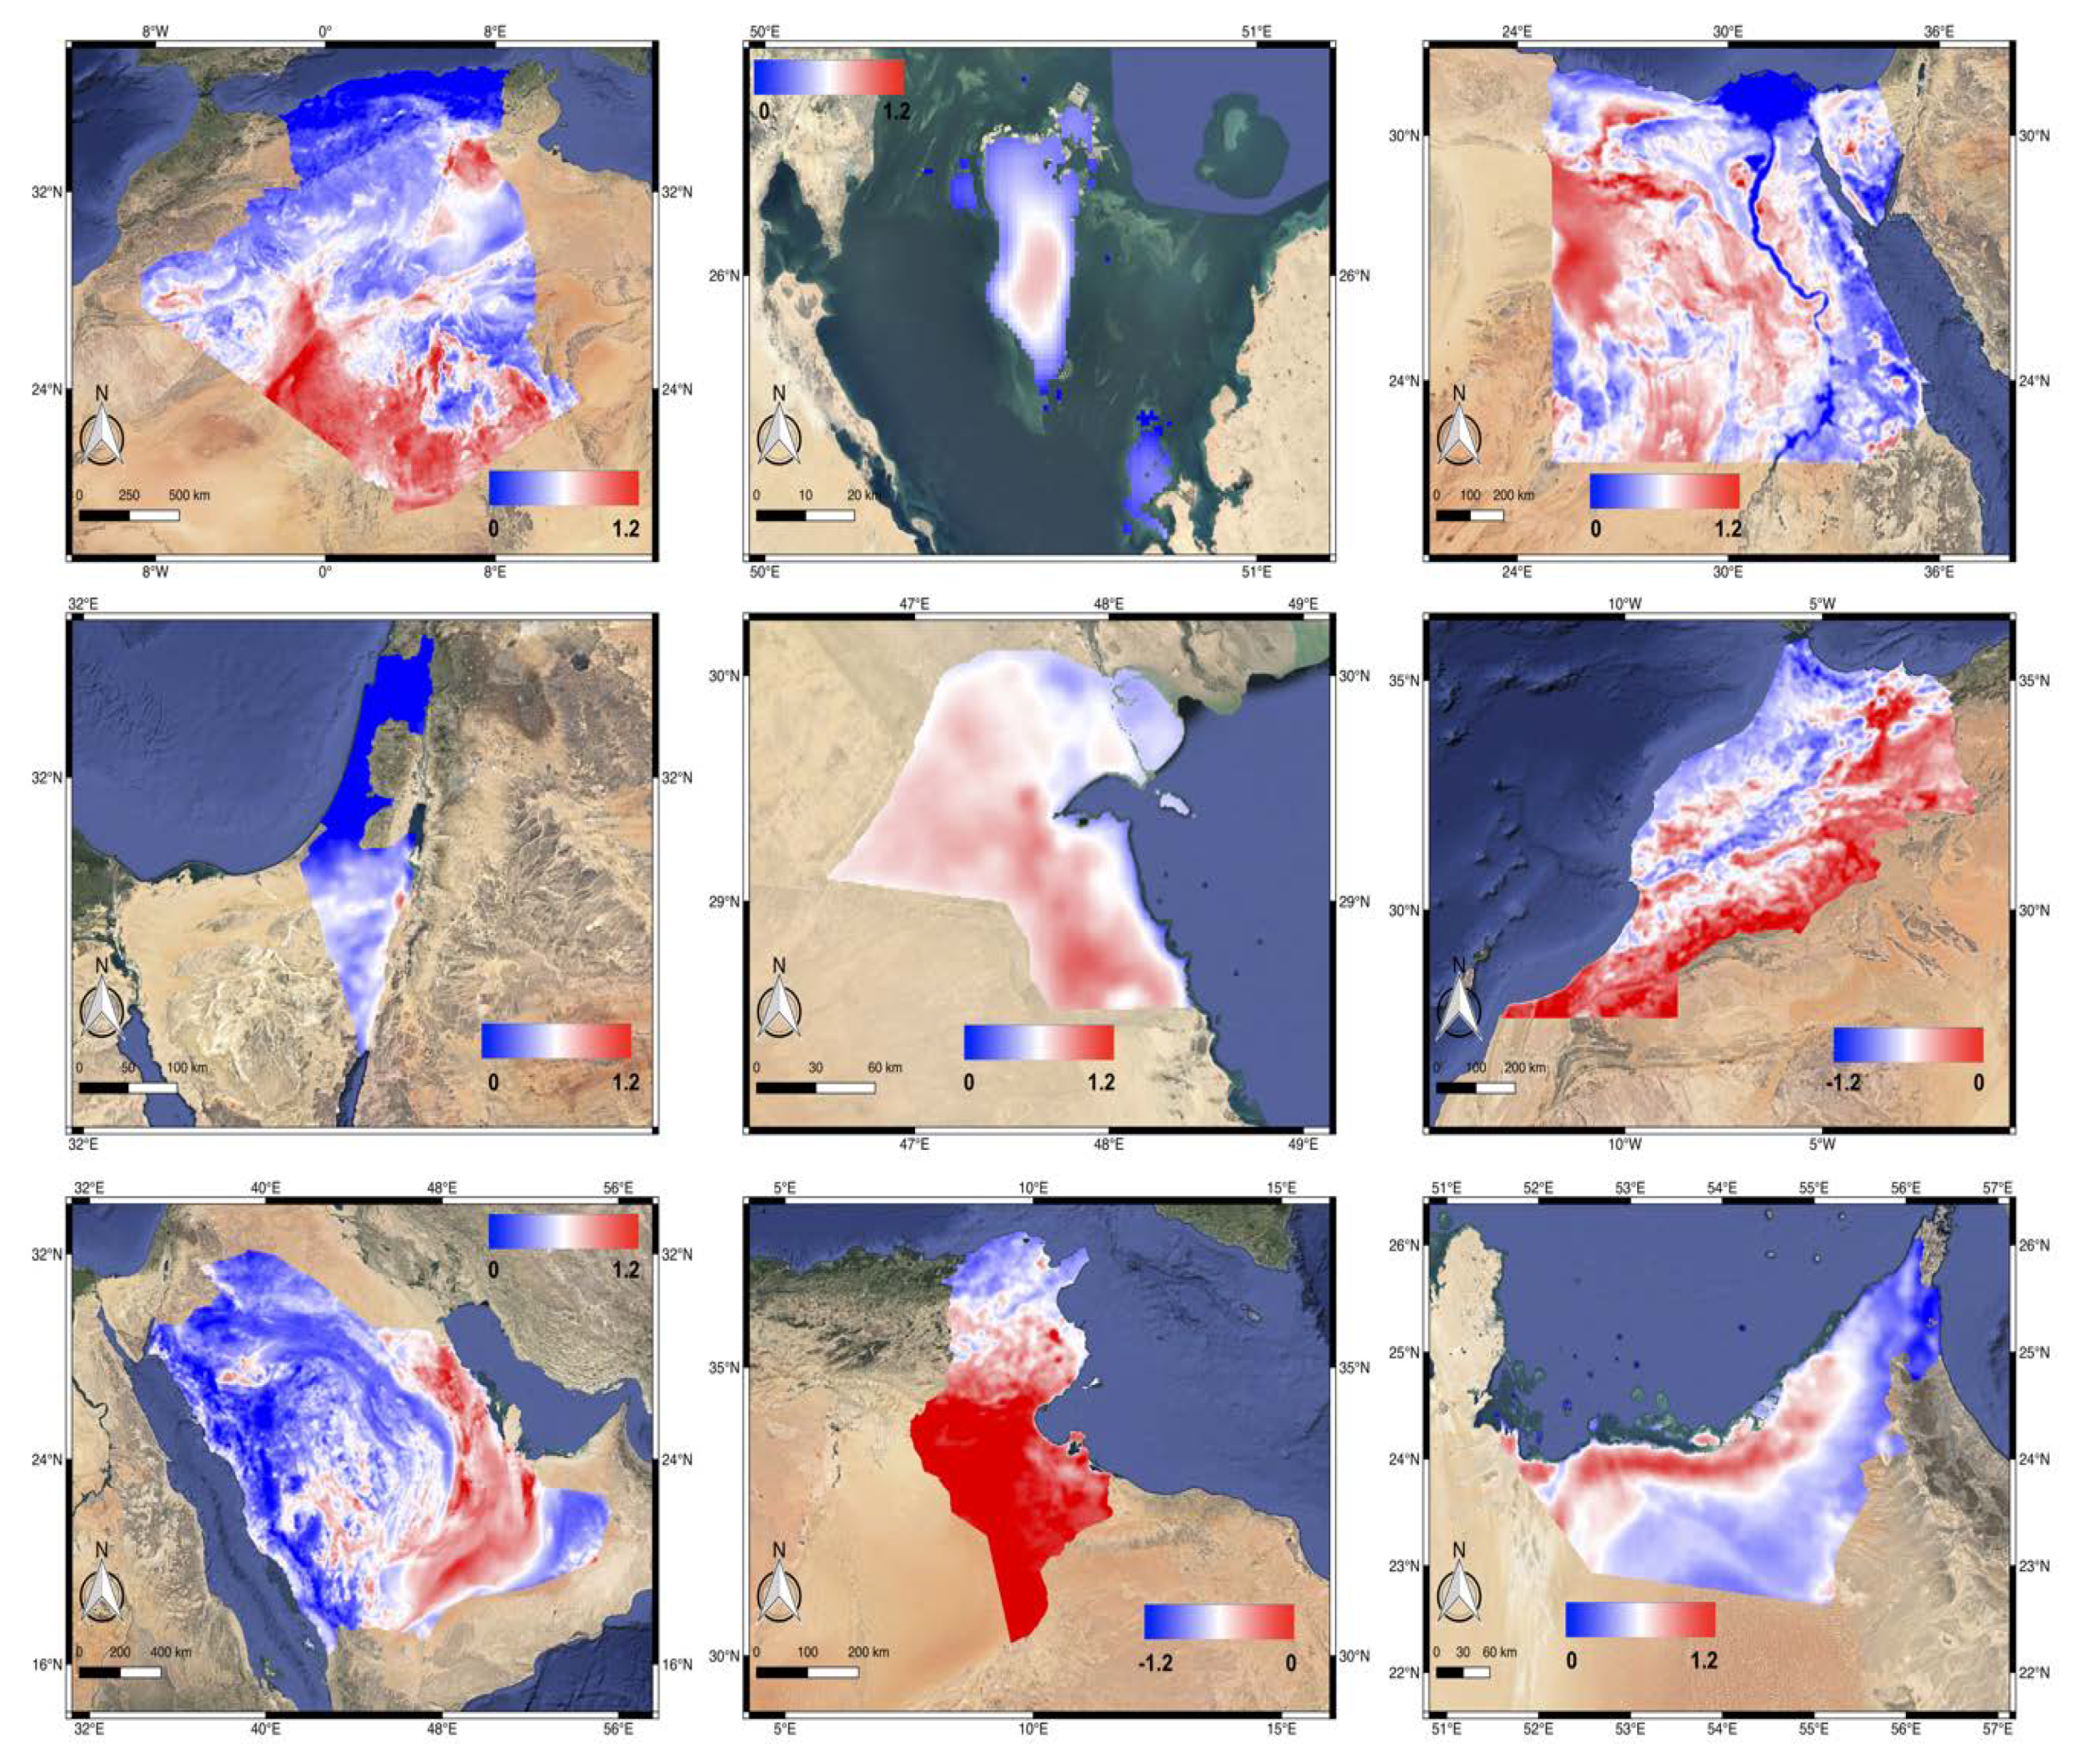
3.4. Spatial Variability and Properties of Aerosol over the Selected Countries

Airborne radiative forcing was evaluated using AOD as it quantifies the opaqueness of the vertical column of the atmosphere and the Ångström Exponent (α) which demonstrates the dominating size of the suspended particles being fine or coarse mode fraction. The annual variability of AOD and Ångström Exponent and their monthly linear scatter plots with regression statistics (R2) are illustrated in Figure 8 and Figure 9, as well as their detailed information, including mean value (mean), observation number (N), bound values (upper and lower), and confidence intervals (CI) are listed in Table 2 and Table 3.
For Morocco, Tunisia, and Algeria, there is a detectable lessening of the Ångström type along with high AOD values owing to the yearly residue storm occasions, which blow through Sahara in the period from 2014 to 2017 as shown in Figure 8.
Egypt, on the other hand experiences higher AOD values, which corresponds with the known spring Khamsin storms, in which significant dust residues are transported from Sahara to Eastern Europe. A hot (above 40 °C) and dusty wind blows from the south or southeast in the North Africa and the Arabian Peninsula during the late winter and early spring. It blows continuously for three or four days, depositing a large amount of dust and sand over the Cairo area [65]. Besides, there is a conspicuous increase in the estimation of the Ångström exponent combined with AOD decline in the period from 2015 to 2017, which implies the strength of fine particulates because of the expansion of the quantity of vehicles and the contamination from industrial facilities.
Israel likewise experienced a critical rise in the AOD estimation in 2008, which may be caused by rapid population increase and development that have prompted rapid increase in the quantity of vehicles from 70,000 to 2,391,000 in 2008. A critical decline in the AOD estimation accompanied by Ångström exponent variance is observed thereafter because of less dependence on coal derivatives for power consumption.
Observed contamination over Kuwait and Bahrain is owed to the wide increase in the oil business because of the increasing demand in many sectors especially in the concrete industry along with the rapid development rate.
Saudi Arabia (SA) experienced an increase in the AOD values during the recent decades along with a decline in the Ångström exponent values, which is inversely related to the size of the particles. The diminishing Ångström exponent obviously shows a pattern from 2012 to 2016 toward moderately huge aerosol particles, proposing an expanded measure of a coarse mode aerosols dust and for the most part a dominant role of dust in regard to the AOD inconstancy.
The United Arab Emirates has solid provincial desert dust wellsprings of predominately-coarse mode particles as well as fine mode fractions from oil extraction and handling offices, which are situated on islands, ocean stages, and seaside districts of the Arabian Gulf. There is a clear variability in the two parameters particularly in 2012 where the observed increase in the AOD values along with the extraordinary abatement in the AE suggests the predominance of coarse mode dust aerosols which occurred again during 2017.
According to the geographical locations and R2 values, the scatterplots in Figure 9 can be grouped into four categories: (1) the stations along the Mediterranean coast with low R2 (< 0.1), including Egypt, Algeria, Israel, Tunisia; (2) the stations near the Gulf region with higher R2 (> 0.3), including UAE, Bahrain and Kuwait; (3) Saudi Arabia as the inland station with low R2 (< 0.1), and (4) Morocco situated in the Atlantic coast of Africa with higher R2 (> 0.3). It is noted that a circular effect shown in Morocco indicates different types of aerosols. This may be due to the impact of the seasonal Saharan Air Layer aerosols moving off the Africa coast [66]. This is outside the scope of the present paper, though deserves investigation in the further researches.

3.5. Modeling of the MENA Aerosol Products

Table 4 shows the results of the best model per category of the modeling methods. One of the deep neural network (DNN) is evaluated as the best model among all models with lowest R squared value of 0.63 and MAE value of 0.06. This DNN model is constructed with three hidden layers, learning rate as 0.001 and dropout rate as 0.5. The field importance normalized values (0–100% and sum to 100%) for each parameter is shown in Figure 10. It provides a measure of the relative importance of the input parameter to the other parameters to predict the objective field (AERONET AOD). The MERRA-2 (59.45%) is the most important source for the DNN model, while TERRA AOD (3.36%) as the least important. It is because the MERRA-2 model dataset is generated considering the corrections with grounds observations including AERONET.
The regression analysis of the testing dataset in Figure 11 shows the AERONET AOD observations against AOD values predicted by the selected DNN model, also including the same analysis of other five AOD products. The R squared value of DNN model is the highest (>0.52) than all of the other AOD products (0.11–0.34) with MERRA-2 as the second best product which contributes most information to the DNN model (Figure 10). The AQUA and TERRA products have the similar wide distributions of AOD ranging from 0 to over 1.0, whereas the MISR and MERRA-2 products have narrower range from 0 to 0.6. The OMI product has lowest R squared value (0.1083) and x coefficient (0.27), indicating the OMI significantly overestimate the AOD values. Similarly, the other four products also overestimated the AOD values to different extent. Instead, the DNN model matched AERONET observations well, with x coefficient close to 1 (1.0667) and intercept close to 0 (-0.0071). The analysis proved the DNN model can effectively optimize the results from the available AOD products. Similarly, the usage of DNN also has been proved to be effective to predict and estimate the other parameters related to human health and living conditions such as PM10 and precipitation [67,68].

4. Discussion

The air pollution resulted from the accelerated economic growth and urban development in the cities of MENA region further affected the health situation of the dense population. In spite of the fact that in the previous couple of years, contamination discharges have diminished as a result of financial emergencies and clashes in the area [69]. In any case, pollution levels are exponentially high, including aerosols that add to a high foundation of common particles, prompting in excess of 100,000 unexpected deaths every year in the MENA region [70]. For example, the “black cloud” occurring annually in the Greater Cairo and Nile Delta region is associated with burning of rural agriculture waste in combination with the industrial and transport emissions [27,51,71,72,73], making Cairo as the “worst” polluted city in terms of particulate matter concentrations in the World bank report for 2007 [74]. As it is illustrated in the Figure 2, even the sub regions within Cairo bore the burden of air pollutant diversely, with the advances of using high-resolution TROPOMI products, providing useful information to the administration for effective management operations. The other Figures showing distribution and intensity of air quality indictors among the countries demonstrates their relationship in an intercountry perspective, saying the air pollutants are connected and transport without the boundaries. These facts indicate the air pollution problem in the urban area is not contributed by the city and should be managed in a broader scope. However, the pattern of ozone is rather different when compared with other indicators. Further study of ozone and other pollutants is needed, but is out of the scope of this work. As the precursor of tropospheric ozone and secondary aerosols, the nitrogen oxides (NO + NO2 = NOx) play an important role in tropospheric chemistry [75]. For the MENA region, the NO2 over the urban areas is closely related to the local NOx emissions and its lifetime usually lasts several hours in urban plumes [69]. However, the lifetime of CO in the troposphere is about one month, which is long enough to have long transport with winds but enough to mix evenly throughout the atmosphere [76]. Therefore, the correlation analysis of the air pollutant species as shown in the Figure 7 should consider their lifetimes using the lagged methods; adequate data is obtained from the TROPOMI products.
In this study, Figure 9 shows the regional differences between the Mediterranean and the Gulf coast stations regarding the statistics such as R2. Both regions are rich in dust and industrial pollutant while the Mediterranean coastal regions are also more likely affected by the transporting marine aerosols such as sea salt. The lower R2 may be due to the mixture of different aerosol types in this region, where marine aerosols are usually mixed with dust and smoke yet occasionally dominating in some emerging aerosol episodes [68]. Different aerosol sources have different impacts on the urban human health related parameters, including solar radiation, air temperature, humidity, and UV exposure. Moreover, the dust aerosols as a type of air quality component are also highly vulnerable to changes in climate [77,78]. Being covered mostly by drylands, the MENA region is frequently threatened by dust storms, causing massive damages to people, agriculture, and economy [79]. The increase in temperatures and evapotranspiration, change in precipitation regime, intensification or change in frequencies of extreme events can directly trigger or enhance the desertification processes [39]. For example, dust loads have been increasing because of the Fertile Crescent drought in the last decade in the MENA region. In addition, even though natural variations, such as a swing back to wetter phases of the Pacific Decadal Oscillation (PDO) and El Niño/Southern Oscillation (ENSO) patterns, may temporarily relieve drought conditions and reduce the frequency of dust storms currently plaguing the Arabian Peninsula, long-term climate models indicate temperatures in the region will continue to rise, in response to rising levels of greenhouse gases, and the hot, dry trend will continue, leading to an overall increase in the number of significant regional dust events [80]. Then again, the dust could likewise affect the climate through: (1) vary the energy balance of the Earth-Atmospheric system through changing radiative driving [81,82]; (2) lead to contrasts in cloud microphysics and its radiative properties [82]; (3) diminish the snow albedo through dust deposition [83,84,85,86,87]; (4) increased mineral supplement supply to the seas, thereby upgrading the development of marine phytoplankton. Since the center of the twentieth century, the yearly number of strangely hot days and evenings in the Middle East has officially expanded through the number of cool days and evenings has diminished essentially [82]. The impact of aerosols on the climate change will in turn affect the human welfare and living environment. This situation requires more accurate analysis and monitoring of the dust aerosol products, which the application of recent breakthrough of machine learning tools and methods can generate optimized satellite-based products in order to improve our understanding of aerosol characteristics and its impact on the climate studies.

5. Conclusions

This study expands on creating more synergistic activities between new satellite observations, namely Sentinal-5P sensors in association with more accurate ground-based AERONET observations covering the MENA region. In this research, our approach revealed the air pollutants impact on urban and human health in the region under investigation during 2018–2019. Generally, the ground-based derived AOD values show a varying dust behavior over the region, yet with an inclining trend in the most recent years over some of the countries in the region. We believe that these increases exhibit extra anthropogenic airborne discharges, where these raised residue outflows are more likely to be identified with dry spell conditions associated with high temperatures. The newly available data from TROPOMI on board Sentinel-5 Precursor, shows annual mean high resolution maps of selected air quality indicators of the MENA countries for the first time. Meanwhile, the DNN model built from multiple satellite-borne AOD products can predict the surface AOD values with better correlation to ground AOD observations. We demonstrate how advances in machine learning methodology substantially improves satellite-derived AOD products for dust and air pollution modeling. It also suggests that the use of machine learning models will be an important supplement to extend our knowledge of aerosol variability in the MENA regions.

Author Contributions

Conceptualization, M.E.-N., H.E.-A. and W.L.; data analysis, M.E.-N. and W.L.; funding acquisition, H.E.-A.; methodology, H.E.-A., W.L., M.A.A. and M.E.-N.; validation, H.E.-A., A.R.M., W.L.; writing—original draft, W.L. and M.E.-N.; writing—review and editing, H.E.-A., W.L., M.E.-N., A.R.M. and M.A.A.

Funding

This research was partly funded by the COST Action “InDust” under grant agreement CA16202, supported by COST (European Cooperation in Science and Technology) and more specifically the Short Term Scientific Mission project “Finding”.

Acknowledgments

The authors would like to thank the AERONET team for calibrating and maintaining instrumentation and processing these data.

Conflicts of Interest

The authors declare no conflict of interest.

References

  1. WHO. Urban Air Pollution Database; WHO: Geneva, Switzerland, 2016. [Google Scholar]
  2. AFED. Arab Environment in 10 Years. Annual Report of Arab Forum for Environment and Development; Saab, N., Ed.; AFED: Beirut, Lebanon, 2017. [Google Scholar]
  3. Ramsey, L. Business Insider. May 2016. Available online: http://www.businessinsider.com/the-cities-with-the-worlds-worst-air-pollution-who-2016-5 (accessed on 15 June 2019).
  4. World Bank. The Little Green Data Book 2016; The World Bank: Washington, DC, USA, 2016; ISBN 978-1-4648-0928-6. [Google Scholar]
  5. AFED; Chaaban, F.B. Air Quality, Arab Forum for Environment and Development (AFED). Arab Environment; Future Challenges; AFED: Bejrut, Lebanon, 2008. [Google Scholar]
  6. Sami, S.; Khonji, T. Traffic Blamed for Air Pollution in Bahrain; Daily Gulf News: Dubai, UAE, 2006. [Google Scholar]
  7. GHG Equivalence Calculator, USEPA. Available online: www.epa.gov/energy (accessed on 15 June 2019).
  8. MadaMasr Study. Air pollution kills 35,000 a year in Egypt, with dust the biggest culprit. 21 September 2015. Available online: http://www.madamasr.com/en/2015/09/21/news/u/study-air-pollution-kills-35000-a-year-in- egypt-with-dust-the-biggest-culprit/ (accessed on 15 June 2019).
  9. Abdalla, K. Health and Environmental Benefits of Clean Fuels and Vehicles; UN DESA: Cairo, Egypt, 2006. [Google Scholar]
  10. Aboel Fetouh, Y.; El Askary, H.; El Raey, M.; Allali, M.; Sprigg, W.A.; Kafatos, M. Annual patterns of atmospheric pollutions and episodes over Cairo Egypt. Adv. Meteorol. 2013, 2013, 1–11. [Google Scholar] [CrossRef]
  11. IPCC Report. The Fourth Assessment Report (AR4). Available online: http:/www.ipcc.ch/ (accessed on 14 March 2008).
  12. Thalib, L.; Al-Taiar, A. Dust storms and the risk of asthma admissions to hospitals in Kuwait. Sci. Total. Environ. 2012, 433, 347–351. [Google Scholar] [CrossRef] [PubMed]
  13. Bousquet, J.; Ndiaye, M.; Aït-Khaled, N.; Annesi-Maesano, I.; Vignola, A.-M. Management of chronic respiratory and allergic diseases in developing countries. Focus on sub-Saharan Africa. Allergy 2003, 58, 265–283. [Google Scholar] [CrossRef] [PubMed]
  14. Levelt, P.F.; Hilsenrath, E.; Leppelmeier, G.W.; van den Oord, G.H.J.; Bhartia, P.K.; Tamminen, J.; de Haan, J.F.; Veefkind, J.P. Science objectives of the ozone monitoring instrument. IEEE Trans. Geosci. Remote Sens. 2006, 44, 1199–1208. [Google Scholar] [CrossRef]
  15. Levelt, P.F.; van den Oord, G.H.J.; Dobber, M.R.; Malkki, A.; Visser, H.; de Johan, V.; Stammes, P.; Lundell, J.O.V.; Saari, H. The ozone monitoring instrument. IEEE Trans. Geosci. Remote Sens. 2006, 44, 1093–1101. [Google Scholar] [CrossRef]
  16. Astitha, M.; Lelieveld, J.; Abdel Kader, M.; Pozzer, A.; de Meij, A. Parameterization of dust emissions in the global atmospheric chemistry-climate model EMAC: Impact of nudging and soil properties. Atmos. Chem. Phys. 2012, 12, 11057–11083. [Google Scholar] [CrossRef]
  17. Hsu, N.C.; Gautam, R.; Sayer, A.M.; Bettenhausen, C.; Li, C.; Jeong, M.J.; Tsay, S.-C.; Holben, B.N. Global and regional trends of aerosol optical depth over land and ocean using SeaWiFS measurements from 1997 to 2010. Atmos. Chem. Phys. 2012, 12, 8037–8053. [Google Scholar] [CrossRef] [Green Version]
  18. Todd, M.C.; Washington, R.; Martins, J.V.; Dubovik, O.; Lizcano, G.; M’Bainayel, S.; Engelstaedter, S. Mineral dust emission from the Bodélé Depression, Northern Chad, during BoDEx 2005. J. Geophys. Res. 2007, 112. [Google Scholar] [CrossRef]
  19. Baker, A.R.; Croot, P.L. Atmospheric and marine controls on aerosol iron solubility in seawater. Mar. Chem. 2010, 120, 4–13. [Google Scholar] [CrossRef]
  20. Schladitz, A.; Müller, T.; Nowak, A.; Kandler, K.; Lieke, K.; Massling, A.; Wiedensohler, A. In situ aerosol characterization at Cape Verde: Part 1: Particle number size distributions, hygroscopic growth and state of mixing of the marine and Saharan dust aerosol. Tellus B Chem. Phys. Meteorol. 2011, 63, 531–548. [Google Scholar] [CrossRef]
  21. Sadiq, M.; McCain, J.C. (Eds.) The Gulf War Aftermath; Environment & Assessment; Springer Netherlands: Dordrecht, The Netherlands, 1993; Volume 4, ISBN 978-94-010-4737-1. [Google Scholar]
  22. Farahat, A. Air pollution in the Arabian Peninsula (Saudi Arabia, the UAE, Kuwait, Qatar, Bahrain, and Oman): Causes, effects, and aerosol categorization. Arab. J. Geosci. 2016, 9, 196. [Google Scholar] [CrossRef]
  23. Chin, M.; Diehl, T.; Tan, Q.; Prospero, J.M.; Kahn, R.A.; Remer, L.A.; Yu, H.; Sayer, A.M.; Bian, H.; Geogdzhayev, I.V.; et al. Multi-decadal aerosol variations from 1980 to 2009: A perspective from observations and a global model. Atmos. Chem. Phys. 2014, 14, 3657–3690. [Google Scholar] [CrossRef]
  24. Ramanathan, V.; Cess, R.D.; Harrison, E.F.; Minnis, P.; Barkstrom, B.R.; Ahmad, E.; Hartmann, D. Cloud-radiative forcing and climate: Results from the earth radiation budget experiment. Science 1989, 243, 57–63. [Google Scholar] [CrossRef] [PubMed]
  25. Satheesh, S.; Krishnamoorthy, K. Radiative effects of natural aerosols: A review. Atmos. Environ. 2005, 39, 2089–2110. [Google Scholar] [CrossRef]
  26. Farahat, A.; El-Askary, H.; Al-Shaibani, A. Study of aerosols’ characteristics and dynamics over the Kingdom of Saudi Arabia using a multisensor approach combined with ground observations. Adv. Meteorol. 2015, 2015, 1–12. [Google Scholar] [CrossRef]
  27. El-Askary, H.; Farouk, R.; Ichoku, C.; Kafatos, M. Transport of dust and anthropogenic aerosols across Alexandria, Egypt. Ann. Geophys. 2009, 27, 2869–2879. [Google Scholar] [CrossRef] [Green Version]
  28. Ansmann, A.; Seifert, P.; Tesche, M.; Wandinger, U. Profiling of fine and coarse particle mass: Case studies of Saharan dust and Eyjafjallajökull/Grimsvötn volcanic plumes. Atmos. Chem. Phys. 2012, 12, 9399–9415. [Google Scholar] [CrossRef]
  29. Yu, Y.; Notaro, M.; Liu, Z.; Wang, F.; Alkolibi, F.; Fadda, E.; Bakhrjy, F. Climatic controls on the interannual to decadal variability in Saudi Arabian dust activity: Toward the development of a seasonal dust prediction model: Saudi Arabian dust prediction. J. Geophys. Res. Atmos. 2015, 120, 1739–1758. [Google Scholar] [CrossRef]
  30. Farahat, A.; El-Askary, H.; Dogan, A.U. Aerosols size distribution characteristics and role of precipitation during dust storm formation over Saudi Arabia. Aerosol. Air Qual. Res. 2016, 16, 2523–2534. [Google Scholar] [CrossRef]
  31. Solomos, S.; Ansmann, A.; Mamouri, R.-E.; Binietoglou, I.; Patlakas, P.; Marinou, E.; Amiridis, V. Remote sensing and modelling analysis of the extreme dust storm hitting the Middle East and eastern Mediterranean in September 2015. Atmos. Chem. Phys. 2017, 17, 4063–4079. [Google Scholar] [CrossRef] [Green Version]
  32. Ginoux, P.; Chin, M.; Tegen, I.; Prospero, J.M.; Holben, B.; Dubovik, O.; Lin, S.-J. Sources and distributions of dust aerosols simulated with the GOCART model. J. Geophys. Res. Atmos. 2001, 106, 20255–20273. [Google Scholar] [CrossRef]
  33. Kim, D.; Chin, M.; Yu, H.; Eck, T.F.; Sinyuk, A.; Smirnov, A.; Holben, B.N. Dust optical properties over North Africa and Arabian Peninsula derived from the AERONET dataset. Atmos. Chem. Phys. 2011, 11, 10733–10741. [Google Scholar] [CrossRef] [Green Version]
  34. Rockström, J.; Steffen, W.L.; Noone, K.; Persson, Å.; Chapin, F.S., III; Lambin, E.; Nykvist, B. Planetary boundaries: Exploring the safe operating space for humanity. Ecol. Soc. 2009, 14, 32. [Google Scholar] [CrossRef]
  35. Vörösmarty, C.J.; McIntyre, P.B.; Gessner, M.O.; Dudgeon, D.; Prusevich, A.; Green, P.; Glidden, S.; Bunn, S.E.; Sullivan, C.A.; Liermann, C.R.; et al. Global threats to human water security and river biodiversity. Nature 2010, 467, 555–561. [Google Scholar] [CrossRef] [PubMed]
  36. Droogers, P.; de Boer, F.; Terink, W. Water allocation models for the Umbeluzi River Basin, Mozambique. In Wetter Skip Frystan and ARA-Sul Report Future Water; ARA-Sul: Maputo, Mozambique, 2014; Volume 132. [Google Scholar]
  37. Veefkind, J.P.; Aben, I.; McMullan, K.; Förster, H.; de Vries, J.; Otter, G.; Claas, J.; Eskes, H.J.; de Haan, J.F.; Kleipool, Q.; et al. TROPOMI on the ESA Sentinel-5 Precursor: A GMES mission for global observations of the atmospheric composition for climate, air quality and ozone layer applications. Remote Sens. Environ. 2012, 120, 70–83. [Google Scholar] [CrossRef]
  38. Gorelick, N.; Hancher, M.; Dixon, M.; Ilyushchenko, S.; Thau, D.; Moore, R. Google earth engine: Planetary-scale geospatial analysis for everyone. Remote Sens. Environ. 2017, 202, 18–27. [Google Scholar] [CrossRef]
  39. Li, W.; El-Askary, H.M.; Qurban, M.; Allali, M.; Manikandan, K.P. On the drying trends over the MENA countries using harmonic analysis of the enhanced vegetation index. In Advances in Remote Sensing and Geo Informatics Applications; El-Askary, H.M., Lee, S., Heggy, E., Pradhan, B., Eds.; Springer International Publishing: Cham, Switzerland, 2019; pp. 243–245. ISBN 978-3-030-01439-1. [Google Scholar]
  40. El-Askary, H.M.; Li, W.; El-Nadry, M.; Awad, M.; Mostafa, A.R. Strong interactions indicated between dust aerosols and precipitation related clouds in the Nile Delta. In Advances in Remote Sensing and Geo Informatics Applications; El-Askary, H.M., Lee, S., Heggy, E., Pradhan, B., Eds.; Springer International Publishing: Cham, Switzerland, 2019; pp. 3–6. ISBN 978-3-030-01439-1. [Google Scholar]
  41. Li, W.; El-Askary, H.; Qurban, M.A.; Li, J.; ManiKandan, K.P.; Piechota, T. Using multi-indices approach to quantify mangrove changes over the Western Arabian Gulf along Saudi Arabia coast. Ecol. Indic. 2019, 102, 734–745. [Google Scholar] [CrossRef]
  42. Holben, B.N.; Eck, T.F.; Slutsker, I.; Tanré, D.; Buis, J.P.; Setzer, A.; Vermote, E.; Reagan, J.A.; Kaufman, Y.J.; Nakajima, T.; et al. AERONET—A federated instrument network and data archive for aerosol characterization. Remote Sens. Environ. 1998, 66, 1–16. [Google Scholar] [CrossRef]
  43. Smirnov, A.; Holben, B.N.; Eck, T.F.; Dubovik, O.; Slutsker, I. Cloud-screening and quality control algorithms for the AERONET database. Remote Sens. Environ. 2000, 73, 337–349. [Google Scholar] [CrossRef]
  44. Dubovik, O.; Smirnov, A.; Holben, B.N.; King, M.D.; Kaufman, Y.J.; Eck, T.F.; Slutsker, I. Accuracy assessments of aerosol optical properties retrieved from aerosol robotic network (AERONET) sun and sky radiance measurements. J. Geophys. Res. Atmos. 2000, 105, 9791–9806. [Google Scholar] [CrossRef]
  45. Smirnov, A.; Holben, B.N.; Kaufman, Y.J.; Dubovik, O.; Eck, T.F.; Slutsker, I.; Pietras, C.; Halthore, R.N. Optical properties of atmospheric aerosol in maritime environments. J. Atmos. Sci. 2002, 59, 501–523. [Google Scholar] [CrossRef]
  46. Kahn, R.A. Multiangle imaging spectroradiometer (MISR) global aerosol optical depth validation based on 2 years of coincident aerosol robotic network (AERONET) observations. J. Geophys. Res. 2005, 110. [Google Scholar] [CrossRef]
  47. Kokhanovsky, A.A.; Breon, F.-M.; Cacciari, A.; Carboni, E.; Diner, D.; Di Nicolantonio, W.; Grainger, R.G.; Grey, W.M.F.; Höller, R.; Lee, K.-H.; et al. Aerosol remote sensing over land: A comparison of satellite retrievals using different algorithms and instruments. Atmos. Res. 2007, 85, 372–394. [Google Scholar] [CrossRef]
  48. Liu, L.; Mishchenko, M.I. Toward unified satellite climatology of aerosol properties: Direct comparisons of advanced level 2 aerosol products. J. Quant. Spectrosc. Radiat. Transf. 2008, 109, 2376–2385. [Google Scholar] [CrossRef]
  49. Mishchenko, M.I.; Geogdzhayev, I.V.; Liu, L.; Lacis, A.A.; Cairns, B.; Travis, L.D. Toward unified satellite climatology of aerosol properties: What do fully compatible MODIS and MISR aerosol pixels tell us? J. Quant. Spectrosc. Radiat. Transf. 2009, 110, 402–408. [Google Scholar] [CrossRef]
  50. Chin, M. Atmospheric Aerosol Properties and Climate Impacts; Diane Publishing: Collingdale, PA, USA, 2009. [Google Scholar]
  51. Marey, H.S.; Gille, J.C.; El-Askary, H.M.; Shalaby, E.A.; El-Raey, M.E. Study of the formation of the black cloud and its dynamics over Cairo, Egypt, using MODIS and MISR sensors. J. Geophys. Res. 2010, 115. [Google Scholar] [CrossRef]
  52. Kahn, R.A.; Gaitley, B.J.; Garay, M.J.; Diner, D.J.; Eck, T.F.; Smirnov, A.; Holben, B.N. Multiangle imaging spectroradiometer global aerosol product assessment by comparison with the Aerosol Robotic Network. J. Geophys. Res. 2010, 115. [Google Scholar] [CrossRef]
  53. Kaufman, Y.J.; Tanré, D.; Remer, L.A.; Vermote, E.F.; Chu, A.; Holben, B.N. Operational remote sensing of tropospheric aerosol over land from EOS moderate resolution imaging spectroradiometer. J. Geophys. Res. Atmos. 1997, 102, 17051–17067. [Google Scholar] [CrossRef]
  54. Remer, L.A.; Kaufman, Y.J.; Tanré, D.; Mattoo, S.; Chu, D.A.; Martins, J.V.; Li, R.-R.; Ichoku, C.; Levy, R.C.; Kleidman, R.G.; et al. The MODIS aerosol algorithm, products, and validation. J. Atmos. Sci. 2005, 62, 947–973. [Google Scholar] [CrossRef]
  55. Mishchenko, M.I.; Geogdzhayev, I.V. Satellite remote sensing reveals regional tropospheric aerosol trends. Opt. Express 2007, 15, 7423. [Google Scholar] [CrossRef]
  56. Just, A.; De Carli, M.; Shtein, A.; Dorman, M.; Lyapustin, A.; Kloog, I. Correcting measurement error in satellite aerosol optical depth with machine learning for modeling PM2.5 in the Northeastern USA. Remote Sens. 2018, 10, 803. [Google Scholar] [CrossRef]
  57. Lanzaco, B.L.; Olcese, L.E.; Palancar, G.G.; Toselli, B.M. An improved aerosol optical depth map based on machine-learning and MODIS data: Development and application in South America. Aerosol Air Qual. Res. 2017, 17, 1623–1636. [Google Scholar] [CrossRef]
  58. Qin, W.; Wang, L.; Lin, A.; Zhang, M.; Bilal, M. Improving the estimation of daily aerosol optical depth and aerosol radiative effect using an optimized artificial neural network. Remote Sens. 2018, 10, 1022. [Google Scholar] [CrossRef]
  59. García, R.D.; García, O.E.; Cuevas, E.; Cachorro, V.E.; Barreto, A.; Guirado-Fuentes, C.; Kouremeti, N.; Bustos, J.J.; Romero-Campos, P.M.; de Frutos, A.M. Aerosol optical depth retrievals at the Izaña atmospheric observatory from 1941 to 2013 by using artificial neural networks. Atmos. Meas. Tech. 2016, 9, 53–62. [Google Scholar] [CrossRef]
  60. Hutter, F.; Hoos, H.H.; Leyton-Brown, K. Sequential model-based optimization for general algorithm configuration. In Learning and Intelligent Optimization; Coello, C.A.C., Ed.; Springer: Berlin/Heidelberg, Germany, 2011; Volume 6683, pp. 507–523. ISBN 978-3-642-25565-6. [Google Scholar]
  61. Xu, Q.-S.; Liang, Y.-Z. Monte Carlo cross validation. Chemom. Intell. Lab. Syst. 2001, 56, 1–11. [Google Scholar] [CrossRef]
  62. Breiman, L. Bagging predictors. Mach. Learn. 1996, 24, 123–140. [Google Scholar] [CrossRef] [Green Version]
  63. Tin, K.H. Random decision forests. In Proceedings of the 3rd International Conference on Document Analysis and Recognition, Montreal, QC, Canada, 14–16 August 1995; Volume 1, pp. 278–282. [Google Scholar]
  64. Neu, J.L.; Flury, T.; Manney, G.L.; Santee, M.L.; Livesey, N.J.; Worden, J. Tropospheric ozone variations governed by changes in stratospheric circulation. Nat. Geosci. 2014, 7, 340–344. [Google Scholar] [CrossRef]
  65. Salam, M.S.A.; Sowelim, M.A. Dustfall caused by the spring khamasin storms in cairo: A preliminary report. Atmos. Environ. 1967 1967, 1, 221–226. [Google Scholar] [CrossRef]
  66. Carlson, T.N.; Prospero, J.M. The large-scale movement of Saharan Air outbreaks over the Northern Equatorial Atlantic. J. Appl. Meteorol. 1972, 11, 283–297. [Google Scholar] [CrossRef]
  67. Le, J.A.; El-Askary, H.M.; Allali, M.; Struppa, D.C. Application of recurrent neural networks for drought projections in California. Atmos. Res. 2017, 188, 100–106. [Google Scholar] [CrossRef] [Green Version]
  68. Li, W.; Ali, E.; Abou El-Magd, I.; Mourad, M.M.; El-Askary, H. Studying the impact on urban health over the greater delta region in Egypt due to aerosol variability using optical characteristics from satellite observations and ground-based AERONET measurements. Remote Sens. 2019, 11, 1998. [Google Scholar] [CrossRef]
  69. Lelieveld, J.; Beirle, S.; Hörmann, C.; Stenchikov, G.; Wagner, T. Abrupt recent trend changes in atmospheric nitrogen dioxide over the Middle East. Sci. Adv. 2015, 1, e1500498. [Google Scholar] [CrossRef] [PubMed] [Green Version]
  70. Giannadaki, D.; Pozzer, A.; Lelieveld, J. Modeled global effects of airborne desert dust on air quality and premature mortality. Atmos. Chem. Phys. 2014, 14, 957–968. [Google Scholar] [CrossRef] [Green Version]
  71. Marey, H.S.; Gille, J.C.; El-Askary, H.M.; Shalaby, E.A.; El-Raey, M.E. Aerosol climatology over Nile Delta based on MODIS, MISR and OMI satellite data. Atmos. Chem. Phys. 2011, 11, 10637–10648. [Google Scholar] [CrossRef] [Green Version]
  72. El-Askary, H.; Kafatos, M. Dust storm and black cloud influence on aerosol optical properties over Cairo and the Greater Delta region, Egypt. Int. J. Remote Sens. 2008, 29, 7199–7211. [Google Scholar] [CrossRef]
  73. Prasad, A.K.; El-Askary, H.; Kafatos, M. Implications of high altitude desert dust transport from Western Sahara to Nile Delta during biomass burning season. Environ. Pollut. 2010, 158, 3385–3391. [Google Scholar] [CrossRef]
  74. The World Bank. World Development Indicators; The World Bank: Washington, DC, USA, 2007. [Google Scholar]
  75. Jacob, D.J.; Heikes, E.G.; Fan, S.-M.; Logan, J.A.; Mauzerall, D.L.; Bradshaw, J.D.; Singh, H.B.; Gregory, G.L.; Talbot, R.W.; Blake, D.R.; et al. Origin of ozone and NO× in the tropical troposphere: A photochemical analysis of aircraft observations over the South Atlantic basin. J. Geophys. Res. Atmos. 1996, 101, 24235–24250. [Google Scholar] [CrossRef]
  76. Voiland, A. Fourteen Years of Carbon Monoxide from MOPITT. Available online: https://climate.nasa.gov /news/2291/fourteen-years-of-ca rbon-monoxide-from-mopitt/ (accessed on 18 August 2019).
  77. Mahowald, N.M.; Muhs, D.R.; Levis, S.; Rasch, P.J.; Yoshioka, M.; Zender, C.S.; Luo, C. Change in atmospheric mineral aerosols in response to climate: Last glacial period, preindustrial, modern, and doubled carbon dioxide climates: DUST RESPONSE TO CLIMATE. J. Geophys. Res. Atmos. 2006, 111. [Google Scholar] [CrossRef]
  78. Lambert, F.; Delmonte, B.; Petit, J.R.; Bigler, M.; Kaufmann, P.R.; Hutterli, M.A.; Stocker, T.F.; Ruth, U.; Steffensen, J.P.; Maggi, V. Dust-climate couplings over the past 800,000 years from the EPICA dome C ice core. Nature 2008, 452, 616–619. [Google Scholar] [CrossRef]
  79. Kumar, A. Natural hazards of the Arabian Peninsula: Their causes and possible remediation. In Earth System Processes and Disaster Management; Sinha, R., Ravindra, R., Eds.; Springer: Berlin/Heidelberg, Germany, 2013; pp. 155–180. ISBN 978-3-642-28844-9. [Google Scholar]
  80. Notaro, M.; Yu, Y.; Kalashnikova, O.V. Regime shift in Arabian dust activity, triggered by persistent Fertile Crescent drought: REGIME SHIFT IN ARABIAN DUST. J. Geophys. Res. Atmos. 2015, 120, 10229–10249. [Google Scholar] [CrossRef]
  81. Haywood, J.M. Can desert dust explain the outgoing longwave radiation anomaly over the Sahara during July 2003? J. Geophys. Res. 2005, 110. [Google Scholar] [CrossRef]
  82. Intergovernmental Panel on Climate Change (Ed.) Climate Change 2013—The Physical Science Basis: Working Group I Contribution to the Fifth Assessment Report of the Intergovernmental Panel on Climate Change; Cambridge University Press: Cambridge, UK, 2014; ISBN 978-1-107-41532-4. [Google Scholar]
  83. Hadley, O.L.; Kirchstetter, T.W. Black-carbon reduction of snow albedo. Nat. Clim. Change 2012, 2, 437–440. [Google Scholar] [CrossRef]
  84. Lee, W.-L.; Liou, K.N. Effect of absorbing aerosols on snow albedo reduction in the Sierra Nevada. Atmos. Environ. 2012, 55, 425–430. [Google Scholar] [CrossRef]
  85. Prasad, A.K.; Elaskary, H.M.; Asrar, G.R.; Kafatos, M.; Jaswal, A. Melting of major glaciers in Himalayas: Role of desert dust and anthropogenic aerosols. In Planet Earth 2011—Global Warming Challenges and Opportunities for Policy and Practice; IntechOpen: London, UK, 2011. [Google Scholar]
  86. El-Askary, H.; Li, J.; Li, W.; Piechota, T.; Ta, T.; Jong, A.; Zhang, X.; Yang, T. Impacts of aerosols on the retreat of the Sierra Nevada Glaciers in California. Aerosol Air Qual. Res. 2018, 18, 1317–1330. [Google Scholar] [CrossRef]
  87. Prasad, A.K.; Yang, K.H.S.; El-Askary, H.M.; Kafatos, M. Melting of major Glaciers in the western Himalayas: Evidence of climatic changes from long term MSU derived tropospheric temperature trend (1979–2008). Ann. Geophys. 2009, 27, 4505–4519. [Google Scholar] [CrossRef]
Figure 1. Location and topography map shows the selected countries of Middle East and North Africa (MENA) region, background image from Google Earth.
Remotesensing 11 02096 g001
Figure 2. Time series of air quality indicators (CO, SO2, NO2, O3, and UVAI) over three locations within the urban Cairo from March 1 till April 30, 2019.
Remotesensing 11 02096 g002
Figure 3. The maps of the TROPOMI (UVAI, CO, NO2, O3 SO2) and MERRA-2 AOD distribution of each season in the MENA region.
Remotesensing 11 02096 g003aRemotesensing 11 02096 g003b
Figure 4. The annually averaged CO distribution map of nine MENA countries (from left to right, top to bottom: Algeria, Bahrain, Egypt, Israel, Kuwait, Morocco, Saudi Arabia, Tunisia, and UAE) from July 11, 2018 till July 10, 2019.
Remotesensing 11 02096 g004
Figure 5. The annually averaged NO2 distribution map of the nine MENA countries (from left to right, top to bottom: Algeria, Bahrain, Egypt, Israel, Kuwait, Morocco, Saudi Arabia, Tunisia, and UAE) from July 11, 2018 till July 10, 2019.
Remotesensing 11 02096 g005
Figure 6. The annually averaged UVAI distribution map of the nine MENA countries (from left to right, top to bottom: Algeria, Bahrain, Egypt, Israel, Kuwait, Morocco, Saudi Arabia, Tunisia, and UAE) from July 11, 2018 till July 10, 2019.
Remotesensing 11 02096 g006
Figure 7. The correlation maps of the daily anomalies values for (a) NO2 and CO; (b) CO and UVAI, and (c) NO2 and UVAI, from July 11, 2018 till July 10, 2019.
Remotesensing 11 02096 g007
Figure 8. The relationship between the aerosol optical depth and Ångström exponent in the MENA region.
Remotesensing 11 02096 g008
Figure 9. Scatter plot for the MENA region countries for the relationship between the Ang400-870 and the AOD550.
Remotesensing 11 02096 g009
Figure 10. The field importance of parameters for the deep neural network (DNN) model.
Remotesensing 11 02096 g010
Figure 11. Comparison of DNN model to the other Satellite/Models vs. AERONET for the MENA region countries.
Remotesensing 11 02096 g011
Table 1. The location of the nine selected AERONET stations.
StationsPeriod of Available DataLatitudeLongitude
Morocco (Dhakla)February2012–December201723.717N15.950W
Tunisia (Ben salem)June2013–December201735.551N9.914E
Algeria (Blida)October2003–January201736.508N2.881E
Egypt (Cairo EMA)April2010–December201730.081N31.290E
Israel (Nes-Ziona)October1999–December201731.922N34.789E
Bahrain (Bahrain)October1998–October200626.208N50.609E
Kuwait (Kuwait Airport)June2006–December201729.325N47.971E
Saudi-Arabia (Solar Village)February1999–May201324.907N43.397E
UAE (Dhabi)October2003–August201724.476N54.329E
Table 2. Detailed information of aerosol optical depth (AOD) in Figure 9.
CountryMoroccoAlgeriaTunisiaEgyptIsraelKuwaitBahrainSAUAE
Mean0.310.230.170.390.230.450.380.440.41
N1081455593172475167117
STDEV0.130.140.050.060.070.180.100.180.17
Upper0.330.250.190.400.240.500.400.480.44
Lower0.280.200.160.380.220.400.350.390.38
CI0.28–0.330.20–0.240.16–0.180.37–0.400.22–0.240.39–0.490.34–0.400.39–0.470.37–0.43
Table 3. Detailed information of Ångström exponent in Figure 9.
CountryMoroccoAlgeriaTunisiaEgyptIsraelKuwaitBahrainSAUAE
Mean0.510.760.861.031.010.550.820.650.78
N1081455593172475167124
STDEV0.180.370.180.160.260.300.300.270.32
Upper0.540.820.911.061.040.640.900.720.84
Lower0.470.700.810.990.970.460.740.590.72
CI0.47–0.530.70–0820.81–0.900.99–1.050.96–1.040.46–0.630.73–0.890.58–0.710.72–0.83
Table 4. The selected model per category.
RankingAlgorithm NameR SquaredMAE
1Deep Neural Network0.626280.06399
2Random Decision Forest0.559970.07530
3Linear Regression0.350810.08013
4Decision Tree0.243460.08129

