Satellite Earth Observation Data in Epidemiological Modeling of Malaria, Dengue and West Nile Virus: A Scoping Review

 , ,
, , 


Abstract
1. Introduction
1.1. Malaria
1.2. Dengue
1.3. West Nile Virus
2. Material and Methods
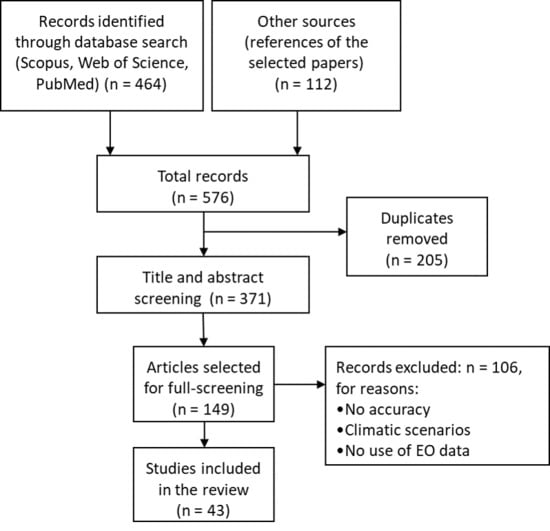
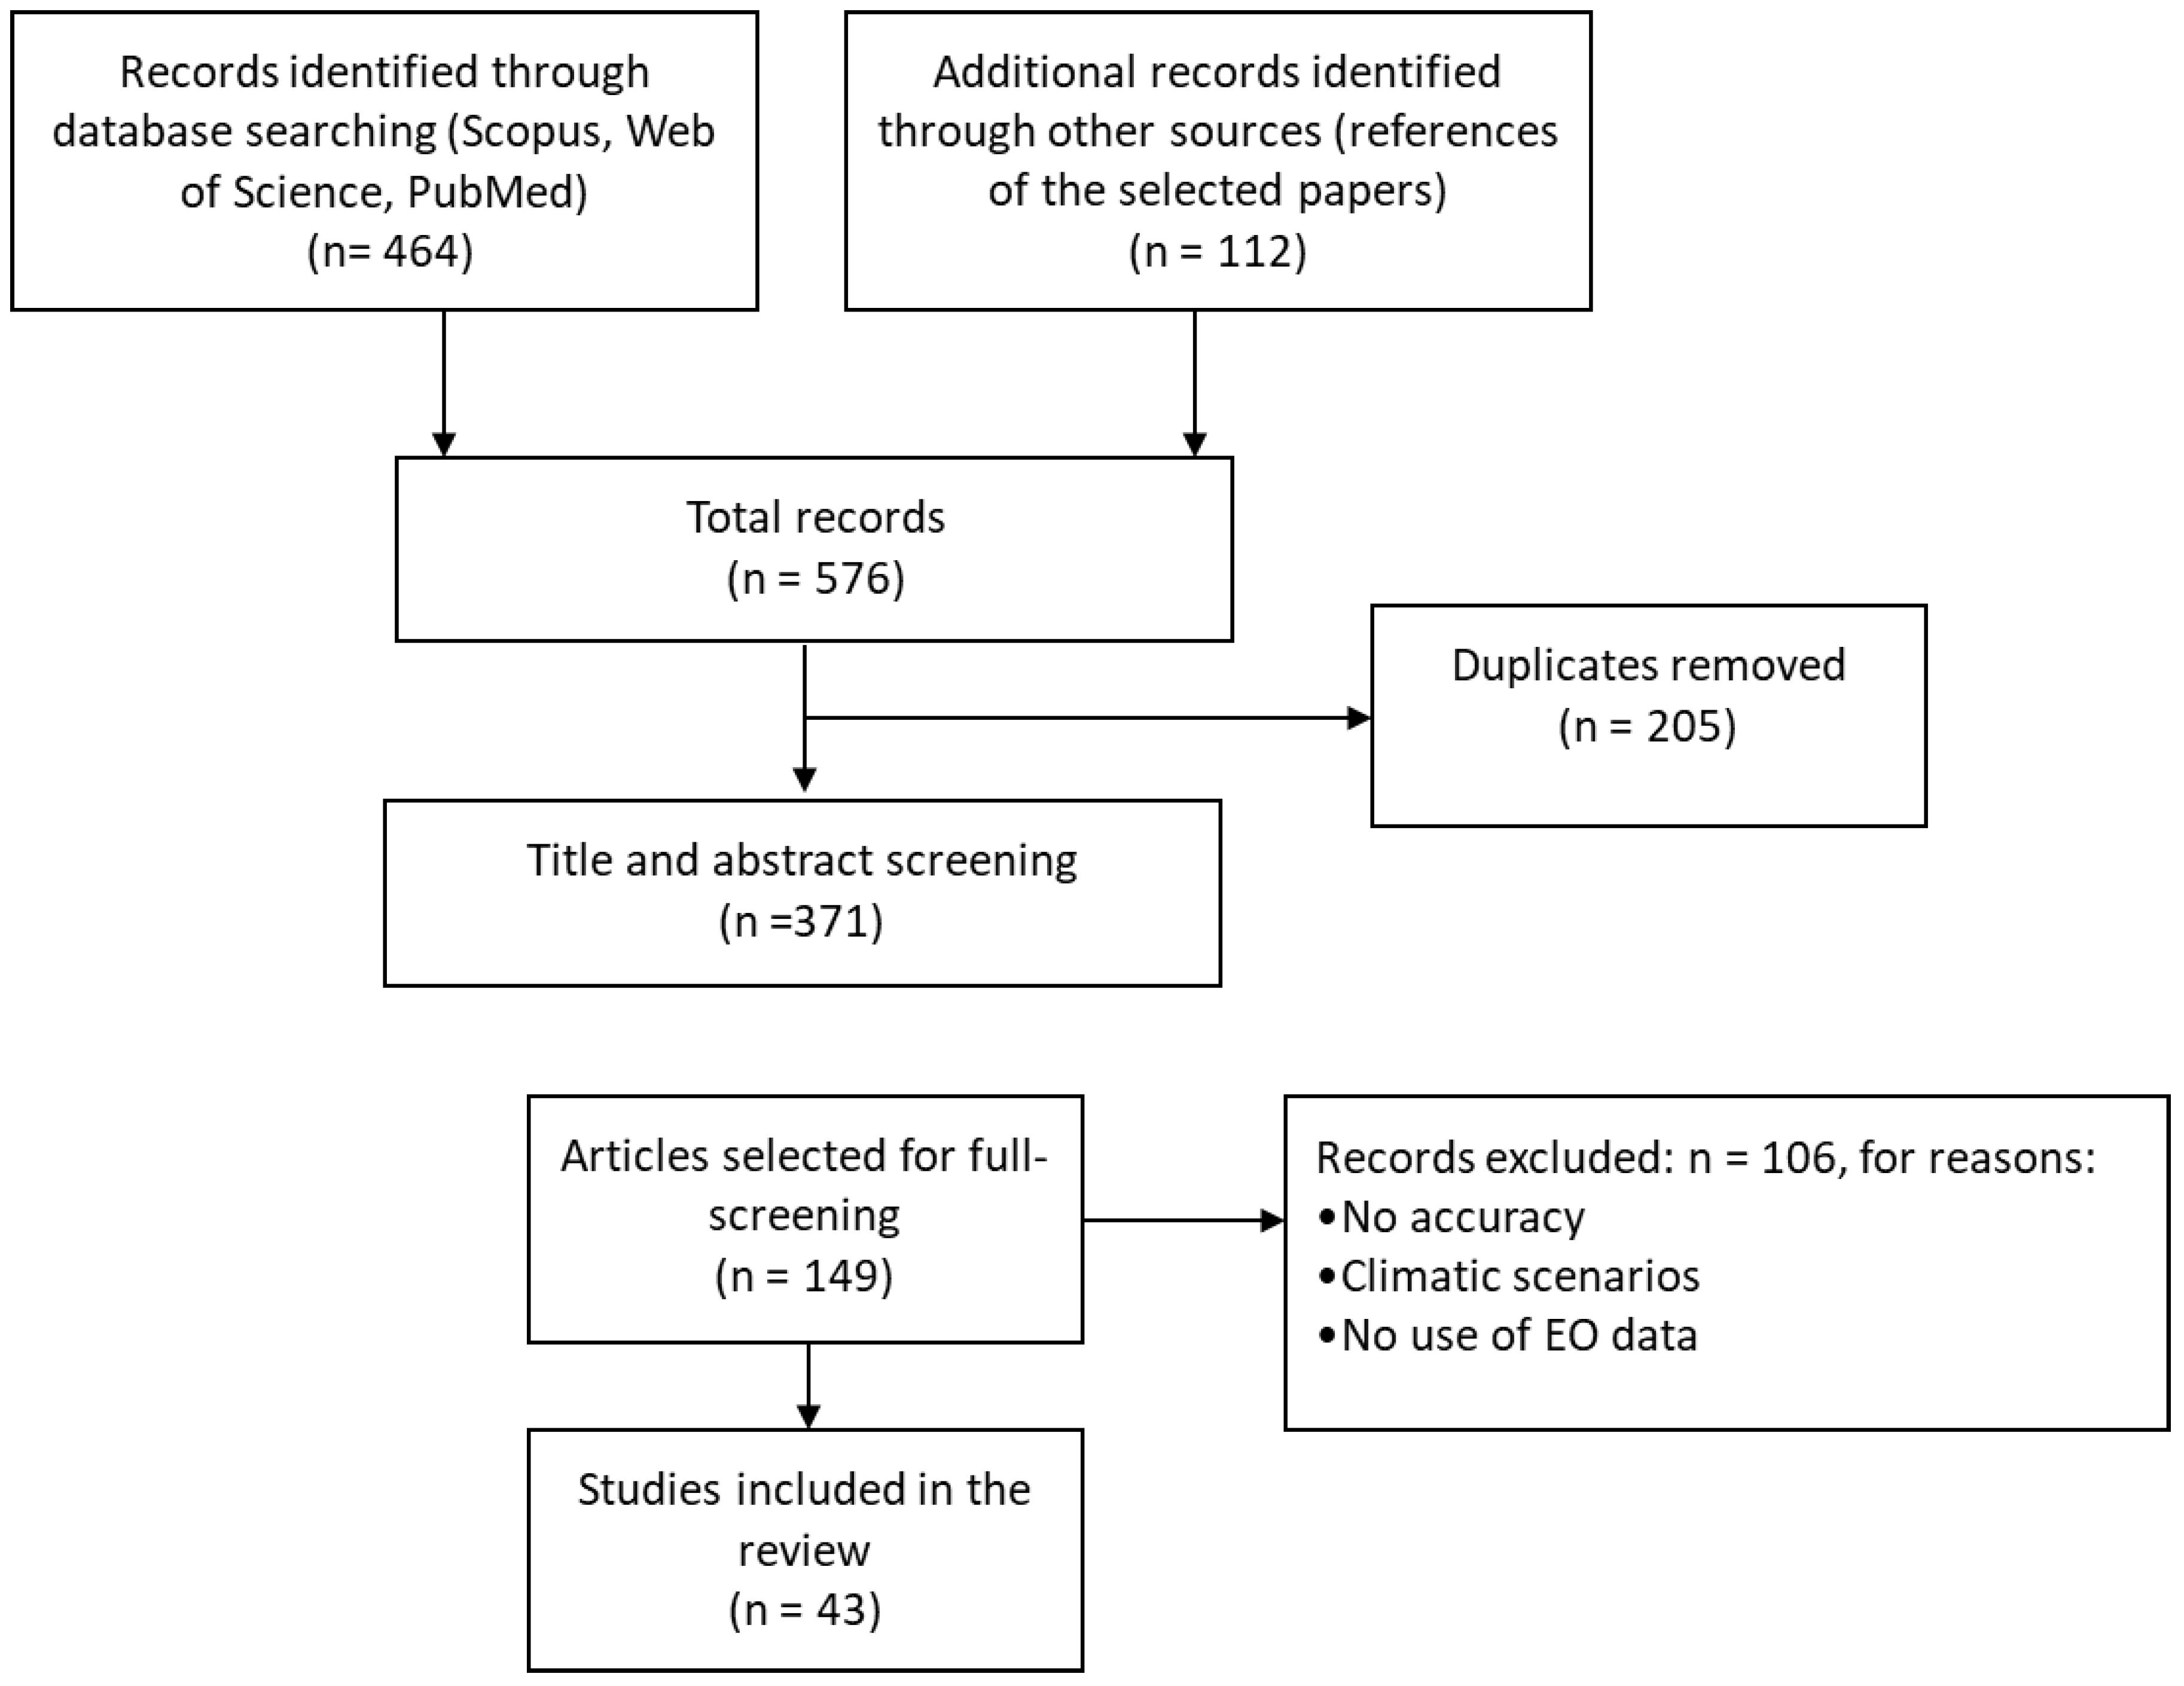
2.1. Literature Search Strategy
2.2. Inclusion and Exclusion Criteria
- Peer-reviewed articles published in English between 1 January 2012 and 31 December 2018.
- Publications that integrated satellite EO derived climatic and environmental predictors for analyzing mosquito-borne epidemics. Studies that did not use satellite EO data or used solely in situ data were excluded from the review.
- Studies on models that included disease incidence, prevalence and cases as variables, as well as studies that used entomological data as response variables.
- Articles referring to the impact of (inter-annual) climate variability on pathogen transmission, excluding the ones using climatic scenarios. By climatic scenario we refer to studies that used future projections under different climate change scenarios. Therefore, we only focused on studies that utilized historical data and built knowledge from the past events.
- Studies that used epidemiological models, making reference to the achieved level of accuracy rates. In contrast studies that did not bring any evidence or information on the accuracy of the used models were excluded.
3. State-of-the-Art Review
3.1. Environmental EO Predictors
3.2. Other Non-Environmental Predictors
3.3. Satellite EO Systems Used for Assessing the Environmental Predictors
4. Results and Discussion
4.1. Predictors for Malaria
4.2. Predictors for Dengue
4.3. Predictors for WNV
4.4. Data Driven Uncertainties and Limitations
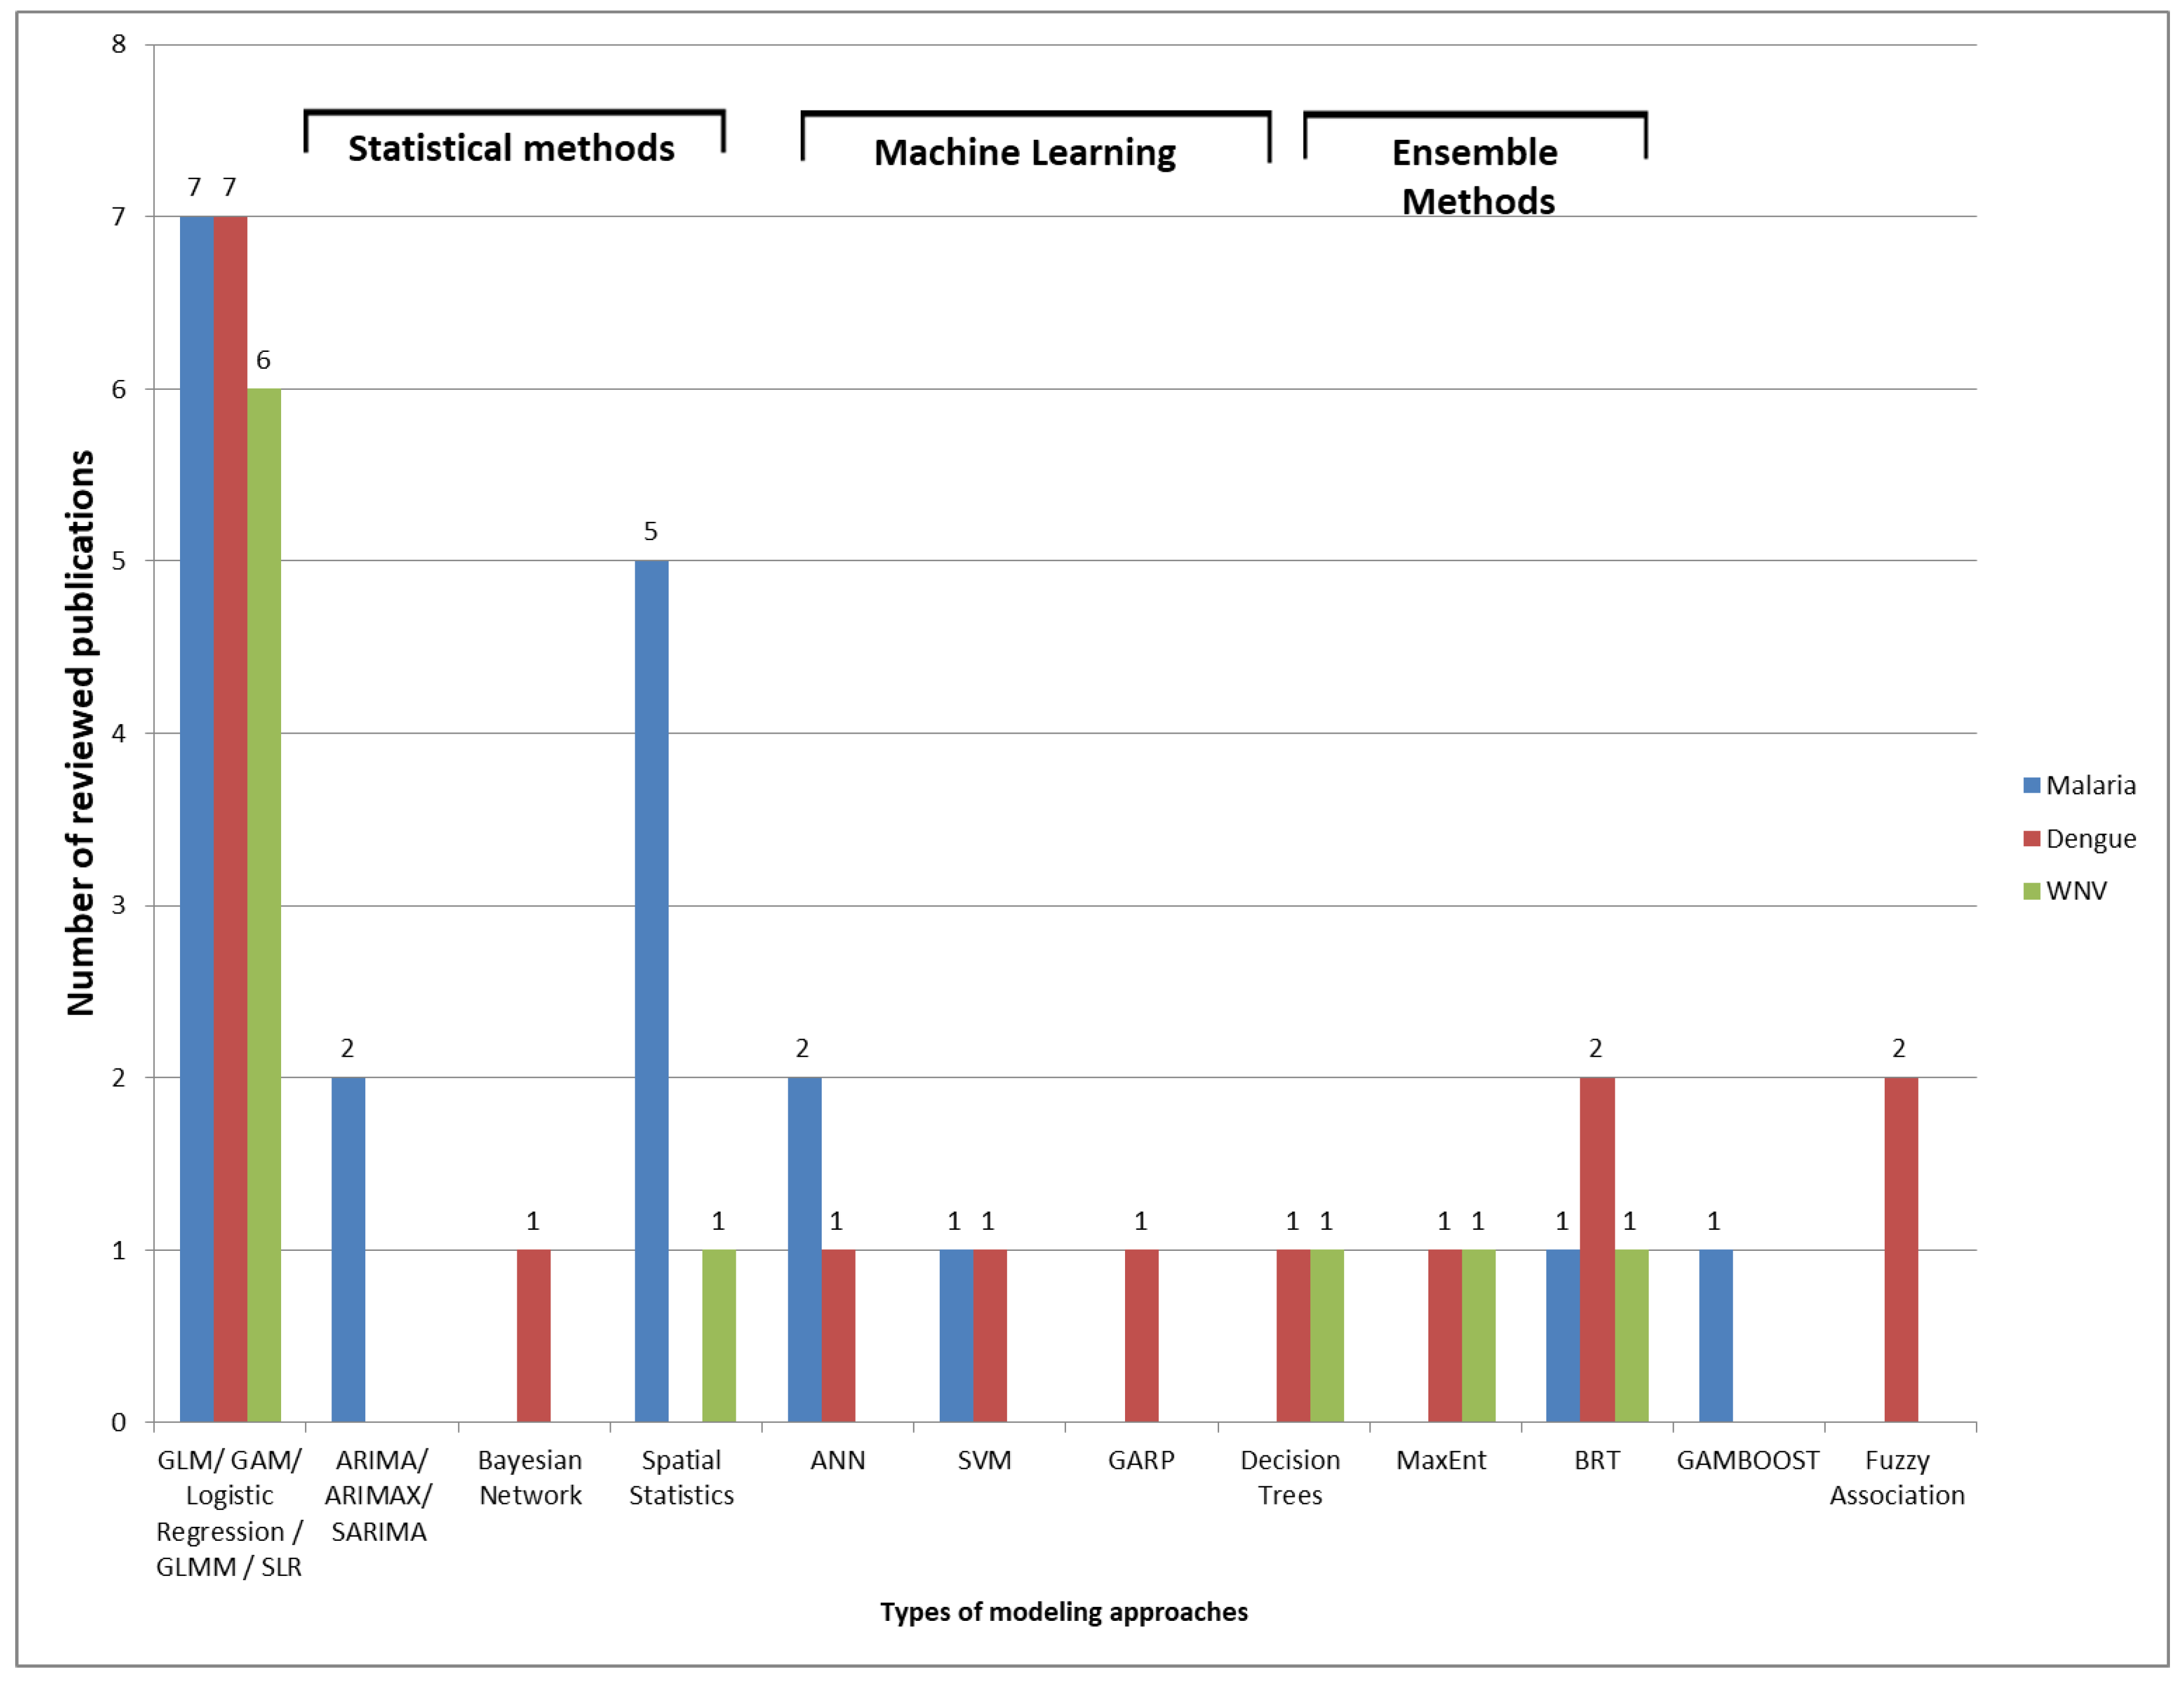
4.5. Modeling Approaches and Evaluation
4.6. Scalability and Transferability
5. Conclusions
6. Disclaimer
Author Contributions
Funding
Conflicts of Interest
Abbreviations
| ACTs | Artemisinin Combination Therapies |
| ADDS | Africa Data Disseminating Services |
| AIC | Akaike’s Information Criterion |
| AIRS | Atmospheric Infrared Sounder |
| ANDWI | Adapted NDWI Mac Feeters Index |
| ANNs | Artificial Neural Networks |
| AOI | Area of Interest |
| ARIMA | AutoRegressive Integrated Moving Average |
| ARIMAX | Autoregressive Integrated Moving Average with Explanatory Variable |
| AST | Air Surface Temperature |
| AUC | Area under the ROC Curve |
| AVHRR | Advanced Very High Resolution Radiometer |
| BI | Breteau Index |
| BN | Bayesian Network |
| BRT | Boosted Regression Tree |
| BT | Brightness Temperature |
| CDC | Center for Disease Control |
| CHIRPS | Climate Hazards Group InfraRed Precipitation |
| CI | Container Index |
| CLMM | Cumulative Link Mixed Model |
| DAG | Directed Acyclic Graph |
| DEMs | Digital Elevation Models |
| ECMWF | European Centre for Medium-RangeWeather Forecasts |
| EIP | Extrinsic Incubation Period |
| EO | Earth Observation |
| ET | Evapotranspiration |
| ETa | Actual Evapotranspiration |
| EVI | Enhanced Vegetation Index |
| EWEM | Early Warning and Environmental Monitoring Program |
| EWSs | Early Warning Systems |
| FARM | Fuzzy Association Rule |
| FSCPE | Federal State Cooperative Program |
| GAM | Generalized Additive Model |
| GAMBOOST | Generalized Additive Model with Boosting |
| GAUL | Global Administrative Unit Layers |
| GARP | Genetic Algorithm for Rule-set Prediction |
| GI | Green Index |
| GLM | General Linear Mixed |
| GLR | General Linear Regression |
| GPM | Global Precipitation Measurement |
| GPW | Gridded Population of the World |
| GTT | Greedy Thick Thinning |
| HI | Household Index |
| HR | High Resolution |
| IBGE | Brazilian Institute for Geography and Statistics |
| ICT | Information and Communication Technology |
| INEI | Peru National Institute of Statistics and Information 2007 |
| INSA | Indian National Satellite System |
| ITN | Insecticide treated |
| KNN | K-Nearest Neighbor |
| LMM | Linear mixed effects models |
| LST | Land Surface Temperature |
| LU/LC | Land Use/Land Cover |
| MAE | Mean Absolute Error |
| MaxEnt | Maximun Entropy |
| MBDs | Mosquito-Borne Diseases |
| MR | Medium Resolution |
| ML | Machine Learning |
| MNDWI | Modified Normalized Difference Water Index |
| MSL | Mean Seal Level |
| NDVI | Normalized Difference Vegetation Index |
| NDWI | Normalized Difference Water Index |
| NOAA | National Oceanic and Atmospheric Administration |
| NUTS | Nomenclature of Territorial Units for Statistics |
| ONI | Oceanic Niño Index |
| PCA | Principle Component Analysis |
| PPV | Positive Predictive Value |
| RDT | Rapid Diagnostic Tests |
| RMSE | Root Mean Square Error |
| RMSPE | Root Mean Square Percentage Error |
| p-YI | quasi-Yellowness Index |
| SAR | Synthetic Aperture Radar |
| SAVI | Soil-Adjusted Vegetation Index |
| SES | Socio-Economic Status |
| SDGs | Sustainable Development Goals |
| SLP | Sea Level Pressure |
| SLR | Stepwise Logistic Regression |
| SMAP | Soil Moisture Active/Passive |
| SMAPE | Symmetric Mean Absolute Percentage Error |
| SMN | Smoothed and normalized difference vegetation index |
| SMT | Smoothed brightness temperature index |
| SOI | Southern Oscillation Index (SOI) |
| SRTM | Shuttle Radar Topography Mission |
| SST | Sea Surface Temperature |
| SSTA | Sea Surface Temperature Anomaly |
| SVM | Support Vector Machine |
| TCI | Temperature Condition Index |
| TPI | Topographic Position Index |
| TRMM | Tropical Rainfall Measuring Mission |
| TWI | Topographical wetness index |
| USGS | United States Geological Survey |
| VCI | Vegetation Condition Index |
| VHI | Vegetation Health Index |
| VHR | Very High Resolution |
| WHO | World Health Organization |
| WNND | West Nile neuro-invasive disease |
| WNV | West Nile Virus |
Appendix A

| Reference | Period of Study | Validation | Dependent Variable | Number of Independent Variables/Best | Method | Score |
|---|---|---|---|---|---|---|
| [63] | 1995–2015 | 1995–2014: training set 2015: testing set | Relative Malaria abundances | 6 vars (lagged, monthly). Best: temperature and rainfall | ANN/AI | RMSPE ranged from 18% to 117%. |
| [48] | 2012–2014 | 10-fold cross-validation | Malaria vector densities | 22 landscape and 2214 meteorological variables Best: Meteorological variables: rainfall, evapotranspiration, min and max temperature Landscape variable: dense forest surface, built surface | Multivariate analysis-CLMM/SM | AUC of mosquito density classes: “Low” −0.78 “Medium” −0.64 “High” −0.80 |
| [34] | 2005 | 60% training set 40% validation set | Probability of malaria distribution | 9 vars. Best: soil-adjusted vegetation index (SAVI) | Stepwise logistic regression model/SM | Classification accuracy of 82% at a threshold of 0.9 (buffer distance of 10 km) |
| [35] | 2006 to 2013 | site implementation-31/05/2012: training set 01/06/2012–31/05/2013: testing set | Weekly number of laboratory- confirmed malaria cases | 19 vars. Half of the predictor series were lagged, ranging from lags of 1 to 52 weeks Best: Drug treatment, precipitation | ARIMAX/SM | SMAPE ranged from 26% to 128% |
| [77] | 2012–2015 | Monte Carlo cross validation 66.6%: training set 33.3%: testing set | Household with at least one member test positive by RDT | 11 vars. Best: Distance to the Mozambique border, elevation | Multivariate logistic regression/SM | For the rainy season, the sensitivity and specificity of the model were 61% and 80%, respectively. The model performance during the dry season had better specificity (96%) but far worse sensitivity (37%). |
| [37] | 2013–2017 | Markov chain Monte Carlo (MCMC) simulation. A two-chain algorithm for 200,000 iterations with an initial burn-in period of 5000 iterations | Malaria incidence in each age group was estimated by dividing the district aggregated malaria cases by the district age group-specific population | 4 vars, (lagged: (i) current and previous month, (ii) current and two previous months, (iii) current and three previous months). Best: LST night, LST day | Bayesian spatio-temporal negative binomial models/Geostatistics | At least one ITN was associated with a decline in malaria incidence in children < years by 73% |
| [38] | 2006–2014 | Randomly split 75%: training set 25%: testing set | Malaria parasite prevalence | 10 vars. Best: percentage of dense/riverine vegetation | Boosted Regression Tree (BRT) modeling/AI | Model prediction accuracy: AUC = 0.89 |
| [88] | 1997–2006 | A single year was left out one-by-one from the data set | Malaria incidences | 2 vars. Best: TCI | OLS, Principal Component Regression (PCR) PCR performed better | PCR: R2 = 0.68 OLS: R2 = 0.43 |
| [65] | 2001–2009 | 2001–2008: training set 2009: testing set | Monthly tine series of malaria cases | 4 vars lagged (monthly, yearly). Best: Precipitation (lag one to three months) | Seasonal autoregressive integrated moving average (SARIMA)/SM | Akaine weights greater than 85% |
| [40] | Asembo and Gem: 2003–2012 Karemo: 2008–2012 | - | Number of malaria deaths | 3 vars lagged (0–12 weeks) Best: Precipitation | Distributed Lag Non Linear Modeling/SM | Precipitation relative risk: 1.68 in Asembo Vegetation relative risk: 3.4 in Gem |
| [52] | 2001–2010 | Statistical association | Monthly values of Vector density | 5 vars, Best: Land cover, EVI | (1) Simple Linear relations (2) non-linear multi-variable models (Gausian, log-logistic, first to third degree polynomials and an inverse second degree polynomial equation)/SM | Coupling static land cover suitability with dynamic vegetation data Nash–Sutcliffe model efficiency (MEF) index MEF = 0.90 |
| [84] | 2009–2012 | - | Malaria cases | 3 vars, lagged (1,2 and 3 months) NDVI (+) and monthly total precipitation (+) | Poison regression—GLMM/SM | T min and NDVI accounted for 66% (29.9, 36.1 respectively) of the total variation in malaria incidence explained by model |
| [45] | 2002–2004 | Randomly selected locations 85%: training set 15%: testing set | Mosquito density | 3 vars lagged up to 3 month Best: Distance to water bodies, mean value of NDVI during the month of collection and average day temperature during the current and the previous month of collection | Geostatistical zero inflated binomial and negative binomial models/SM | mosquito densities 66% the zero inflated spatio-temporal negative binomial model and 83% zero inflated spatial negative binomial model respectively(CI:95%) |
| [78] | 2012–2013 | Different samples of training and a validation sets were considered to validate predictions in every cluster | Variable malaria positive or negative | 6 vars Best: Higher socioeconomic status | geographically-weighted regression (GWR)/SM | R2 values per cluster vary between 32% and 87% with a mean of 63% |
| [76] | 2016–2017 | Ten- fold cross validation | malaria incidence | 10 varsBest: Land Use, Distance to residence | ANN, SVM, ensemble techniques (J48)/AI | Best model: Random Subspace ensemble model overall accuracy: 94.2% |
| [66] | 2003–2013 | 5-k cross validation 2003–2012: training set 2013: testing set | malaria admissions | 5 vars, (lagged 1 to 3 months) Observed: lag pattern of rainfall and temperature | GAMBOOST, GAM/SM | GAMBOOST: R2 = 0.71 GAM: R2 = 0.44 |
| [46] | 2001–2004 | Randomly selected locations subset 85% training set 15% testing test | mosquito density and EIR | 6 vars (lagged 1 to 3 months) Association: Rainfall (−) and night temperature (−) | Bayesian geostatistical zero-inflated binomial and negative binomial models Bayesian kriging/SM Geostatistics | Mosquito density models 58%: zero in-flated spatio-temporal negative binomial mode 73%: zero inflated spatial negative binomial model(CI:95%) |
| [39] | 2011 | Subset of 35 location: testing set | malaria infected individuals | 4 vars, Best: rainfall and LST day | Bayesian geostatistical model/Geostatistics | Best model: Log-predictive density of −115.12 |
| [42] | 2006 | The accuracy of the model predictions was tested using independent breeding site data from Nyamanga in 2010 | malaria breeding sites | 9 vars: TWI (+) | logistic regression/SM | In the test site AUC for SRTM: 0.829 AUC for ASTER: 0.799 |
| Reference | Period of Study | Validation | Dependent Variable | Number of Independent Variables/Best | Method | Score |
|---|---|---|---|---|---|---|
| [32] | 2001–2009 | Data set was disjoint into training, validation and test set | Dengue incidence | 108 variables (lagged: 3 week, 4 weeks and 4–7 weeks ahead) | Fuzzy Association Rule Mining (FARM)/AI | 4–7 weeks from time of prediction yielded a PPV = 0.686, PPN = 0.976, sensitivity: 0.615, specificity: 0.982 |
| [71] | 2007–2015 | 10-fold cross validation procedure | Outbreak level of dengue | 5 vars (lagged weekly): Best: SMN, SMT, and TCI | Bayesian Network/SM | Best model: BN model built with an expert and GTT overall Accuracy: 0.906 and AUC 0.954 |
| [50] | 2012–2016 | 2012–2014: training set 2015–2016: testing set | Ovipositon (Nr od Eggs) | 42 vars (lagged weekly: Best temperature, humidity and precipitation | linear multivariate method/SM | final model with prediction capacity (R2 = 0.7, p < 0.05) was established. |
| [44] | 2009–2011 | Validation was performed on the same dataset as the one used to fit the model | Presence of Aedes aegypti larvae | 8 vars: sparsely vegetated soil (+) | Two-step approach, Logistic regression analysis/SM | 84% of the experimental units were correctly predicted, the percentage of correctly classified predictions ranged from 67% to 92% depending on sections. The positive predictive value of the two step scenario was 57%, and the negative predictive value was 90 %. Sensitivity: 57% Specificity: 90% |
| [93] | 2009–2011 | Analytic hierarchy process | Larval density | 7 vars. Elevation (−), Temperature 30–35 C (+), Rainfall 40–81 mm∖hr | Fuzzy logic Data mining and the decision tree method/Data Mining/ AI | Overall accuracy of 80% |
| [51] | 2012–2016 | Time series cross validation procedure (80% training, 20% test) | Oviposition | 5 vars (lagged 3 weeks) | SVM, ANN, K-NN, decision trees, Linear and ridge regression/SM-AI | KNN, correration between observed and fitted values 90% |
| [64] | 2012–2014 | BRT cross validation (75% training set, 25% testing set) | Disease presence/absence | 64 vars Best: Population density and daytime LST min | Boosted Regression Trees: (1) Bernoulli Family (presence/absence) (2) Poisson Family (actual case counts)/AI | Poisson family better model fit compared to the Bernoulli, with lower RMSE and higher correlation. 50% of the relative influence was due to the population density and the daytime LST Poisson: Pearson r 0.9 Bernouli Pearson r 0.25 |
| [85] | 2014 | - | Dengue fever cases | 6 vars. Best: Population density, night and day LST | OLS/SM | R2 = 0.320 |
| [33] | 2002–2008 | Maxent 50% of the data were used to train the model | Presence of breeding vector populations in | 11 vars (lagged 1–3 weeks) | Ecological niche models Maxent and GARP/AI | Two models Maxent + GARP Prediction Maxent: 46–83% GARP: 23–61% Combination: 44.3–76.1% |
| [59] | 1992–2011 | - | Dengue incidence | 7 vars (Monthly and annual averages, amplitudes, and anomalies) Strongest correlation: SST and AST | Logistic regression/SM | PCA: 4 vars explained 72% of the variance R = 0.04–0.56 varied over years |
| [60] | 2006–2015 | - | Dengue incidence rates | 7 vars (lagged weekly) Best: previous dengue cases | Stepwise multiple regression analyses/SM | Best model: R2 = 0.42 |
| [61] | 1960–2012 | Statistic association | Probability of dengue occurrence | 8 vars: Best: rainfall, temperature and the degree of urbanization. | BRT/AI | AUC: 0.81 |
| Reference | Period of Study | Validation | Dependent Variable | Number of Independent Variables/Best | Method | Score |
|---|---|---|---|---|---|---|
| [81] | 2003–2008 | 80%: training set 20%: testing set | WNV incidence for each US county | 5 vars (lagged, monthly). Best X: precipitation for the whole 6y period. | Decision trees/ML | Annual results were highly variable: R = 0–0.84 Tested the whole 6 years period: R = 0.86 |
| [49] | 2001–2011 | - | Annual Culex population at 44 sites | 5 vars (lagged window of 12 consecutive weeks). Best X: (a) days of precipitation at the start of the year (+) and (b) distance to rice fields (−) | Linear mixed models/SM | R2 = 0.46–0.49 |
| [86] | 2002–2013 | 2002–2011: training set 2012–2013: testing set | Probability of WND human infections | 12 vars. Best model: Temperature anomalies in July, MNDWI in early June Multivariate | Logistic Regression/ML | AUC: 0.819 for 2012 AUC: 0.853 for 2013. |
| [83] | 2010–2012 | Statistical association | Annual total of WNV incidences for each NUTS3 area per 100 K inhabitants | 10 vars (lagged into 9 blocks of 4 months). Best model: uses: NDWI (−) in spring-early summer, T (+) in summer, days of precipitation (+), area covered with irrigated croplands (+) | linear mixed-effects models (LMMs)/SM | Best model: (R2 = 0.32) |
| [41] | 2009 | Training set: Locations recorded as positive for Cx. pipiens from Egypt (n = 239) from Lebanon (n = 83) Testing set: Independent locations of Cx. pipiens from Israel (n = 23) from Egypt (n = 56) | Habitats of Culex mosquitoes | 24 vars. Best X: population density, seasonality of EVI | Maximum entrory and BRT/AI | In regions with high risk: R 0.73–0.77, In regions with low risk: R 0.55–0.66 |
| [30] | 2010–2014 | Statistical Association | Reported human cases of WNF/ WNND (441 cases), in weekly blocks | 6 vars (lagged 1–3 weeks), wind speed (−), relatively humidity (−), air temperature (+) | Multiple logistic regression/SM | The odds ratios (OR) OR wind speed: 0.76 (95% CI) OR relative humidity: 0.60 (95% CI), respectively, for lag 0. |
| [75] | 2004–2010 | Drop 1 year at a time | The number of county-level WNV neuroinvasive cases and WNV fever cases (3131 cases), in 8day blocks | 3vars: The models were sensitive to: the timing of spring green up (measured with NDVI), temperature variability in early spring and summer (measured with LST), and moisture availability from late spring through early summer (measured with ETa) | Non-linear generalized additive models (GAMs)/SM | R2 0.18 (April)–0.62 (August). |
| [31] | 2010–2012 | 2010–2011 training set 2012 testing set | Positive human cases | 37 vars. Best X: elevation (−) and distance from water (−) | Two step cluster analysis/SM | 80% of incidences in 2012 occurred in areas recognized by the model as high-risk |
| Reference | Mosquito-Borne Disease | Study Area | Climatic Zone | Epidemiological Data | EO Climatic/Environmental Data |
|---|---|---|---|---|---|
| [32] | Dengue | Peru, province of Loreto | Tropical | Probable and confirmed cases longer text | Precipitation (TRMM), Temperature (USGS), NDVI (USGS), EVI (USGS), SOI (NCAR), SSTA (GCMD), Elevation (NOAA), running water, sanitation, electric lighting (INEI) |
| [81] | WNV | Great Plains region of the US | Semi arid | WNV incidence data aggregated to the county level-(I.R.) | NDVI (MODIS), Elevation (SRTM), Land Cover (NLCD2006 Landsat ETM+), temperature *, precipitation * (Oregon State University’s PRISM) |
| [71] | Dengue | Sisaket province, Thailand | Tropical | Dengue confirmed cases (I.R.) | SMN, SMT, VCI, TCI, VHI (AVHRR) |
| [63] | Malaria | Local Khammam district, Telangana, India | Semi arid | Positive cases without symptoms | precipitation (TRMM), day and night LST (MODIS), EVI (MODIS), relative humidity * (MOSDAC) |
| [86] | WNV | 1113 districts, Europe | Warm humid continental | Number of districts reporting WND cases in humans | Air temperature (NOAA NCEP-NCAR database), MNDWI (MODIS), Wetlands (GLWD) |
| [35] | Malaria | Uganda | Different climates, but is dominated by tropical savanna climate | Laboratory confirmed malaria cases | day and night LST, EVI (MODIS), precipitation (TRMM) |
| [77] | Malaria | region Mutasa District, Zimbabwe | Humid subtropical | RDT-positive participants-Household RDT | Elevation, slope, aspect (STRM), NDVI, LU (Landsat-8), distance to streams, distance to main road, distance to health facility, distance to Mozambique border |
| [83] | WNV | 146 NUTS3 regions, Europe | Warm humid continental climate | WNV incidence | daily LST, NDVI, NDWI(MODIS), precipitation (ECA&D), LC, water bodies (OpenStreetMap), protected areas (IUCN and UNEP), Light at night (VIIRS) |
| [37] | Malaria | Uganda | Tropical savanna climate | Confirmed malaria cases by RDT–district aggregated monthly malaria cases | day and night LST (MODIS), NDVI(MODIS), LC, elevation (SRTM), distance to water, precipitation (EWEM) |
| [38] | Malaria | City of Dar es Salaam, Tanzania | Tropical | RDT test -standardized parasite prevalence into the 2–10 years age group | LC, NDVI, NDWI (SPOT-6), Distance to inland water, Percentage dense/riverine vegetation, Percentage built-up, Elevation (ASTER GDEM), Compound Topographic Index (CTI), daily LST (MODIS), precipitation (RFE 2.0) |
| [88] | Malaria | Tripura state India | Tropical savanna climate | Malaria cases-slidy positive rate and % of malaria cases/total Nr. of patients tested | NDVI, BT, (VCI–TCI) ((AVHRR) (NOAA GVI)) |
| [64] | Dengue | Magdalena River watershed of Colombia | Tropical | Confirmed cases Dengue Fever | day and night LST (MODIS), EVI (MODIS), precipitation (TRMM), LU/LC, elevation (SRTM) |
| [30] | WNV | Northern Greece | Humid subtropical | Confirmed laboratory cases/mosquito traps | Air temperature, relative humidity, soil temperature, soil water content, wind speed, precipitation (ERA-Interim) |
| [75] | WNV | 66 counties from the Northern Great Plains US | Weather varies throughout the year with cold winters, hot summers, and strong winds | Positive human case–Logarithm of relative risk (LRR) | mean LST (MODIS), NDVI (MODIS), ETa (FEWS-NET) |
| [65] | Malaria | District Amhara region of Ethiopia | Humid subtropical | Clinically diagnosed malaria cases | precipitation (TRMM), eight-day composite LST (MODIS), NDVI (MODIS), EVI (MODIS), ETa (MODIS) |
| [40] | Malaria | Western Kenya | Tropical | VA4 method-malaria deaths | day LST, NDVI (MODIS), precipitation (TRMM) |
| [84] | Malaria | Baringo, Kenya | Tropical savanna | Clinical malaria cases | monthly LST, NDVI (MODIS), precipitation (CHIRPS) |
| [85] | Dengue | Guangzhou, China | Subtropical coastal area with an oceanic subtropical monsoon climate | Confirmed dengue cases (clinical and laboratory diagnosis) | Land type(LT), NDWI (GF-1 satellite), day and night LST(GF-1 satellite) |
| [78] | Malaria | Western Kenya | Tropical | Malaria prevalence (positive to antigens) RDT Household information /odour-baited MM-X traps | elevation relative to lake (ASTER), distance to lake, distance to nearest clinic, NDVI (QuickBird), TWI (QuickBird) |
| [76] | Malaria | Province of Dak Nong, Vietnam | Tropical | Malaria incidence | Elevation, aspect, slope (Aster Global DEM), temperature *, precipitation * (meteorological stations), NDVI (Landsat 8), LU type, distance to road, distance to residential area, distance to river (Landsat 8) |
| [53] | Dengue | State of Selangor, Malaysia | Tropical rainforest | Dengue cases | Temperature, precipitation (Weather department Malaysia), LU (Town Planning Department Malaysia) |
| [31] | WNV | Greece | Humid subtropical | laboratory-confirmed human cases, wild birds seroprevalence | temperature (WorldClim), precipitation (WorldClim), NDVI (WorldClim), elevation, slope, aspect (STRM DEM), LU (Corine Land Cover 2000 database), distance to water, distance to nearest village |
| [66] | Malaria | Western Kenya | Tropical | Confirmed malaria cases | day and night LST(MODIS), NDVI (MODIS), ET (MODIS), precipitation (TRMM) |
| [87] | Dengue | Singapore | Tropical | Dengue Cases | temperature (NOAA), precipitation (rain gauges) |
| [82] | Dengue | South Brazil | Tropical | Laboratory and clinically confirmed dengue cases/Dengue Incidence rate | precipitation (GPCP), ONI (NOAA CPC), mean surface air temperature (NCEP/NCAR), elevation (IBGE) |
| [59] | Dengue | San Juan, Puerto Rico | Tropical island | Confirmed dengue cases | surface air temperature (maximum and minimum), precipitation, sea level pressure (SLP), wind speed (NOAA-National Climatic Data Center), Sea Surface Temperature (SST), precipitation (AVHRR), Mean Sea level (MSL) * Sea Level Pressure SLP) * |
| [39] | Malaria | Mozambique | Tropical | Number of Infected children from 0 to 5 years old | LST (MODIS), precipitation (ADDS/RFE 2.0), elevation (GDEM/USGS), LU∖LC (RapidEye) |
| [67] | Malaria | Amhara region | Humid subtropical | Malaria cases (clinically diagnosed as well as confirmed) | Precipitation (TRMM),mean daily LST (MODIS), NDVI (MODIS), SAVI (MODIS), EVI (MODIS), NDWI (MODIS) |
| [60] | Dengue | State of Yucatan, Mexico | Tropical | Confirmed dengue fever cases | Day- and night-time SST (AVHRR), air temperature *, humidity *, and precipitation * (CONAGUA) |
| [61] | Dengue | Worldwide | - | dengue occurrence records | Precipitation * (WorldClim), temperature index, NDVI (AVHRR) |
| Reference | Mosquito-Borne Disease | Study Area | Climatic Zone | Entomological Data | EO Climatic/Environmental Data |
|---|---|---|---|---|---|
| [48] | Malaria | Municipality of Saint-Georges de l’Oyapock French Guiana | Tropical | Mosquito Magnet traps baited with octenol-weekly number of specimens | Land cover (SPOT-5), precipitation *, temperature *, relative humidity *, solar radiation *, evapotranspiration * (Meteo–France weather station) |
| [49] | WNV | Eastern Piemonte, Italy | Humid subtropical | CO2 baited traps-start (ON) and end (OFF) of mosquito season (threshold values for population abundance) | daily LST (MODIS), Precipitation * (ECA&D), NDWI (MODIS), LU∖LC (Corine Land Cover), proximity to mosquito traps and rice fields |
| [34] | Malaria | Vhembe District Municipality in Limpopo Province of South Africa | North-western part is semi arid, south-eastern is subtropical | Presence of Malaria agent from patients that were tested positive for P. falciparum-presence/pseudo-absence were generated at buffer distances of 0.5–20 km | NDVI(Landsat 5), NNDWI, GI, SAVI, p-YI, Moisture index (Landsat 5), aspect (ASTER), Elevation (SRTM) |
| [50] | Dengue | Tartagal City, Argentina | Humid subtropical | Ovitraps–sum of eggs | NDVI (MODIS), NDWI (MODIS), LST (MODIS), precipitation (TRMM) |
| [44] | Dengue | Tartane (Martinique, French Antilles) | Tropical | Aedes larvae-positive cases identified at the experimental units (houses visited multiple time) | Temperature *, humidity *, precipitation * (Météo-France stations), NDVI (Geoeye-1), NDWI (Geoeye-1), ANDWI (Geoeye-1),LU∖LC (Geoeye-1), elevation (Litto3D) |
| [93] | Dengue | Phetchabun Province, Thailand | Tropical | Larval density inside and around residential homes-HI, CI, BI | day LST, night LST (MODIS), precipitation (TRMM), relative humidity (Aqua/AIRS), elevation (SRTM), LU∖LC (MODIS) |
| [51] | Dengue | Tartagal city Northwest of Argentina in Salta Province | Humid subtropical | Vector population–Ovitraps Egg | NDVI (MODIS), NDWI (MODIS), day and night LST(MODIS), local precipitation (TRMM) |
| [41] | WNV | Middle East and North Africa | Arid and semi-arid | (1) Adult sample-CDC light traps (2) Larval samples–classical dipping method form artificial and natural breeding sites | Temperature (WorldClim), precipitation (WorldClim) EVI (MODIS), TWI (GLSDEM) |
| [30] | WNV | Northern Greece | Humid subtropical | Confirmed laboratory cases/mosquito traps | Air temperature, relative humidity, soil temperature, soil water content, wind speed, precipitation (ERA-Interim) |
| [52] | Malaria | southern Portugal | Mediterranean | CDC light traps/vector density | 8 day LST (MODIS), NDVI (MODIS), EVI (MODIS), NDWI (MODIS), LC (Corine Land Cover 2006) |
| [33] | Dengue | Antioquia, Colombia | Tropical rainforest | The basic unit of sampling was the house, where systematic searches found water containers with larvae, pupae, or exuviae/Breteau index Human cases at least suspected | Landsat band 1–7, NDVI (Landsat 7), elevation, slope, aspect (SRTM) |
| [45] | Malaria | Western Kenya | Tropical | Mosquito density CDC light traps/ EIR | day and light LST (MODIS), NDVI (MODIS), precipitation (Meteosat 7), elevation (USGS EROS Data Center), distance to the nearest water source |
| [78] | Malaria | Western Kenya | Tropical | Malaria prevalence (positive to antigens) RDT Household information/odour-baited MM-X traps | elevation relative to lake (ASTER), distance to lake, distance to nearest clinic, NDVI (QuickBird), TWI (QuickBird) |
| [46] | Malaria | Nouna district in Burkina Faso | Sub-Saharan | CDC light traps/EIR | NDVI, day and night LST (MODIS), precipitation (ADDS), water bodies (Health Mapper) |
| [42] | Malaria | Rusinga Island in western Kenya | Tropical | Vector density | slope, aspect, plan curvature, profile curvature, convergence index, and wetness index, topographic position index (TPI) (SRTM, ASTER) |
References
- World Health Organization. Mosquito-borne diseases. 2018. Available online: https://www.who.int/neglected_diseases/vector_ecology/mosquito-borne-diseases/en/ (accessed on 20 November 2018).
- World Health Organization. Eliminating Malaria. 2016. Available online: https://apps.who.int/iris/bitstream/handle/10665/205565/WHO_HTM_GMP_2016.3_eng.pdf;jsessionid=F61B110C5B2AE747195723077A15AF09?sequence=1. (accessed on 30 November 2018).
- Ford, T.E.; Colwell, R.R.; Rose, J.B.; Morse, S.S.; Rogers, D.J.; Yates, T.L. Using satellite images of environmental changes to predict infectious disease outbreaks. Emerg. Infect. Dis. 2009, 15, 1341–1346. [Google Scholar] [CrossRef] [PubMed]
- Gubler, D.J. Dengue, Urbanization and Globalization: The Unholy Trinity of the 21(st) Century. Trop. Med. Health 2011, 39, 3–11. [Google Scholar] [CrossRef] [PubMed]
- Bauwens, I.; Franke, J.; Gebreslasie, M. Malareo-Earth observation to support Malaria Control in Southern Africa. In Proceedings of the 2012 IEEE International Geoscience and Remote Sensing Symposium (IGARSS), Munich, Germany, 22–27 July 2012; pp. 7252–7255. [Google Scholar] [CrossRef]
- Hay, S.I.; Packer, M.J.; Rogers, D.J. Review article The impact of remote sensing on the study and control of invertebrate intermediate hosts and vectors for disease. Int. J. Remote. Sens. 1997, 18, 2899–2930. [Google Scholar] [CrossRef]
- Kalluri, S.; Gilruth, P.; Rogers, D.; Szczur, M. Surveillance of arthropod vector-borne infectious diseases using remote sensing techniques: A review. PLoS Pathog. 2007, 3, 1361–1371. [Google Scholar] [CrossRef] [PubMed]
- Kazansky, Y.; Wood, D.; Sutherlun, J. The current and potential role of satellite remote sensing in the campaign against malaria. Acta Astronaut. 2016, 121, 292–305. [Google Scholar] [CrossRef]
- Pixalytics Ltd. 2016. How many Earth observation satellites are in space in 2018? 2018. Available online: https://www.pixalytics.com/eo-satellites-in-space-2018/ (accessed on 4 December 2018).
- Ma, Y.; Wu, H.; Wang, L.; Huang, B.; Ranjan, R.; Zomaya, A.; Jie, W. Remote sensing big data computing: Challenges and opportunities. Future Gener. Comput. Syst. 2014. [Google Scholar] [CrossRef]
- Viana, J.; Santos, J.V.; Neiva, R.M.; Souza, J.; Duarte, L.; Teodoro, A.C.; Freitas, A. Remote sensing in human health: A 10-year bibliometric analysis. Remote Sens. 2017, 9, 1225. [Google Scholar] [CrossRef]
- SDGs: Sustainable Development Knowledge Platform. Available online: https://sustainabledevelopment.un.org/sdgs (accessed on 28 February 2019).
- World Health Organization. Malaria. 2019. Available online: https://www.who.int/news-room/fact-sheets/detail/malaria (accessed on 30 April 2019).
- Sadoine, M.L.; Smargiassi, A.; Ridde, V.; Tusting, L.S.; Zinszer, K. The associations between malaria, interventions, and the environment: A systematic review and meta-analysis. Malar. J. 2018, 17, 73. [Google Scholar] [CrossRef]
- Paaijmans, K.P.; Read, A.F.; Thomas, M.B. Understanding the link between malaria risk and climate. Proc. Natl. Acad. Sci. USA 2009, 106, 13844–13849. [Google Scholar] [CrossRef]
- Rogers, D.J.; Randolph, S.E.; Snow, R.W.; Hay, S.I. Satellite imagery in the study and forecast of malaria. Nature 2002, 415, 710–715. [Google Scholar] [CrossRef]
- Paaijmans, K.P.; Wandago, M.O.; Githeko, A.K.; Takken, W. Unexpected High Losses of Anopheles gambiae Larvae Due to Rainfall. PLoS ONE 2007, 2, e1146. [Google Scholar] [CrossRef] [PubMed]
- Whitehorn, J.; Simmons, C.P. The pathogenesis of dengue. Vaccine 2011, 29, 7221–7228. [Google Scholar] [CrossRef] [PubMed]
- WHO. What Is Dengue; WHO: Geneva, Switzerland, 2017. [Google Scholar]
- Barbazan, P.; Guiserix, M.; Boonyuan, W.; Tuntaprasart, W.; Pontier, D.; Gonzalez, J.P. Modelling the effect of temperature on transmission of dengue. Med. Vet. Entomol. 2010, 24, 66–73. [Google Scholar] [CrossRef] [PubMed]
- Stewart Ibarra, A.M.; Ryan, S.J.; Beltrán, E.; Mejía, R.; Silva, M.; Muñoz, Á. Dengue Vector Dynamics (Aedes aegypti) Influenced by Climate and Social Factors in Ecuador: Implications for Targeted Control. PLoS ONE 2013, 8, e78263. [Google Scholar] [CrossRef] [PubMed]
- Pontes, R.J.; Freeman, J.; Oliveira-Lima, J.W.; Hodgson, J.C.; Spielman, A. Vector densities that potentiate dengue outbreaks in a Brazilian city. Am. J. Trop. Med. Hyg. 2000, 62, 378–383. [Google Scholar] [CrossRef] [PubMed]
- World Health Organization. West Nile Virus. 2018. Available online: http://www.who.int/news-room/fact-sheets/detail/west-nile-virus (accessed on 3 December 2018).
- Reisen, W.K. Ecology of West Nile virus in North America. Viruses 2013, 5, 2079–2105. [Google Scholar] [CrossRef] [PubMed]
- Bertolotti, L.; Kitron, U.D.; Walker, E.D.; Ruiz, M.O.; Brawn, J.D.; Loss, S.R.; Hamer, G.L.; Goldberg, T.L. Fine-scale genetic variation and evolution of West Nile Virus in a transmission “hot spot” in suburban Chicago, USA. Virology 2008, 374, 381–389. [Google Scholar] [CrossRef]
- Dohm, D.J.; O’guinn, M.L.; Turell, M.J. Effect of Environmental Temperature on the Ability of Culex pipiens (Diptera: Culicidae) to Transmit West Nile Virus. J. Med. Entomol. 2002, 39, 221–225. [Google Scholar] [CrossRef]
- Munn, Z.; Peters, M.D.J.; Stern, C.; Tufanaru, C.; McArthur, A.; Aromataris, E. Systematic review or scoping review? Guidance for authors when choosing between a systematic or scoping review approach. BMC Med. Res. Methodol. 2018, 18, 143. [Google Scholar] [CrossRef]
- Arksey, H.; O’Malley, L. Scoping studies: Towards a methodological framework. Int. J. Soc. Res. Methodol. 2005, 8, 19–32. [Google Scholar] [CrossRef]
- Levac, D.; Colquhoun, H.; O’Brien, K.K. Scoping studies: Advancing the methodology. Implement. Sci. 2010, 5, 69. [Google Scholar] [CrossRef] [PubMed]
- Stilianakis, N.I.; Syrris, V.; Petroliagkis, T.; Pärt, P.; Gewehr, S.; Kalaitzopoulou, S.; Mourelatos, S.; Baka, A.; Pervanidou, D.; Vontas, J.; et al. Identification of Climatic Factors Affecting the Epidemiology of Human West Nile Virus Infections in Northern Greece. PLoS ONE 2016, 11, e0161510. [Google Scholar] [CrossRef] [PubMed]
- Valiakos, G.; Papaspyropoulos, K.; Giannakopoulos, A.; Birtsas, P.; Tsiodras, S.; Hutchings, M.R.; Spyrou, V.; Pervanidou, D.; Athanasiou, L.V.; Papadopoulos, N.; et al. Use of Wild Bird Surveillance, Human Case Data and GIS Spatial Analysis for Predicting Spatial Distributions of West Nile Virus in Greece. PLoS ONE 2014, 9, e96935. [Google Scholar] [CrossRef] [PubMed]
- Buczak, A.L.; Koshute, P.T.; Babin, S.M.; Feighner, B.H.; Lewis, S.H. A data-driven epidemiological prediction method for dengue outbreaks using local and remote sensing data. BMC Med. Inform. Decis. Mak. 2012, 12. [Google Scholar] [CrossRef] [PubMed]
- Arboleda, S.; Jaramillo-o, N.; Peterson, A.T. Spatial and temporal dynamics of Aedes aegypti larval sites in Bello, Colombia. J. Vector Ecol. 2012, 37, 37–48. [Google Scholar] [CrossRef]
- Malahlela, O.E.; Olwoch, J.M.; Adjorlolo, C. Evaluating Efficacy of Landsat-Derived Environmental Covariates for Predicting Malaria Distribution in Rural Villages of Vhembe District, South Africa. EcoHealth 2018, 15, 23–40. [Google Scholar] [CrossRef]
- Kamya, M.R.; Dorsey, G.; Kigozi, R.; Brownstein, J.S.; Charland, K.; Buckeridge, D.L.; Brewer, T.F.; Zinszer, K. Forecasting malaria in a highly endemic country using environmental and clinical predictors. Malar. J. 2015, 14, 245. [Google Scholar] [CrossRef]
- Kanyangarara, M.; Mamini, E.; Mharakurwa, S.; Munyati, S.; Gwanzura, L.; Kobayashi, T.; Shields, T.; Mullany, L.C.; Mutambu, S.; Mason, P.R.; et al. High-resolution plasmodium falciparum malaria risk mapping in Mutasa District, Zimbabwe: Implications for regaining control. Am. J. Trop. Med. Hyg. 2016, 95, 141–147. [Google Scholar] [CrossRef]
- Ssempiira, J.; Kissa, J.; Nambuusi, B.; Mukooyo, E.; Opigo, J.; Makumbi, F.; Kasasa, S.; Vounatsou, P. Interactions between climatic changes and intervention effects on malaria spatio-temporal dynamics in Uganda. Parasite Epidemiol. Control 2018, 3, e00070. [Google Scholar] [CrossRef]
- Kabaria, C.W.; Molteni, F.; Mandike, R.; Chacky, F.; Noor, A.M.; Snow, R.W.; Linard, C. Mapping intra-urban malaria risk using high resolution satellite imagery: A case study of Dar es Salaam. Int. J. Health Geogr. 2016, 15, 26. [Google Scholar] [CrossRef]
- Giardina, F.; Franke, J.; Vounatsou, P. Geostatistical modelling of the malaria risk in Mozambique: Effect of the spatial resolution when using remotely-sensed imagery. Geospat. Health 2015, 10, 232–238. [Google Scholar] [CrossRef] [PubMed][Green Version]
- Sewe, M.O.; Ahlm, C.; Rocklöv, J. Remotely sensed environmental conditions and malaria mortality in three malaria endemic regions in western kenya. PLoS ONE 2016, 11, e0154204. [Google Scholar] [CrossRef] [PubMed]
- Conley, A.K.; Fuller, D.O.; Haddad, N.; Hassan, A.N.; Gad, A.M.; Beier, J.C. Modeling the distribution of the West Nile and Rift Valley Fever vector Culex pipiens in arid and semi-arid regions of the Middle East and North Africa. Parasites Vectors 2014, 7, 289. [Google Scholar] [CrossRef] [PubMed]
- Nmor, J.C.; Sunahara, T.; Goto, K.; Futami, K.; Sonye, G.; Akweywa, P.; Dida, G.; Minakawa, N. Topographic models for predicting malaria vector breeding habitats: Potential tools for vector control managers. Parasites Vectors 2013, 6, 14. [Google Scholar] [CrossRef] [PubMed]
- Sarfraz, M.S.; Tripathi, N.K.; Faruque, F.S.; Bajwa, U.I.; Kitamoto, A.; Souris, M. Mapping urban and peri-urban breeding habitats of Aedes mosquitoes using a fuzzy analytical hierarchical process based on climatic and physical parameters. Geospat. Health 2014, 8, S685–S697. [Google Scholar] [CrossRef] [PubMed]
- Machault, V.; Yébakima, A.; Etienne, M.; Vignolles, C.; Palany, P.; Tourre, Y.; Guérécheau, M.; Lacaux, J.P. Mapping Entomological Dengue Risk Levels in Martinique Using High-Resolution Remote-Sensing Environmental Data. ISPRS Int. J. -Geo-Inf. 2014, 3, 1352–1371. [Google Scholar] [CrossRef]
- Amek, N.; Bayoh, N.; Hamel, M.; Lindblade, K.A.; Gimnig, J.E.; Odhiambo, F.; Laserson, K.F.; Slutsker, L.; Smith, T.; Vounatsou, P. Spatial and temporal dynamics of malaria transmission in rural Western Kenya. Parasites Vectors 2012, 5, 86. [Google Scholar] [CrossRef] [PubMed]
- Diboulo, E.; Sié, A.; Diadier, D.A.; Voules, D.A.K.; Yé, Y.; Vounatsou, P. Bayesian variable selection in modelling geographical heterogeneity in malaria transmission from sparse data: An application to Nouna Health and Demographic Surveillance System (HDSS) data, Burkina Faso. Parasites Vectors 2015, 8, 118. [Google Scholar] [CrossRef] [PubMed][Green Version]
- Shaukat, A.M.; Breman, J.G.; McKenzie, F.E. Using the entomological inoculation rate to assess the impact of vector control on malaria parasite transmission and elimination. Malar. J. 2010, 9, 122. [Google Scholar] [CrossRef]
- Adde, A.; Roux, E.; Mangeas, M.; Dessay, N.; Nacher, M.; Dusfour, I.; Girod, R.; Briolant, S. Dynamical mapping of anopheles darlingi densities in a residual malaria transmission area of French guiana by using remote sensing and meteorological data. PLoS ONE 2016, 11, e0164685. [Google Scholar] [CrossRef]
- Rosà, R.; Marini, G.; Bolzoni, L.; Neteler, M.; Metz, M.; Delucchi, L.; Chadwick, E.; Balbo, L.; Mosca, A.; Giacobini, M.; et al. Early warning of West Nile virus mosquito vector: Climate and land use models successfully explain phenology and abundance of Culex pipiens mosquitoes in north-western Italy. Parasites Vectors 2014, 7. [Google Scholar] [CrossRef] [PubMed]
- German, A.; Espinosa, M.O.; Abril, M.; Scavuzzo, C.M. Exploring satellite based temporal forecast modelling of Aedes aegypti oviposition from an operational perspective. Remote. Sens. Appl. Soc. Environ. 2018, 11, 231–240. [Google Scholar] [CrossRef]
- Scavuzzo, J.M.; Trucco, F.; Espinosa, M.; Tauro, C.B.; Abril, M.; Scavuzzo, C.M.; Frery, A.C. Modeling Dengue vector population using remotely sensed data and machine learning. Acta Trop. 2018, 185, 167–175. [Google Scholar] [CrossRef] [PubMed]
- Benali, A.; Nunes, J.P.; Freitas, F.B.; Sousa, C.A.; Novo, M.T.; Lourenço, P.M.; Lima, J.C.; Seixas, J.; Almeida, A.P. Satellite-derived estimation of environmental suitability for malaria vector development in Portugal. Remote. Sens. Environ. 2014, 145, 116–130. [Google Scholar] [CrossRef]
- Mokraoui, L.; Noor, N.; Abdullah, A. Developing dengue index through the integration of crowdsourcing approach (X-Waba). IOP Conf. Ser. Earth Environ. Sci. 2018, 169. [Google Scholar] [CrossRef]
- Lessler, J.; Azman, A.S.; Grabowski, M.K.; Salje, H.; Rodriguez-Barraquer, I. Trends in the Mechanistic and Dynamic Modeling of Infectious Diseases. Curr. Epidemiol. Rep. 2016, 3, 212–222. [Google Scholar] [CrossRef]
- Parham, P.E.; Waldock, J.; Christophides, G.K.; Hemming, D.; Agusto, F.; Evans, K.J.; Fefferman, N.; Gaff, H.; Gumel, A.; Ladeau, S.; et al. Climate, environmental and socio-economic change: Weighing up the balance in vector-borne disease transmission. Philos. Trans. R. Soc. Lond. Ser. Biol. Sci. 2015, 370, 20130551. [Google Scholar] [CrossRef] [PubMed]
- Freitas, S.C.; Trigo, I.F.; Macedo, J.; Barroso, C.; Silva, R.; Perdigão, R. Land surface temperature from multiple geostationary satellites. Int. J. Remote Sens. 2013, 34, 3051–3068. [Google Scholar] [CrossRef]
- Weiss, D.J.; Bhatt, S.; Mappin, B.; Van Boeckel, T.P.; Smith, D.L.; Hay, S.I.; Gething, P.W. Air temperature suitability for Plasmodium falciparum malaria transmission in Africa 2000–2012: A high-resolution spatiotemporal prediction. Malar. J. 2014, 13, 171. [Google Scholar] [CrossRef]
- Albergel, C.; Dutra, E.; Muñoz-Sabater, J.; Haiden, T.; Balsamo, G.; Beljaars, A.; Isaksen, L.; de Rosnay, P.; Sandu, I.; Wedi, N. Soil temperature at ECMWF: An assessment using ground-based observations. J. Geophys. Res. 2015, 120, 1361–1373. [Google Scholar] [CrossRef]
- Méndez-Lázaro, P.; Muller-Karger, F.E.; Otis, D.; McCarthy, M.J.; Peña-Orellana, M.; Méndez-Lázaro, P.; Muller-Karger, F.E.; Otis, D.; McCarthy, M.J.; Peña-Orellana, M. Assessing Climate Variability Effects on Dengue Incidence in San Juan, Puerto Rico. Int. J. Environ. Res. Public Health 2014, 11, 9409–9428. [Google Scholar] [CrossRef] [PubMed]
- Laureano-Rosario, A.E.; Garcia-Rejon, J.E.; Gomez-Carro, S.; Farfan-Ale, J.A.; Muller-Karger, F.E. Modelling dengue fever risk in the State of Yucatan, Mexico using regional-scale satellite-derived sea surface temperature. Acta Trop. 2017, 172, 50–57. [Google Scholar] [CrossRef] [PubMed]
- Bhatt, S.; Gething, P.W.; Brady, O.J.; Messina, J.P.; Farlow, A.W.; Moyes, C.L.; Drake, J.M.; Brownstein, J.S.; Hoen, A.G.; Sankoh, O.; et al. The global distribution and burden of dengue. Nature 2013, 496, 504–507. [Google Scholar] [CrossRef] [PubMed]
- Benedum, C.M.; Seidahmed, O.M.E.; Eltahir, E.A.B.; Markuzon, N. Statistical modeling of the effect of rainfall flushing on dengue transmission in Singapore. PLoS Neglected Trop. Dis. 2018, 12, e0006935. [Google Scholar] [CrossRef] [PubMed]
- Thakur, S.; Dharavath, R. Artificial neural network based prediction of malaria abundances using big data: A knowledge capturing approach. Clin. Epidemiol. Glob. Health 2018, 7, 121–126. [Google Scholar] [CrossRef]
- Ashby, J.; Moreno-Madriñán, M.M.J.; Yiannoutsos, C.T.C.; Stanforth, A. Niche modeling of dengue fever using remotely sensed environmental factors and boosted regression trees. Remote. Sens. 2017, 9. [Google Scholar] [CrossRef]
- Midekisa, A.; Senay, G.; Henebry, G.M.; Semuniguse, P.; Wimberly, M.C. Remote sensing-based time series models for malaria early warning in the highlands of Ethiopia. Malar. J. 2012, 11, 165. [Google Scholar] [CrossRef] [PubMed]
- Sewe, M.O.; Tozan, Y.; Ahlm, C.; Rocklöv, J. Using remote sensing environmental data to forecast malaria incidence at a rural district hospital in Western Kenya. Sci. Rep. 2017, 7, 2589. [Google Scholar] [CrossRef]
- Merkord, C.L.; Liu, Y.; Mihretie, A.; Gebrehiwot, T.; Awoke, W.; Bayabil, E.; Henebry, G.M.; Kassa, G.T.; Lake, M.; Wimberly, M.C. Integrating malaria surveillance with climate data for outbreak detection and forecasting: The EPIDEMIA system. Malar. J. 2017, 16, 1–89. [Google Scholar] [CrossRef]
- Pettorelli, N.; Ryan, S.; Mueller, T.; Bunnefeld, N.; Jedrzejewska, B.; Lima, M.; Kausrud, K. The Normalized Difference Vegetation Index (NDVI): Unforeseen successes in animal ecology. Clim. Res. 2011, 46, 15–27. [Google Scholar] [CrossRef]
- Liu, J.; Chen, X.P. Relationship of Remote Sensing Normalized Differential Vegetation Index to Anopheles Density and Malaria Incidence Rate. Biomed. Environ. Sci. 2006, 19, 130–132. [Google Scholar] [PubMed]
- Huete, A.; Didan, K.; Miura, T.; Rodriguez, E.; Gao, X.; Ferreira, L. Overview of the radiometric and biophysical performance of the MODIS vegetation indices. Remote. Sens. Environ. 2002, 83, 195–213. [Google Scholar] [CrossRef]
- Ruangudomsakul, C.; Duangsin, A.; Kerdprasop, K.; Kerdprasop, N. Application of Remote Sensing Data for Dengue Outbreak Estimation Using Bayesian Network. Int. J. Mach. Learn. Comput. 2018, 8. [Google Scholar] [CrossRef]
- Chabot-Couture, G.; Nigmatulina, K.; Eckhoff, P. An environmental data set for vector-borne disease modeling and epidemiology. PLoS ONE 2014, 9. [Google Scholar] [CrossRef] [PubMed]
- Cao, G.; Han, D.; Song, X. Evaluating actual evapotranspiration and impacts of groundwater storage change in the North China Plain. Hydrol. Process. 2014, 28, 1797–1808. [Google Scholar] [CrossRef]
- Tsouni, A.; Kontoes, C.; Koutsoyiannis, D.; Elias, P.; Mamassis, N. Estimation of Actual Evapotranspiration by Remote Sensing: Application in Thessaly Plain, Greece. Sensors 2008, 8, 3586–3600. [Google Scholar] [CrossRef] [PubMed]
- Chuang, T.W.; Wimberly, M. Remote Sensing of Climatic Anomalies and West Nile Virus Incidence in the Northern Great Plains of the United States. PLoS ONE 2012, 7. [Google Scholar] [CrossRef]
- Bui, Q.T.; Nguyen, Q.H.; Pham, V.M.; Pham, M.H.; Tran, A.T. Understanding spatial variations of malaria in Vietnam using remotely sensed data integrated into GIS and machine learning classifiers. Geocarto Int. 2018, 6049, 1–15. [Google Scholar] [CrossRef]
- Kanyangarara, M.; Mamini, E.; Mharakurwa, S.; Munyati, S.; Gwanzura, L.; Kobayashi, T.; Shields, T.; Mullany, L.C.; Mutambu, S.; Mason, P.R.; et al. Reduction in malaria incidence following indoor residual spraying with actellic 300 CS in a setting with pyrethroid resistance: Mutasa District, Zimbabwe. PLoS ONE 2016, 11, e0151971. [Google Scholar] [CrossRef]
- Homan, T.; Maire, N.; Hiscox, A.; Di Pasquale, A.; Kiche, I.; Onoka, K.; Mweresa, C.; Mukabana, W.R.; Ross, A.; Smith, T.A.; et al. Spatially variable risk factors for malaria in a geographically heterogeneous landscape, western Kenya: An explorative study. Malar. J. 2016, 15, 1. [Google Scholar] [CrossRef]
- Atieli, H.E.; Zhou, G.; Lee, M.C.; Kweka, E.J.; Afrane, Y.; Mwanzo, I.; Githeko, A.K.; Yan, G. Topography as a modifier of breeding habitats and concurrent vulnerability to malaria risk in the western Kenya highlands. Parasites Vectors 2011, 4, 241. [Google Scholar] [CrossRef] [PubMed]
- Watts, A.G.; Miniota, J.; Joseph, H.A.; Brady, O.J.; Kraemer, M.U.G.; Grills, A.W.; Morrison, S.; Esposito, D.H.; Nicolucci, A.; German, M.; et al. Elevation as a proxy for mosquito-borne Zika virus transmission in the Americas. PLoS ONE 2017, 12, e0178211. [Google Scholar] [CrossRef]
- Young, S.G.; Tullis, J.A.; Cothren, J. A remote sensing and GIS-assisted landscape epidemiology approach to West Nile virus. Appl. Geogr. 2013, 45, 241–249. [Google Scholar] [CrossRef]
- Lowe, R.; Bailey, T.C.; Stephenson, D.B.; Jupp, T.E.; Graham, R.J.; Barcellos, C.; Carvalho, M.S. The development of an early warning system for climate-sensitive disease risk with a focus on dengue epidemics in Southeast Brazil. Stat. Med. 2013, 32, 864–883. [Google Scholar] [CrossRef] [PubMed]
- Marcantonio, M.; Rizzoli, A.; Metz, M.; Rosà, R.; Marini, G.; Chadwick, E.; Neteler, M. Identifying the Environmental Conditions Favouring West Nile Virus Outbreaks in Europe. PLoS ONE 2015, 10, e0121158. [Google Scholar] [CrossRef] [PubMed]
- Amadi, J.A.; Olago, D.O.; Ong’amo, G.O.; Oriaso, S.O.; Nanyingi, M.; Nyamongo, I.K.; Estambale, B.B. Sensitivity of vegetation to climate variability and its implications for malaria risk in Baringo, Kenya. PLoS ONE 2018, 13. [Google Scholar] [CrossRef]
- Yue, Y.; Sun, J.; Liu, X.; Ren, D.; Liu, Q.; Xiao, X.; Lu, L. Spatial analysis of dengue fever and exploration of its environmental and socio-economic risk factors using ordinary least squares: A case study in five districts of Guangzhou City, China, 2014. Int. J. Infect. Dis. 2018, 75, 39–48. [Google Scholar] [CrossRef]
- Tran, A.; Sudre, B.; Paz, S.; Rossi, M.; Desbrosse, A.; Chevalier, V.; Semenza, J. Environmental predictors of West Nile fever risk in Europe. Int. J. Health Geogr. 2014, 13. [Google Scholar] [CrossRef]
- Hii, Y.L.; Zhu, H.; Ng, N.; Ng, L.C.; Rocklöv, J. Forecast of Dengue Incidence Using Temperature and Rainfall. PLoS Neglected Trop. Dis. 2012, 6, e1908. [Google Scholar] [CrossRef]
- Nizamuddin, M.; Kogan, F.; Dhiman, R.; Guo, W.; Roytman, L. Modeling and Forecasting Malaria in Tripura, INDIA using NOAA/AVHRR-Based Vegetation Health Indices. Int. J. Remote. Sens. Appl. 2013, 3, 108–116. [Google Scholar]
- Quintero, J.; Carrasquilla, G.; Suárez, R.; González, C.; Olano, V.A. An ecosystemic approach to evaluating ecological, socioeconomic and group dynamics affecting the prevalence of Aedes aegypti in two Colombian towns. Cadernos de Saúde Pública 2009, 25, s93–s103. [Google Scholar] [CrossRef] [PubMed]
- Quintero, J.; Brochero, H.; Manrique-Saide, P.; Barrera-Pérez, M.; Basso, C.; Romero, S.; Caprara, A.; De Lima Cunha, J.C.; Beltrán - Ayala, E.; Mitchell-Foster, K.; et al. Ecological, biological and social dimensions of dengue vector breeding in five urban settings of Latin America: A multi-country study. BMC Infect. Dis. 2014, 14, 38. [Google Scholar] [CrossRef]
- Ayala, R.G.; Estrugo, A. Assessing the Effects of Climate and Socioeconomic Factors on Vulnerability to Vector-Borne Diseases in Latin America; Inter-American Development Bank: Washington, DC, USA, 2014. [Google Scholar]
- Monroe, A.; Asamoah, O.; Lam, Y.; Koenker, H.; Psychas, P.; Lynch, M.; Ricotta, E.; Hornston, S.; Berman, A.; Harvey, S.A. Outdoor-sleeping and other night-time activities in northern Ghana: Implications for residual transmission and malaria prevention. Malar. J. 2015, 14, 35. [Google Scholar] [CrossRef] [PubMed]
- Sarfraz, M.S.; Tripathi, N.K.; Kitamoto, A. Near real-time characterisation of urban environments: A holistic approach for monitoring dengue fever risk areas. Int. J. Digit. Earth 2014, 7, 916–934. [Google Scholar] [CrossRef]
- Generalized Linear Models and Generalized Additive Models 13.1 Generalized Linear Models and Iterative Least Squares. Available online: https://www.stat.cmu.edu/~cshalizi/uADA/12/lectures/ch13.pdf (accessed on 13 May 2019).
- Adimi, F.; Soebiyanto, R.P.; Safi, N.; Kiang, R. Towards malaria risk prediction in Afghanistan using remote sensing. Malar. J. 2010, 9, 125. [Google Scholar] [CrossRef] [PubMed]
- De Oliveira, E.C.; Dos Santos, E.S.; Zeilhofer, P.; Souza-Santos, R.; Atanaka-Santos, M. Geographic information systems and logistic regression for high-resolution malaria risk mapping in a rural settlement of the southern Brazilian Amazon. Malar. J. 2013, 12, 420. [Google Scholar] [CrossRef] [PubMed]
- Shumway, R.H.; Stoffer, D.S. Time Series Analysis and Its Applications: With R Examples, 3rd ed.; Springer: New York, NY, USA, 2011. [Google Scholar]
- Zinszer, K.; Verma, A.D.; Charland, K.; Brewer, T.F.; Brownstein, J.S.; Sun, Z.; Buckeridge, D.L. A scoping review of malaria forecasting: Past work and future directions. BMJ Open 2012, 2, e001992. [Google Scholar] [CrossRef]
- Wang, S.; Feng, J.; Liu, G. Application of seasonal time series model in the precipitation forecast. Math. Comput. Model. 2013, 58, 677–683. [Google Scholar] [CrossRef]
- Khameneh, N.J. Machine Learning for Disease Outbreak Detection using Probabilistic Models. Ph.D. Thesis, École Polytechnique de Montréal, Montreal, QC, Canada, 2014. [Google Scholar]
- Li, Z.; Roux, E.; Dessay, N.; Girod, R.; Stefani, A.; Nacher, M.; Moiret, A.; Seyler, F. Mapping a knowledge-based malaria hazard index related to landscape using remote sensing: Application to the cross-border area between French Guiana and Brazil. Remote. Sens. 2016, 8, 319. [Google Scholar] [CrossRef]
- Catry, T.; Li, Z.; Roux, E.; Herbreteau, V.; Révillion, C.; Dessay, N. Fusion of SAR and optical imagery for studying the ecoepidemiology of vector-borne diseases in tropical countries. In Proceedings of the 2016 European Space Agency Living Planet Symposium, Prague, Czech Republic, 9–13 May 2016. [Google Scholar]
- Catry, T.; Li, Z.; Roux, E.; Herbreteau, V.; Gurgel, H.; Mangeas, M.; Seyler, F.; Dessay, N.; Catry, T.; Li, Z.; et al. Wetlands and Malaria in the Amazon: Guidelines for the Use of Synthetic Aperture Radar Remote-Sensing. Int. J. Environ. Res. Public Health 2018, 15, 468. [Google Scholar] [CrossRef]


| Non-EO Environmental Predictors | Number of Studies (Reference) |
|---|---|
| Demographic data | |
| Population density | 8 [38,41,64,78,82,83,85,86] |
| Socio-economic conditions | |
| Running water | 1 [32] |
| Hygienic services | 1 [32] |
| Electric lighting | 1 [32] |
| Socio-economic status index (SES) | 1 [78] |
| Other non-environmental data | |
| Birds | 2 [31,86] |
| Moon phase | 1 [53] |
| Parameter | Malaria | Dengue | WNV | |||
|---|---|---|---|---|---|---|
| Association | (+) association | (−) association | (+) association | (−) association | (+) association | (−) association |
| TTropical | [35,37,39,45,48,84,88] | [48] | [43,59,64,71] | |||
| TSemi-arid | [63] | |||||
| TSubtropical | [50,85] | [49] | ||||
| TSub-Saharan | [65] | |||||
| TContinental | [75,81,83,86] | |||||
| TMediterranean | [30] | |||||
| PTropical | [35,39,40,84] | [48] | [93] | |||
| PSemi-arid | [63] | [81] | ||||
| PSubtropical | [65] | [50] | [49] | |||
| PSub-Saharan | [65] | |||||
| PContinental | [83] | |||||
| ETTropical | [48] | [48] | ||||
| ETSemi-arid | [63] | |||||
| ETContinental | [75] | |||||
| VegTropical | [38,40,45,84] | [44,71] | ||||
| VegSemi-arid | [34] | [41] | ||||
| VegMediterranean | [52,65] | |||||
| VegContinental | [75] | |||||
| ElContinental | [31] | |||||
| ElSubtropical | [77] | [93] | ||||
| TWITropical | [42] | |||||
| NDWISubtropical | [50,51] | [85] | [86] | [83] | ||
| NDWIContinental | [86] | [83] | ||||
| WSMediterranean | [30] | |||||
| HumMediterranean | [30] | |||||
| PopTropical | [64] | |||||
| PopSemi-arid | [41] | |||||
| PopSubtropical | [85] |
© 2019 by the authors. Licensee MDPI, Basel, Switzerland. This article is an open access article distributed under the terms and conditions of the Creative Commons Attribution (CC BY) license (http://creativecommons.org/licenses/by/4.0/).
Share and Cite
Parselia, E.; Kontoes, C.; Tsouni, A.; Hadjichristodoulou, C.; Kioutsioukis, I.; Magiorkinis, G.; Stilianakis, N.I. Satellite Earth Observation Data in Epidemiological Modeling of Malaria, Dengue and West Nile Virus: A Scoping Review. Remote Sens. 2019, 11, 1862. https://doi.org/10.3390/rs11161862
Parselia E, Kontoes C, Tsouni A, Hadjichristodoulou C, Kioutsioukis I, Magiorkinis G, Stilianakis NI. Satellite Earth Observation Data in Epidemiological Modeling of Malaria, Dengue and West Nile Virus: A Scoping Review. Remote Sensing. 2019; 11(16):1862. https://doi.org/10.3390/rs11161862
Chicago/Turabian StyleParselia, Elisavet, Charalampos Kontoes, Alexia Tsouni, Christos Hadjichristodoulou, Ioannis Kioutsioukis, Gkikas Magiorkinis, and Nikolaos I. Stilianakis. 2019. "Satellite Earth Observation Data in Epidemiological Modeling of Malaria, Dengue and West Nile Virus: A Scoping Review" Remote Sensing 11, no. 16: 1862. https://doi.org/10.3390/rs11161862
APA StyleParselia, E., Kontoes, C., Tsouni, A., Hadjichristodoulou, C., Kioutsioukis, I., Magiorkinis, G., & Stilianakis, N. I. (2019). Satellite Earth Observation Data in Epidemiological Modeling of Malaria, Dengue and West Nile Virus: A Scoping Review. Remote Sensing, 11(16), 1862. https://doi.org/10.3390/rs11161862