Tracking the Land Use/Land Cover Change in an Area with Underground Mining and Reforestation via Continuous Landsat Classification


 ,
, 
Abstract
1. Introduction
2. Materials and Methods
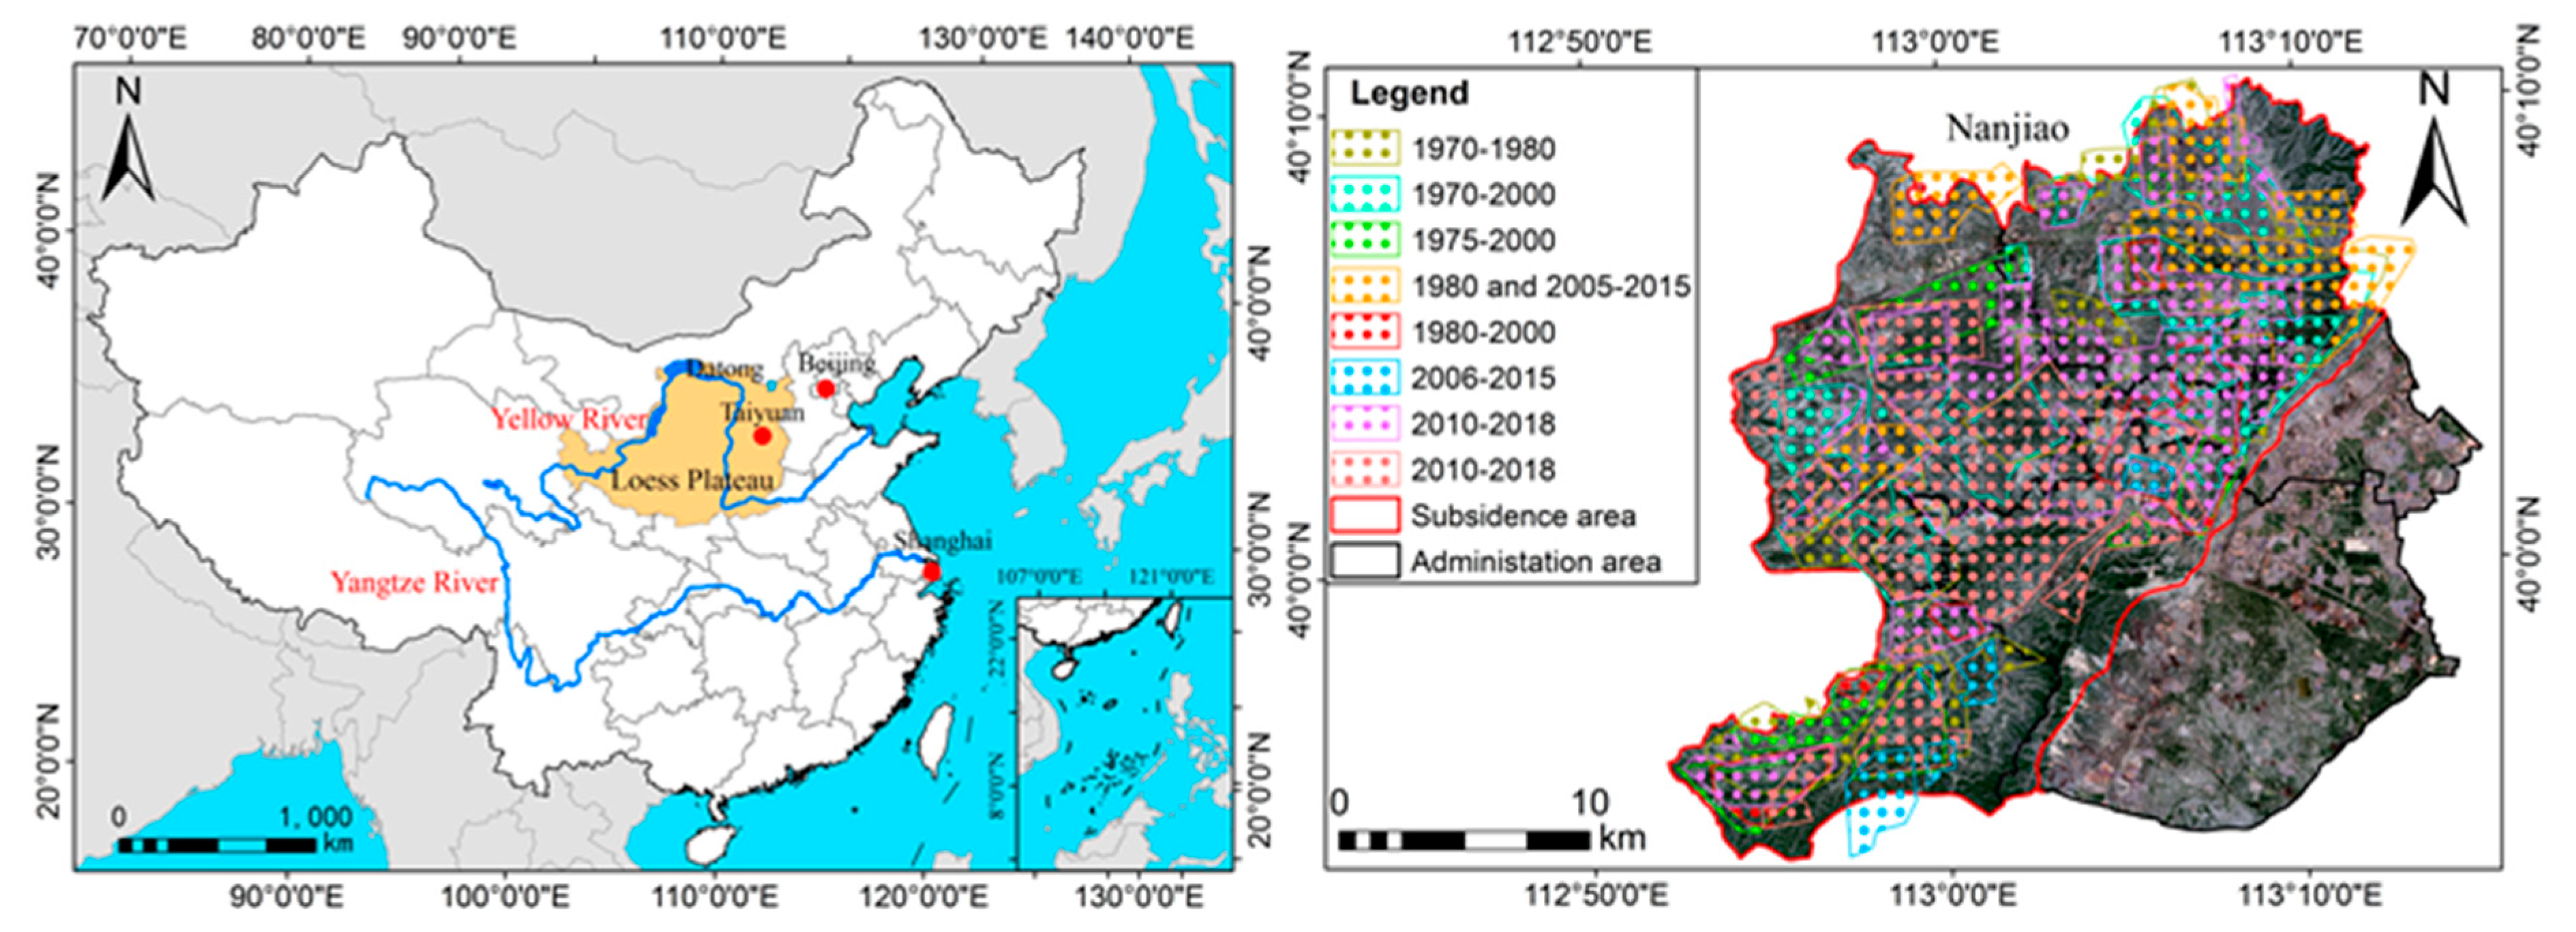
2.1. Study Area
2.2. Training Sample and Datasets
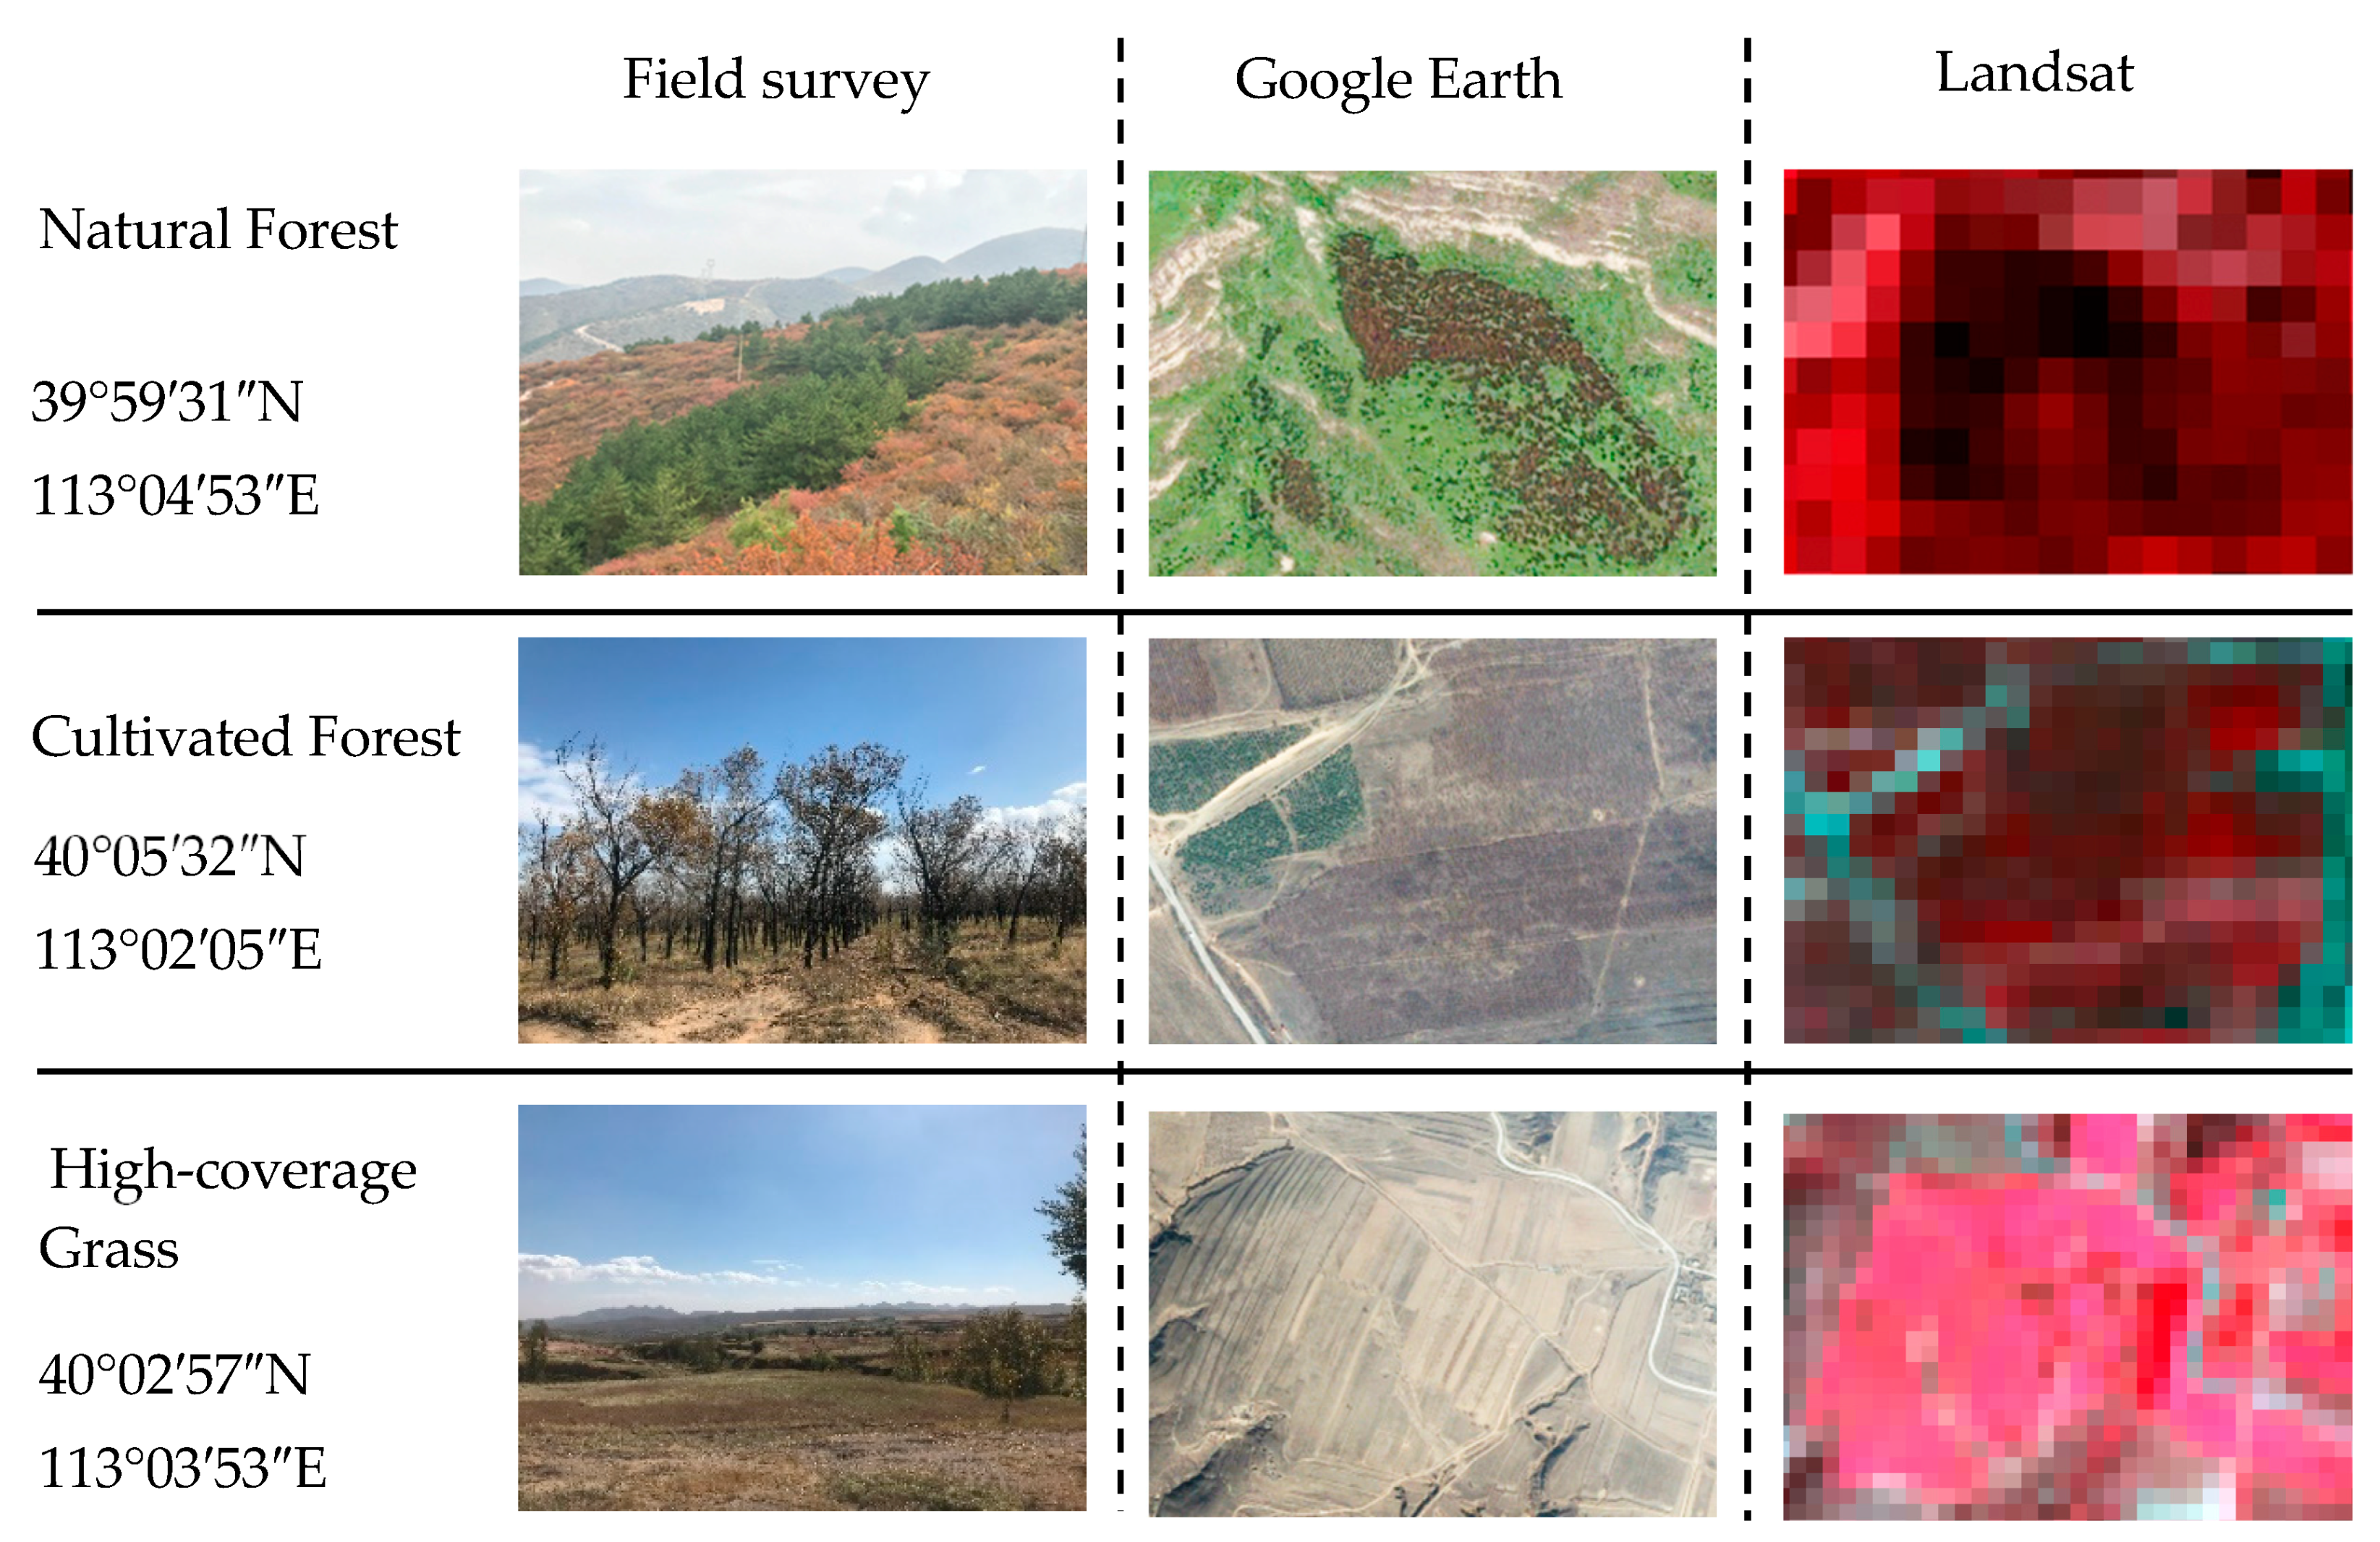
2.2.1. Training Sample Collection
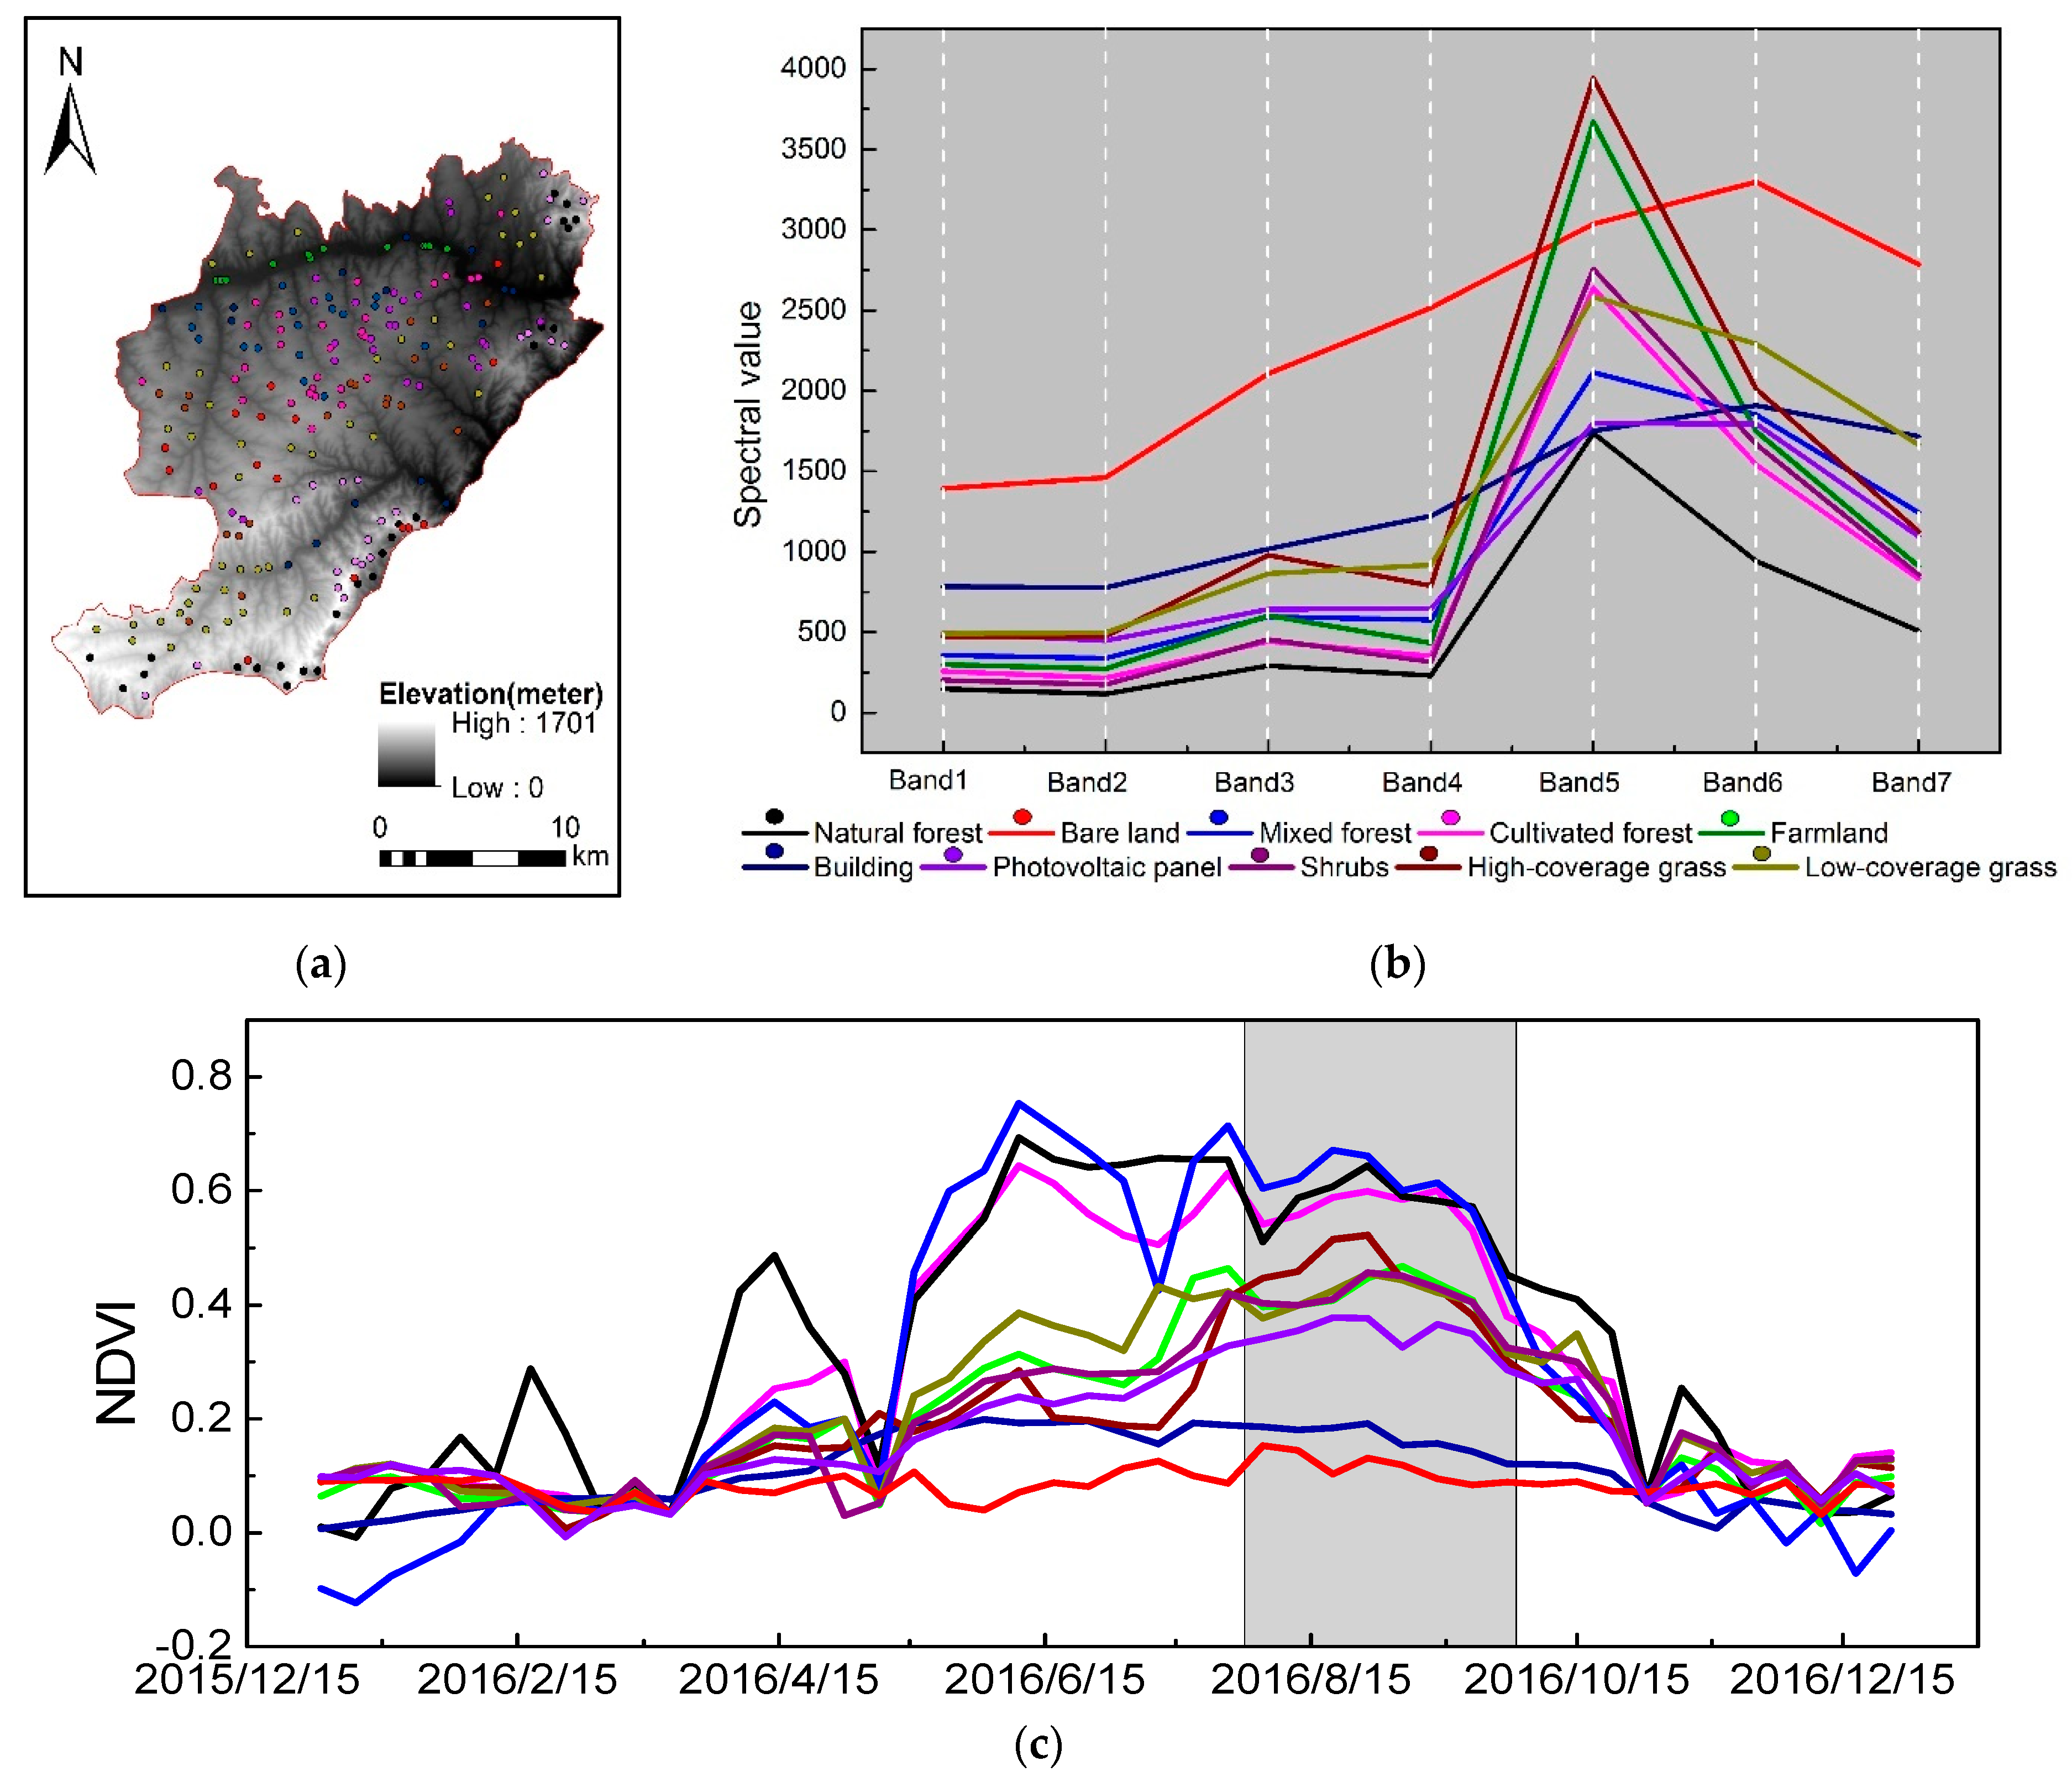
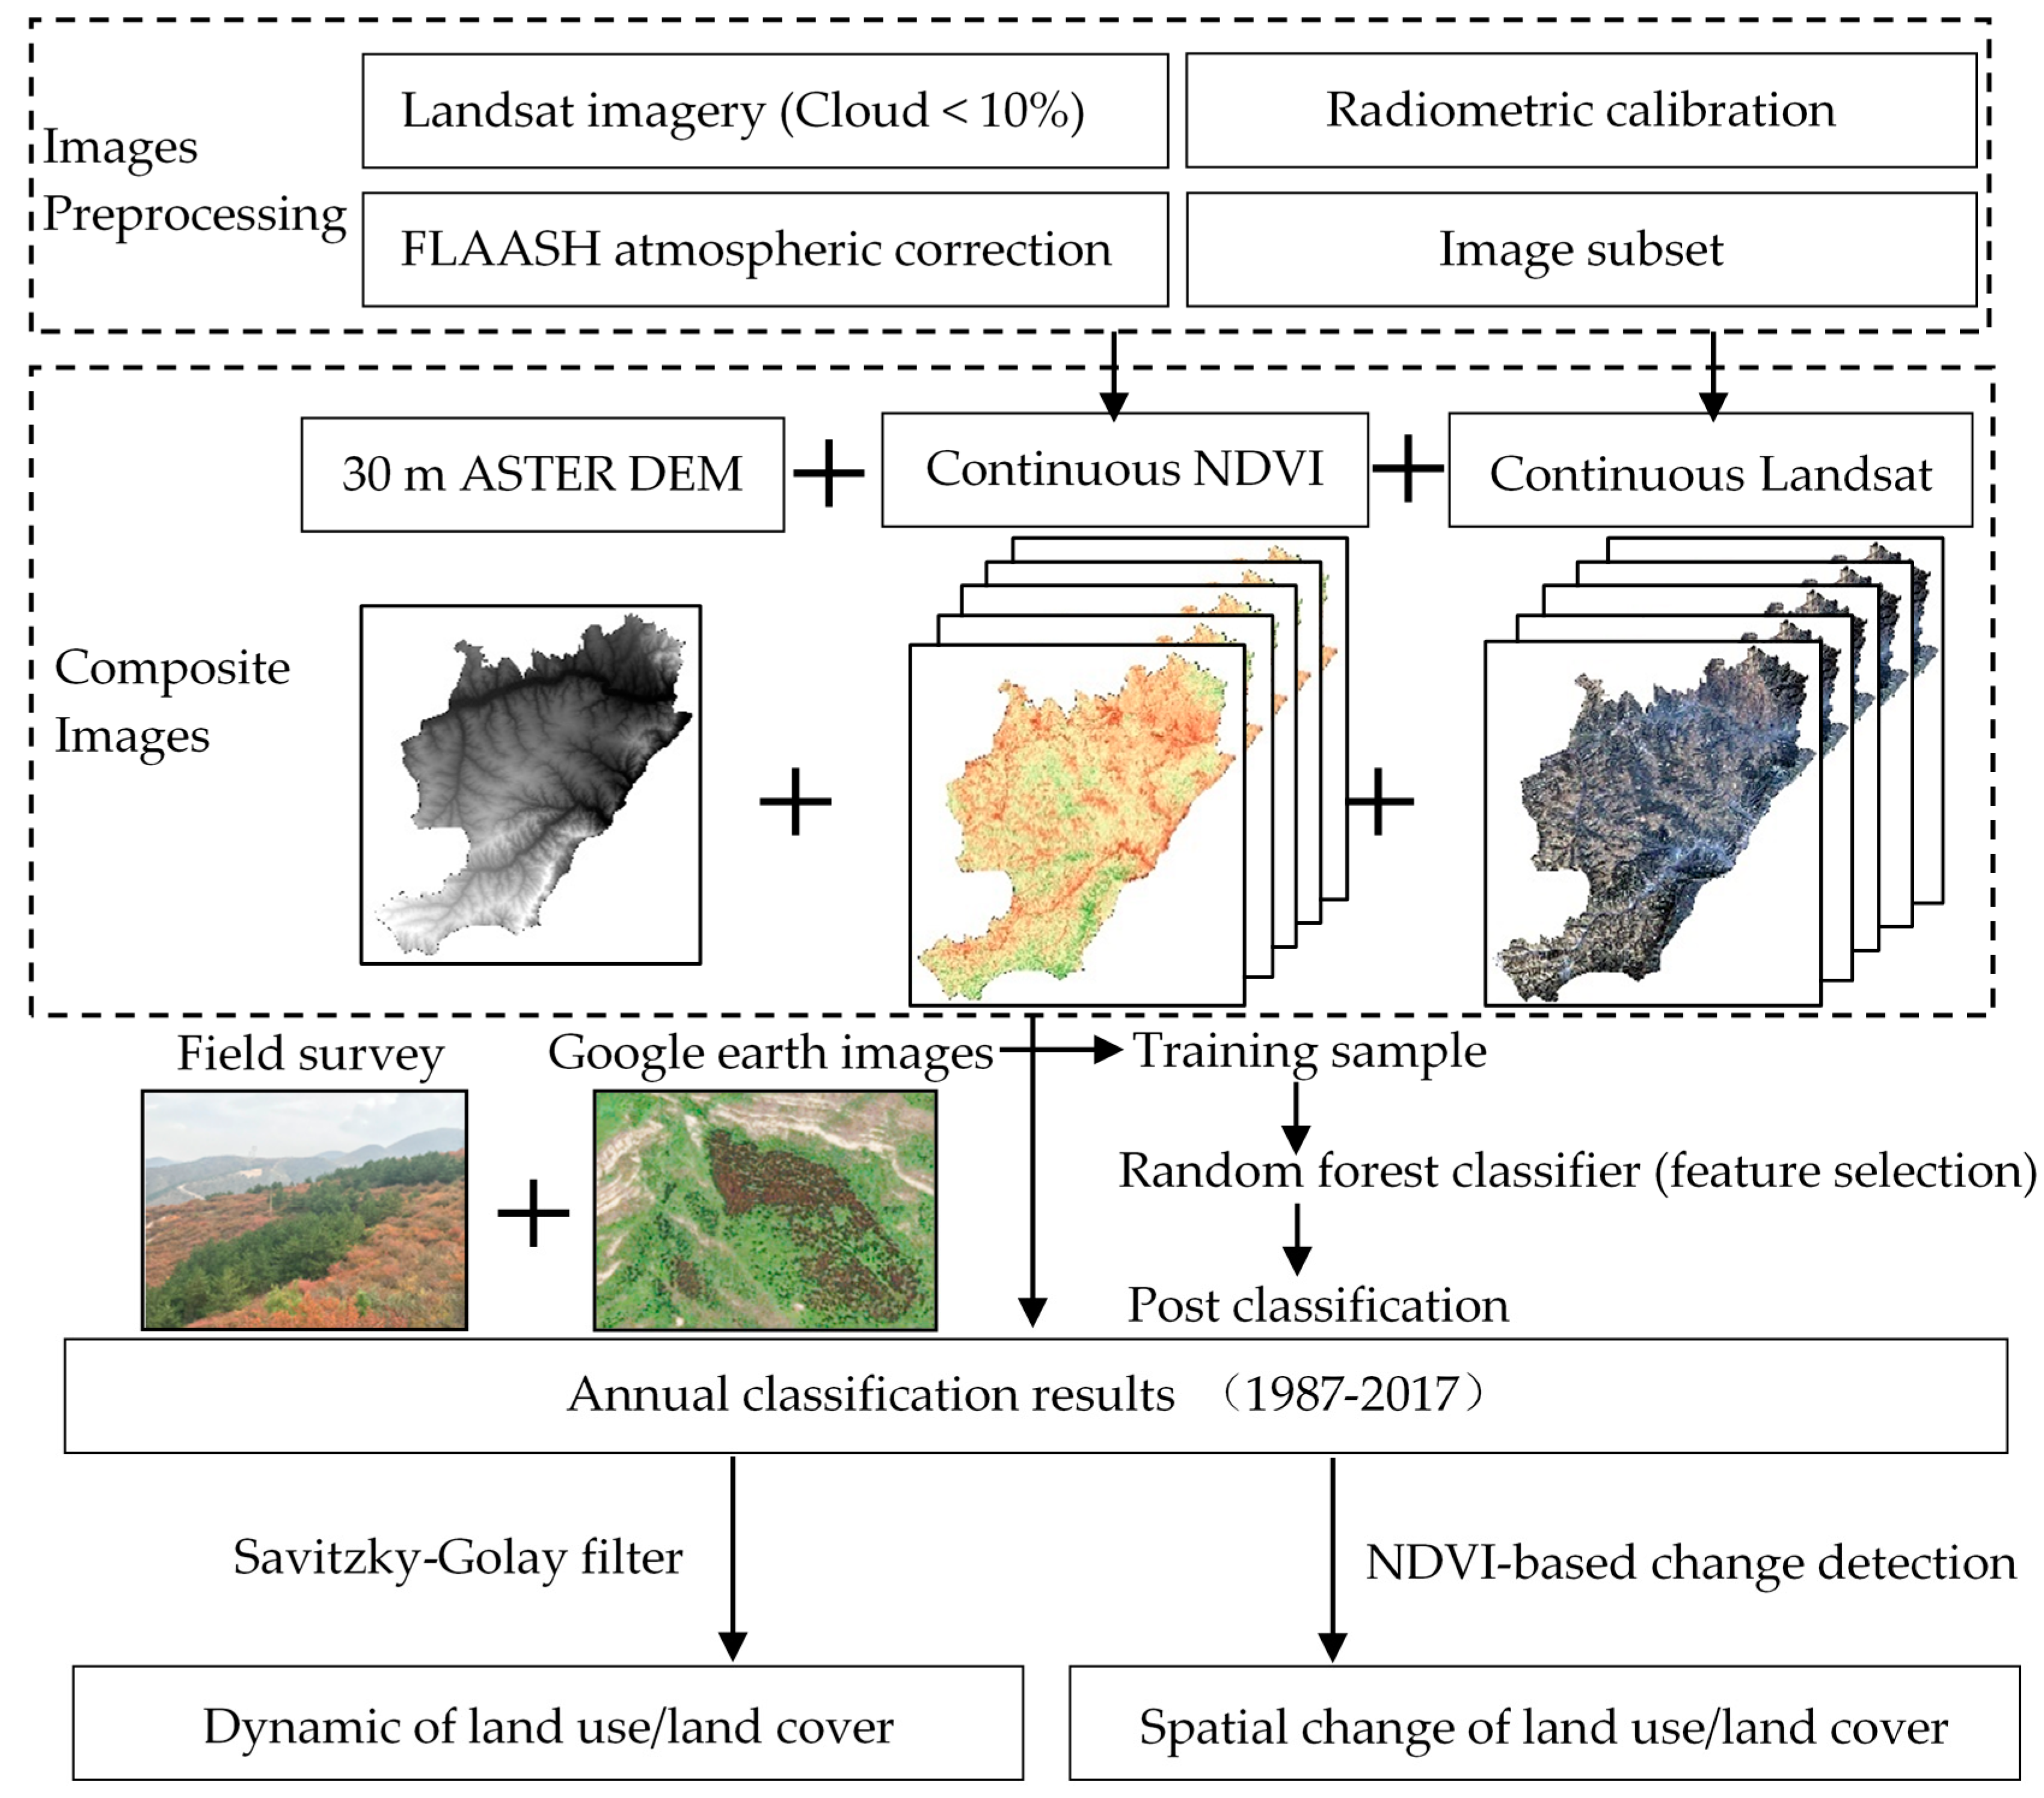
2.2.2. Data Preparation
2.3. Methods
2.3.1. LULC Classification and Change Detection
2.3.2. Accuracy Assessment
2.3.3. Data Analysis
3. Results
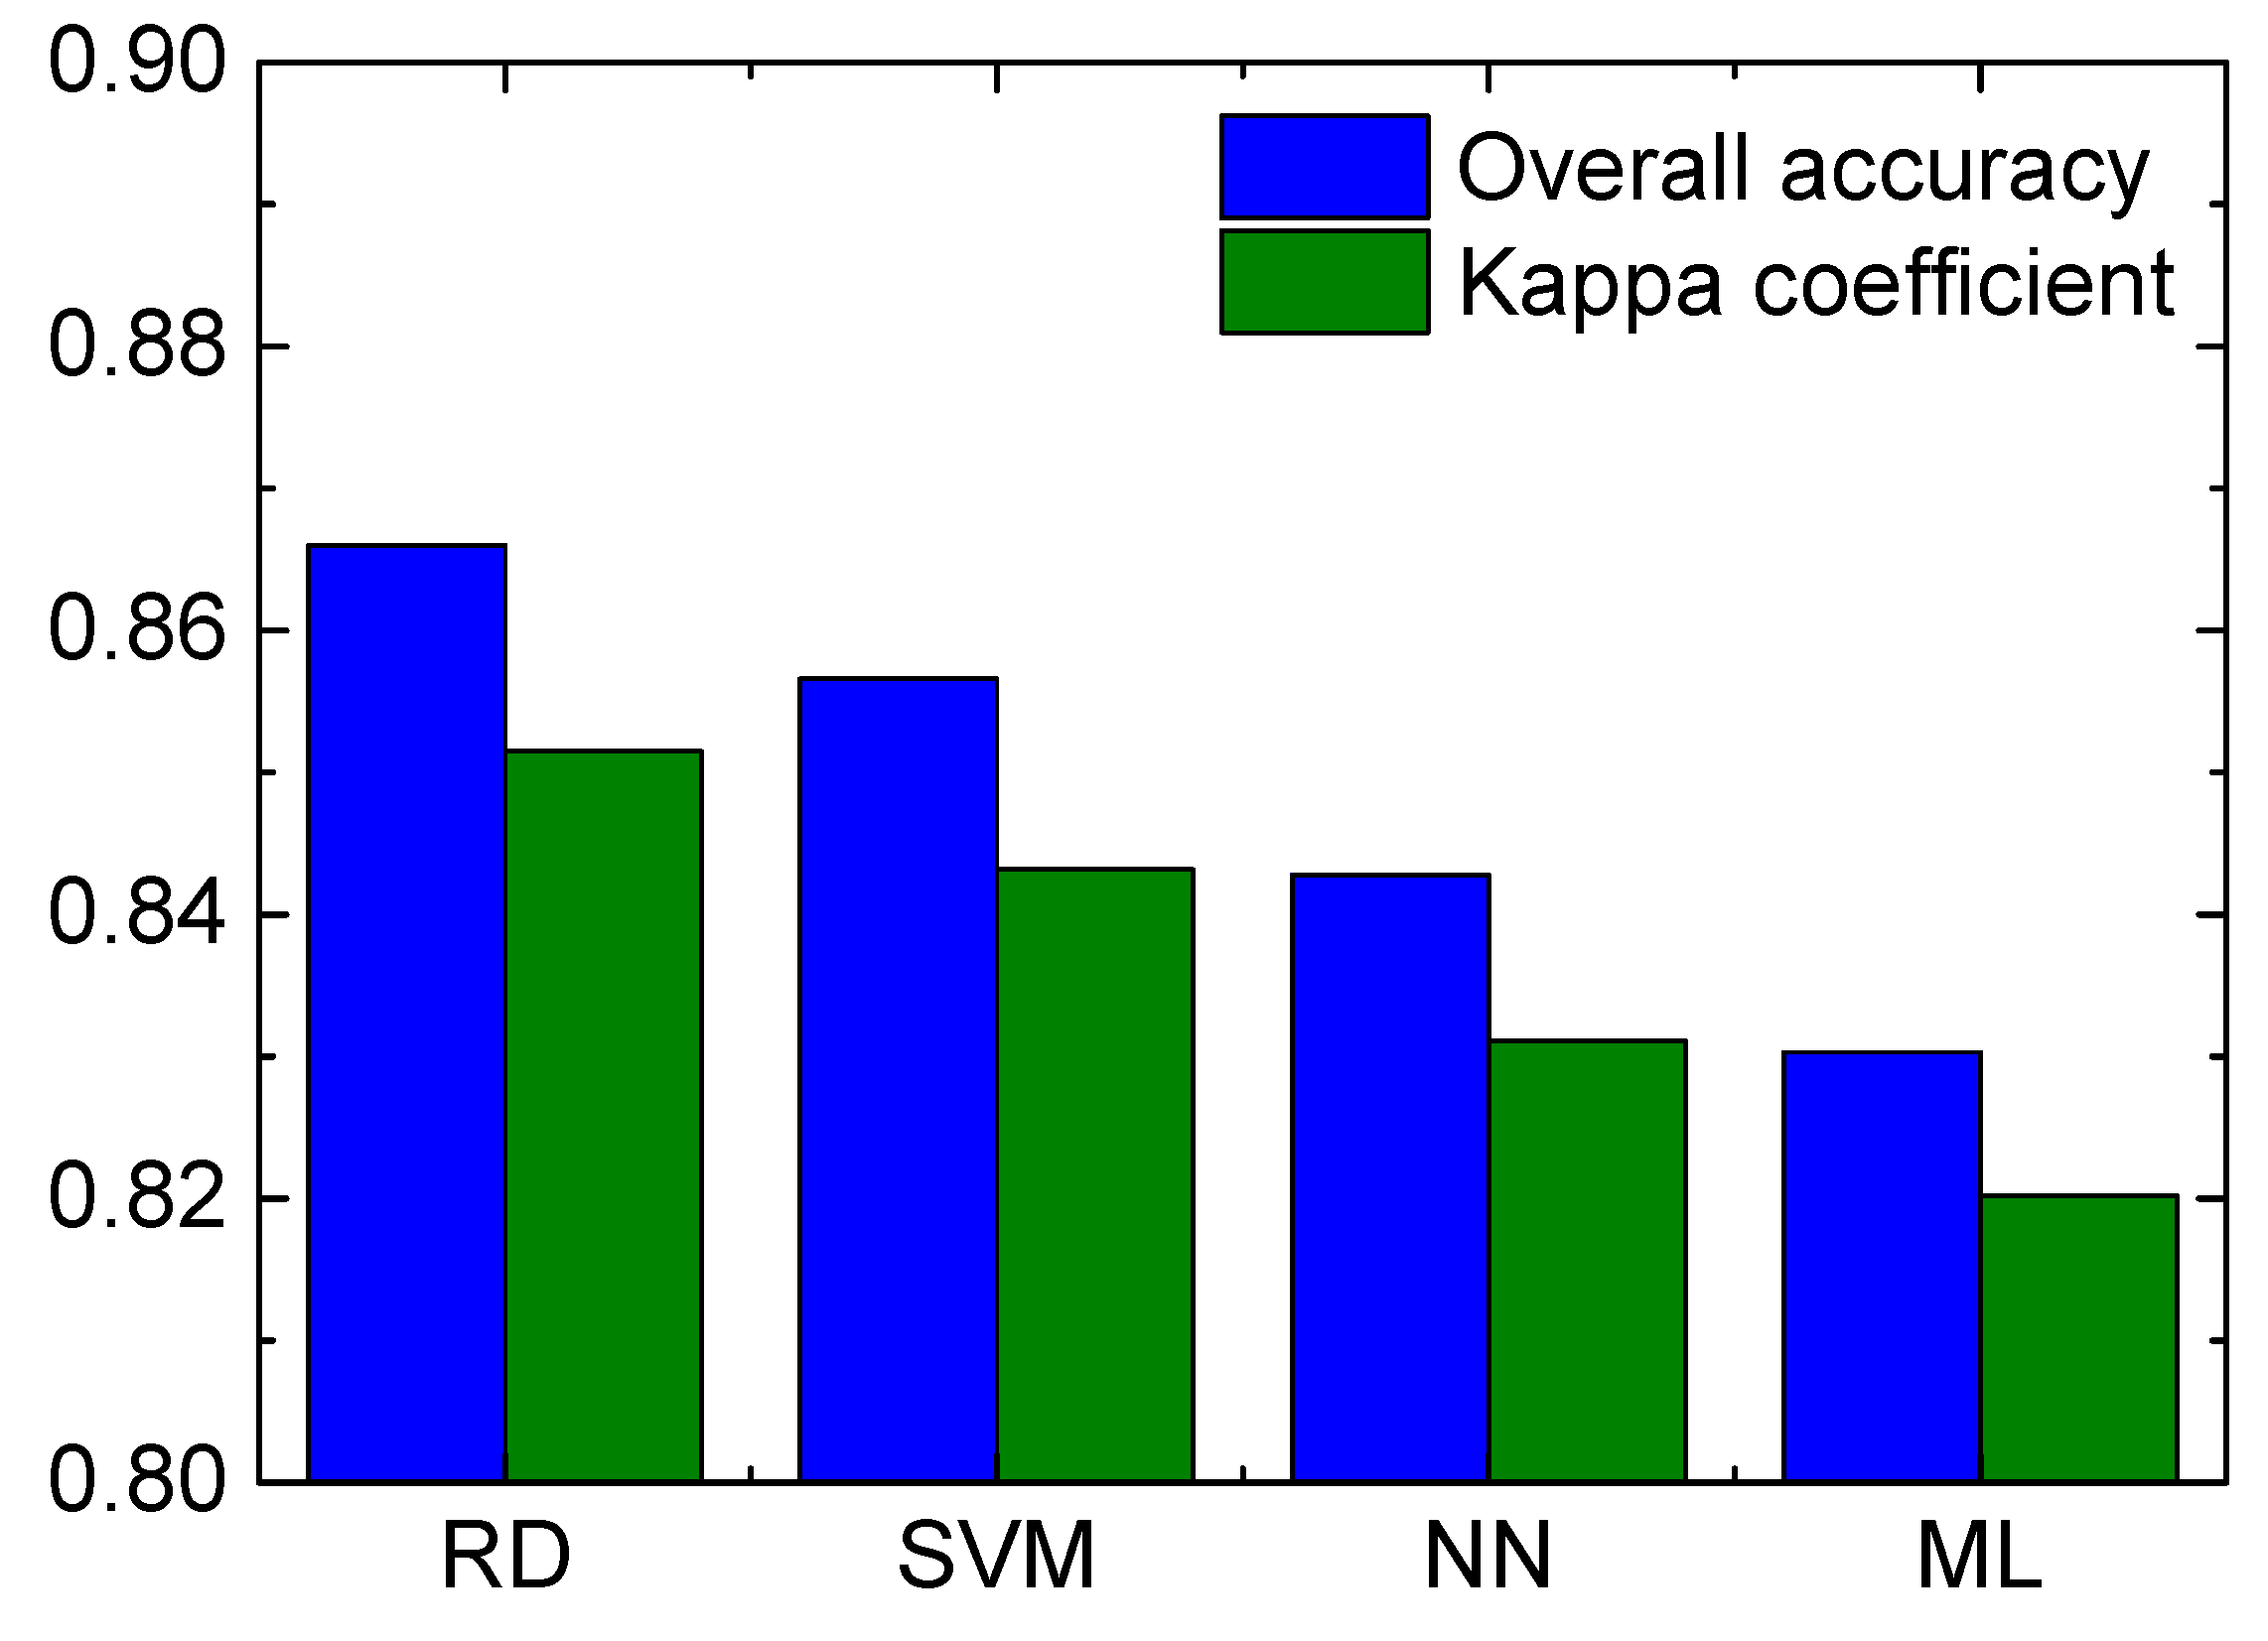
3.1. Performance Assessment of the Classification
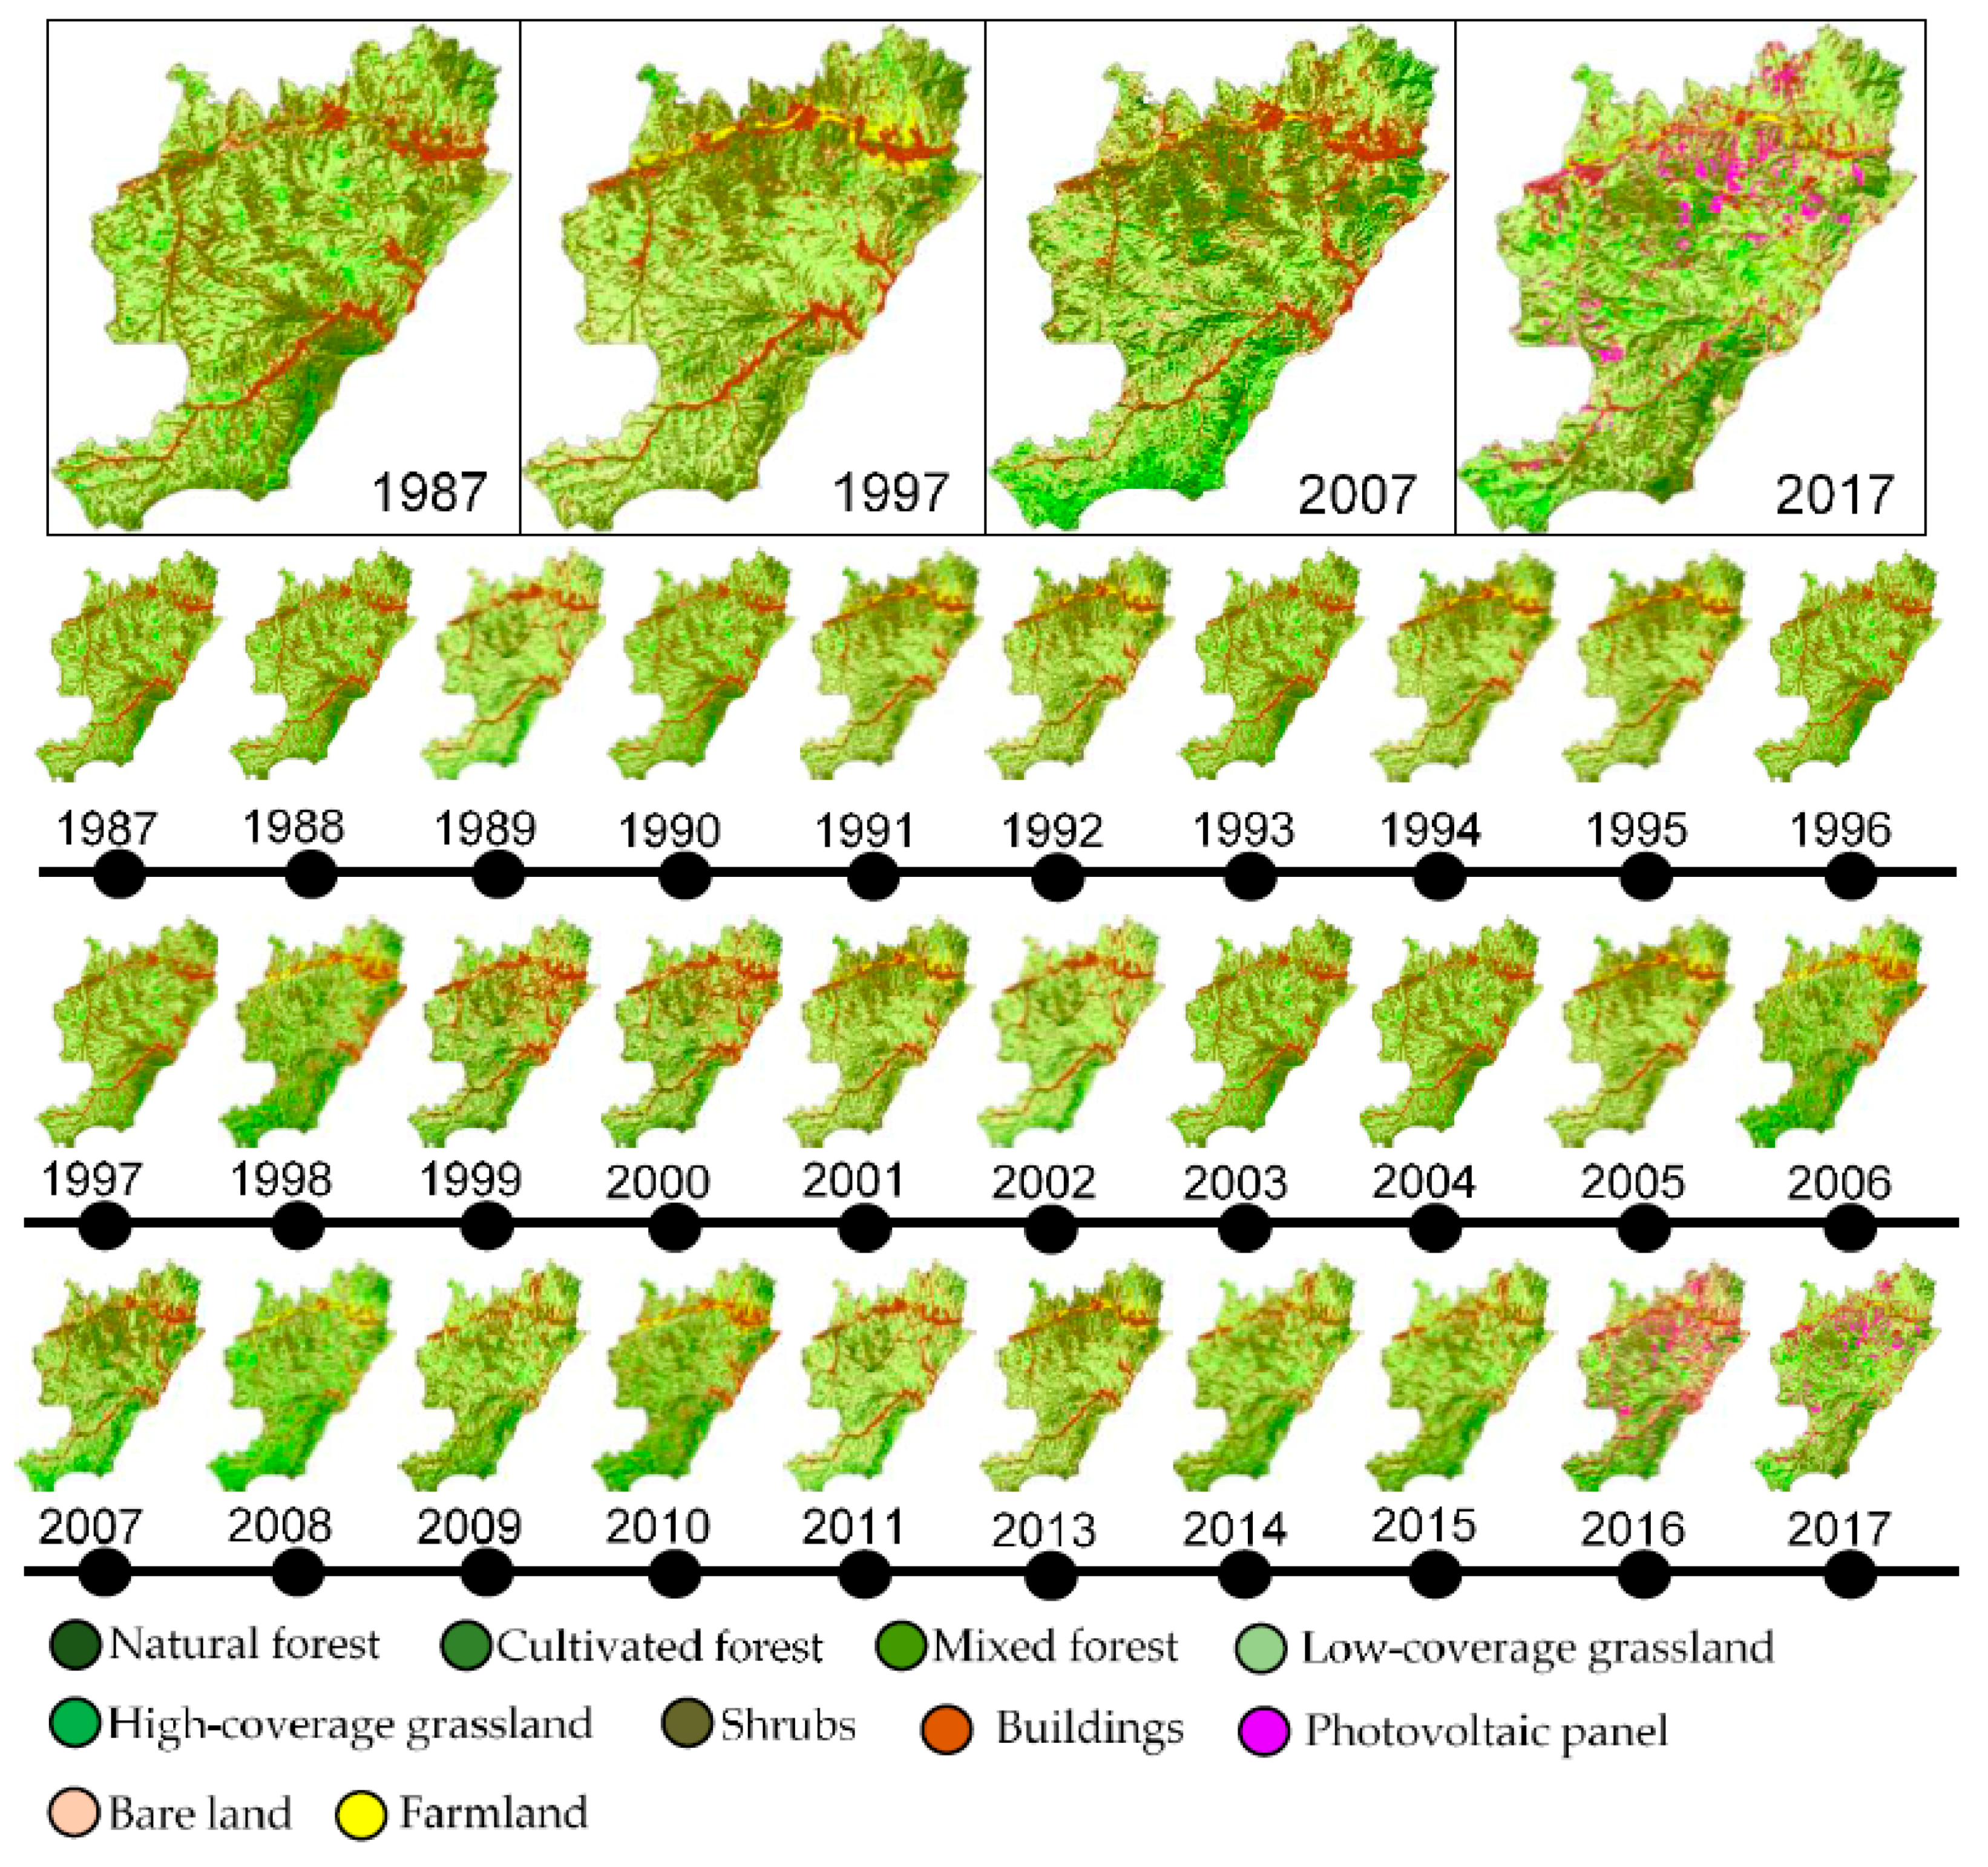
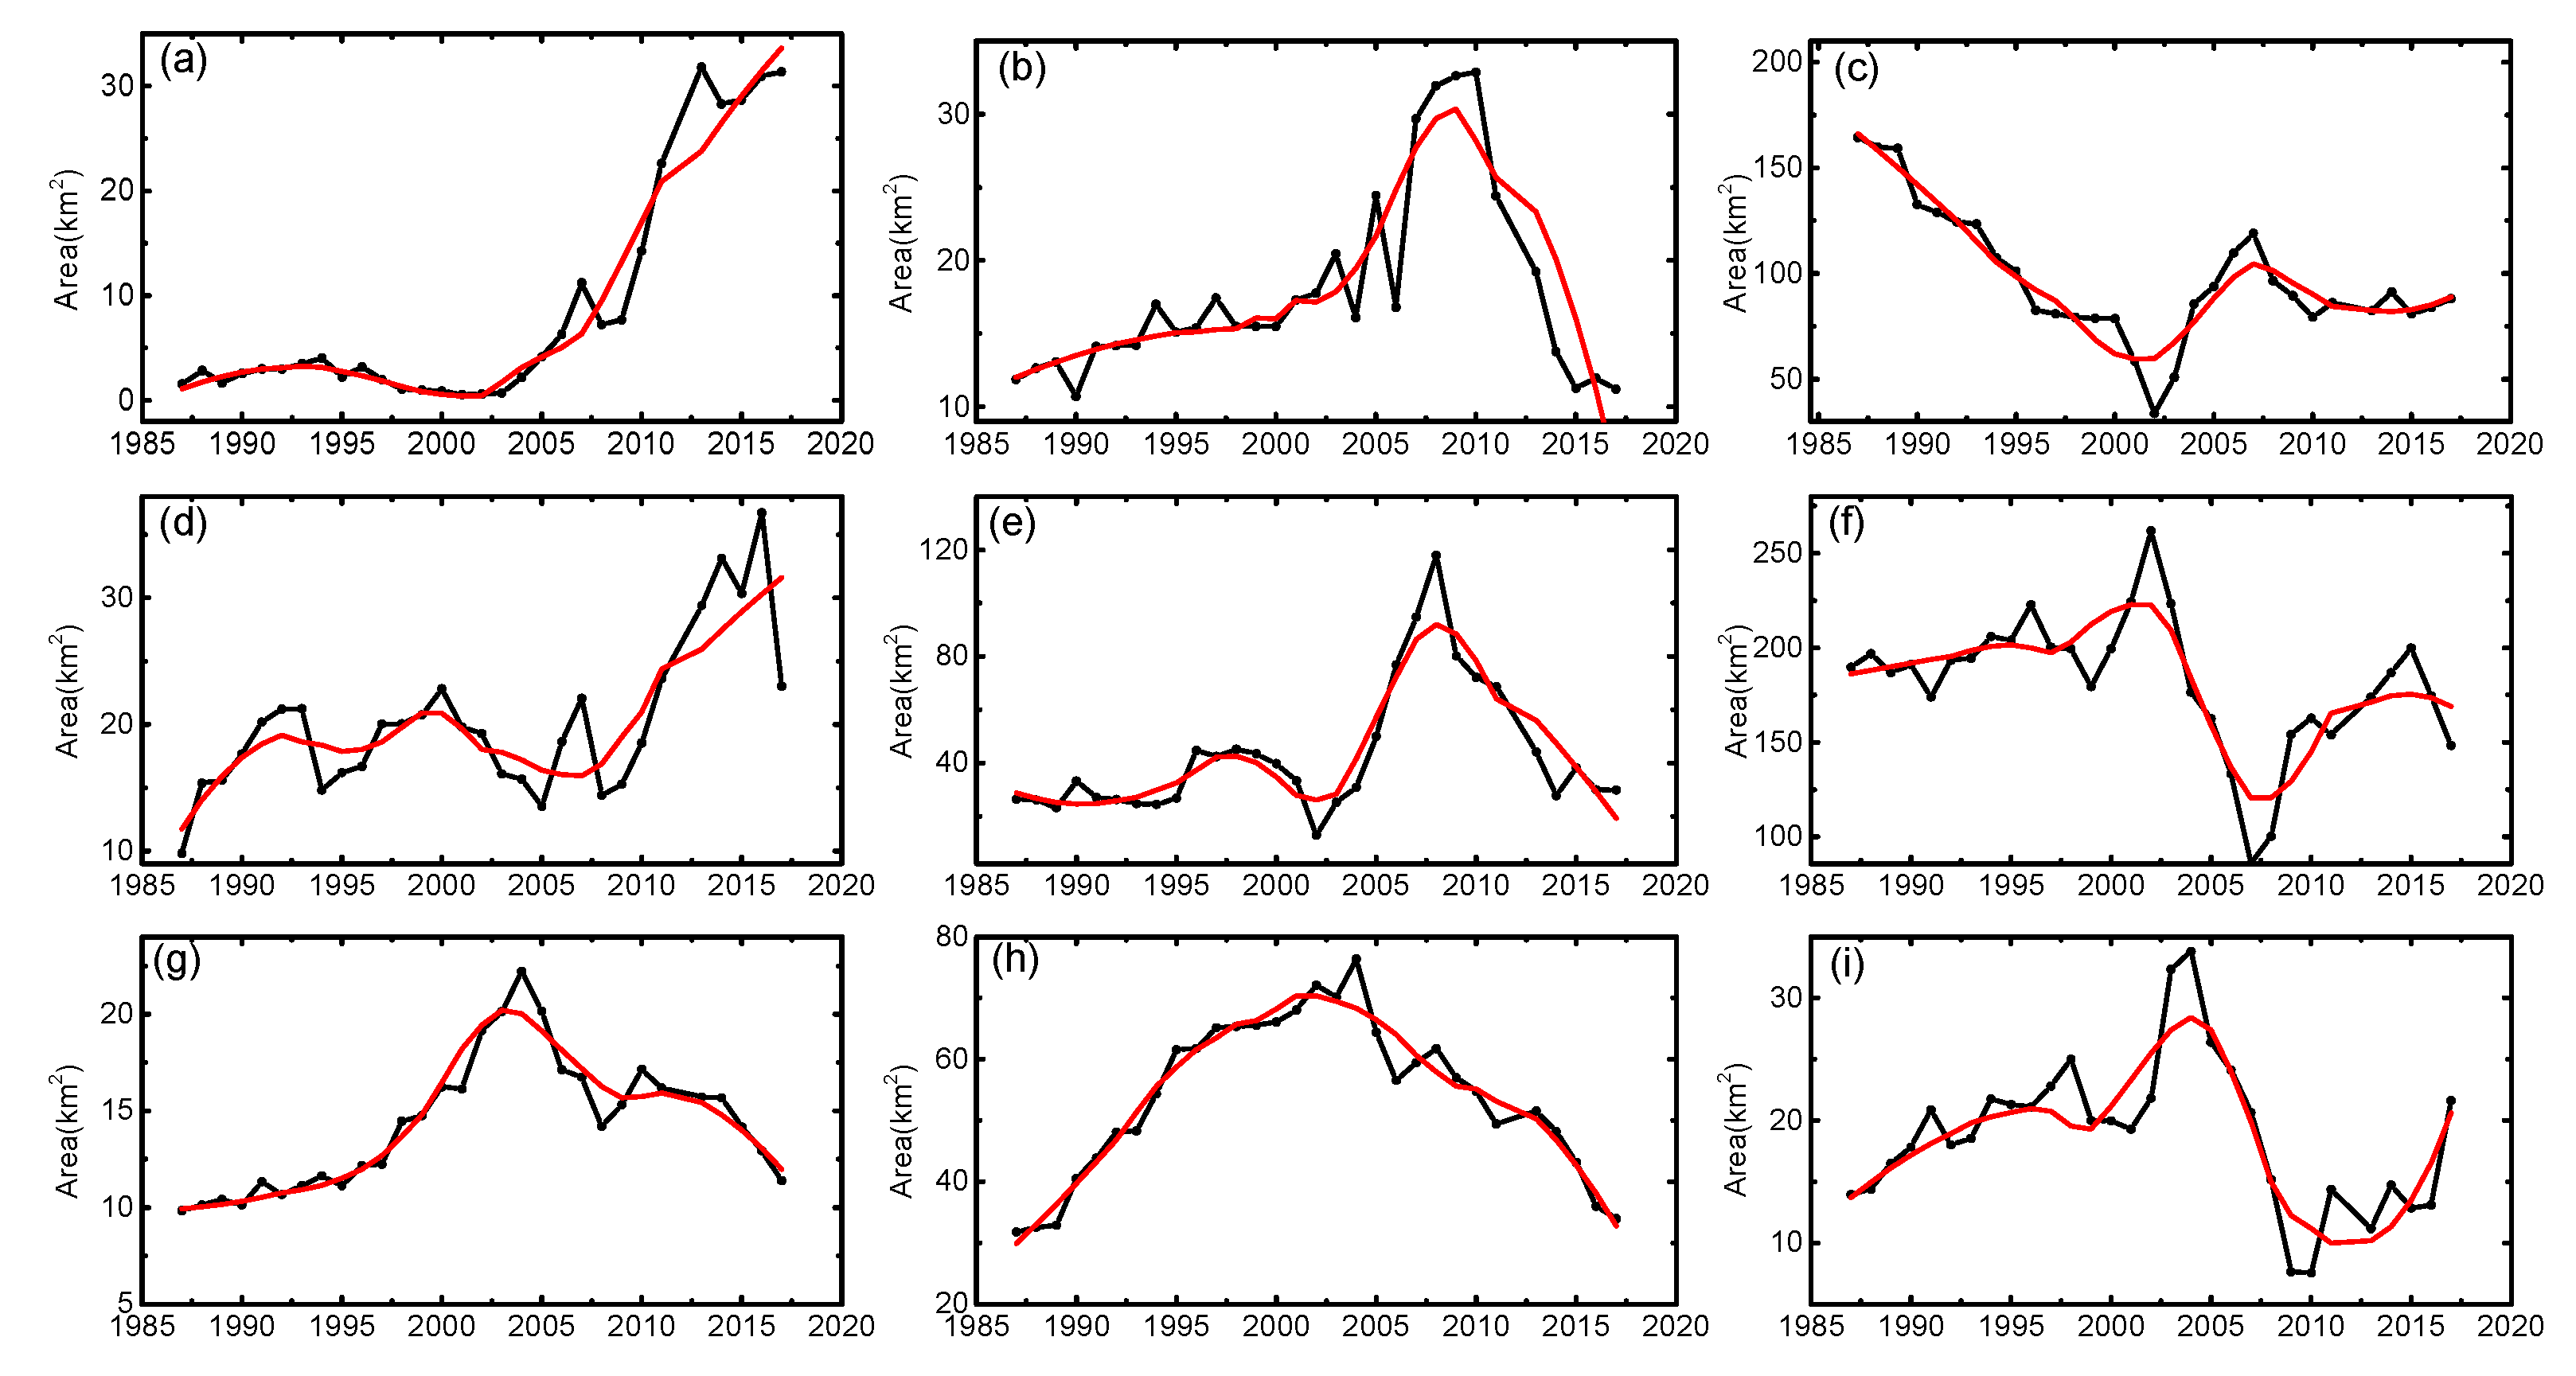
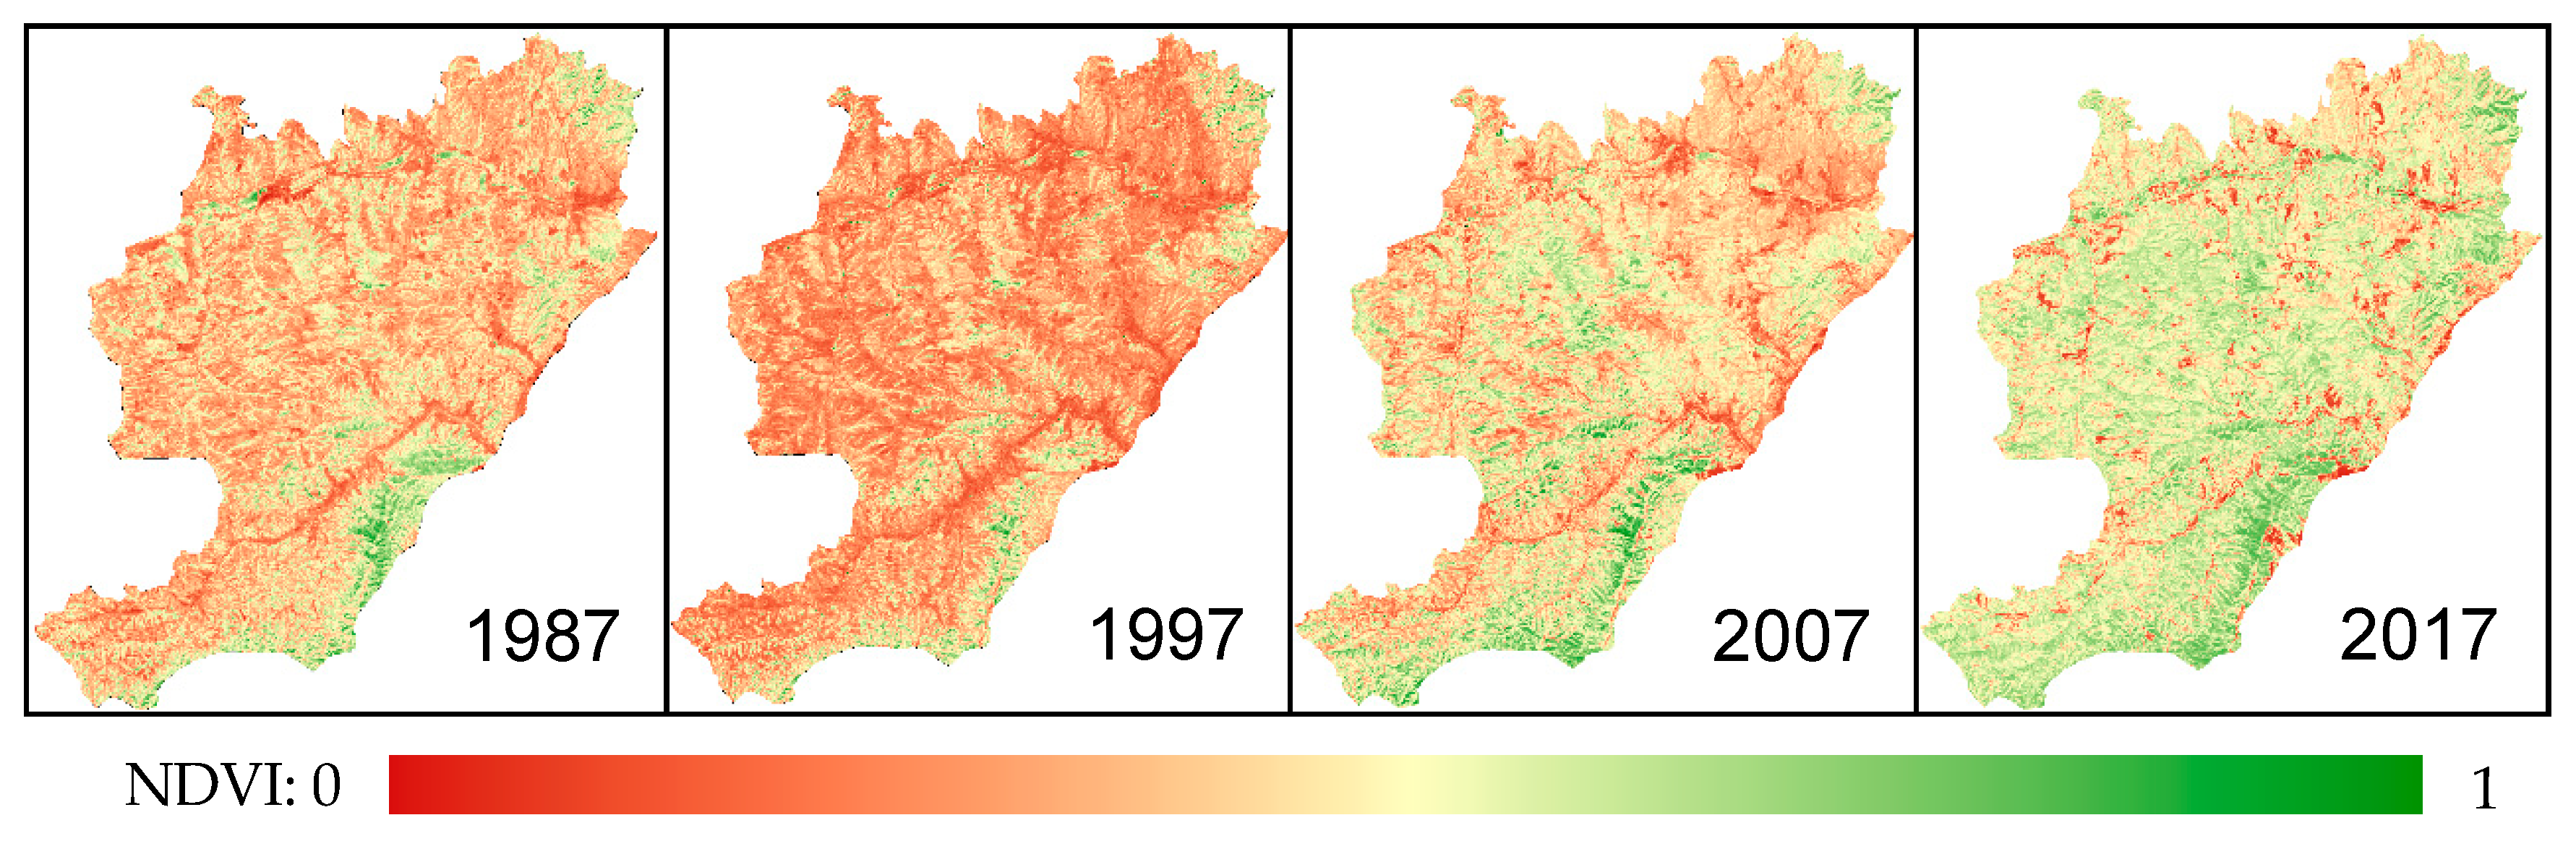
3.2. Temporal and Spatial Changes of LULC
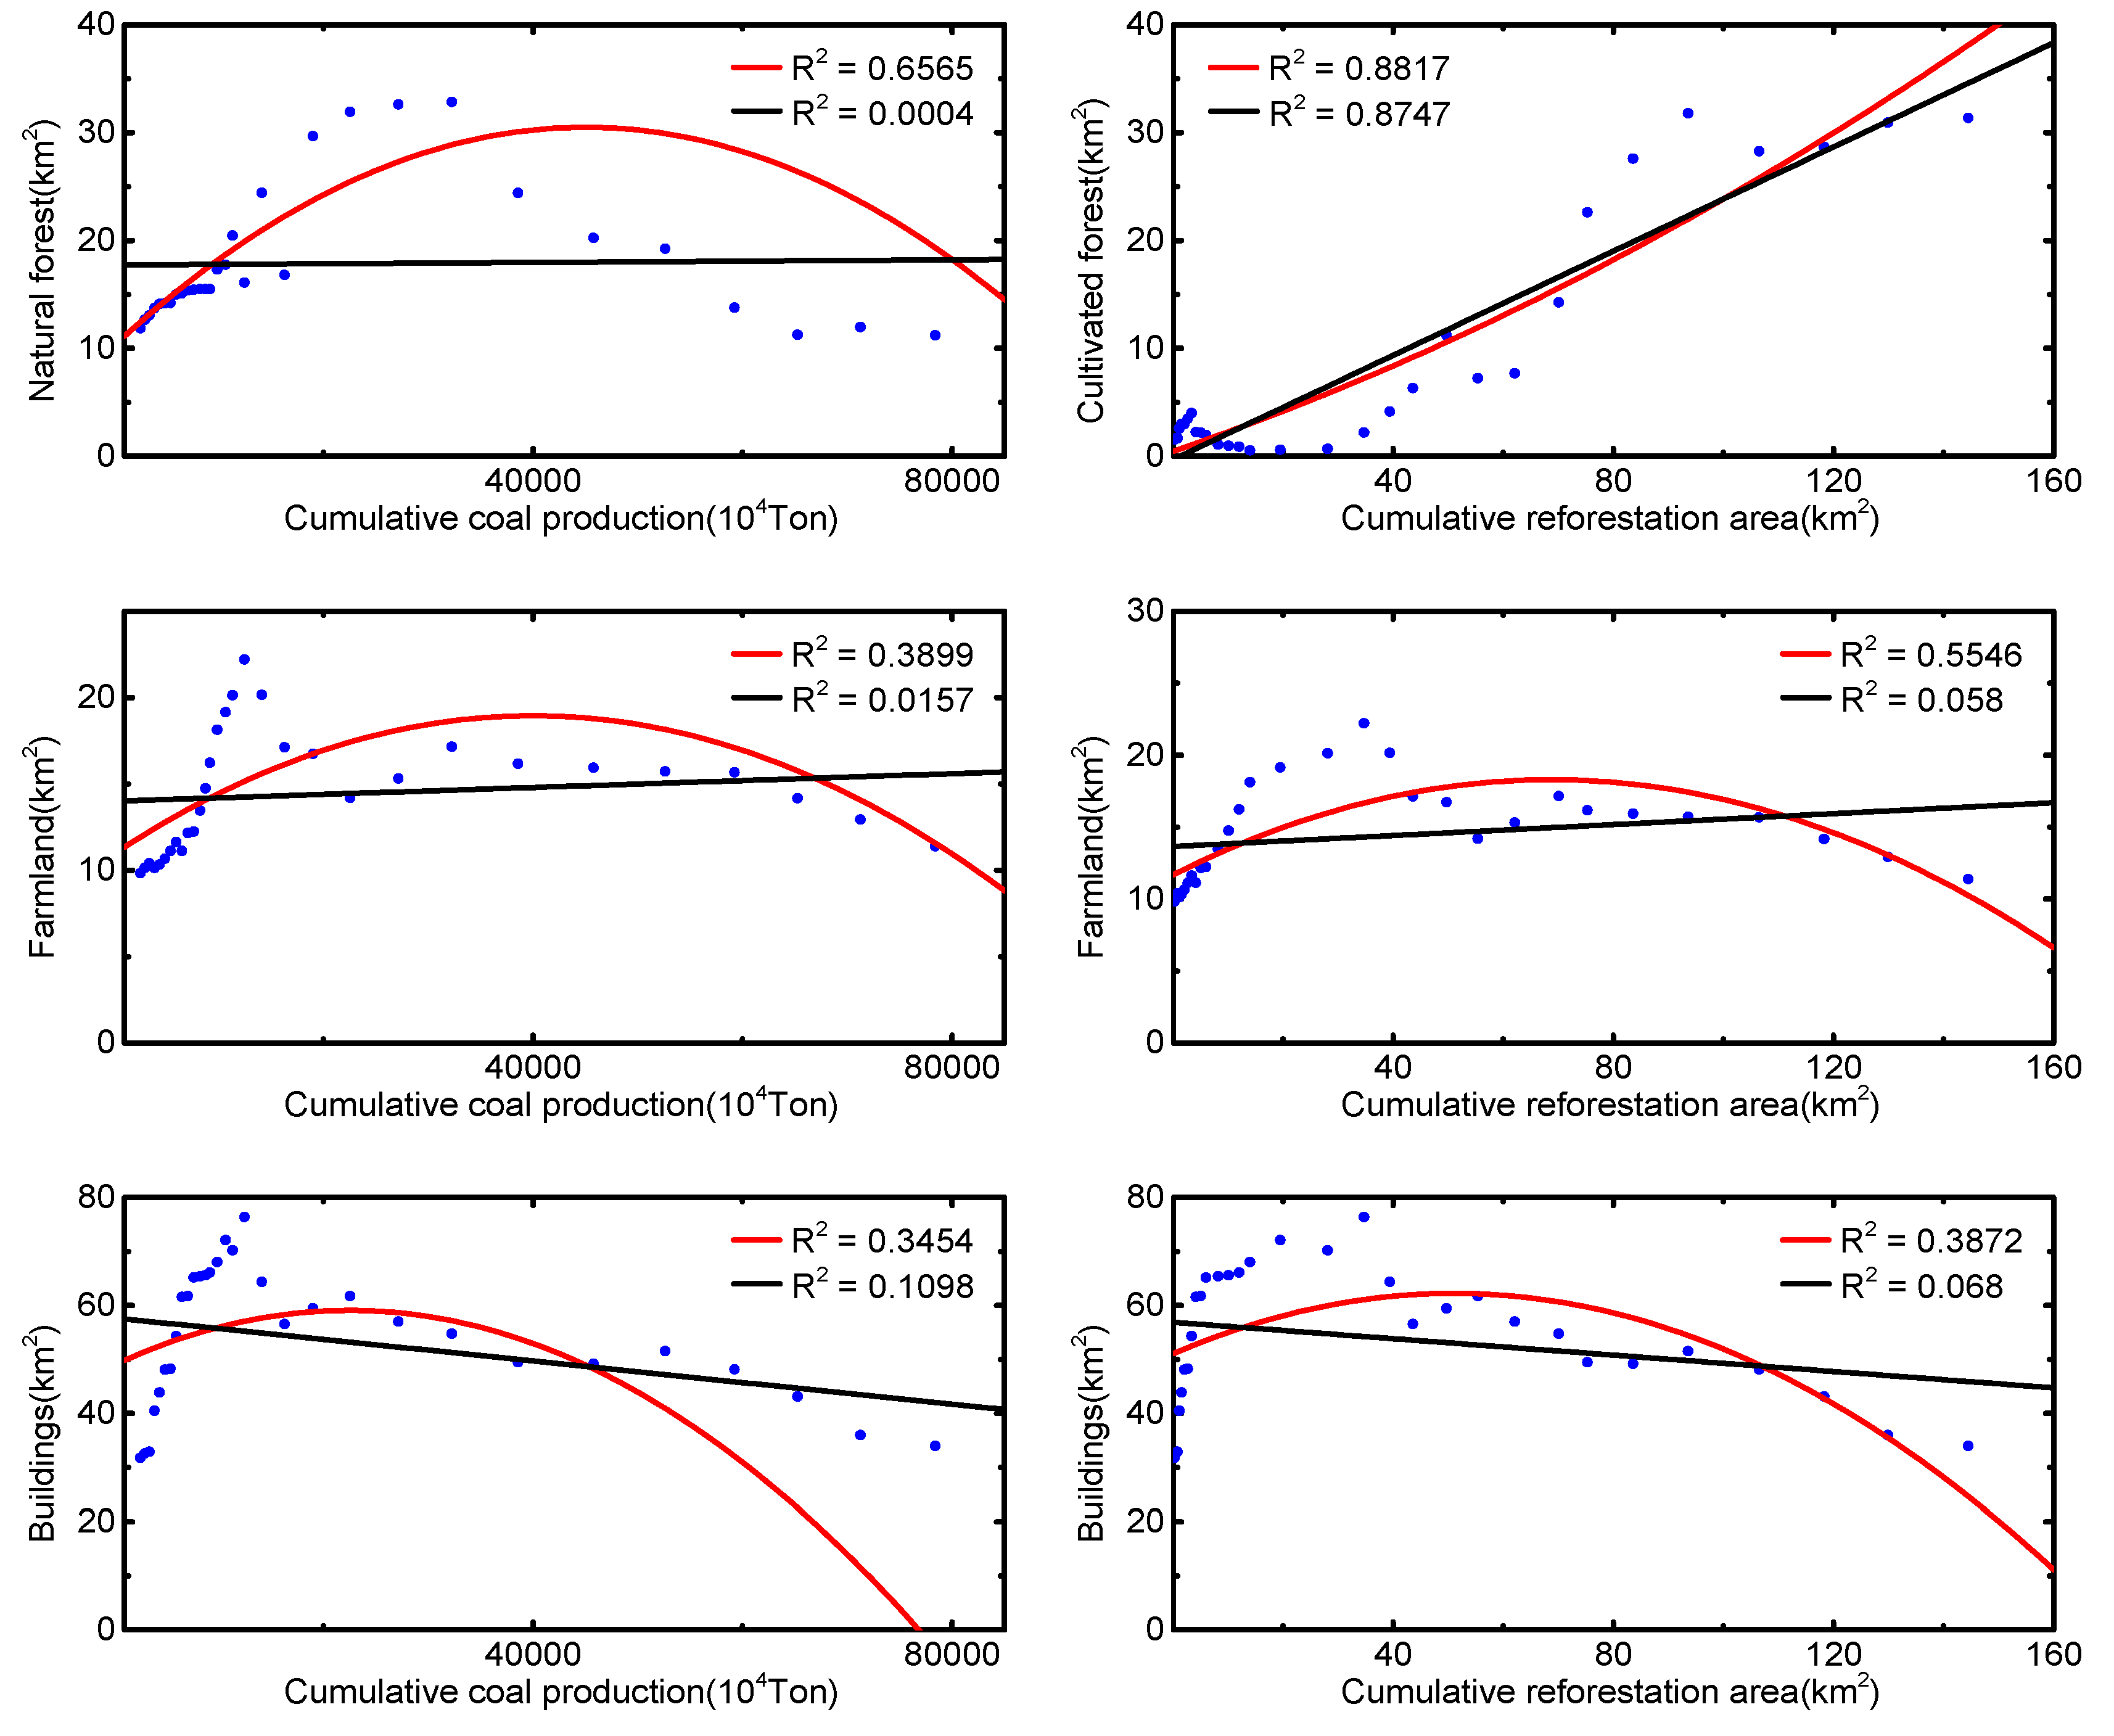
3.3. Relevance Between LULC Changes, Underground Mining, and Reforestation
4. Discussion
4.1. Characteristics of the LULC Change in the Mining Area
4.2. Effects of Underground Mining and Reforestation on the Analyzed LULC
4.3. Research Limitations and Future Work
5. Conclusions
Supplementary Materials
Author Contributions
Funding
Acknowledgments
Conflicts of Interest
References
- Ales, R.F.; Martin, A.; Ortega, F.; Ales, E.E. Recent changes in landscape structure and function in a mediterranean region of SW Spain (1950–1984). Landsc. Ecol. 1992, 7, 3–18. [Google Scholar] [CrossRef]
- Kareiva, P.; Wennergren, U. Connecting landscape patterns to ecosystem and population processes. Nature 1995, 373, 299–302. [Google Scholar] [CrossRef]
- Tscharntke, T.; Klein, A.M.; Kruess, A.; Steffan-Dewenter, I.; Thies, C. Landscape perspectives on agricultural intensification and biodiversity-ecosystem service management. Ecol. Lett. 2005, 8, 857–874. [Google Scholar] [CrossRef]
- Xiao, W.; Fu, Y.; Wang, T.; Lv, X. Effects of land use transitions due to underground coal mining on ecosystem services in high groundwater table areas: A case study in the Yanzhou coalfield. Land Use Policy 2018, 71, 213–221. [Google Scholar] [CrossRef]
- Liu, S.; Wang, T. Aeolian processes and landscape change under human disturbances on the Sonid grassland of inner Mongolian Plateau, northern China. Environ. Earth Sci. 2014, 71, 2399–2407. [Google Scholar] [CrossRef]
- Wang, Y.Q.; Zhang, X.S. A dynamic modeling approach to simulating socioeconomic effects on landscape changes. Ecol. Model. 2001, 140, 141–162. [Google Scholar] [CrossRef]
- D’Almeida, C.; Vörösmarty, C.J.; Hurtt, G.C.; Marengo, J.A.; Dingman, S.L.; Keim, B.D. The effects of deforestation on the hydrological cycle in Amazonia: A review on scale and resolution. Int. J. Climatol. 2010, 27, 633–647. [Google Scholar] [CrossRef]
- Li, J.; Zipper, C.E.; Donovan, P.F.; Wynne, R.H.; Oliphant, A.J. Reconstructing disturbance history for an intensively mined region by time-series analysis of Landsat imagery. Environ. Monit. Assess. 2015, 187, 557. [Google Scholar] [CrossRef] [PubMed]
- Skalos, J.; Kasparova, I. Landscape memory and landscape change in relation to mining. Ecol. Eng. 2012, 43, 60–69. [Google Scholar] [CrossRef]
- Lei, K.; Pan, H.; Lin, C. A landscape approach towards ecological restoration and sustainable development of mining areas. Ecol. Eng. 2016, 90, 320–325. [Google Scholar] [CrossRef]
- Wang, J.; Wang, P.; Qin, Q.; Wang, H. The effects of land subsidence and rehabilitation on soil hydraulic properties in a mining area in the Loess Plateau of China. Catena 2017, 159, 51–59. [Google Scholar] [CrossRef]
- He, Y.; He, X.; Liu, Z.; Zhao, S.; Bao, L.; Li, Q.; Yan, L. Coal mine subsidence has limited impact on plant assemblages in an arid and semi-arid region of northwestern China. Écoscience 2017, 24, 91–103. [Google Scholar] [CrossRef]
- Hu, Z.; Xu, X.; Zhao, Y. Dynamic monitoring of land subsidence in mining area from multi-source remote-sensing data—A case study at Yanzhou, China. Int. J. Remote Sens. 2012, 33, 5528–5545. [Google Scholar] [CrossRef]
- Zipper, C.E.; Burger, J.A.; Skousen, J.G.; Angel, P.N.; Barton, C.D.; Davis, V.; Franklin, J.A. Restoring Forests and Associated Ecosystem Services on Appalachian Coal Surface Mines. Environ. Manag. 2011, 47, 751–765. [Google Scholar] [CrossRef]
- Román-Dañobeytia, F.; Huayllani, M.; Michi, A.; Ibarra, F.; Loayza-Muro, R.; Vázquez, T.; Rodríguez, L.; García, M. Reforestation with four native tree species after abandoned gold mining in the Peruvian Amazon. Ecol. Eng. 2015, 85, 39–46. [Google Scholar] [CrossRef]
- Evans, D.M.; Zipper, C.E.; Burger, J.A.; Strahm, B.D.; Villamagna, A.M. Reforestation practice for enhancement of ecosystem services on a compacted surface mine: Path toward ecosystem recovery. Ecol. Eng. 2013, 51, 16–23. [Google Scholar] [CrossRef]
- Jorgenson, M.T.; Frost, G.V.; Dissing, D. Drivers of Landscape Changes in Coastal Ecosystems on the Yukon-Kuskokwim Delta, Alaska. Remote Sens. 2018, 10, 1280. [Google Scholar] [CrossRef]
- Jorgenson, J.C.; Jorgenson, M.T.; Boldenow, M.L.; Orndahl, K.M. Landscape Change Detected over a Half Century in the Arctic National Wildlife Refuge Using High-Resolution Aerial Imagery. Remote Sens. 2018, 10, 1305. [Google Scholar] [CrossRef]
- Curatola Fernández, G.; Obermeier, W.; Gerique, A.; López Sandoval, M.; Lehnert, L.; Thies, B.; Bendix, J. Land Cover Change in the Andes of Southern Ecuador—Patterns and Drivers. Remote Sens. 2015, 7, 2509–2542. [Google Scholar] [CrossRef]
- DeWitt, J.D.; Chirico, P.G.; Bergstresser, S.E.; Warner, T.A. Multi-scale 46-year remote sensing change detection of diamond mining and land cover in a conflict and post-conflict setting. Remote Sens. Appl. Soc. Environ. 2017, 8, 126–139. [Google Scholar] [CrossRef]
- Soulard, C.E.; Acevedo, W.; Stehman, S.V.; Parker, O.P. Mapping Extent and Change in Surface Mines Within the United States for 2001 to 2006. Land Degrad. Dev. 2016, 27, 248–257. [Google Scholar] [CrossRef]
- Du, P.; Yuan, L.; Xia, J.; He, J. Fusion and classification of Beijing-1 small satellite remote sensing image for land cover monitoring in mining area. Chin. Geogr. Sci. 2011, 21, 656–665. [Google Scholar] [CrossRef]
- De Lucia Lobo, F.; Souza-Filho, P.W.M.; De Moraes Novo, E.M.L.; Carlos, F.M.; Barbosa, C.C.F. Mapping Mining Areas in the Brazilian Amazon Using MSI/Sentinel-2 Imagery (2017). Remote Sens. 2018, 10, 1178. [Google Scholar] [CrossRef]
- Raczko, E.; Zagajewski, B. Comparison of support vector machine, random forest and neural network classifiers for tree species classification on airborne hyperspectral APEX images. Eur. J. Remote Sens. 2017, 50, 144–154. [Google Scholar] [CrossRef]
- Pal, M. Random forest classifier for remote sensing classification. Int. J. Remote Sens. 2007, 26, 217–222. [Google Scholar] [CrossRef]
- Berhane, T.M.; Lane, C.R.; Wu, Q.; Autrey, B.C.; Anenkhonov, O.A.; Chepinoga, V.V.; Liu, H. Decision-Tree, Rule-Based, and Random Forest Classification of High-Resolution Multispectral Imagery for Wetland Mapping and Inventory. Remote Sens. 2018, 10, 580. [Google Scholar] [CrossRef] [PubMed]
- Cui, Y.; Li, L.; Chen, L.; Zhang, Y.; Cheng, L.; Zhou, X.; Yang, X. Land-Use Carbon Emissions Estimation for the Yangtze River Delta Urban Agglomeration Using 1994–2016 Landsat Image Data. Remote Sens. 2018, 10, 1334. [Google Scholar] [CrossRef]
- Mohamed, H.; Nadaoka, K.; Nakamura, T. Assessment of Machine Learning Algorithms for Automatic Benthic Cover Monitoring and Mapping Using Towed Underwater Video Camera and High-Resolution Satellite Images. Remote Sens. 2018, 10, 773. [Google Scholar] [CrossRef]
- Pei, W.; Yao, S.; Knight, J.F.; Dong, S.; Pelletier, K.; Rampi, L.P.; Wang, Y.; Klassen, J. Mapping and detection of land use change in a coal mining area using object-based image analysis. Environ. Earth Sci. 2017, 76. [Google Scholar] [CrossRef]
- Townsend, P.A.; Helmers, D.P.; Kingdon, C.C.; McNeil, B.E.; de Beurs, K.M.; Eshleman, K.N. Changes in the extent of surface mining and reclamation in the Central Appalachians detected using a 1976–2006 Landsat time series. Remote Sens. Environ. 2009, 113, 62–72. [Google Scholar] [CrossRef]
- Petropoulos, G.P.; Partsinevelos, P.; Mitraka, Z. Change detection of surface mining activity and reclamation based on a machine learning approach of multi-temporal Landsat TM imagery. Geocarto Int. 2013, 28, 323–342. [Google Scholar] [CrossRef]
- Ji, L.; Gong, P.; Geng, X.; Zhao, Y. Improving the Accuracy of the Water Surface Cover Type in the 30 m FROM-GLC Product. Remote Sens. 2015, 7, 13507–13527. [Google Scholar] [CrossRef]
- Brovelli, M.; Molinari, M.; Hussein, E.; Chen, J.; Li, R. The First Comprehensive Accuracy Assessment of GlobeLand30 at a National Level: Methodology and Results. Remote Sens. 2015, 7, 4191–4212. [Google Scholar] [CrossRef]
- Kennedy, R.E.; Yang, Z.; Cohen, W.B. Detecting trends in forest disturbance and recovery using yearly Landsat time series: 1. LandTrendr—Temporal segmentation algorithms. Remote Sens. Environ. 2010, 114, 2897–2910. [Google Scholar] [CrossRef]
- Yang, Y.; Erskine, P.D.; Lechner, A.M.; Mulligan, D.; Zhang, S.; Wang, Z. Detecting the dynamics of vegetation disturbance and recovery in surface mining area via Landsat imagery and LandTrendr algorithm. J. Clean. Prod. 2018, 178, 353–362. [Google Scholar] [CrossRef]
- Liu, S.; Wei, X.; Li, D.; Lu, D. Examining Forest Disturbance and Recovery in the Subtropical Forest Region of Zhejiang Province Using Landsat Time-Series Data. Remote Sens. 2017, 9, 479. [Google Scholar] [CrossRef]
- Garrigues, S.; Allard, D.; Baret, F.; Weiss, M. Influence of landscape spatial heterogeneity on the non-linear estimation of leaf area index from moderate spatial resolution remote sensing data. Remote Sens. Environ. 2006, 105, 286–298. [Google Scholar] [CrossRef]
- General Planning of Mineral Resources in the Southern Suburb of Datong City; Government, Department of Safety and Professional Services: Datong, China, 2012.
- Yang, X.; Xu, B.; Jin, Y.; Qin, Z.; Ma, H.; Li, J.; Zhao, F.; Chen, S.; Zhu, X. Remote sensing monitoring of grassland vegetation growth in the Beijing-Tianjin sandstorm source project area from 2000 to 2010. Ecol. Indic. 2015, 51, 244–251. [Google Scholar] [CrossRef]
- Wang, X.M.; Zhang, C.X.; Hasi, E.; Dong, Z.B. Has the Three Norths Forest Shelterbelt Program solved the desertification and dust storm problems in arid and semiarid China? J. Arid Environ. 2010, 74, 13–22. [Google Scholar] [CrossRef]
- Chander, G.; Markham, B.L.; Helder, D.L. Summary of current radiometric calibration coefficients for Landsat MSS, TM, ETM+, and EO-1 ALI sensors. Remote Sens. Environ. 2009, 113, 893–903. [Google Scholar] [CrossRef]
- Raval, S.; Shamsoddini, A. A monitoring framework for land use around kaolin mining areas through Landsat TM images. Earth Sci. Inform. 2014, 7, 153–163. [Google Scholar] [CrossRef]
- Chen, J.; Jönsson, P.; Tamura, M.; Gu, Z.; Matsushita, B.; Eklundh, L. A simple method for reconstructing a high-quality NDVI time-series data set based on the Savitzky—Golay filter. Remote Sens. Environ. 2004, 91, 332–344. [Google Scholar] [CrossRef]
- Savitzky, A.; Golay, M.J.E. Smoothing and differentiation of data by simplified least squares procedures. Anal. Chem. 1967, 36, 1627–1639. [Google Scholar] [CrossRef]
- Stehman, S.V. Model-assisted estimation as a unifying framework for estimating the area of land cover and land-cover change from remote sensing. Remote Sens. Environ. 2009, 113, 2455–2462. [Google Scholar] [CrossRef]
- Vázquez-Jiménez, R.; Ramos-Bernal, R.N.; Romero-Calcerrada, R.; Arrogante-Funes, P.; Tizapa, S.S.; Novillo, C.J. Thresholding Algorithm Optimization for Change Detection to Satellite Imagery. In Colorimetry and Image Processing, Travieso-González, C.M., Ed.; InTech: London, UK, 2018. [Google Scholar]
- Lu, D.; Li, G.; Moran, E. Current situation and needs of change detection techniques. Int. J. Image Data Fusion 2014, 5, 13–38. [Google Scholar] [CrossRef]
- Bian, Z.; Lu, Q. Ecological effects analysis of land use change in coal mining area based on ecosystem service valuing: A case study in Jiawang. Environ. Earth Sci. 2012, 68, 1619–1630. [Google Scholar] [CrossRef]
- Malaviya, S.; Munsi, M.; Oinam, G.; Joshi, P.K. Landscape approach for quantifying land use land cover change (1972–2006) and habitat diversity in a mining area in Central India (Bokaro, Jharkhand). Environ. Monit. Assess. 2010, 170, 215–229. [Google Scholar] [CrossRef]
- Basommi, L.P.; Guan, Q.; Cheng, D.; Singh, S.K. Dynamics of land use change in a mining area: A case study of Nadowli District, Ghana. J. Mt. Sci. 2016, 13, 633–642. [Google Scholar] [CrossRef]
- Liu, C.; Ma, X. Analysis to driving forces of land use change in Lu’an mining area. Trans. Nonferr. Met. Soc. China 2011, 21, s727–s732. [Google Scholar] [CrossRef]
- Yilmaz, I.; Marschalko, M. A leaning historical monument formed by underground mining effect: An example from Czech Republic. Eng. Geol. 2012, 133, 43–48. [Google Scholar] [CrossRef]
- Dong, S.C.; Samsonov, S.; Yin, H.W.; Yao, S.P.; Xu, C. Spatio-temporal analysis of ground subsidence due to underground coal mining in Huainan coalfield, China. Environ. Earth Sci. 2015, 73, 5523–5534. [Google Scholar] [CrossRef]
- Lechner, A.M.; Baumgartl, T.; Matthew, P.; Glenn, V. The Impact of Underground Longwall Mining on Prime Agricultural Land: A Review and Research Agenda. Land Degrad. Dev. 2016, 27, 1650–1663. [Google Scholar] [CrossRef]
- Yang, Z.; Dong, J.; Qin, Y.; Ni, W.; Zhao, G.; Chen, W.; Chen, B.; Kou, W.; Wang, J.; Xiao, X. Integrated Analyses of PALSAR and Landsat Imagery Reveal More Agroforests in a Typical Agricultural Production Region, North China Plain. Remote Sens. 2018, 10, 1323. [Google Scholar] [CrossRef]
- De Alban, J.; Connette, G.; Oswald, P.; Webb, E. Combined Landsat and L-Band SAR Data Improves Land Cover Classification and Change Detection in Dynamic Tropical Landscapes. Remote Sens. 2018, 10, 306. [Google Scholar] [CrossRef]


| Classification Type | Standard |
|---|---|
| Natural forest | High density pine; NDVI > 0.5; black in false-color composite; high elevation |
| Cultivated forest | High density Poplar; NDVI > 0.5; dark red in false-color composite; low elevation |
| Mixed forest | Low density tree; 0.3 < NDVI < 0.5; dull red in false-color composite |
| High-coverage grassland | High density grass; 0.3 < NDVI < 0.5; pink in false-color composite |
| Low-coverage grassland | Low density grass; 0.2 < NDVI < 0.3; baby pink in false-color composite |
| Shrubs | High density shrubs; NDVI > 0.5; bright red in false-color composite |
| Farmland | Crop; NDVI > 0.5; red in false-color composite; low elevation |
| Buildings | Impervious surface; NDVI < 0.2 |
| Bare land | Non-vegetation surface; NDVI < 0.2; white in false-color composite |
| Photovoltaic panel area | Photovoltaic panel; 0.3 < NDVI < 0.5; blackish green in false-color composite (because of the vegetation under panel); low elevation |
| Period | Sensor | Acquisition Date | ||
|---|---|---|---|---|
| 1987–1997 | TM | 8 September 1987 | 26 September 1988 | 29 September 1989 |
| 31 August 1990 | 02 August 1991 | 18 August 1991 | ||
| 04 August 1992 | 24 September 1993 | 10 August 1994 | ||
| 27 September 1994 | 30 September 1995 | 16 September 1996 | ||
| 09 August 1997 | 25 August 1997 | 03 September 1997 | ||
| 1997–2007 | ETM, TM | 28 August 1998 | 06 September 1998 | 24 August 1999 |
| 11 September 2000 | 21 August 2001 | 14 September 2001 | ||
| 30 September 2001 | 01 September 2002 | 17 September 2002 | ||
| 25 September 2002 | 03 August 2003 | 20 September 2003 | ||
| 05 August 2004 | 22 September 2004 | 25 September 2005 | ||
| 27 August 2006 | 12 September 2006 | 28 September 2006 | ||
| 14 August 2007 | 15 September 2007 | |||
| 2007–2017 | TM, ETM, OLI | 01 September 2008 | 20 September 2009 | 22 August 2010 |
| 23 September 2010 | 09 August 2011 | 14 August 2013 | ||
| 06 September 2013 | 01 August 2014 | 18 September 2014 | ||
| 04 August 2015 | 20 August 2015 | 21 September 2015 | ||
| 06 August 2016 | 23 September 2016 | 25 August 2017 | ||
| Years | Overall Accuracy in Each Year (%) | Kappa Coefficient | Years | Overall Accuracy in Each Year (%) | Kappa Coefficient | |
|---|---|---|---|---|---|---|
| 1987 | 82.4 | 0.81 | 2002 | 82.85 | 0.81 | |
| 1988 | 83.85 | 0.82 | 2003 | 82.21 | 0.80 | |
| 1989 | 82.46 | 0.81 | 2004 | 82.63 | 0.81 | |
| 1990 | 84.47 | 0.83 | 2005 | 83.46 | 0.82 | |
| 1991 | 85.6 | 0.84 | 2006 | 85.98 | 0.85 | |
| 1992 | 83.44 | 0.82 | 2007 | 82.86 | 0.81 | |
| 1993 | 84.8 | 0.83 | 2008 | 83.18 | 0.81 | |
| 1994 | 84.1 | 0.82 | 2009 | 85.48 | 0.84 | |
| 1995 | 85.92 | 0.84 | 2010 | 83.72 | 0.82 | |
| 1996 | 81.92 | 0.80 | 2011 | 84.31 | 0.83 | |
| 1997 | 82.81 | 0.81 | 2013 | 83.68 | 0.82 | |
| 1998 | 83.32 | 0.82 | 2014 | 84.92 | 0.83 | |
| 1999 | 85.91 | 0.84 | 2015 | 85.5 | 0.84 | |
| 2000 | 82.29 | 0.81 | 2016 | 85.83 | 0.84 | |
| 2001 | 83.78 | 0.82 | 2017 | 86.6 | 0.85 | |
| Average overall accuracy (%) | 84.01 | |||||
| Average Kappa coefficient | 0.82 | |||||
| LULC\Year | 1987 (km2) | 1997 (km2) | 2007 (km2) | 2017 (km2) |
|---|---|---|---|---|
| Cultivated forest | 1.55 | 0.89 | 11.19 | 31.36 |
| Natural forest | 11.87 | 15.49 | 29.67 | 11.21 |
| Buildings | 41.79 | 86.09 | 79.44 | 33.96 |
| Farmland | 0.65 | 0.36 | 16.74 | 11.40 |
| HC grassland | 25.62 | 35.61 | 74.78 | 29.80 |
| Shrubs | 9.81 | 22.80 | 22.06 | 23.02 |
| Mixed forest | 164.37 | 78.63 | 118.98 | 88.06 |
| LC grassland | 189.75 | 199.52 | 85.86 | 148.34 |
| Bare land | 13.96 | 19.98 | 20.65 | 21.64 |
| Photovoltaic panel area | - | - | - | 60.58 |
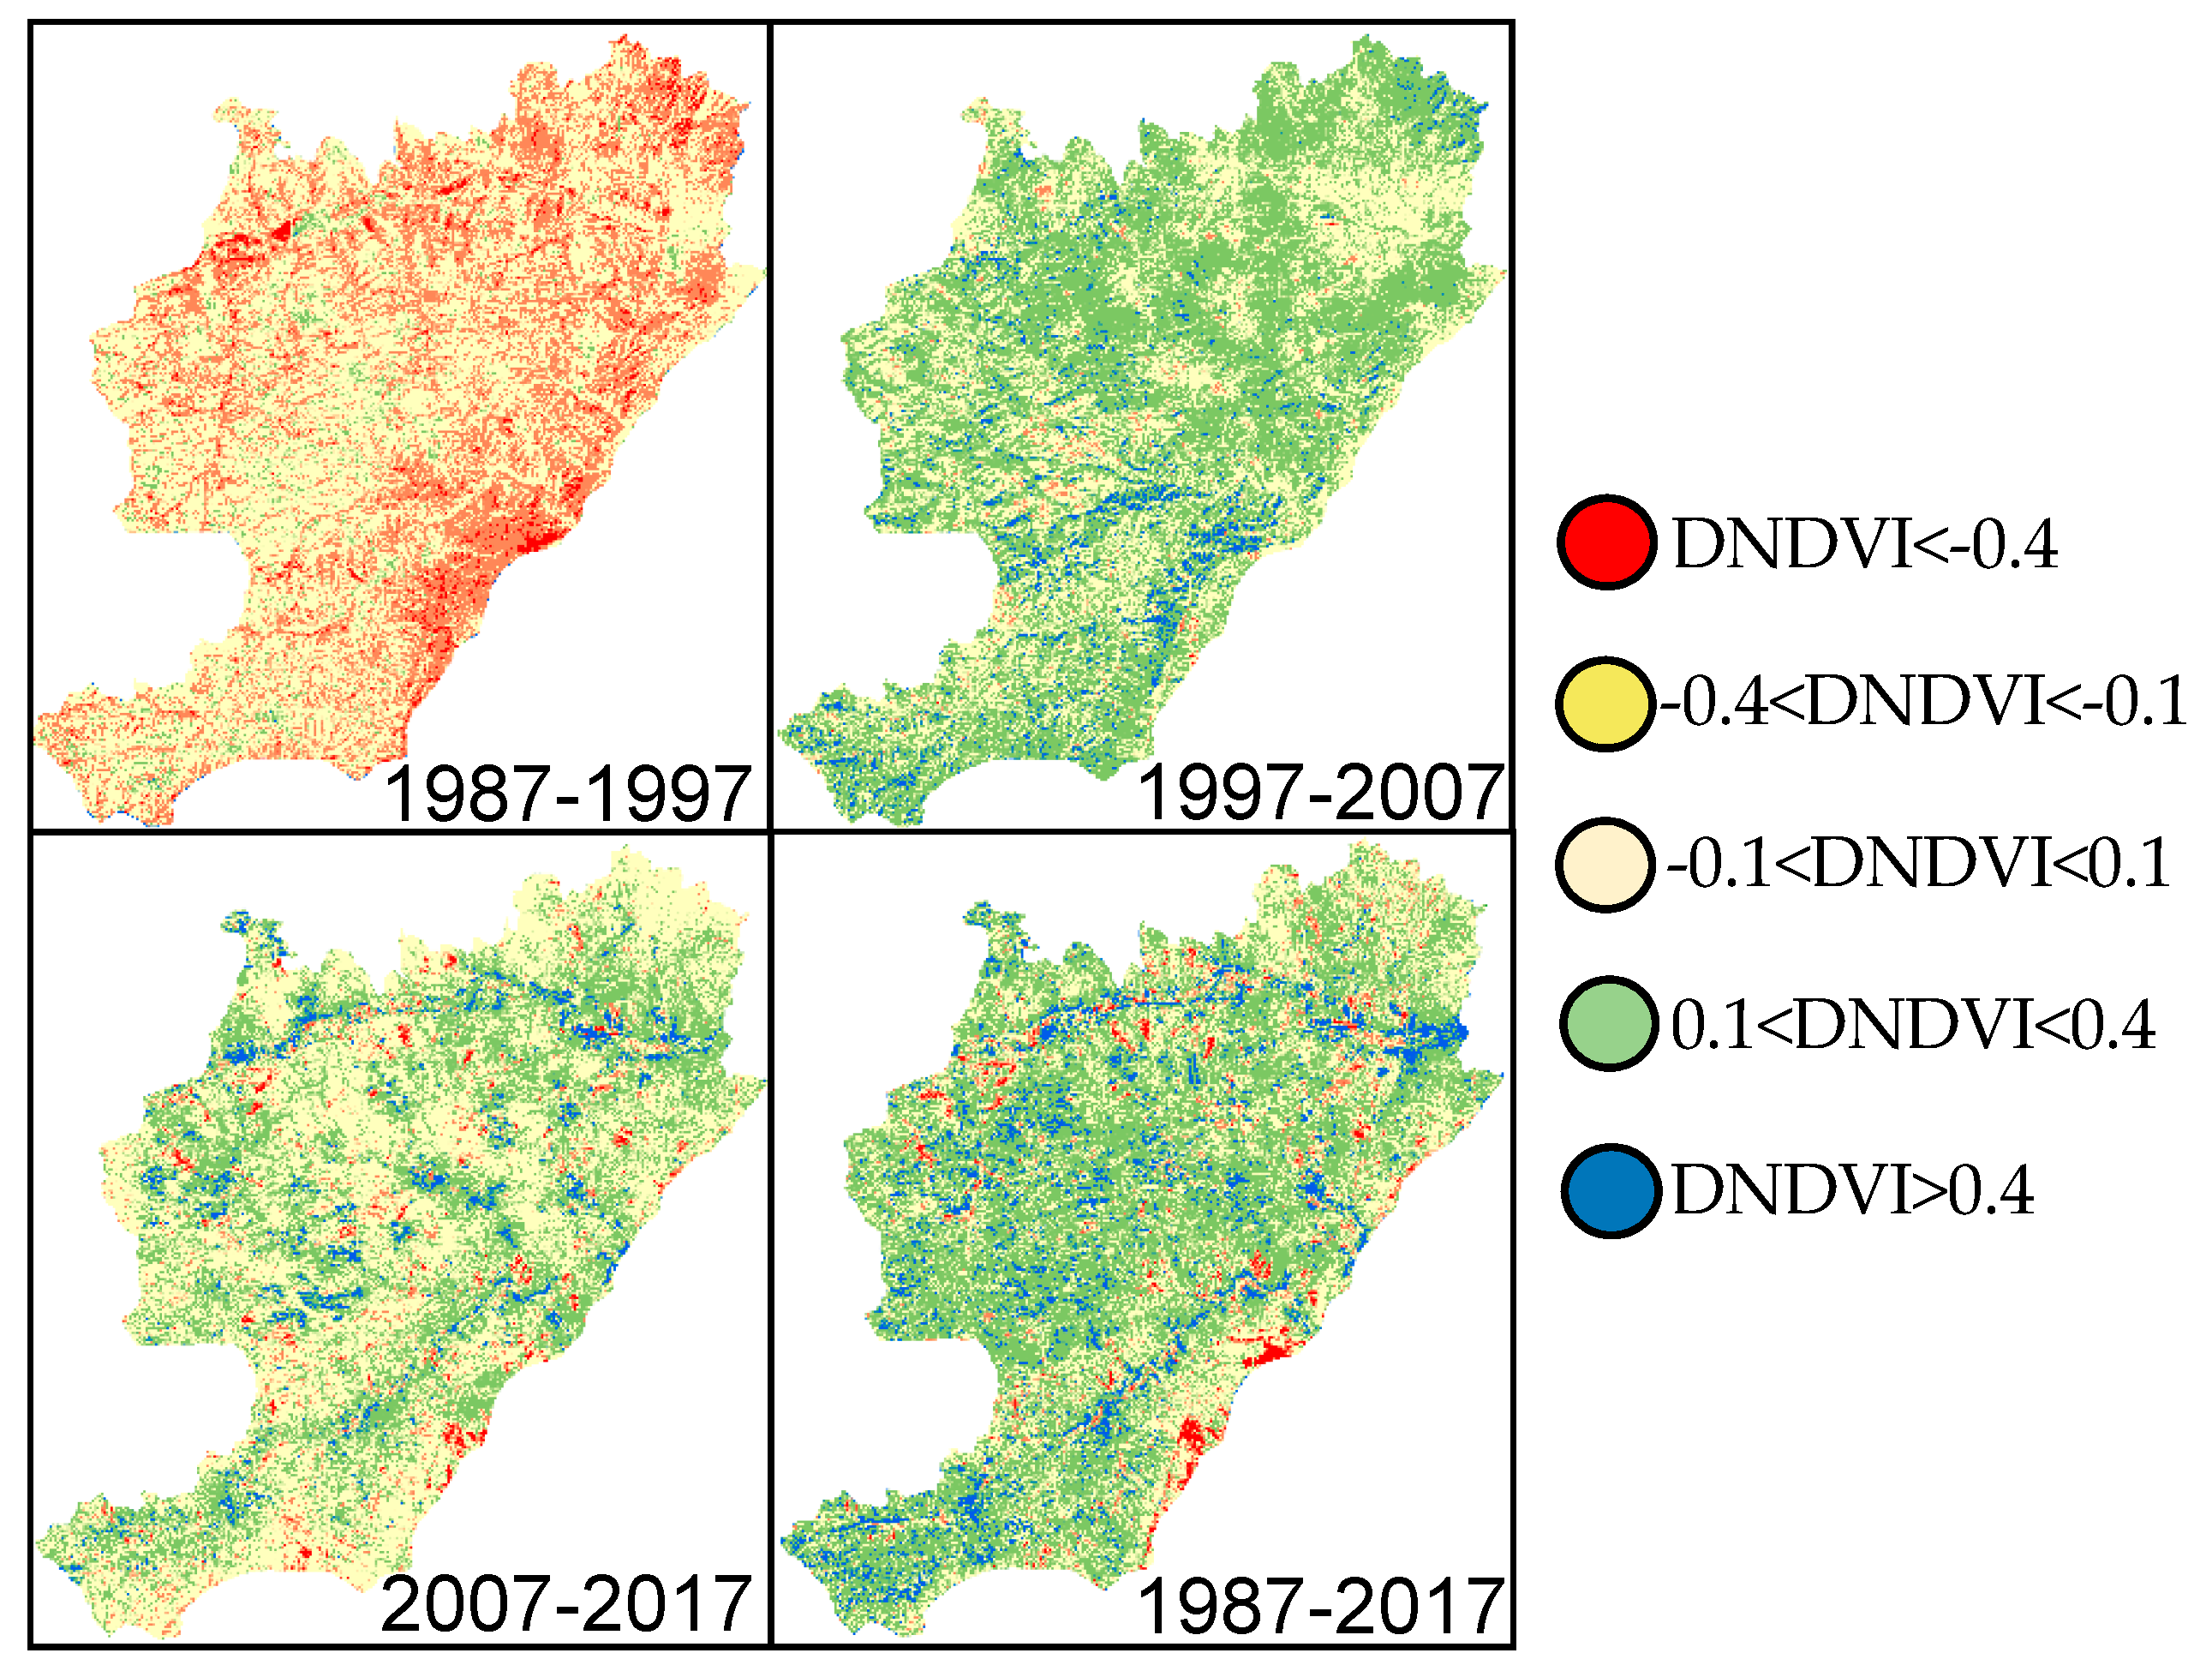
| Year | DNDVI | Proportion (%) | Change Direction (%) |
|---|---|---|---|
| 1987–1997 | DNDVI <−0.4 | 2.88 | Mixed forest →LC grassland (0.45) |
| Natural forest → LC grassland (0.31) | |||
| −0.1 < DNDVI < −0.4 | 34.78 | Mixed forest → LC grassland (9.79) | |
| LC grassland (3.52) | |||
| −0.1 < DNDVI < 0.1 | 59.10 | LC grassland (18.08) | |
| Mixed forest → LC grassland (7.58) | |||
| 0.1 < DNDVI < 0.4 | 3.14 | LC grassland (1.04) | |
| Bare land → LC grassland (0.27) | |||
| DNDVI >0.4 | 0.09 | Mixed forest →Natural forest (0.04) | |
| LC grassland → Shrubs (0.02) | |||
| 1997–2007 | DNDVI <−0.4 | 0.02 | HC grassland → Bare land (0.004) |
| LC grassland → Bare land (0.004) | |||
| −0.1< DNDVI < −0.4 | 1.33 | LC grassland → Bare land (0.37) | |
| LC grassland → Building (0.29) | |||
| −0.1 < DNDVI < 0.1 | 37.77 | LC grassland (17.66) | |
| Mixed forest (6.40) | |||
| 0.1 < DNDVI < 0.4 | 56.55 | LC grassland (14.68) | |
| LC grassland → Mixed forest (11.68) | |||
| DNDVI >0.4 | 4.33 | Natural forest (1.48) | |
| Shrub (0.48) | |||
| 2007–2017 | DNDVI <−0.4 | 0.92 | Mixed forest → Building (0.13) |
| Mixed forest → Bare land (0.12) | |||
| −0.1< DNDVI < −0.4 | 4.68 | LC grassland → Bare land (0.55) | |
| Mixed forest → Building (0.45) | |||
| −0.1 < DNDVI < 0.1 | 55.73 | LC grassland (15.10) | |
| Mixed forest (6.71) | |||
| 0.1 < DNDVI < 0.4 | 35.08 | LC grassland (10.45) | |
| Building → LC grassland (3.61) | |||
| DNDVI >0.4 | 3.58 | Buildings → HC grassland (0.55) | |
| Buildings →HC grassland (0.51) | |||
| 1987–2017 | DNDVI <−0.4 | 1.34 | Natural forest → LC grassland (0.67) |
| Shrubs → Bare land (0.16) | |||
| −0.1< DNDVI < −0.4 | 4.59 | Mixed forest → LC grassland (1.81) | |
| LC grassland (1.13) | |||
| −0.1 < DNDVI < 0.1 | 32.49 | Mixed forest (14.18) | |
| LC grass (9.60) | |||
| 0.1 < DNDVI < 0.4 | 53.28 | LC grassland → Mixed forest (25.79) | |
| Mixed forest (17.86) | |||
| DNDVI >0.4 | 8.29 | LC grassland → Cultivated forest (4.38) | |
| Buildings → Cultivated forest (1.97) |
| LULC | ||
|---|---|---|
| Cultivated forest | −0.23 | 0.66 ** |
| Natural forest | −0.75 ** | 0.76 ** |
| Buildings | −0.43 * | 0.39 * |
| Farmland | −0.64 * | 0.66 ** |
| HC grassland | −0.67 * | 0.64 ** |
| Shrubs | 0.62 * | −0.48 ** |
| Mixed forest | 0.08 | −0.14 |
| LC grassland | 0.60 ** | −0.65 ** |
| Bare land | −0.28 | 0.22 |
© 2019 by the authors. Licensee MDPI, Basel, Switzerland. This article is an open access article distributed under the terms and conditions of the Creative Commons Attribution (CC BY) license (http://creativecommons.org/licenses/by/4.0/).
Share and Cite
Mi, J.; Yang, Y.; Zhang, S.; An, S.; Hou, H.; Hua, Y.; Chen, F. Tracking the Land Use/Land Cover Change in an Area with Underground Mining and Reforestation via Continuous Landsat Classification. Remote Sens. 2019, 11, 1719. https://doi.org/10.3390/rs11141719
Mi J, Yang Y, Zhang S, An S, Hou H, Hua Y, Chen F. Tracking the Land Use/Land Cover Change in an Area with Underground Mining and Reforestation via Continuous Landsat Classification. Remote Sensing. 2019; 11(14):1719. https://doi.org/10.3390/rs11141719
Chicago/Turabian StyleMi, Jiaxin, Yongjun Yang, Shaoliang Zhang, Shi An, Huping Hou, Yifei Hua, and Fuyao Chen. 2019. "Tracking the Land Use/Land Cover Change in an Area with Underground Mining and Reforestation via Continuous Landsat Classification" Remote Sensing 11, no. 14: 1719. https://doi.org/10.3390/rs11141719
APA StyleMi, J., Yang, Y., Zhang, S., An, S., Hou, H., Hua, Y., & Chen, F. (2019). Tracking the Land Use/Land Cover Change in an Area with Underground Mining and Reforestation via Continuous Landsat Classification. Remote Sensing, 11(14), 1719. https://doi.org/10.3390/rs11141719