Operational Flood Mapping Using Multi-Temporal Sentinel-1 SAR Images: A Case Study from Bangladesh


Abstract

1. Introduction
2. Materials and Methods
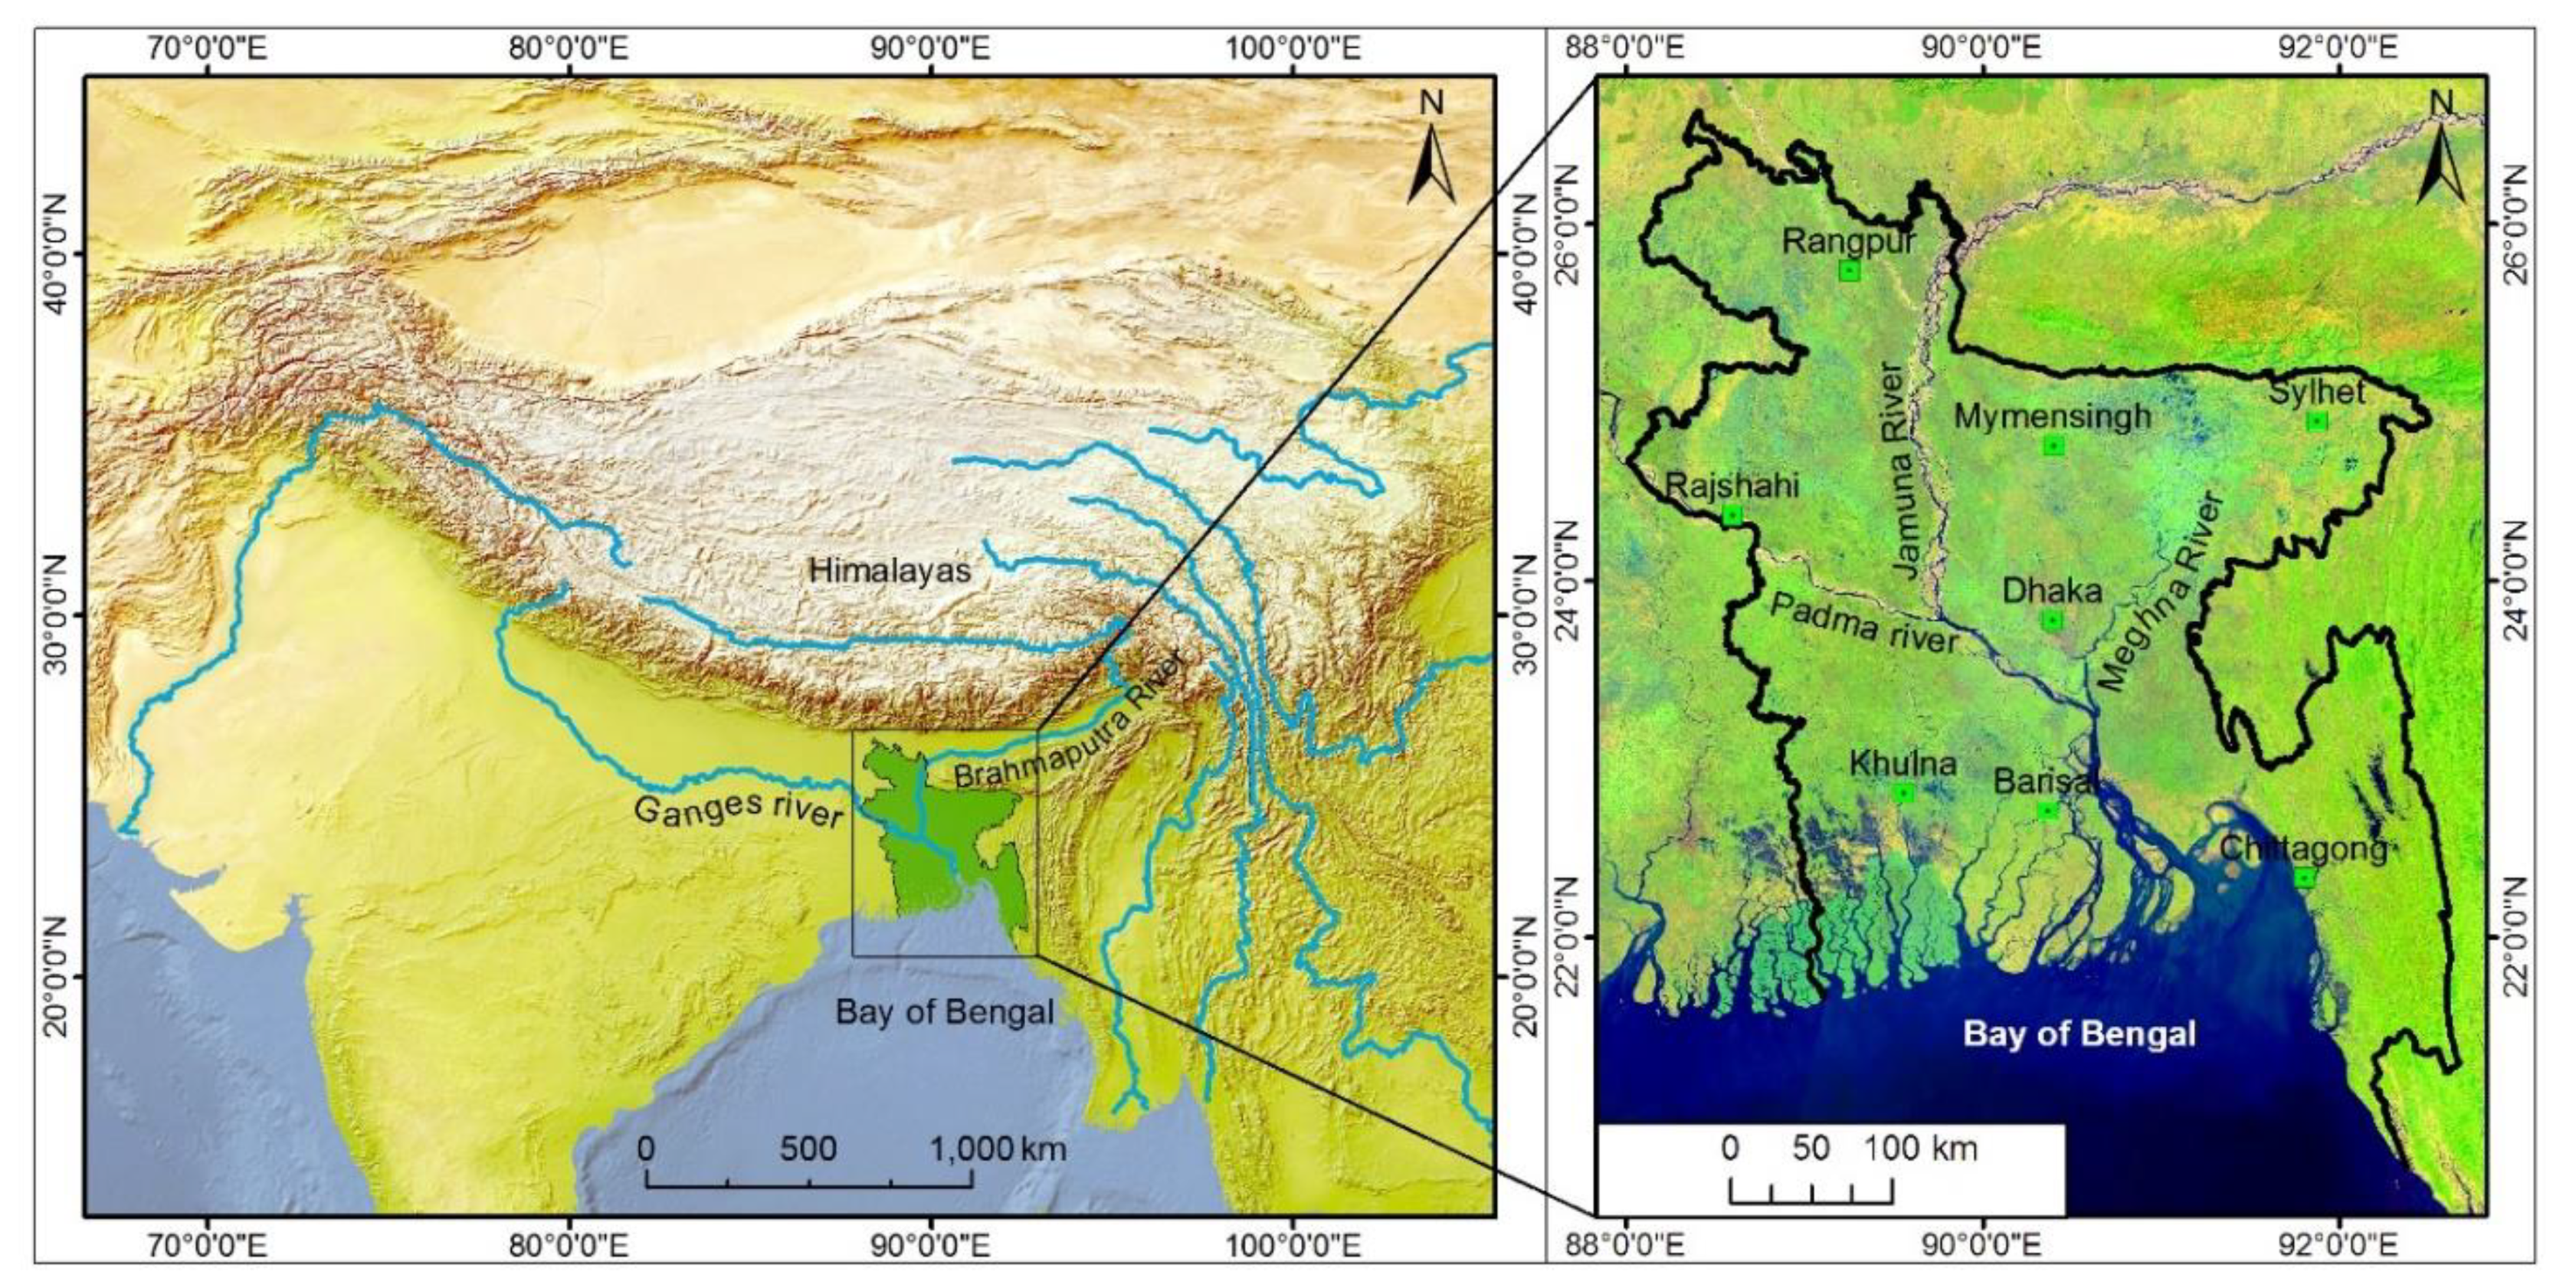
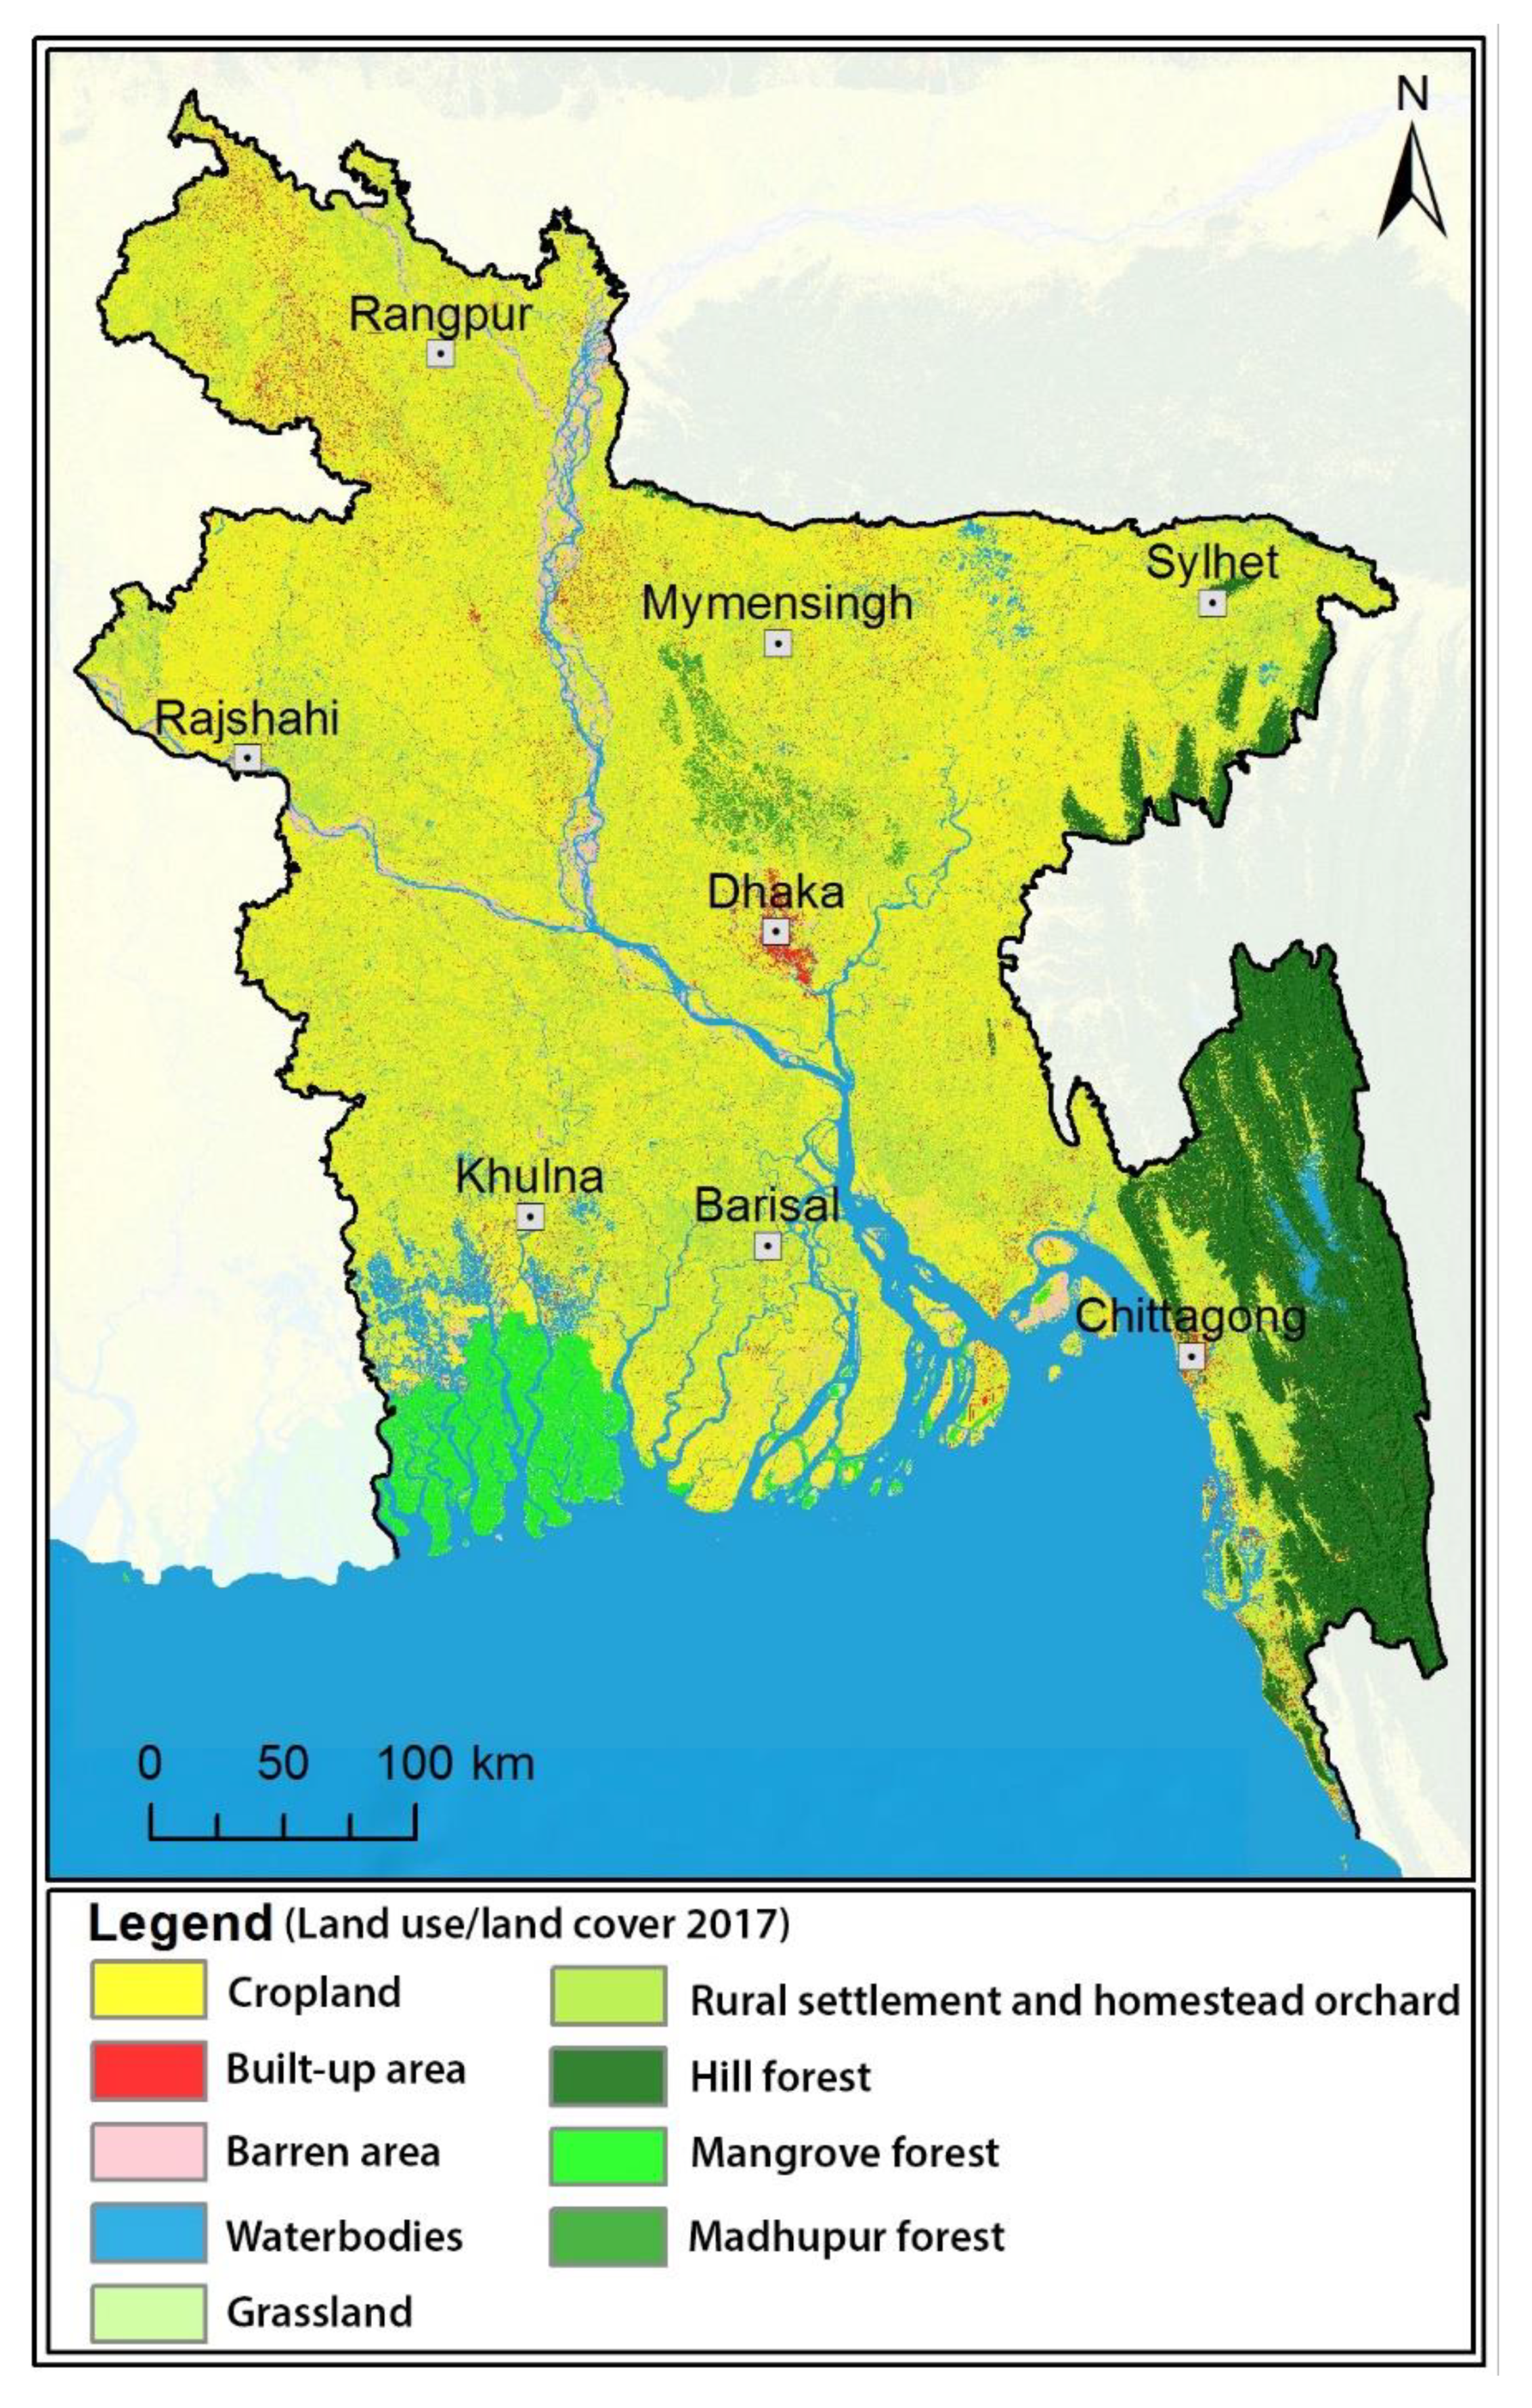
2.1. Study Area
2.2. Materials
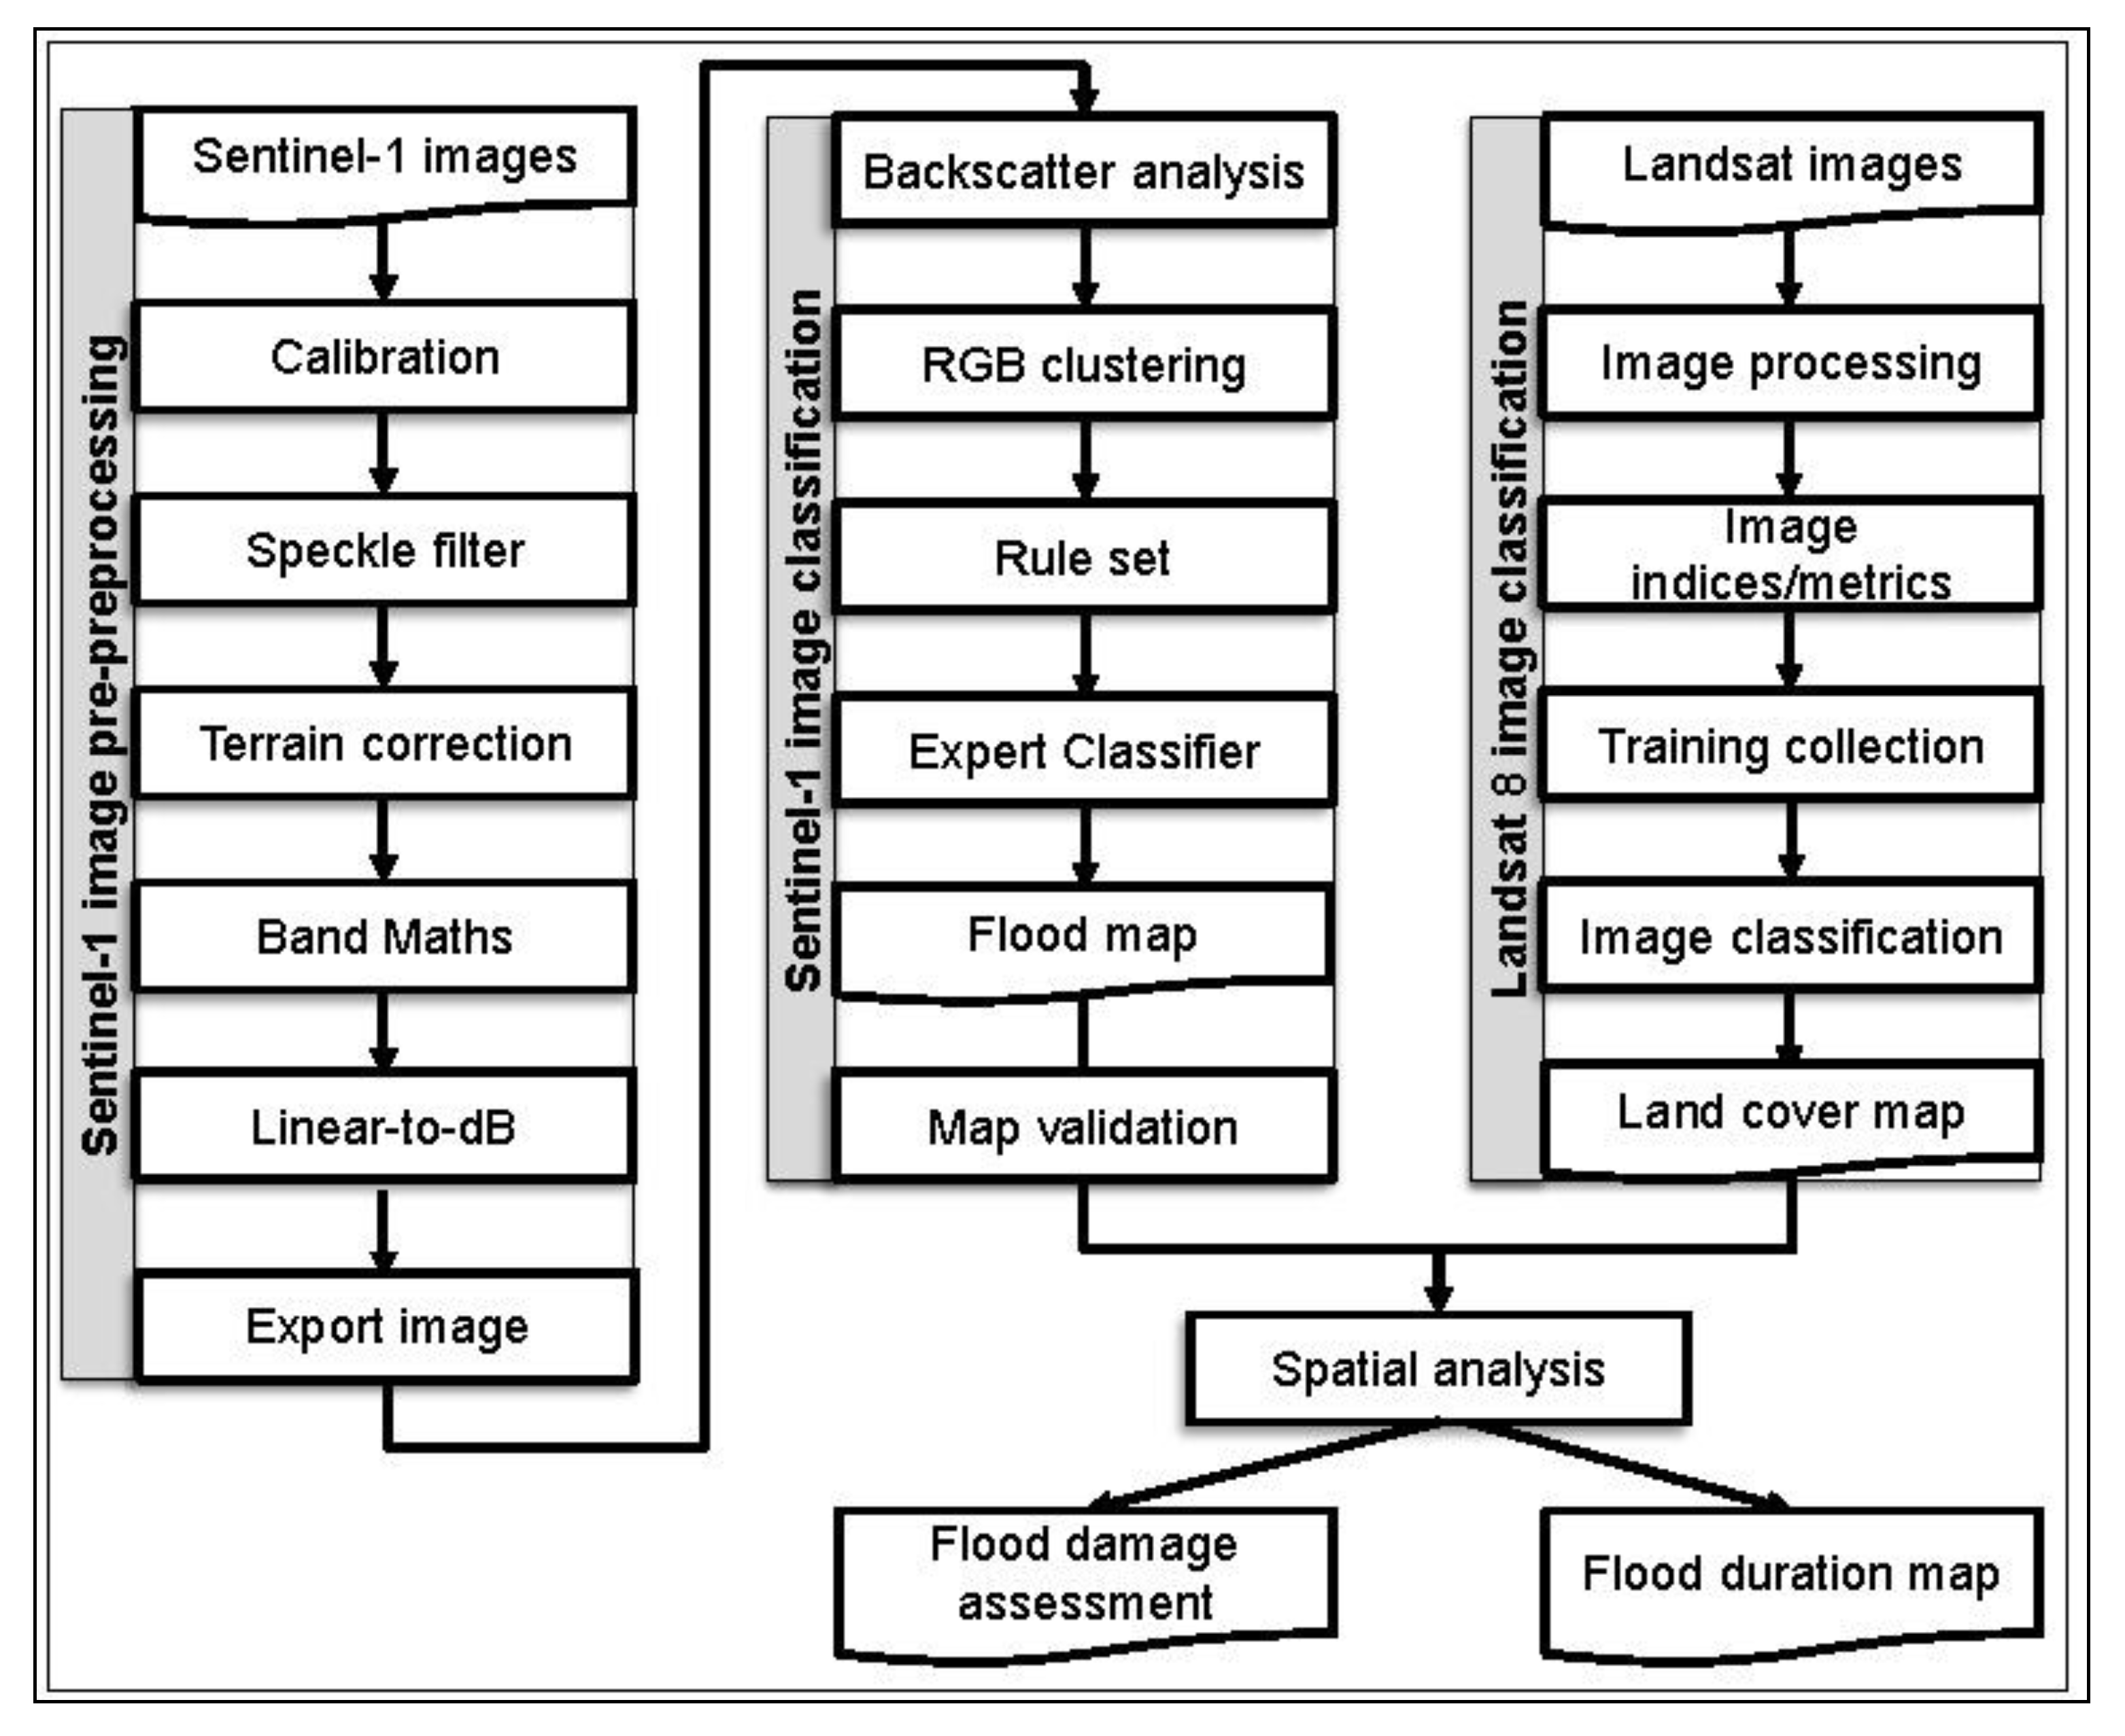
2.3. Methods
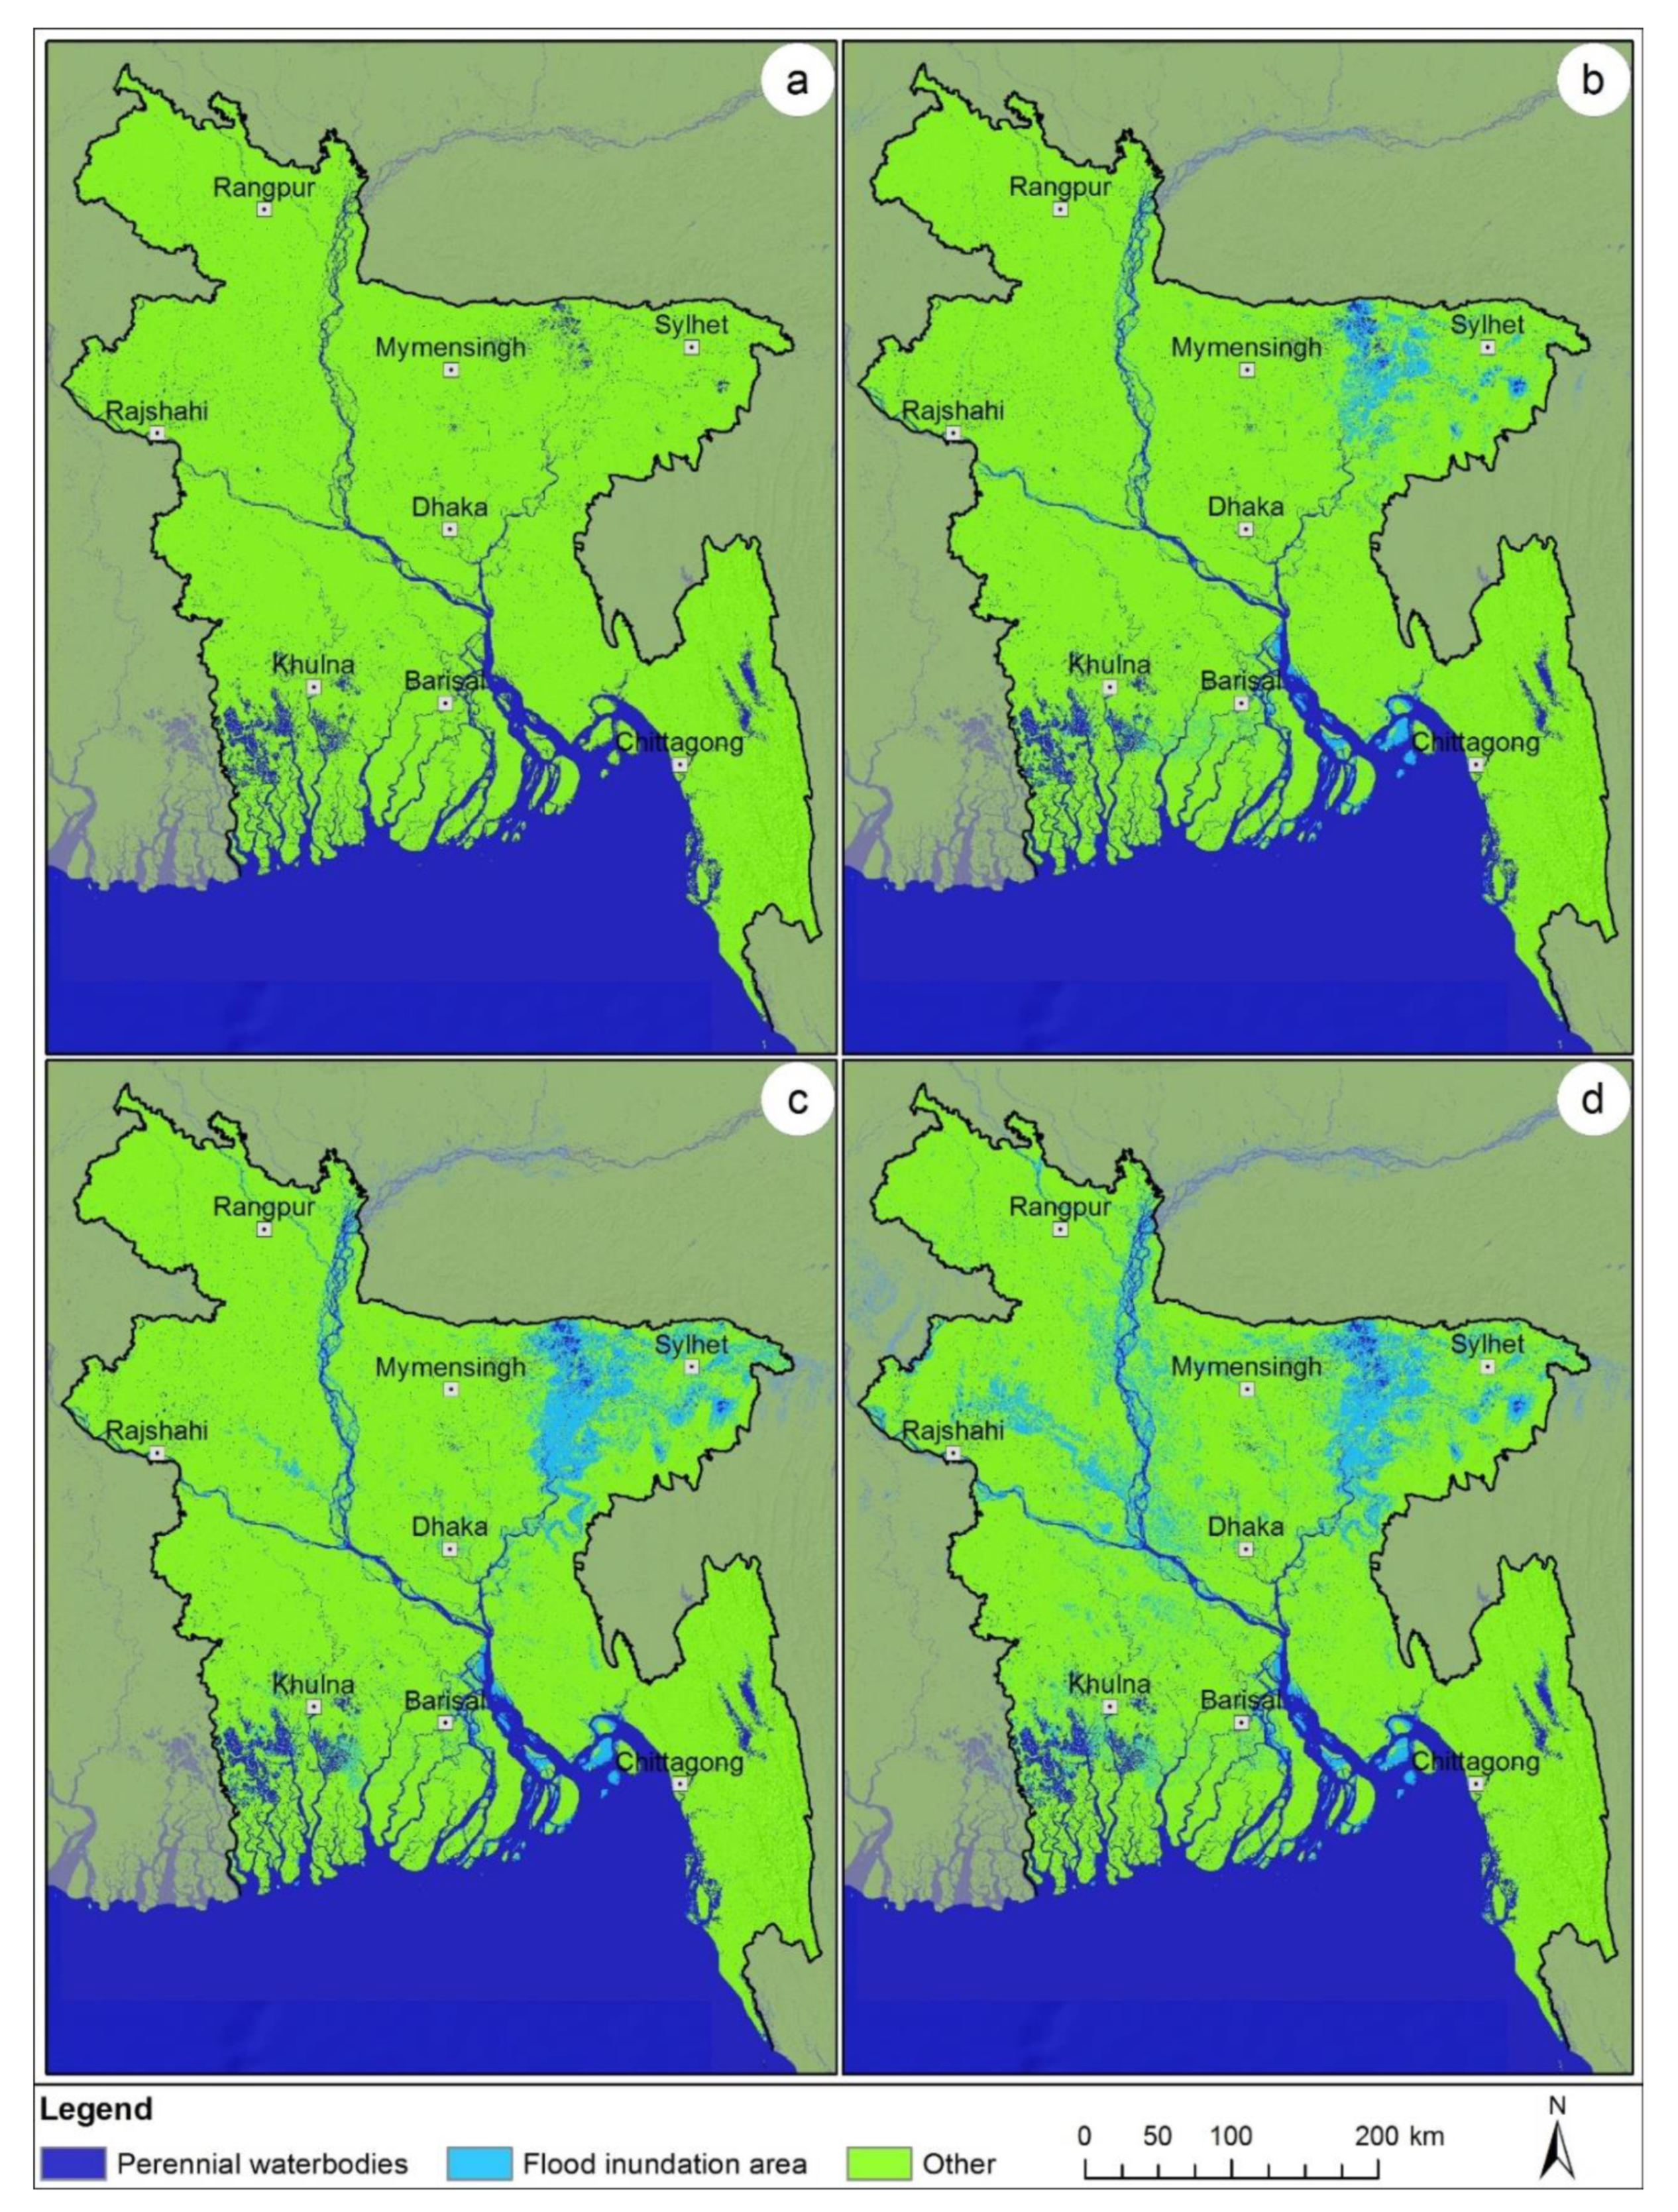
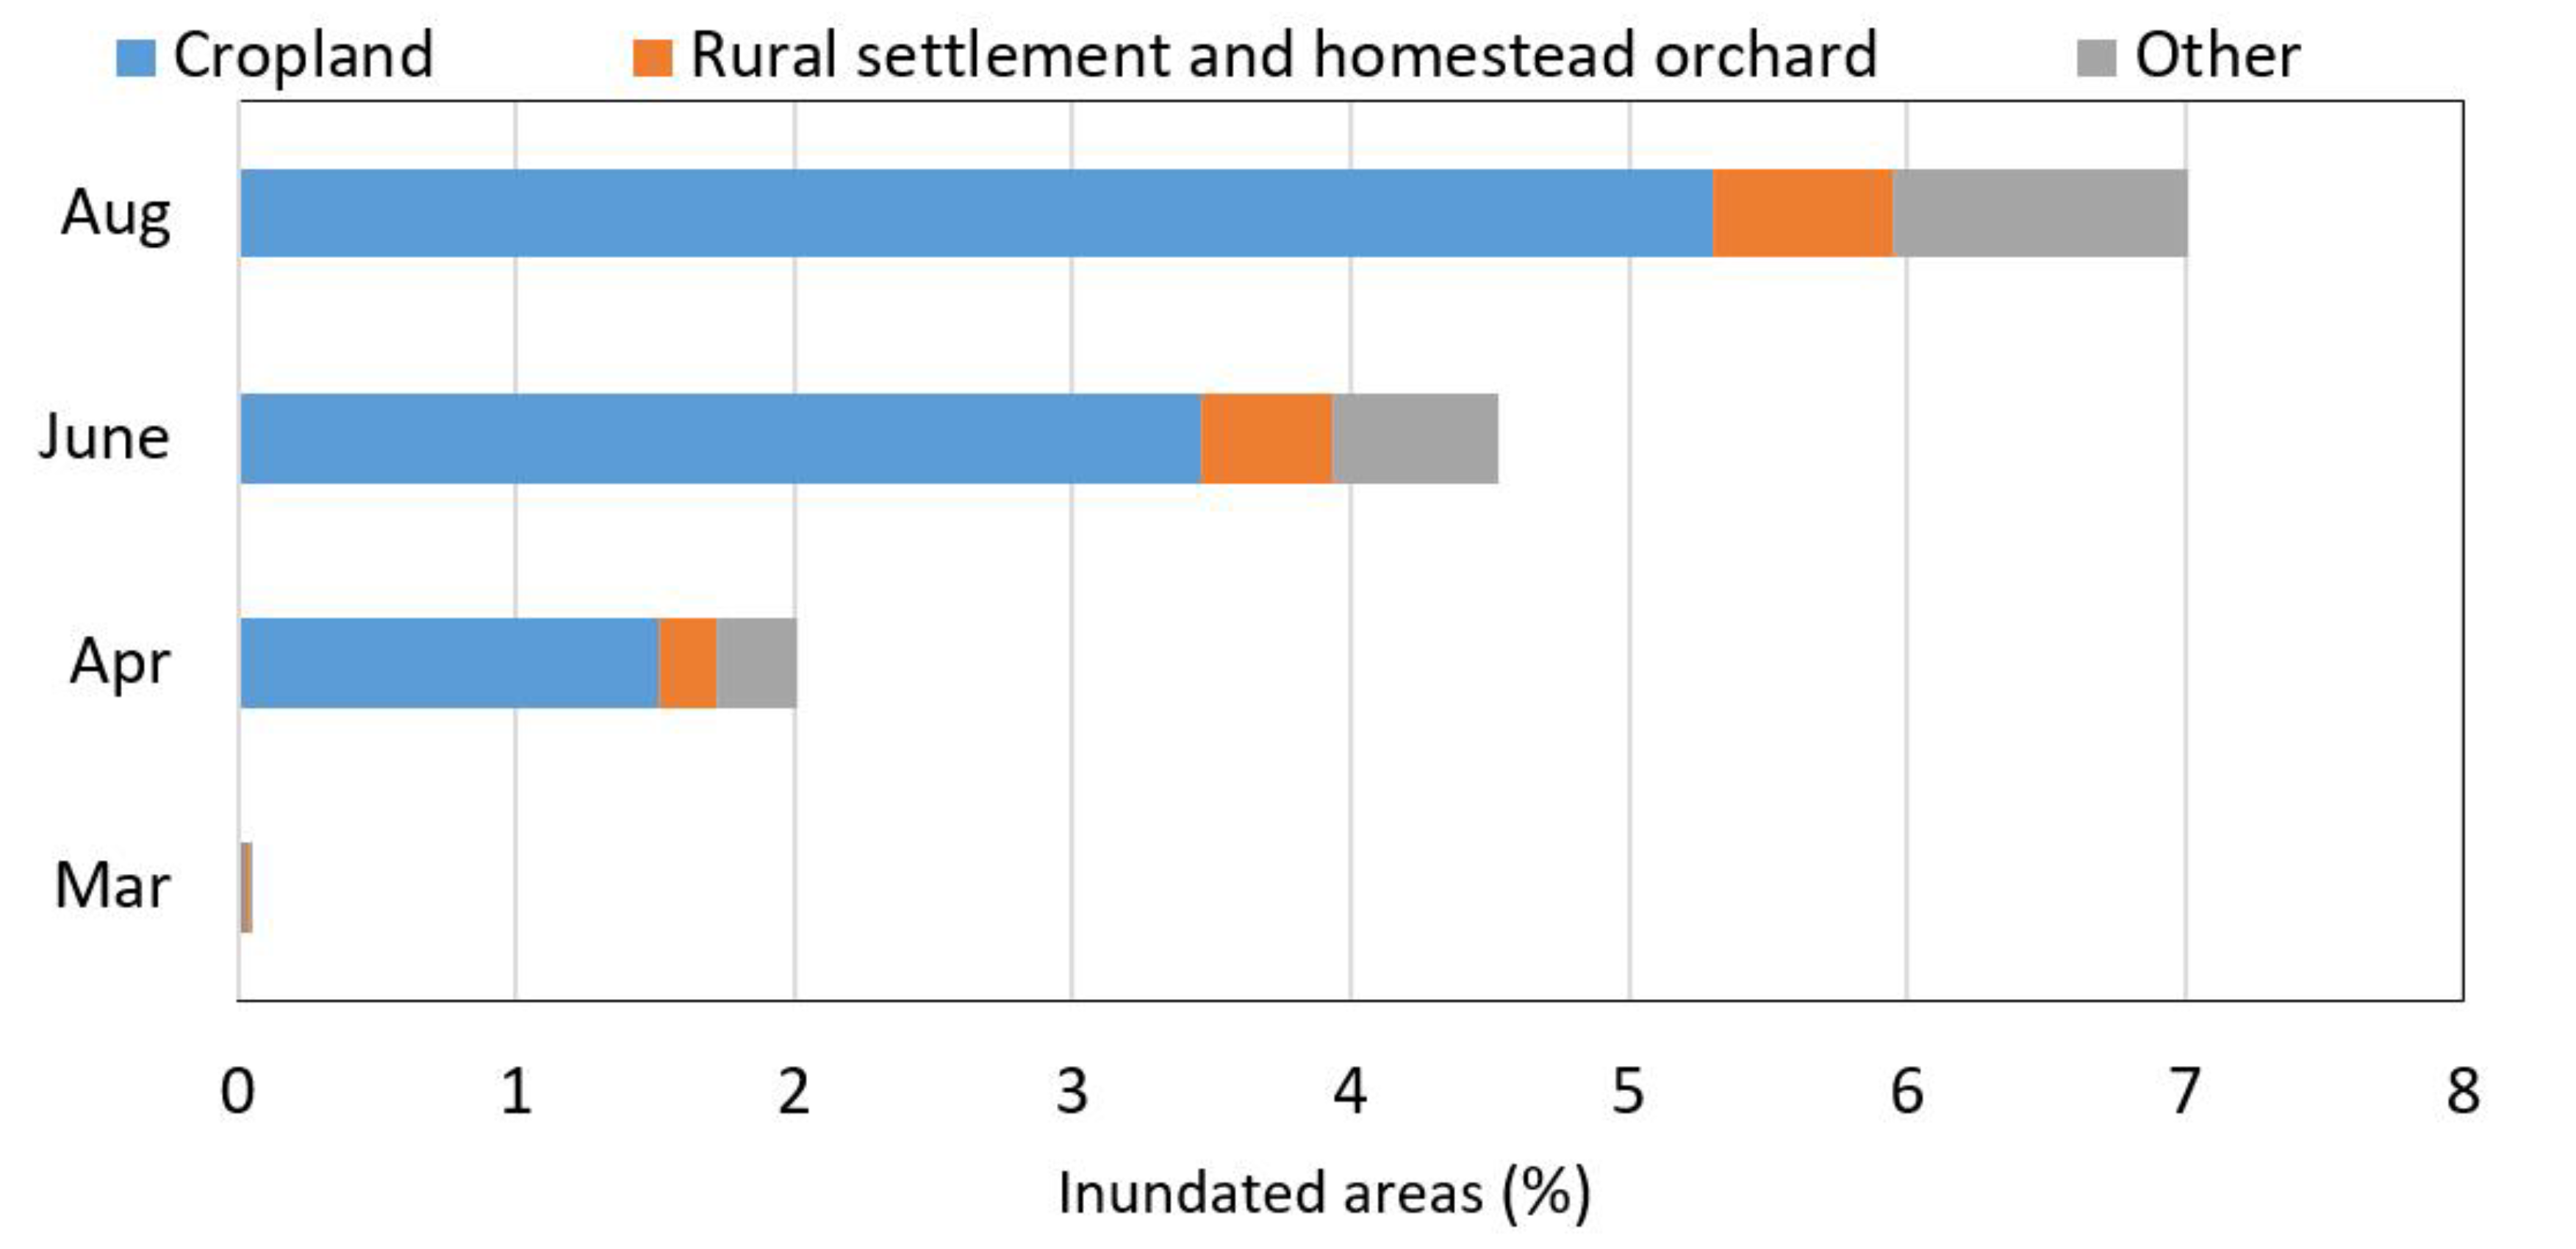
3. Results
4. Discussion
5. Conclusions
Supplementary Materials
Author Contributions
Acknowledgments
Conflicts of Interest
References
- Ozaki, M. Disaster Risk Financing in Bangladesh; ADB South Asia Working Paper Series No. 46; Asian Development Bank: Metro Manila, Philippines, 2016. [Google Scholar]
- Chowdhury, R.B.; Moore, G.A. Floating agriculture: a potential cleaner production technique for climate change adaptation and sustainable community development in Bangladesh. J. Clean. Prod. 2017, 150, 371–389. [Google Scholar] [CrossRef]
- Dasgupta, S.; Huq, M.; Khan, Z.H.; Sohel Masud, M.; Ahmed, M.M.Z.; Mukherjee, N.; Pandey, K. Climate proofing infrastructure in Bangladesh: The incremental cost of limiting future flood damage. J. Environ. Dev. 2011, 20, 167–190. [Google Scholar] [CrossRef]
- Biswas, A.K. Management of Ganges-Brahmaputra-Meghna System: Way Forward. In Management of Transboundary Rivers and Lakes; Varis, O., Biswas, A.K., Tortajada, C., Eds.; Springer: Berlin/Heidelberg, Germany, 2008; pp. 143–164. [Google Scholar] [CrossRef]
- Ahmad, Q.; Ahmed, A.U. Regional cooperation in flood management in the Ganges-Brahmaputra-Meghna region: Bangladesh perspective. In Flood Problem and Management in South Asia; Springer: Berlin/Heidelberg, Germany, 2003; pp. 181–198. [Google Scholar]
- Banerjee, L. Effects of flood on agricultural productivity in Bangladesh. Oxf. Dev. Stud. 2010, 38, 339–356. [Google Scholar] [CrossRef]
- Rasid, H.; Pramanik, M. Areal extent of the 1988 flood in Bangladesh: How much did the satellite imagery show? Nat. Hazards 1993, 8, 189–200. [Google Scholar] [CrossRef]
- Mirza, M.M.Q. Climate change, flooding in South Asia and implications. Reg. Environ. Chang. 2011, 11, 95–107. [Google Scholar] [CrossRef]
- Bangladesh Bureau of Statistics. Banglaxesh Disaster Related Statistics 2015; BBS: Dhaka, Bangladesh, 2016. [Google Scholar]
- Mirza, M.M.Q. Global warming and changes in the probability of occurrence of floods in Bangladesh and implications. Glob. Environ. Chang. 2002, 12, 127–138. [Google Scholar] [CrossRef]
- Kundzewicz, Z.W.; Kanae, S.; Seneviratne, S.I.; Handmer, J.; Nicholls, N.; Peduzzi, P.; Mechler, R.; Bouwer, L.M.; Arnell, N.; Mach, K.; et al. Flood risk and climate change: global and regional perspectives. Hydrol. Sci. J. 2014, 59, 1–28. [Google Scholar] [CrossRef]
- Dash, J.; Paul, R. Worst Monsoon Floods in Years Kill More Than 1200 across South Asia; Reuters: London, UK, 2017. [Google Scholar]
- Lin, L.; Di, L.; Tang, J.; Yu, E.; Zhang, C.; Rahman, M.; Shrestha, R.; Kang, L. Improvement and Validation of NASA/MODIS NRT Global Flood Mapping. Remote Sens. 2019, 11, 205. [Google Scholar] [CrossRef]
- Chowdhury, E.H.; Hassan, Q.K. Use of remote sensing data in comprehending an extremely unusual flooding event over southwest Bangladesh. Nat. Hazards 2017, 88, 1805–1823. [Google Scholar] [CrossRef]
- Amarnath, G.; Rajah, A. An evaluation of flood inundation mapping from MODIS and ALOS satellites for Pakistan. Geomat. Nat. Hazards Risk 2016, 7, 1526–1537. [Google Scholar] [CrossRef]
- Shen, X.; Wang, D.; Mao, K.; Anagnostou, E.; Hong, Y. Inundation Extent Mapping by Synthetic Aperture Radar: A Review. Remote Sens. 2019, 11, 879. [Google Scholar] [CrossRef]
- Bates, P.D. Remote sensing and flood inundation modelling. Hydrol. Process. 2004, 18, 2593–2597. [Google Scholar] [CrossRef]
- Jung, Y.; Kim, D.; Kim, D.; Kim, M.; Lee, S. Simplified flood inundation mapping based on flood elevation-discharge rating curves using satellite images in gauged watersheds. Water 2014, 6, 1280–1299. [Google Scholar] [CrossRef]
- Rahman, M.S.; Di, L. The state of the art of spaceborne remote sensing in flood management. Nat. Hazards 2017, 85, 1223–1248. [Google Scholar] [CrossRef]
- Chowdhury, M.R. Consensus seasonal Flood Forecasts and Warning Response System (FFWRS): An alternate for nonstructural flood management in Bangladesh. Environ. Manag. 2005, 35, 716–725. [Google Scholar] [CrossRef] [PubMed]
- Islam, A.S.; Bala, S.K.; Haque, M. Flood inundation map of Bangladesh using MODIS time-series images. J. Flood Risk Manag. 2010, 3, 210–222. [Google Scholar] [CrossRef]
- Ahmed, M.R.; Rahaman, K.R.; Kok, A.; Hassan, Q.K. Remote Sensing-Based Quantification of the Impact of Flash Flooding on the Rice Production: A Case Study over Northeastern Bangladesh. Sensors 2017, 17, 2347. [Google Scholar] [CrossRef]
- Rahman, M.S.; Di, L.; Shrestha, R.; Eugene, G.Y.; Lin, L.; Zhang, C.; Hu, L.; Tang, J.; Yang, Z. Agriculture flood mapping with Soil Moisture Active Passive (SMAP) data: A case of 2016 Louisiana flood. In Proceedings of the 2017 6th International Conference on Agro-Geoinformatics, Fairfax, VA, USA, 7–10 August 2017; pp. 1–6. [Google Scholar]
- Joyce, K.E.; Belliss, S.E.; Samsonov, S.V.; McNeill, S.J.; Glassey, P.J. A review of the status of satellite remote sensing and image processing techniques for mapping natural hazards and disasters. Prog. Phys. Geogr. 2009, 33, 183–207. [Google Scholar] [CrossRef]
- Nandi, I.; Srivastava, P.K.; Shah, K. Floodplain Mapping through Support Vector Machine and Optical/Infrared Images from Landsat 8 OLI/TIRS Sensors: Case Study from Varanasi. Water Resour. Manag. 2017, 31, 1157–1171. [Google Scholar] [CrossRef]
- Doody, T.; Overton, I.; Pollock, D. Floodplain inundation mapping. In Ecological Outcomes of Flow Regimes in the Murray–Darling Basin; Report Prepared for the National Water Commission by CSIRO Water for a Healthy Country Flagship; Overton, I., Colloff, M.J., Doody, T.M., Henderson, B., Cuddy, S.M., Eds.; CSIRO: Canberra, Australia, 2009; pp. 289–308. [Google Scholar]
- Wilson, A.M.; Jetz, W. Remotely sensed high-resolution global cloud dynamics for predicting ecosystem and biodiversity distributions. PLoS Biol. 2016, 14, e1002415. [Google Scholar] [CrossRef]
- Greifeneder, F.; Wagner, W.; Sabel, D.; Naeimi, V. Suitability of SAR imagery for automatic flood mapping in the Lower Mekong Basin. Int. J. Remote Sens. 2014, 35, 2857–2874. [Google Scholar] [CrossRef]
- Ajmar, A.; Boccardo, P.; Broglia, M.; Kucera, J.; Giulio-Tonolo, F.; Wania, A. Response to Flood Events: The Role of Satellite-Based Emergency Mapping and the Experience of the Copernicus Emergency Management Service. Flood Damage Surv. Assess. New Insights Res. Pract. 2017, 228, 213–228. [Google Scholar]
- Ohki, M.; Watanabe, M.; Natsuaki, R.; Motohka, T.; Nagai, H.; Tadono, T.; Suzuki, S.; Ishii, K.; Itoh, T.; Yamanokuchi, T. Flood Area Detection Using ALOS-2 PALSAR-2 Data for the 2015Heavy Rainfall Disaster in the Kanto and Tohoku Area, Japan. J. Remote Sens. Soc. Jpn. 2016, 36, 348–359. [Google Scholar]
- Voormansik, K.; Praks, J.; Antropov, O.; Jagomagi, J.; Zalite, K. Flood mapping with TerraSAR-X in forested regions in Estonia. IEEE J. Sel. Top. Appl. Earth Obs. Remote Sens. 2014, 7, 562–577. [Google Scholar] [CrossRef]
- Hoque, R.; Nakayama, D.; Matsuyama, H.; Matsumoto, J. Flood monitoring, mapping and assessing capabilities using RADARSAT remote sensing, GIS and ground data for Bangladesh. Nat. Hazards 2011, 57, 525–548. [Google Scholar] [CrossRef]
- Werle, D.; Martin, T.C.; Hasan, K. Flood and Coastal Zone Monitoring in Bangladesh with Radarsat ScanSAR: Technical Experience and Institutional Challenges. Johns Hopkins APL Tech. Dig. 2000, 21, 148–154. [Google Scholar]
- Dewan, A.M.; Islam, M.M.; Kumamoto, T.; Nishigaki, M. Evaluating flood hazard for land-use planning in Greater Dhaka of Bangladesh using remote sensing and GIS techniques. Water Resour. Manag. 2007, 21, 1601–1612. [Google Scholar] [CrossRef]
- Roy, S.K.; Sarker, S.C. Integration of Remote Sensing Data and GIS Tools for Accurate Mapping of Flooded Area of Kurigram, Bangladesh. J. Geogr. Inf. Syst. 2016, 8, 184. [Google Scholar] [CrossRef]
- Uddin, K.; Guring, D.R. Land cover change in Bangladesh: A knowledge based classification approach. In Proceedings of the 10th International Symposium on Hill Mountain Remote Sensing Cartography, Kathmandu, Nepal, 8–11 September 2008. [Google Scholar]
- Gilani, H.; Shrestha, H.L.; Murthy, M.; Phuntso, P.; Pradhan, S.; Bajracharya, B.; Shrestha, B. Decadal land cover change dynamics in Bhutan. J. Environ. Manag. 2015, 148, 91–100. [Google Scholar] [CrossRef]
- Uddin, K.; Abdul Matin, M.; Maharjan, S. Assessment of Land Cover Change and Its Impact on Changes in Soil Erosion Risk in Nepal. Sustainability 2018, 10, 4715. [Google Scholar] [CrossRef]
- Uddin, K.; Shrestha, H.L.; Murthy, M.; Bajracharya, B.; Shrestha, B.; Gilani, H.; Pradhan, S.; Dangol, B. Development of 2010 national land cover database for the Nepal. J. Environ. Manag. 2015, 148, 82–90. [Google Scholar] [CrossRef] [PubMed]
- Huang, H.; Chen, Y.; Clinton, N.; Wang, J.; Wang, X.; Liu, C.; Gong, P.; Yang, J.; Bai, Y.; Zheng, Y. Mapping major land cover dynamics in Beijing using all Landsat images in Google Earth Engine. Remote Sens. Environ. 2017, 202, 166–176. [Google Scholar] [CrossRef]
- Xiong, J.; Thenkabail, P.; Tilton, J.; Gumma, M.; Teluguntla, P.; Oliphant, A.; Congalton, R.; Yadav, K.; Gorelick, N. Nominal 30-m cropland extent map of continental Africa by integrating pixel-based and object-based algorithms using Sentinel-2 and Landsat-8 data on Google Earth Engine. Remote Sens. 2017, 9, 1065. [Google Scholar] [CrossRef]
- Hansen, M.C.; Potapov, P.V.; Moore, R.; Hancher, M.; Turubanova, S.; Tyukavina, A.; Thau, D.; Stehman, S.; Goetz, S.; Loveland, T.R. High-resolution global maps of 21st-century forest cover change. Science 2013, 342, 850–853. [Google Scholar] [CrossRef] [PubMed]
- Uddin, K.; Gurung, D.R.; Giriraj, A.; Shrestha, B. Application of Remote Sensing and GIS for Flood Hazard Management: A Case Study from Sindh Province, Pakistan. Am. J. Geogr. Inf. Syst. 2013, 2, 1–5. [Google Scholar]
- Manjusree, P.; Kumar, L.P.; Bhatt, C.M.; Rao, G.S.; Bhanumurthy, V. Optimization of threshold ranges for rapid flood inundation mapping by evaluating backscatter profiles of high incidence angle SAR images. Int. J. Disaster Risk Sci. 2012, 3, 113–122. [Google Scholar] [CrossRef]
- Syed, M.A.; Al Amin, M. Geospatial modeling for investigating spatial pattern and change trend of temperature and rainfall. Climate 2016, 4, 21. [Google Scholar] [CrossRef]
- WorldAtlas. 10 Largest Rice Producing Countries. Available online: https://www.worldatlas.com/articles/the-countries-producing-the-most-rice-in-the-world.html (accessed on 25 June 2018).
- Temps, C. Rainfall/Precipitation in Dhaka, Bangladesh. Available online: https://en.climate-data.org/asia/bangladesh/dhaka-division/dhaka-1062098/ (accessed on 17 June 2018).
- Paul, B.K.; Rasid, H. Flood damage to rice crop in Bangladesh. Geogr. Rev. 1993, 83, 150–159. [Google Scholar] [CrossRef]
- NASA. NASA Shuttle Radar Topography Mission Global 1 Arc Second. Available online: https://cgiarcsi.community/data/srtm-90m-digital-elevation-database-v4-1/ (accessed on 17 June 2018).
- Haklay, M.; Weber, P. Openstreetmap: User-generated street maps. IEEE Pervasive Comput. 2008, 7, 12–18. [Google Scholar] [CrossRef]
- Global Administrative Areas. GADM Database of Global Administrative Areas, Version 2.0. Available online: http://www.gadm.org (accessed on 25 June 2018).
- Small, D. Flattening gamma: Radiometric terrain correction for SAR imagery. IEEE Trans. Geosci. Remote Sens. 2011, 49, 3081–3093. [Google Scholar] [CrossRef]
- Ajadi, O.A.; Meyer, F.J.; Webley, P.W. Change detection in synthetic aperture radar images using a multiscale-driven approach. Remote Sens. 2016, 8, 482. [Google Scholar] [CrossRef]
- Janssen, L.L.; Middelkoop, H. Knowledge-based crop classification of a Landsat Thematic Mapper image. Int. J. Remote Sens. 1992, 13, 2827–2837. [Google Scholar] [CrossRef]
- Mwaniki, M.W.; Matthias, M.S.; Schellmann, G. Application of remote sensing technologies to map the structural geology of central Region of Kenya. IEEE J. Sel. Top. Appl. Earth Obs. Remote Sens. 2015, 8, 1855–1867. [Google Scholar] [CrossRef]
- Gan, G.; Ma, C.; Wu, J. Data Clustering: Theory, Algorithms, and Applications; Society for Industrial and Applied Mathematics: Ontario, Canada, 2007; Volume 20. [Google Scholar]
- Ghosh, A.; Mishra, N.S.; Ghosh, S. Fuzzy clustering algorithms for unsupervised change detection in remote sensing images. Inf. Sci. 2011, 181, 699–715. [Google Scholar] [CrossRef]
- Mather, P.; Tso, B. Classification Methods for Remotely Sensed Data; CRC Press: Boca Raton, FL, USA, 2016. [Google Scholar]
- Mohamed, I.N.; Verstraeten, G. Analyzing dune dynamics at the dune-field scale based on multi-temporal analysis of Landsat-TM images. Remote Sens. Environ. 2012, 119, 105–117. [Google Scholar] [CrossRef]
- Komac, M. A landslide susceptibility model using the analytical hierarchy process method and multivariate statistics in perialpine Slovenia. Geomorphology 2006, 74, 17–28. [Google Scholar] [CrossRef]
- Mahi, H.; Farhi, N.; Labed, K. Unsupervised classification of satellite images using K-Harmonic Means Algorithm and Cluster Validity Index. EARSeL eProc. 2016, 15, 10. [Google Scholar]
- Kumar, G.; Sarthi, P.P.; Ranjan, P.; Rajesh, R. Performance of k-means based Satellite Image Clustering in RGB and HSV Color Space. In Proceedings of the 2016 International Conference on Recent Trends in Information Technology (ICRTIT), Chennai, India, 8–9 April 2016; pp. 1–5. [Google Scholar]
- Rahman, M.; Di, L.; Yu, E.; Lin, L.; Zhang, C.; Tang, J. Rapid Flood Progress Monitoring in Cropland with NASA SMAP. Remote Sens. 2019, 11, 191. [Google Scholar] [CrossRef]
- Khatami, R.; Mountrakis, G.; Stehman, S.V. Mapping per-pixel predicted accuracy of classified remote sensing images. Remote Sens. Environ. 2017, 191, 156–167. [Google Scholar] [CrossRef]
- Wing, O.E.; Bates, P.D.; Sampson, C.C.; Smith, A.M.; Johnson, K.A.; Erickson, T.A. Validation of a 30 m resolution flood hazard model of the conterminous United States. Water Resour. Res. 2017, 53, 7968–7986. [Google Scholar] [CrossRef]
- Jain, S.K.; Saraf, A.K.; Goswami, A.; Ahmad, T. Flood inundation mapping using NOAA AVHRR data. Water Resour. Manag. 2006, 20, 949–959. [Google Scholar] [CrossRef]
- Firpi, O.A.A. Satellite Data for All? Review of Google Earth Engine for Archaeological Remote Sensing. Internet Archaeol. 2016. [Google Scholar] [CrossRef]
- Shelestov, A.; Lavreniuk, M.; Kussul, N.; Novikov, A.; Skakun, S. Exploring Google Earth Engine Platform for Big Data Processing: Classification of Multi-Temporal Satellite Imagery for Crop Mapping. Front. Earth Sci. 2017, 5, 17. [Google Scholar] [CrossRef]
- Mesas-Carrascosa, F.-J.; Torres-Sánchez, J.; Clavero-Rumbao, I.; García-Ferrer, A.; Peña, J.-M.; Borra-Serrano, I.; López-Granados, F. Assessing optimal flight parameters for generating accurate multispectral orthomosaicks by UAV to support site-specific crop management. Remote Sens. 2015, 7, 12793–12814. [Google Scholar] [CrossRef]
- Bajracharya, B.; Uddin, K.; Chettri, N.; Shrestha, B.; Siddiqui, S.A. Understanding Land Cover Change Using a Harmonized Classification System in the Himalaya. Mt. Res. Dev. 2010, 30, 143–156. [Google Scholar] [CrossRef]
- Gregorio, A.D. Land Cover Classification System Classification Concepts and User Manual Software Version (2); Food and Agriculture Organization of the United Nations: Rome, Italy, 2005. [Google Scholar]
- Loh, W.Y. Classification and regression trees. Wiley Interdiscip. Rev. Data Min. Knowl. Discov. 2011, 1, 14–23. [Google Scholar] [CrossRef]
- Goldblatt, R.; You, W.; Hanson, G.; Khandelwal, A.K. Detecting the boundaries of urban areas in India: A dataset for pixel-based image classification in Google Earth Engine. Remote Sens. 2016, 8, 634. [Google Scholar] [CrossRef]
- Uddin, K.; Chaudhary, S.; Chettri, N.; Kotru, R.; Murthy, M.; Chaudhary, R.P.; Ning, W.; Shrestha, S.M.; Gautam, S.K. The changing land cover and fragmenting forest on the Roof of the World: A case study in Nepal’s Kailash Sacred Landscape. Landsc. Urban Plan. 2015, 141, 1–10. [Google Scholar] [CrossRef]
- Aguirre-Gutiérrez, J.; Seijmonsbergen, A.C.; Duivenvoorden, J.F. Optimizing land cover classification accuracy for change detection, a combined pixel-based and object-based approach in a mountainous area in Mexico. Appl. Geogr. 2012, 34, 29–37. [Google Scholar] [CrossRef]
- Saah, D.; Johnson, G.; Ashmall, B.; Tondapu, G.; Tenneson, K.; Patterson, M.; Poortinga, A.; Markert, K.; Quyen, N.H.; San Aung, K. Collect Earth: An online tool for systematic reference data collection in land cover and use applications. Environ. Model. Softw. 2019, 118, 166–171. [Google Scholar] [CrossRef]
- UNDP. Bangladesh: Disaster Risk Reduction as Development. Available online: https://www.undp.org/content/undp/en/home/librarypage/poverty-reduction/supporting_transformationalchange/Bangladesh-drr-casestudy-transformational-change.html (accessed on 29 June 2018).
- Dewan, T.H. Societal impacts and vulnerability to floods in Bangladesh and Nepal. Weather Clim. Extrem. 2015, 7, 36–42. [Google Scholar] [CrossRef]
- Zoka, M.; Psomiadis, E.; Dercas, N. The Complementary Use of Optical and SAR Data in Monitoring Flood Events and Their Effects. Proceedings 2018, 2, 644. [Google Scholar] [CrossRef]
- Falter, D.; Schröter, K.; Dung, N.V.; Vorogushyn, S.; Kreibich, H.; Hundecha, Y.; Apel, H.; Merz, B. Spatially coherent flood risk assessment based on long-term continuous simulation with a coupled model chain. J. Hydrol. 2015, 524, 182–193. [Google Scholar] [CrossRef]
- Borah, S.B.; Sivasankar, T.; Ramya, M.; Raju, P. Flood inundation mapping and monitoring in Kaziranga National Park, Assam using Sentinel-1 SAR data. Environ. Monit. Assess. 2018, 190, 520. [Google Scholar] [CrossRef] [PubMed]
- Atijosan, A.; Salau, A.O.; Badru, R.A.; Alaga, T. Development of a Low Cost Community Based Real Time Flood Monitoring and Early Warning System. Int. J. Sci. Res. Sci. Eng. Technol. 2017, 3, 189–195. [Google Scholar]
- World Meteorological Organization. Integrated Flood Management Tools Series; No. 20; WMO: Zurich, Switzerland, 2013; pp. 1–88. [Google Scholar]
- Amir, M.; Khan, M.; Rasul, M.; Sharma, R.; Akram, F. Hydrologic and hydrodynamic modelling of extreme flood events to assess the impact of climate change in a large basin with limited data. J. Flood Risk Manag. 2018, 11, S147–S157. [Google Scholar] [CrossRef]
- Klemas, V. Remote Sensing of Floods and Flood-Prone Areas: An Overview. J. Coast. Res. 2014, 31, 1005–1013. [Google Scholar] [CrossRef]
- Zurqani, H.A.; Post, C.J.; Mikhailova, E.A.; Schlautman, M.A.; Sharp, J.L. Geospatial analysis of land use change in the Savannah River Basin using Google Earth Engine. Int. J. Appl. Earth Obs. Geoinf. 2018, 69, 175–185. [Google Scholar] [CrossRef]
- Reiche, J.; Hamunyela, E.; Verbesselt, J.; Hoekman, D.; Herold, M. Improving near-real time deforestation monitoring in tropical dry forests by combining dense Sentinel-1 time series with Landsat and ALOS-2 PALSAR-2. Remote Sens. Environ. 2018, 204, 147–161. [Google Scholar] [CrossRef]
- WFP. Terai Flood 72 Hour Assessment; Version 1; The United Nations World Food Programme, Ed.; WFP: Kathmandu, Nepal, 2017. [Google Scholar]
- Lobry, S.; Denis, L.; Tupin, F.; Fjørtoft, R. Double MRF for water classification in SAR images by joint detection and reflectivity estimation. In Proceedings of the 2017 IEEE International Geoscience and Remote Sensing Symposium (IGARSS), Fort Worth, TX, USA, 23–28 July 2017. [Google Scholar]
- Ban, Y.; Hu, H.; Rangel, I.M. Fusion of Quickbird MS and RADARSAT SAR data for urban land-cover mapping: Object-based and knowledge-based approach. Int. J. Remote Sens. 2010, 31, 1391–1410. [Google Scholar] [CrossRef]
- Tsyganskaya, V.; Martinis, S.; Marzahn, P.; Ludwig, R. SAR-based detection of flooded vegetation—A review of characteristics and approaches. Int. J. Remote Sens. 2018, 39, 2255–2293. [Google Scholar] [CrossRef]
- Casado, M.R.; Irvine, T.; Johnson, S.; Yu, D.; Butler, J. Drone watch: UAVs for flood extent mapping and damage assessment. In Proceedings of the Small Unmanned Aerial Systems for Environmental Research, Worcester, UK, 28–29 June 2018. [Google Scholar]


| Class Name | Flood | Other | Total | Accuracy |
|---|---|---|---|---|
| Flood | 1335 | 123 | 1458 | 91.56 |
| Other | 37 | 3005 | 3042 | 98.78 |
| Total | 1372 | 3128 | 4500 | n.a. |
| Producer’s accuracy (%) | 97.30 | 96.07 | n.a. | n.a. |
| Land Cover | Hill Forest | Madhupur Forest | Mangrove Forest | Rural Settlement and Homestead Orchard | Grassland | Cropland | Barren Area | Built-Up Area | Waterbodies | Total | Users Accuracy (%) |
|---|---|---|---|---|---|---|---|---|---|---|---|
| Hill forest | 155 | 1 | 1 | 8 | 1 | 166 | 93.37 | ||||
| Madhupur forest | 7 | 1 | 1 | 9 | 77.78 | ||||||
| Mangrove forest | 43 | 1 | 44 | 97.73 | |||||||
| Rural settlement and homestead orchard | 1 | 1 | 1 | 214 | 60 | 2 | 279 | 76.70 | |||
| Grassland | 1 | 3 | 1 | 1 | 6 | 50.00 | |||||
| Cropland | 59 | 1 | 722 | 3 | 12 | 797 | 90.59 | ||||
| Barren area | 1 | 19 | 1 | 1 | 22 | 86.36 | |||||
| Built-up area | 3 | 2 | 6 | 11 | 54.55 | ||||||
| Waterbodies | 18 | 113 | 131 | 86.26 | |||||||
| Total | 156 | 9 | 45 | 279 | 4 | 812 | 23 | 7 | 130 | 1465 | n.a. |
| Producer’s accuracy (%) | 99.36 | 77.78 | 95.56 | 76.70 | 75.00 | 88.92 | 82.61 | 85.71 | 86.92 | n.a. | n.a. |
© 2019 by the authors. Licensee MDPI, Basel, Switzerland. This article is an open access article distributed under the terms and conditions of the Creative Commons Attribution (CC BY) license (http://creativecommons.org/licenses/by/4.0/).
Share and Cite
Uddin, K.; Matin, M.A.; Meyer, F.J. Operational Flood Mapping Using Multi-Temporal Sentinel-1 SAR Images: A Case Study from Bangladesh. Remote Sens. 2019, 11, 1581. https://doi.org/10.3390/rs11131581
Uddin K, Matin MA, Meyer FJ. Operational Flood Mapping Using Multi-Temporal Sentinel-1 SAR Images: A Case Study from Bangladesh. Remote Sensing. 2019; 11(13):1581. https://doi.org/10.3390/rs11131581
Chicago/Turabian StyleUddin, Kabir, Mir A. Matin, and Franz J. Meyer. 2019. "Operational Flood Mapping Using Multi-Temporal Sentinel-1 SAR Images: A Case Study from Bangladesh" Remote Sensing 11, no. 13: 1581. https://doi.org/10.3390/rs11131581
APA StyleUddin, K., Matin, M. A., & Meyer, F. J. (2019). Operational Flood Mapping Using Multi-Temporal Sentinel-1 SAR Images: A Case Study from Bangladesh. Remote Sensing, 11(13), 1581. https://doi.org/10.3390/rs11131581