Article

A Bibliometric Profile of the Remote Sensing Open Access Journal Published by MDPI between 2009 and 2018

1
Faculty of Education, Dalian University, Dalian 116622, China
2
Western Geographic Science Center (WGSC), U. S. Geological Survey (USGS), 2255, N. Gemini Drive, Flagstaff, AZ 86001, USA
3
Faculty of Management and Economics, Dalian University of Technology, Dalian 116024, China
*
Author to whom correspondence should be addressed.
Remote Sens. 2019, 11(1), 91; https://doi.org/10.3390/rs11010091
Submission received: 13 November 2018 / Revised: 27 December 2018 / Accepted: 28 December 2018 / Published: 7 January 2019
(This article belongs to the Special Issue Remote Sensing: 10th Anniversary)

Abstract

:
Remote Sensing Open Access Journal (RS OAJ) is an international leading journal in the field of remote sensing science and technology. It was first published in the year 2009 and is currently celebrating tenth year of publications. In this research, a bibliometric analysis of RS OAJ was conducted based on 5588 articles published during the 10-year (2009–2018) time-period. The bibliometric analysis includes a comprehensive set of indicators such as dynamics and trends of publications, journal impact factor, total cites, eigenfactor score, normalized eigenfactor, CiteScore, h-index, h-classic publications, most productive countries (or territories) and institutions, co-authorship collaboration about countries (territories), research themes, citation impact of co-occurrences keywords, intellectual structure, and knowledge commutation. We found that publications of RS OAJ presented an exponential growth in the past ten years. From 2010 to 2017 (for which complete years data were available), the h-index of RS OAJ is 67. From 2009–2018, RS OAJ includes publications from 129 countries (or territories) and 3826 institutions. The leading nations contributing articles, based on 2009–2018 data, and listed based on ranking were: China, United States, Germany, Italy, France, Spain, Canada, England, Australia, Netherlands, Japan, Switzerland and Austria. The leading institutions, also for the same period and listed based on ranking were: Chinese Academy of Sciences, Wuhan University, University of Chinese Academy of Sciences, Beijing Normal University, The university of Maryland, National Aeronautics and Space Administration, National Oceanic and Atmospheric Administration, China University of Geosciences, United States Geological Survey, German Aerospace Centre, University of Twente, and California Institute of Technology. For the year 2017, RS OAJ had an impressive journal impact factor of 3.4060, a CiteScore of 4.03, eigenfactor score of 0.0342, and normalized eigenfactor score of 3.99. In addition, based on 2009–2018, data co-word analysis determined that “remote sensing”, “MODIS”, “Landsat”, “LiDAR” and “NDVI” are the high-frequency of author keywords co-occurrence in RS OAJ. The main themes of RS OAJ are multi-spectral and hyperspectral remote sensing, LiDAR scanning and forestry remote sensing monitoring, MODIS and LAI data applications, Remote sensing applications and Synthetic Aperture Radar (SAR). Through author keywords citation impact analysis, we find the most influential keyword is Unmanned Aerial Vehicle (UAV), followed, forestry, Normalized Difference Vegetation Index (NDVI), terrestrial laser scanning, airborne laser scanning, forestry inventory, urban heat island, monitoring, agriculture, and laser scanning. By analyzing the intellectual structure of RS OAJ, we identify the main reference publications and find that the themes are about Random Forests, MODIS vegetation indices and image analysis, etc. RS OAJ ranks first in cited journals and third in citing, this indicates that RS OAJ has the internal knowledge flow. Our results will bring more benefits to scholars, researchers and graduate students, who hopes to get a quick overview of the RS OAJ. And this article will also be the starting point for communication between scholars and practitioners. Finally, this paper proposed a nuanced h-index (nh-index) to measure productivity and intellectual contribution of authors by considering h-index based on whether the one is first, second, third, or nth author. This nuanced approach to determining h-index of authors is powerful indicator of an academician’s productivity and intellectual contribution.

Graphical Abstract

1. Introduction

Remote Sensing Open Access Journal (RS OAJ) is an international peer-reviewed scholarly open access journal established in the year 2009 and published every month by MDPIAG, SWITZERLAND. It publishes regular research papers, technical notes or letters, review articles, and communications. Today, the journal is very well recognized in remote sensing science and technology and other spatial sciences such as the geographic information systems (GIS), global positioning systems (GPS), and global navigation satellite system (GNSS). A wide array of remote sensing subjects are covered that include passive remote sensing from sensors such as multispectral and hyperspectral sensors [1,2], microwave radiometer (Yavuz, Teixeira, 2009) [3], thermal radiometer (Gao, Kustas & Anderson, 2012) [4], etc. Active remote sensing from sensors such as Lidar (Colgan, Baldeck & Féret et al., 2012) [5], Radar (Joshi, Baumann & Ehammer et al., 2016) [6], Sonar (Hasan, Ierodiaconou & Monk, 2012) [7], Scatterometer (Zwieback, Paulik & Wagner, 2015) [8], Altimeter (Bosch, Dettmering & Schwatke, 2014) [9]. The Remote Sensing Open Access Journal (RS OAJ) of the MDPI is indexed by Science Citation Index Expanded, Ei Compendex, SCOPUS and some other famous databases. In the 2017 Journal Citation Reports (JCR) released by Web of Science, it had an impact factor (IF) of 3.406 and a CiteScore (Elsevier) of 4.03.
This year (2018) is the 10th anniversary of RS OAJ and a special issue is organized to celebrate this. In this milestone, conducting a general bibliometric review about RS OAJ is particularly pertinent and valuable. It is common to publish special issues (Meyer, Winer, 2014) [10] when a journal is holding a significant anniversary. In particular, a bibliometric overview of the journal is noteworthy because it provides some historical results and the retrospective evaluation of the journal is presented for us (Schwert, 1993) [11]. Research on bibliometric of a journal has developed for a long time (Heck, Bremser, 1986) [12]. Many scholars have done bibliometric analysis of journals during the anniversary celebrations. Such as Shugan (2006) [13] developed a bibliometric overview of the journal Marketing Science. Van Fleet (2006) [14] wrote an article about The Journal of Management’s First 30 Years published in the Journal of Management. Merigó (2015) [15] of the papers published Journal of Business Research. Cancino (2017) [16] presented an overview of the Computers & Industrial Engineering. Merigó (2017) [17] developed a bibliometric analysis of the thirty years of International Journal of Intelligent Systems. Valenzuela (2017) [18] presented an overview of Journal of Business & Industrial Marketing. Tang (2018) [19] wrote an article about Ten Years of Sustainability (2009 to 2018): A Bibliometric Overview.
Bibliometrics provides us with a tool that can be easily extended from the micro to the macro level. Bibliometric indicators are increasingly used as research performance evaluation tools. These indicators are based on bibliographic databases designed primarily for information retrieval purposes. Such as co-citation, journal impact factor, total cites, eigenfactor score, normalized eigenfactor, CiteScore, h-index. We can understand the characteristics of journals macroscopically through these indicators.
The RS OAJ published by MDPI has not been systematically reviewed by bibliometric method previously. Therefore, in this article, we conduct a comprehensive bibliometric profile of RS OAJ that will help answer questions like:
(1)
What are the dynamics and trends of RS OAJ publications over last 10-years?
(2)
What are the journal impact factor, total cites, eigenfactor score, normalized eigenfactor, CiteScore of RS OAJ and the publications speed of various remote sensing journals?
(3)
What is the h-index of RS OAJ, and how are the h-classic publications distributed?
(4)
What are the major institutions and countries (or territories) according to number of publications, and the cooperation patterns among them?
(5)
What are the main research themes?
(6)
What are the citation impact of co-occurrences keywords?
(7)
What is the intellectual structure analysis about RS OAJ? and
(8)
What is the knowledge commutation analysis about RS OAJ?
In each of the above, a comparison is made with the similar factors of other leading remote sensing journals of the world.
This article is expected to achieve several goals. First, it is expected to help readers to get a quick, intuitive, and profound overview of RS OAJ, and help relevant scientists/readers decide whether or not to contribute articles to the RS OAJ. Second, exploring the research status of RS OAJ by bibliometric analysis, some meaningful information will be provided to improve the visibility of RS OAJ. Third, a comparison with other leading remote sensing journals will highlight strengths and limitations of RS OAJ. Fourth, a comprehensive review of this nature will help take stock, get critical feedback from the scientific community, understand what has been done right so far and help focus on advancing the journal to next level. A comprehensive understanding of the journal is achieved by analyzing factors such as the number of citations, most cited papers, influential authors, document types, impact factor (IF), the publication years, the most productive institutions and countries (territories). Fifth, In August 2005, Jorge Hirsch (2005) [20] proposed a research performance indicator called h-index to measure the scientific performance of scholars. It is defined as follows, “A scientist has index h if h of his or her Np papers have at least h citations each and the other (Np − h) of papers have ≤h citations each”. (Hirsch, 2005) [20]. So, an h-index of 25 means that a scientist has 25 papers that are each cited atleast 25 times. This new indicator has attracted great interest in the field of informetrics, scientometrics and bibliometrics. Butler & McAllister (2011) [21] had confirmed the applicability of h-index to social science researchers. Costas & Bordons (2007) [22] confirmed the h-index, which includes the total number of publications and the citation of these publications, has recently been proposed as an objective criterion for academic productivity. The advantage of the h-index is that it gives a robust estimate of the wide impact of scientists’ cumulative research contributions (Hirsch, 2005) [20]. The authors of this manuscript suggest to take a more nuanced assessment of h-index. This calls to consider h-index based on the authorship ranking; that is whether the one is the first, second, third, and so on to nth author. The synthesis will develop visualization tools that are employed to exhibit the development characteristics of RS OAJ and compare the same with other leading remote sensing journals. In addition, the h-index can not only be applied to assessment achievement of a single researcher, but also can be applied to academic journals (Bornmann, 2005) [23].

2. Materials and Methods

The data for this article was retrieved from the Web of Science database after comparing it with other databases as it contains panoramic information of RS OAJ. We used the journal title = “Remote Sensing” to search for publications. There were 5573 publications in total from 2009 until the date of search (2 August 2018). In addition, there were 15 publications missing from the database, but found in the RS OAJ journal homepage (which included 8 editorials, 5 new book reviews, and 2 articles). We processed these 15 publications according to the Web of Science format, and a total of 5588 publications were obtained. RS OAJ contains 7 types of publications: research articles (5373, 96.15%), review articles (103, 1.84%), editorials (57, 1.02%), corrections/addendum (44, 0.79%), letters (4, 0.07%), book reviews (5, 0.14%) and biographies (2, 0.04%).
Bibliometric analysis is an effective way to study and test a knowledge field (Braun, Schubert, 2003) [24] and it also can avoid subjective judgment (Garfield, 1972) [25]. A large number of bibliometric methods are used to evaluate research performance. Because this is a quantitative study, providing many indicators to assess the literature (Broadus, 1987) [26]. This article used a wide range of bibliometric indicators, including the dynamics and trends of publications, h-index, h-classic publications, co-authorship countries (territories) and institutions, citation impact of co-occurrences keywords, co-occurrences author keywords and other related indicators (Alonso, Cabrerizo, Herrera-Viedma & Herrera, 2009; Franceschini, Maisano, 2010; Hirsch, 2005) [20,27,28]. Since Henry Small (1980) [29] introduced the concept of co-citation for the first time and used the node link network to visualize the co-citation relationship of 10 famous particle physics papers, a large number of studies have applied the visualization of the co-citation relationship. In a series of subsequent co-citation studies (Small 1981 and 2006) [30,31], Boyack (2014) [32] and White (2014) [33] studied the principle of co-citation analysis and its application in the process of scientific development and determined the dynamic intellectual structure of science as a whole or in a specific field. The scholars expanded the analysis unit from the paper to the author, resulting in the author co-citation analysis (ACA) (Nerur, 2010) [34]. Through a lot of self-reflection research on co-citation research, two main types of co-citation analysis, that is, DCA and ACA, can be found to visualize the whole or specific domain intelligent structure (Chen, Ibekwe-Sanjuan & Hou, 2010) [35].
We made a comparison with the 20 other leading remote sensing journals (Table 1) taking four factors: journal impact factor, total cites, eigenfactor score, and normalized eigenfactor. We have considered other equivalent journals which overwhelmingly publish remote sensing data, methods, and science.
Journal Impact Factor means number of times all the articles that are published in the last two years (e.g., 2015, 2016) in a journal are cited this year (e.g., 2017) by any journal in the JCR database divided by the total number of articles published [36,37].
JIF   ( k ) = nk 1 + nk 2 Nk 1 + Nk 2
where “k” is a year, “Nk − 1 + Nk − 2” is the number of papers published by the journal in the previous two years, “nk − 1” and “nk − 2” represent the number of citations of the journal in year “k”.
Specifically, the journal impact factor of RS OAJ in 2017 can be calculated as the following formula:
JIF   ( 2017 ) = Citations   in   2017   to   items   published   in   2015 ( 3071 ) + 2016 ( 2985 ) Number   of   citable   items   in   2015 ( 762 ) + 2016 ( 1016 )
Total cites means the total number of times that a journal has been cited by all journals included in the database in the Journal Citation Reports (JCR) year [38].
Eigenfactor score calculation is based on the number of times articles from the journal published in the past five years have been cited in the JCR year, but it also considers which journals have contributed these citations so that highly cited journals will influence the network more than lesser cited journals [39,40]. Remote Sensing Open Access Journal (RS OAJ) with eigenfactor score of 0.0342 is next only to Remote Sensing of Environment (0.0529), and IEEE Transaction of Geoscience and Remote Sensing (0.0434), showing that RS OAJ has excellent record of its articles cited in other high ranked journals.
The normalized eigenfactor Score is the eigenfactor score normalized, by rescaling the total number of journals in the JCR each year, so that the average journal has a score of 1. Journals can then be compared and influence measured by their score relative to 1. For example, Remote Sensing Journal of MDPI which has a normalized eigenfactor of 3.99, means that the journal is 3.99 times more influential as the average journal in the Journal Citation Report (JCR) [41].
Another measure of the impact of the journals is depicted by the CiteScore. CiteScore is a new journal evaluation index published by Elsevier publishers in 2016. CiteScore calculates the average number of citations received in a calendar year by all items published in that journal in the preceding three years. Papers published in journals for 3 consecutive years are cited times in the fourth year without excluding any type of articles. It increases the citation period by one year compared with the impact factors. (https://journalmetrics.scopus.com) [42].
We also analysis the most productive countries (territories) and institutions. Because we can see the distribution characteristics of high-yielding countries and institutions, we can find out which countries and institutions are investing most of their efforts in remote sensing. Our research method is to obtain the most productive countries (territories) and institutions by downloading RS OAJ data from the Web of science database and sorting them in descending order. In addition, through the VOSviewer, we can analyze the amount of cooperation between countries. Further explore which countries have closer cooperation. In a nutshell, we use bibliometric and cartography to explore the bibliometric characteristics of the RS OAJ in this article. And we use h-index and h-classic articles to identify highly cited articles in RS OAJ. We also used co-citation to analyze intellectual structure. In addition, we use VOSviewer with the visual intelligence structure tools (Van Eck et al., 2010) [43]. This is because VOSviewer makes it more intuitive to display panoramic information about RS OAJ (Bonilla, Merigó & Torres-Abad, 2015; Ding, Rousseau & Wolfram, 2014) [44,45].

3. Results

The results of the data analysis of the RS OAJ based on the Web of Science database is provided below and discussed in sub-sections below.

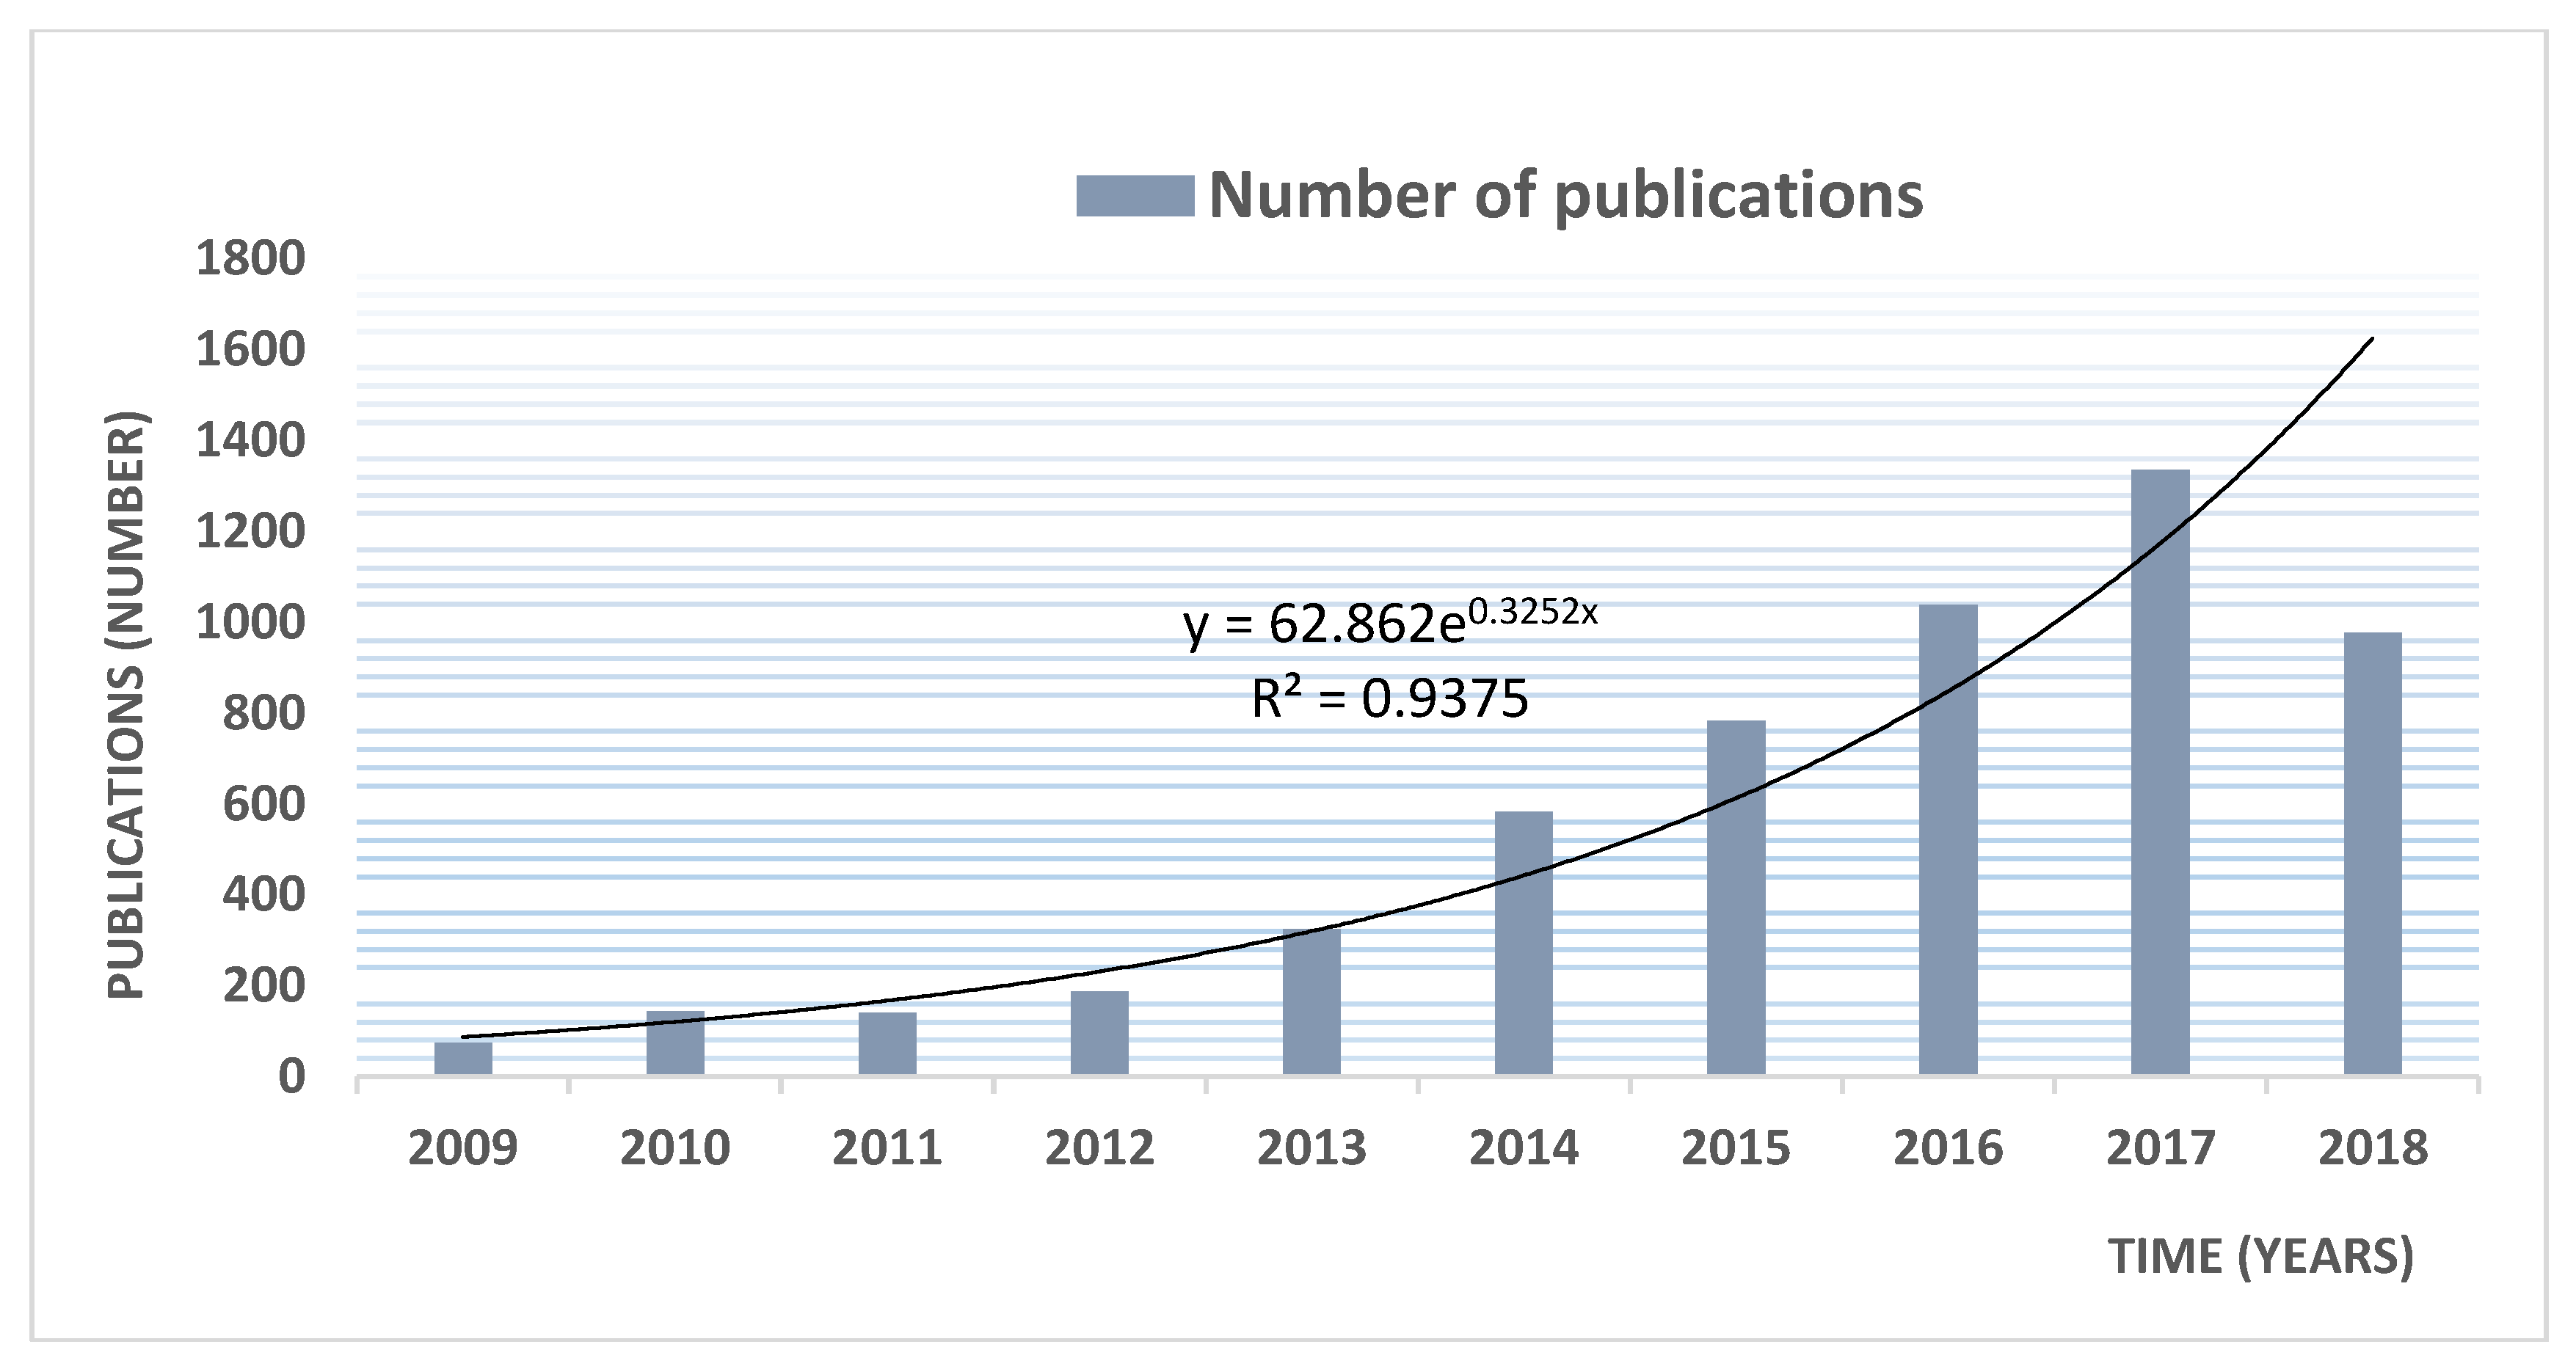
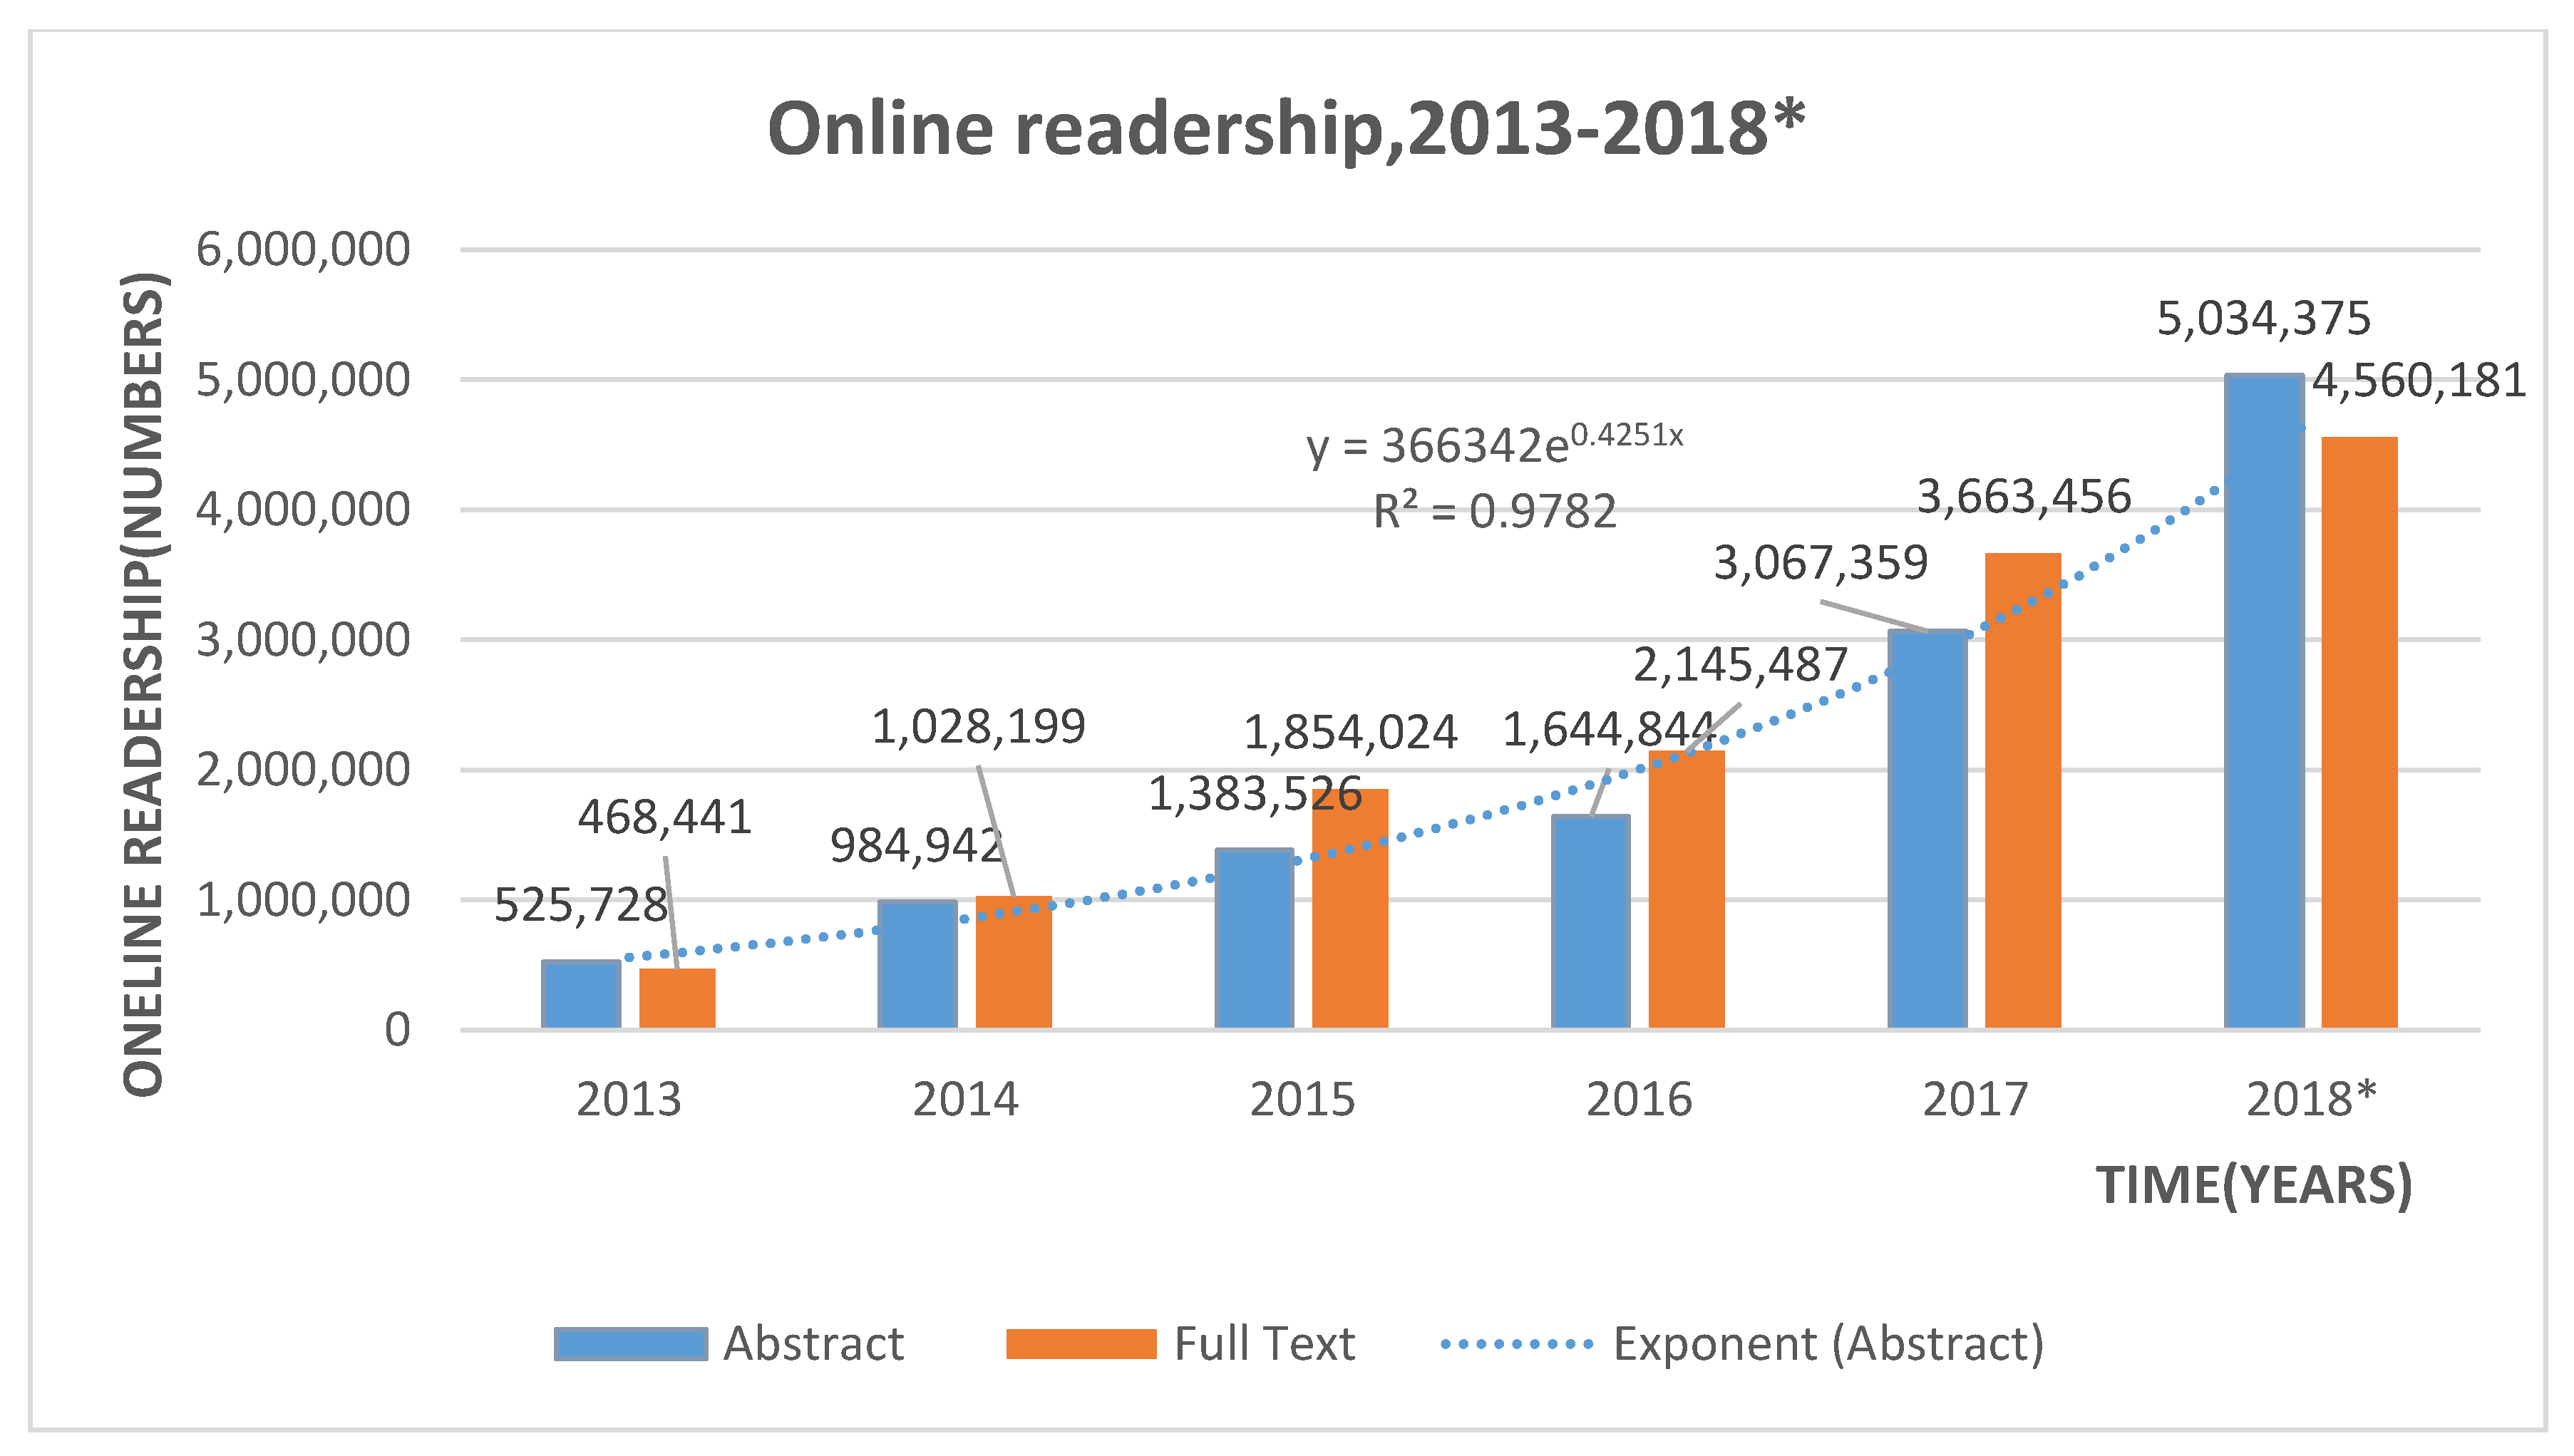
3.1. Dynamics and Trends of Publications

Figure 1 shows the dynamics and trends of publications in RS OAJ annually. On the whole, there is a near exponential growth in the number of articles published from 2012 to 2017 and the trend appears to stay the pattern in 2018.The first three years (2009–2011) there was a period of uncertainty. The number of publications increased at the peak of the year (2017, 1336 publications), and will probably stay about the same in 2018. A correlation approximated by a fast growth line following the equation y = 62.862e0.3252x with R2 = 0.9375, is found through the number of publications from 2009 to 2018 (Figure 1). Relative to 2011 (141 publications), there was swift growth of 950% by 2017 (1336 publications). From the trend, it is reasonable to predict that the growth will plateau around 1400 articles per year (about 120 papers per month). Year 2009 was a partial year. The slight decrease in 2011 (141 publications) relative to 2010 (144 publications), was the due to challenge of a new journal establishing its credibility with the remote sensing community and trying to obtain citation index.

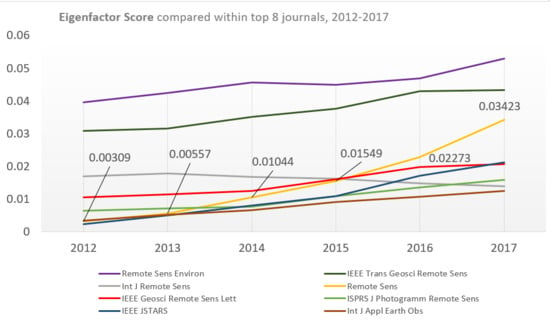
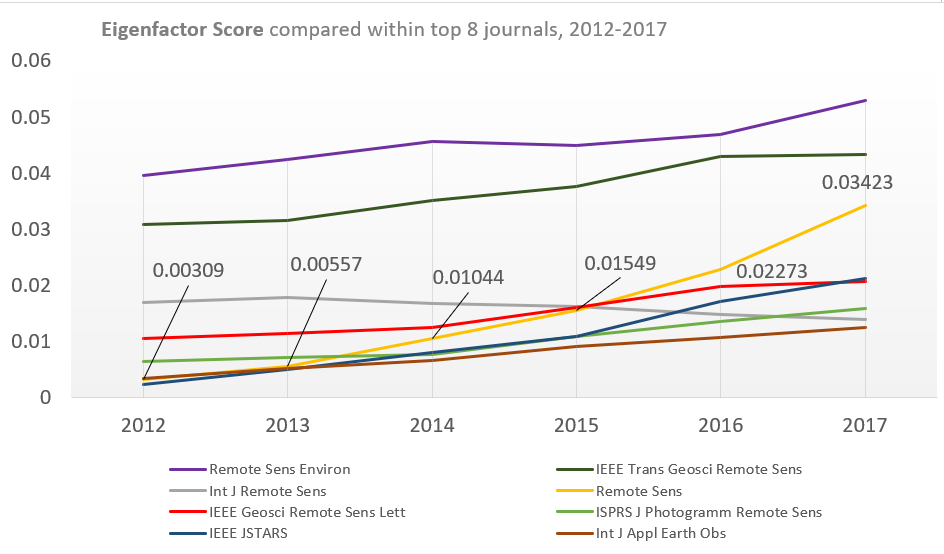
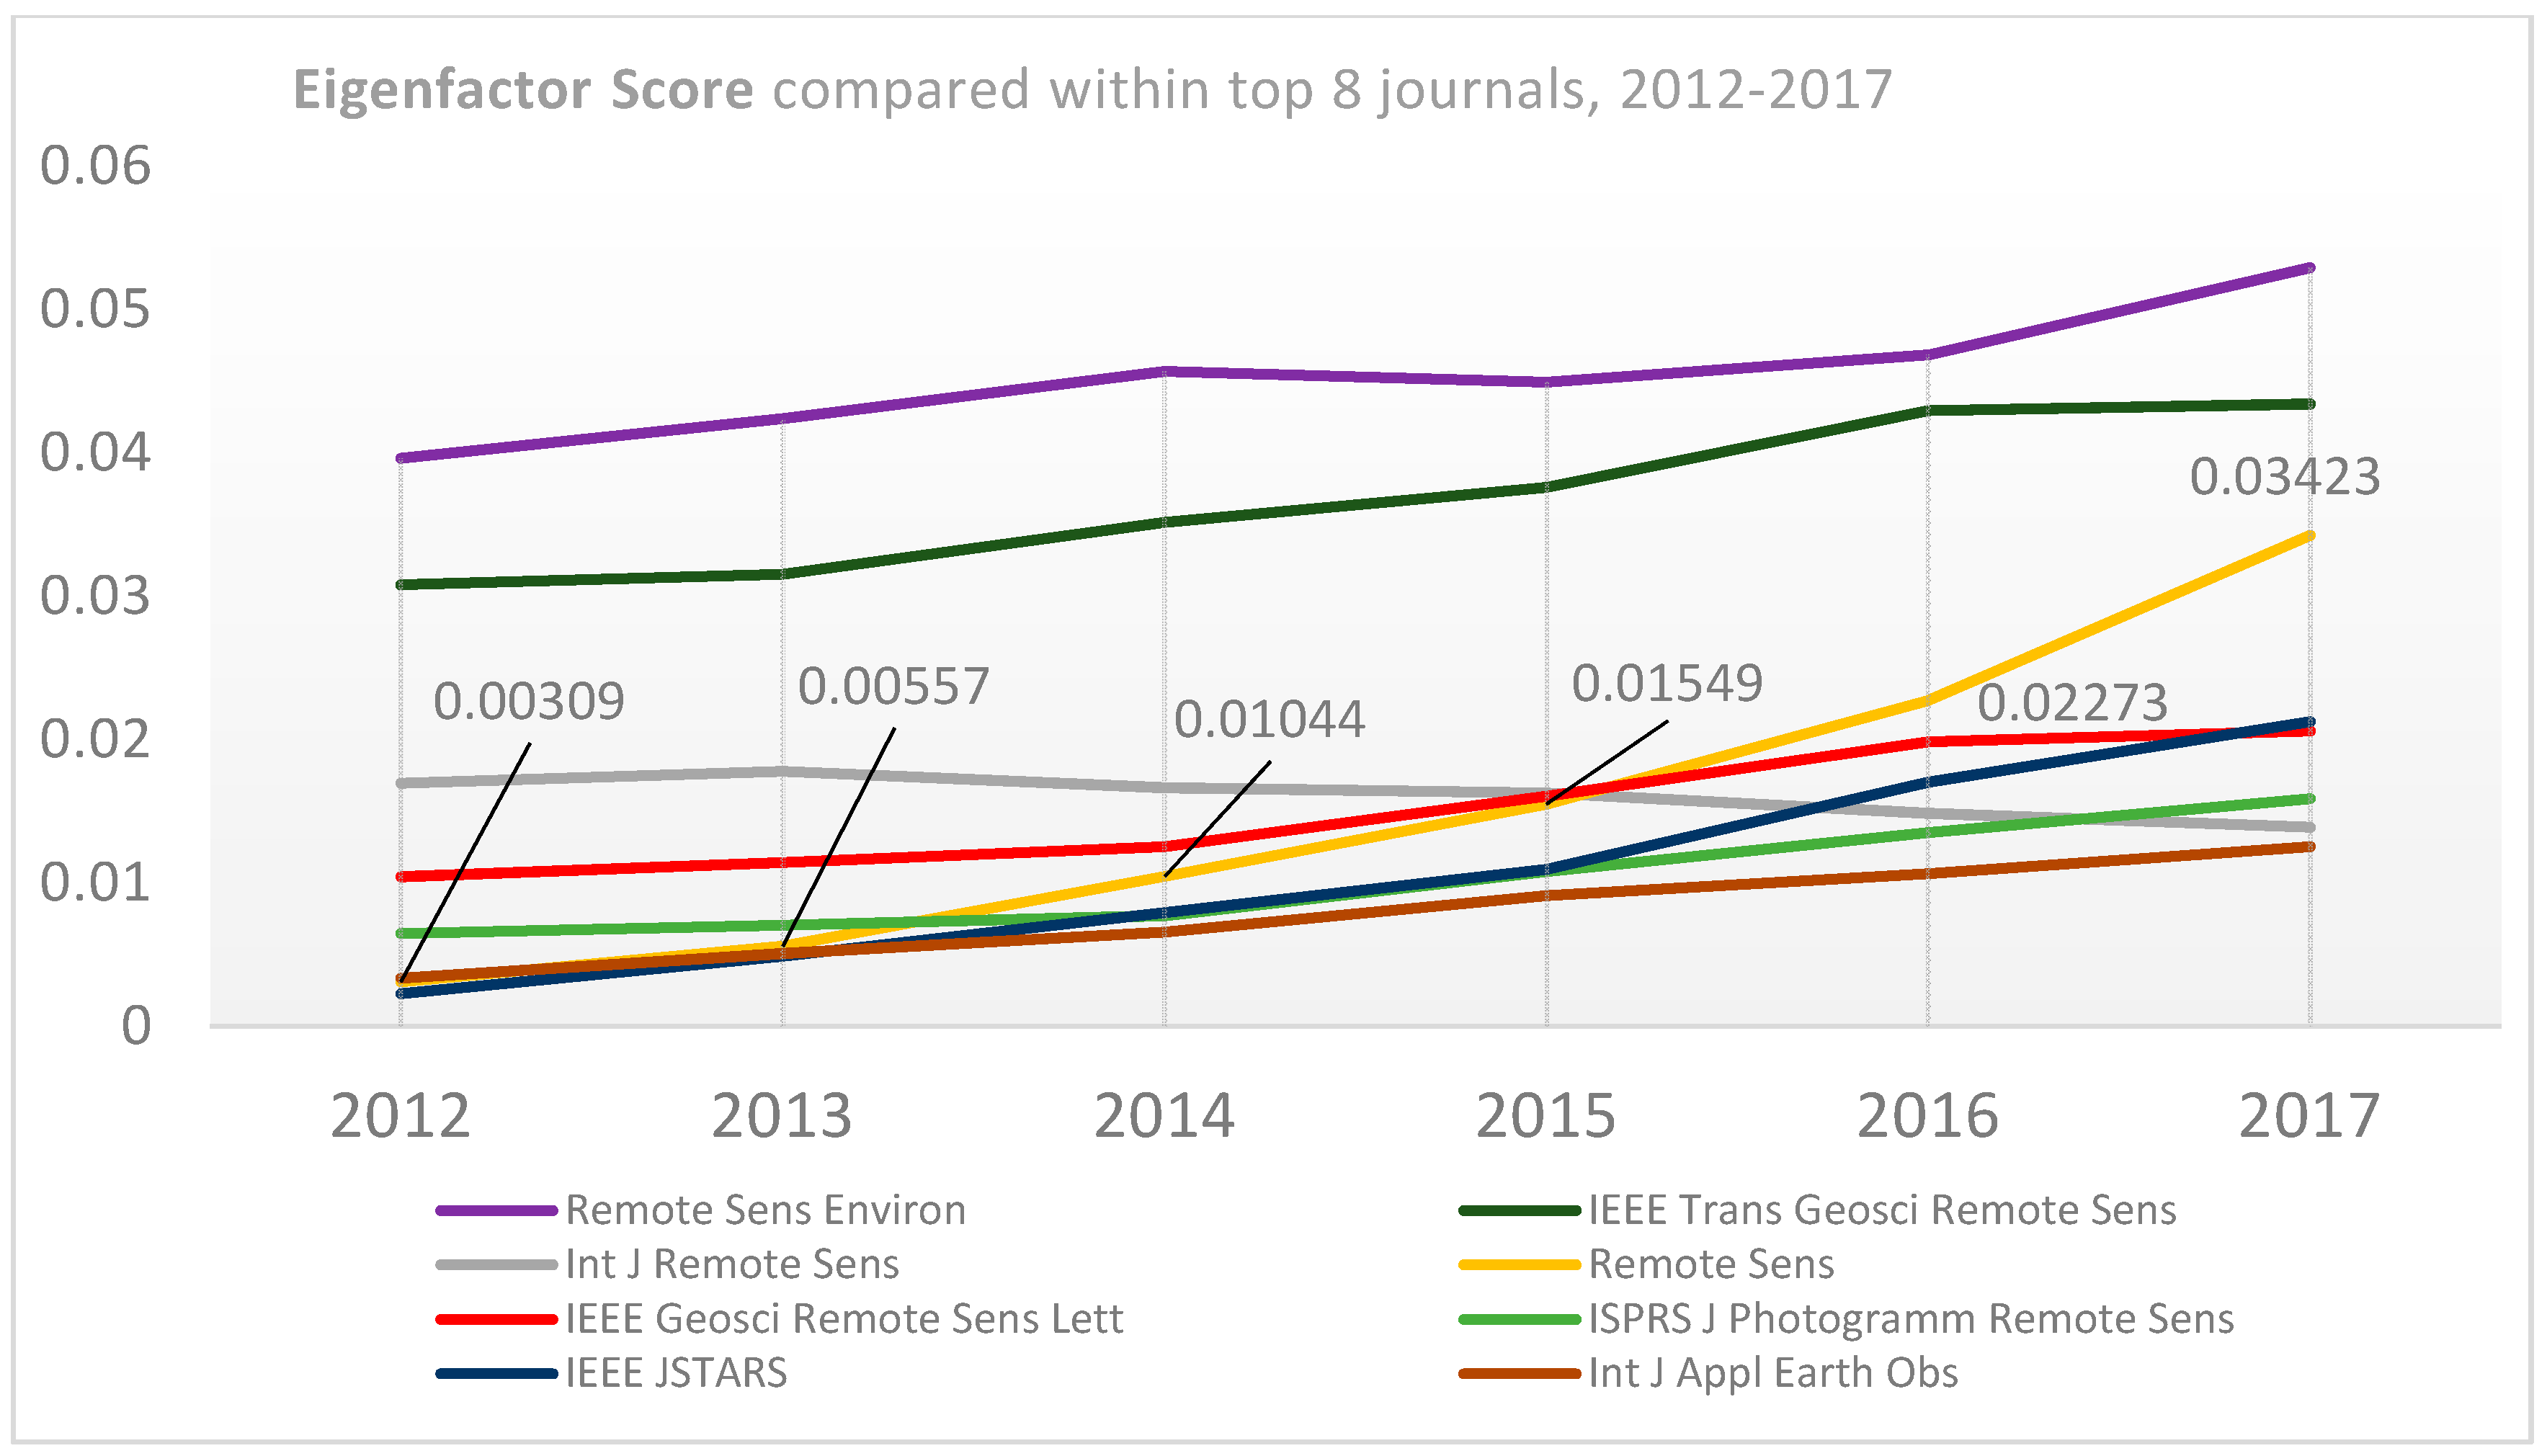
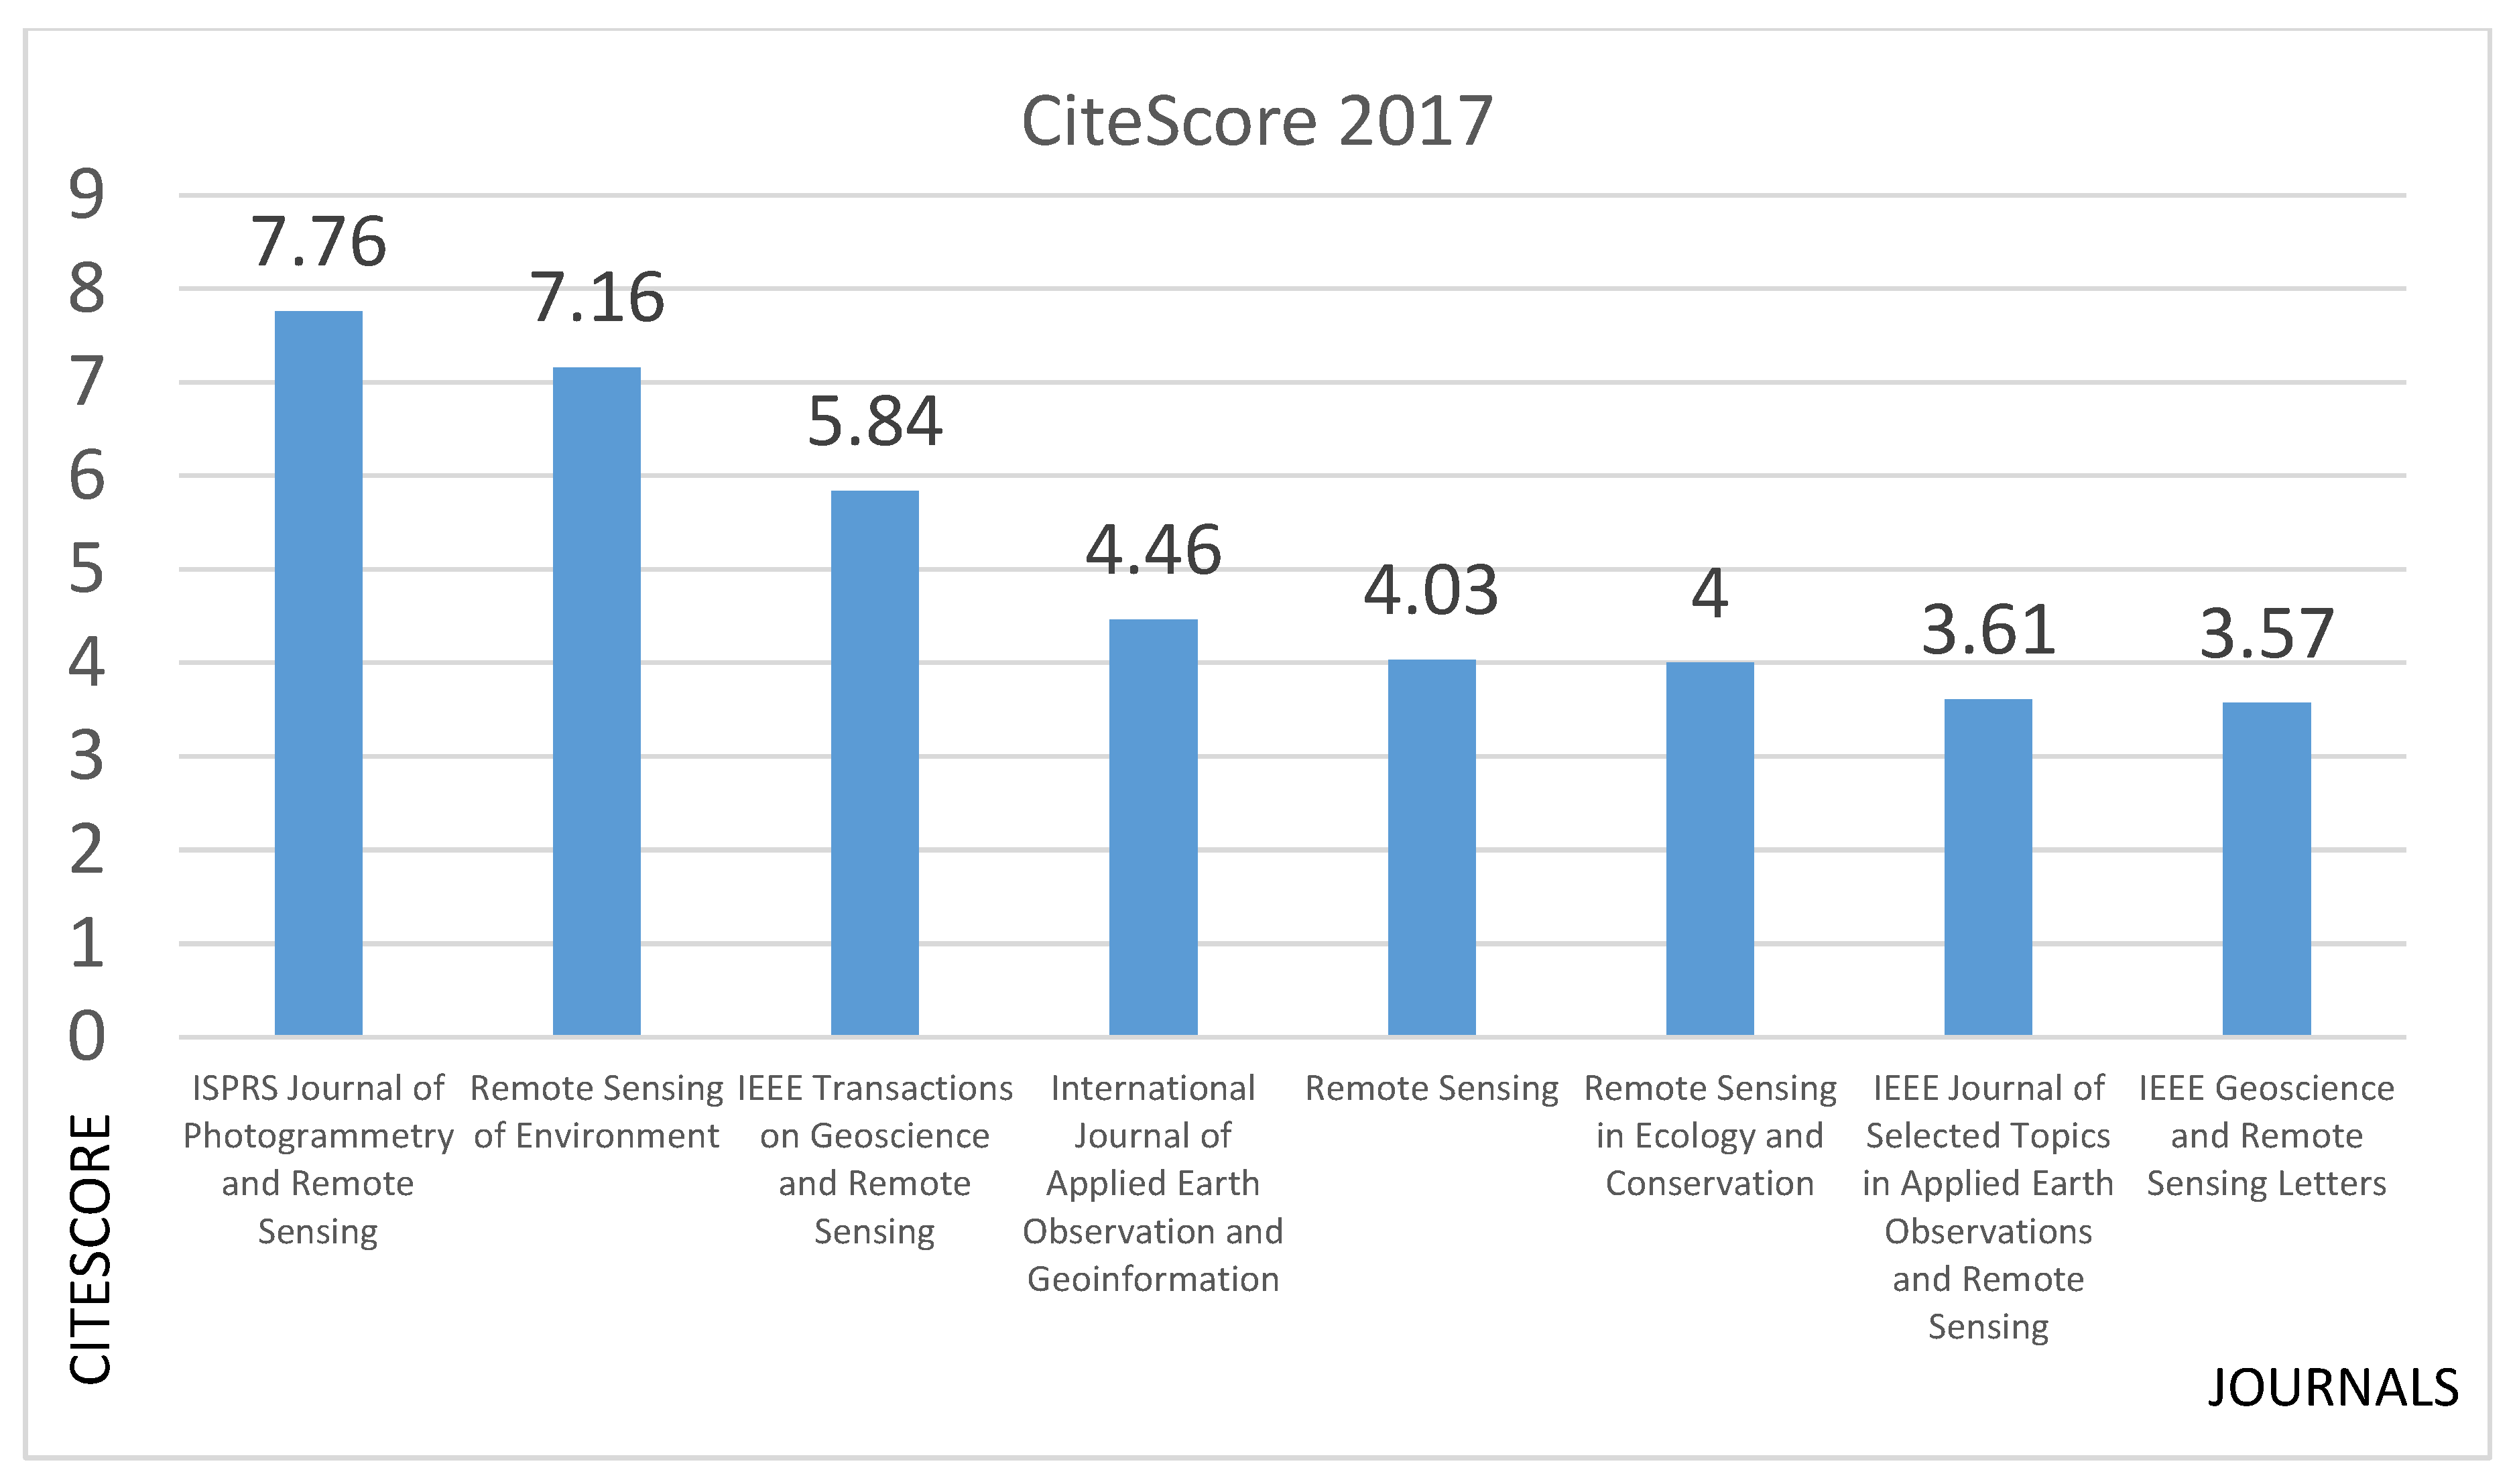
3.2. Journal Impact Factor, Total Cites, Eigenfactor Score, Normalized Eigenfactor and the Publication Speed of Various Remote Sensing Journals

We have compared Remote Sensing with 20 other journals that extensively publish remote sensing science and technology (Table 1) which shows a high level of performance not only in journal impact factor, but also other key parameters like total cites, eigenfactor score and normalized eigenfactor score obtained from Web of Science category REMOTE SENSING [36,37,46,47]. Remote Sensing Open Access Journal (RS OAJ) of MDPI has an impressive journal impact factor of 3.4060 for the year 2017 (Table 1). During 2017, there were a total of 13,600 cites (Figure 2) of the articles published in RS OAJ. Citations of these articles in various remote sensing journals are included in the Journal Citation Reports (JCR). The eigenfactor score of 0.0342 (Figure 3) and normalized eigenfactor score of 3.9902 are next only to Remote Sensing of Environment (RSE) and IEEE Transactions of Geoscience and Remote Sensing (IEEE TGRS). Overall, when 21 top remote sensing journals are compared, RS OAJ is ranked #6 in journal impact factor, fourth in total citations, and third in the eigenfactor score and also third in normalized the eigenfactor scope (Table 1).
For the year 2017, the CiteScore for RS OAJ is 4.03. A comparison of CiteScores of other leading remote sensing journals is provided in Figure 4 below. Online readership (Figure 5) of the RS OAJ has reached around 3.5 million annually in the year 2017 and has already crossed over 4 million in the year 2018, at the time of writing this article (30 October 2018). This again follows an exponential growth over the years (Figure 5).
We excluded these five journals (IEEE Geoscience and Remote Sensing Magazine, IEEE Transactions on Geoscience and Remote Sensing, IEEE Geoscience and Remote Sensing Letters, IEEE Journal of Selected Topics in Applied Earth Observations and Remote Sensing, Photogrammetric Record) with only publication time and no acceptance time. We can see the publication speed of 16 various remote sensing journals in Table 2 that the publication time of RS OAJ is the fastest, which is about one to two months. European Journal of Remote Sensing takes 12 to 13 months to publication. Therefore, one of the greatest advantages of open-access journals is that they are published almost immediately after acceptance. This is one reason why RS OAJ has attracted more attention from scholars and practitioners.

3.3. H-Index and H-Classic Publicaitons

Generally speaking, the h-index is used to show the performance of journals. From 2010 to 2017, the h-index of RS OAJ is 67. It means there are 67 publications which are each cited atleast 67 times. We chose other journals in the “remote sensing” category. Because some of these journals have been in existence for far greater number of years; some as way back as from 1980s and 1990s. So we compared all journals from 2010–2017 because 2009 was a partial year (published 4 issues) for RS OAJ and the data of 2018 is incomplete. Comparative h-index of other leading remote sensing journals during 2010–2017 were: Remote Sensing of Environment (h-index = 112), IEEE Transactions on Geoscience and Remote Sensing (h-index = 101), IEEE Geoscience and Remote Sensing Letters (h-index = 54), International Journal of Remote Sensing (h-index = 52), IEEE Journal of Selected Topics in Applied Earth Observations and Remote Sensing (h-index = 52), Photogrammetric Engineering And Remote Sensing (h-index = 34), Journal Of Applied Remote Sensing (h-index = 25), Remote Sensing Letters (h-index = 28). There were only two journals higher than RS OAJ during this period. Thereby, an h-index of 67 from 2010–2017, demonstrates the significant impact that the RS OAJ already has on remote sensing community. Martínez (2015) [48] introduced the h-classic articles that are made up of highly cited papers with more than h-citations. Among the 67 h-classic publications, 2013 (n = 18) is the most, followed by 2010 (n = 11), 2012 (n = 10), 2011 (n = 9), 2009 (n = 8), 2014 (n = 7), 2015 (n = 3) and 2016 (n = 1). Of course, the recent year publications will take time to gather greater h-index. There are 11 articles from the year 2010 that have an h-index of 67; meaning there are 67 citations for these 11 articles from 2010 to Aug. 2018. Table 3 shows the top 20 h-classic publications in RS OAJ along with the number of citations.
The above 20 papers (Table 3) can be considered classics (h-classic). Table 4 shows the title analysis of the 20 major classic publications. Of these twenty, 17 were research articles and 3 review articles (Table 3). We can see that the most cited article title (Table 4) is Global Data Sets of Vegetation Leaf Area Index (LAI)3g and Fraction of Photosynthetically Active Radiation (FPAR)3g Derived from Global Inventory Modeling and Mapping Studies (GIMMS) Normalized Difference Vegetation Index (NDVI3g) for the Period 1981 to 2011 by Zhu et al., 2013. An analysis of the keywords of top 20 publications titles and keywords (Table 4), established that four articles were on the subject about application of Unmanned Aerial Vehicle (UAV) in remote sensing field, three articles have been written on Normalized Difference Vegetation Index (NDVI3g), and the rest were on Light Detection and Ranging (LiDAR), (3D) Point cloud, airborne laser scanning, terrestrial laser scanning, mangrove ecosystems, agricultures, CO2, tree species classification and random forest etc.
The current h-index does not consider whether the h-index is based on first authorship or nth authorship. In a more nuanced version of the h-index, when an author has an h-index of 25, one can see in how many of those he or she is the first author. For example, if the author is first author in only 5 of the 25 and in the rest he or she is second or third or even lower, it provides a more nuanced view of one’s academic and intellectual contributions. We select 10 random authors (from different remote sensing journals) to analyze the author’s h-index (Table 5), at the time of writing this article (30 October 2018). From Table 5, we can see that the h-index of Zhu, Z.C. is 17. In other words, in all Zhu’s publications, there were 17 publications were cited more than 17 times. In the 17 publications, Zhu published 2 publications as the first author, 0 publication as the second author, 2 publications as the third author and 13 publications as the nth author. Among these 17 publications, Zhu had published 1 publications as the corresponding author. In Table 5 we show, for randomly selected 10 scientists, our nuanced version of h-index which clearly highlights the real academic and intellectual contribution of authors. Some author h-index may look very high, but majority of the articles they maybe not the first or second authors whereas some h-index may look modest, but in majority of the articles, they are either first or second authors (Table 5). We believe that this nuanced approach to determining h-index of authors is powerful indicator of an academician’s productivity and intellectual contribution.
A similar nuanced assessment can be made of each authors total citations. Many times a particular authors citations looks high, but they are often an nth author in a popular paper that has very high citations and as a first or second author they fall way back. This nuanced assessment will provide a true picture of each author’s academic strength as a researcher. Table 6 shows 10 random authors (from different remote sensing journals) to reveal the author’s total citations. Such as Zhu, Z.C. has published 39 publications and the total citations is 1120. As the first author, Zhu had published 7 publications, and the total citations is 471. As the second author, Zhu had published 3 publications, and the total citations is 19. As the third author, Zhu had published 2 publications, and the total citations is 51. As an nth author, Zhu had published 27 publications, and the total citations is 579. Among the 39 publications, Zhu, as the corresponding author, had published one article with 271 citations.

3.4. Most Productive Countries (Territories) and Institutions

By the year 2018, RS OAJ includes publications from 129 countries (territories) and 3826 institutions. Table 7 and Table 8 display the most productive countries (territories) and institutions. As can be seen from Table 7 the most productive country (territories) is China (n = 2012, 36.0%), followed by the United States (n = 1563, 28.1%), Germany (n = 610, 10.9%), Italy (n = 382, 6.8%), France (n = 304, 5.4%) and Spain (n = 301, 5.4%) have published more than 300 of the publications. It also points out that other countries (territories), such as Canada, England, Australia, Netherlands, Japan, Switzerland and Austria are noteworthy contributors to the journal. In Table 7, China has 2012 publications for a total population of 1386 million (2012/1386 = 1.45 publications per million population), while Finland has 128 for a population of only 6 million (128/6 = 21.33 publications per million population). Finland is more productive in terms of papers per 1 million habitants. So we should also pay attention to the relationship between populations and publications.
Table 8 shows the top 50 most prolific institutions. From Table 8, we can see that Chinese Academy of Science (n = 763, 13.65%) is the most productive institution, followed by Wuhan University (n = 352, 6.30%), University of Chinese Academy of Science (n = 337, 6.03%), Beijing Normal University (n = 198, 3.54%), The university of Maryland (n = 151, 2.70%), National Aeronautics and Space Administration (n = 148, 2.65%), National Oceanic and Atmospheric Administration (n=86, 1.54%), China University of Geosciences (n = 85, 1.52%), United States Geological Survey (n=83, 1.49%), German Aerospace Centre (DLR) (n = 79, 1.41%), University of Twente (n = 76, 1.36%) and California Institute of Technology (n = 75, 1.34%). From the average citation per publication of each institution, Finnish Geodetic Institute (38.85, Finland) has the highest average citation frequency. Followed, University of Helsinki (20.25, Finland), Boston University (20.12, USA), United States Forest Service (17.61, USA) and European Commission Joint Research Centre (17.61, Belgium). It can be seen that the average citation per publications published by these institutions is relatively high. Interestingly, 19 of the 50 most productive institutions are in China and 12 of the 50 most productive institutions are in USA. Interestingly, the journal has an office in Beijing and Wuhan. For the reason, geographically speaking, Beijing is the capital of China, and Wuhan is in the central part of China, which can cover most of China. Economically speaking, Beijing and Wuhan are developing very well. The two cities with the fastest economic growth have the highest quality of economic growth. China has a large population base, more researchers may be developed to devote themselves to attaches great importance to remote sensing applications. It also demonstrates China’s growth as a scientific power house. In addition, 12 of the 50 most productive institutions are in the United States, maintaining its role as a leading scientific power and specifically here regarding remote sensing science.

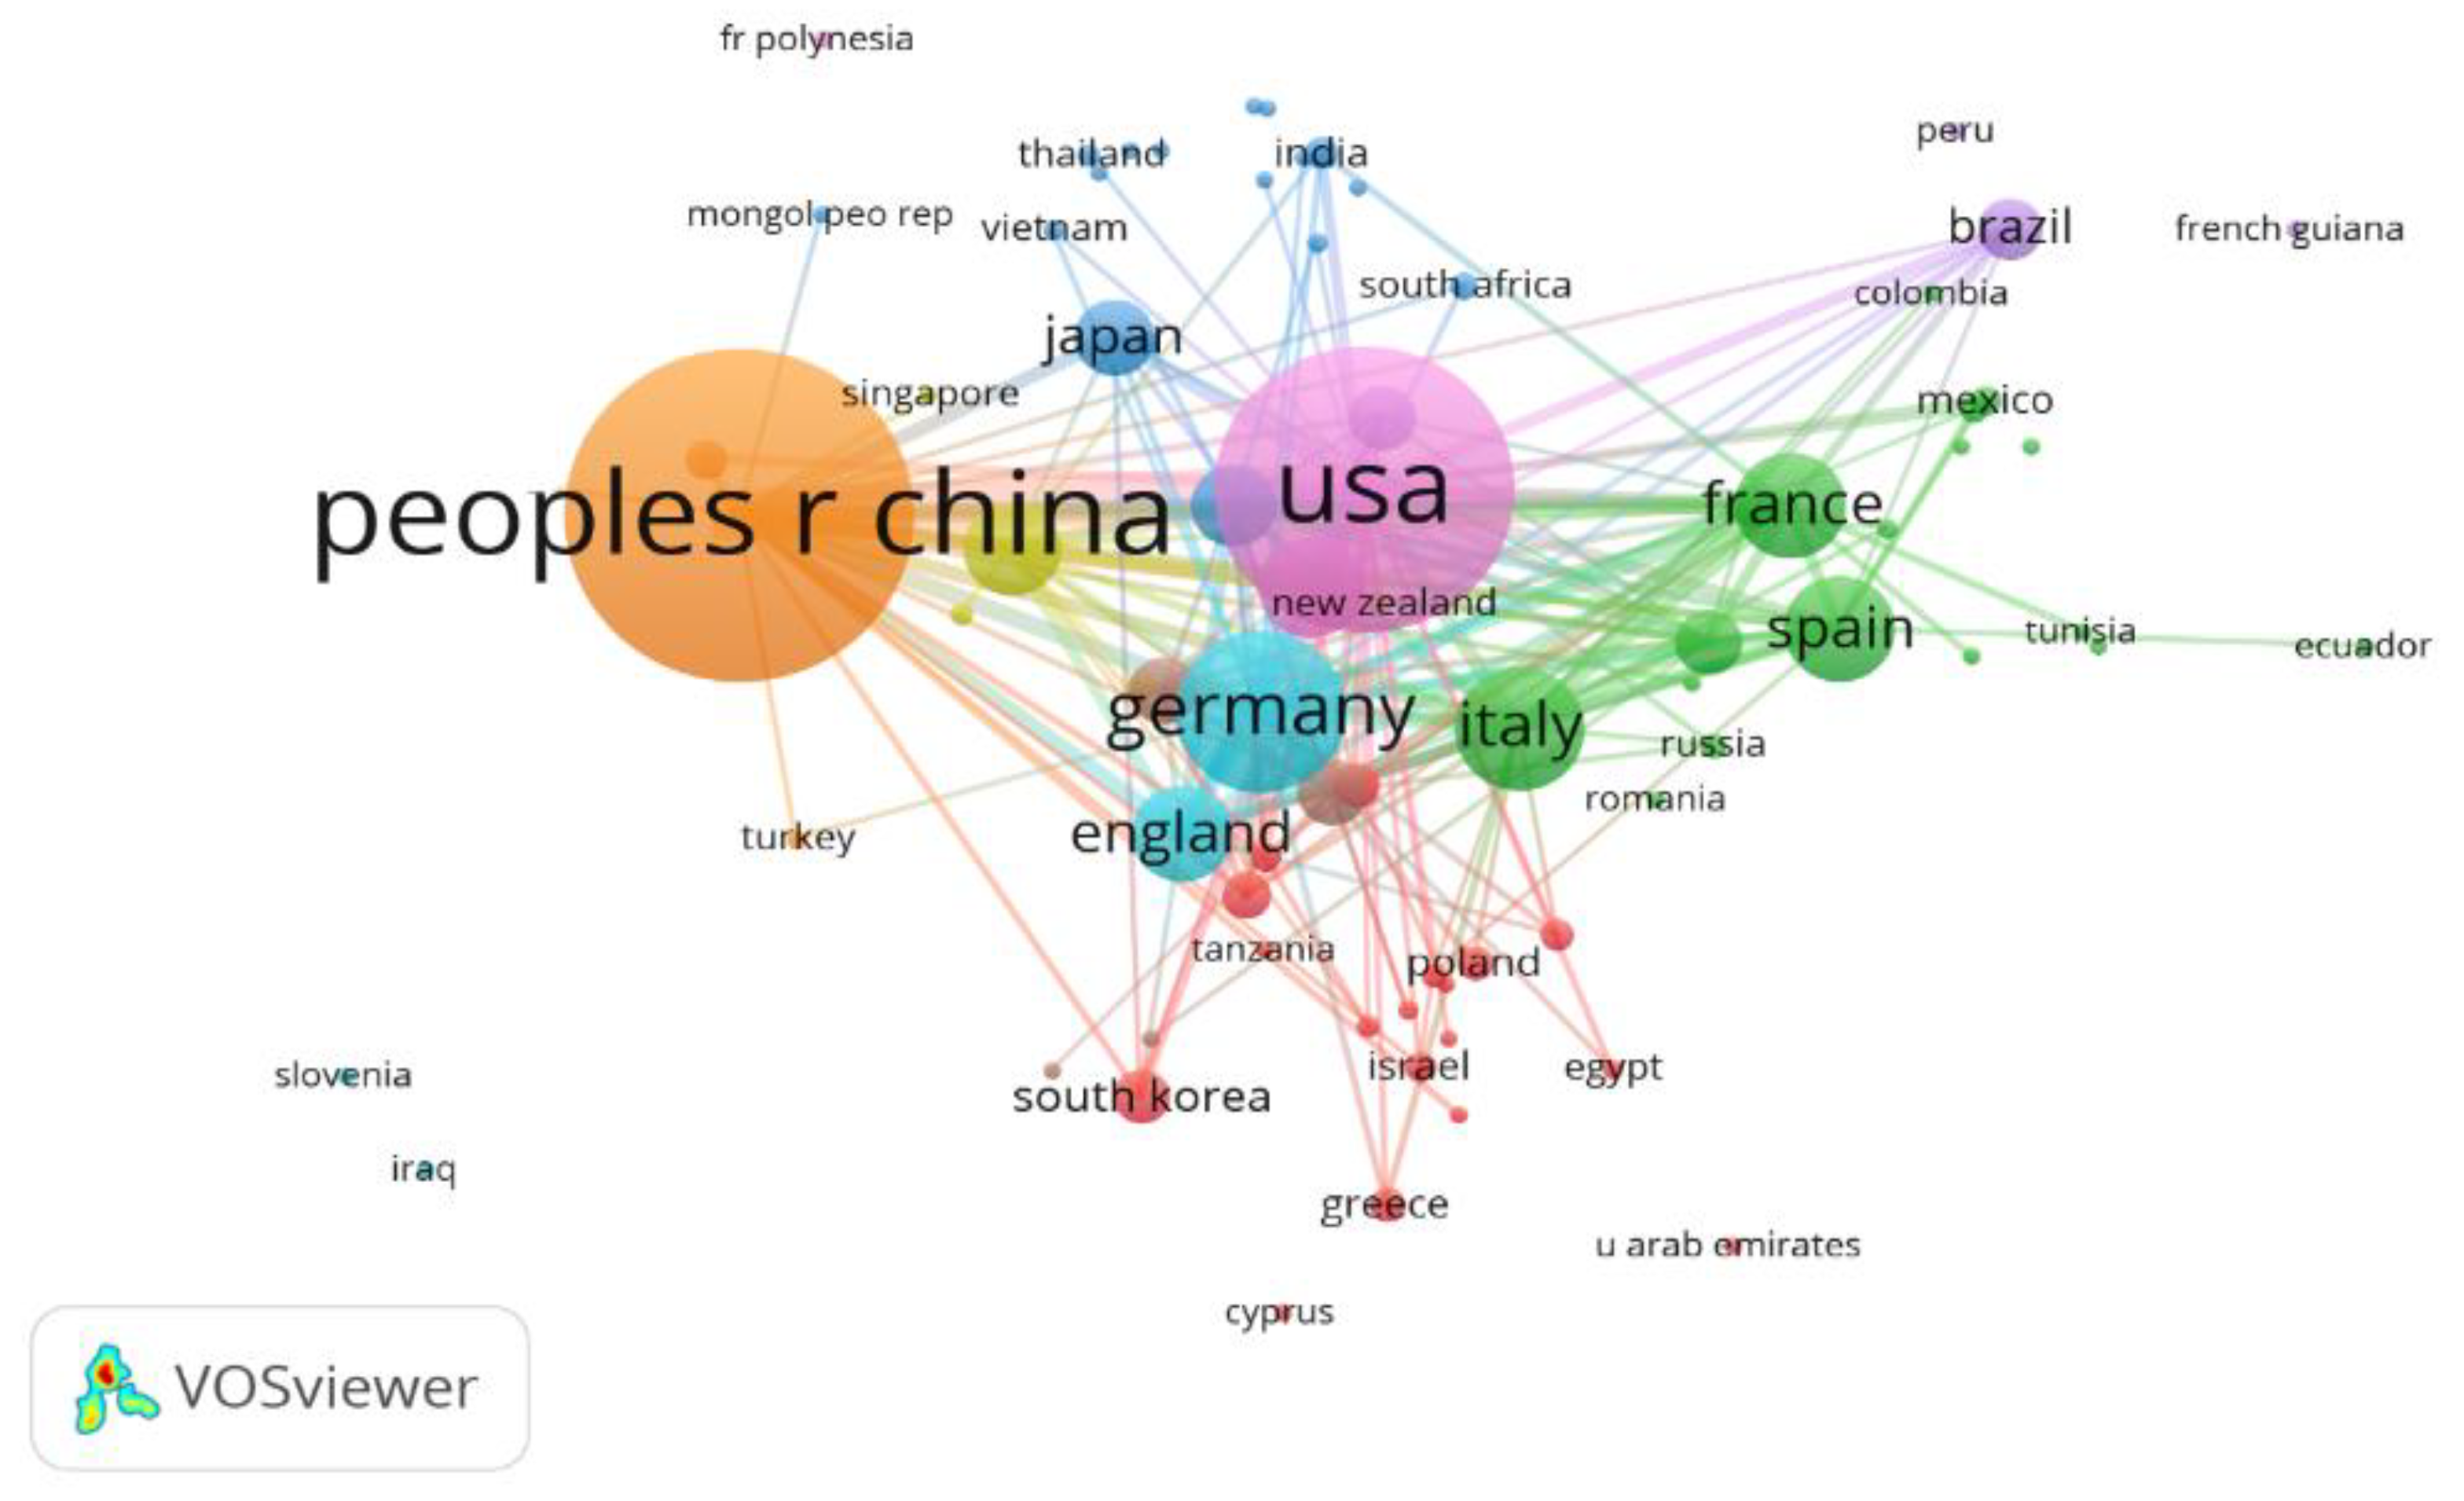
3.5. Number of Publications by a Country and Co-Authorship Collaboration amongst Countries and\or Territories

The network impact diagram (Figure 6) provides two key information with regard to publications in RS OAJ. First, Figure 6 shows the number of publications by country, which is represented by the size of the circle. Second, Figure 6 shows the co-authorship collaboration amongst countries. The size of each circle in Figure 6 represents the amount of publications published by a country in RS OAJ. We set the minimum number of publications of a country as 5. Overall, 78 of the 129 countries that published in RS OAJ met this criterion. The line thickness of each line in Figure 6 shows co-authorship cooperation amongst countries. It is clear to see that the China and USA have cooperated most frequently (from the thickness of the line). The number of publications published by each country (size of the circles) are also largest by these two countries. In Table 9, we can see the number of publications for cooperation among countries and countries. Overall, it can be concluded that: 1. By size or number of publications the 10 leading countries are: China, USA, Germany, Italy, France, Spain, Canada, England, Australia, and Netherlands (Table 6, Figure 6), 2. By co-authorship, most collaborative countries 10 country networks are: China and USA, USA and Germany, USA and Canada, China and France, China and Germany, USA and Australia, USA and England, China and England, China and Australia, and China and Canada.
There is also scientific collaborative clusters (as indicated by color scheme in Figure 6). Some of these clusters (see color scheme; only few countries mentioned here, for rest see Figure 6) are: 1. Greece, Iceland, Norway, South Korea, Tanzania and Poland; 2. Algeria, Belgium, France, Italy, Mexico, Russia and Spain; 3. India, Japan, Sudan, Thailand and Netherlands; 4. Australia, Iran, Malaysia, New Zealand, Singapore; 5. England, Germany, Iraq, Slovenia; 6. China, Taiwan and Turkey are in the same cluster; 7. United States, Canada and Fr Polynesia.

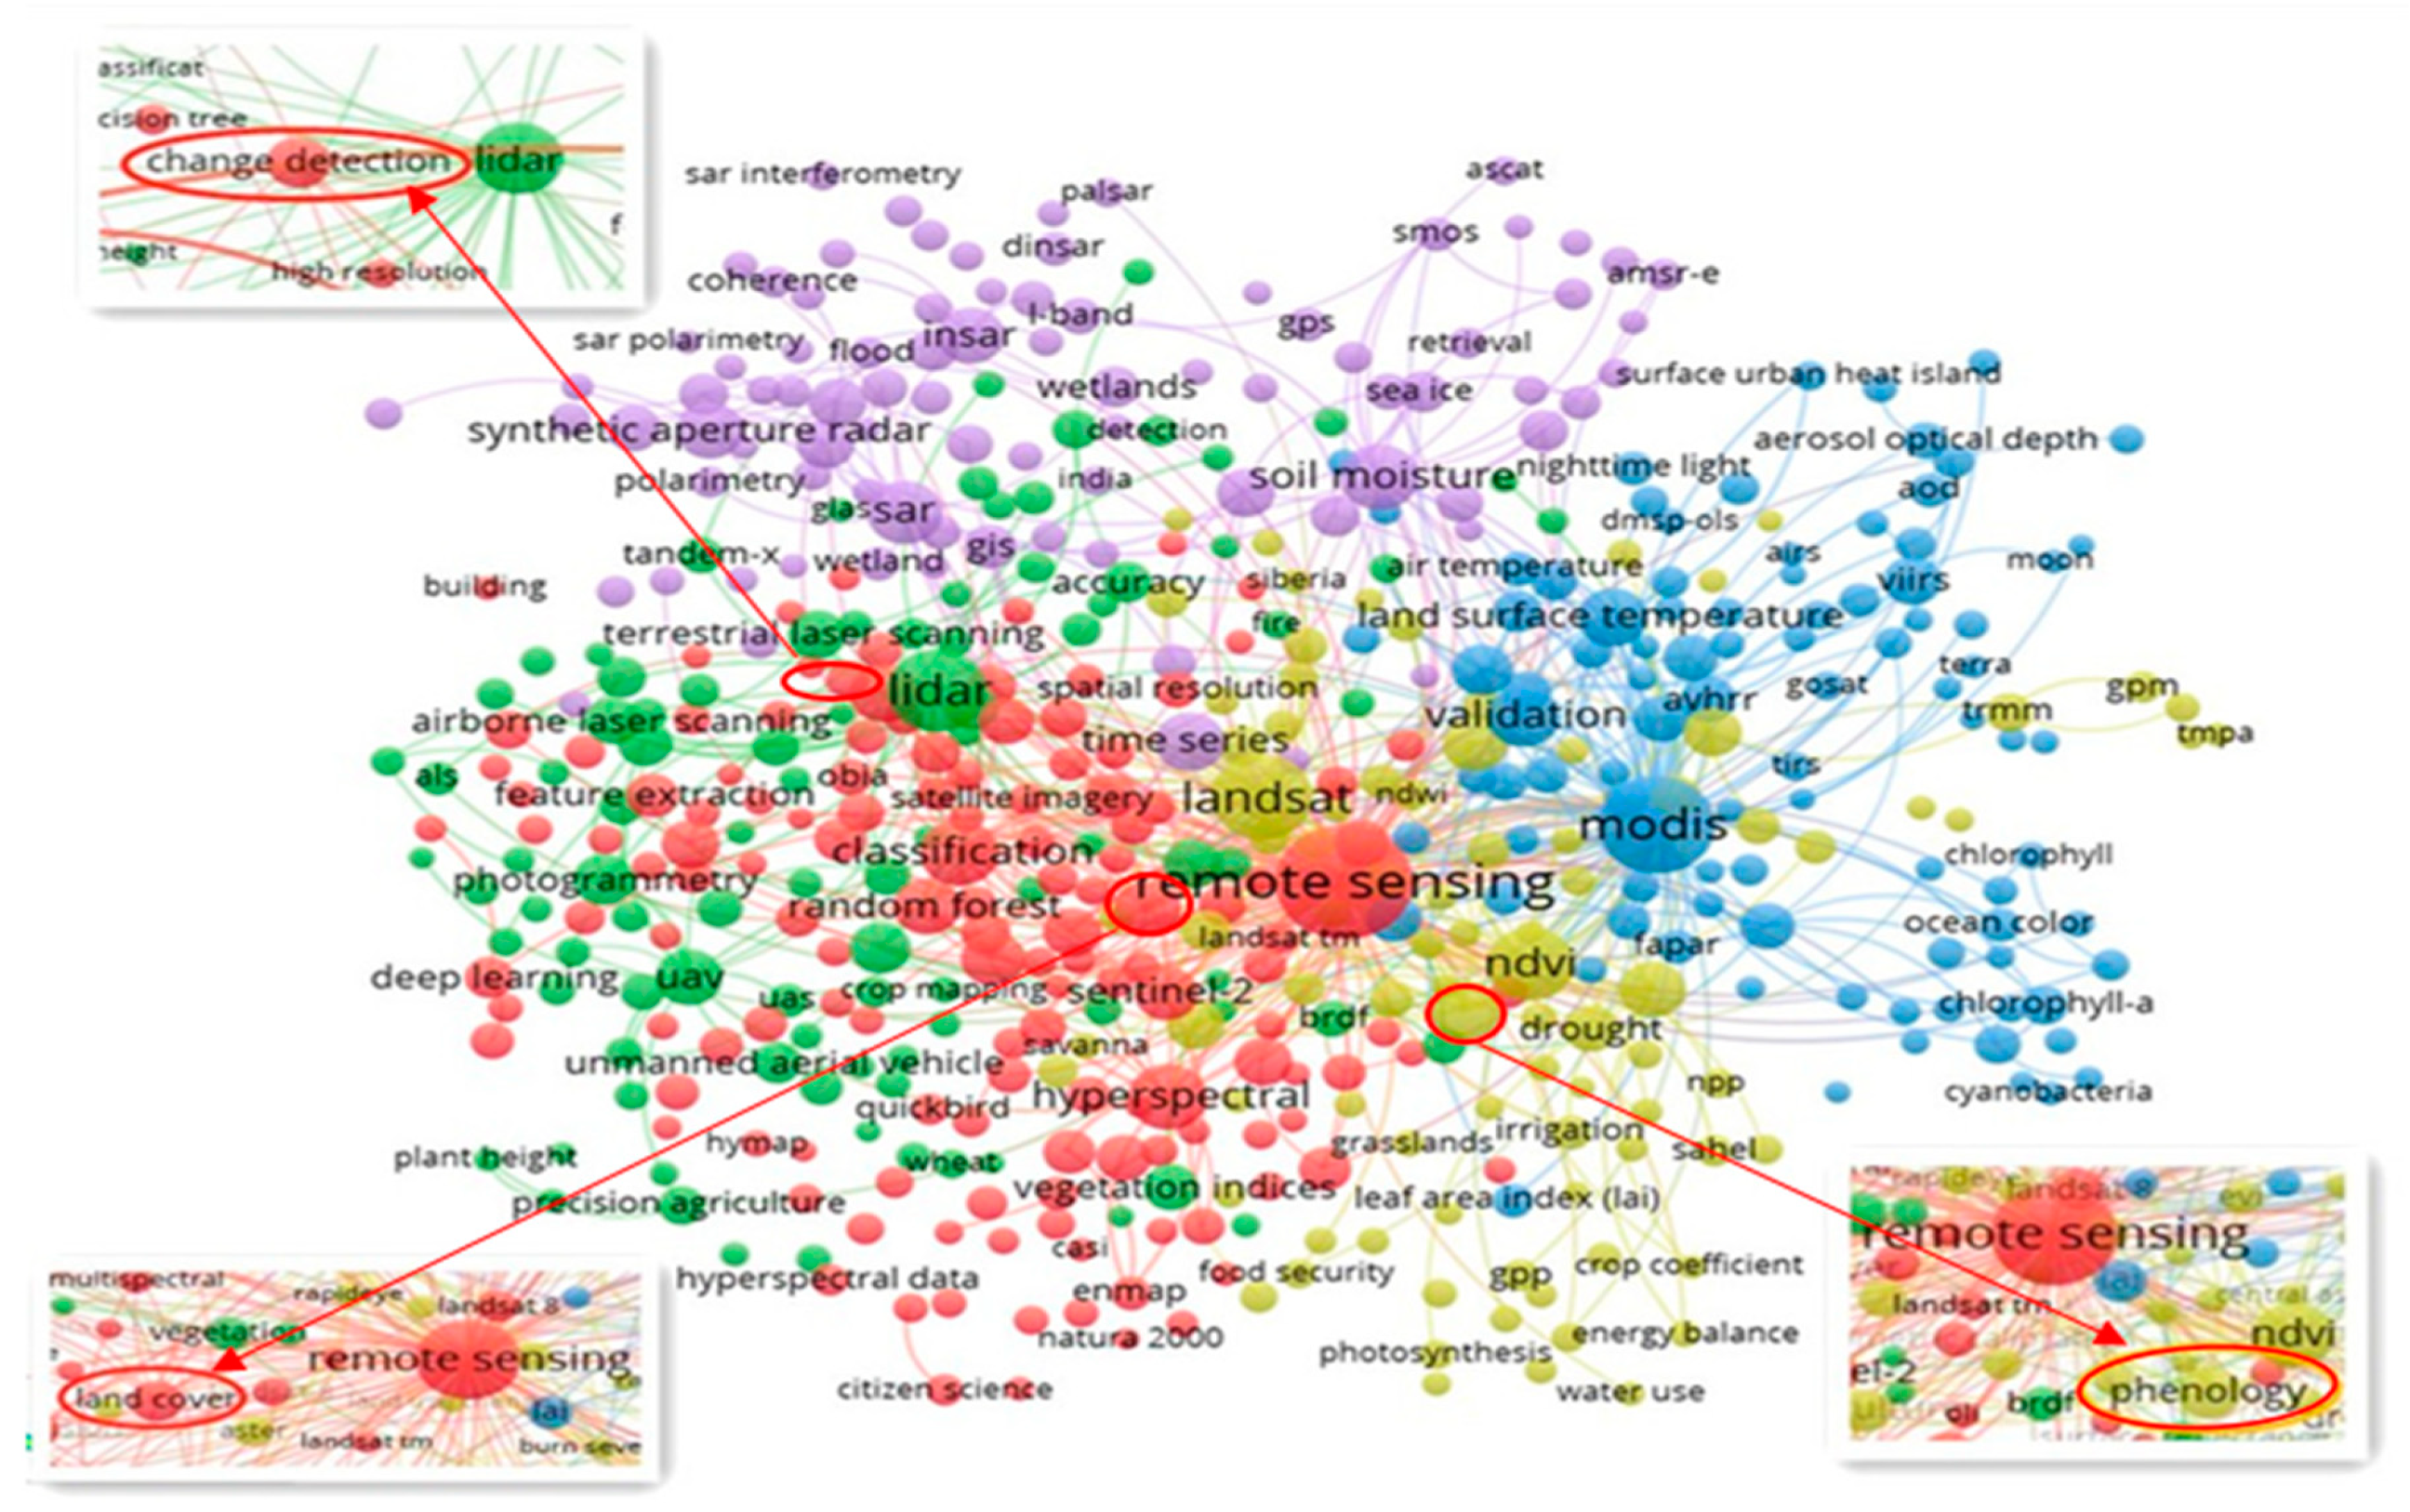
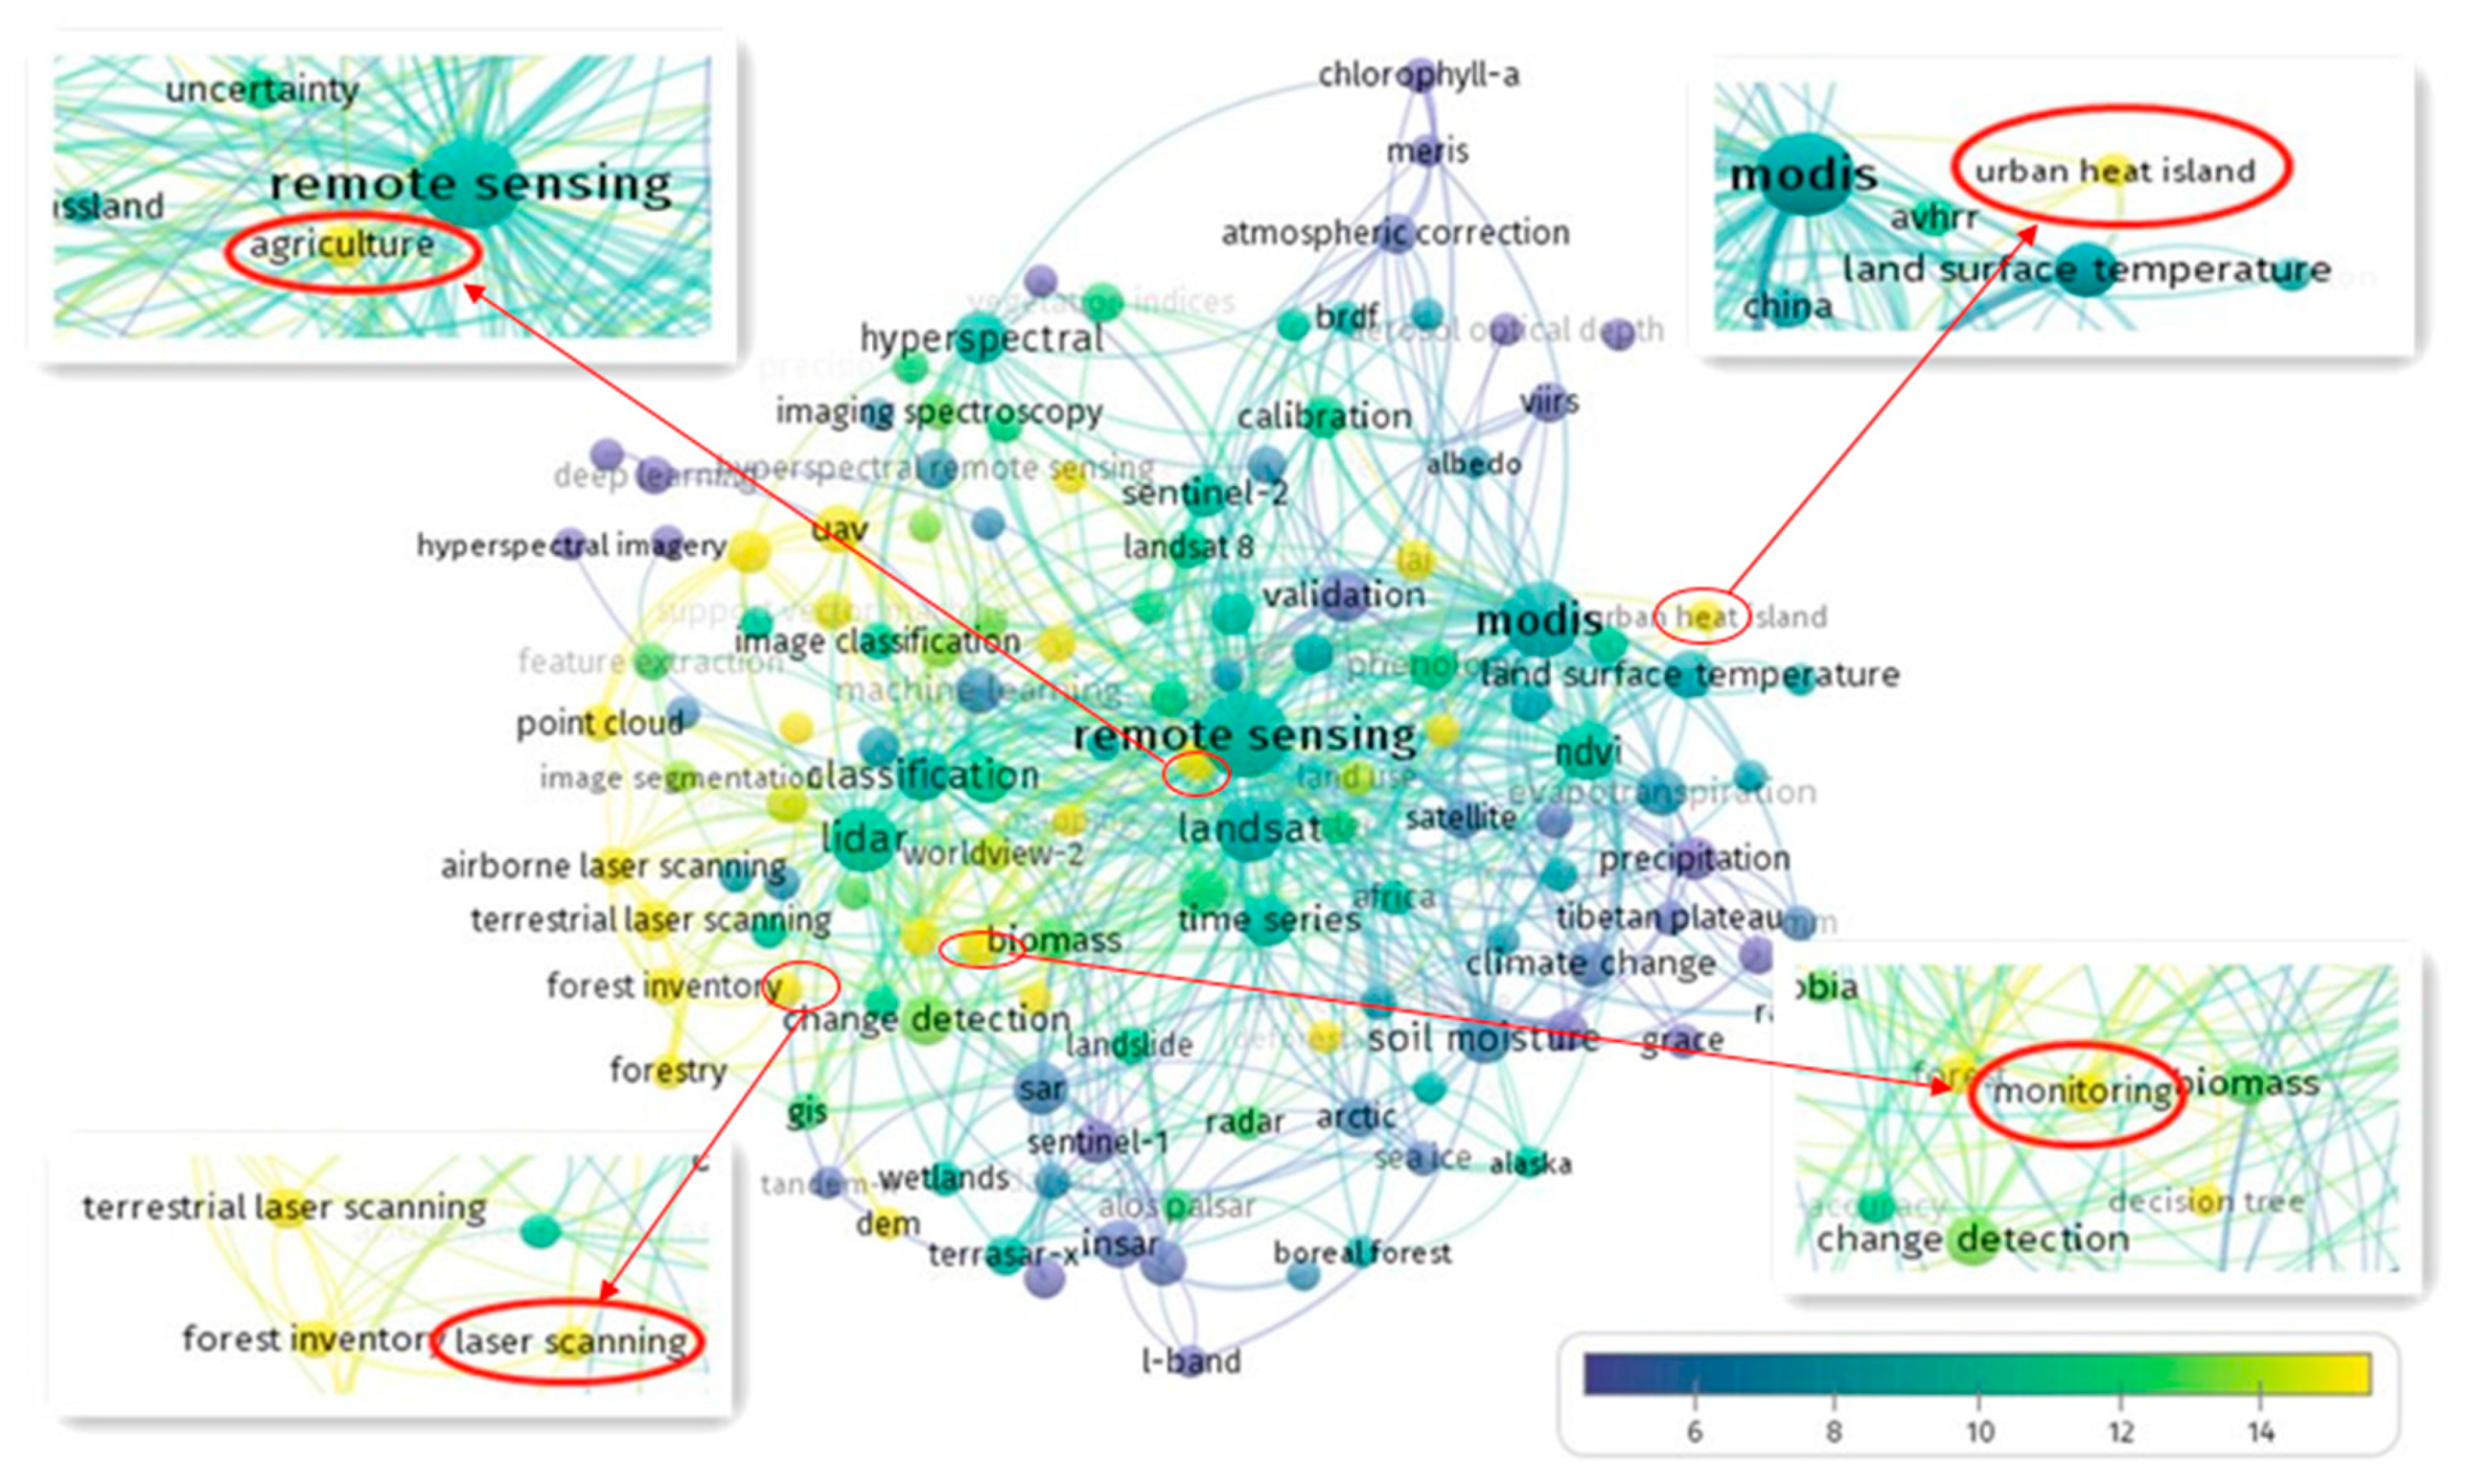
3.6. Remote Sensing Research Theme Analysis

A wide array of remote sensing research themes are published in the Remote Sensing Open Access Journal of MDPI (RS OAJ) (Figure 7). We considered a research theme when it occurred atleast 5 times. There were 814 themes that met this threshold and involved 14,018 keywords. The size of each node in Figure 7 represents the frequency of co-occurrence of research themes as plotted using VOSviewer. As can been seen in Figure 7 the most occurring themes are: Remote Sensing (623 occurrences), Moderate Resolution Imaging Spectroradiometer (MODIS, 382 occurrences), Landsat (255 occurrences), Light Detection and Ranging (LiDAR, 245 occurrences), Normalized Difference Vegetation Index (NDVI, 157 occurrences), Classification (121 occurrences), Hyperspectral (114 occurrences), Soil Moisture (114 occurrences), Synthetic Aperture Radar (SAR, 105 occurrences), Validation (99 occurrences), Time Series (89 occurrences), Change Detection (88 occurrences), Land Surface Temperature (87 occurrences), Phenology (85 occurrences), Land Cover (78 occurrences).
Figure 7 also gives a knowledge map of research topics that fall within a cluster. Broadly, there are 5 clusters (Figure 7). For example, the red cluster has topics like remote sensing, Sentinel-2, hyperspectral, vegetation indices etc. clustering together. Similarly, green cluster has LiDAR, forest inventory, point cloud etc. clustering together. More specifically, the following themes fall into each clusters (see below for a comprehensive list in Table 10).

3.7. Citation Impact of Publications

Citation impact shows the average number of citations that a topic is referenced, as determined by the keywords in the publications. This is plotted in a normalized citation scores from 6 to 14, with a score of 10 (green) being average (Figure 8). This is determined by an in-depth study of the keywords in the publications in RS OAJ that is cited (Figure 8). In Figure 8, topics are represented by frames colored to reflect the average citations scores in publications [69]. The larger the citation impact associated with RS OAJ, the closer the color of the author keywords is to yellow. Conversely, the smaller the citation impact, the closer the color is to blue.
We set the minimum number of occurrences of a keyword was 20, there were 128 themes that met this threshold and involved 14,018 keywords. As depicted in Figure 8, the most cited topics (all in yellow) were: Unmanned Aerial Vehicle (UAV, 27.24 Average citations scores), forestry (23.67 Average citations scores), Normalized Difference Vegetation Index (NDVI, 22.05 Average citations scores), terrestrial laser scanning (20.41 Average citations scores), airborne laser scanning (20.05 Average citations scores), forestry inventory (19.97 Average citations scores), urban heat island (19.85 Average citations scores), monitoring (19.39 Average citations scores), agriculture (18.58 Average citations scores), and laser scanning (18.52 Average citations scores) are the most influential author keywords, i.e., these author keywords have been made a significant contribution to expand the RS OAJ influence. RS OAJ can publish more articles related to most cited keywords (Figure 8), if it wants to expand the influence factor.

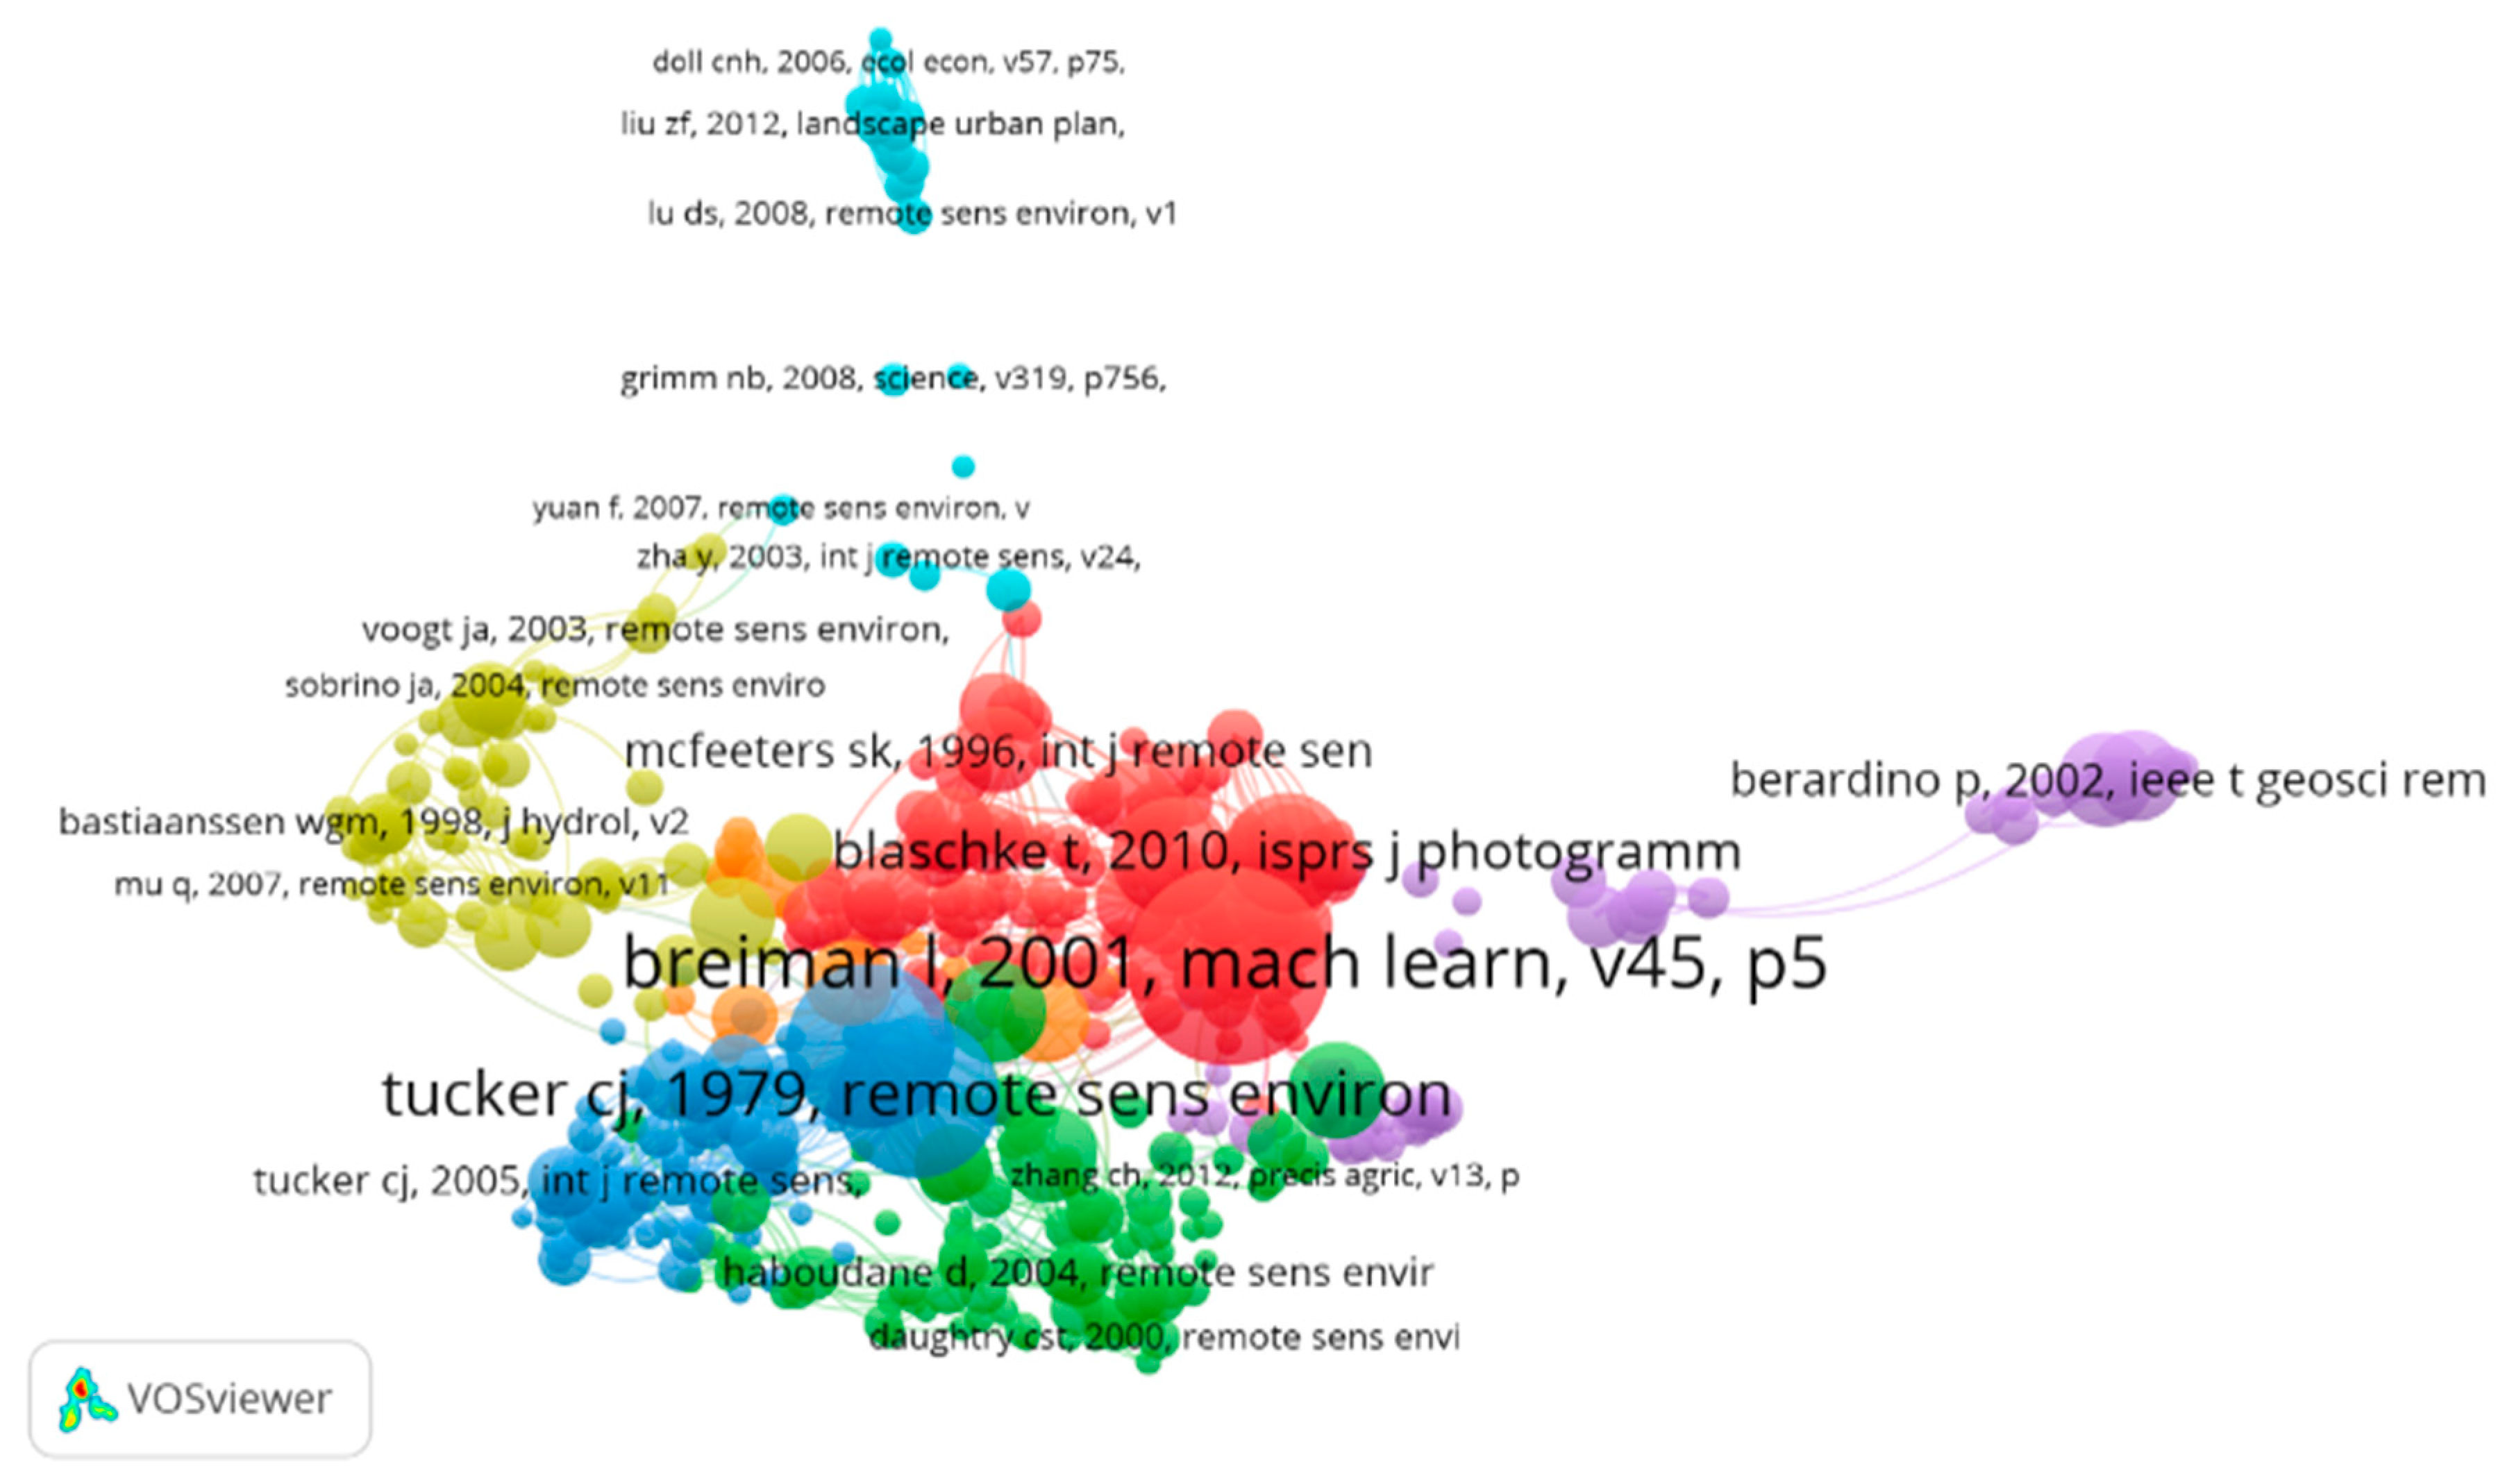
3.8. Intellectual Structure Analysis

The intellectual structure of a journal can be expressed in a network of co-cited references. This article created the co-cited references networks using VOSviewer. We selected articles that had atleast a minimum number of citation of 20 in the Remote Sensing Open Access Journal (RS OAJ). We found a total of 764 cited references (Figure 9) that met minimum of 20 citation criterion out of a total 147,708 cited references. Thereby, Figure 9 shows the panoramic intellectual structure of RS OAJ. The size of the node is proportional to the number of cited references (see 10 most cited in Table 11).
Most cited references in RS OAJ publications from 2009 to 2018 are shown in Table 11. The article of Breiman [70] ranks first which received 294 citations in RS OAJ and has 19,461 citations in Web of Science (Table 11). The article describes how a pixel-based supervised random forests classifier is used to understand data and perform classifications (e.g., Xiong et al., 2018; Teluguntla et al., 2018; Thenkabail et al., 2012) [71,72,73]. This is followed by the article by Huete [74] with 233 citations in RS OAJ, and has 3057 citations in the Web of Science (Table 11). This paper by Huete deals with computing various Moderate Resolution Imaging Spectroradiometer (MODIS) Normalized Difference Vegetation Indices (NDVI’s). The third most cited article in RS OAJ is by Tucker et al. [75] that is a classic paper of computing the normalized difference vegetation index (NDVI) as published in year 1979 (Table 11). This paper has Web of Science citation of 3728. The fourth most cited paper in RS OAJ was by Blaschke [76] published in fourth in the ISPRS Journal of Photogrammetry & Remote Sensing. This paper discusses the object oriented classifications in remote sensing. The fifth most cited paper in RS OAJ is a review paper of classification accuracies by Congalton et al. which was first published in Remote Sensing of Environment in the year 1991. The leading, top 10, topics and papers most cited in RS OAJ in the 2009–2018 time-period are provided in Table 11. The 764 papers that were cited atleast 20 times in RS OAJ during 2009–2018 are shown in Figure 10.

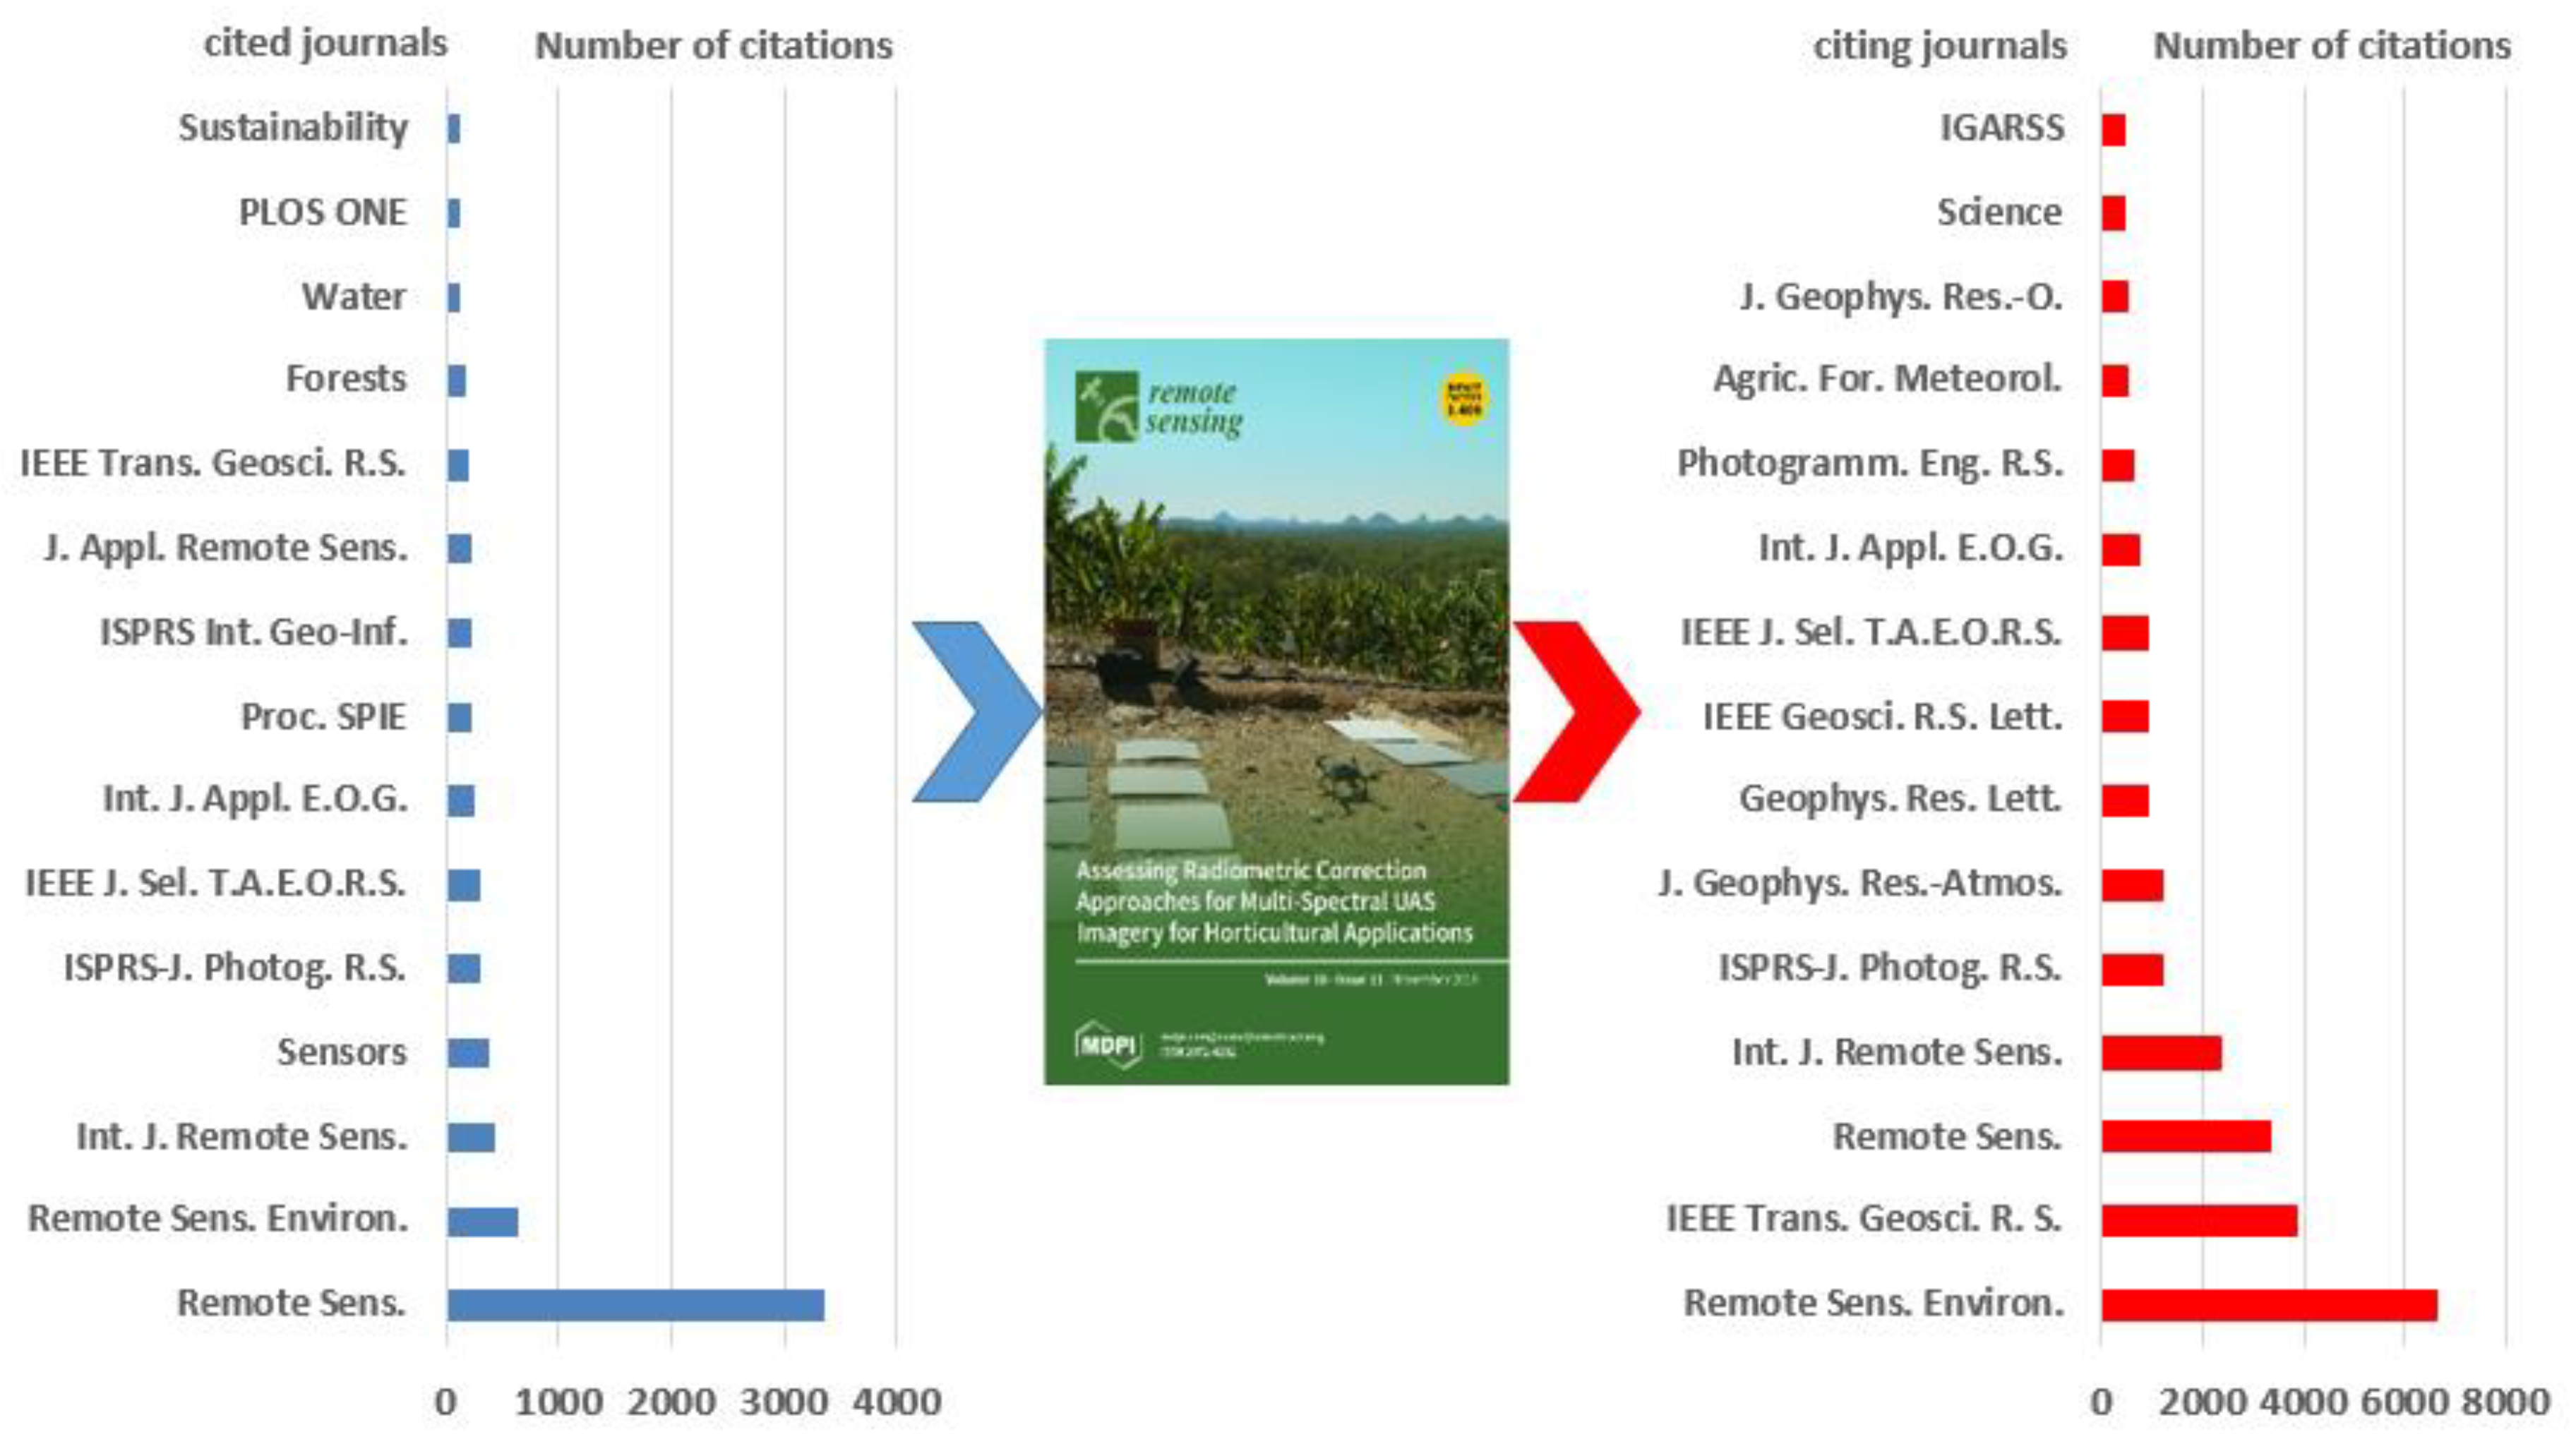
3.9. Knowledge Commutation Analysis: To and from Remote Sensing Open Access Journal (RS OAJ) of MDPI

The knowledge flow to and from RS OAJ is shown in Figure 10. On the left side of Figure 10, the top 15 journals cited by RS OAJ reflect the knowledge that these journals offer to RS OAJ. The main journals cited by RS OAJ are RS OAJ (Remote Sens., 3363 times), Remote Sensing of Environment (Remote Sens. Environ., 634 times), and International Journal of Remote Sensing (Int. J. Remote Sens., 449 times), etc. In Table 12 shows the top 15 journals that are cited in RS OAJ articles frequently. We must stress that Forests, Water, PLOS ONE and Sustainability, appear in the first 15 cited journals. Sustainability journal is cross-disciplinary, which shows the study of remote sensing from the perspective of sustainable development is increasingly concerned by RS OAJ. Forests and Water journals reveal the study of remote sensing from the perspective of ecology. PLOS ONE is a comprehensive journal shows that comprehensive perspective to study remote sensing.
The right side of Figure 10 shows the journals that cite RS OAJ as indexed by the Web of Science database. This reflects the knowledge flow from RS OAJ to other journals. We can see that the top 15 most representative journals are shown in Figure 10 and we also list a table (Table 13) to show the top 15 journals that cite RS OAJ articles frequently.
The RS OAJ articles are most cited by the highest ranked remote sensing journal (Remote Sensing of Environment with an impact factor of 6.457) (Figure 10). Further, all other important Remote Sensing journal cite remote sensing articles in significant number. This is a clear indication of the importance of the RS OAJ published articles. The self-citation rate of RS OAJ is 24.10%. Comparison of various remote sensing journals (Table 14), RS OAJ has relatively high self-citation rate. The RA OAJ articles cite from all major remote sensing journals with highest number (after its self-citation) from Remote Sensing of Environment, the top ranked remote sensing journal. Sevinc (2004) [83] and Fassoulaki (2000) [84] considered the influence of self-citation rate on journals was highly correlated. It is generally believed that the self-citation rate of a mature journal should not be greater than 20%. In conclusion, if the self-citation rate of a journal exceeds 20%, we believe that there may be unreasonable self-citation phenomenon in the journal [85]. As a result, there is a need for the articles published in RS OAJ to slightly increase citation from other best journals and slightly decrease citation from RS OAJ to reduce the self-citation rate.

4. Comparison with Two Best Remote Sensing Journals

The two best, well known, remote sensing journals are Remote Sensing of Environment or RSE (published: 1969–current) and the IEEE Transactions on Geoscience and Remote Sensing (IEEE TGRS) (published: 1980–current) (Previous Title: IEEE Transactions on Geoscience Electronics; published: 1963–1979) It is interesting to compare Remote Sensing Open Access Journal of MDPI (RS OAJ) (published: 2009–current) with these two best remote sensing journals (Table 15). Year 2016 was chosen due to availability of complete data for all three journals obtained from Web of Science. RS OAJ published about 2.3 times number of articles when compared with RSE and about1.8 times that of IEEE TGRS. Overall, RS OAJ has highest number of cites (6248), followed by RSE (5854), and IEEE TGRS (5740). However, the average cites per item is just the reverse: RSE (13.07), IEEE TGRS (10.02), and RS OAJ (6.03) (Table 15). However, RS OAJ has 28 papers with 21 or greater citations compared to 62 papers and 83 papers with citations of 21 or higher in IEEE TGRS and RSE respectively (Table 9). Also, RS OAJ has 136 papers with 11–20 citations compared to 92 papers and 114 papers with citations of 10–21 in IEEE TGRS and RSE respectively (Table 15). On the low end, about 7% of the papers published in RS OAJ do not have any citations. In comparison those percentages for IEEE TGRS and RSE were about 5.0% and 2.5% respectively (Table 15). Also, about 22% of the papers published in RS OAJ have just 1–2 citations. In comparison those percentages for IEEE TGRS and RSE were about 19% and 8% respectively (Table 15). So, it is clear that if RS OAJ can eliminate publishing a good percentage of likely low cited articles in comping years, its impact factor can swiftly rise. However, RS OAJ philosophy is also to publish all good papers that have value, and technically sound but may not be cited frequently due to various reasons.
We also made detailed statistics on the citations of three journals from 2010 to 2017. In Table 16, the median citation number for RSE for 2010 is 42 (95%: 186), for RS OAJ the median is 15 (95%: 92), for IEEE TGRS the median is 23 (95%: 112). RSE had in 2010 a total number of 244 publications. We found the following 95% percentile: 186 citations and the following median (50% percentile): 42 citations. IEEE TGRS had in 2010 a total number of 383 publications. We calculated the following 95% percentile: 112 citations and the following median: 23 citations. RS OAJ had in 2010 a total number of 143 publications. We calculated the following 95% percentile: 92 citations and the following median: 15 citations. We also calculated the number of articles with citations less than 3 that found the percentage of citations less than 3 in each year from 2010 to 2013 was about 5, and the percentage increased in 2014–2017. This is a good indication that there are too many papers that don’t get (or little) attention. The possible reason is that it takes some time to quote, and the other reason is that these articles are of “poor” quality. In order to become Top 1 journal, RS OAJ would need to significantly reduce the number of “poor” papers in the future.

5. Discussion

In 2018, RS OAJ will celebrate its 10th anniversary. Motivated by this event, this article proposes a bibliometric and visualization methods to analyze the main trends of RS OAJ from 2009 to 2018 (years in which it is published). On the basis of the indicators put forward by Cancino (2017) [16], Tang (2018) [19], Voner (2016) [86] and Merigó (2018) [87], our article analyzes a wide array of different type of bibliometric indicators, including dynamics and trends of publications, journal impact factor, total cites, eigenfactor score, normalized eigenfactor, CiteScore, h-index, h-classic publications, most productive countries (territories) and institutions, co-authorship collaboration about countries (territories), research themes, citation impact of co-occurrences keywords, intellectual structure and knowledge commutation, which are reveal the bibliometric characteristics of the journal [88].
Our article shows that the number of publications published in RS OAJ has been increasing. The highest number of published publications was in 2017 (1336 publications), 298 publications more than in 2016 (1038 publications). By analyzing the trend of citations per publication, the annual citation trend of publications is stable from 2009 to 2012 with an average citation rate of 26 per publication. However, we can see that from 2013 to 2018, the average number of citations per publication has annually decreased. The possible reason is the number of publications published in recent years (2013–2018), as it takes time to cite them. At the same time, editors and reviewers should continue to strictly review the procedures so that improve quality of RS OAJ. Based on 2016 data, about 7% of the papers published in RS OAJ do not have any citations. In comparison those percentages for IEEE TGRS and RSE were 5.0% and 2.5% respectively. Also, about 22% of the papers published in RS OAJ have just 1–2 citations. In comparison percentages of 1–2 citations for articles published in IEEE TGRS and RSE were about 19% and 8% respectively. This shows that if RS OAJ can reduce a certain articles types of articles that are not likely to be cited, its impact factor can increase dramatically. However, this is a tradeoff between publishing some good articles that may lack novelty and hence less likely to be quoted, versus publishing them for certain value they offer (e.g., a drought study conducted in another region using a well-known method). Impact factor were proposed by Garfield and Sher (1963) [89], and was used to rank and evaluate journals (Garfield, 1996) [90]. We can see that RS OAJ has an impressive journal impact factor of 3.4060 for the year 2017. During 2017, a total of 13,600 times the articles published in RS OAJ are cited in the journals included in the Journal Citation Reports (JCR). The eigenfactor score of 0.0342 and normalized eigenfactor score of 3.9902. For the year 2017, the CiteScore for RS OAJ is 4.03.
Through analyzing h-index, RS OAJ has an h-index of 67 from 2009–2018. Considering h-classic publications, the most cited article title is Global Data Sets of Vegetation Leaf Area Index (LAI)3g and Fraction of Photosynthetically Active Radiation (FPAR)3g Derived from Global Inventory Modeling and Mapping Studies (GIMMS) Normalized Difference Vegetation Index (NDVI3g) for the Period 1981 to 2011. China and the United States have cooperated most frequently, probably the number of publications published are largest in both countries. The most productive country is China (2012 publications) but there are few publications from China are highly cited as shown in Table 3. Thus, Chinese scholars should pay more attention to improve the quality of publications rather than the quantity in future research. By analyzing most productive institutions, we find that the first four prolific institutions are located in China. Through further analysis, compared to other journals that belongs to remote sensing. Such as, Remote Sensing of Environment (United States, 3804 publications; France, 778 publications), IEEE Journal of Selected Topics in Applied Earth Observations and Remote Sensing (China, 2031 publications; United States, 741 publications), Journal of Applied Remote Sensing (China, 1462 publications; United States, 561 publications) and ISPRS Journal of Photogrammetry and Remote Sensing (China, 428 publications; United States, 375 publications). This indicate China and the United States are the two countries that have published the most publications on remote sensing. In the high-frequency author keywords analysis, the major co-occurrences author keywords are remote sensing, MODIS, Landsat, LiDAR, NDVI, classification, hyperspectral, soil moisture, SAR and validation. For further study, we cluster analysis the author’s keywords and get 5 research themes: Multi-spectral and hyperspectral remote sensing, LiDAR scanning and forestry remote sensing monitoring, MODIS and LAI data applications, Remote sensing applications and Synthetic Aperture Radar (SAR).
Through author keywords citation impact analysis, the most influential keyword is Unmanned Aerial Vehicle (UAV), this indicate the publications about Unmanned Aerial Vehicle (UAV) attract more citations than other keywords in RS OAJ. Followed, forestry, Normalized Difference Vegetation Index (NDVI), terrestrial laser scanning, airborne laser scanning, forestry inventory, urban heat island, monitoring, agriculture, and laser scanning. By analyzing the intellectual structure of RS OAJ, we identify the main reference publications and find that the themes are about Random Forests, MODIS vegetation indices, image analysis, remotely sensed data, Soil-Adjusted Vegetation Index (SAVI) and SAR interferometry etc. RS OAJ ranks first in cited journals and third in citing, this indicates that RS OAJ has the internal knowledge flow. This is called the self-citation of the journal and the self-citation rate of RS OAJ is 24.10%. Brown considered it is a common phenomenon for a journal to cite itself [91].

Limitations

Some of the limitations of this article deserve to be noted. First, due to the bibliometric method, we mainly use frequencies plotted in charts to show the status of RS OAJ, This is because the frequency is the most commonly index in the bibliometric methods. Charts intuitively display the statistical information (time, quantity, etc.), and it is a very good method to vividly show information. However, this may lead us to neglect some valuable information. Such as centrality, degree centrality, and effective scale. So such indicators are worth pursuing in future research. Second, we analyzed the indicators (including dynamics and trends of publications, journal impact factor, total cites, eigenfactor score, normalized eigenfactor, CiteScore, h-index, h-classic publications, most productive countries (territories) and institutions, co-authorship collaboration about countries (territories), research themes, citation impact of co-occurrences keywords, intellectual structure and knowledge commutation). However, we did not analyze the correlation between the indicators, which may be worth looking at in future.

6. Conclusions

This paper presents a comprehensive bibliometric profile of the Remote Sensing Open Access Journal (RS OAJ) based on its publication years (2009–2018). During these 10 years, there has been an exponential growth in the number of articles published, going from around 100 articles in 2009 and 2010 to 1336 articles in 2017 and reaching about the same in 2018. During 2009–2018, there were 129 countries and 3826 institutions that published 5588 articles. The leading nations contributing articles, based on 2009–2018 data, were (based on ranking): China, United States, Germany, Italy, France, Spain, Canada, England, Australia, Netherlands, Japan, Switzerland and Austria. The leading institutions, also for the same period and listed based on ranking, were: Chinese Academy of Sciences, Wuhan University, University of Chinese Academy of Sciences, Beijing Normal University, The university of Maryland, National Aeronautics and Space Administration, National Oceanic and Atmospheric Administration, China University of Geosciences, United States Geological Survey, German Aerospace Centre, University of Twente, and California Institute of Technology.
The h-index of RS OAJ based on data from 2010 to 2017 (data of full years of publication) was 67. For the same period, there were two remote sensing journals with higher h-index: Remote Sensing of Environment with (h-index = 112), and IEEE Transactions on Geoscience and Remote Sensing (h-index = 101). For 2017, the latest year for which impact data are available, the RS OAJ had journal impact factor of 3.4060, and a CiteScore of 4.03. Further, RS OAJ had eigenfactor score of 0.0342 for the year 2017, which was next only to Remote Sensing of Environment or RSE (0.0529), and IEEE Transaction of Geoscience and Remote Sensing (0.0434) amongst the best remote sensing journals. This shows that RS OAJ has excellent record of its articles being cited in other high ranked journals. The normalized eigenfactor score of 3.99 for RS OAJ during the year 2017, means that the journal is 3.99 times more influential as the average journal in the Journal Citation Report (JCR). There were a total of 12,327 journals in JCR during 2017. Also, for the year 2017, the CiteScore for RS OAJ was 4.03. CiteScore calculates the average number of citations received in a calendar year by all items published in that journal in the preceding three years.
Other comparisons were also made to gauge impact based on recent years’ data. The 2016 data showed, RS OAJ published about 2.3 times number of articles when compared with RSE and about 1.8 times that of IEEE TGRS, the two leading international remote sensing journals. Overall, RS OAJ has highest number of cites (6248), followed by RSE (5854), and IEEE TGRS (5740). However, the average cites per article is just the reverse: RSE (13.07), IEEE TGRS (10.02), and RS OAJ (6.03). The trends are about the same for 2017. During 2009–2018, there were 814 keyword themes that occurred 5 or more times in the published articles. The paper established these topics as well as the most frequently occurring topics that were published in RS OAJ. The paper also shows the knowledge flow into and from RS OAJ to other journals and proposes a nuanced h-index (nh-index) to measure productivity and intellectual contribution of authors by considering h-index based on whether the one is first, second, third, or nth author.

Author Contributions

Conceptualization, P.S.T.; Formal analysis, P.W.; Visualization, P.W.; Writing—original draft, Y.Z. and P.S.T.; Writing—review & editing, Y.Z. and P.S.T.

Funding

This research received no external funding.

Conflicts of Interest

The authors declare no conflict of interest.

References

  1. Laliberte, A.S.; Goforth, M.A.; Steele, C.M.; Rango, A. Multispectral remote sensing from unmanned aircraft: Image processing workflows and applications for rangeland environments. Remote Sens. 2011, 3, 2529–2551. [Google Scholar] [CrossRef]
  2. Suomalainen, J.; Anders, N.; Iqbal, S.; Roerink, G.; Franke, J.; Wenting, P.; Hünniger, D.; Bartholomeus, H.; Becker, R.; Kooistra, L. A lightweight hyperspectral mapping system and photogrammetric processing chain for unmanned aerial vehicles. Remote Sens. 2014, 6, 11013–11030. [Google Scholar] [CrossRef]
  3. Yavuz, M.E.; Teixeira, F.L. Ultrawideband microwave sensing and imaging using time-reversal techniques: A review. Remote Sens. 2009, 1, 466–495. [Google Scholar] [CrossRef]
  4. Gao, F.; Kustas, W.P.; Anderson, M.C. A data mining approach for sharpening thermal satellite imagery over land. Remote Sens. 2012, 4, 3287–3319. [Google Scholar] [CrossRef]
  5. Colgan, M.S.; Baldeck, C.A.; Féret, J.-B.; Asner, G.P. Mapping Savanna tree species at ecosystem scales using support vector machine classification and BRDF correction on airborne hyperspectral and LiDAR data. Remote Sens. 2012, 4, 3462–3480. [Google Scholar] [CrossRef]
  6. Joshi, N.; Baumann, M.; Ehammer, A.; Fensholt, R.; Grogan, K.; Hostert, P.; Jepsen, M.R.; Kuemmerle, T.; Meyfroidt, P.; Mitchard, E.T.A.; et al. A review of the application of optical and radar remote sensing data fusion to land use mapping and monitoring. Remote Sens. 2016, 8, 70. [Google Scholar] [CrossRef]
  7. Hasan, R.C.; Ierodiaconou, D.; Monk, J. Evaluation of four supervised learning methods for Benthic habitat mapping using backscatter from multi-beam sonar. Remote Sens. 2012, 4, 3427–3443. [Google Scholar] [CrossRef]
  8. Zwieback, S.; Paulik, C.; Wagner, W. Frozen soil detection based on advanced scatterometer observations and air temperature data as part of soil moisture retrieval. Remote Sens. 2015, 7, 3206–3231. [Google Scholar] [CrossRef]
  9. Bosch, W.; Dettmering, D.; Schwatke, C. Multi-mission cross-calibration of satellite altimeters: Constructing a long-term data record for global and regional sea level change studies. Remote Sens. 2014, 6, 2255–2281. [Google Scholar] [CrossRef]
  10. Meyer, R.; Winer, R.S. Introduction to the JMR 50th anniversary special section. J. Mark. Res. 2014, 51, 83. [Google Scholar] [CrossRef]
  11. Schwert, G.W. The journal of financial economics: A retrospective evaluation (1974–1991). J. Financ. Econ. 1993, 33, 369–424. [Google Scholar] [CrossRef]
  12. Heck, J.L.; Bremser, W.G. Six decades of the accounting review: A summary of author and institutional contributors. Account. Rev. 1986, 61, 735–744. [Google Scholar]
  13. Shugan, S.M. Editorial: Fifty years of marketing science. Mark. Sci. 2006, 25, 551–555. [Google Scholar] [CrossRef]
  14. Van Fleet, D.D.; Ray, D.F.; Hunt, J.G.; Vecchio, R.P.; Bedeian, A.G.; Griffin, R.W.; Kacmar, K.M.; Downey, H.K.; Dalton, D.; Feldman, D.C. The journal of management’s first 30 years. J. Manag. 2006, 32, 477–506. [Google Scholar] [CrossRef]
  15. Merigó, J.M.; Mas-Tur, A.; Roig-Tierno, N.; Ribeiro-Soriano, D. A bibliometric overview of the journal of business research between 1973 and 2014. J. Bus. Res. 2015, 68, 2645–2653. [Google Scholar] [CrossRef]
  16. Cancino, C.A.; Merigó, J.M.; Coronado, F.; Dessouky, Y.; Dessouky, M. Forty years of computers and industrial engineering: A bibliometric analysis. Comput. Ind. Eng. 2017, 113, 614–629. [Google Scholar] [CrossRef]
  17. Merigó, J.M.; Blanco-Mesa, F.; Gil-Lafuente, A.M.; Yager, R.R. Thirty years of the international journal of intelligent systems: A bibliometric review. Int. J. Intell. Syst. 2017, 32, 526–554. [Google Scholar] [CrossRef]
  18. Valenzuela, L.; Merigó, J.M.; Johnston, W.J.; Nicolás, C.; Jaramillo, J.F. Thirty years of the journal of business and industrial marketing: A bibliometric analysis. J. Bus. Ind. Mark. 2017, 32, 1–18. [Google Scholar] [CrossRef]
  19. Tang, M.; Liao, H.C.; Wan, Z.J.; Herrera-Viedma, E.; Rosen, M.A. Ten years of sustainability (2009 to 2018): A bibliometric overview. Sustainability 2018, 10, 1655. [Google Scholar] [CrossRef]
  20. Hirsch, J.E. An index to quantify an individual’s scientific research output. Proc. Natl. Acad. Sci. USA 2005, 102, 16569–16572. [Google Scholar] [CrossRef]
  21. Butler, L.; Mcallister, I. Evaluating university research performance using metrics. Eur. Polit. Sci. 2011, 10, 44–58. [Google Scholar] [CrossRef]
  22. Costas, R.; Bordons, M. The H-index: Advantages, limitations and its relation with other bibliometric indicators at the micro level. J. Informetr. 2007, 1, 193–203. [Google Scholar] [CrossRef]
  23. Bornmann, L.; Daniel, H.D. Does the H-index for ranking of scientists really work? Scientometrics 2005, 65, 391–392. [Google Scholar] [CrossRef]
  24. Braun, T.; Schubert, A. A quantitative view on the coming of age of interdisciplinarity in the sciences 1980–1999. Scientometrics 2003, 58, 183–189. [Google Scholar] [CrossRef]
  25. Garfield, E. Citation analysis as a tool in journal evaluation. Science 1972, 178, 471–479. [Google Scholar] [CrossRef] [PubMed]
  26. Broadus, R.N. Toward a definition of “Bibliometrics”. Scientometrics 1987, 12, 373–379. [Google Scholar] [CrossRef]
  27. Alonso, S.; Cabrerizo, F.J.; Herrera-Viedma, E.; Herrera, F. H-index: A review focused on its variants, computation and standardization for different scientific fields. J. Informetr. 2009, 3, 273–289. [Google Scholar] [CrossRef]
  28. Franceschini, F.; Maisano, D.A. The hirsch index in manufacturing and quality engineering. Qual. Reliab. Eng. Int. 2010, 25, 987–995. [Google Scholar] [CrossRef]
  29. Small, H. Co-citation context analysis and the structure of paradigms. J. Doc. 1980, 36, 183–196. [Google Scholar] [CrossRef]
  30. Small, H. The relationship of information science to the social sciences: A co-citation analysis. Inf. Process. Manag. 1981, 17, 39–50. [Google Scholar] [CrossRef]
  31. Small, H. Tracking and predicting growth areas in science. Scientometrics 2006, 68, 595–610. [Google Scholar] [CrossRef]
  32. Boyack, K.W.; Klavans, R. Co-citation analysis, bibliographic coupling, and direct citation: Which citation approach represents the research front most accurately? J. Am. Soc. Inf. Sci. Technol. 2014, 61, 2389–2404. [Google Scholar] [CrossRef]
  33. White, H.D.; Griffith, B.C. Author co-citation: A literature measure of intellectual structure. J. Am. Soc. Inf. Sci. Technol. 2014, 32, 163–171. [Google Scholar] [CrossRef]
  34. Nerur, S.P.; Rasheed, A.A.; Natarajan, V. The intellectual structure of the strategic management field: An author co-citation analysis. Strateg. Manag. J. 2010, 29, 319–336. [Google Scholar] [CrossRef]
  35. Chen, C.M.; Ibekwe-SanJuan, F.; Hou, J.H. The structure and dynamics of co-citation clusters: A multiple-perspective co-citation analysis. J. Am. Soc. Inf. Sci. Technol. 2010, 61, 1386–1409. [Google Scholar] [CrossRef]
  36. Garfield, E. Journal impact factor: A brief review. Can. Med. Assoc. J. 1999, 161, 979–980. [Google Scholar]
  37. Garfield, E. The history and meaning of the journal impact factor. Jama 2006, 295, 90–93. [Google Scholar] [CrossRef]
  38. Total Cites. Available online: http://ipscience-help.thomsonreuters.com/incitesLiveJCR/glossaryAZgroup/g13/7411-TRS.html (accessed on 5 October 2018).
  39. Fersht, A. The most influential journals: Impact factor and eigenfactor. Proc. Natl. Acad. Sci. USA 2009, 106, 6883–6884. [Google Scholar] [CrossRef]
  40. Bergstrom, C.T.; West, J.D.; Wiseman, M.A. The eigenfactor metrics. J. Neurosci. 2008, 28, 11433–11434. [Google Scholar] [CrossRef]
  41. Gu, H. Normalized Eigenfactor, normalized article influence score and SNIP in interdisciplinary evaluation: A correlation analysis. J. Intell. 2017, 8, 120–123. [Google Scholar]
  42. Da Silva, J.A.T.; Memon, A.R. CiteScore: A cite for sore eyes, or a valuable, transparent metric? Scientometrics 2017, 111, 1–4. [Google Scholar]
  43. Van Eck, N.J.; Waltman, L.; Noyons, E.C.M.; Buter, R.K. Automatic term identification for bibliometric mapping. Scientometrics 2010, 82, 581–596. [Google Scholar] [CrossRef] [PubMed] [Green Version]
  44. Bonilla, C.A.; Merigó, J.M.; Torres-Abad, C. Economics in Latin America: A bibliometric analysis. Scientometrics 2015, 105, 1239–1252. [Google Scholar] [CrossRef]
  45. Ding, Y.; Rousseau, R.; Wolfram, D. Measuring Scholarly Impact; Springer International Publishing: Basel, Switzerland, 2014; pp. 285–320. ISBN 978-3-319-10376-1. [Google Scholar]
  46. Todorov, R.; Glanzel, W. Journal citation measures: A concise review. J. Inf. Sci. 1988, 14, 47–56. [Google Scholar] [CrossRef]
  47. Garfield, E. Citation indexes to science: A new dimension in documentation through association of ideas. Science 1955, 122, 108–111. [Google Scholar] [CrossRef] [PubMed]
  48. Martinez, M.A.; Herrera, M.; Contreras, E.; Ruiz, A.; Herrera-Viedma, E. Characterizing highly cited papers in social work through H-classics. Scientometrics 2015, 102, 1713–1729. [Google Scholar] [CrossRef]
  49. Zhu, Z.; Bi, J.; Pan, Y.; Ganguly, S.; Anav, A.; Xu, L.; Samanta, A.; Piao, S.; Nemani, R.R.; Myneni, R.B. Global data sets of vegetation leaf area index (LAI)3g and fraction of photosynthetically active radiation (FPAR)3g derived from global inventory modeling and mapping studies (GIMMS) normalized difference vegetation index (NDVI3g) for the period 1981 to 2011. Remote Sens. 2013, 5, 927–948. [Google Scholar]
  50. Pinzon, J.E.; Tucker, C.J. A non-stationary 1981–2012 AVHRR NDVI3g time series. Remote Sens. 2014, 6, 6929–6960. [Google Scholar] [CrossRef]
  51. Watts, A.C.; Ambrosia, V.G.; Hinkley, E.A. Unmanned aircraft systems in remote sensing and scientific research: Classification and considerations of use. Remote Sens. 2012, 4, 1671–1692. [Google Scholar] [CrossRef]
  52. Meng, X.L.; Currit, N.; Zhao, K.G. Ground filtering algorithms for airborne LIDAR data: A review of critical issues. Remote Sens. 2010, 2, 833–860. [Google Scholar] [CrossRef]
  53. Turner, D.; Lucieer, A.; Watson, C. An automated technique for generating georectified mosaics from ultra-high resolution unmanned aerial vehicle (UAV) imagery, based on structure from motion (SFM) point clouds. Remote Sens. 2012, 4, 1392–1410. [Google Scholar] [CrossRef]
  54. Atzberger, C. Advances in remote sensing of agriculture: Context description, existing operational monitoring systems and major information needs. Remote Sens. 2013, 5, 949–981. [Google Scholar] [CrossRef]
  55. Kaartinen, H.; Hyyppa, J.; Yu, X.W.; Vastaranta, M.; Hyyppa, H.; Kukko, A.; Holopainen, M.; Heipke, C.; Hirschmugl, M.; Morsdorf, F.; et al. An international comparison of individual tree detection and extraction using airborne laser scanning. Remote Sens. 2012, 4, 950–974. [Google Scholar] [CrossRef]
  56. Rudorff, B.F.T.; de Aguiar, D.A.; da Silva, W.F.; Sugawara, L.M.; Adami, M.; Moreira, M.A. Studies on the rapid expansion of sugarcane for ethanol production in São Paulo state (Brazil) using landsat data. Remote Sens. 2010, 2, 1057–1076. [Google Scholar] [CrossRef]
  57. Harwin, S.; Lucieer, A. Assessing the accuracy of georeferenced point clouds produced via multi-view stereopsis from unmanned aerial vehicle (UAV) imagery. Remote Sens. 2012, 4, 1573–1599. [Google Scholar] [CrossRef]
  58. Hunt, E.R.J.; Hively, W.D.; Fujikawa, S.J.; Linden, D.S.; Daughtry, C.S.T.; McCarty, G.W. Acquisition of NIR-green-blue digital photographs from unmanned aircraft for crop monitoring. Remote Sens. 2010, 2, 290–305. [Google Scholar] [CrossRef]
  59. Mancini, F.; Dubbini, M.; Gattelli, M.; Stecchi, F.; Fabbri, S.; Gabbianelli, G. Using unmanned aerial vehicles (UAV) for high-resolution reconstruction of topography: The structure from motion approach on coastal environments. Remote Sens. 2013, 5, 6880–6898. [Google Scholar] [CrossRef]
  60. Raumonen, P.; Kaasalainen, M.; Akerblom, M.; Kaasalainen, S.; Kaartinen, H.; Vastaranta, M.; Holopainen, M.; Disney, M.; Lewis, P. Fast automatic precision tree models from terrestrial laser scanner data. Remote Sens. 2013, 5, 491–520. [Google Scholar] [CrossRef]
  61. Immitzer, M.; Atzberger, C.; Koukal, T. Tree species classification with random forest using very high spatial resolution 8-band worldview-2 satellite data. Remote Sens. 2012, 4, 2661–2693. [Google Scholar] [CrossRef]
  62. Remondino, F. Heritage recording and 3D modeling with photogrammetry and 3D scanning. Remote Sens. 2011, 3, 1104–1138. [Google Scholar] [CrossRef]
  63. Fritz, S.; McCallum, I.; Schill, C.; Perger, C.; Grillmayer, R.; Achard, F.; Kraxner, F.; Obersteiner, M. Geo-wiki.org: The use of crowdsourcing to improve global land cover. Remote Sens. 2009, 1, 345–354. [Google Scholar] [CrossRef]
  64. Hu, F.; Xia, G.S.; Hu, J.W.; Zhang, L.P. Transferring deep convolutional neural networks for the scene classification of high-resolution remote sensing imagery. Remote Sens. 2015, 7, 14680–14707. [Google Scholar] [CrossRef]
  65. D’Oleire-Oltmanns, S.; Marzolff, I.; Peter, K.D.; Ries, J.B. Unmanned aerial vehicle (UAV) for monitoring soil erosion in morocco. Remote Sens. 2012, 4, 3390–3416. [Google Scholar] [CrossRef]
  66. Wallace, L.; Lucieer, A.; Watson, C.; Turner, D. Development of a UAV-LiDAR system with application to forest inventory. Remote Sens. 2012, 4, 1519–1543. [Google Scholar] [CrossRef]
  67. Kuenzer, C.; Bluemel, A.; Gebhardt, S.; Quoc, T.V.; Dech, S. Remote sensing of mangrove ecosystems: A review. Remote Sens. 2011, 3, 878–928. [Google Scholar] [CrossRef]
  68. Boesch, H.; Baker, D.; Connor, B.; Crisp, D.; Miller, C. Global characterization of CO2 column retrievals from shortwave-infrared satellite observations of the orbiting carbon observatory-2 mission. Remote Sens. 2011, 3, 270–304. [Google Scholar] [CrossRef]
  69. Van Eck, N.J.; Waltman, L.; Van Raan, A.F.J.; Klautz, R.J.M.; Peul, W.C. Citation analysis may severely underestimate the impact of clinical research as compared to basic research. PLoS ONE 2013, 8, e62395. [Google Scholar] [CrossRef]
  70. Breiman, L. Random forests. Mach. Learn. 2001, 45, 5–32. [Google Scholar] [CrossRef]
  71. Xiong, J.; Thenkabail, P.S.; Tilton, J.C.; Gumma, M.K.; Teluguntla, P.; Oliphant, A.; Congalton, R.G.; Yadav, K.; Gorelick, N. Nominal 30-m cropland extent map of continental Africa by integrating pixel-based and object-based algorithms using sentinel-2 and landsat-8 data on Google Earth engine. Remote Sens. 2017, 9, 1065. [Google Scholar] [CrossRef]
  72. Teluguntla, P.; Thenkabail, P.S.; Xiong, J.; Gumma, M.K.; Congalton, R.G.; Oliphant, A.; Poehnelt, J.; Yadav, K.; Rao, M.; Massey, R. Spectral matching techniques (SMTs) and automated cropland classification algorithms (ACCAs) for mapping croplands of Australia using MODIS 250-m time-series (2000–2015) data. Int. J. Digit. Earth 2017, 10, 944–977. [Google Scholar] [CrossRef] [Green Version]
  73. Thenkabail, P.S.; Knox, J.W.; Ozdogan, M.; Gumma, M.K.; Congalton, R.G.; Wu, Z.T.; Milesi, C.; Finkral, A.; Marshall, M.; Mariotto, I.; et al. Assessing future risks to agricultural productivity, water resources and food security: How can remote sensing help? Photogramm. Eng. Remote Sens. 2012, 78, 773–782. [Google Scholar]
  74. Huete, A.; Didan, K.; Miura, T.; Rodriguez, E.P.; Gao, X.; Ferreira, L.G. Overview of the radiometric and biophysical performance of the MODIS vegetation indices. Remote Sens. Environ. 2002, 83, 195–213. [Google Scholar] [CrossRef]
  75. Tucker, C.J. Red and photographic infrared linear combinations for monitoring vegetation. Remote Sens. Environ. 1979, 8, 127–150. [Google Scholar] [CrossRef] [Green Version]
  76. Blaschke, T. Object based image analysis for remote sensing. ISPRS J. Photogramm. Remote Sens. 2010, 65, 2–16. [Google Scholar] [CrossRef] [Green Version]
  77. Congalton, R.G. A review of assessing the accuracy of classifications of remotely sensed date. Remote Sens. Environ. 1991, 37, 35–46. [Google Scholar] [CrossRef]
  78. Gao, B.C. NDWI-A normalized difference water index for remote sensing of vegetation liquid water from space. Remote Sens. Environ. 1996, 58, 257–266. [Google Scholar] [CrossRef]
  79. Huete, A.R. A Soil-adjusted vegetation index (SAVI). Remote Sens. Environ. 1988, 25, 295–309. [Google Scholar] [CrossRef]
  80. Lowe, D.G. Distinctive image features from scale-invariant keypoints. Int. J. Comput. Vis. 2004, 60, 91–110. [Google Scholar] [CrossRef]
  81. Berardino, P.; Fornaro, G.; Lanari, R.; Sansosti, E. A new algorithm for surface deformation monitoring based on small baseline differential SAR interferograms. IEEE Trans. Geosci. Remote Sens. 2002, 40, 2375–2383. [Google Scholar] [CrossRef]
  82. Ferretti, A.; Prati, C.; Rocca, F. Permanent scatterers in SAR interferometry. IEEE Trans. Geosci. Remote Sens. 2001, 39, 8–20. [Google Scholar] [CrossRef] [Green Version]
  83. Sevinc, A. Manipulating impact factor: An unethical issue or an editor’s choice? Swiss Med. Wkly. 2004, 134, 410. [Google Scholar] [PubMed]
  84. Fassoulaki, A.; Paraskeva, A.; Papilas, K.; Karabinis, G. Self-citations in six anaesthesia journals and their significance in determining the impact factor. Br. J. Anaesth. 2000, 84, 266–269. [Google Scholar] [CrossRef] [PubMed]
  85. Martyn, C. Advice to a new editor. BMJ Br. Med. J. 2007, 334, 586. [Google Scholar] [CrossRef]
  86. Vosner, H.B.; Kokol, P.; Bobek, S.; Zeleznik, D.; Zavrsnik, J. A bibliometric retrospective of the journal computers in human behavior (1991–2015). Comput. Hum. Behav. 2016, 65, 46–58. [Google Scholar] [CrossRef]
  87. Merigó, J.M.; Cobo, M.J.; Laengle, S.; Rivas, D.; Herrera-Viedma, E. Twenty years of soft computing: A bibliometric overview. Soft Comput. 2018, 1–21. [Google Scholar] [CrossRef]
  88. Gariano, S.L.; Guzzetti, F. Landslides in a changing climate. Earth Sci. Rev. 2016, 162, 227–252. [Google Scholar] [CrossRef] [Green Version]
  89. Garfield, E.; Sher, I.H. New factors in the evaluation of scientific literature through citation indexing. J. Am. Soc. Inf. Sci. Technol. 1963, 14, 195–201. [Google Scholar] [CrossRef]
  90. Garfield, E. How can impact factors be improved? BMJ Br. Med. J. 1996, 313, 411–413. [Google Scholar] [CrossRef]
  91. Brown, L.D.; Gardner, J.C. Using citation analysis to assess the impact of journals and articles on contemporary accounting research (CAR). J. Account. Res. 1985, 23, 84–109. [Google Scholar] [CrossRef]
Figure 1. Trend of number of publications, 2009–2018. Note: 2018 is incomplete and has data only for July months.
Remotesensing 11 00091 g001
Figure 2. Total number of cites of papers published in RS OAJ during the year 2017 was 13,600.
Remotesensing 11 00091 g002
Figure 3. Eigenfactor score of RS OAJ during 2017 was 0.03423, which is third amongst all remote sensing journals.
Remotesensing 11 00091 g003
Figure 4. CiteScore, another measure of impact of the journals developed by the publisher Elsevier.
Remotesensing 11 00091 g004
Figure 5. Total number of online readership has reached over 4 million in year 2018 at the time of writing this article (30 October 2018).
Remotesensing 11 00091 g005
Figure 6. Network Impact Diagram. Number of publications and co-authorship cooperation between countries.
Remotesensing 11 00091 g006
Figure 7. Mapping remote sensing research themes published in Remote Sensing Open Access Journal (RS OAJ) based on the cluster method by VOSviewer.
Remotesensing 11 00091 g007
Figure 8. Mapping the citation impact of remote sensing research topics as determined based on the keywords in the publications.
Remotesensing 11 00091 g008
Figure 9. Panorama of intellectual structure of the 764 publications that were cited 20 times or more in Remote Sensing Open Access Journal during 2009–2018 time-period.
Remotesensing 11 00091 g009
Figure 10. Knowledge flow into and from Remote Sensing Open Access Journal (RS OAJ) of MDPI during 2009–2018 time-period. The left side shows the articles of the Journals that are cited in RS OAJ articles frequently and on the right side are the Journals that cite RS OAJ frequently. Note: IEEE Trans. Geosci. R.S. (IEEE Transactions on Geoscience and Remote Sensing), Int. J. Appl. E.O.G. (International Journal of Applied Earth Observation and Geoinformation), IEEE J. Sel. T.A.E.O.R.S. (IEEE Journal of Selected Topics in Applied Earth Observations and Remote Sensing), ISPRS-J. Photo.R.S. (ISPRS Journal of Photogrammetry and Remote Sensing), J. Geophys. Res.-O. (Journal of Geophysical Research-Oceans), Photogramm. Eng. R.S. (Photogrammetric Engineering and Remote Sensing), IEEE Geosci. R.S. Lett. (IEEE Geoscience and Remote Sensing Letters).
Remotesensing 11 00091 g010
Table 1. Comparison of various journals that publish remote sensing science and technology extensively for the year 2017.
RankFull Journal TitleJournal Impact Factor 1Total Cites 2Eigenfactor Score 3Normalized Eigenfactor 4Total Publications Numbers
1Remote Sensing of Environment6.457044,1680.05296.1678385
2ISPRS Journal of Photogrammetry and Remote Sensing5.994085350.01591.8500198
3IEEE Geoscience and Remote Sensing Magazine4.93204800.00200.238945
4IEEE Transactions on Geoscience and Remote Sensing4.662034,5220.04345.0591562
5International Journal of Applied Earth Observation and Geoinformation4.003055070.01251.4582160
6Remote Sensing3.406013,6000.03423.99021335
7Photogrammetric Engineering and Remote Sensing3.150061960.00300.348994
8IEEE Geoscience and Remote Sensing Letters2.892090690.02062.3991493
9GIScience & Remote Sensing2.85208120.00140.165747
10IEEE Journal of Selected Topics in Applied Earth Observations and Remote Sensing2.777068460.02132.4768481
11International Journal of Digital Earth2.746011320.00270.309570
12Canadian Journal of Remote Sensing2.000019860.00190.217544
13Photogrammetric Record1.91707220.00060.073033
14International Journal of Remote Sensing1.782018,6750.01391.6155391
15Geocarto International1.759010170.00130.153890
16ISPRS International Journal of Geo-Information1.723011830.00250.2857405
17Remote Sensing Letters1.524012270.00360.4169126
18European Journal of Remote Sensing1.12203460.00090.107650
19Photogrammetrie Fernerkundung Geoinformation1.08502350.00040.051873
20Journal of Applied Remote Sensing0.976017710.00410.4821275
21Journal of the Indian Society of Remote Sensing0.81008630.00100.1207101
Foot Note: 1 = Journal Impact Factor: Number of times all the articles that are published in the last two years (e.g., 2015, 2016) in a journal are cited this year (e.g., 2017) by any journal in the JCR database divided by the total number of articles published [36,37]. 2 = Total cites: The total number of times that a journal has been cited by all journals included in the database in the Journal Citation Reports (JCR) year [38]. 3 = Eigenfactor score: The Eigenfactor Score calculation is based on the number of times articles from the journal published in the past five years have been cited in the JCR year, but it also considers which journals have contributed these citations so that highly cited journals will influence the network more than lesser cited journals [39,40]. Remote Sensing Open Access Journal (RS OAJ) with eigenfactor score of 0.0342 is next only to Remote Sensing of Environment (0.0529), and IEEE Transaction of Geoscience and Remote Sensing (0.0434), showing that RS OAJ has excellent record of its articles cited in other high ranked journals. 4 = Normalized Eigenfactor: The Normalized Eigenfactor Score is the Eigenfactor score normalized, by rescaling the total number of journals in the JCR each year, so that the average journal has a score of 1. Journals can then be compared and influence measured by their score relative to 1. For example, Remote Sensing Journal of MDPI which has a normalized eigenfactor of 3.99, means that the journal is 3.99 times more influential as the average journal in the Journal Citation Report (JRC) [41].
Table 2. Publication time of various remote sensing journals.
RankFull Journal TitleAverage Review Speed (Days)Average Publication Time (Days)
1Remote Sensing of Environment166180
2ISPRS Journal of Photogrammetry and Remote Sensing166175
3International Journal of Applied Earth Observation and Geoinformation126155
4Remote Sensing4067
5Photogrammetric Engineering and Remote Sensing196364
6GIScience & Remote Sensing158178
7International Journal of Digital Earth200218
8Canadian Journal of Remote Sensing166256
9International Journal of Remote Sensing169211
10Geocarto International150164
11ISPRS International Journal of Geo-Information5499
12Remote Sensing Letters159184
13European Journal of Remote Sensing301325
14Photogrammetrie Fernerkundung Geoinformation221266
15Journal of Applied Remote Sensing101130
16Journal of the Indian Society of Remote Sensing262276
Table 3. H-classic publications published by RS OAJ (top 20).
RankAuthorsYear, Volume (Issue), PageDocument TypeCitations
1Zhu, Z.C.; Bi, J.; Pan, Y.Z. et al.2013, 5(2), 927–948 [49]Article249
2Pinzon, J.E.; Tucker, C.J.2014, 6(8), 6929–6960 [50]Article216
3Watts, A.C.; Ambrosia, V.G.; Hinkley, E.A.2012, 4(6), 1671–1692 [51]Article213
4Meng, X.; Currit, N.; Zhao, K.G.2010, 2(3), 833–860 [52]Review196
5Turner, D.; Lucieer, A.; Watson, C.2012, 4(5), 1392–1410 [53]Article186
6Atzberger, C.2013, 5(2), 949–981 [54]Review184
7Kaartinen, H.; Hyyppa, J.; Yu, X.W. et al.2012, 4(4), 950–974 [55]Article169
8Rudorff, B.F.T.; De Aguiar, D.A.; Da Silva, W.F. et al.2010, 2(4), 1057–1076 [56]Article169
9Harwin, S.; Lucieer, A.2012, 4(6), 1573–1599 [57]Article168
10Hunt, E.R.; Hively, W.D.; Fujikawa, S.J. et al.2010, 2(1), 290–305 [58]Article166
11Mancini, F.; Dubbini, M.; Gattelli, M. et al.2013, 5(12), 6880–6898 [59]Article157
12Raumonen, P.; Kaasalainen, M.; Akerblom, M. et al.2013, 5(2), 491–520 [60]Article157
13Immitzer, M.; Atzberger, C.; Koukal, T.2012, 4(9), 2661–2693 [61]Article151
14Remondino, F.2011, 3(6), 1104–1138 [62]Article148
15Fritz, S.; McCallum, I.; Schill, C. et al.2009, 1(3), 345–354 [63]Article148
16Hu, F.; Xia, G.S.; Hu, J.W. et al.2015, 7(11), 14680–14707 [64]Article143
17D’Oleire-Oltmanns, S.; Marzolff, I.; Peter, K.D.; Ries, J.B.2012, 4(11), 3390–3416 [65]Article143
18Wallace, L.; Lucieer, A.; Watson, C. et al.2012, 4(6), 1519–1543 [66]Article141
19Kuenzer, C.; Bluemel, A.; Gebhardt, S. et al.2011, 3(5), 878–928 [67]Review129
20Boesch, H.; Baker, D.; Connor, B. et al.2011, 3(2), 270–304 [68]Article111
Table 4. The title analysis of the first 20 h-classic publications (Table 3) published by RS OAJ.
RankAuthorsTitleTitle Keywords
1Zhu, Z.C.; Bi, J.; Pan, Y.Z. et al.Global Data Sets of Vegetation Leaf Area Index (LAI)3g and Fraction of Photosynthetically Active Radiation (FPAR) 3 g Derived from Global Inventory Modeling and Mapping Studies (GIMMS) Normalized Difference Vegetation Index (NDVI3g) for the Period 1981 to 2011 [49]LAI; FPAR; GIMMS; NDVI3g
2Pinzon, J.E.; Tucker, C.J.A Non-Stationary 1981–2012 AVHRR NDVI3g Time Series [50]AVHRR NDVI3g
3Watts, A.C.; Ambrosia, V.G.; Hinkley, E.A.Unmanned Aircraft Systems in Remote Sensing and Scientific Research: Classification and Considerations of Use [51]Unmanned Aircraft Systems
4Meng, X.; Currit, N.; Zhao, K.G.Ground Filtering Algorithms for Airborne LiDAR Data: A Review of Critical Issues [52]LiDAR; Fround filtering;
5Turner, D.; Lucieer, A.; Watson, C.An Automated Technique for Generating Georectified Mosaics from Ultra-High Resolution Unmanned Aerial Vehicle (UAV) Imagery, Based on Structure from Motion (SfM) Point Clouds [53]UAV; SfM; Rectify; Georeferencing; Mosaicking; Point cloud
6Atzberger, C.Advances in Remote Sensing of Agriculture: Context Description, Existing Operational Monitoring Systems and Major Information Needs [54]Agriculture: Context Description; Existing Operational Monitoring Systems; Information Needs
7Kaartinen, H.; Hyyppa, J.; Yu, X.W. et al.An International Comparison of Individual Tree Detection and Extraction Using Airborne Laser Scanning [55]Tree detection; Tree extraction; Airborne laser scanning; EuroSDR; ISPRS
8Rudorff, B.F.T.; De Aguiar, D.A.; Da Silva, W.F. et al.Studies on the Rapid Expansion of Sugarcane for Ethanol Production in Sao Paulo State (Brazil) Using Landsat Data [56]Sugarcane; Ethanol; Using Landsat Data
9Harwin, S.; Lucieer, A.Assessing the Accuracy of Georeferenced Point Clouds Produced via Multi-View Stereopsis from Unmanned Aerial Vehicle (UAV) Imagery [57]UAV; Multi-view stereopsis; 3D point cloud
10Hunt, E.R.; Hively, W.D.; Fujikawa, S.J. et al.Acquisition of NIR-Green-Blue Digital Photographs from Unmanned Aircraft for Crop Monitoring [58]UAV; Green NDVI; Leaf area index
11Mancini, F.; Dubbini, M.; Gattelli, M. et al.Using Unmanned Aerial Vehicles (UAV) for High-Resolution Reconstruction of Topography: The Structure from Motion Approach on Coastal Environments [59]UAV; Structure from motion; Terrestrial laser scanning; Digital surface model; Beach dunes system
12Raumonen, P.; Kaasalainen, M.; Akerblom, M. et al.Fast Automatic Precision Tree Models from Terrestrial Laser Scanner Data [60]Terrestrial laser scanning; Automatic tree modeling; Precision tree models
13Immitzer, M.; Atzberger, C.; Koukal, T.Tree Species Classification with Random Forest Using Very High Spatial Resolution 8-Band WorldView-2 Satellite Data [61]Tree species classification; WorldView-2; Random Forest
14Remondino, F.Heritage Recording and 3D Modeling with Photogrammetry and 3D Scanning [62]Sensors; 3D modeling; Photogrammetry; 3D scanning;
15Fritz, S.; McCallum, I.; Schill, C. et al.Geo-Wiki.Org: The Use of Crowdsourcing to Improve Global Land Cover [63]Land cover; Crowdsourcing; Validating land cover
16Hu, F.; Xia, G.S.; Hu, J.W. et al.Transferring Deep Convolutional Neural Networks for the Scene Classification of High-Resolution Remote Sensing Imagery [64]CNN; Scene classification; Feature representation
17D’Oleire-Oltmanns, S.; Marzolff, I.; Peter, K.D.; Ries, J.B.Unmanned Aerial Vehicle (UAV) for Monitoring Soil Erosion in Morocco [65]UAV; SFAP; Soil erosion; Monitoring
18Wallace, L.; Lucieer, A.; Watson, C. et al.Development of a UAV-LiDAR System with Application to Forest Inventory [66]Unmanned Aerial Vehicles; LiDAR
19Kuenzer, C.; Bluemel, A.; Gebhardt, S. et al.Remote Sensing of Mangrove Ecosystems: A Review [67]Mangrove Ecosystems
20Boesch, H.; Baker, D.; Connor, B. et al.Global Characterization of CO2 Column Retrievals from Shortwave-Infrared Satellite Observations of the Orbiting Carbon Observatory-2 Mission [68]CO2; Trace gases; Remote sensing; Inverse theory
Table 5. A nuanced version of h-index (nh-index) of 10 authors, randomly selected.
Authorsh-Indexh-Index First Authorh-Index Second Authorh-Index Third Authorh-Index n-Authorh-Index Correspondence Authorship
Zhu, Z.C. (Zhu, Zaichun)17202131
Gao, B.C. (Gao, Bo-Cai)341664814
Hansen, M.C. (Hansen, Matthew C.)471694815
Blaschke, T. (Blaschke, Thomas)2959974
Bioucas-Dias, J.M. (Bioucas-Dias, Jose M.)4111215410
Lefsky, M.A. (Lefsky, Michael A.)3012521112
Melgani, F. (Melgani, Farid)31816439
Tarabalka, Y. (Tarabalka, Yuliya)1476016
Chavez, P.S. (Chavez, PS)151220112
Liu, D.S. (Liu, Desheng)21745511
Table 6. A nuanced version of total citations of 10 authors, randomly selected.
AuthorsTotal Citations (Publications)Total Citations First Author (Publications)Total Citations Second Author (Publications)Total Citations Third Author (Publications)Total Citations n-Author (Publications)Total Citations Correspondence Authorship (Publications)
Zhu, Z.C.
(Zhu, Zaichun)
1120 (39)471 (7)19 (3)51 (2)579 (27)271 (1)
Gao, B.C.
(Gao, Bo-Cai)
6261 (124)3645 (61)544 (15)405 (19)1667 (29)3316 (49)
Hansen, M.C.
(Hansen, Matthew C.)
11,527 (127)5900 (26)1190 (32)851 (8)3586 (61)5695 (26)
Blaschke, T.
(Blaschke, Thomas)
4771 (125)2275 (19)1459 (48)641 (33)396 (25)2320 (19)
Bioucas-Dias, J.M.
(Bioucas-Dias, Jose Mario.)
10,109 (207)3439 (43)5435 (96)552 (36)683 (32)2582 (38)
Lefsky, M.A.
(Lefsky, Michael A.)
5712 (55)3039 (15)703 (13)165 (7)1805 (20)3124 (16)
Melgani, F.
(Melgani, Farid)
4503 (160)2050 (25)1499 (86)664 (30)290 (19)2207 (40)
Tarabalka, Y.
(Tarabalka, Yuliya)
2266 (39)1430 (18)785 (16)24 (3)27 (2)1394 (17)
Chavez, P.S.
(Chavez, PS)
3677 (25)3461 (14)147 (4)26 (5)43 (2)3482 (13)
Liu, D.S.
(Liu, Desheng)
1229 (46)429 (11)276 (15)275 (12)249 (8)636 (18)
Table 7. Most productive countries (territories) of Remote Sensing Open Access Journal (RS OAJ) publications (Top 20).
RankCountryNumber of PublicationsMillion PopulationsPublications /Million PopulationsPercentage/5588
1China201213861.4536.0
2USA15633264.7928.1
3Germany610837.3510.9
4Italy382616.266.8
5France304674.545.4
6Spain301476.405.4
7Canada279367.755.0
8England262663.974.7
9Australia2532510.124.5
10Netherlands2001711.763.6
11Japan1791271.413.2
12Switzerland151818.882.7
13Austria142915.782.5
14Belgium1321112.002.4
15Finland128621.332.3
16Brazil1242090.592.2
17South Korea103512.021.8
18Norway80516.001.4
19Sweden71107.101.3
20Denmark64610.671.1
Table 8. Most productive institutions in Remote Sensing Open Access Journal (RS OAJ) (Top 50).
RankInstitutionsCountryNumber of PublicationsTotal CitationsTotal Citations/PublicationsPercentage/5588
1Chinese Academy of ScienceChina76342295.5413.65
2Wuhan UniversityChina35217314.926.30
3University of Chinese Academy of ScienceChina33715504.606.03
4Beijing Normal UniversityChina19815417.783.54
5The university of MarylandUSA15113138.702.70
6National Aeronautics and Space AdministrationUSA148235315.902.65
7National Oceanic and Atmospheric AdministrationUSA866357.381.54
8China University of GeosciencesChina852623.081.52
9United States Geological SurveyUSA83108013.011.49
10German Aerospace Centre (DLR)Germany7979010.001.41
11University of Twente Netherlands765767.581.36
12California Institute of TechnologyUSA756278.361.34
13Peking University China7373010.001.31
14Tsinghua UniversityChina674676.971.20
15Nanjing UniversityChina563355.981.00
16Nanjing University of Information Science and TechnologyChina551853.360.98
17Consiglio Nazionale delle RicercheItaly533696.960.95
18Jiangsu Center for Collaborative Innovation in Geographical Information Resource Development and ApplicationChina532464.640.95
19China University of Mining and TechnologyChina472815.980.84
20Central South UniversityChina451984.400.81
21The University of QueenslandAustralia4573016.220.81
22Chinese Academy of Agricultural SciencesChina453958.780.81
23Collaborative Innovation Center of Geospatial TechnologyChina451242.760.81
24University of HelsinkiFinland4489120.250.79
25Boston UniversityUSA4284520.120.75
26Joint Center for Global Change StudiesChina422846.760.75
27Université de ToulouseFrance422696.400.75
28Finnish Geodetic InstituteFinland41159338.850.73
29The Hong Kong Polytechnic UniversityChina411644.000.73
30Hohai UniversityChina392636.740.70
31The University of ArizonaUSA3853514.080.68
32University of ValenciaSpain382667.000.68
33Colorado State UniversityUSA3748413.080.66
34Tongji UniversityChina362647.330.64
35Instituto Nacional de Pesquisas Espaciais (INPE)Brazil3456416.590.61
36University of ColoradoUSA3437911.150.61
37The Chinese University of Hong KongChina343299.680.61
38Consejo Superior de Investigaciones Cientificas (CSIC)Spain342938.620.61
39Science Systems and Applications, Inc.USA341835.380.61
40United States Forest ServiceUSA3358117.610.59
41University of WisconsinUSA3335810.850.59
42Delft University of TechnologyNetherlands332437.360.59
43University of Electronic Science and Technology of ChinaChina331454.390.59
44University of CopenhagenDenmark3242913.410.57
45GFZ German Research Centre for GeosciencesGermany3238712.090.57
46Centre National de la Recherche Scientifique (CNRS)France322407.500.57
47European Commission Joint Research CentreBelgium3154617.610.55
48The University of TokyoJapan311314.230.55
49Vienna University of TechnologyAustria3052517.500.54
50Wageningen University and ResearchNetherlands3045115.030.54
Table 9. The number of publications for cooperation among China/USA with other countries (the number of cooperation publications exceeds 10).
RankChina with Other CountriesPublicationsUSA with Other CountriesPublications
1China and USA443USA and China443
2China and France54USA and Germany60
3China and Germany54USA and Canada57
4China and England46USA and Australia53
5China and Australia45USA and England48
6China and Canada45USA and Italy40
7China and Netherlands38USA and France35
8China and Italy37USA and Spain34
9China and Japan35USA and Japan33
10China and Taiwan18USA and Netherlands29
11China and Belgium17USA and Brazil28
12China and Spain15USA and South Korea23
13China and Finland11USA and Belgium21
14 USA and India19
15 USA and Taiwan17
16 USA and Switzerland14
17 USA and Austria12
18 USA and Finland12
19 USA and Chile11
20 USA and Mexico11
21 USA and Scotland10
22 USA and Sweden10
Table 10. The cluster of Remote Sensing Open Access Journal (RS OAJ) research themes.
RankResearch ThemesKeywords
1: Red ClusterMulti-spectral and hyperspectral remote sensing“remote sensing”, “classification”, “hyperspectral”, “change detection”, “land cover”, “random forest”, “Sentinel-2”, “machine learning”, “leaf area index”, “data fusion”, “segmentation”, “monitoring”, “Landsat-8”, “hyperspectral remote sensing”, “imaging spectroscopy”,
2: Green ClusterResearch on LiDAR scanning and forestry remote sensing monitoring“Light Detection and Ranging (LiDAR)”, “Unmanned Aerial Vehicle (UAV)”, “biomass”, “photogrammetry”, “terrestrial laser scanning”, “vegetation”, “vegetation indices”, “airborne laser scanning”, “point cloud”, “forest”, “forest inventory”, “accuracy”, “unmanned aerial vehicle”, “forestry”, “aboveground biomass”
3: Blue ClusterMODIS and LAI data applications“Moderate Resolution Imaging Spectroradiometer (MODIS)”, “validation”, “land surface temperature”, “calibration”, “Visible Infrared Imaging Radiometer Suite (VIIRS) ”, “China”, “Leaf Area Index (LAI)”, “atmospheric correction”, “satellite”, “Advanced Very High Resolution Radiometer (AVHRR)”, “uncertainty”, “downscaling”, “chlorophyll-a”, “urbanization”, “Medium Resolution Imaging Spectrometer (MERIS)”, “aerosol optical depth”, “albedo”, “evaluation”, “satellite remote sensing”, “urban heat island”, “aerosol”, “Aerosol Optical Depth (AOD)”, “Leaf Area Index (LAI)”, “air temperature”, “Fraction of Absorbed Photosynthetically Active Radiation (FAPAR)”, “nighttime light”, etc.
4: Yellow ClusterRemote sensing applications“Landsat”, “NDVI”, “phenology”, “evapotranspiration”, “climate change”, “precipitation”, “agriculture”, “drought”, “The Advanced Space-borne Thermal Emission and Reflection Radiometer (ASTER)”, “Tibetan Plateau”, “land cover change”, “Africa”, “Tropical Rainfall Measuring Mission(TRMM)”, “The Enhanced Vegetation Index (EVI)”, “rainfall”, “deforestation”, “boreal forest”, “Normalized Difference Vegetation Index (NDVI)”, “earth observation”, “irrigation”, etc.
5: Purple ClusterSynthetic Aperture Radar (SAR)“soil moisture”, “SAR”, “time series”, “ Interferometric Synthetic Aperture Radar (InSAR)”, “Synthetic Aperture Radar”, “Sentinel-1”, “TerraSAR-X”, “Arctic”, “Synthetic Aperture Radar (SAR)”, “Geographic Information Systems (GIS)”, “landslide”, “data assimilation”, “wetlands”, “Radarsat-2”, “grace”, “sea ice”, “radar”, “ALOS PALSAR”, “snow”, “l-band”, etc.
Table 11. The top 10 publications most cited references in Remote Sensing Open Access Journal (RS OAJ) from 2009 to 2018.
RankAuthorsTitleYearVolume (Issue), PageSourceCitationsWeb of Science Citation
1Breiman, L.Random Forests [70]200145(1), 5–32Machine Learning29419,461
2Huete, A.; Didan, K.; Miura, T.; Rodriguez, E.P.; Gao, X.; Ferreira, L.G.Overview of the Radiometric and Biophysical Performance of the MODIS Vegetation Indices [74]200283(1), 195–213Remote Sensing of Environment2333057
3Tucker, C.J.Red and Photographic Infrared Linear Combinations for Monitoring Vegetation [75]19798(2), 127–150Remote Sensing of Environment2393728
4Blaschke, T.Object Based Image Analysis for Remote Sensing [76]201065(1), 2–16ISPRS Journal of Photogrammetry & Remote Sensing1581690
5Congalton, R.G.A Review of Assessing the Accuracy of Classifications of Remotely Sensed Data [77]199137(1), 35–46Remote Sensing of the Environment1533224
6Gao, B.C.NDWI-A Normalized Difference Water Index for Remote Sensing of Vegetation Liquid Water from Space [78]199658(3), 257–266Remote Sensing of Environment1271658
7Huete, A.R.A Soil-Adjusted Vegetation Index (SAVI) [79]198825(3), 295–309Remote Sensing of Environment1222276
8Lowe, D.G.Distinctive Image Features from Scale-Invariant Keypoints [80]200460(2), 91–110International Journal of Computer Vision12122,527
9Berardino, P.; Fornaro, G.; Lanari, R.; Sansosti, E.A New Algorithm for Surface Deformation Monitoring Based on Small Baseline Differential SAR Interferograms [81]200240(11), 2375–2383IEEE Transactions on Geoscience & Remote Sensing1171407
10Ferretti, A.; Prati, C.; Rocca, F.Permanent Scatterers in SAR Interferometry [82]200139(1), 8–20IEEE Transactions on Geoscience & Remote Sensing1141956
Table 12. The articles of the Journals that are cited in RS OAJ articles frequently (Top 15).
RankJournal TitleTimes
1RS OAJ (Remote Sens.)3363
2Remote Sensing of Environment (Remote Sens. Environ.)634
3International Journal of Remote Sensing (Int. J. Remote Sens.)449
4Sensors376
5ISPRS Journal of Photogrammetry and Remote Sensing (ISPRS-J. Photogramm. Remote Sens.)311
6IEEE Journal of Selected Topics in Applied Earth Observations and Remote Sensing (IEEE J. Sel. Top. Appl. Earth Observ. Remote Sens.)303
7International Journal of Applied Earth Observation and Geoinformation (Int. J. Appl. Earth Obs. Geoinf.)256
8Proceedings of SPIE (Proc. SPIE)241
9ISPRS International Journal of Geo-Information (ISPRS Int. Geo-Inf.)219
10Journal of Applied Remote Sensing (J. Appl. Remote Sens.)219
11IEEE Transactions on Geoscience and Remote Sensing (IEEE Trans. Geosci. Remote Sensing)214
12Forests183
13Water137
14PLOS ONE134
15Sustainability124
Table 13. The articles of the Journals that cite RS OAJ frequently (Top 15).
RankJournal TitleTimes
1Remote Sensing of Environment is the most important journal (Remote Sens. Environ.)6610
2IEEE Transactions on Geoscience and Remote Sensing (IEEE Trans. Geosci. Remote Sensing)3868
3RS OAJ (Remote Sens.)3363
4International Journal of Remote Sensing (Int. J. Remote Sens.)2347
5ISPRS Journal of Photogrammetry and Remote Sensing (ISPRS-J. Photogramm. Remote Sens.)1227
6Journal of Geophysical Research-Atmospheres (J. Geophys. Res.-Atmos.)1181
7Geophysical Research Letters (Geophys. Res. Lett.) 937
8IEEE Geoscience and Remote Sensing Letters (IEEE Geosci. Remote Sens. Lett.)906
9IEEE Journal of Selected Topics in Applied Earth Observations and Remote Sensing (IEEE J. Sel. Top. Appl. Earth Observ. Remote Sens.)892
10International Journal of Applied Earth Observation and Geoinformation (Int. J. Appl. Earth Obs. Geoinf.)726
11Photogrammetric Engineering and Remote Sensing (Photogramm. Eng. Remote Sens.)640
12Agricultural and Forest Meteorology (Agric. For. Meteorol.)528
13Journal of Geophysical Research-Oceans (J. Geophys. Res.-Oceans)486
14Science467
15International Geoscience and Remote Sensing Symposium (IGARSS)438
Table 14. Comparison of various remote sensing journals about self-citation rate (%).
RankFull Journal TitleSelf-Citation Rate (%)
1Remote Sensing of Environment12.92
2ISPRS Journal of Photogrammetry and Remote Sensing8.22
3IEEE Geoscience and Remote Sensing Magazine2.41
4IEEE Transactions on Geoscience and Remote Sensing12.73
5International Journal of Applied Earth Observation and Geoinformation6.54
6Remote Sensing24.10
7Photogrammetric Engineering and Remote Sensing8.67
8IEEE Geoscience and Remote Sensing Letters8.04
9GIScience & Remote Sensing18.97
10IEEE Journal of Selected Topics in Applied Earth Observations and Remote Sensing15.44
11International Journal of Digital Earth11.43
12Canadian Journal of Remote Sensing6.27
13Photogrammetric Record12.59
14International Journal of Remote Sensing8.19
15Geocarto International9.50
16ISPRS International Journal of Geo-Information24.61
17Remote Sensing Letters5.81
18European Journal of Remote Sensing13.74
19Photogrammetrie Fernerkundung Geoinformation6.23
20Journal of Applied Remote Sensing11.12
21Journal of the Indian Society of Remote Sensing8.72
Table 15. Comparison with two of the best remote sensing journals for the year 2016.
Remote Sensing
Total Doc of 2016 in WoS1037
Editorial Materials22
Corrected Value1015
Range of CitationsNo of PapersPercentCitationsContribution to Citations
0737.19%00.00%
1–222622.27%3445.51%
3–1057456.55%313950.24%
11–2013613.40%192230.76%
>21282.76%84313.49%
Sum of Times Cited6248 6248
Average citations per item6.03
h-index22
IEEE Transactions on Geoscience and Remote Sensing
Total Doc of 2016 in WoS573
Editorial Materials1
Corrected Value572
Range of CitationsNo of PapersPercentCitationsContribution to Citations
0284.90%00.00%
1–210718.71%1743.03%
3–1028449.65%170829.76%
11–209216.08%134623.45%
>216210.84%251243.76%
Sum of Times Cited5740 5740
Average citations per item10.02
h-index29
Remote Sensing of Environment
Total Doc of 2016 in WoS448
Editorial Materials5
Corrected Value443
Range of CitationsNo of PapersPercentCitationsContribution to Citations
0112.48%00.00%
1–2378.35%560.96%
3–1020345.82%131622.48%
11–2011425.73%166728.48%
>218318.74%281548.09%
Sum of Times Cited5854 5854
Average citations per item13.07
h-index33
Table 16. Comparison with two of the best remote sensing journals about citations from 2010–2017.
Remote Sensing
The following % percentile of articles with n citationsArticles < 3 citations
YearMedia citations number5%15%25%50%75%85%95%NumberPercentage (%)Total publications
2010153791530419264.20143
2011202692033467585.67141
20121825918344371105.35187
20131626916283873185.61321
20141214612212844508.61581
2015913491419329512.18780
2016501259121826125.171037
20172001245976657.381335
IEEE Transactions on Geoscience and Remote Sensing
The following % percentile of articles with n citationsArticles < 3 citations
YearMedia citations number5%15%25%50%75%85%95%NumberPercentage (%)Total publications
2010233711234463112184.70383
2011192610193861107225.15427
20121725817344988337.91417
20131314713263666409.05442
20141314613253758487.59632
201511145112029566011.43525
20166023611172613523.56573
201720012681528350.36562
Remote Sensing of Environment
The following % percentile of articles with n citationsArticles <3 citations
YearMedia citations number5%15%25%50%75%85%95%NumberPercentage (%)Total articles
2010427152342749918600244
2011355152135608714182.52318
2012316121831588415741.02392
201329510152949639572.28307
201419271119355082215.37391
20151636916293858163.70433
20161013510182541429.38448
2017502259132010326.75385

