Abstract
High-throughput phenotyping technologies have become an increasingly important topic of crop science in recent years. Various sensors and data acquisition approaches have been applied to acquire the phenotyping traits. It is quite confusing for crop phenotyping researchers to determine an appropriate way for their application. In this study, three representative three-dimensional (3D) data acquisition approaches, including 3D laser scanning, multi-view stereo (MVS) reconstruction, and 3D digitizing, were evaluated for maize plant phenotyping in multi growth stages. Phenotyping traits accuracy, post-processing difficulty, device cost, data acquisition efficiency, and automation were considered during the evaluation process. 3D scanning provided satisfactory point clouds for medium and high maize plants with acceptable efficiency, while the results were not satisfactory for small maize plants. The equipment used in 3D scanning is expensive, but is highly automatic. MVS reconstruction provided satisfactory point clouds for small and medium plants, and point deviations were observed in upper parts of higher plants. MVS data acquisition, using low-cost cameras, exhibited the highest efficiency among the three evaluated approaches. The one-by-one pipeline data acquisition pattern allows the use of MVS high-throughput in further phenotyping platforms. Undoubtedly, enhancement of point cloud processing technologies is required to improve the extracted phenotyping traits accuracy for both 3D scanning and MVS reconstruction. Finally, 3D digitizing was time-consuming and labor intensive. However, it does not depend on any post-processing algorithms to extract phenotyping parameters and reliable phenotyping traits could be derived. The promising accuracy of 3D digitizing is a better verification choice for other 3D phenotyping approaches. Our study provides clear reference about phenotyping data acquisition of maize plants, especially for the affordable and portable field phenotyping platforms to be developed.
1. Introduction
Plant genotyping and phenotyping technologies are significantly important for acceleration of breeding programs to feed several billion people all around the world [1]. However, compared to rapid development of genotyping technologies, the inability to efficiently and accurately achieve complex phenotypic traits has become a bottleneck that limits genetic gain in breeding programs [2,3]. Substantial changes and improvements in phenotyping technologies for crops are required for a long term [1,4]. Morphology of plants is one of the most important types of phenotyping traits. The morphological traits provide a feasible way to assess plant growth, physiology, stress, yield, and every development in the plant [5]. These traits are also fundamental to improve plant characterization, selection, and discrimination [6]. Therefore, development of highly accurate and efficient morphological data acquisition and processing approaches is of great significance for plant phenotyping and further plant breeding [7].
Phenotyping traits related to plant morphology could be classified into three categories from large to small scales: (1) plot and canopy scale in field, (2) individual plant and organ scale indoor, and (3) micro-scale in laboratories. For the largest scale, unmanned aerial vehicle (UAV) [8] and vehicle based phenotyping platforms [9] were commonly used in field to acquire the phenotyping traits in plot and canopy scales [10]. Parameters derived by these platforms, such as plant height, leaf area index (LAI), canopy cover, and above-ground biomass [11], were satisfactory to show the morphological differences of canopies caused by cultivar or treatment strategies. Owing to the occlusion of adjacent plants, most field phenotyping platforms were not capable of deriving finer phenotyping traits of individual plants [12]. Since last few years, there are big (and very expensive) field devices that could acquire the same (or almost the same) traits accuracies on single plant level as the indoor ones [13]; however, they are unaffordable for most researchers in application. For the smallest scale, the internal structure of plant organs was captured using Micro- computed tomography (CT) and similar high resolution imaging devices [14,15]. However, this depends on expensive equipment and it is not feasible for high-throughput plant phenotyping.
Maize (Zea mays) is one of the most widely grown crops worldwide. It has been predicted that more than half of the increased food demand for cereal plants comes from maize [16]. Substantial changes in phenotyping technologies for breeding and crop improvement are thus required [17]. Delicate phenotyping traits of individual plant and organs benefit to genome wide association analysis (GWAS) and crop breeding [16,18]; therefore, many researchers developed high-throughput and efficient phenotyping platforms and methods to acquire maize plant traits [19]. Pot-grown plants on conveyor transport [20], robot-assisted imaging pipeline [21,22], and turntable combined with light detection and imaging (LiDAR) measuring [23] platforms were developed to acquire high-throughput plant phenotyping. Morphological parameters derived through two-dimensional (2D) images taken at appropriate angles were satisfactory for many demands [21]. However, the 1D parameterization was not always properly achieved. That led to extra calibration of e.g., leaf azimuthal angle, leaf length, and leaf area. 3D reconstruction of plants is an alternative way to solve this problem [24]. Commonly adopted 3D reconstruction approaches include 2D LiDAR synthesis [23], time-of-flight camera reconstruction [25,26,27], multi view stereo (MVS) reconstruction [28,29], 3D digitizing [30,31], and 3D laser scanning [32,33]. These approaches showed different performance toward various growth stages of maize plants in accuracy, efficiency, and throughput. Therefore, it has become quite confusing for the new researchers and developers to make a good choice for their phenotyping application of maize plants.
In this study, the performance of three representative morphological data acquisition approaches was comprehensively evaluated in 3D phenotyping of different growth stages of maize plants, including 3D laser scanning, MVS reconstruction, and 3D digitizing. The efficiency, accuracy, automation, and costs were systematically evaluated. The comparison aims to provide reasonable reference for sensor selection in phenotyping platforms for field maize plants.
2. Materials and Methods
2.1. Overall Process Flow
Three 3D data acquisition approaches and manual measurement were used to obtain the phenotypic traits of maize plants. The overall workflow is described in Figure 1. It involves ten steps: (1) measurement of the leaf inclination and azimuth angle of target plants; (2) obtaining the 3D scanning point clouds of plants; (3) capturing of MVS images of individual plants; (4) acquiring 3D digitizing data of plants in phytomer scale; (5) manual measurement of leaf length, leaf width, sheath length, and internode length of the plants; (6) registration and segmentation of 3D point clouds of each plant from 3D scanning; (7) reconstruction of 3D point clouds of maize plant from MVS images; (8) evaluation of the accuracy of 3D point clouds between 3D scanning and MVS; (9) extraction of phenotypic parameters of maize plant structure from 3D point clouds and 3D digitizing; and (10) evaluation of the accuracy of phenotypic parameters from 3D point clouds, 3D digitizing and manual measurement.
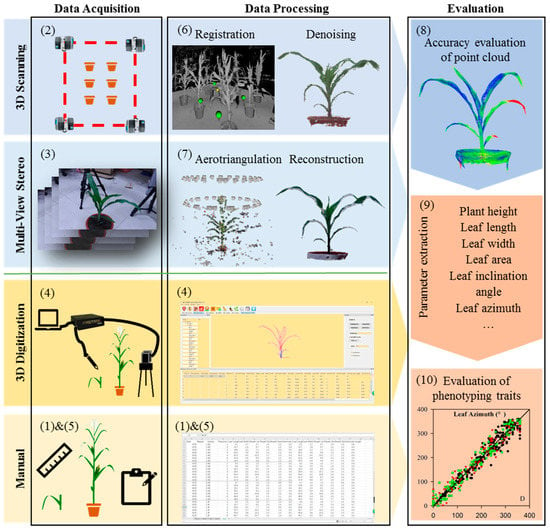
Figure 1.
Workflow of data acquisition, processing, and evaluation of phenotypic parameters of maize plants.
2.2. Plant Material and Sampling
The field experiment was conducted from June to July in 2018 at the experimental field in Beijing Academy of Agriculture and Forestry Sciences (39°56′N, 116°16′E). Three maize hybrids labeled AiDan268 (AD268), JingKe968 (JK968), and ZhengDan958 (ZD958) were planted in nine plots with three replicates for each, respectively. The planting density of these nine plots was 6 plants/m2, where the row spacing was 60 cm. Each plot consisted of 15 lines, and the plot size was 90 m2 (10 m × 9 m). Leaf ages were marked on the 5th and 10th leaves using red spray paint. The soil was tilled to a depth of 15 cm before sowing, and the soil texture was loamy sand with a field capacity of 32% in the plow layer. Other chemical properties of the plow layer are as follows: 27.2 g kg−1 organic matter, 1.34 g kg−1 total N, 37.6 mg kg−1 available phosphorus, 91 mg kg−1 ammonium acetate extractable potassium, and the pH of the soil was 7.6.
At the growth stage V5 (20th day after sowing), V15 (50th day after sowing), and R1 (80th day after sowing) [34], one maize plant in each plot was selected (nine plants of each growth stage in total, containing three hybrids and three plants for each hybrid). Table 1 summarizes an intuitive description of selected plants, including the averaged leaf number and plant height in three growth stages. Specifically, AD268 plants in R1 stage were much smaller than the other two hybrid plants. To identify the azimuth direction in field, the selected plants were marked towards north at the base of the stems. Then the plants were excavated into pots with underground parts, containing a soil and roots cylinder of 30 cm diameter and a depth of 25 cm. To assure the morphological stablility for a short time, the sampled plants were watered immediately.

Table 1.
Morphological description of three hybrids maize plants at three growth stages.
2.3. Data Acquisition and Processing
The pots loaded with plants were transported into indoor labs (the roof was higher than all the selected plants) to prevent subtle air flow, which would affect the morphological stability of plant leaves. The sequence of data acquisition of target plants was strictly in accordance with that mentioned in Section 2.1. The leaf angle measurement, 3D scanning, and MVS imaging acquisition occupy the highest priority to prevent water loss, which may lead to the change in morphological characteristics of plants, especially for V5 stage plants. Detailed description of 3D scanning, MVS imaging, 3D digitizing, and manual measurement processes was introduced as discussed in the following sections.
2.3.1. Three-Dimensional Scanning
Terrestrial laser scanning (TLS) offers a potential solution for rapid and accurate solution for the plant’s 3D structure [35]. Herein, FARO Focus3D S120 (FARO, Lake Mary, Florida, USA) 3D scanner was used to obtain the point clouds. This scanner is featured as portable, scanning rapidly with high resolution. To improve the scanning efficiency, nine plants (arranged in three rows and three plants in each row) at V5 stage, whereas six plants (arranged in two rows and three plants in each row) at V15 and R1 stages, were measured together as a group. 0–90° scan view oriented to the target plants and four stations around the plants were set up for a group of plants. Five calibration balls were arranged at different heights for later point cloud registration, connecting the four scan stations together as an integral group. It took about 30 min to scan a group. Thus the average time spent on an individual plant was 3.3 min for V5 stage, and 5 min for V15 and R1 stages, respectively. The supporting software of the scanner SCENE 6.2 (FARO, Lake Mary, Florida, USA) was used to register the point clouds of a group. Point clouds procedures, including denoising, resampling, mesh reconstruction, hole filling and phenotypic parameter extraction were processed by using Geomagic Studio 2013 (3D system, Morrisville, NC, USA) and CloudCompare (2.10.beta, http://www.cloudcompare.org/). The extracted phenotypic parameters include leaf length, leaf width, leaf area, leaf inclination angle, leaf azimuth angle, leaf curvature, plant volume, and plant height. ‘Point list picking’ tool in CloudCompare was used to pick vein curve points and width points manually for each leaf. Then the parameters were calculated by using the coordinates of picking points and algorithms in our previously developed software MaizeTypeAns (NERCITA, Beijing, China) [30].
2.3.2. Multi-View Stereo Image Acquisition
Recent advances in MVS technology can lead to the reconstruction of 3D plant structure using image sequences from multi-view angles [28]. We acquired the MVS image sequences of each selected plant. Multi-view images were captured by evenly moving one or two Canon 700D DSLR cameras with Canon EF-S 24 mm f/2.8 lens (Canon, Tokyo, Japan). Based on the plant size mentioned in Table 1, maize plants were photographed as a single layer at V5 stage and as a double layer at V15 stage. At R1 stage, AD268 could be photographed as double layer (this hybrid was much shorter than the other two hybrids, see Table 1), while JK968 and ZD958 were too high to be photographed as double layer. Therefore, individual plants of these two hybrids were divided into two parts following which lower part was photographed as double layer. The upper part was photographed as another extra single layer. Two markers were bound on the common sections of the to be truncated plants as the registration substance of later combination of the two parts. The maize plants were truncated because of the room height (310 cm) and the limitation of camera view (must be 30–40 cm higher than plant height). If the room is high enough, there is no need to truncate the plants. However, the extra layer must be considered due to the limitation of camera view. The cameras were held up at higher positions using a support, and a wireless shutter was used to control the image acquisition. The optimal distance between the camera and the plant was around 50 cm, and the camera was positioned at 80 cm height as well as 45° look-down towards the plant at V5 stage. At V15 and R1 stages, the distance between the camera and the plant was around 150 cm, and the cameras were positioned at 130 cm and 260 cm height of the two corresponding layers as well as 45° looking-down towards the target area of the plant. Each group of images consisted of 30–40 images for V5 stage, 60–80 images for V15 stage, and 90–120 images for R1 stage. The averaged time spent on acquiring the images of an individual plant was 1.5 min for V5 stage, 2 min for V15 stage, and 4 min for R1 stage (the time spent on AD268 of R1 stage was 2 min). 3D point clouds reconstruction was performed by using PhotoScan software (Agisoft, St. Petersburg, Leningrad, Russia 2018), which is a commercial software that performs 3D reconstruction of objects based on MVS technology (Figure 2). The efficiency of PhotoScan was seriously affected by the number of images and quality setting in ‘Bulid Dense Cloud’. Moreover, the accuracy was affected by quality setting in ‘Aligning Photos’. To balance efficiency and accuracy, the software setting was ‘High’ in ‘Aligning Photos’, ‘Medium’ in ‘Bulid Dense Cloud’; and default in others. The reconstructed 3D point clouds were processed in the way similar to that of 3D scanning. Segmented point clouds of JK968 and ZD958 in R1 stage were registered using ‘Manual Registration’ in Geomagic Studio 2013 (3D system, Morrisville, NC, USA). The parameters extraction of point clouds was performed in a way similar to that in 3D Scanning.
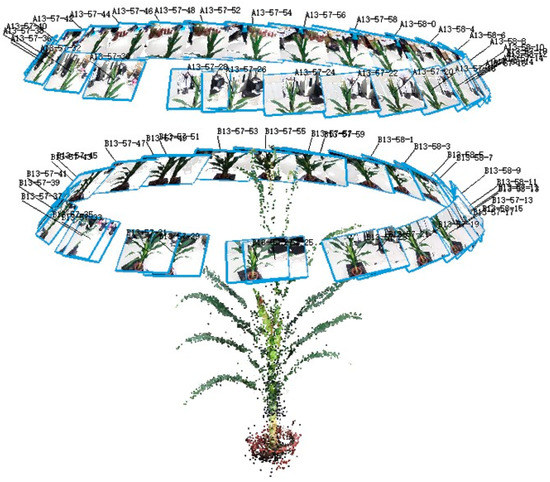
Figure 2.
Diagram of MVS reconstruction using PhotoScan.
2.3.3. Three-Dimensional Digitizing
3D digitizer, an electromagnetic device that could measure the location and orientation of target objects, is a popular approach to characterize the feature points in 3D space, and especially fits for branch structured plants [31,36]. In this study, Fastrak 3D digitizer (Polhemus, Colchester, VT, USA) combined with Tx4 emitter was used to obtain the 3D featured points of the selected plants. Each 3D coordinate of the featured point was acquired by a free-moving pen operated manually. 3D digitizing principle was formulated for the basic phytomer unit, as shown in Figure 3. A phytomer is composed of a node, an internode, a sheath, and a blade. The 3D digitizing of a phytomer started from the node, i.e., the growth point of the sheath. The first point was the bottom of the sheath. Further, three points were recorded clockwise around the sheath at the quarter position points, and the fifth point overlapped with the first point. The following sixth and seventh points were recorded at middle and top of the sheath, respectively. Then the blade vein was digitalized with appropriate distance, generally about 5 cm step length. The step length was appropriately reduced at bending positions to promise the curving shape of the vein described accurately. Finally, three points were recorded along the widest section of leaf perpendicular to the vein direction. The phytomer acquisition procedure of the individual plant was conducted from lower to upper leaves, and lower sheath and blade of a phytomer were peeled off to release the sheath and blade of the next phytomer. Tassel and ears were also digitized as independent organs parallel to the phytomers. It took about 5, 15, and 20 min of an individual plant at V5, V15, and R1 stages, respectively. The emitter and plant should remain relatively static during the data acquisition process. Metal objects were forbidden to appear around the emitter because metal would affect the magnetic field of the digitizer. 3D digitizing visualization, processing, and phenotyping traits estimation were conducted by using our previously developed software MaizeTypeAns [30] for maize plants. Figure 3 shows the 3D digitizing visualization result of maize plants in three growth stages.
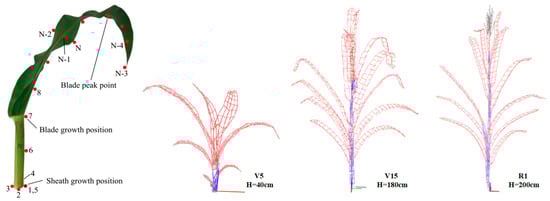
Figure 3.
3D digitizing principle of a phytomer and three 3D digitizing visualization result of maize plants at three growth stages.
2.3.4. Manual Measurement
The leaf angle, leaf azimuth, and plant height were measured manually at the first step before 3D laser scanning; while the leaf length, leaf width of each phytomer were measured manually at the last step after 3D digitizing.
3. Results
3.1. Evaluation of Data Acquisition and Processing Efficiency
A comprehensive comparison of 3D scanning, MVS reconstruction, 3D digitizing, and manual measurement is summarized in Table 2, including the costs of related instruments, data acquisition efficiency, data analysis difficulty, phenotyping traits accuracy, automation degree, etc.
Table 2.
Comparative analysis of different phenotyping approaches for maize plant.
3D scanning is an automatic and non-destructive approach to acquire the 3D point clouds of maize plants. The device is very portable to take along and needs little preparation. Supporting software for data acquisition and processing are easy to operate. There is little stochastic error affected by human operation. Point cloud registration has to be conducted after the scanning to obtain complete point clouds of plants. The time spent on data acquisition and processing was acceptable. It took an average of 5 min to acquire the point cloud of a maize plant. However, the depending device and software were relatively expensive compared to that in other approaches. The phenotyping parameter extraction procedure is not highly automatic and takes longer time. 3D scanning is a better choice for affiliations with adequate budgets. Further point cloud processing and phenotyping traits extraction software needs to be developed for high throughput phenotyping applications.
MVS reconstruction provides an independent way to acquire the 3D point clouds of individual maize plants. Only low-cost cameras are necessary in the data acquisition procedure. There is little stochastic error affected by human operation. The time spent on data acquisition and processing was also acceptable. It took almost 4 min to acquire the image sequences of a maize plant. MVS reconstruction was performed to obtain the point cloud after the image acquisition. Open source alternatives are available to reconstruct the 3D point cloud using the acquired images instead of the commercial software, such as VisualSFM [37]. Therefore, MVS reconstruction is a good choice to develop affordable phenotyping platforms [38]. However, there is a risk that incorrect operation, such as insufficient overlap or deficient images, may lead to the failure of reconstruction. Positions for acquiring photographs (at different heights and azimuth) and camera settings have to be specified; therefore, the preparation time of MVS image acquisition is relatively long.
Though the 3D digitizing data acquisition of maize plants was quite labor intensive and time-consuming, plant skeleton with explicit semantics was obtained directly for phenotyping analysis. The cost of equipment used was acceptable and data acquisition process was very simple to operate. Comparing with the 3D scanning and MVS reconstruction which generate point cloud as the raw data, post-processing such as point cloud resampling and skeleton extraction could be skipped. However, the obtained data were significantly affected by human operation and the device was strictly restricted by the metal-like surroundings. 3D digitizing is quite suitable for field plant phenotyping.
3.2. Evaluation of Three-Dimensional Point Cloud Accuracy of Maize Plants
Point clouds were obtained in both 3D scanning and MVS reconstruction. Thus the accuracy of these two approaches was evaluated by comparing the acquired point clouds of the three hybrids plants in three growth stages. Figure 4, Figure 5 and Figure 6 illustrate the visualization of the point clouds derived by 3D scanning and MVS reconstruction. Clearly, MVS reconstruction shows better result than 3D scanning of small plants (V5 stage), as the thinner leaves are rather unstable and may wave during the entire data acquisition process (nine plants were scanned together for totally about 30 min in 3D scanning process while only one plant took 1.5 min in MVS image acquisition). In contrast, significant differences between the two approaches were not observed for medium and higher plants (V15 and R1 stages). Point cloud distances were estimated by “cloud→cloud dist” tool in CloudCompare (2.10.beta, http://www.cloudcompare.org/), which is an open source project of 3D point cloud and mesh processing. More deviations were observed in upper parts of JK968 and ZD958 at V15 and R1 stages. This is attributed to the fact that the plants of these two hybrids in the later growth stages were too tall and the image acquisition for MVS reconstruction was performed twice, including three layers. Therefore, when accuracy is the major indicator to be considered, it is advised that MVS reconstruction is more suitable for early growth stage maize plants and 3D scanning obtains better results for later growth stage maize plants.
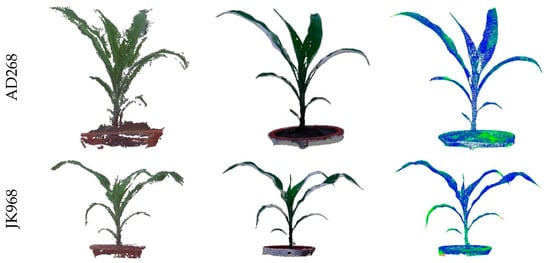
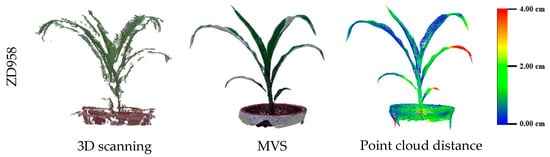
Figure 4.
Maize plants point clouds comparison derived using 3D scanning and MVS reconstruction at V5 stage (20th day after sowing).
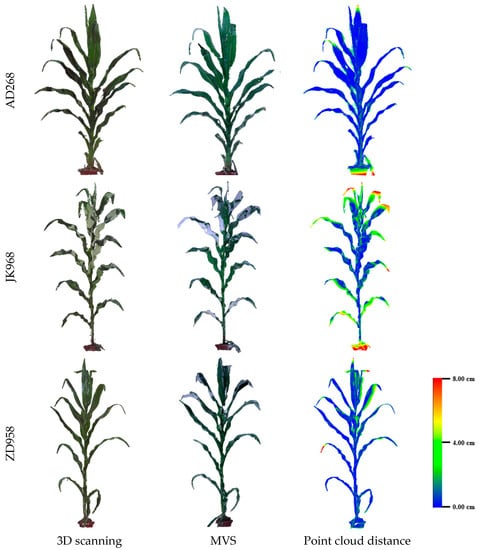
Figure 5.
Maize plants point clouds comparison derived using 3D scanning and MVS reconstruction at V15 stage (50th day after sowing).
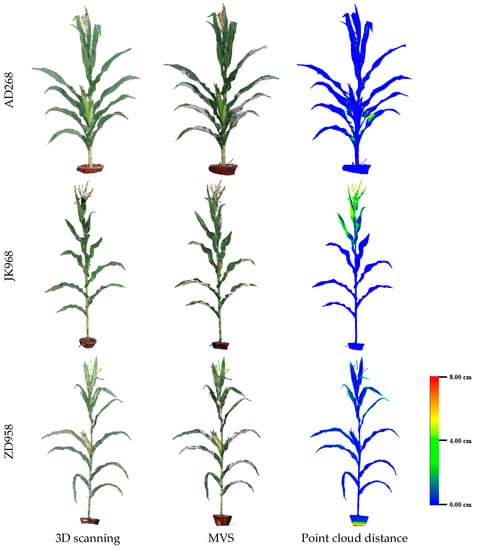
Figure 6.
Maize plants point clouds comparison derived using 3D scanning and MVS reconstruction at R1 stage (80th day after sowing).
3.3. Evaluation of Three-Dimensional Phenotypic Parameter
Furthermore, the commonly used phenotyping parameters, including leaf length, leaf width, leaf inclination angle, leaf azimuth, leaf area, plant height, normalized volume, and leaf curvature were also evaluated. These parameters were estimated according to procedures mentioned in literature reports [17,30]. The first six parameters (Figure 7), containing the four data acquisition forms, including 3D scanning, MVS reconstruction, 3D digitizing, and manual measurement, where the manual measured parameters were considered as the ground truth, were compared. Corresponding correlation coefficient (R2) and root mean square error (RMSE) are listed in Table 3. 3D digitizing was more accurate compared to 3D scanning and MVS reconstruction when calculating leaf length. The main reason for the difference was the points missing of blade tip during point cloud reconstruction and post-processing. 3D digitizing was also more accurate in calculating leaf width when leaf width was less than 10 cm. The difference below 10 cm was caused by points missing at blade edges. However, leaf widths obtained by the three methods appeared shorter than the actual measured value, when leaf width was greater than 10 cm. The result was attributed to the leaf rolling at edge, and the 3D measurement methods could not capture these small deformations. For leaf inclination angle and azimuth, no significant differences were found among the three approaches. The main reason was that point clouds loss did not affect angle extraction, and the high RMSE of leaf angle derived by the three approaches was caused by stochastic measurement errors. For leaf areas, the deviations were accumulated by both leaf length and leaf width. For plant height, 3D digitizing performed more positively than 3D scanning and MVS, in particular, at R1 stage. This is attributed to the fact that point cloud loss of tassels in 3D scanning and MVS reconstruction led to shorter plant height estimation. In summary, averaged R2 of the six concerned traits is in the following order: 3D digitizing (0.941) > MVS reconstruction (0.912) > 3D scanning (0.906). This indicates that parameters extracted by 3D digitizing were more accurate than point clouds derived from 3D scanning and MVS reconstruction. There were no significant differences between MVS reconstruction and 3D scanning.
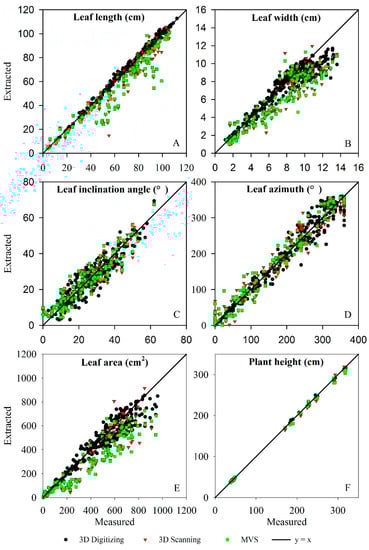
Figure 7.
Phenotyping parameter evaluation derived by 3D scanning, MVS reconstruction, 3D digitizing, and manual measurement. The samples used contain all three hybrid plants in three growth stages. Evaluated parameters include (A) leaf length, (B) leaf width, (C) leaf inclination angle, (D) leaf azimuth, (E) leaf area, and (F) plant height.
Table 3.
Correlation coefficient (R2) and root mean square error (RMSE) of phenotyping parameters derived by 3D scanning, MVS reconstruction, and 3D digitizing as presented in Figure 7.
Moreover, the normalized volume of the plants and leaf curvature directly estimated by the 3D scanning and MVS reconstructed point clouds were compared to evaluate the phenotypic differences caused by the two approaches (Figure 8). The normalized volume was estimated as follows:
where Vmax and Vmin are the maximum and minimum volumes of all the sampled plants in the same growth stage, respectively, and Vi is the ith sampled plant volume. A significant reduction was observed in 3D scanning normalized volume at V5 stage compared to MVS reconstruction. It was mainly caused by the poor quality of the point cloud obtained by 3D scanning at V5 stage for which plants were small. No significant differences were acquired for leaf curvature derived from 3D scanning and MVS reconstruction.
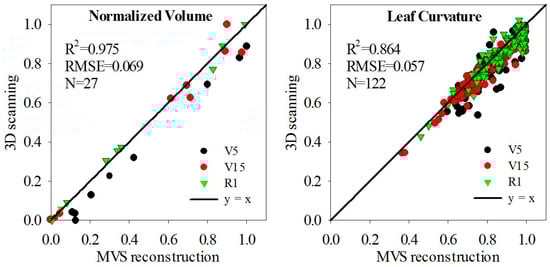
Figure 8.
Normalized volume and leaf curvature comparison derived by 3D scanning and MVS reconstruction point clouds.
4. Discussion
4.1. Evaluation of Efficiency and Accuracy
In this study, three representative morphological data acquisition approaches were selected to evaluate their performance in maize plant phenotyping. 3D scanning, as an automatic approach with high accuracy, performs well for later growth stage plants, i.e., higher plants. However, it does not perform well for early growth stage plants, i.e., shorter plants. Though several plants could be scanned together to improve the average efficiency of individual plants, 3D scanning still requires relatively long time for data acquisition. Nonetheless, the results only reflected the equipment used for the research, and using higher class laser scanner could probably provide better results. MVS reconstruction exhibited the highest data acquisition efficiency and performed well for small plants. However, significant deviations were observed in upper parts of higher plants. This issue can be resolved by designing robotic arms [22], which carries the camera to higher position and provides a more stable support. For field crops and dense vegetation structure, illumination problem was also very important for MVS reconstruction. Low contrast and dim light images may lead to point cloud missing or reconstruction failure. It can be improved by partly using image enhancement techniques. Point clouds were obtained by 3D scanning or MVS reconstruction. Some of the morphological details of the acquired point clouds were not so satisfactory for phenotyping applications, such as key point loss at the end of the leaves and blur points at leaf edges and tassel ends. Thus post-processing approaches, such as point cloud resampling [39], skeleton extraction [40], and mesh reconstruction [41], have to be applied and improved to extract the phenotyping traits of maize plants. Compared to 3D scanning and MVS reconstruction, 3D digitizing sacrificed data acquisition efficiency for simple post-processing, and obtained reliable results for phenotyping (Figure 7 and Table 3). Thus the efficiency of 3D digitizing was quite low and morphological data with clear semantics of plants could be obtained. However, 3D digitizing could be used as verification for other 3D phenotyping approaches due to its promising accuracy. Moreover, there is efficiency improvement potential for point cloud analysis by developing suitable software, such as automatic point cloud skeleton extraction and automatic parameter extraction. Comparing with other 3D data acquisition approaches, such as 2D LiDAR synthesis [23] and TOF sensors [25], the three approaches examined in this study are capable of acquiring 3D morphological data of maize plants with a wide range of heights, though they perform in a diverse manner for small and upper parts of the plants.
4.2. Potential Application in Phenotyping Platforms
At present, the indoor phenotyping platforms [17,19,42] of individual maize plants are relatively mature. Ideal environment could be promised in these platforms, such as appropriate lights for imaging, stable air flow, and reliable conveyors. However, indoor plants show diverse morphology as in field, and cannot present the environmental adaptability of specified genes [43,44]. Thus field plant phenotyping [45] is more significant for genetic breeders. Although canopy and plot scale platforms have been developed to derive canopy scale morphological traits, field phenotyping platforms for individual plants still need to be improved urgently, in particular, for high-throughput and more detailed traits in plant and organ scale [12]. Comparative analysis of the accuracy, efficiency, automation, and cost of the three approaches evaluated in this study, it indicates that MVS reconstruction has a great potential in field phenotyping platforms for individual plants. “One by one” plant data acquisition pattern and efficiency of MVS coincides with the high-throughput phenotyping requirement. The cost of MVS is highly suitable for affordable and portable platforms [38]. Post-processing software and robust algorithms should be developed for the reconstructed point clouds of MVS to improve the accuracy of phenotyping parameter extraction in the platforms. A reasonable question for such platform is the choice between rotating the plant or rotating the camera. In our experiment, rotating the plant might shake the leaves and cause more noise in the reconstructed point clouds. Thus, rotating the camera and keeping the plant still is a better choice for the platforms to be developed.
5. Conclusions
This study evaluated three representative 3D phenotyping approaches of maize plants, including 3D laser scanning, MVS reconstruction, and 3D digitizing. 3D laser scanning depends on expensive devices to automatically acquire 3D point clouds with acceptable efficiency. This technique showed good performance for higher plants and unsatisfactory point clouds for smaller plants. MVS reconstruction exhibited the highest efficiency among the three investigated approaches. Compared to 3D scanning, it acquired better point clouds for smaller plants, while it obtained significant deviation in upper parts of higher plants. The low cost and one by one plant pipeline data acquisition pattern allows the MVS reconstruction to be a better choice for affordable and portable field phenotyping platforms. Advanced point cloud processing technologies are definitely needed to improve the accuracy of phenotyping traits extraction for both 3D scanning and MVS reconstruction. 3D digitizing is the most time-consuming and labor intensive among the three approaches. However, it does not depend on any post-processing algorithms to extract phenotyping traits and reliable phenotyping results could be obtained. The promising accuracy of 3D digitizing provides a reasonable way of verification for other 3D phenotyping approaches.
Author Contributions
Data curation, Y.W. and Z.Y.; Funding acquisition, X.G.; Methodology, Y.W. and W.W.; Software, S.W. and C.W.; Supervision, C.Z.; Validation, Z.Y.; Visualization, S.W.; Writing—original draft, Y.W. and W.W.; Writing—review & editing, W.W. and X.G.
Funding
This research was funded by the National Natural Science Foundation of China, grant number 31601215 and 31501226, Science and Technology Innovation Special Construction Funded Program of Beijing Academy of Agriculture and Forestry Sciences, grant number KJCX20180423, and Scientific and Technological Innovation Team of Beijing Academy of Agricultural and Forestry Sciences, grant number JNKYT201604.
Conflicts of Interest
The authors declare no conflict of interest.
References
- Tester, M.; Langridge, P. Breeding technologies to increase crop production in a changing world. Science 2010, 327, 818–822. [Google Scholar] [CrossRef] [PubMed]
- Araus, J.L.; Kefauver, S.C.; Zaman-Allah, M.; Olsen, M.S.; Cairns, J.E. Translating high-throughput phenotyping into genetic gain. Trends Plant Sci. 2018, 23, 451–466. [Google Scholar] [CrossRef] [PubMed]
- Watson, A.; Ghosh, S.; Williams, M.J.; Cuddy, W.S.; Simmonds, J.; Rey, M.D.; Hatta, M.A.M.; Hinchliffe, A.; Steed, A.; Reynolds, D.; et al. Speed breeding is a powerful tool to accelerate crop research and breeding. Nat. Plants 2018, 4, 23–29. [Google Scholar] [CrossRef] [PubMed]
- Fiorani, F.; Schurr, U. Future scenarios for plant phenotyping. Annu. Rev. Plant Biol. 2013, 64, 267–291. [Google Scholar] [CrossRef] [PubMed]
- Fahlgren, N.; Gehan, M.A.; Baxter, I. Lights, camera, action: High-throughput plant phenotyping is ready for a close-up. Curr. Opin. Plant Biol. 2015, 24, 93–99. [Google Scholar] [CrossRef]
- Andujar, D.; Calle, M.; Fernandez-Quintanilla, C.; Ribeiro, A.; Dorado, J. Three-dimensional modeling of weed plants using low-cost photogrammetry. Sensors 2018, 18, 1077. [Google Scholar] [CrossRef]
- Tardieu, F.; Cabrera-Bosquet, L.; Pridmore, T.; Bennett, M. Plant phenomics, from sensors to knowledge. Curr. Biol. 2017, 27, R770–R783. [Google Scholar] [CrossRef]
- Yang, G.J.; Liu, J.G.; Zhao, C.J.; Li, Z.H.; Huang, Y.B.; Yu, H.Y.; Xu, B.; Yang, X.D.; Zhu, D.M.; Zhang, X.Y.; et al. Unmanned aerial vehicle remote sensing for field-based crop phenotyping: Current status and perspectives. Front. Plant Sci. 2017, 8, 26. [Google Scholar] [CrossRef]
- Liu, S.Y.; Baret, F.; Abichou, M.; Boudon, F.; Thomas, S.; Zhao, K.G.; Fournier, C.; Andrieu, B.; Irfan, K.; Hemmerle, M.; et al. Estimating wheat green area index from ground-based lidar measurement using a 3d canopy structure model. Agr. For. Meteorol. 2017, 247, 12–20. [Google Scholar] [CrossRef]
- Sun, S.P.; Li, C.Y.; Paterson, A.H.; Jiang, Y.; Xu, R.; Robertson, J.S.; Snider, J.L.; Chee, P.W. In-field high throughput phenotyping and cotton plant growth analysis using lidar. Front. Plant Sci. 2018, 9, 17. [Google Scholar] [CrossRef]
- Jimenez-Berni, J.A.; Deery, D.M.; Rozas-Larraondo, P.; Condon, A.G.; Rebetzke, G.J.; James, R.A.; Bovill, W.D.; Furbank, R.T.; Sirault, X.R.R. High throughput determination of plant height, ground cover, and above-ground biomass in wheat with lidar. Front. Plant Sci. 2018, 9, 18. [Google Scholar] [CrossRef] [PubMed]
- Young, S.N.; Kayacan, E.; Peschel, J.M. Design and field evaluation of a ground robot for high-throughput phenotyping of energy sorghum. Precis. Agric. 2018, 1–26. [Google Scholar] [CrossRef]
- Virlet, N.; Sabermanesh, K.; Sadeghi-Tehran, P.; Hawkesford, M.J. Field scanalyzer: An automated robotic field phenotyping platform for detailed crop monitoring. Funct. Plant Biol. 2017, 44, 143–153. [Google Scholar] [CrossRef]
- Du, J.J.; Zhang, Y.; Guo, X.Y.; Ma, L.M.; Shao, M.; Pan, X.D.; Zhao, C.J. Micron-scale phenotyping quantification and three-dimensional microstructure reconstruction of vascular bundles within maize stalks based on micro-ct scanning. Funct. Plant Biol. 2017, 44, 10–22. [Google Scholar] [CrossRef]
- Zhang, Y.; Ma, L.; Pan, X.; Wang, J.; Guo, X.; Du, J. Micron-scale phenotyping techniques of maize vascular bundles based on X-ray microcomputed tomography. JoVE 2018, e58501. [Google Scholar] [CrossRef] [PubMed]
- Yan, J.B.; Warburton, M.; Crouch, J. Association mapping for enhancing maize (Zea mays L.) genetic improvement. Crop Sci. 2011, 51, 433–449. [Google Scholar] [CrossRef]
- Zhang, X.H.; Huang, C.L.; Wu, D.; Qiao, F.; Li, W.Q.; Duan, L.F.; Wang, K.; Xiao, Y.J.; Chen, G.X.; Liu, Q.; et al. High-throughput phenotyping and qtl mapping reveals the genetic architecture of maize plant growth. Plant Physiol. 2017, 173, 1554–1564. [Google Scholar] [CrossRef]
- Chen, T.-W.; Cabrera-Bosquet, L.; Alvarez Prado, S.; Perez, R.; Artzet, S.; Pradal, C.; Coupel-Ledru, A.; Fournier, C.; Tardieu, F. Genetic and environmental dissection of biomass accumulation in multi-genotype maize canopies. J. Exp. Bot. 2018, 12. [Google Scholar] [CrossRef]
- Cabrera-Bosquet, L.; Fournier, C.; Brichet, N.; Welcker, C.; Suard, B.; Tardieu, F. High-throughput estimation of incident light, light interception and radiation-use efficiency of thousands of plants in a phenotyping platform. New Phytol. 2016, 212, 269–281. [Google Scholar] [CrossRef]
- Junker, A.; Muraya, M.M.; Weigelt-Fischer, K.; Arana-Ceballos, F.; Klukas, C.; Melchinger, A.E.; Meyer, R.C.; Riewe, D.; Altmann, T. Optimizing experimental procedures for quantitative evaluation of crop plant performance in high throughput phenotyping systems. Front. Plant Sci. 2015, 5, 21. [Google Scholar] [CrossRef]
- Brichet, N.; Fournier, C.; Turc, O.; Strauss, O.; Artzet, S.; Pradal, C.; Welcker, C.; Tardieu, F.; Cabrera-Bosquet, L. A robot-assisted imaging pipeline for tracking the growths of maize ear and silks in a high-throughput phenotyping platform. Plant Methods 2017, 13, 12. [Google Scholar] [CrossRef] [PubMed]
- Chaudhury, A.; Ward, C.; Talasaz, A.; Ivanov, A.G.; Brophy, M.; Grodzinski, B.; Huner, N.P.A.; Patel, R.V.; Barron, J.L. Machine vision system for 3d plant phenotyping. IEEE/ACM Trans. Comput. Biol. Bioinform. 2017. [Google Scholar] [CrossRef] [PubMed]
- Thapa, S.; Zhu, F.; Walia, H.; Yu, H.; Ge, Y. A novel lidar-based instrument for high-throughput, 3d measurement of morphological traits in maize and sorghum. Sensors 2018, 18, 1187. [Google Scholar] [CrossRef] [PubMed]
- Vazquez-Arellano, M.; Griepentrog, H.W.; Reiser, D.; Paraforos, D.S. 3-d imaging systems for agricultural applications-a review. Sensors 2016, 16, 618. [Google Scholar] [CrossRef] [PubMed]
- Chaivivatrakul, S.; Tang, L.; Dailey, M.N.; Nakarmi, A.D. Automatic morphological trait characterization for corn plants via 3d holographic reconstruction. Comput. Electron. Agric. 2014, 109, 109–123. [Google Scholar] [CrossRef]
- Vázquez-Arellano, M.; Reiser, D.; Paraforos, D.; Garrido-Izard, M.; Griepentrog, H. Leaf area estimation of reconstructed maize plants using a time-of-flight camera based on different scan directions. Robotics 2018, 7, 63. [Google Scholar] [CrossRef]
- Guan, H.; Liu, M.; Ma, X.; Yu, S. Three-dimensional reconstruction of soybean canopies using multisource imaging for phenotyping analysis. Remote Sens. 2018, 10, 1206. [Google Scholar] [CrossRef]
- Hui, F.; Zhu, J.; Hu, P.; Meng, L.; Zhu, B.; Guo, Y.; Li, B.; Ma, Y. Image-based dynamic quantification and high-accuracy 3d evaluation of canopy structure of plant populations. Ann. Bot. 2018, 121, 1079–1088. [Google Scholar] [CrossRef]
- Burgess, A.J.; Retkute, R.; Pound, M.P.; Mayes, S.; Murchie, E.H. Image-based 3d canopy reconstruction to determine potential productivity in complex multi-species crop systems. Ann. Bot. 2017, 119, 517–532. [Google Scholar] [CrossRef]
- Wen, W.; Guo, X.; Zhao, C.; Xiao, B.; Wang, Y. Research on maize plant type parameter extraction by using three dimensional digitizing data. Sci. Agric. Sin. 2018, 51, 1034–1044. [Google Scholar] [CrossRef]
- Sinoquet, H.; Thanisawanyangkura, S.; Mabrouk, H.; Kasemsap, P. Characterization of the light environment in canopies using 3d digitising and image processing. Ann. Bot. 1998, 82, 203–212. [Google Scholar] [CrossRef]
- Su, W.; Zhu, D.H.; Huang, J.X.; Guo, H. Estimation of the vertical leaf area profile of corn (Zea mays) plants using terrestrial laser scanning (TLS). Comput. Electron. Agric. 2018, 150, 5–13. [Google Scholar] [CrossRef]
- Garrido, M.; Paraforos, D.S.; Reiser, D.; Vazquez Arellano, M.; Griepentrog, H.W.; Valero, C. 3d maize plant reconstruction based on georeferenced overlapping lidar point clouds. Remote Sens. 2015, 7, 17077–17096. [Google Scholar] [CrossRef]
- Abendroth, L.J.; Elmore, R.W.; Matthew, J. Boyer; Marlay, S.K. Corn Growth and Development; PMR 1009; Iowa State University Extension: Ames, IA, USA, 2011. [Google Scholar]
- Lin, Y. Lidar: An important tool for next-generation phenotyping technology of high potential for plant phenomics? Comput. Electron. Agric. 2015, 119, 61–73. [Google Scholar] [CrossRef]
- Wen, W.; Guo, X.; Wang, Y.; Zhao, C.; Liao, W. Constructing a three-dimensional resource database of plants using measured in situ morphological data. Appl. Eng. Agric. 2017, 33, 747–756. [Google Scholar] [CrossRef]
- Wu, C. Visualsfm: A Visual Structure from Motion System. Available online: http://ccwu.me/vsfm/ (accessed on 11 June 2014).
- Armoniene, R.; Odilbekov, F.; Vivekanand, V.; Chawade, A. Affordable imaging lab for noninvasive analysis of biomass and early vigour in cereal crops. Biomed. Res. Int. 2018, 9. [Google Scholar] [CrossRef] [PubMed]
- Wen, W.; Li, B.; Li, B.-J.; Guo, X. A leaf modeling and multi-scale remeshing method for visual computation via hierarchical parametric vein and margin representation. Front. Plant Sci. 2018, 9. [Google Scholar] [CrossRef]
- Huang, H.; Wu, S.H.; Cohen-Or, D.; Gong, M.L.; Zhang, H.; Li, G.Q.; Chen, B.Q. L-1-medial skeleton of point cloud. ACM Trans. Graph. 2013, 32, 8. [Google Scholar] [CrossRef]
- Yin, K.X.; Huang, H.; Long, P.X.; Gaissinski, A.; Gong, M.L.; Sharf, A. Full 3d plant reconstruction via intrusive acquisition. Comput. Graph. Forum 2016, 35, 272–284. [Google Scholar] [CrossRef]
- Guo, Q.; Wu, F.; Pang, S.; Zhao, X.; Chen, L.; Liu, J.; Xue, B.; Xu, G.; Li, L.; Jing, H.; et al. Crop 3d: A platform based on lidar for 3d high-throughput crop phenotyping. Sci. Sin. 2016, 46, 1210–1221. [Google Scholar] [CrossRef]
- Xu, Y.B. Envirotyping for deciphering environmental impacts on crop plants. Theor. Appl. Genet. 2016, 129, 653–673. [Google Scholar] [CrossRef] [PubMed]
- Josephs, E.B. Determining the evolutionary forces shaping G × E. New Phytol. 2018, 219, 31–36. [Google Scholar] [CrossRef] [PubMed]
- Araus, J.L.; Cairns, J.E. Field high-throughput phenotyping: The new crop breeding frontier. Trends Plant Sci. 2014, 19, 52–61. [Google Scholar] [CrossRef] [PubMed]


© 2018 by the authors. Licensee MDPI, Basel, Switzerland. This article is an open access article distributed under the terms and conditions of the Creative Commons Attribution (CC BY) license (http://creativecommons.org/licenses/by/4.0/).