1. Introduction
China is a country whose main energy source is coal; coal resources account for more than 70% of China’s energy structure, and this pattern is expected to continue into the future. Goafs are formed after underground coal mining. The upper rock layers of goafs undergo deformation, bending, movement, and collapse under gravity, and the rock deformation spreads to the surface and results in surface subsidence basins. About 14 billion tons of coal are compressed under buildings, railways, and water-bodies in China; the extraction of these coal seams has theoretical and practical significance for the economic recovery of the coal resources and protection of ground structures [
1].
To monitor mining subsidence, geodetic technologies, which comprise total station surveying, precise leveling measurement, global navigation satellite system (GNSS), and GPS networks, have been used widely. These traditional methods suffer some limitations due to the need for long observation periods. Additionally, these methods are labor-intensive and costly. As a new earth observation technology, differential interferometry synthetic aperture RADAR (DInSAR) has many advantages, such as immunity to weather conditions, large-scale coverage, high spatial resolution, and repeated observation. Thus, DInSAR has been used in volcanic activity monitoring [
2,
3], landslip monitoring [
4], and seismic activity monitoring [
5]. In particular, DInSAR has been used to monitor surface deformation in mining areas. In particular, DInSAR has a high monitoring precision for residual surface subsidence caused by abandoned goafs. However, rapid deformations and sudden collapses in mining areas are difficult to monitor effectively with conventional DInSAR.
Since the Persistent Scatterer InSAR (PS-InSAR) [
6] was proposed in 2001, time series InSAR has been rapidly developed and widely used. There are, however, two disadvantages to PS-InSAR: (1) Permanent scatterers, which maintain a high coherence over the study period, are needed; (2) a large number of images (20–30) are required for statistical analysis, which limits application in non-urban areas. The use of the small baseline set (SBAS) was proposed by Berardino et al. [
7]. However, in this case, the resolution of images is reduced when coherent points are selected, and the interferograms are required to be unwrapped. PS-InSAR and SBAS minimize the limitations of traditional InSAR, which include atmospheric errors, orbit errors and terrain errors [
8,
9,
10,
11]. Referring to PS-InSAR and SBAS, numerous time series InSAR technologies have been proposed, such as StaMPS (Stanford Method for Persistent Scatterers) [
12], TCPInSAR (Temporarily Coherent Point InSAR) [
13,
14], IPTA [
15], CPT [
16], and so on. To improve the number of coherent points in non-urban areas, the use of distributed scatterers (DS) [
17] was proposed by Rocca et al. Further, SqueeSAR [
18], which combines permanent scatterers and distributed scatterers, was reported by Ferretti et al. Recently, researchers have studied the use of CAESAR (Component extrAction and sElection SAR) [
19] and PD-PSInSAR (phase decomposition based PS-InSAR) [
20]. Phase decomposition, variance matrix decomposition, and other methods are used to analyze the scattering mechanisms underlying spatial and temporal decoherence, and to obtain more permanent and distributed scatterers.
Surface subsidence caused by coal mining takes place over a significant timescale. The subsidence may last for several years or even decades. Therefore, time series InSAR technologies are used to obtain time series surface subsidence information in order to study the subsidence mechanism, land reclamation, and foundation stability. Accordingly, numerous researchers have applied time series InSAR to monitor subsidence in abandoned goaf areas [
21,
22]. Because of differences in energy structure, the exploitation of coal mines has gradually declined in North America, Europe and other regions. Time series InSAR technologies have been used to monitor the surface deformations due to coal mining in Germany [
23], England [
24], and other regions. For example, PSI was used by Cuenca et al. [
23] to study the relationship between the groundwater level of abandoned mines at the junction of the Netherlands, Belgium, and Germany, and to determine the surface deformation. The monitoring results indicated that the maximum deformation was most elevated (up to +220 mm) from 1992 to 2009. Intermittent SBAS-InSAR (ISBAS) [
24] was proposed by Bateson et al. and used to monitor the surface deformation of the South Wales coalfield from 1992 to 1999.
Coal resources continue to represent a large proportion of China’s energy structure, and deposits are widely distributed in central, western, and northwestern China. Many coal mines have been exploited, and there is a large incidence of surface subsidence. Time series InSAR has been used to monitor surface subsidence in coalfields such as Huaibei [
25], Yanzhou [
26], Yulin [
27], and Fengfeng [
28]. A method that combines DInSAR and probability integration was introduced by Fan et al. [
25] to monitor large-magnitude deformation in the Huaibei coalfield. Using DInSAR combined with Kalman filtering, the deformation of a highway in the Nantun coalfield region was analyzed by Zhao et al. [
26]. TCPInSAR was used by Fan et al. [
27] to monitor surface deformation in the Yulin mining area from October 2012 to March 2013. The results indicated that the maximum deformation reached −86 mm.
The application of time series InSAR for subsidence monitoring in mining areas remains limited by several challenges: (1) Surface subsidence caused by coal mining reveals unique characteristics, such as non-linearity, sudden collapse and huge subsidence, which results in erroneous phase unwrapping. Errors are introduced during the processing of the SBAS. (2) Coal mines are generally located below farmland; as a result, high-coherence point targets are scarce, as the land surface is covered by vegetation.
2. Study Area and Datasets
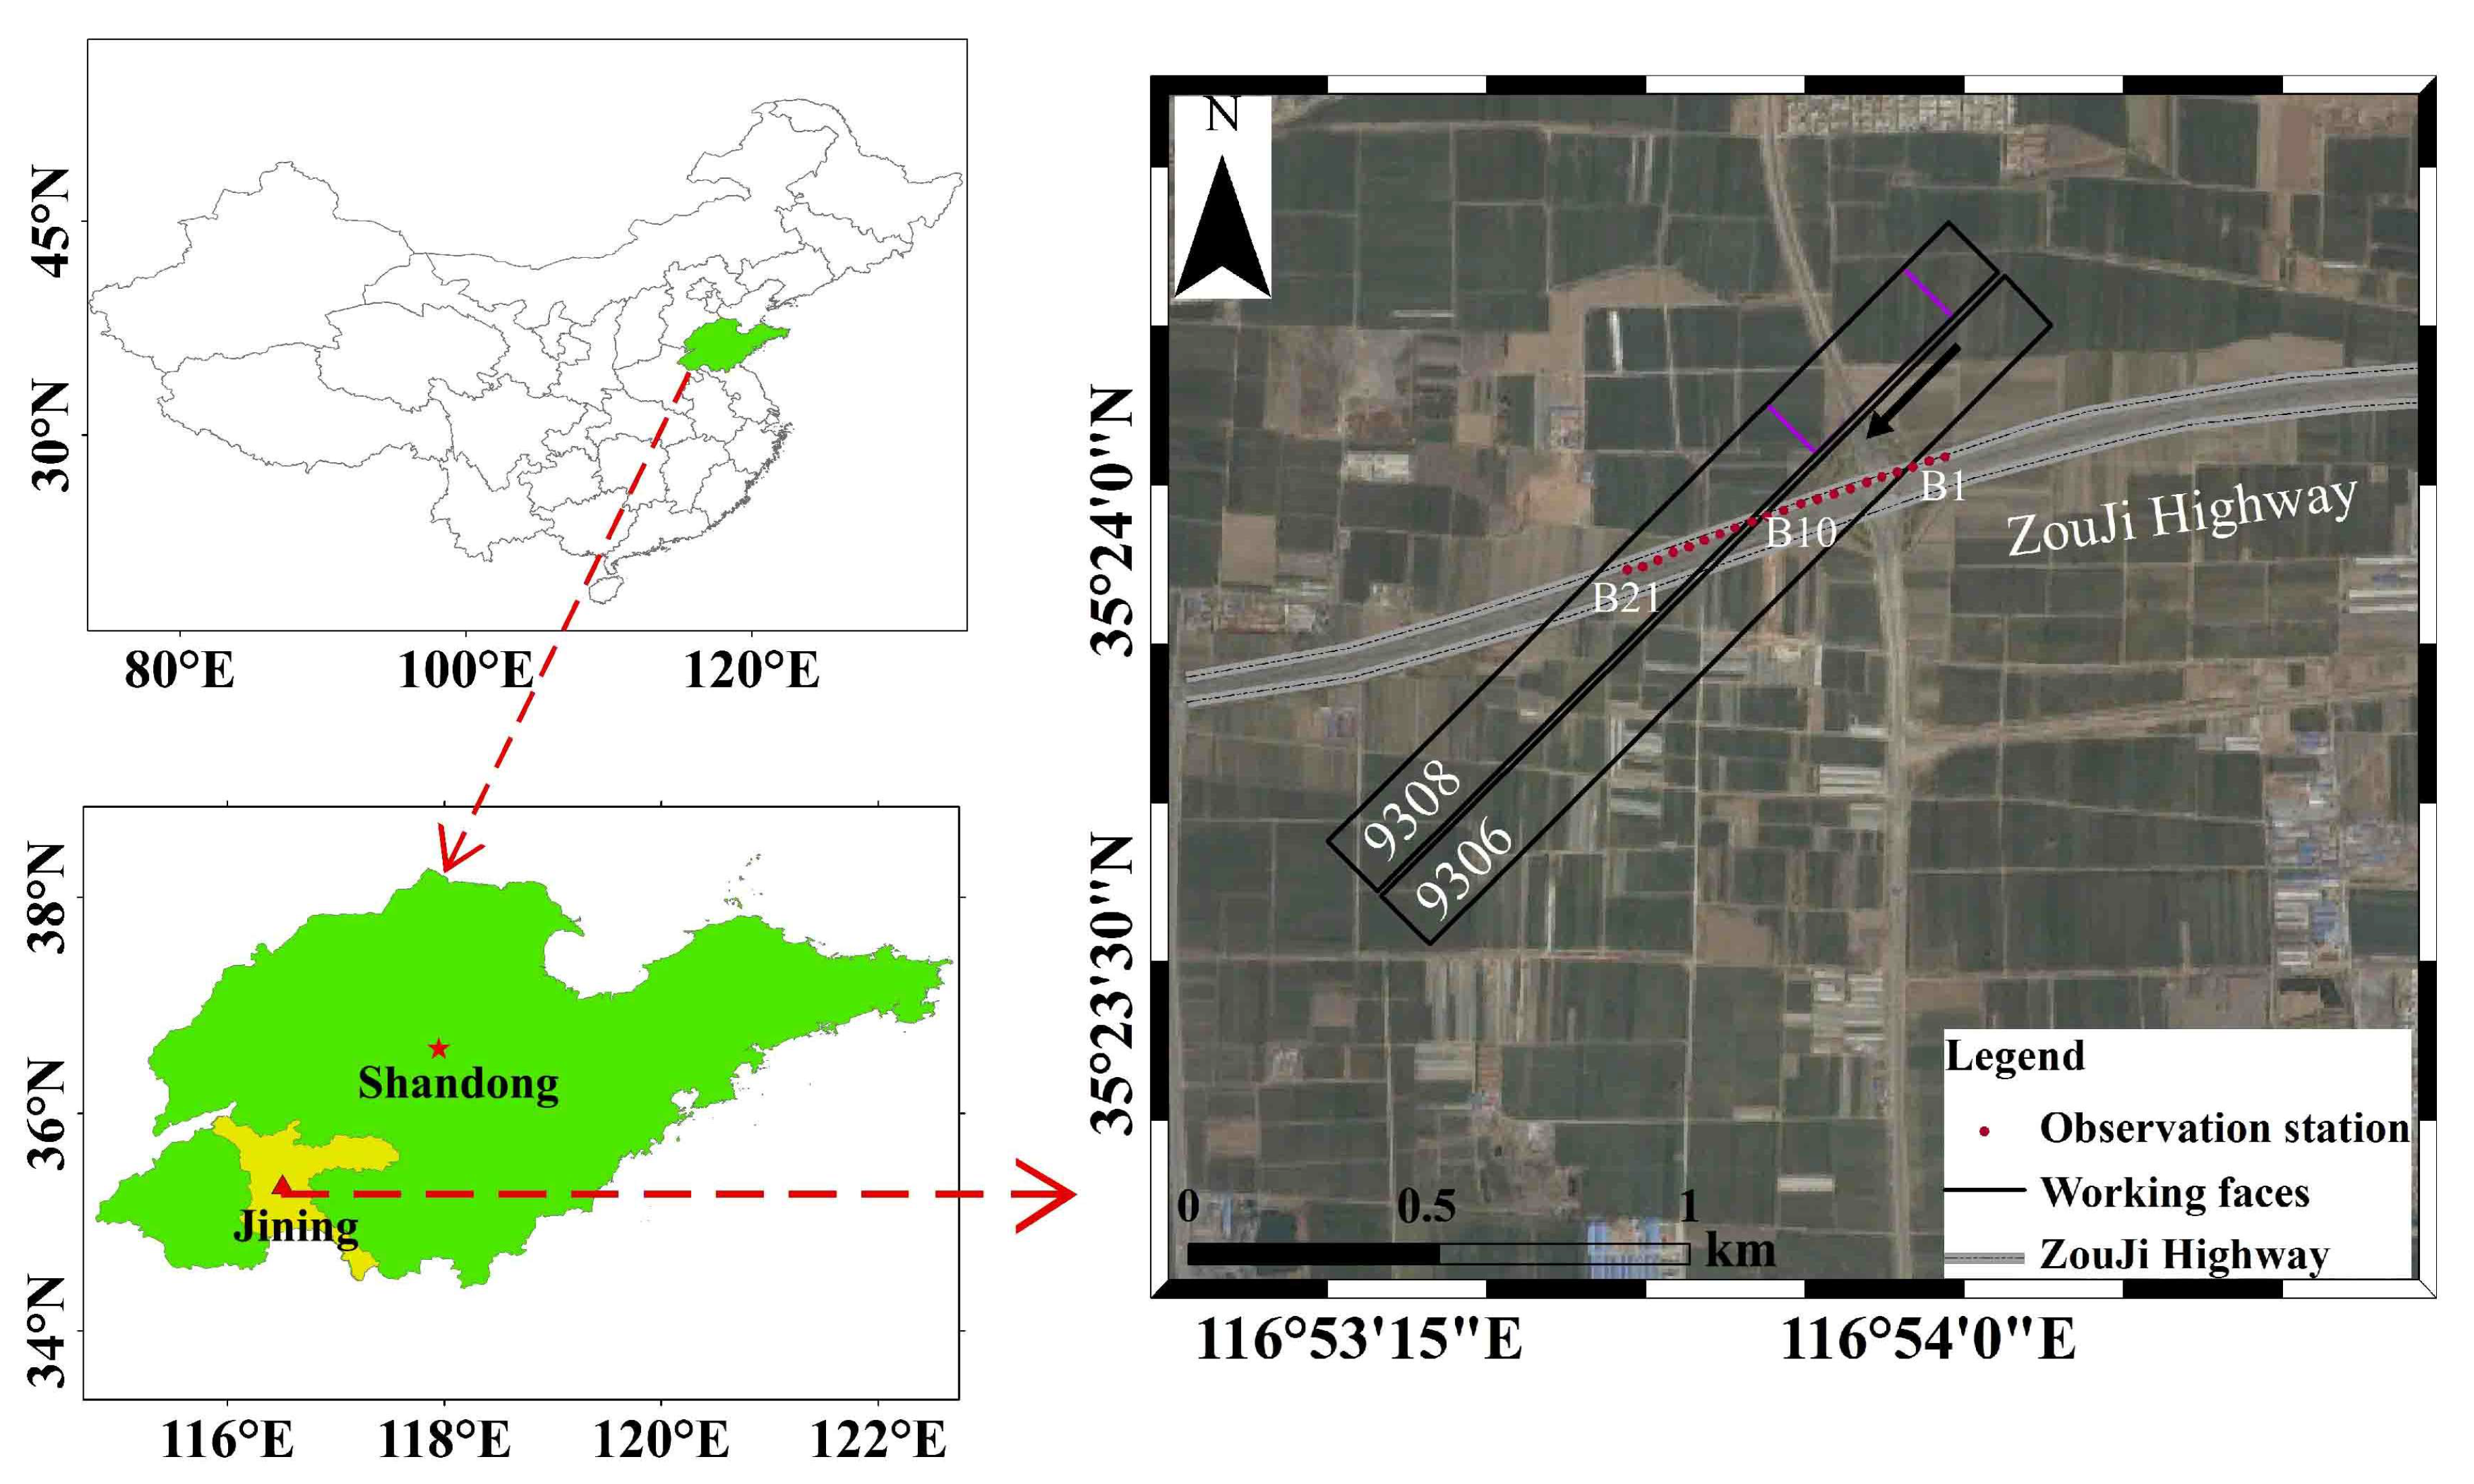
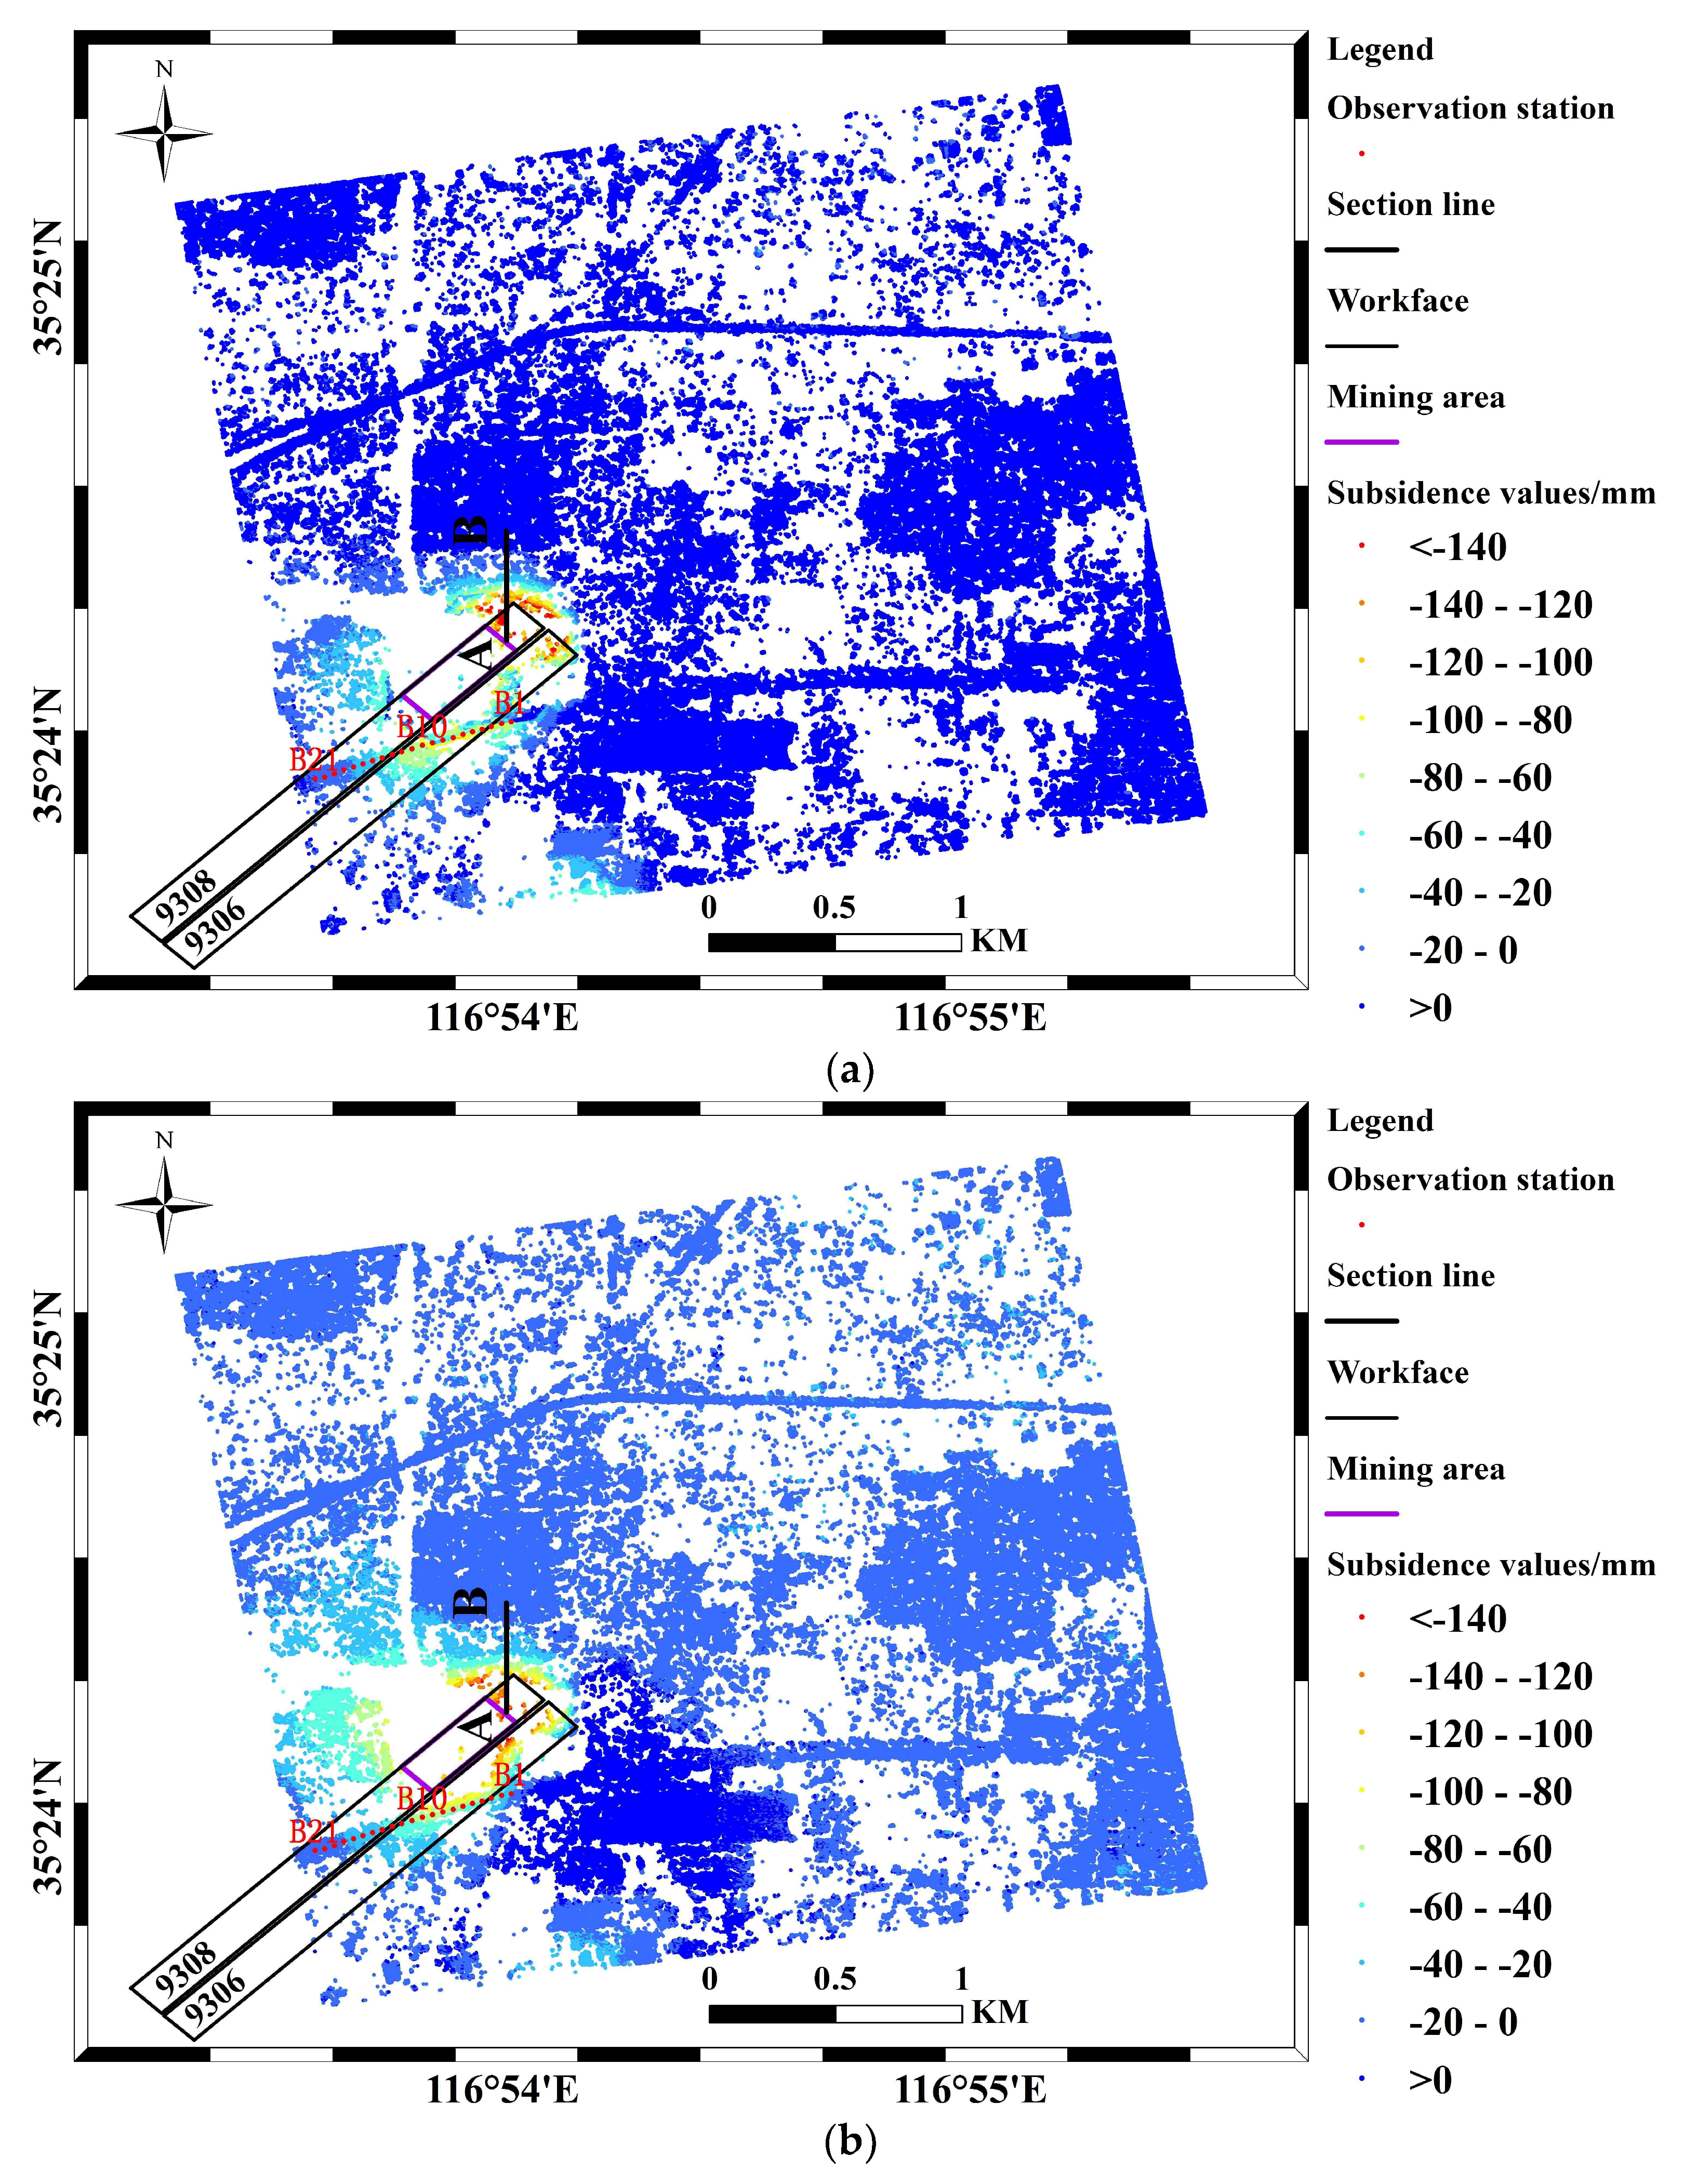
The study area is the 9308 workface in the Nantun mining area (Jining City, Shandong Province, China), where the land surface consists mainly of industrial plants and farmland. The Zouji highway also passes over the workface. The strike length and dip width of this workface are 800 m and 140 m, respectively. The average mining depth is about 630 m. The thickness of the coal seam is about 4.76 m. The coal seam has an inclination angle of 6°, and the mining direction was from the northeast to southwest. The 9306 workface, located on the southeast side of the 9308 workface, is an abandoned goaf, where work ceased in 2011. The location of the 9308 and 9306 workfaces are shown in
Figure 1. The purple frame represents the scope of mining during the study period, and the black arrow represents the direction of coal mining. To effectively monitor the subsidence that occurred on the Zouji highway, a total of 21 ground leveling points, whose layouts were from east to west along the highway, were selected to monitor the subsidence. These ground leveling points are annotated using red dots and labeled using white characters.
The main impacts from coal mining on the surface are ground fissures and subsidence. The exploitation of these coal seams, which are located under buildings, railways, and highways, affects the safety, stability, and integrity of these structures. To safeguard human life, property, and the road infrastructure, there is an urgent need to monitor the subsidence caused by coal mining. The monitoring results should provide a basis for highway maintenance and management.
In this study, ten TerraSAR-X images, spanning the period from 25 December 2011 to 2 April 2012, were acquired. The TerraSAR-X satellite (TSX), launched by the German Aerospace Center (DLR) on 15 June 2007, is synchronized to the sun. Compared with other SAR satellites, the repetitive observation period of the TSX is 11 days, which enables an increase in the frequency of subsidence monitoring. The range and azimuth of pixel spacing are about 1.5 m and 2.0 m, respectively. To preserve a high coherence for all image pairs, only image pairs with the smallest temporal and spatial baseline were selected. A total of nine image pairs, which were constructed from two adjacent images, were generated. The specific parameters of the nine image pairs are shown
Table 1.
3. Methodology
3.1. Probability Integration Model
During the deposition process, different rock formations are formed due to changes in the sedimentary environment, and layers appear at the interface of different rock strata. However, the rock strata are affected by late tectonic stress and magma intrusion, and weak surfaces such as joints, bedding, and faults are formed in the rock stratum. Due to the existence of weak surfaces, probability integration model, which is widely used for subsidence prediction with coal mining, idealizes the formation as a discontinuous loose medium, and the formation deforms as the coal is mined [
1].
The PIM was constructed in the 1960s using random media theory proposed by Polish scholars. The PIM regards the strata movement as a stochastic process that obeys statistical laws, and the probability density function integral formula is used to predict surface subsidence caused by coal mining. The basic idea is to treat the movement of surface and rock as a random event, whereby the mining area is represented as an infinite number of tiny units, and then to calculate the sum of influences of all the units on rock formation and surface deformation. This approach is the most widely used method for subsidence prediction in China [
1,
29].
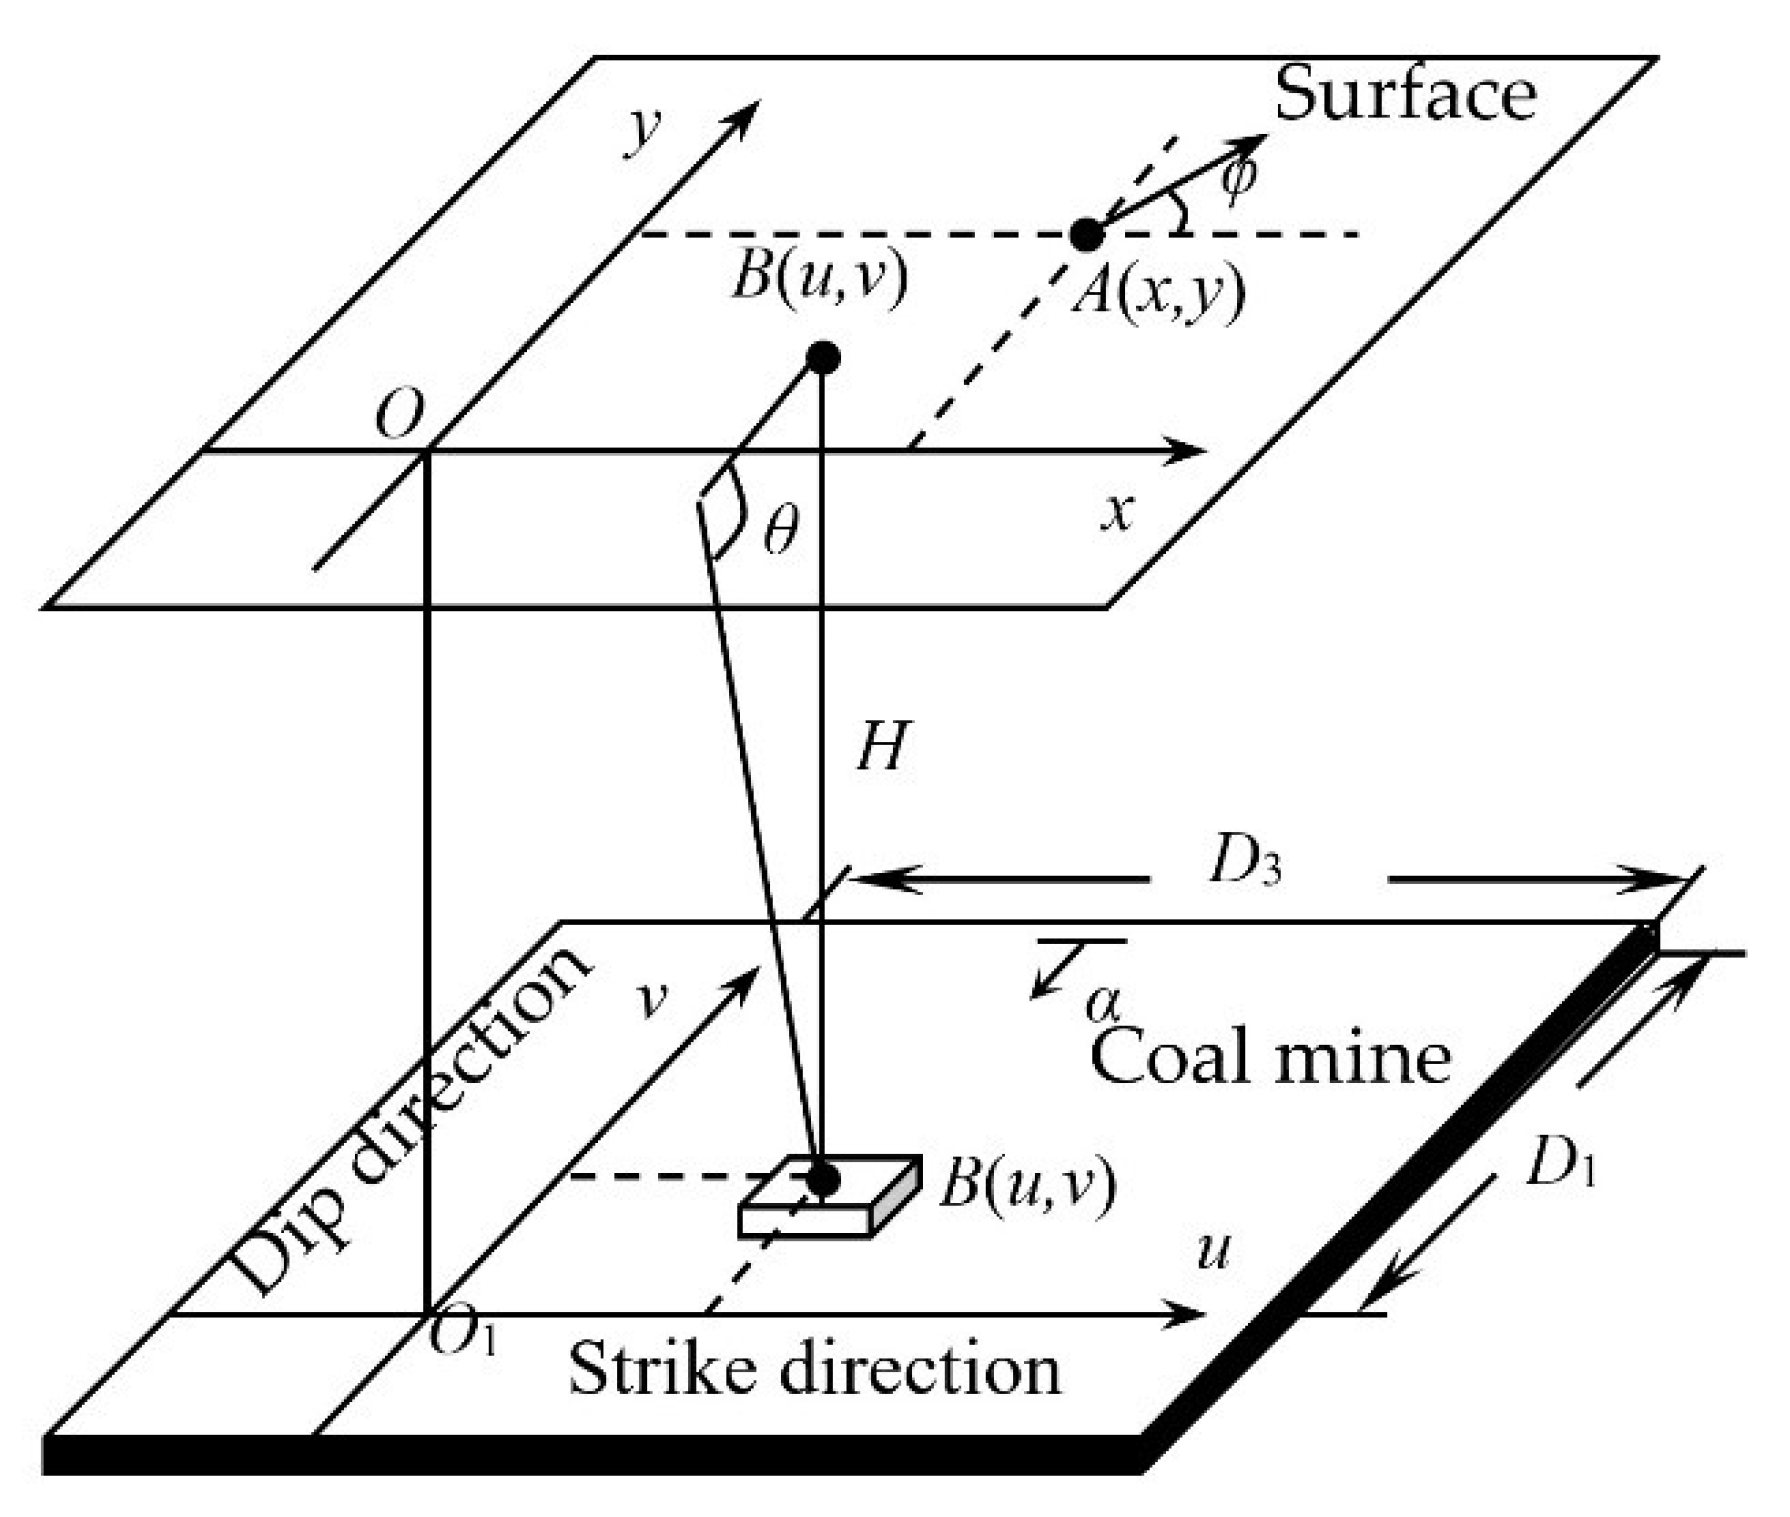
As shown in
Figure 2, the ground coordinate system xOy and the coal seam coordinate system uO1v are assembled. The unit B (
u,
v) is seen as a unit in the inclined coal seam. According to the PIM, unit extraction will cause movements of point A (
x,
y) on the surface. The value can be expressed as:
where
r is the main influence radius of unit B and
,
H is the depth of unit B,
is the main influence angle tangent, and
is the mining influence propagation angle.
Formula (1) represents the surface movement caused by a mining unit. If the entire coal seam is extracted, according to the principle of superposition, the movement
W(
x,
y) of point A(
x,
y) on the surface caused by mining is given by expression (2):
where
is the maximum subsidence for this geological condition of the mine,
,
is the coal seam thickness,
is the subsidence coefficient,
is the dip angle of the coal seam,
,
;
and
are the strike length and inclined length of the work face, respectively;
,
,
and
are the displacement distances of the inflection point in the downhill, uphill, left, and right directions of the workface, respectively.
Therefore, using the geological mining data, the dynamic surface subsidence caused by coal extraction can be simulated by the PIM; the precision of estimation is mainly related to several basic parameters, including the subsidence coefficient (), , , the coal seam thickness, and the mining depth.
3.2. SBAS
SBAS, which was proposed in 2002, has overcome the limitations of PS-InSAR, and has been widely applied in various fields of deformation monitoring. SAR images are combined into interference pairs via the restriction of small spatial and temporal baselines. Points with high coherence are selected, and terrain phases are removed by the external digital elevation model (DEM) to obtain differential interference phases. A functional relationship is established between the unwrapped differential interferometric phase and the surface deformation rate, and and are calculated using the least squares method or by the singular value decomposition method. This approach has many advantages, including simple principles for estimation and easy implementation, and is not limited by the quantity of images. Further, the selection of high coherence points reduces the image resolution. In areas with larger magnitude deformation and large vegetation coverage, errors are readily introduced into the phase unwrapping process because of decorrelations.
We assume that the number of differential interferograms is I, the differential interferometric phase of the ith interferogram can be expressed as Formula (3).
where,
is wavelength,
is the distance in the LOS direction,
is the angle of incidence,
is the vertical baseline,
is the terrain error, and
and
are the temporal baseline and the velocity of deformation of the
interference pair, respectively.
Formula (3) can be expressed as Formula (6).
where
I is the number of interference pairs.
Assuming that subsidence is linear with time, relationship between subsidence and time can be expressed as Formula (7).
where
(
si = 2, 3 …
N,
N is the number of SAR images),
(
mi = 1, 2 …
N−1) are the accumulated subsidence of coherent point on
ith differential interferogram fore slave image and master image respectively, and
is the temporal baseline of the
interference pair. Time-series subsidence of coherent points is accumulated using Formula (8).
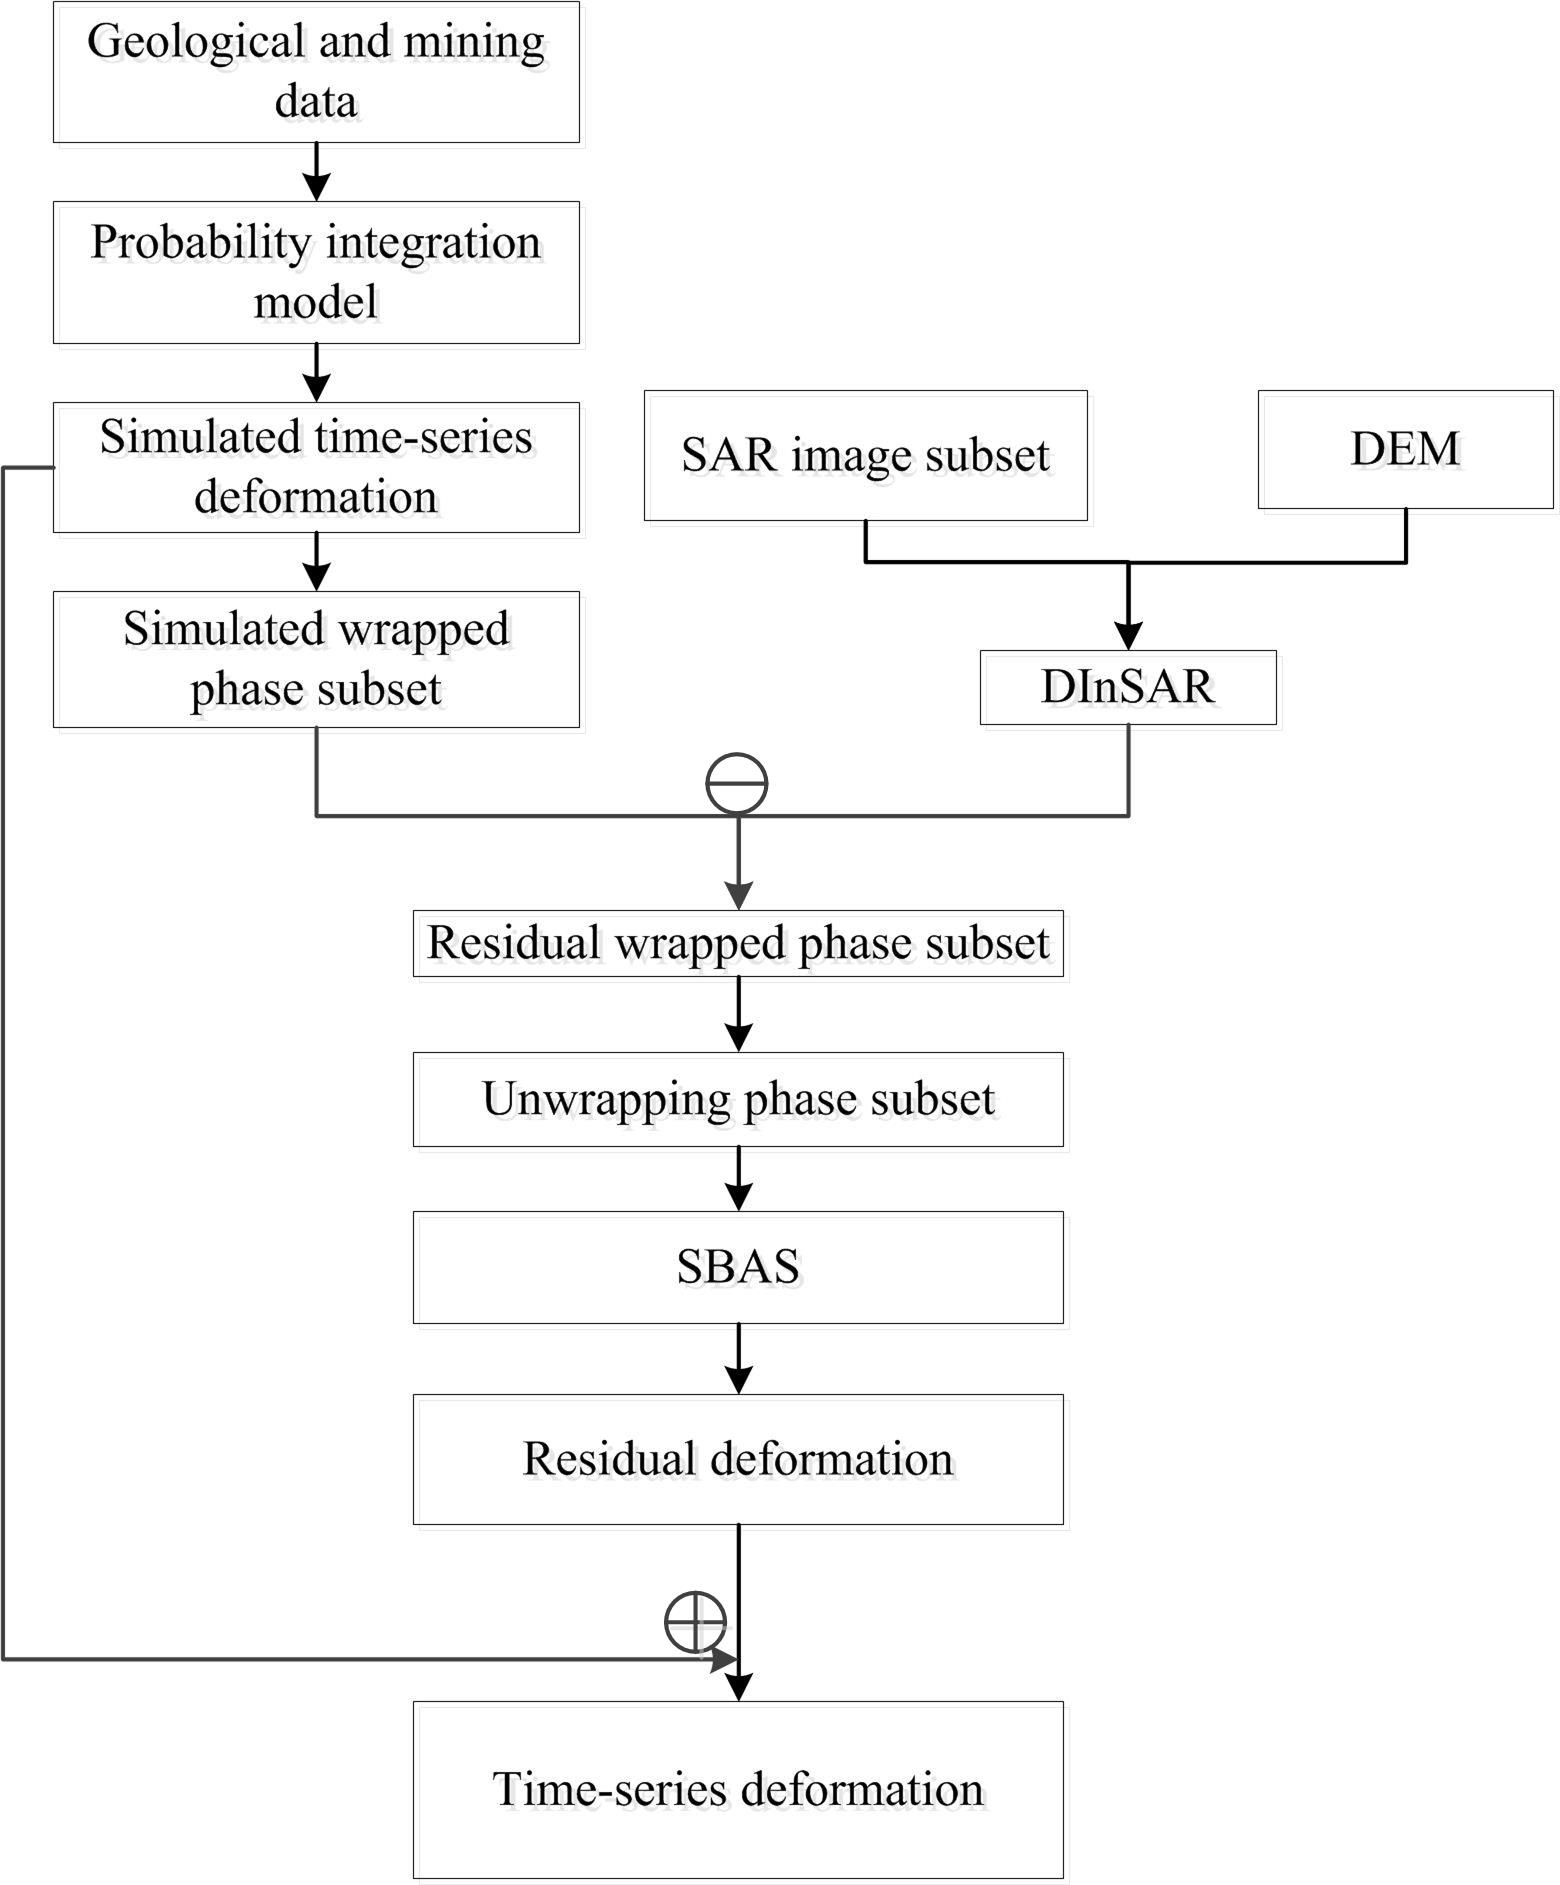
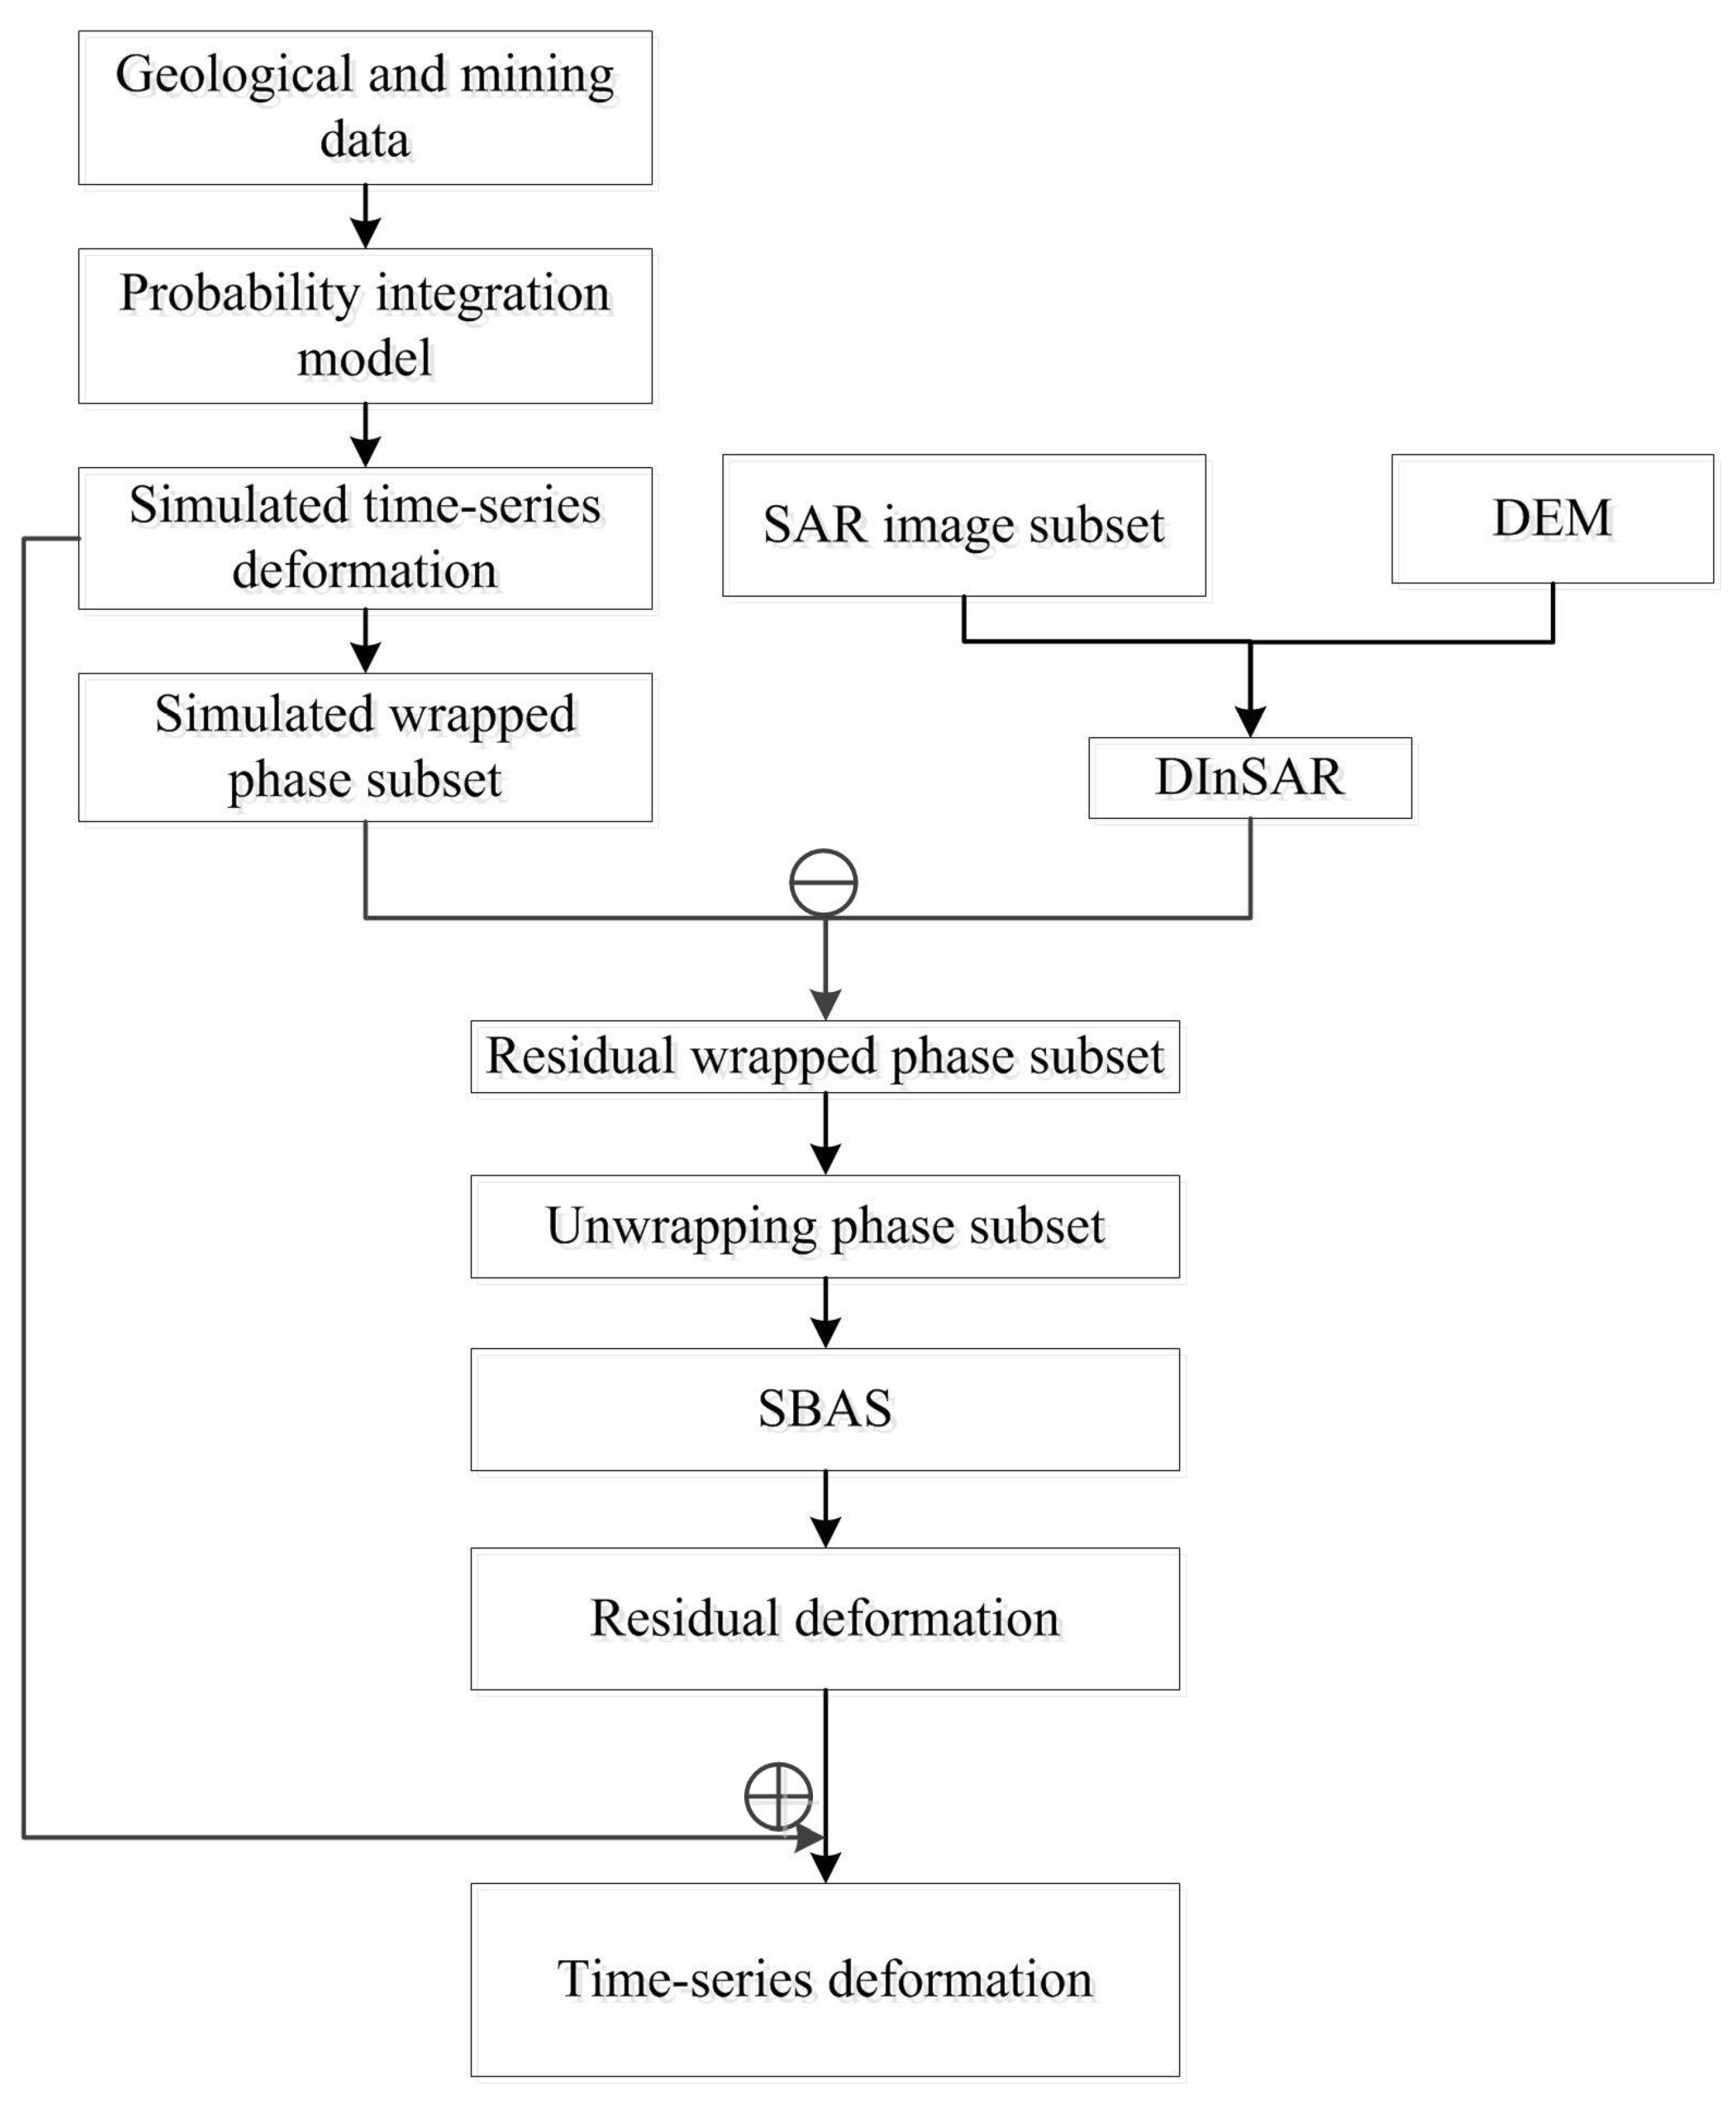
3.3. PIM-SBAS
A new methodology, which combines the PIM and SBAS, is proposed in this study. To avoid the errors introduced by temporal and spatial decorrelations into the phase unwrapping step, mining subsidence could be effectively simulated using PIM-SBAS. The specific steps are as follows (
Figure 3): (1) DInSAR is used to yield the actual wrapped phase; (2) the time series surface deformations are simulated using PIM and the geological mining parameters; (3) the simulated surface subsidence is converted to wrapped phases, and the wrapped phases are subtracted from the actual wrapped phase to obtain the residual phase; (4) SBAS is used to determine the residual deformations; (5) the total surface deformation is determined by adding the residual deformation to the simulated surface deformation.
3.4. Validation Methods of the Results
3.4.1. TCPInSAR
TCPInSAR, which was proposed by Zhang et al. [
13,
14] in 2011, has been used in calculating surface subsidence using temporarily coherent points (TCPs) rather than persistent coherent points. After identifying TCPs from images over the whole time span, the local Delaunay triangulation network is used to assist in connecting all the TCPs and each connected pair in the network is termed as an arc. In the model, the arcs with phase ambiguity are detected and removed using least squares residuals.
In the
ith differential interferogram, the differential phase of the TCP with the coordinate (
l,
m) can be expressed as:
where
W{ } is the phase wrapping operation,
is the topography phase error,
is the deformation phase,
represents the atmospheric artefacts,
is the orbit error phase,
is the phase error of the difference of the Doppler phase and
is the noise phase.
Land subsidence can be expressed by the deformation velocity and time intervals of SLC (single look complex) data. The topography phase error is related to the perpendicular baseline and altitude error .
where
Ci is the total number of SLC images between the acquired time of master and slave images,
tk is the acquired time of SLC images,
λ is the wave length of the SAR,
V is the subsidence velocity vector,
is the perpendicular baseline of the TCP point (
l,
m),
is the local incidence angle, and
is the slant range between the land target and the satellite.
The differential operation between a pair of nearby TCPs can reduce the atmospheric artefacts, the orbital error phase, so the phase difference of a given arc between two nearby TCPs can be written as:
where
, which is the residual phases error vector and
.
When there are no phase ambiguities among all arcs in a Delaunay network, the phase difference of arcs can be simplified as:
where
is the difference of height errors of an arc connected by two TCPs (
l,
m), and (
l′,
m′),
is the difference subsidence velocity between two TCP in an arc,
is the residual phase error vector,
is the coefficient matrix. and
is the phase difference between two TCPs in an arc.
The parameters , and of the TCPs of each arc can be calculated from Formula (14)–(16), where P is the priori weight matrix.
Equations (14)–(16) are the basic model and for the initial estimation of TCPInSAR. However, the above process assumes all arcs phase ambiguity equals to zero, which is wrong for the arcs with non-zero phase ambiguity. Therefore, L. Zhang proposed an outliers detector to find the arcs with phase ambiguity, which can be recognized by:
where
Max(·) stands the maximum value of a vector or matrix,
are the residual phases of arcs in the
ith differential interferogram,
is the covariance matrix of the observation (differential phases at arcs), which is the inverse of matrix
P in Equations (14)–(16),
is the covariance matrix of the observation estimation value, which can be calculated by Equation (15) and
is a constant (generally 3 or 4).
After the parameters of arcs are determined, the relationship between arcs and the points can be established by Equation (18), and we can also use the least squares method to get the parameters of each TCP.
where
L and
X are the parameters of arcs and points respectively,
and
U is the coefficient matrix that links the arcs and points, which is shown in Equation (19).
is the velocity of deformation of the
interference pair.
After acquiring and (temporal baseline), the time-series subsidence of coherent points can be calculated using Formula (8).
3.4.2. Leveling Measurements
Four groups of leveling measurements, as obtained in a previous study [
26], were recorded on 5 January 2012, 11 March 2012, 22 March 2012, and 2 April 2012, respectively. The four groups of leveling data are measured by the fourth level, and the error per kilometer height difference is 10 mm.
4. Results
4.1. Simulated Interferograms and Actual Interferograms
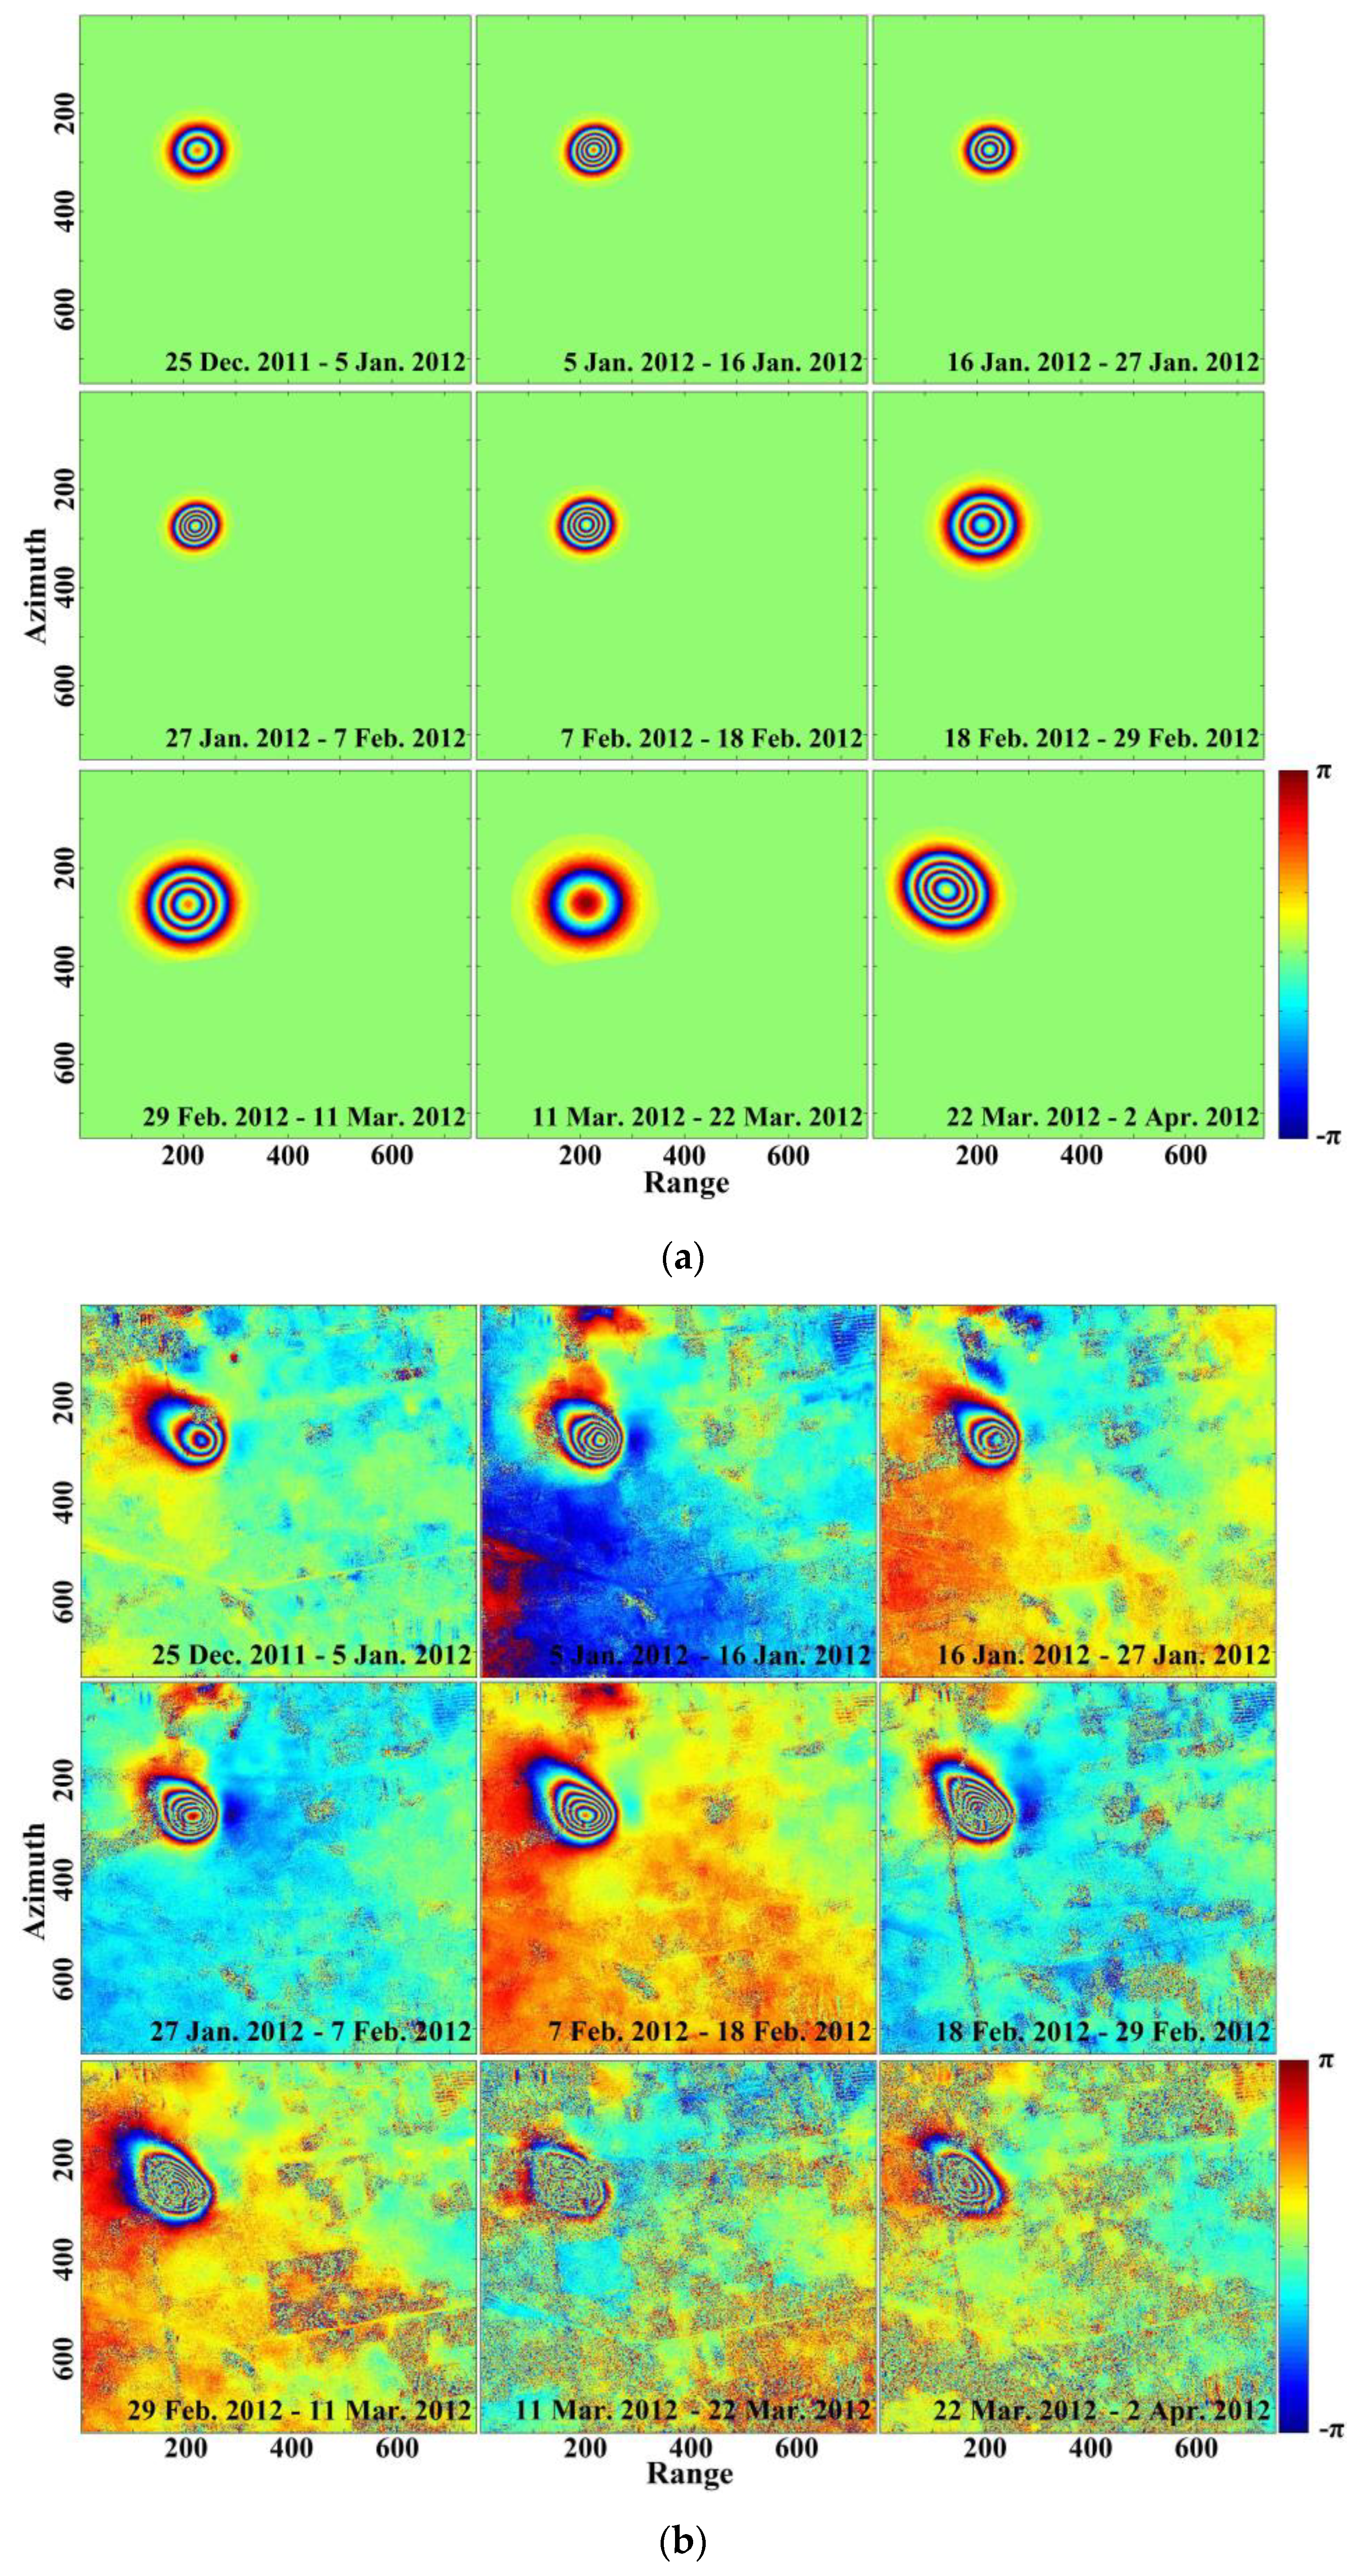
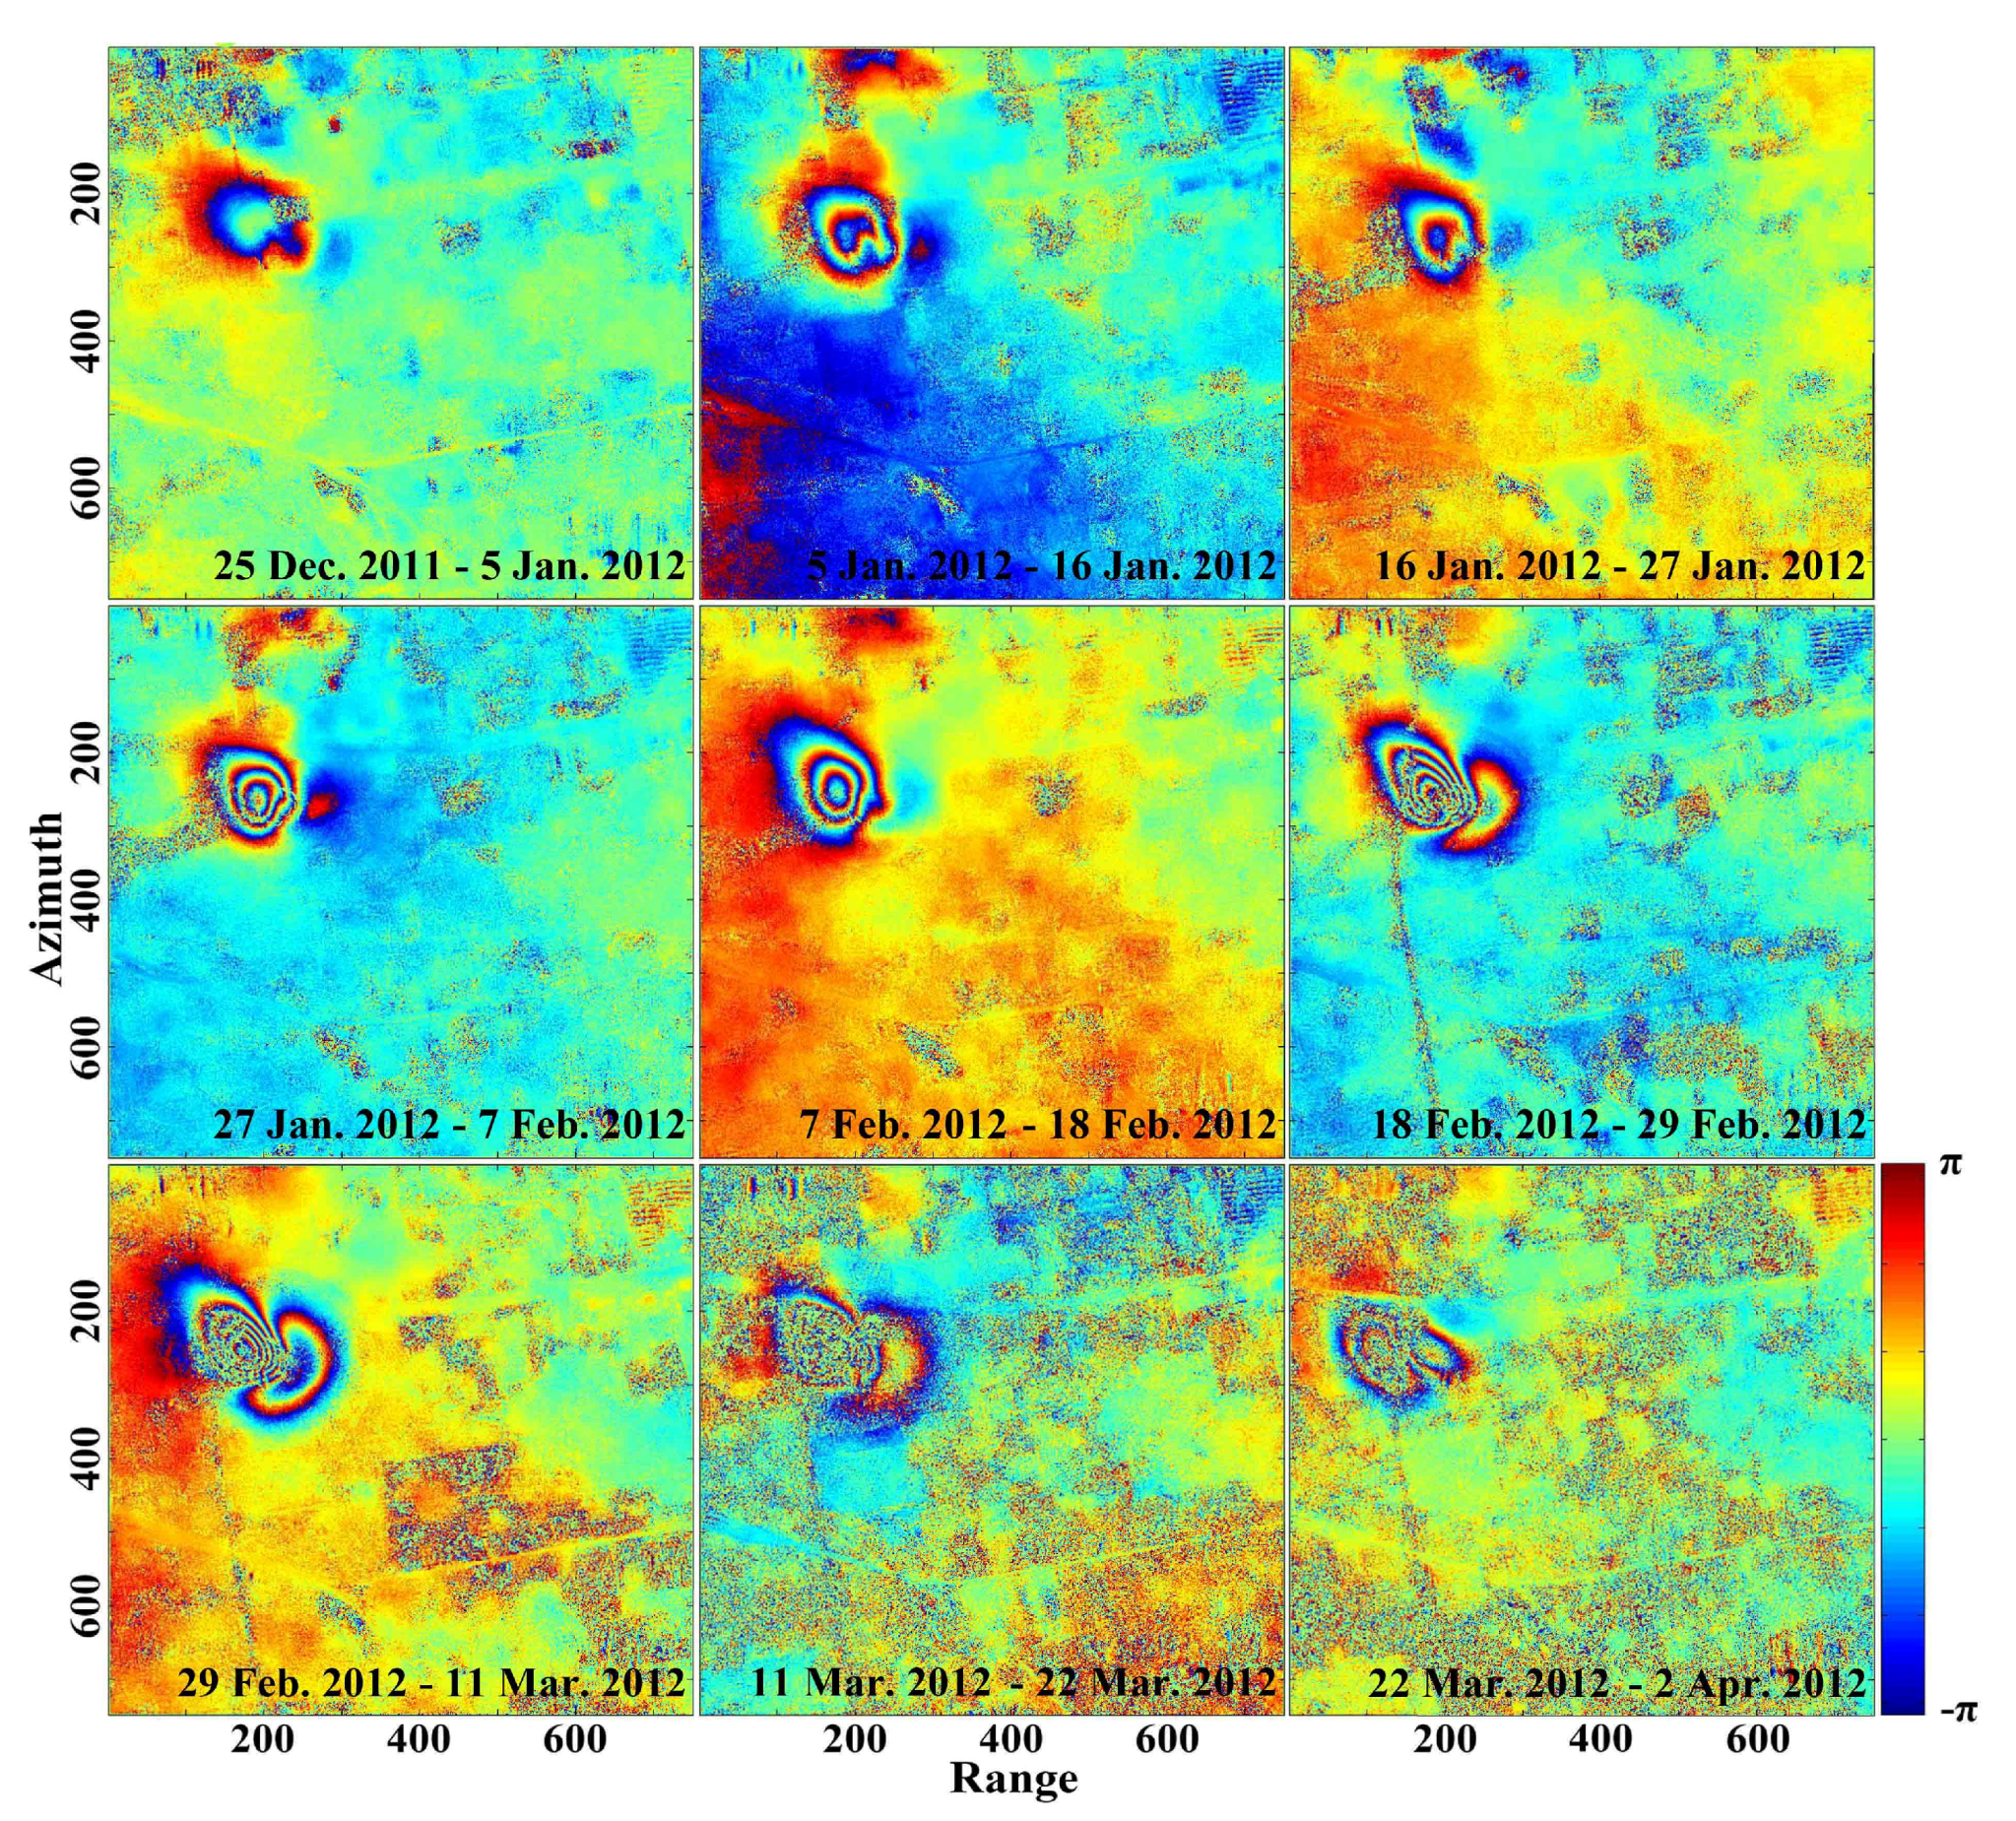
To avoid the effect of spatial decorrelation on phase unwrapping, a primary step was to simulate surface subsidence and remove it on the basis of coal mining theory. Therefore, the area with large large-scale subsidence of each image pair was simulated by the PIM and the geological mining data, and simulated subsidence was transformed into wrapped phase map. After using SRTM 3 DEM, whose resolution is 90 m, to remove the terrain phase subsets, the actual wrapped phase subsets were calculated by the SBAS technique. Residual wrapped phase subsets were obtained by subtracting simulated wrapped phase subsets from actual wrapped phase subsets generated by SBAS. The simulated wrapped phase map and actual wrapped phase map generated by SBAS are shown in
Figure 4a,b, respectively. The residual wrapped phase map is shown in
Figure 5.
As shown in the first five panels of
Figure 4 and
Figure 5, when surface subsidence values are small, simulated subsidence values are close to values calculated by SBAS, and the numbers of stripes are significantly reduced. In the last four panels of
Figure 4 and
Figure 5, simulated subsidence values are significantly different from values calculated by SBAS, and there are many stripes in residual wrapped phase map. Because wrapped phase maps simulated by PIM are regular, bulges appear in the lower right corner of interference fringes.
In addition, the subsidence of this study area was affected by the mining of 9308 workface and the residual subsidence caused by 9306 workface, an abandoned goaf near the 9308 workface. It was difficult to ensure the mining parameters of the abandoned goaf, and further, the land subsidence caused by the goaf was small; thus, we only used the 9308 workface to simulate land subsidence. The interference fringes in residual wrapped phase map are significantly reduced but not completely removed.
4.2. PIM-SBAS Monitoring Results
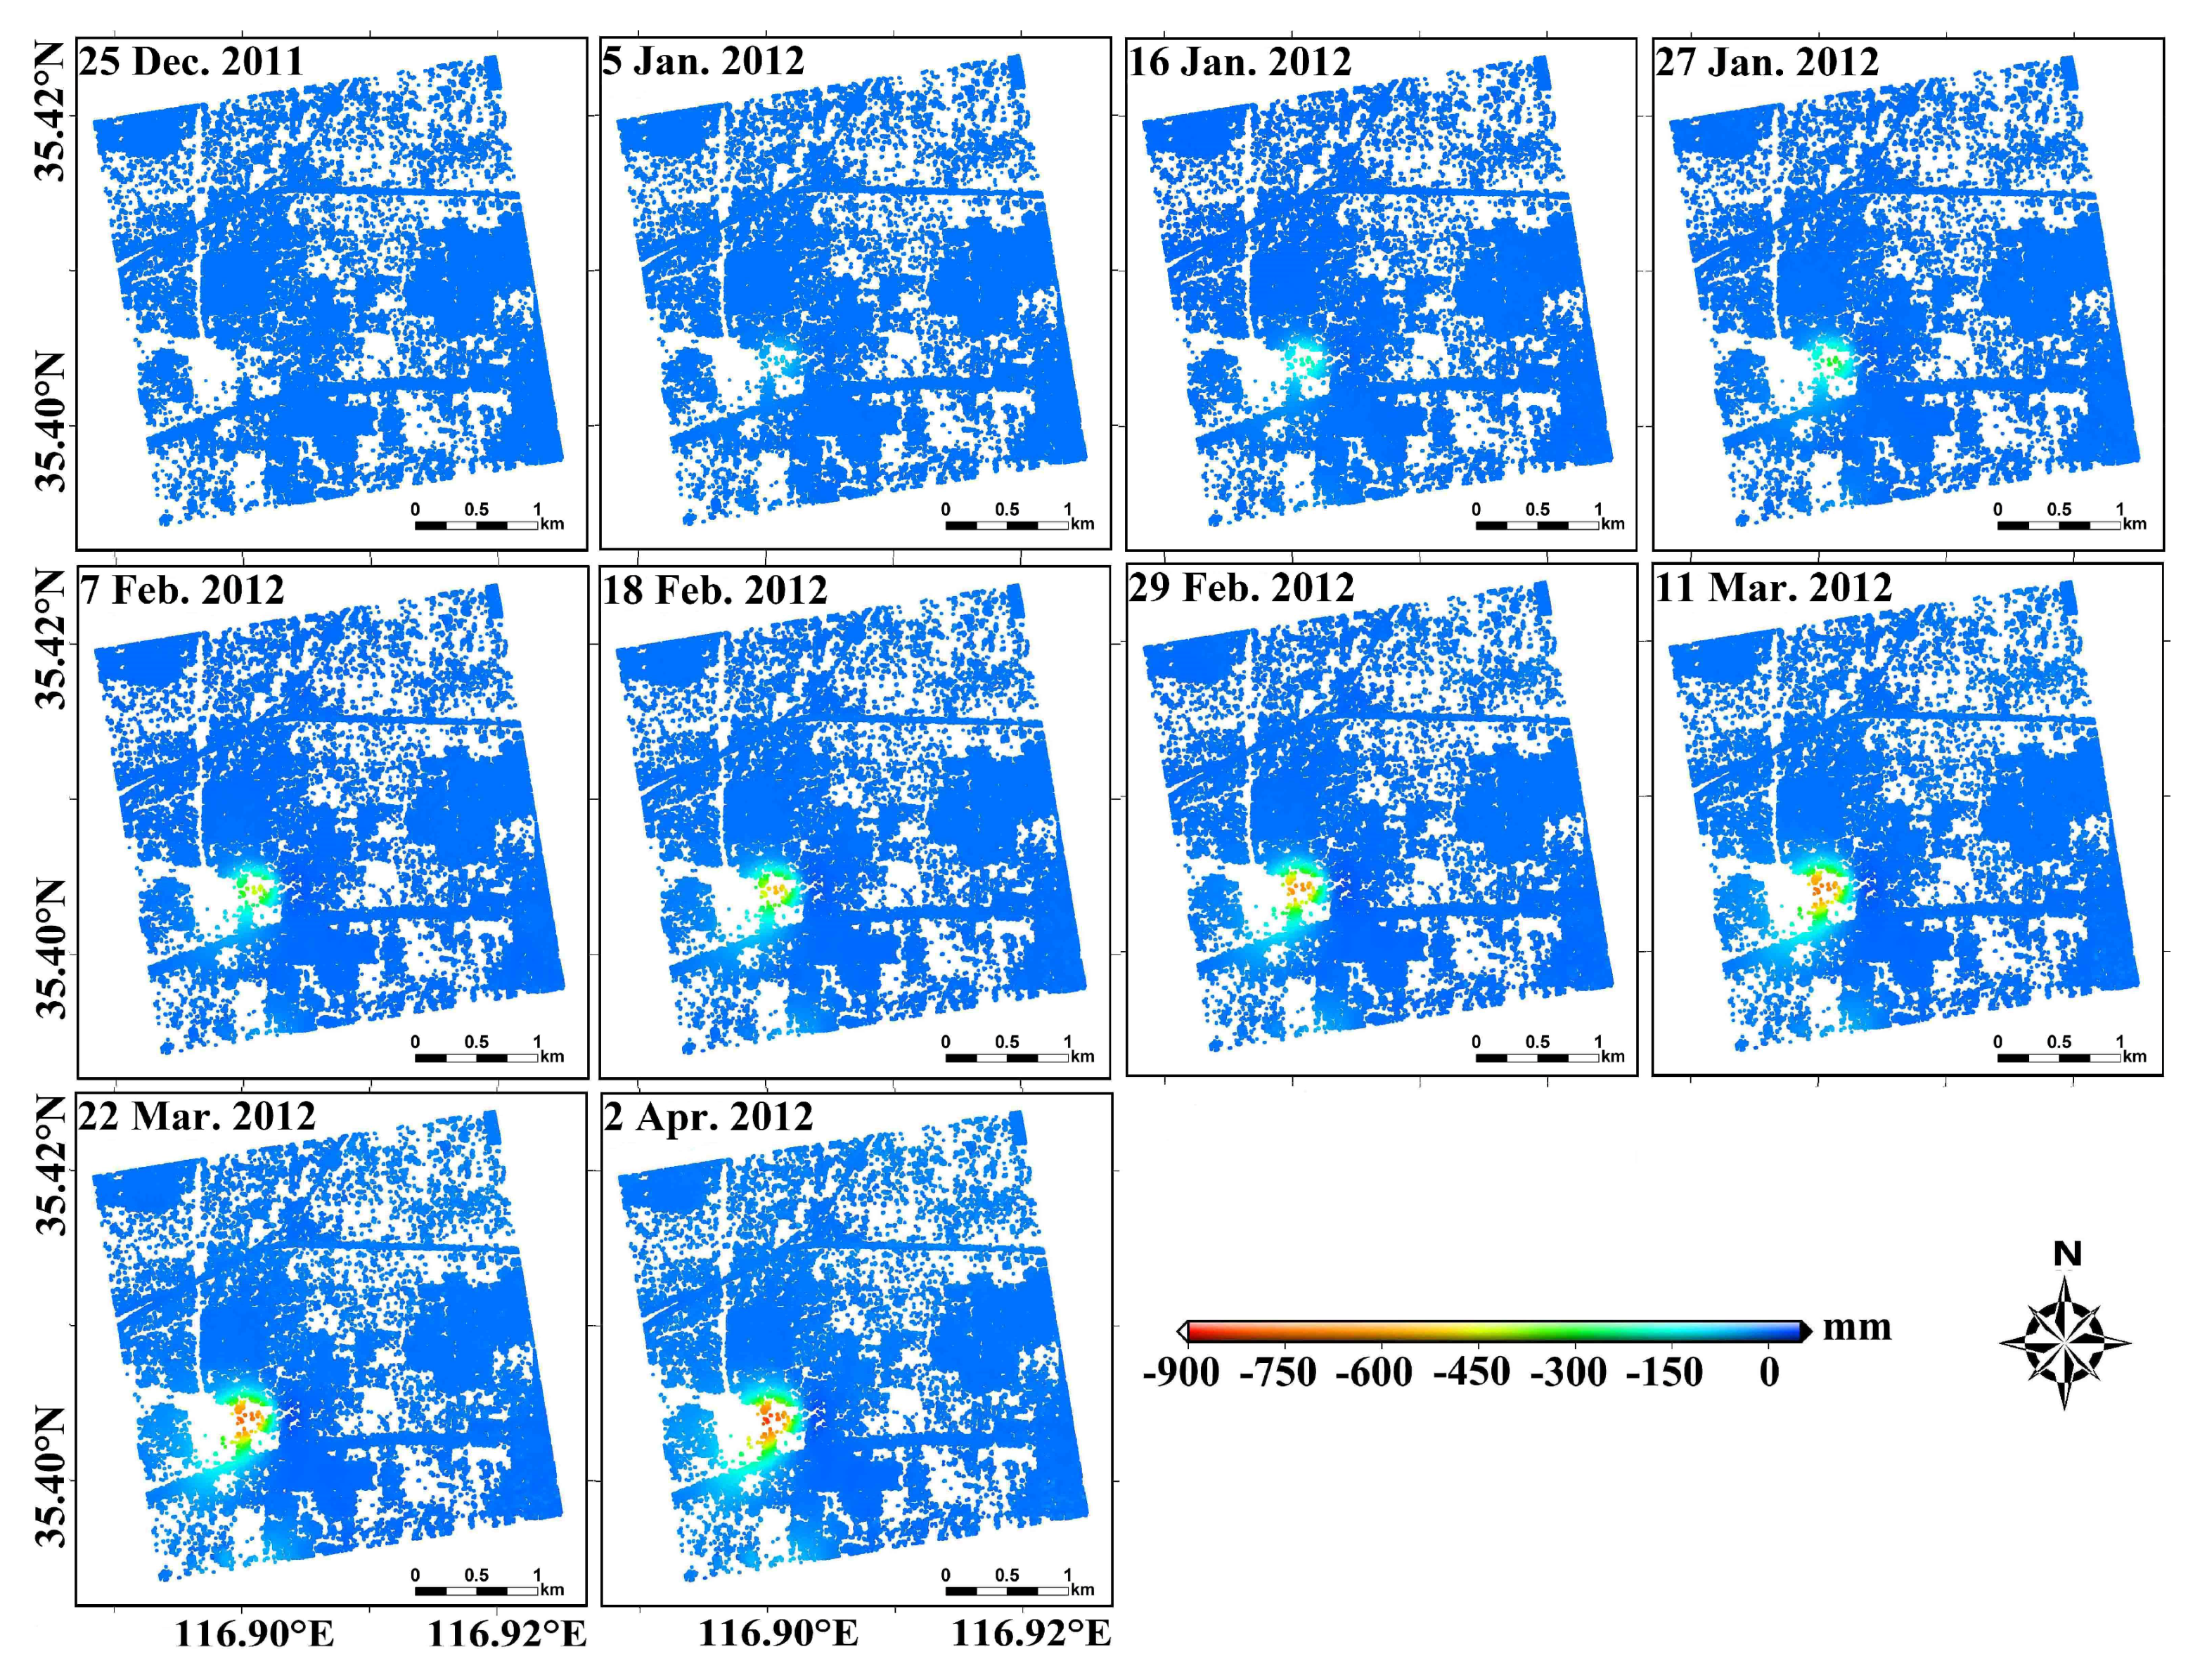
After phase unwrapping, the coherence threshold was set to 0.2 to select the coherent points. The surface deformations were obtained by the least-squares method. Because the mining area was covered with a large number of crops in March and April, the number of coherent points in some areas was lower than in others.
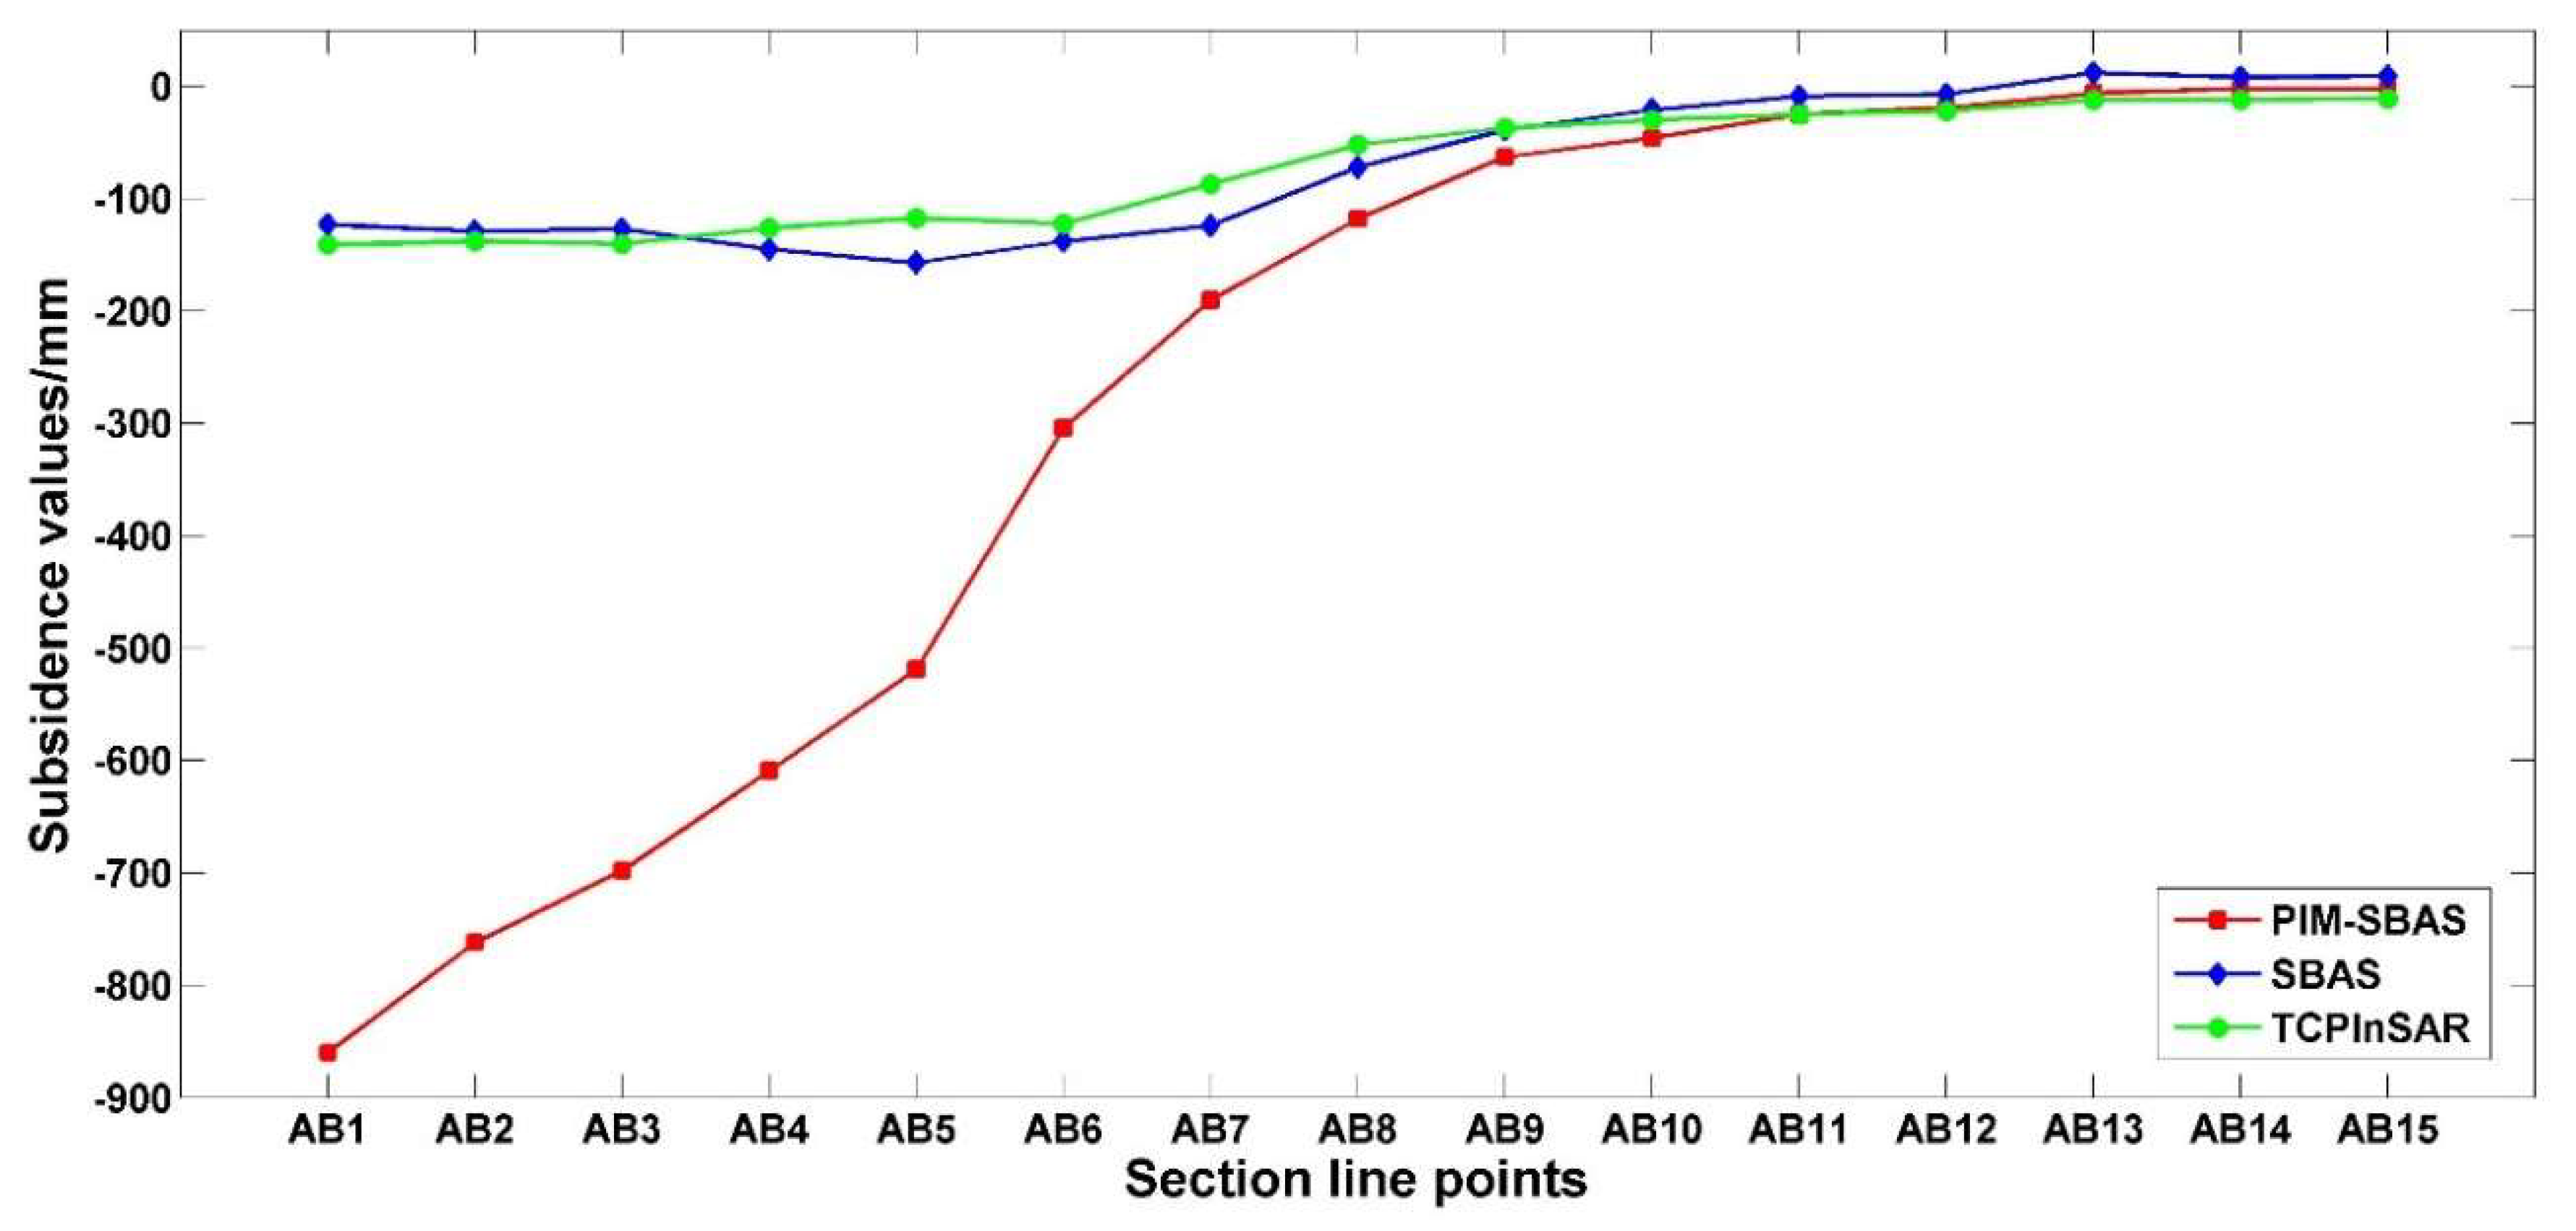
A total of 152,318 coherent points were obtained. Unfortunately, few high coherence points were selected above the workface because of spatial decorrelation. Clearly, there was no evidence for land subsidence in the whole image except for the mining area. The subsidence funnel extended from the northeast to the southwest and was consistent with the mining direction. Due to the residual subsidence of the abandoned goaf (9306 workface), the range of land movements shifted to the southeast direction. The time series deformations generated by PIM-SBAS are shown in
Figure 6. From 25 December 2011 to 2 April 2012, the range for the subsidence increased gradually.
From 25 December 2011 to 2 April 2012, the maximum subsidence of coherent points reached 860 mm. Because of the spatial decorrelation caused by the large surface subsidence, the number of coherent points above the workface decreased. The number of coherent points was sufficient, however, for analysis of the influence of coal mining on the Zouji highway; the maximum subsidence of the Zouji highway was calculated to be about 145 mm.
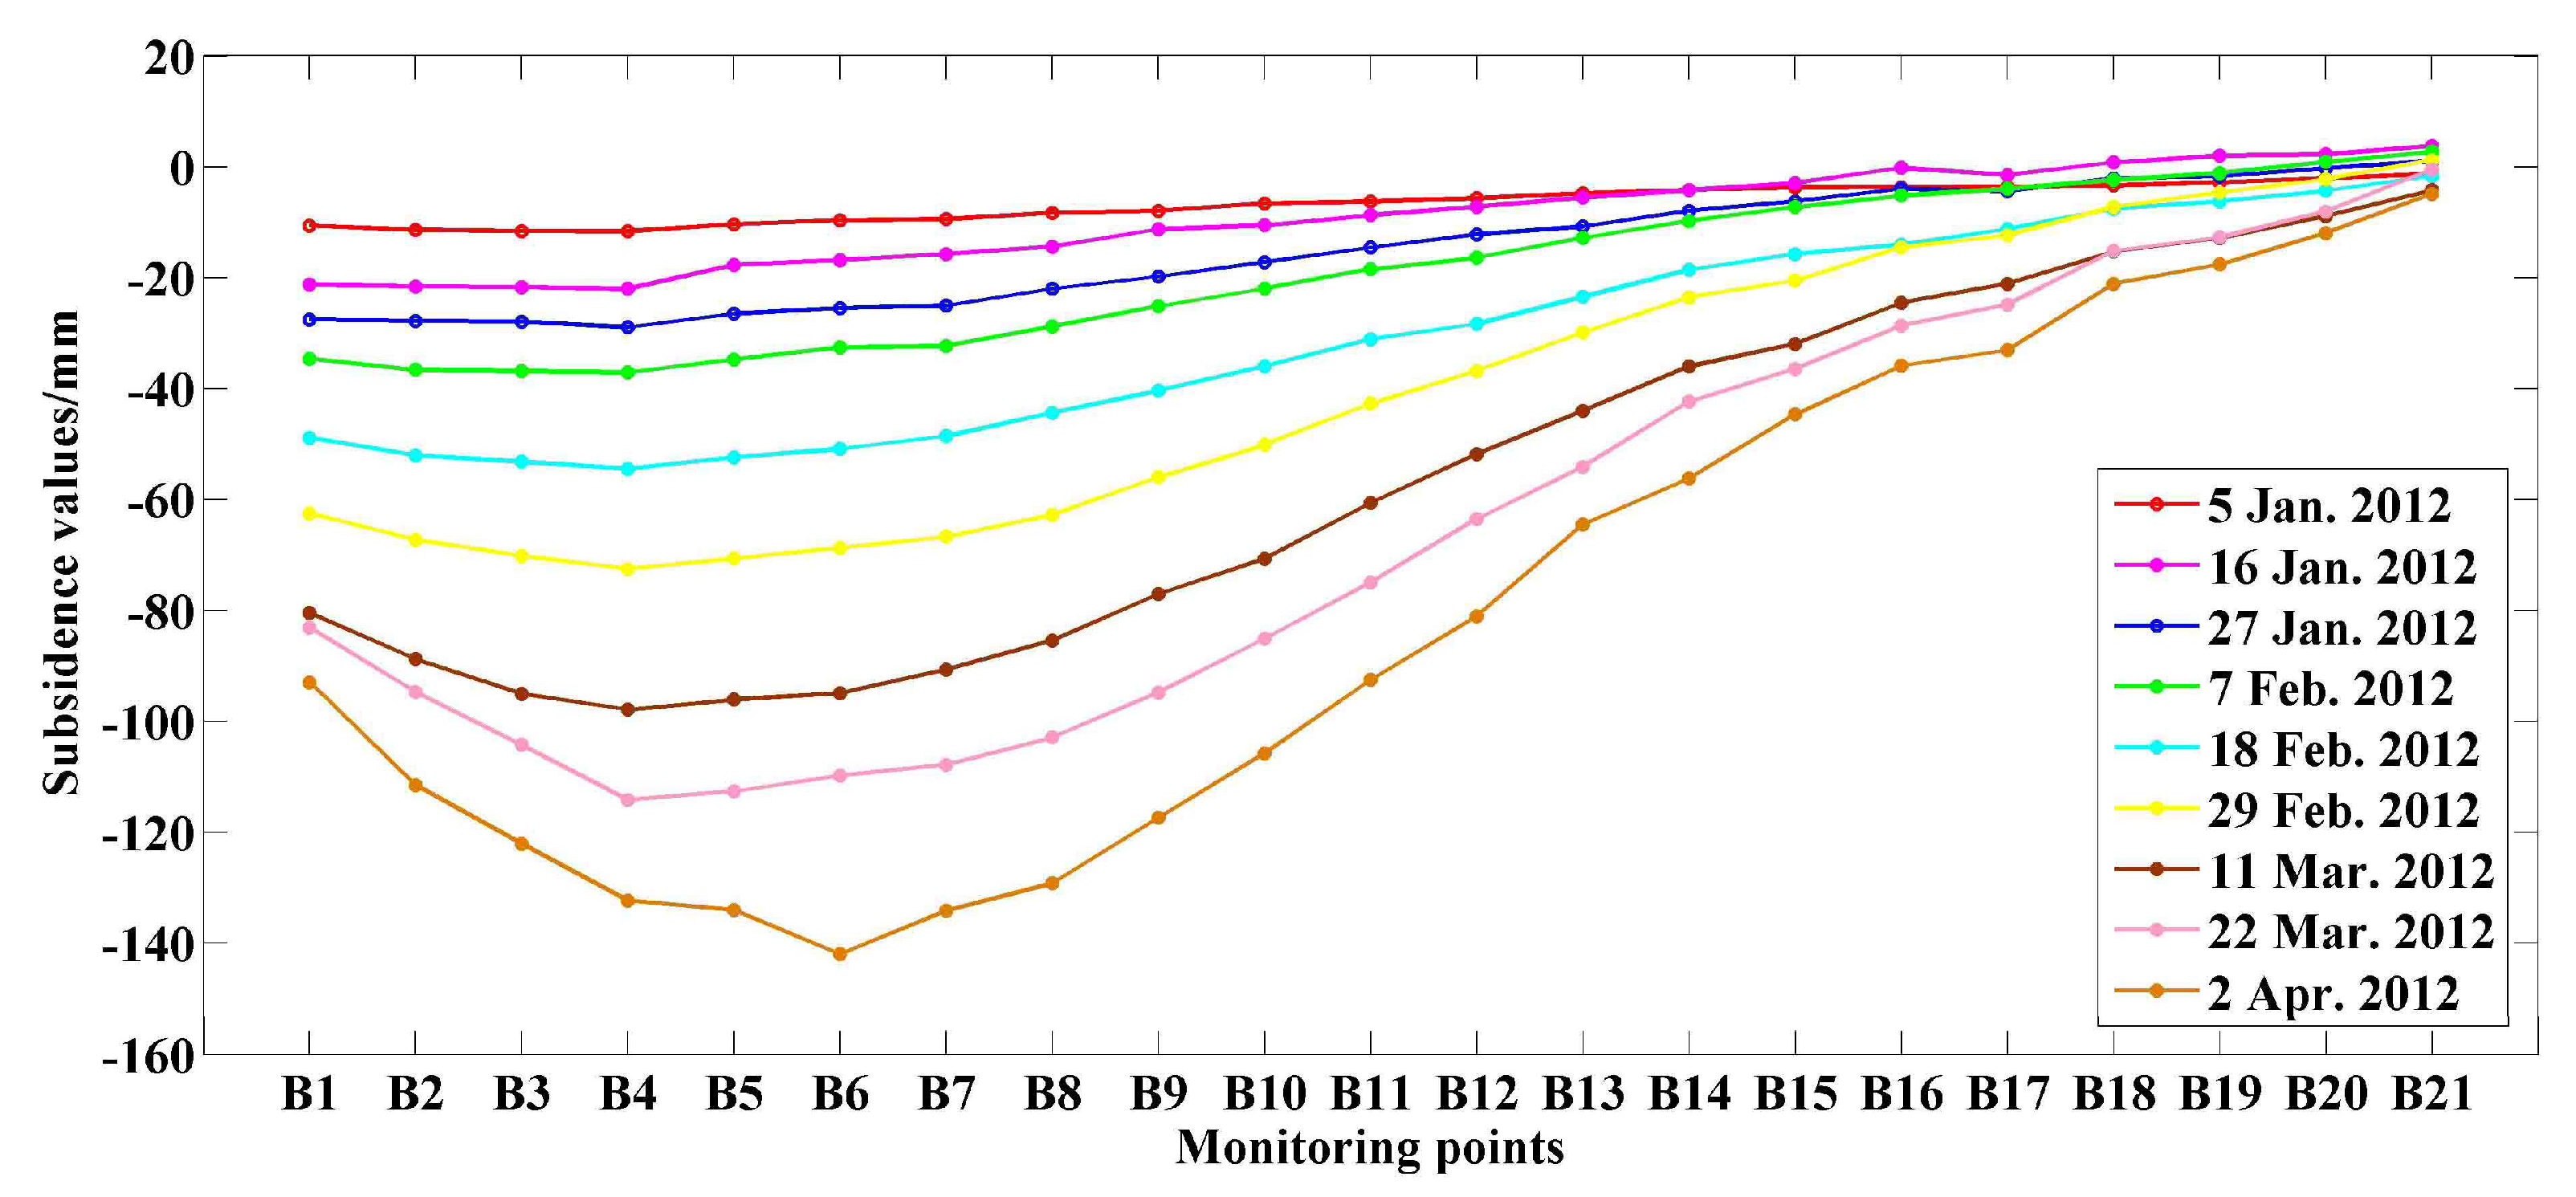
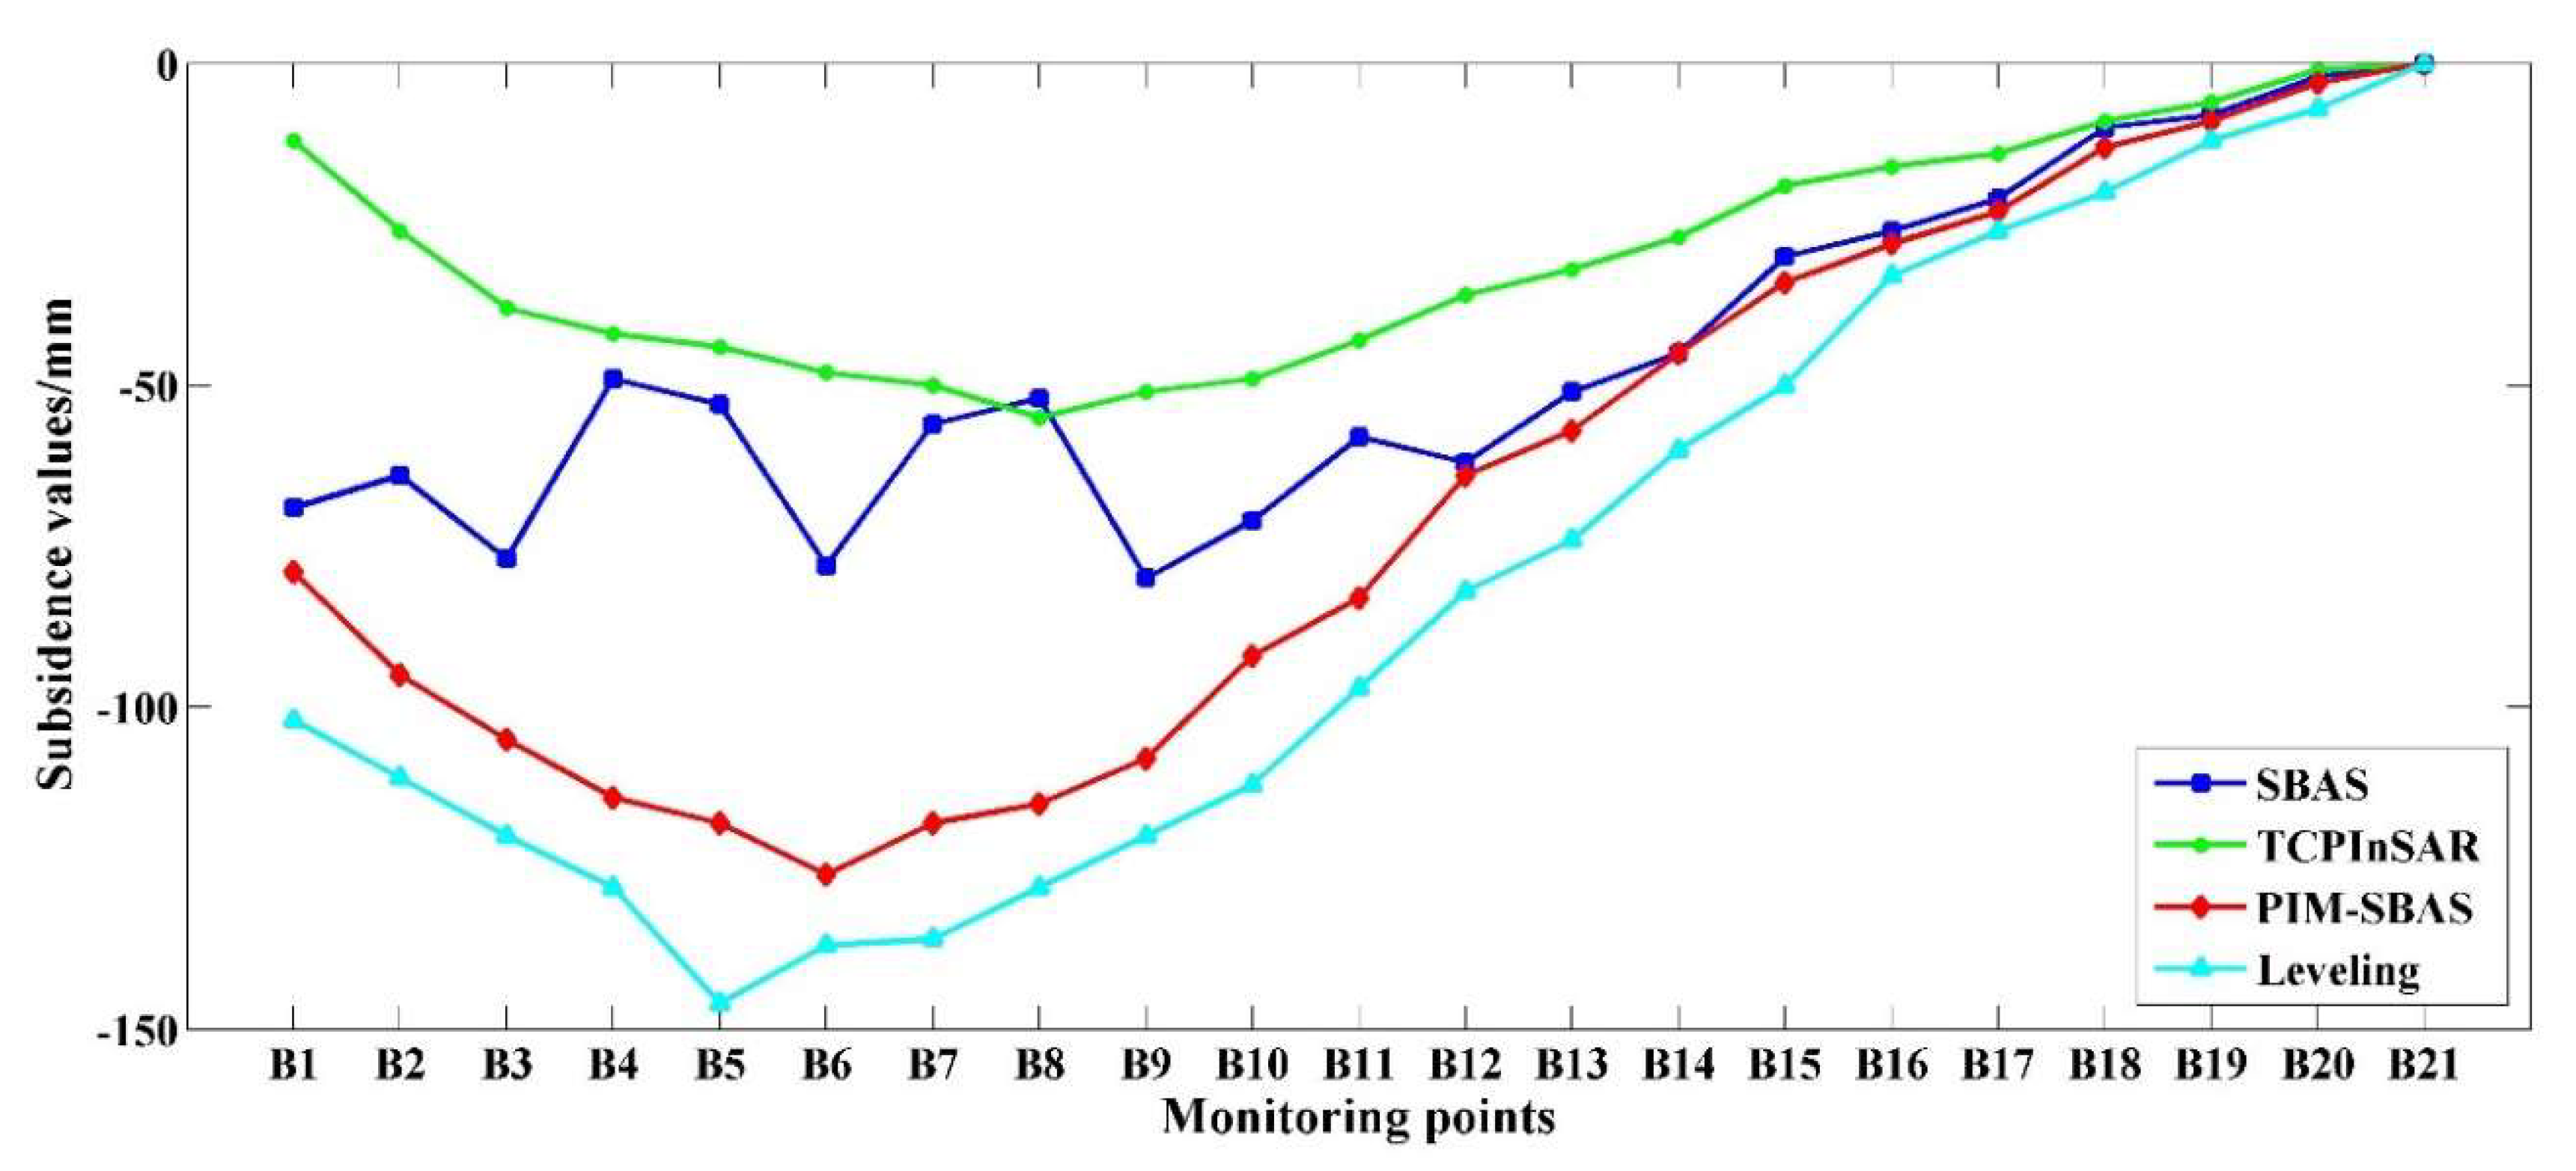
Using PIM-SBAS, the time series subsidence values for each monitoring point were obtained; these are shown in
Figure 7. As a result of the effects of mining of the 9308 workface, subsistence for almost all of the monitoring points increased over time. The monitoring point B6 attained a maximum subsidence of 142 mm on 2 April 2012.
To effectively compare PIM-SBAS monitoring results with those obtained by other time series InSAR, the surface subsidence values obtained by SBAS and TCPInSAR were also calculated, and are presented below.
4.3. Monitoring Results of SBAS and TCPInSAR
To avoid temporal and spatial decorrelation, ten TSX SAR images from 25 December 2011 to 2 April 2012, were grouped with nine interference pairs using the smallest temporal and spatial baseline. However, the surface vegetation coverage and the large surface subsidence caused spatial and temporal decorrelation, which impacted the phase unwrapping of the traditional SBAS. When the threshold of coherent values was set to 0.2, the accumulated surface subsidence from 25 December 2011 to 2 April 2012, is shown in
Figure 8a.
To avoid the error introduced by phase unwrapping, TCPInSAR, a time-series InSAR for calculating surface subsidence without phase wrapping, was used to monitoring surface subsidence. After setting the coherent value to 0.2, the accumulated surface subsidence from 25 December 2011 to 2 April 2012 were mapped, and are shown in
Figure 8b.
Above the 9308 workface, the maximum accumulated subsidence calculated by SBAS reached 184 mm. The maximum accumulated subsidence calculated by TCPInSAR in mining area reached 150 mm. Monitoring results of SBAS and TCPInSAR were clearly far lower than the accumulated monitoring subsidence (860 mm) calculated using PIM-SBAS.
6. Conclusions
A new method for subsidence monitoring, termed the PIM-SBAS method, which combines the advantages of the PIM and SBAS, was developed. This method alleviates the difficulty of phase wrapping, and enables retrieval of data for large-scale mining subsidence. Owing to the large degree of land deformation that results from coal extraction, TS-InSAR techniques (SBAS, TCPInSAR and others), which regard land subsidence as linear in order for the purpose of calculation of the deformation velocity, are not suitable for calculating mining subsidence. These TS-InSAR methods should be modified with a mining subsidence model to improve monitoring capabilities.
Time-series surface subsidence maps of Nantun coal mining area were generated using PIM-SBAS during the period from 25 December 2011 to 2 April 2012, with ten TerraSAR-X satellite images. The maximum deformation above the subsidence basin reached 860 mm. Twenty one observation stations were laid along the road from west to east, which is near the workface. Compared with the leveling measurements, the root mean square errors of PIM-SBSA monitoring results on road and the average value of errors were 15 mm and the 13 mm respectively, which was better than the results of original SBAS and TCPInSAR methods.
As a result of the influence of substantial land deformation and vegetation, the number of coherent points above the workface was low. To increase the number of coherent points, further studies should consider distributed scatterers and TCPs, which would enable more accurate time series monitoring of deformation above the workforce to be performed. In addition, atmospheric noises should be considered and removed using temporal filtering methods in future research. Finally, the images acquired form satellites with longer wavelengths and the offset-tracking method will be used to monitor the large-scale subsidence in mining area.


