Brief Report

Contributions of Operational Satellites in Monitoring the Catastrophic Floodwaters Due to Hurricane Harvey

1
NOAA JPSS Program Office, Lanham, MD 20706, USA
2
Department of Geography and Geoinformation Science, George Mason University, Fairfax, VA 22030, USA
3
GOES-R Program Office at NASA GSFC, Greenbelt, MD 20771, USA
4
NOAA/NESDIS Senior Scientific Adviser for GOES-R, Fort Collins, CO 80523, USA
*
Author to whom correspondence should be addressed.
Remote Sens. 2018, 10(8), 1256; https://doi.org/10.3390/rs10081256
Submission received: 3 July 2018 / Revised: 25 July 2018 / Accepted: 3 August 2018 / Published: 10 August 2018
(This article belongs to the Special Issue Remote Sensing for Flood Mapping and Monitoring of Flood Dynamics)

Abstract

:
Hurricane Harvey made landfall as a Category-4 storm in the United States on 25 August 2017 in Texas, causing catastrophic flooding in the Houston metropolitan area and resulting in a total economic loss estimated to be about $125 billion. To monitor flooding in the areas affected by Harvey, we used data from sensors aboard the Suomi National Polar-Orbiting Partnership Satellite (SNPP) and the new Geostationary Operational Environmental Satellite (GOES)-16. The GOES-16 Advanced Baseline Imager (ABI) observations are available every 5 min at 1-km spatial resolution across the entire United States, allowing for the possibility of frequent cloud free views of the flooded areas; while the higher resolution 375-m imagery available twice per day from the Visible Infrared Imaging Radiometer Suite (VIIRS) aboard the SNPP satellite can observe more details of the flooded regions. Combining the high spatial resolution from VIIRS with the frequent observations from ABI offers an improved capability for flood monitoring. The flood maps derived from the SNPP VIIRS and GOES-16 ABI observations were provided to the Federal Emergency Management Agency (FEMA) continuously during Hurricane Harvey. According to FEMA’s estimate on 3 September 2017, approximately 155,000 properties might have been affected by the floodwaters of Hurricane Harvey.

1. Introduction

Hurricane Harvey was the first major storm to make landfall in the United States as a Category-4 hurricane (with wind speeds measured at 130 mph or 215 km/h) since Hurricane Charley hit Florida in 2004. Harvey made landfall on 25 August near the town of Rockport, Texas, and remained stationary over southeast Texas, providing extreme rainfall in the greater Houston and southeast Texas area, resulting in record-breaking rainfall totals in those areas. With a peak accumulation of 51.88 in (1318 mm), Harvey is the wettest tropical cyclone on record in the contiguous United States, causing catastrophic flooding. The resulting floods inundated hundreds of thousands of homes, displaced more than 30,000 people, and prompted more than 17,000 rescues. As of this writing, Harvey caused at least 107 confirmed deaths, and the total economic loss is estimated at $125 billion (2017 USD).
The accurate assessment of the spatial extent of such a large-scale flooding event is highly important for relief and rescue efforts [1]. Because of the large spatial coverage and frequent revisit, no data cost, and low risk to gain access to the observed area, satellite remote sensing is especially helpful for this task [2,3,4]. Under clear conditions during the daytime, flood maps can be derived from optical sensors, such as a very high resolution radiometer (VHHR) and advanced very high resolution radiometer (AVHRR) [3,4,5,6,7] on board the operational polar orbiting satellite, the National Oceanic and Atmospheric Administration (NOAA) series, and the Moderate Resolution Imaging Spectroradiometer (MODIS) [8,9,10,11] sensor, which was launched by the National Aeronautics and Space Administration (NASA) in 1999 on board the Terra (EOS AM) satellite, and in 2002 on board the Aqua (EOS PM) satellite, and Landsat series [12,13,14,15,16,17]. Operational satellites like the NOAA series usually have a moderate spatial resolution. Compared with high spatial resolution sensors, such as optical sensors like the Landsat and radar sensors, which usually offer a 6–16 day repeat cycle, operational satellites usually have relatively high temporal resolution, of twice per day for polar orbiting satellites and 5–30 min for operational geostationary satellites. As a flood is usually a short term event, operational satellites with large area coverage and frequent revisit, either used alone or in combination with other high spatial resolution sensors, or complemented by numerical model simulations, have played significant roles in the detection and monitoring of large floods [18,19,20,21]. For example, Schumann et al. [18] demonstrated an application for the May–June 2015 Texas flood disaster using only satellite observations. In that case, MODIS flood maps at a 250 m resolution were composited with many images from other high resolution sensors like the Landsat 7/8 at 30 m resolution and Sentinel-1 at various resolution, and so on.
MODIS is succeeded by the Visible Infrared Imaging Radiometer Suite (VIIRS) instrument on board the Suomi National Polar-Orbiting Partnership (NPP) satellite and the future Joint Polar Satellite System (JPSS) satellites. The Suomi NPP (SNPP) is a weather satellite operated by the NOAA. Launched in 2011, SNPP serves as a bridge between the Polar Operational Environmental Satellites (POES) satellites and the Joint Polar Satellite System (JPSS). The VIIRS imagery [22] has a moderate spatial resolution of 375 m in the short-wave IR bands, a wide swath coverage of 3000 km, and a relatively constant resolution across the scan. These new features make the VIIRS imagery very attractive for near real-time flood detection. Under the support of the NOAA JPSS program office, near real-time flood maps have been derived from the VIIRS [23,24,25,26]. The SNPP is thus able to provide a flood detection capability to support the National Weather Services (NWS), the U.S. Army Corps of Engineering (USACE), the Federal Emergency Management Agency (FEMA), the U.S. Geological Survey (USGS), and local agencies. Similarly, the GOES-16, previously known as GOES-R before its launch, is an American Geostationary Operational Environmental Satellite (GOES) system operated by NOAA. It is the first of the next generation of geosynchronous environmental satellites, launched on 19 November 2016. The GOES-16 is also the nation’s most advanced geostationary weather satellite. The Advanced Baseline Imager (ABI) on board the GOES-R series provides a significantly improved resolution over the previous GOES 5-channel imager, having a 0.5 km spatial resolution in the visible bands and a 1–2 km spatial resolution in the infrared spectral bands and 5 min temporal resolution [27].
As the VIIRS is an optical sensor, it thus cannot penetrate thick clouds to detect the floodwaters. While microwave sensors can observe the Earth’s surface through non-rainy clouds, but usually with a coarse spatial resolution, for example, for passive microwave sensors, the spatial resolution is in the range from 12 km to 50 km in channels suitable for flood mapping, which is too coarse to observe the small-scale features [25,28]. Radar sensors, such as the Radarsat, synthetic aperture radar (SAR), TerraSAR-X, Sentinel, and so on, can provide observations under cloudy conditions at a high spatial resolution, and therefore play a very important role in flood mapping and disaster relief [29,30,31,32,33,34,35,36]. While these sensors usually have a narrow swath width and long revisit time, they are thus are most likely with a limited area and time coverage, and may not provide continuous observations for floods.
As a flood is usually a short term event, the high temporal resolutions (5–30 min) make the operational geostationary satellite very attractive in dynamic flood monitoring. However, the previous GOES series lacked the near-infrared channel (e.g., 0.86 µm) needed for flood detection; GOES have never been used for flood monitoring. The new near-infrared channel three of the ABI onboard the GOES-16 makes it suitable for monitoring floods. Although GOES-16/ABI is also an optical sensor, its high temporal resolution, available every 5 min, enables it capture some clear sky observations. In this study, for the first time, the nation’s operational geostationary weather satellite, GOES, will be used for the detection and monitoring of floods, and it is also the first time we will explore how to utilize and combine the advantages of operational polar orbiting satellite and geostationary satellite to overcome cloud contamination and improve flood monitoring.

2. Data and Methods

2.1. Data Used

2.1.1. SNPP/VIIRS Data

The SNPP/VIIRS near real-time data are obtained from the SNPP direct-broadcast network and NOAA’s Comprehensive Large Array-Data Stewardship System (CLASS). The following datasets were used for VIIRS flood mapping:
  • SNPP/VIIRS sensor data record (SDR) data at Imager bands 1 (600–680 nm), 2 (850–880 nm), 3 (1610 nm), and 5 (1050–1240 nm) with a 375-m spatial resolution.
  • Geolocation data, including longitude, latitude, solar zenith angles, solar azimuth angles, sensor zenith angles, and sensor azimuth angles (GITCO).
  • SNPP/VIIRS 750-m resolution cloud mask Intermediate Product (IICMO)
  • M-band terrain-corrected geolocation data (GMTCO) are used to help determine cloud cover.
  • Static ancillary datasets include the IGBP global land cover, global land/sea mask, digital elevation model (DEM) from the Shuttle Radar Topography Mission, version 2 (SRTM-2), and Advanced Spaceborne Thermal Emission and Reflection Radiometer (ASTER), MODIS 250-m global water mask (MOD44 W) [37,38], as well as a water layer in the National Land Cover Database 2006 [39].

2.1.2. GOES-R/ABI Data

The GOES-16/ABI near the real-time data are obtained from the GOES-R Program Office, and the NOAA/CLASS.
Furthermore, the GOES-16/ABI near the real-time data, the following ancillary datasets, were also used for GOES-16/ABI flood mapping:
  • ABI sensor zenith and sensor azimuth angles in full disk and CONUS (continental United Sates) provided from GOES-R Program Office
  • ABI 1-km water reference map resampled from 250-m MODIS global water mask (MOD44 W) and 30-m National Land Cover Dataset (NLCD 2006)
  • ABI 1-km land cover dataset from IGBP
  • ABI 1-km land/sea mask
  • ABI 1-km DEM dataset
  • ABI sun glint look-up table
  • ABI surface temperature climatic dataset composited from 10-year MODIS LST and SST datasets
  • ABI albedo climatic dataset in visible channel from MODIS albedo datasets

2.2. Methods

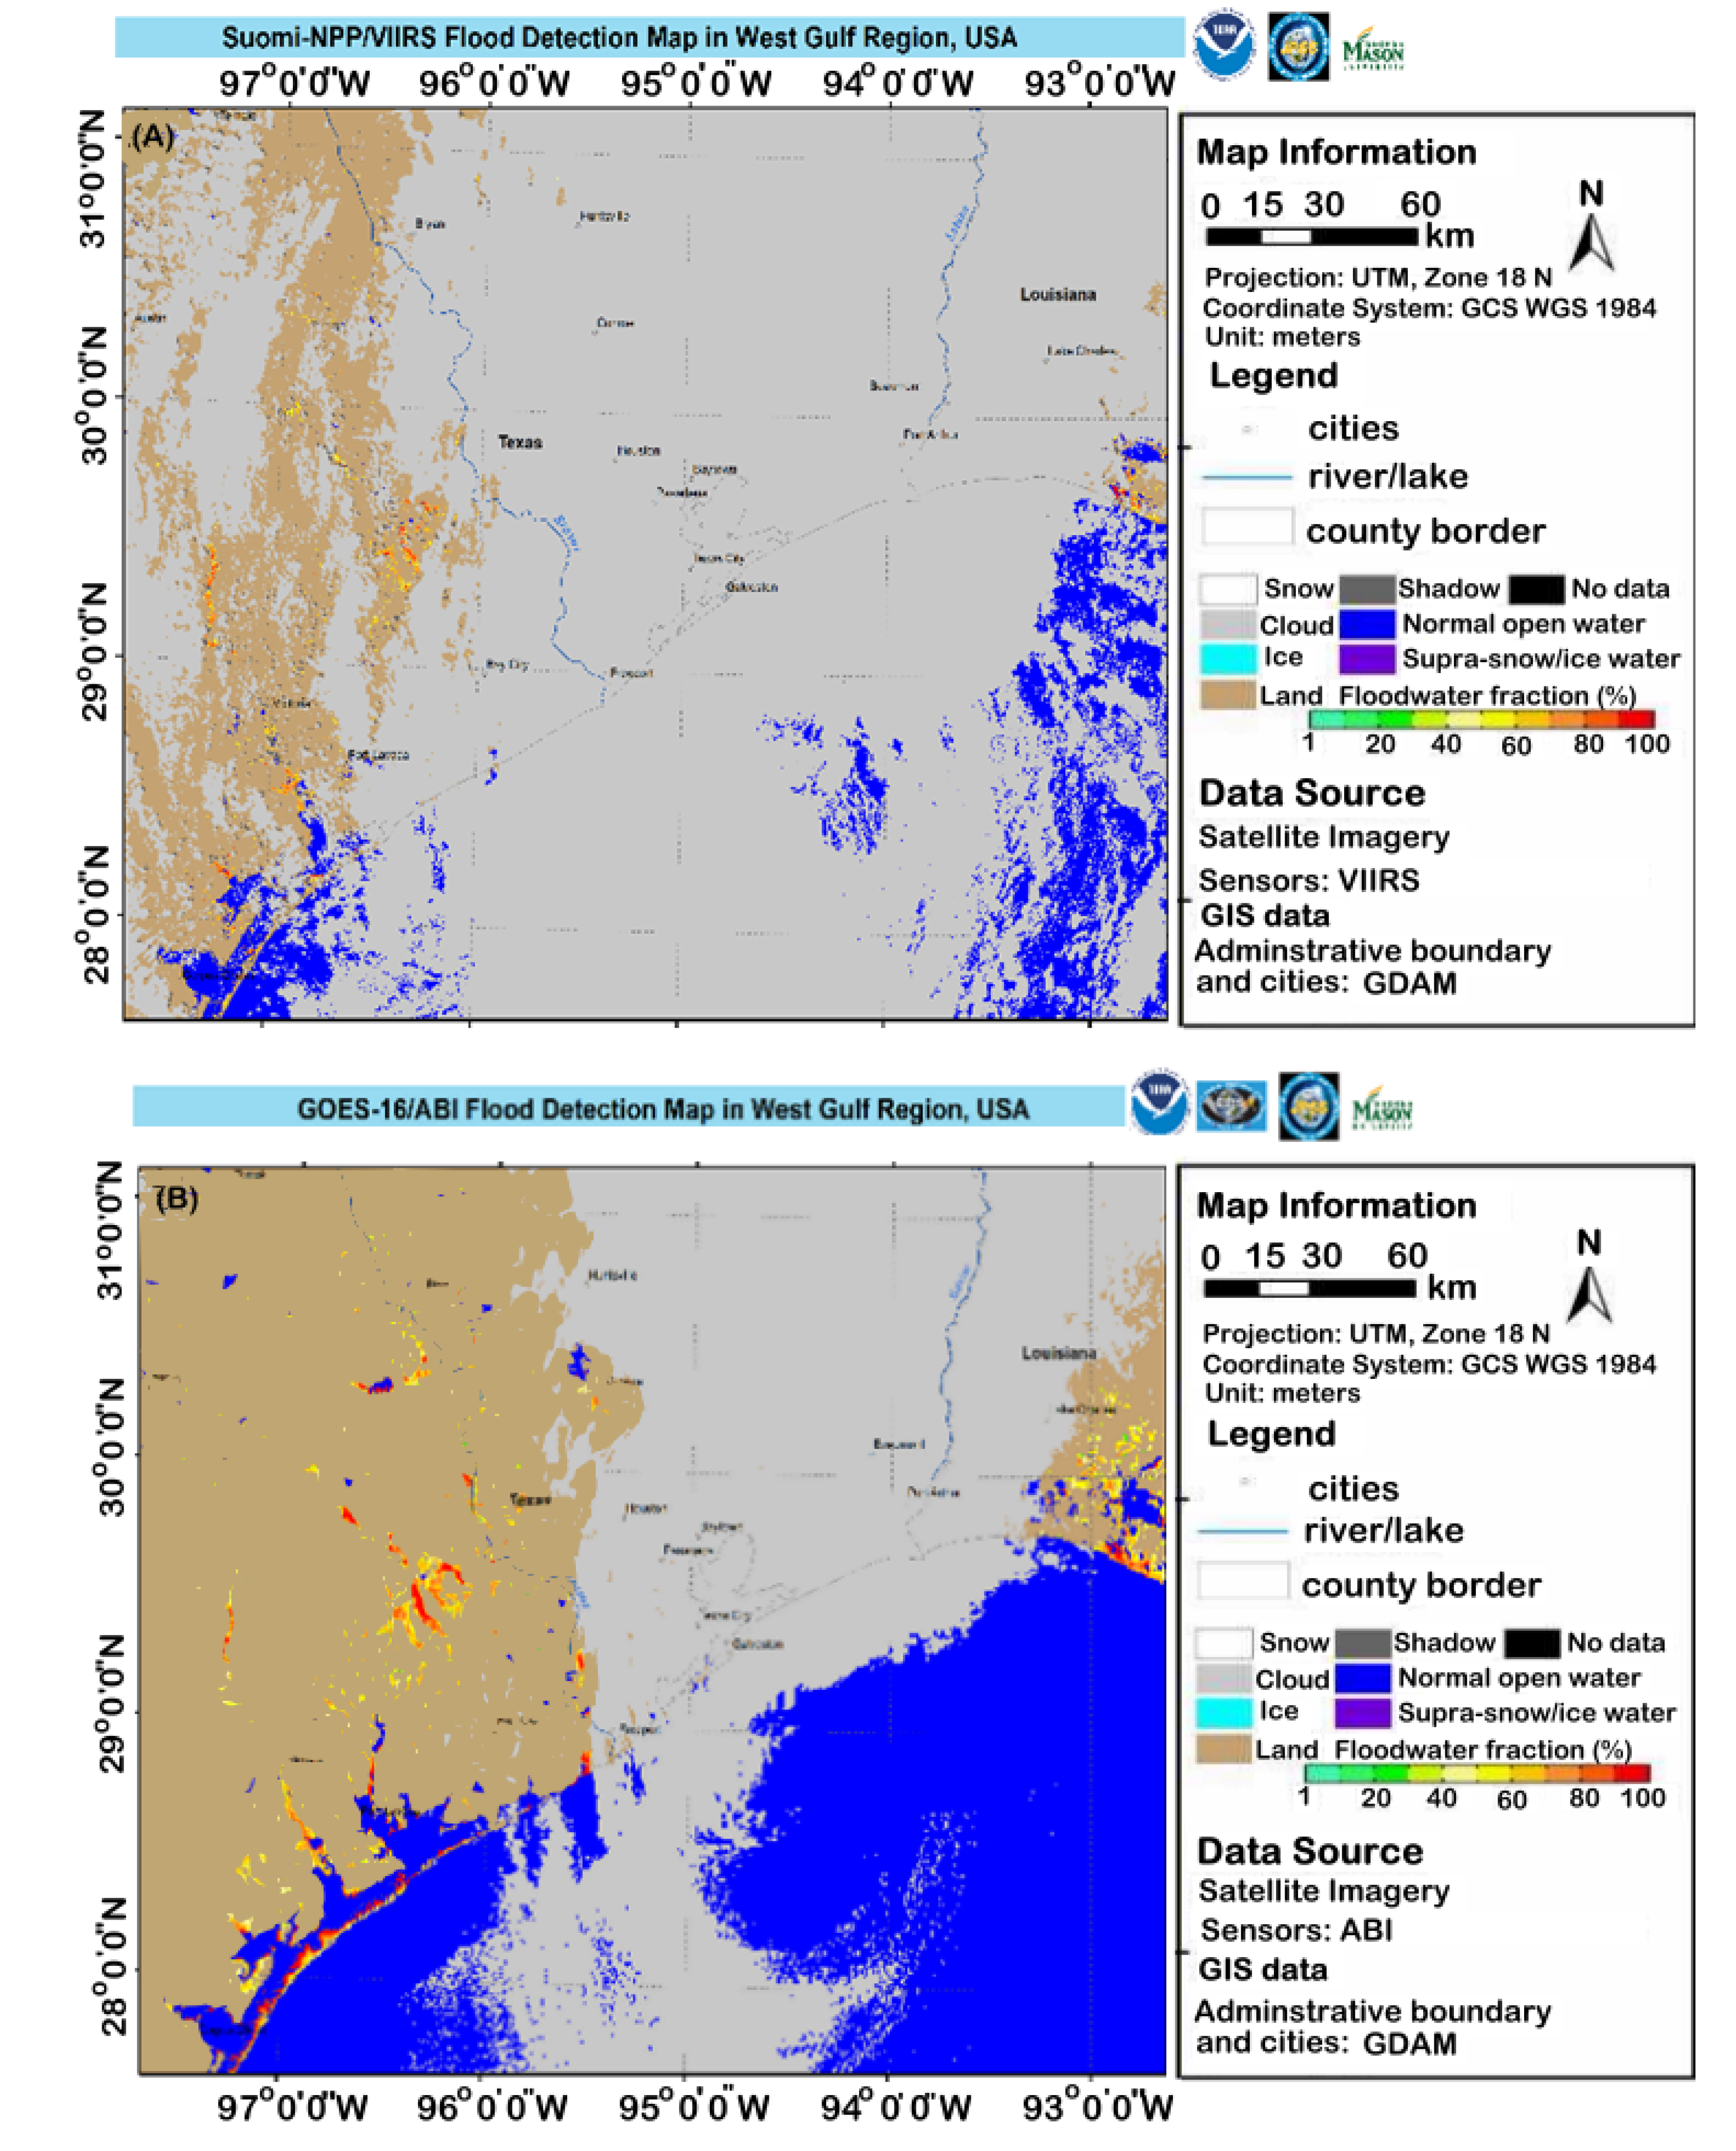
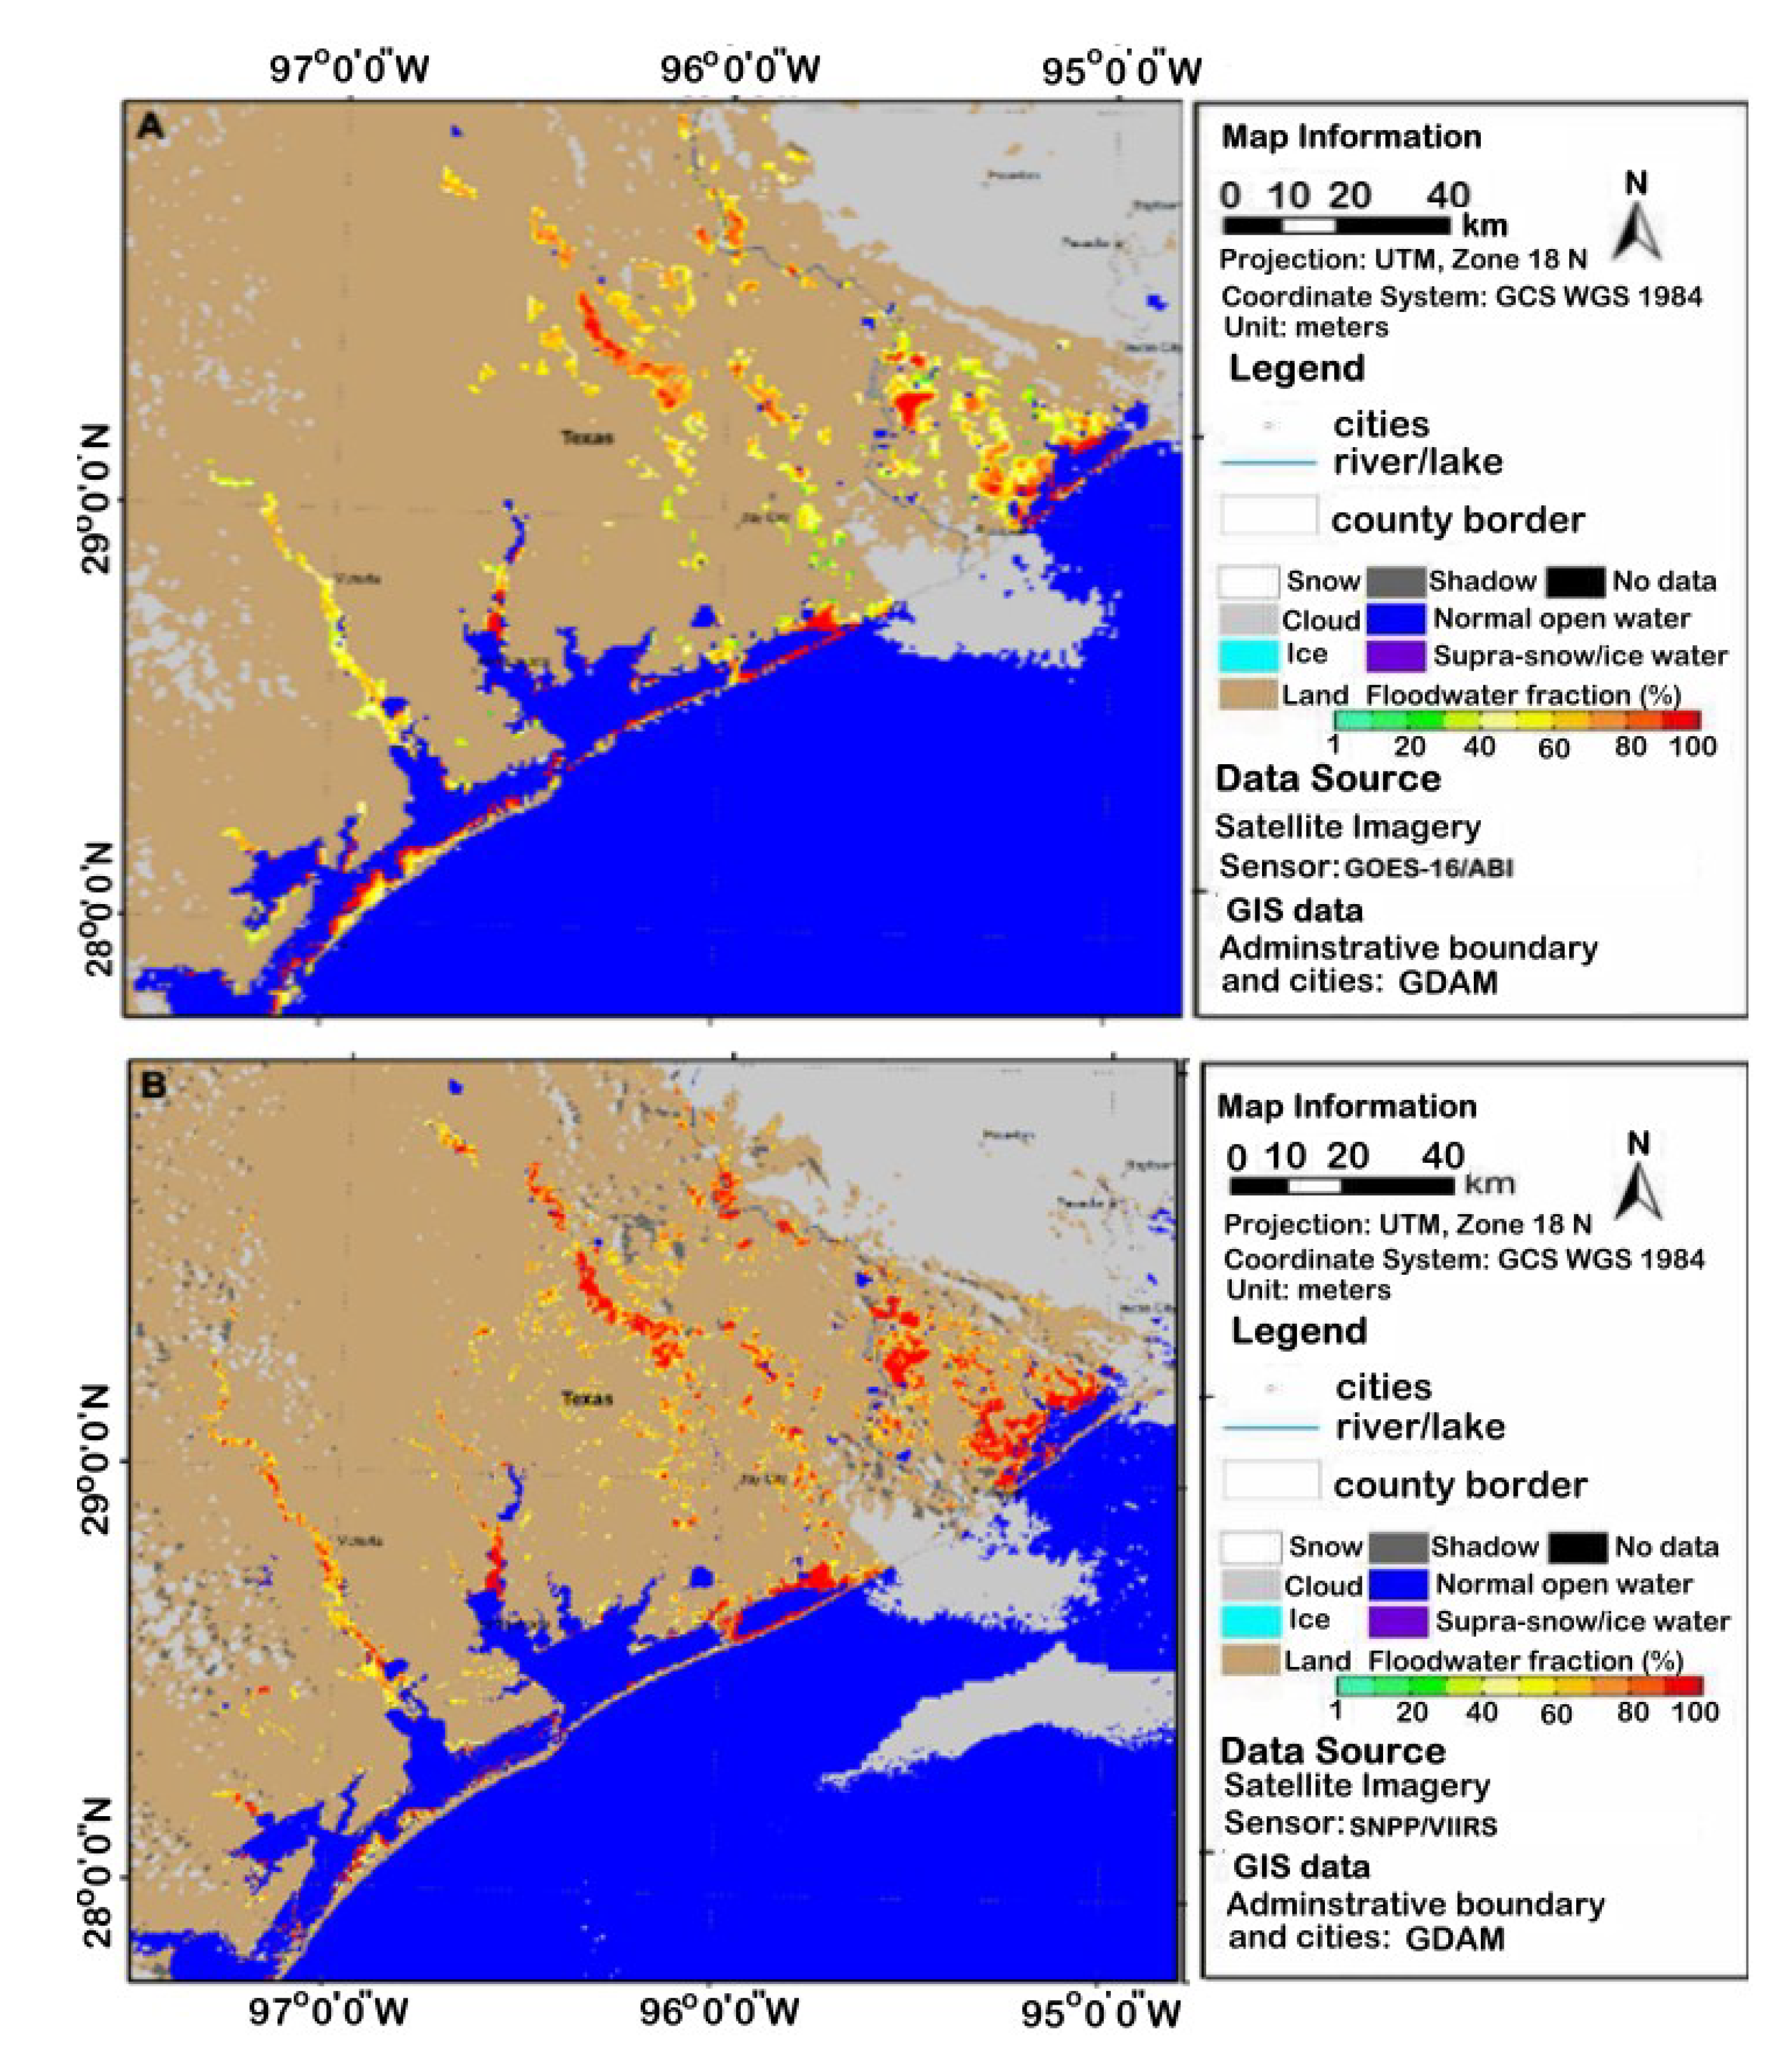
2.2.1. VIIRS Flood Mapping

Flood mapping using SNPP/VIIRS imagery is mainly based on the spectral features in the VIIRS visible, near infrared, and short-wave infrared channels. The developed VIIRS flood mapping software is applied to process the VIIRS data and produce the VIIRS flood maps. A comprehensive introduction to this software package can be found in the reference published in 2017 [26]. The key algorithms supporting the software package include a water detection algorithm based on decision-tree techniques to extract water surface from vegetation, bare land and snow/ice surface [8,9], a geometry-based cloud-shadow removal algorithm to remove cloud shadows from VIIRS flood maps [23], an object-based terrain-shadow removal algorithm to remove terrain shadows from VIIRS flood maps [24], and a dynamic nearest neighboring searching method to retrieve water fractions [10]. The retrieved water fractions are then compared with a water reference map produced from a MODIS global 250-m water mask (MOD44 W) and water layer in the 30-m National Land Cover Dataset in the USA to determine flooding water. In the VIIRS flood maps, the floodwater extent is represented in the floodwater fractions from 1% to 100%.

2.2.2. ABI Flood Mapping

Flood mapping using GOES-16/ABI imagery is actually very similar to VIIRS flood mapping, which is also based on the spectral characteristics in ABI’s visible (ABI band2: 0.64 μm), near infrared (ABI band3: 0.86 μm), and short-wave infrared (ABI band5: 1.6 μm) channels. The algorithms for VIIRS flood mapping are adjusted to match with the calibration performance and spatial resolution of ABI imagery. Then all of the adjusted algorithms are integrated into the ABI flood mapping software to generate ABI flood maps at 1-km spatial resolution every 5 min in the CONUS of USA.

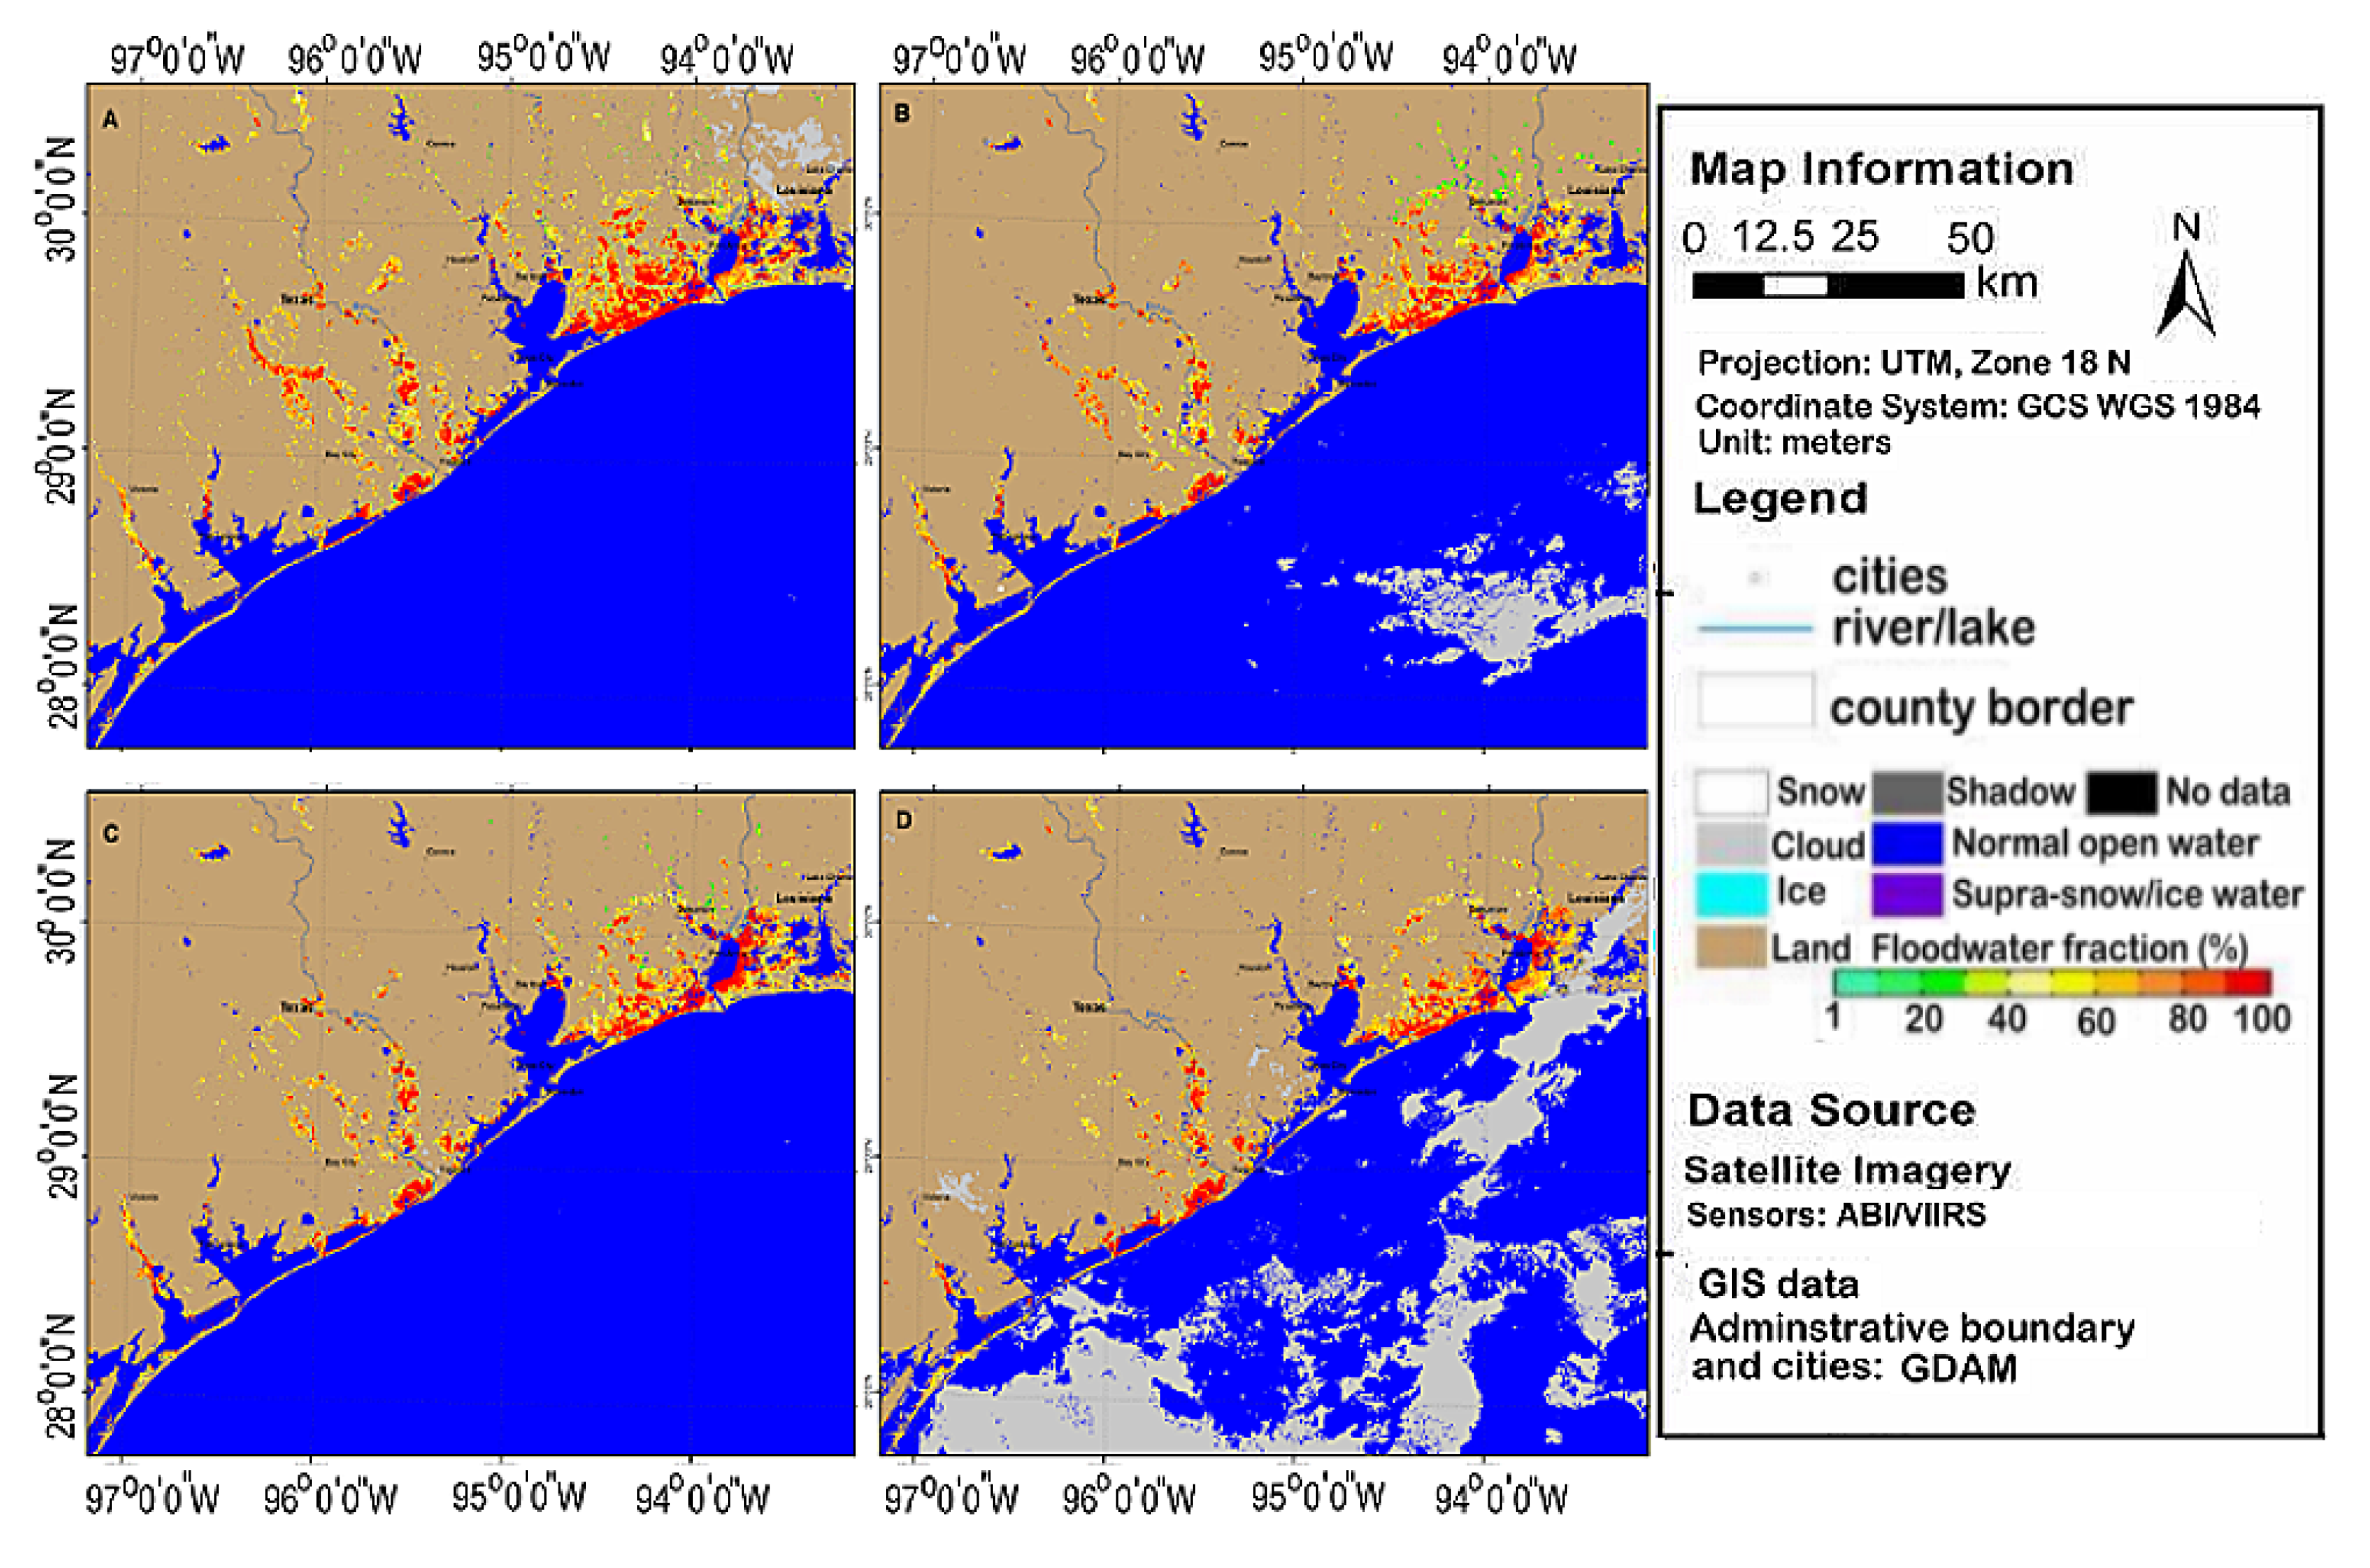
2.2.3. Merge the VIIRS and ABI Flood Mapping

The VIIRS flood maps have a 375-m spatial resolution and show more details than the ABI flood maps. However, the polar-orbit VIIRS imagery can only be available once a day during daytime, and thus may be easily affected by clouds and cloud shadows. The geostationary-orbit ABI flood maps have a 1-km spatial resolution, but are available every 5 min in the CONUS of USA. The frequent observations decrease the impact of the clouds and cloud shadows to a minimum and can derive the maximal clear-sky coverage for flood mapping. Considering the advantages of VIIRS flood maps and ABI flood maps, respectively, merging the two results produces new flood maps that can overcome the shortcomings, while making use of the advantages from the two flood maps.
The merge process is done through a multiple data composition and the nearest neighboring interpolation between the two maps at different spatial resolution. The composition process is applied to derive the maximal flood extent and clear-sky coverage among all of the 5-min ABI flood maps. For the floodwater pixels, the one with the maximal floodwater fractions is selected as the floodwater fraction in the composited flood map. For non-floodwater pixels, the surface type (dry land, snow/ice cover, and open normal water) under clear sky with the most frequency is selected as the type in the composited flood map. For the pixels observed as cloud and shadow in all of the ABI flood maps, they are assigned as cloud and shadow in the composited flood map. In this way, the composition process filters out clouds and shadows to the minimum, and produce an ABI flood map with the maximal clear-sky coverage.
The composited ABI flood map is then spatially matched with the VIIRS flood map through the nearest neighboring interpolation process. All of the clear-sky pixels, including the floodwater pixels, dryland pixels, open normal water pixels, and snow/ice pixels in the VIIRS flood map, are directly kept in the merged flood map. For the cloud and shadow pixels in the VIIRS flood map, if the corresponding pixels in the ABI composited flood map have any clear-sky types, then the clear-sky types in the ABI food map are assigned in the merged flood map. In this way, the gaps caused by the clouds and shadows are filled with the clear-sky info from the ABI detection results, and thus the merged flood map derives the maximal clear-sky coverage from both VIIRS and ABI. Simultaneously, it also keeps the VIIRS’s higher spatial resolution and more detailed clear-sky info.

3. Results

The developed software packages and the methods described above have been applied in the 2017 West Gulf flood caused by Hurricane Harvey, and the combination utilizing the VIIRS and ABI flood maps has shown a substantial improvement on the capability of the optical sensors in flood mapping. Using the SNPP VIIRS and GOES-16 ABI, we find, with the afternoon pass at 19:20 UTC on 29 August 2017, that VIIRS could only observe small portions of the Texas area (Figure 1A), and lots of clouds obscured some of the floodwaters and the non-flooding information, while the high temporal resolution of the GOES-16 ABI allowed for the aggregation of the clear sky observations, thereby creating a composite flood map to detect more flooded areas in western Texas and Louisiana (Figure 1B) than the VIIRS on the same day (Figure 1A). In all of these images, the clouds are shown as light gray, the cloud shadow is shown as dark gray, the normal water is shown as blue, while the flooding water fraction is shown in a continuing color bar from green to red in the range of 0–100%.
On 30 August 2017, the storm and the associated thick clouds finally moved away from the Texas region and provided GOES-16 ABI with an unobstructed view of the severe flooding in the Houston area (Figure 2A). Meanwhile, SNPP VIIRS also had a clear look with its afternoon pass at 19:00 UTC, providing a higher spatial resolution view of the flooded regions (Figure 2B), compared to the GOES-16 ABI at 1 km resolution (Figure 2A).
The frequent updates of the GOES-16 ABI imagery make it easier to catch clear sky observations during daylight hours. The SNPP VIIRS data have a better spatial resolution and may provide a more accurate depiction of the flooding water fraction in the flood map, and thus a more useful guidance for small-scale features within the flooded region. As shown in Figure 2, compared to the ABI flood map at a 1-km spatial resolution, the VIIRS flood map at a 375-m resolution can show more details of the flood extent.
Therefore, the integration of the polar-orbiting and geostationary satellites is an ideal method for improved flood monitoring. The composite GOES-16 ABI flood maps under all of the available clear conditions can be used to fill the cloud gaps in the SNPP VIIRS observations, to produce a merged flood map. These merged flood maps provide not only the most clear-sky coverage, but also maintain the higher spatial resolution achieved through VIIRS. We apply this integrative process to obtain a flood map every day from 30 August to 6 September 2017 during the Hurricane Harvey flood event in the southeastern Texas area. The continuous observations on floodwaters from 31 August to 3 September 2017, shown in Figure 3, demonstrate a slow receding process of floodwaters in this region.
The remotely sensed flood maps obtained from VIIRS and ABI were implemented for damage assessment by FEMA. The distribution map of the likely inundated structures (Figure 4) generated by FEMA shows an example of how GOES-16 ABI and SNPP VIIRS flood maps can potentially help decision-makers to locate the damaged structures likely within the inundated areas during the Hurricane Harvey period for disaster mitigation and relief efforts. According to FEMA’s estimate, 155,000 properties might have been affected by the floodwaters of Harvey, and 3500 structures might have experienced minor damage.

4. Discussion

The operational polar-orbiting and geostationary satellite systems have the advantage of a frequent revisit and wide spatial coverage. The SNPP is the precursor mission of the new generation of the NOAA operational polar orbiting satellites, known as the Joint Polar Satellite System (JPSS). The first satellite of the JPSS series was launched in November 2017, and the series will provide key observations for weather forecasting and environmental intelligence into the late 2030’s. Together, JPSS and GOES-R provide the United States and the global community with advanced capabilities for weather forecasting and real-time situational awareness. The frequent observations (every 5 min) of GOES-16 allowed for more frequent views, thus capturing more clear sky observations and observing more floods than the polar orbiting satellite SNPP/JPSS, while the higher spatial resolution of SNPP VIIRS (each pixel measures about 375 m × 375 m), compared to GOES-16 ABI (each pixel measures 1000 m × 1000 m), captured more details of the flooded regions. Therefore, the integration of the polar-orbiting and geostationary satellites is an ideal method for improved flood monitoring.
The VIIRS and ABI flood maps can be used for damage assessment. Moreover, the VIIRS and ABI flood maps frequently available over large areas can provide a big picture and can be used as a guidance for FEMA to conduct a high water mask survey and request SAR data, which usually has limited spatial and temporal coverage, but with high spatial resolution and the capability to penetrate clouds to watch floods.
This work can be particularly helpful for researchers and scientists working on flood modeling. For example, the National Water Center (NWC) has been using our VIIRS flood maps to evaluate the National Water Model (NWM). The methodology used in the merging process can be applied to enhance the spatial resolution of the flood maps derived from the moderate-to-coarse resolution sensors, and to obtain detailed case studies for the application and validation of flood propagation models. For example, it may be useful for extraordinary flood analysis, such as dam-break/dam-breach flooding or other disasters linked to the flood evolution (e.g., [40,41,42]). The USACE used our enhanced 30-m resolution VIIRS flood maps to monitor dam-breach flooding.

5. Conclusions

In this study, for the first time, the nation’s operational geostationary weather satellite was used for flood monitoring. Compared to the previous GOES series, the new near-infrared channel three (0.86 µm) of the GOES-16 ABI makes it suitable for monitoring floods. The high temporal resolution (5 min) makes the GOES-R series very attractive in dynamic flood monitoring, as a flood is usually a short-term event. It has been found that the high temporal resolution of GOES-16 ABI has enabled it capture frequent cloud free views of the flooding water and the possibility for aggregation of clear sky observations, while the higher spatial resolution of SNPP/VIIRS at 375-m can observe more details of the flooded regions. How to utilize the high temporal resolution of geostationary satellite to overcome cloud contamination was explored. It is also the first time that we made attempts to integrate the two operational weather satellites to make up each other’s shortcomings, while keeping the advantages of each sensor. The results demonstrated that the frequent GOES-16/ABI observations can help solve some cloud contamination problems in the VIIRS flood maps, and thus can provide continuous observations and dynamic monitoring to floodwaters. It is found the integrated VIIRS and ABI flood maps can achieve an improved capability for flood monitoring.
The flood maps derived from the SNPP VIIRS and GOES-16 ABI observations were provided to FEMA continuously during the catastrophic flooding around the Texas and Louisiana areas, due to Hurricane Harvey. According to FEMA’s estimate, approximately 155,000 properties might have been affected by the floodwaters of Hurricane Harvey and about 3500 structures might have experienced minor damages. We tried to make use of the high temporal resolution of GOES-16 to partially solve the cloud contamination problem, although optical remote sensing still has limits and may not be able to remove the clouds completely. However, operational satellites like SNPP/JPSS and GOES-16 have the advantage of large area coverage and frequent revisit. As floods caused more loss of life and property than any other type of severe weather events in the United States, the two operational weather satellites with wide spatial coverage and high temporal resolution will continue playing a critical role in the detection and monitoring of floods.

Funding

This research was funded by NOAA JPSS Program Office and the GOES-R Program Office through the NSF I/UCRC for Spatiotemporal Thinking, Computing, and Applications.

Acknowledgments

The data reported in the paper are presented, archived, or available in the Comprehensive Large Array-data Stewardship System (CLASS) of NOAA. The VIIRS flood product is routinely running at the Space Science and Engineering Center (SSEC) and Geographic Information Network of Alaska (GINA). We thank Jean Fan for her editorial input. The contents are solely the opinions of the authors and do not constitute a statement of policy, decision, or position on behalf of NOAA or the U.S. Government. We thank the reviewers and the editors for their helpful comments! We are grateful to Rayne Ren, Nelson Peng, and Sharon Fan for proofreading the document.

Conflicts of Interest

The authors declare no conflict of interest.

References

  1. Domeneghetti, A.; Carisi, F.; Castellarin, A.; Brath, A. Evolution of flood risk over large areas: Quantitative assessment for the Po River. J. Hydrol. 2015, 527, 809–823. [Google Scholar] [CrossRef]
  2. Schumann, G.J.; Domeneghetti, A. Exploiting the proliferation of current and future satellite observations of rivers. Hydrol. Process. 2016, 30, 2891–2896. [Google Scholar] [CrossRef]
  3. Barton, I.J.; Bathols, J.M. Monitoring floods with AVHRR. Remote Sens. Environ. 1989, 30, 89–94. [Google Scholar] [CrossRef]
  4. Ali, A. Study of river flood hydrology in Bangladesh with AVHRR data. Int. J. Remote Sens. 1989, 10, 1873–1892. [Google Scholar] [CrossRef]
  5. Sheng, Y.; Xiao, Q. Water Identification in Cloud-contaminated NOAA/AVHRR Imagery. Remote Sens. Environ. China 1994, 9, 247–255. [Google Scholar]
  6. Sheng, Y.; Su, Y.; Xiao, Q. Challenging the cloud-contamination problem in flood monitoring with NOAA/AVHRR imagery. Photogramm. Eng. Remote Sens. 1998, 64, 191–198. [Google Scholar]
  7. Sheng, Y.; Gong, P. Quantitative dynamic flood monitoring with NOAA AVHRR. Int. J. Remote Sens. 2001, 22, 1709–1724. [Google Scholar] [CrossRef]
  8. Sun, D.L.; Yu, Y.; Goldberg, M.D. Deriving water fraction and flood maps from MODIS images using a decision tree approach. IEEE J. Sel. Top. Appl. Earth Obs. Remote Sens. 2011, 4, 814–825. [Google Scholar] [CrossRef]
  9. Sun, D.L.; Yu, Y.; Zhang, R.; Li, S.; Goldberg, M.D. Towards Operational Automatic Flood Detection Using EOS/MODIS data. Photogramm. Eng. Remote Sens. 2012, 78, 637–646. [Google Scholar] [CrossRef]
  10. Li, S.; Sun, D.; Yu, Y.; Csiszar, I.; Stefanidis, A.; Goldberg, M.D. A New Shortwave Infrared (SWIR) Method for Quantitative Water Fraction Derivation and Evaluation with EOS/MODIS and Landsat/TM data. IEEE Trans. Geosci. Remote Sens. 2012, 51, 1852–1862. [Google Scholar] [CrossRef]
  11. Li, S.; Sun, D.; Goldberg, M.D.; Stefanidis, A. Derivation of 30-m-resolution Water Maps from TERRA/MODIS and SRTM. Remote Sens. Environ. 2013, 134, 417–430. [Google Scholar] [CrossRef]
  12. Gupta, R.P.; Bodechtel, J. Geotechnical applications of Landsat image analysis of Bhakra dam reservoir, India. Remote Sens. Environ. 1982, 12, 3–13. [Google Scholar] [CrossRef]
  13. Gupta, R.P.; Banerji, S. Monitoring of reservoir volume using Landsat data. J. Hydrol. 1985, 77, 159–170. [Google Scholar] [CrossRef]
  14. Wang, Y.; Colby, J.D.; Mulcahy, K.A. An efficient method for mapping flood extent in a coastal floodplain using Landsat TM and DEM data. Int. J. Remote Sens. 2002, 23, 3681–3696. [Google Scholar] [CrossRef]
  15. Mueller, N.; Lewis, A.; Roberts, D.; Ring, S.; Melrose, R.; Sixsmith, J.; Lym-Burner, L.; McIntyre, A.; Tan, P.; Curnow, S.; et al. Water observations from space: Mapping surface water from 25 years of Landsat imagery across Australia. Remote Sens. Environ. 2016, 174, 341–352. [Google Scholar] [CrossRef]
  16. Fisher, A.; Flood, N.; Danaher, T. Comparing Landsat water index methods for automated water classification in eastern Australia. Remote Sens. Environ. 2016, 175, 167–182. [Google Scholar] [CrossRef]
  17. Tulbure, M.G.; Broich, M.; Stehman, S.V.; Kommareddy, A. Surface water extent dynamics from three decades of seasonally continuous Landsat time series at subcontinental scale in a semi-arid region. Remote Sens. Environ. 2016, 178, 142–157. [Google Scholar] [CrossRef]
  18. Schumann, G.; Frye, S.; Wells, G.; Adler, R.; Brakenridge, R.; Bolten, J.; Murray, J.; Slayback, D.; Policelli, F.; Kirschbaum, D.; et al. Unlocking the full potential of Earth observation during the 2015 Texas flood disaster. Water Resour. Res. 2016, 52, 3288–3293. [Google Scholar] [CrossRef] [Green Version]
  19. Schumann, G.J.-P. Flood response using Earth observation data and products. EOS 2016, 97, 704–716. [Google Scholar] [CrossRef]
  20. Schumann, G.J.-P. Preface: Remote sensing in flood monitoring and management. Remote Sens. 2015, 7, 17013–17015. [Google Scholar] [CrossRef]
  21. Martinis, S.; Twele, A.; Strobl, C.; Kersten, J.; Stein, E. A multi-scale flood monitoring system based on fully automatic MODIS and TerraSAR-X processing chains. Remote Sens. 2013, 5, 5598–5619. [Google Scholar] [CrossRef] [Green Version]
  22. Cao, C.; De Luccia, F.J.; Xiong, X.; Wolfe, R.; Weng, F. Early On-Orbit Performance of the Visible Infrared Imaging Radiometer Suite Onboard the Suomi National Polar-Orbiting Partnership (S-NPP) Satellite. IEEE Trans. Geosci. Remote Sens. 2014, 52, 1142–1156. [Google Scholar] [CrossRef]
  23. Li, S.; Sun, D.; Yu, Y. Automatic cloud-shadow removal from flood/standing water maps using MSG/SEVIRI imagery. Int. J. Remote Sens. 2013, 34, 5487–5502. [Google Scholar] [CrossRef]
  24. Li, S.; Sun, D.; Goldberg, M.D.; Sjoberg, W. Object-based automatic terrain shadow removal from SNPP/VIIRS flood maps. Int. J. Remote Sens. 2015, 36, 5504–5522. [Google Scholar] [CrossRef]
  25. Sun, D.; Li, S.; Zheng, W.; Croitoru, A.; Stefanidis, A.; Goldberg, M.D. Mapping floods due to Hurricane Sandy using NPP VIIRS and ATMS data and geotagged Flickr imagery. Int. J. Dig. Earth 2015, 9, 427–441. [Google Scholar] [CrossRef]
  26. Li, S.; Sun, D.; Goldberg, M.D.; Sjoberg, W.; Santek, D.; Hoffman, J.P.; DeWeese, M.; Restrepo, P.; Lindsey, S.; Holloway, E. Automatic near real-time flood detection using Suomi-NPP/VIIRS data. Remote Sens. Environ. 2017, 204, 672–689. [Google Scholar] [CrossRef]
  27. Schmit, T.J.; Gunshor, M.; Menzel, W.P.; Gurka, J.; Li, J.; Bachmeier, A.S. Introducing the Next-Generation Advanced Baseline Imager on GOES-R. Bull. Am. Meteorol. Soc. 2005, 86, 1079–1096. [Google Scholar] [CrossRef]
  28. Zheng, W.; Sun, D.; Li, S. Mapping coastal floods induced by hurricane storm surge using ATMS data. Int. J. Remote Sens. 2017, 38, 6846–6864. [Google Scholar] [CrossRef]
  29. Matgen, P.; Schumanna, G.; Henryc, J.-B.; Hoffmanna, L.; Pfistera, L. Integration of SAR-derived river inundation areas, high-precision topographic data and a river flow model toward near real-time flood management. Int. J. Appl. Earth Obs. Geoinf. 2007, 9, 247–263. [Google Scholar] [CrossRef]
  30. Schumann, G.; Hostache, R.; Puech, C.; Hoffmann, L.; Matgen, P.; Pappenberger, F.; Pfister, L. High-Resolution 3-D Flood Information From Radar Imagery for Flood Hazard Management. IEEE Trans. Geosci. Remote Sens. 2007, 45, 1715–1725. [Google Scholar] [CrossRef]
  31. Martinis, S.; Twele, A.; Voigt, S. Towards operational near real-time flood detection using a split-based automatic thresholding procedure on high resolution TerraSAR-X data. Nat. Hazards Earth Syst. Sci. 2009, 9, 303–314. [Google Scholar] [CrossRef] [Green Version]
  32. Matgen, P.; Hostache, R.; Schumann, G.; Pfister, L.; Hoffmann, L.; Savenije, H. Towards an automated SAR-based flood monitoring system: Lessons learned from two case studies. Phys. Chem. Earth 2011, 36, 241–252. [Google Scholar] [CrossRef]
  33. Kuenzer, C.; Guo, H.; Huth, J.; Leinenkugel, P.; Li, X.; Dech, S. Flood mapping and flood dynamics of the Mekong delta: ENVISAT-ASAR-WSM based time series analyses. Remote Sens. 2013, 5, 687–715. [Google Scholar] [CrossRef] [Green Version]
  34. Schlaffer, S.; Matgen, P.; Hollaus, M.; Wagner, W. Flood detection from multi-temporal SAR data using harmonic analysis and change detection. Int. J. Appl. Earth Obs. Geoinf. 2015, 38, 15–24. [Google Scholar] [CrossRef]
  35. Vanderhoof, M.K.; Distler, H.E.; Mendiola, D.A.T.G.; Lang, M. Integrating Radarsat-2, Lidar, and Worldview-3 Imagery to Maximize Detection of Forested Inundation Extent in the Delmarva Peninsula, USA. Remote Sens. 2017, 9, 105. [Google Scholar] [CrossRef]
  36. Frappart, F.; Bourrel, L.; Brodu, N.; Riofrío Salazar, X.; Baup, F.; Darrozes, J.; Pombosa, R. Monitoring of the Spatio-Temporal Dynamics of the Floods in the Guayas Watershed (Ecuadorian Pacific Coast) Using Global Monitoring ENVISAT ASAR Images and Rainfall Data. Water 2017, 9, 12. [Google Scholar] [CrossRef]
  37. Rabus, B.; Eineder, M.; Roth, A.; Bamler, R. The shuttle radar topography mission- a new class of digital elevation models acquired by spaceborne radar. Photogramm. Remote Sens. 2003, 57, 241–262. [Google Scholar] [CrossRef]
  38. Carroll, M.; Townshend, J.; DiMiceli, C.; Noojipady, P.; Sohlberg, R. A New Global Raster Water Mask at 250 Meter Resolution. Int. J. Dig. Earth 2009, 2, 291–308. [Google Scholar] [CrossRef]
  39. Xian, G.; Homer, C.; Dewitz, J.; Fry, J.; Hossain, N.; Wickham, J. The change of impervious surface area between 2001 and 2006 in the conterminous United States. Photogramm. Eng. Remote Sens. 2011, 77, 758–762. [Google Scholar]
  40. Oubanas, H.; Gejadze, I.; Malaterre, P.-O.; Mercier, F. River discharge estimation from synthetic SWOT-type observations using variational data assimilitation and the full Saint-Venanthydrualic model. J. Hydrol. 2018, 559, 638–647. [Google Scholar] [CrossRef]
  41. Macchione, F.; Costabile, P.; Costanzo, C.; Lorenzo, G.D.; Razdar, B. Dam breach modelling: Influence on downstream water levels and a proposal of a physically based module for flood propagation software. J. Hydroinform. 2016, 18, 615–633. [Google Scholar] [CrossRef]
  42. Bates, P.D. Remote Sensing and flood inundation modelling. Hydrol. Process. 2002, 18, 2593–2597. [Google Scholar] [CrossRef]
Figure 1. Flood map from the Suomi National Polar-Orbiting Partnership Satellite (SNPP) Visible Infrared Imaging Radiometer Suite (VIIRS) observations (A) and the new Geostationary Operational Environmental Satellite (GOES)-16 Advanced Baseline Imager (ABI) maximum flood extent map composited from 14:47 to 15:57 UTC (B) on 29 August 2017.
Remotesensing 10 01256 g001
Figure 2. The GOES-16 ABI flood map around 19:02 UTC (A) and the SNPP VIIRS flood map at 19:00 UTC (B) on 30 August 2017.
Remotesensing 10 01256 g002
Figure 3. Flood maps integrated from GOES-16 ABI and SNPP VIIRS observations on (A) 31 August, (B) 1 September, (C) 2 September, and (D) 3 September 2017.
Remotesensing 10 01256 g003
Figure 4. VIIRS flood map is implemented by the Federal Emergency Management Agency (FEMA) for damage assessment.
Remotesensing 10 01256 g004

