Technical Note

Vertically Resolved Precipitation Intensity Retrieved through a Synergy between the Ground-Based NASA MPLNET Lidar Network Measurements, Surface Disdrometer Datasets and an Analytical Model Solution

1
CNR-IMAA, Consiglio Nazionale delle Ricerche, Contrada S. Loja snc, Tito Scalo, 85050 Potenza, Italy
2
JCET-UMBC, University of Maryland Baltimore County, Baltimore, MD 21228, USA
3
CNR-ISAC, Consiglio Nazionale delle Ricerche, Roma, Via del Fosso del Cavaliere 100, 00133 Roma, Italy
4
Dipartimento di Fisica, Università degli Studi di Ferrara, Via Saragat 1, 44121 Ferrara, Italy
5
Naval Research Laboratory, Monterey, CA 93940, USA
6
CommSensLab, Department of Signal Theory and Communications, Universitat Politècnica de Catalunya, 08034 Barcelona, Spain
7
Ciències i Tecnologies de l’Espai—Centre de Recerca de l’Aeronàutica i de l’Espai/Institut d’Estudis Espacials de Catalunya (CTE-CRAE / IEEC), Universitat Politècnica de Catalunya, 08034 Barcelona, Spain
8
NASA GSFC, Code 612, Greenbelt, MD 20771, USA
9
Dipartimento Di Matematica, Università degli Studi di Roma II, Via della Ricerca Scientifica 1, 00133 Rome, Italy
10
GRASI S.r.l., Via Tumoli, 03100 Frosinone, Italy
11
Environmental Modeling Laboratory, Universitat Politècnica de Catalunya, 08007 Barcelona, Spain
12
Department of Applied Physics—Meteorology, University of Barcelona, 08007 Barcelona, Spain
13
Meteorological Surveillance and Forecasting Group, DT Catalonia, Agencia Estatal de Meteorología (AEMET), DT Catalonia. Arquitecte Sert, 1, 08003 Barcelona, Spain
*
Author to whom correspondence should be addressed.
Remote Sens. 2018, 10(7), 1102; https://doi.org/10.3390/rs10071102
Submission received: 18 May 2018 / Revised: 5 July 2018 / Accepted: 9 July 2018 / Published: 11 July 2018

Abstract

:
In this paper, we illustrate a new, simple and complementary ground-based methodology to retrieve the vertically resolved atmospheric precipitation intensity through a synergy between measurements from the National Aeronautics and Space Administration (NASA) Micropulse Lidar network (MPLNET), an analytical model solution and ground-based disdrometer measurements. The presented results are obtained at two mid-latitude MPLNET permanent observational sites, located respectively at NASA Goddard Space Flight Center, USA, and at the Universitat Politècnica de Catalunya, Barcelona, Spain. The methodology is suitable to be applied to existing and/or future lidar/ceilometer networks with the main objective of either providing near real-time (3 h latency) rainfall intensity measurements and/or to validate satellite missions, especially for critical light precipitation (<3 mm h 1 ).

Graphical Abstract

1. Introduction

Rain and precipitation fundamentally influence life on Earth. With respect to the Earth-Atmosphere system, they play a role in pairing water and energy cycles, serving as a proxy for latent heat in the atmosphere. In fact, precipitation, modulating the latent heat content in the atmosphere [1], also modifies atmospheric column thermodynamics, affecting cloud lifetime [2]. Moreover, the hydrological cycle, which characterizes the continuous exchange of water in all its three phases, below and above the earth surface, is strongly dependent on precipitation. As a result, characterizing rainfall intensity and its variability at a global scale, is crucial not only to improving our knowledge of the hydrological cycle, but also to reducing uncertainties of global climate change model predictions for future environmental scenarios. Understanding rainfall accumulation paths, together with their spatial variability, besides helping in identifying world regions subject to drought and flooding, is of fundamental importance in reducing global climate models uncertainty to forecasting global temperature change [3]. In this context and thanks to the technological progress in satellite remote sensing techniques, the National Aeronautics and Space Administration (NASA) launched jointly with the Japan Aerospace Exploration Agency (JAXA) the Tropical Rainfall Measuring Mission (TRMM) followed by the Global Precipitation Measurement (GPM) [1]. The main objective of TRMM missions was to monitor and study precipitation with satellite measurements in the tropics where two-thirds of global precipitations occurs.
GPM further extended the measurement range towards the polar regions, (i.e., up to 69 N/S). NASA is at the forefront for retrievals for vertically resolved microphysical rain drop properties from ground-based multi-wavelength lidar measurements [4] and their improvement through comparison with an analytical model solution that uses disdrometer and radiosonde data as inputs [5]. Taking advantage of the experience gained in these previous studies, we develop in this paper a new methodology to retrieve range-resolved rainfall intensity through a synergy between elastic lidar measurements, disdrometer data and an analytical model solution. Measurements obtained with this simple method, if implemented globally through existing or future lidar Level 2 algorithms and output datasets, will fill a gap to help validate satellite data for light precipitation (intensity < 3 mm h 1 ) for which current global climate model predictions are in disagreement [1]. Results obtained from two mid-latitude NASA Micro Pulse Lidar NETwork (MPLNET [6]) permanent observational sites, one located at Goddard Space Flight Center (GSFC), USA, and the other at the Universitat Politècnica de Catalunya (UPC), Spain, are presented.

2. Materials and Methods

2.1. MPLNET Lidar Data Measurements

The ground-based lidar systems used in this study are the elastic polarization-sensitive micro pulse lidar (P-MPL v. 4B, Sigma Space Corp., now LEICA Geosystems, Lanham, MD, USA), which are deployed at two permanent MPLNET lidar network observational sites. The purpose of the NASA MPLNET network [6], active since 1999, is to retrieve automatically and continuously the geometrical and optical aerosol and cloud properties under most meteorological conditions and to the limit of laser signal attenuation. Measurements and retrievals obtained from worldwide deployed permanent stations are publicly available at MPLNET website [7]. Multi-year network data were previously analyzed to assess cloud [7,8,9,10] and aerosol [2,11,12] radiative effects.
The P-MPL samples the atmosphere with a relatively high frequency (2500 Hz) using a low-energy ( 7 μ J) Nd:YAG (neodymium-doped yttrium aluminum garnet) laser at 532 nm. The P-MPL acquisition settings at the two sites focused upon in this study follow the NASA MPLNET temporal and spatial specifications (60 s integration time and 75 m vertical resolution for GSFC and 60 s and 30 m for UPC). Polarization capabilities rely on the collection of two-channel measurements (i.e., the signal measured in the so-called ‘co-polar‘ and ‘cross-polar’ channels of the instrument, respectively denoted as P c o (z) and P c r (z). For reference, these channels are not to be confused with traditional linear depolarization measurements, where co- and cross-polar channels represent those linear states with respect to the linearly-polarized laser source (e.g., [13]). The MPL uses a nematic liquid crystal switching between two states [14,15]. In one of them, the crystal behaves like an isotropic medium, not having an effect on the wave propagating through it. In the other state, the crystal behaves as a quarter wave plate with principal axes at 45 with respect to the polarization direction of the transmitted electric field. The total power, P, is reconstructed as P = P c o + 2P c r [16,17]). The signal, P, multiplied by the squared range is the basis for retrieving all of the different Level 2 cloud and aerosol products [18,19]. Since the P-MPL is a single wavelength lidar, however, the retrieval of the vertically-resolved microphysical and optical aerosol properties are subject to stronger assumptions with respect to multi-wavelength lidars [20].
Among the newly available MPLNET Version 3 (V3) release products, we specifically consider here the Level 1 V3 Cloud algorithm (beta product) [21], which automatically retrieves the cloud base height that is used to correctly compute the precipitating drop size distribution from the ground. The MPLNET systems used are those of the Universitat Politècnica de Catalunya (UPC), Barcelona, Spain, (41.38N, 2.11E, 115 m a.s.l.) and of the Goddard Space Flight Center (GSFC), USA, (38.99N, 76.84W, 50 m a.s.l.).

2.2. Disdrometer

The disdrometer is an in situ measurement device designed to measure the drop size distribution (DSD; [22]), represented as the number of drops per unit of volume and per unit of raindrop diameter. Disdrometers can be based on different measurement principles (high-speed cameras, Doppler effect, laser-optical, impact, etc.). Two different versions of the Parsivel laser-optical disdrometer manufactured by OTT [23] are installed at UPC and GSFC, namely the first generation Parsivel (Parsivel 1 ) and the second generation Parsivel (Parsivel 2 ), respectively. Parsivel systems were originally developed by PM Tech Inc., now OTT Hydromet, Kempten, Germany. The instrument has a laser diode (emitting wavelength of 780 nm) generating a horizontal flat beam. The measurement area is nominally 48 cm 2 for the first generation Parsivel and 54 cm 2 for Parsivel 2 .
When a hydro-meteor passes through the laser beam, it produces attenuation proportional to its size. A relationship between the laser beam occlusion by the falling particle is applied to estimate the particle size. Parsivel instruments can measure particle diameters up to about 25 mm classifying them in 32 size classes of different width. The instrument also estimates the hydro-meter fall velocity by measuring the time necessary for the particle to pass through the laser beam, and thus it stores particles in 32 × 32 matrices. The disdrometers high temporal resolution (60 s for this work) permits study in great detail of physical precipitation variability.

2.3. The Analytical Model Solution

In its original version of the subject model [24], the analytical model solution, based on molecular diffusivity of water vapor in air, permits calculating the evaporation power of a generic atmospheric layer in stationary thermodynamic conditions through the variable D * , which is the initial diameter of a raindrop that evaporates completely after traveling a certain distance in the incident atmospheric layer. Conversely, for our purposes, instead of D * , we reconstruct backwards the vertically-resolved profile of the raindrop diameter, starting from D 0 , measured at the surface by the disdrometer, up to the cloud base at the radiosonding (or the atmospheric model) vertical resolution. The analytical model solution has been previously validated in [5].
In more detail, if the atmosphere is not saturated with respect to the water vapor, a raindrop evaporates through diffusion, which is assumed to be proportional to the water vapor gradient between raindrop surface and the environment [24]. The raindrop mass changes with time t following Equation (1):
d m d t = 4 π r D υ f υ Δ ρ υ ,
where m is the mass of the raindrop having radius r; and D υ is the water vapor diffusivity in air, f υ is the vapor diffusion ventilation coefficient and Δ ρ υ is the gradient of water vapor density between raindrop surface and the atmosphere. f υ can be expressed through υ , the air kinematic viscosity, the diffusivity D υ , raindrop terminal fall velocity V and raindrop diameter D [24]:
f ν = 0.78 + 0.308 υ D υ 1 3 V D υ 1 2 .
In turn, D υ and υ are depending on atmosphere thermodynamics as pressure and temperature. The water vapor density difference Δ ρ υ can be determined from the atmospheric sounding and raindrop temperature, which is determined from heat balance raindrop equation:
L d m d t = 4 π r K f h Δ T ,
where L is the water vaporization latent heat, K is the air thermal conductivity, f h is the heat ventilation coefficient, and Δ T the temperature difference between the environment and the raindrop. As stated in [24], the error assuming equality between the diffusion ventilation coefficient for vapor and heat is small and justified by the other approximations. Equation (1) can be rewritten as:
V D d D d h = 4 ρ w D υ f υ Δ ρ υ ,
where h is the vertical coordinate measured from a certain reference level downward, ρ w is the water density. Ventilation coefficient and diffusivity show a very low variability with height. It is then possible to represent them by their midlevel values in the considered layer as D υ m and f υ m . Using those values and representing the terminal fall velocity as V = V m ρ m ρ 0.4 (m subscript indicates density and velocity midlevel values) [24], Equation (4) becomes:
V m D d D f υ m = ρ m ρ 0.4 4 ρ w D υ m Δ ρ υ d h .
In Equation (5), the right side is only height h dependent, while the left side is a function of raindrop diameter D only. Likewise, Δ ρ υ is just depending on h and the atmospheric thermodynamics. Following the approach of Li [24], the left side integral of Equation (5) can be fit using a quadratic formula as:
F ( D ) = 0 D V m D f υ m d D c 1 D + c 2 D 2 ,
where c 1 and c 2 are the best-fit values. As an example, at 800 hPA (midlevel point) corresponding to a temperature T = 283 K, c 1 = 2.008 cm 2 s 1 and c 2 = 30.146 cm s 1 . The two coefficients should be calculated on a case-by-case basis depending on midlevel point and temperature. Our methodology computes the DSD from surface (measured by the disdrometer) up to cloud base at the same spatial resolution of the sounding or a complementary atmospheric model. If a generic raindrop exhibits a diameter D 0 (measured by the disdrometer) at the surface, at the top of the first considered layer (at height h 1 ), its diameter will be D 1 . In general, if a raindrop exhibits a diameter of D 1 at range h 1 (bottom of the layer) through the analytical model solution, it is possible to compute the value of the raindrop diameter D 2 at height h 2 (top of the layer) as:
( c 1 D 1 + c 2 D 1 2 ) ( c 1 D 2 + c 2 D 2 2 ) = h 1 h 2 ρ m ρ 0.4 4 ρ w D υ m Δ ρ υ d h E ( h 1 , h 2 ) .
Again, the function E ( h 1 , h 2 ) defined as the integral of the right side of Equation (7) is fully determined by the vertical distribution of the thermodynamic variables in the considered layer (i.e., temperature, pressure and water vapor). Consequently, starting from raindrop diameter measurements at the surface, it is possible to estimate the raindrop diameter profile up to the cloud base just knowing the atmosphere thermodynamics. The cloud base height is retrieved using the operational MPLNET lidar product [21]. If the sounding data are unavailable or too far from the measurement site, the atmospheric thermodynamics variables can be obtained from NASA Goddard Modeling and Assimilation Office, version 5.9.1 reanalysis; GEOS-5 [21]), available every three hours and collocated at each MPLNET station.
For each range bin, at the radiosonde or GEOS-5 model resolution, the atmosphere is assumed to be steady. The primary limitation of the analytical model solution is that it does not take into account processes that affect raindrop diameter, such as coalescence and collision. For this reason, this method is more suitable for light intensity rainfall, where those processes are not significant. Moreover, since the methodology further depends on lidar/ceilometer measurements, the rain intensity will affect the instrument signal-to-noise Ratio (SNR). Thus, the lidar/ceilometer signal will only be available up to the cloud base in light intensity rainfall given the potential limits of signal attenuation in heavier showers.

3. Results and Discussion

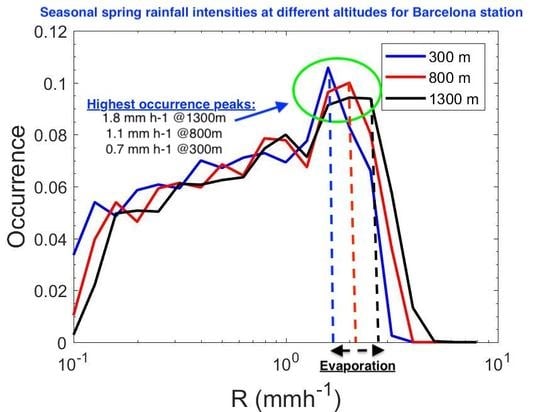
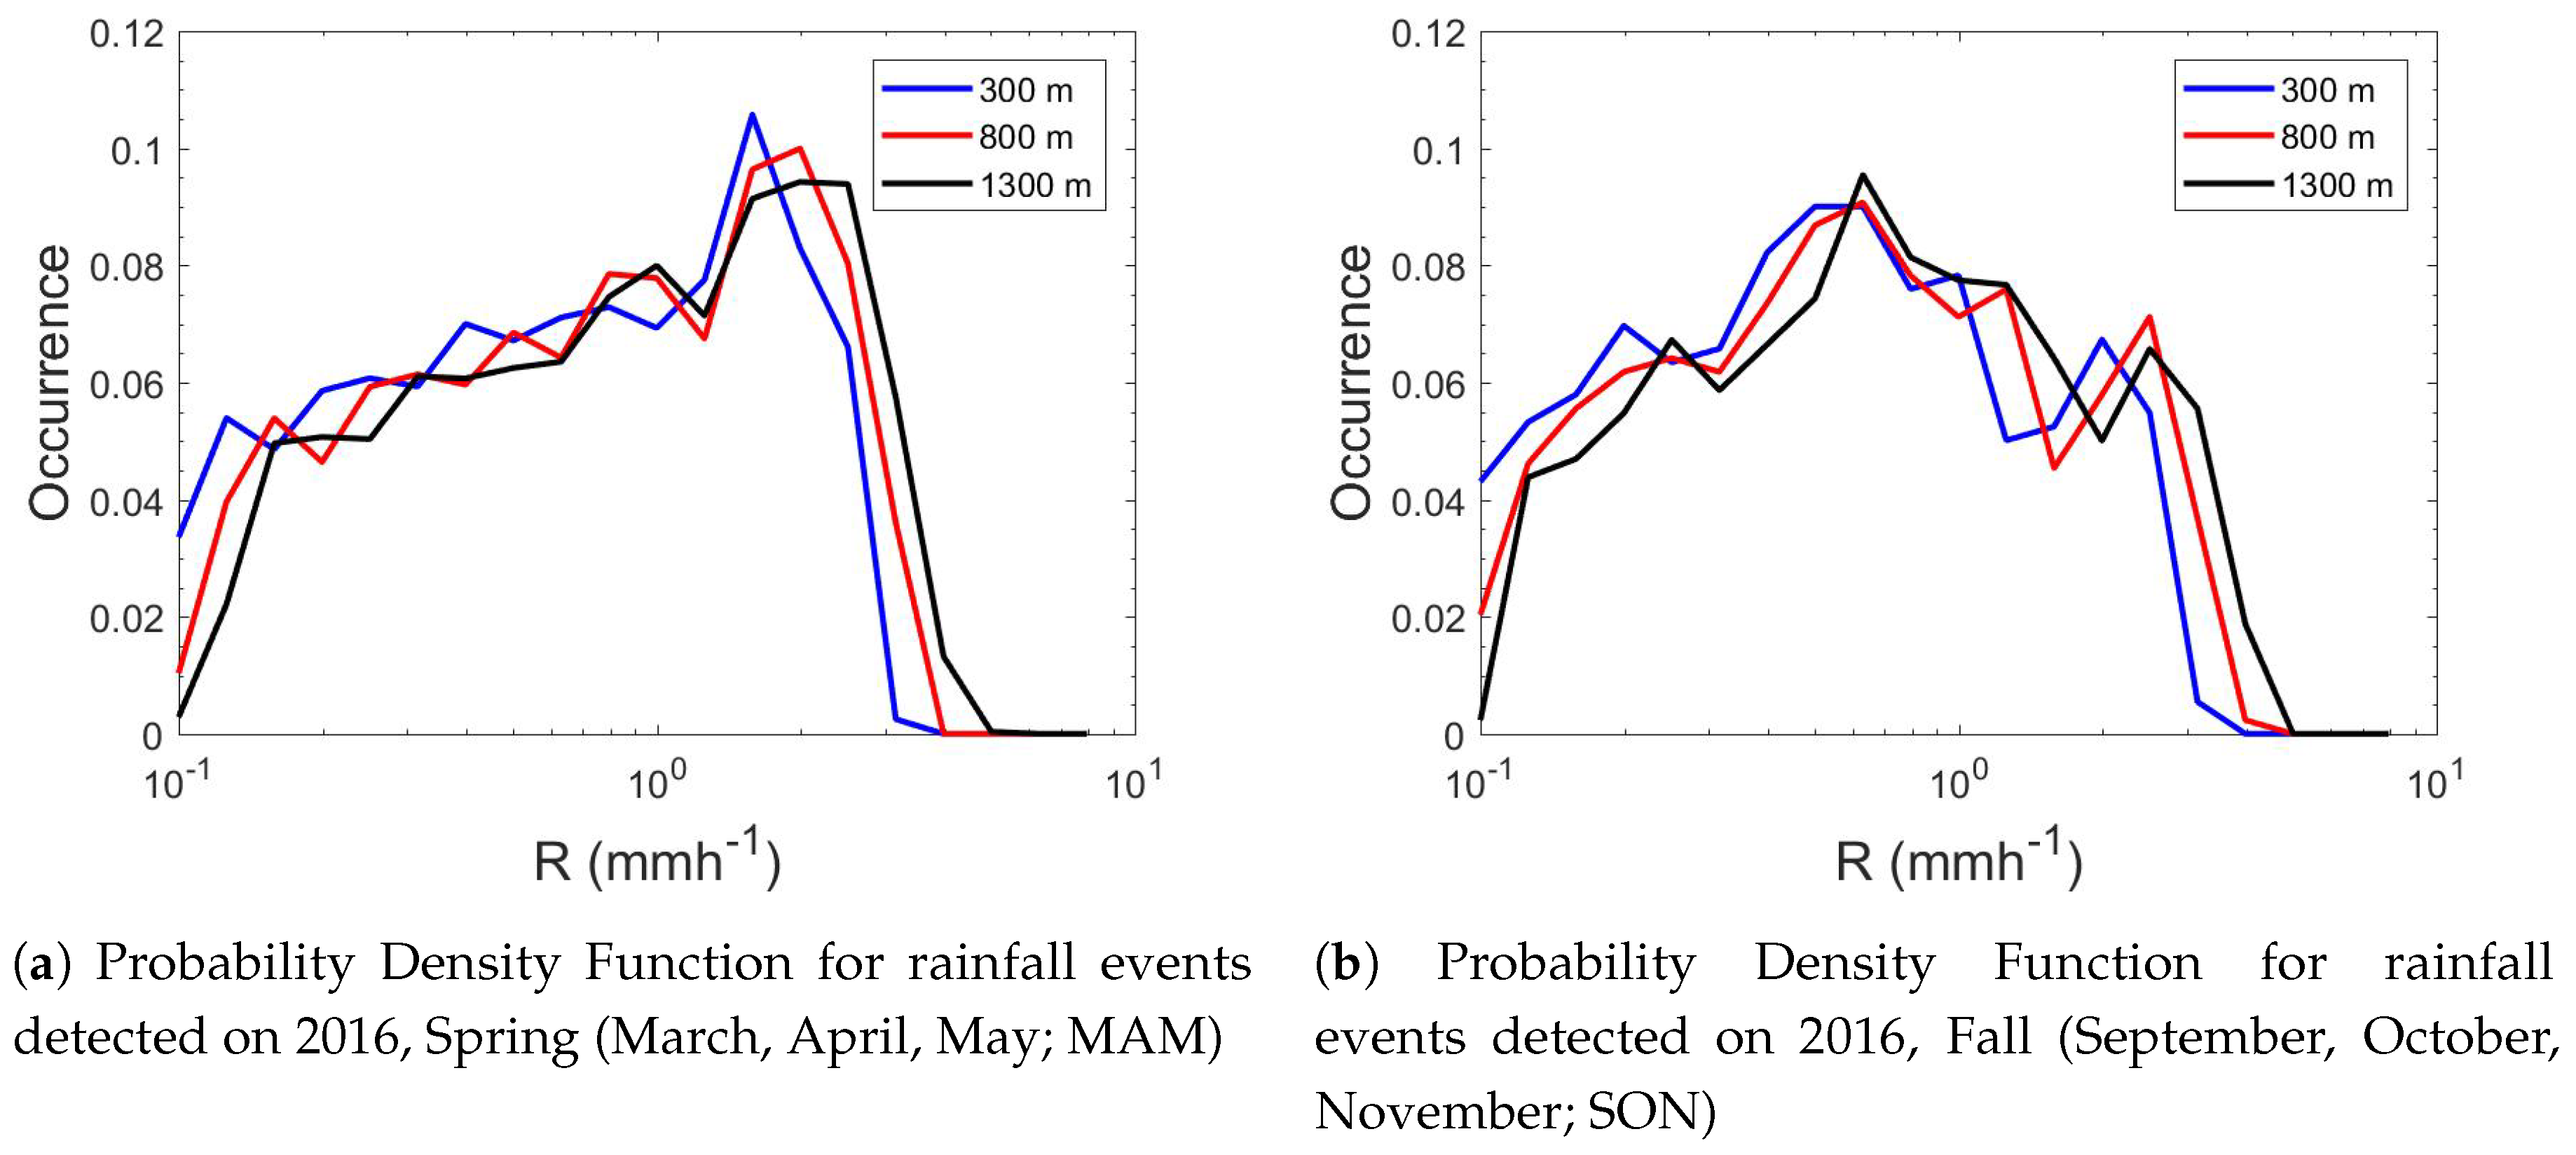
3.1. Seasonal Differences at UPC

The UPC permanent observational site is located on the Remote Sensing Lab (RSlab) building in Barcelona, Spain. The disdrometer is deployed 600 m away from the lidar at the meteorological observatory of the Applied Physics Department of the University of Barcelona. For this kind of application, such a short distance is not relevant in lighter rainfall and both instruments can be assumed as co-located. We analyzed the variability in seasonal rainfall intensity over 2016 where disdrometer and co-located MPLNET observations were simultaneously available. The largest rainfall events were found during the spring (March–April–May; MAM; 2801 min) and fall (September–October–November; SON, 1278 min) seasons. Rainfall intensity was analyzed at three different levels: 300 m, 800 m and 1300 m above ground level (agl).
During spring (Figure 1a), the peak of the distribution is shifted towards higher rainfall intensities (around 1.5 mm h 1 ), while, in fall (Figure 1b), the bulk of rainfall intensity is around 0.6 mm h 1 . This seasonal difference may be explained with different rain processes taking place (i.e., convective vs. stratiform events). The plots at three different quotes show similar trends, but the highest occurrence peaks of the rainfall intensity probability density function are shifted with respect to the altitude: at 300 m the highest peak is centered at 1.58 mm h 1 , at 800 m 1.99 mm h 1 and 2.51 mm h 1 at 1300 m (Figure 1a). Figure 1b shows less pronounced shift during SON: the highest occurrence peaks of rainfall intensity is 0.50 mm h 1 at 300 m while there is basically no difference at 800 m and 1300 m with 0.63 mm h 1 . Due to the lower sample size measurements, the same analysis has not been performed at GSFC.

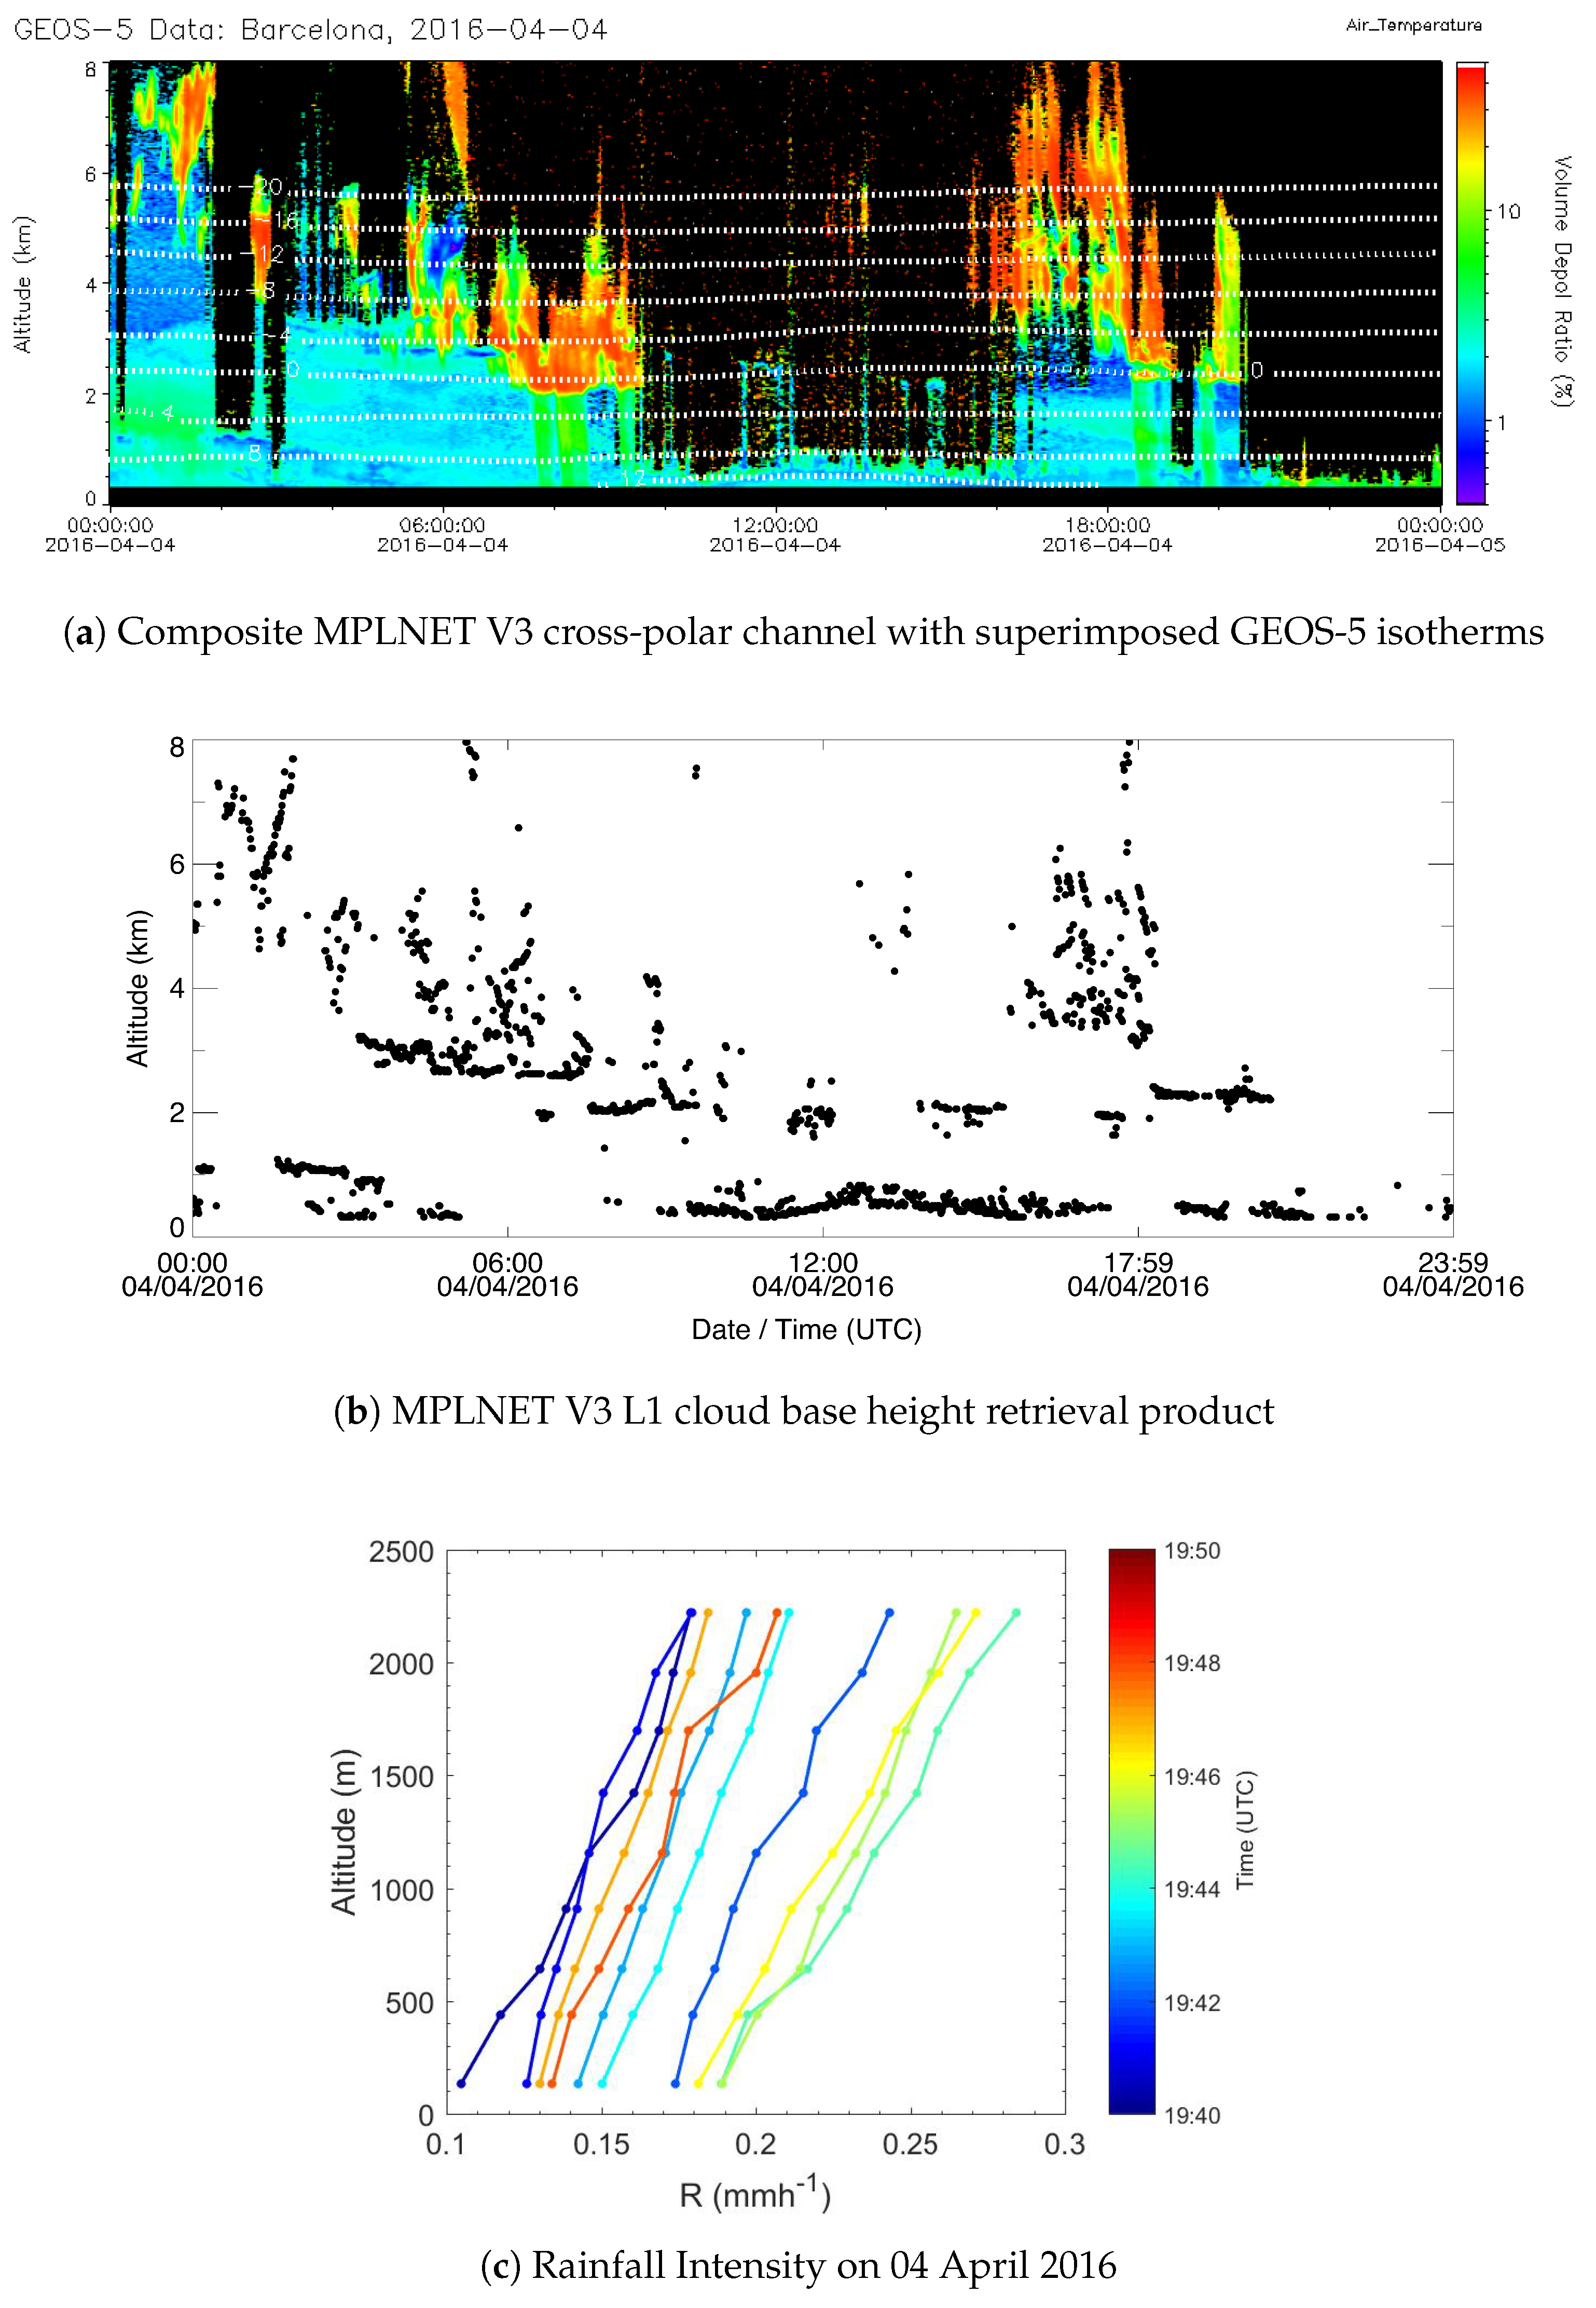
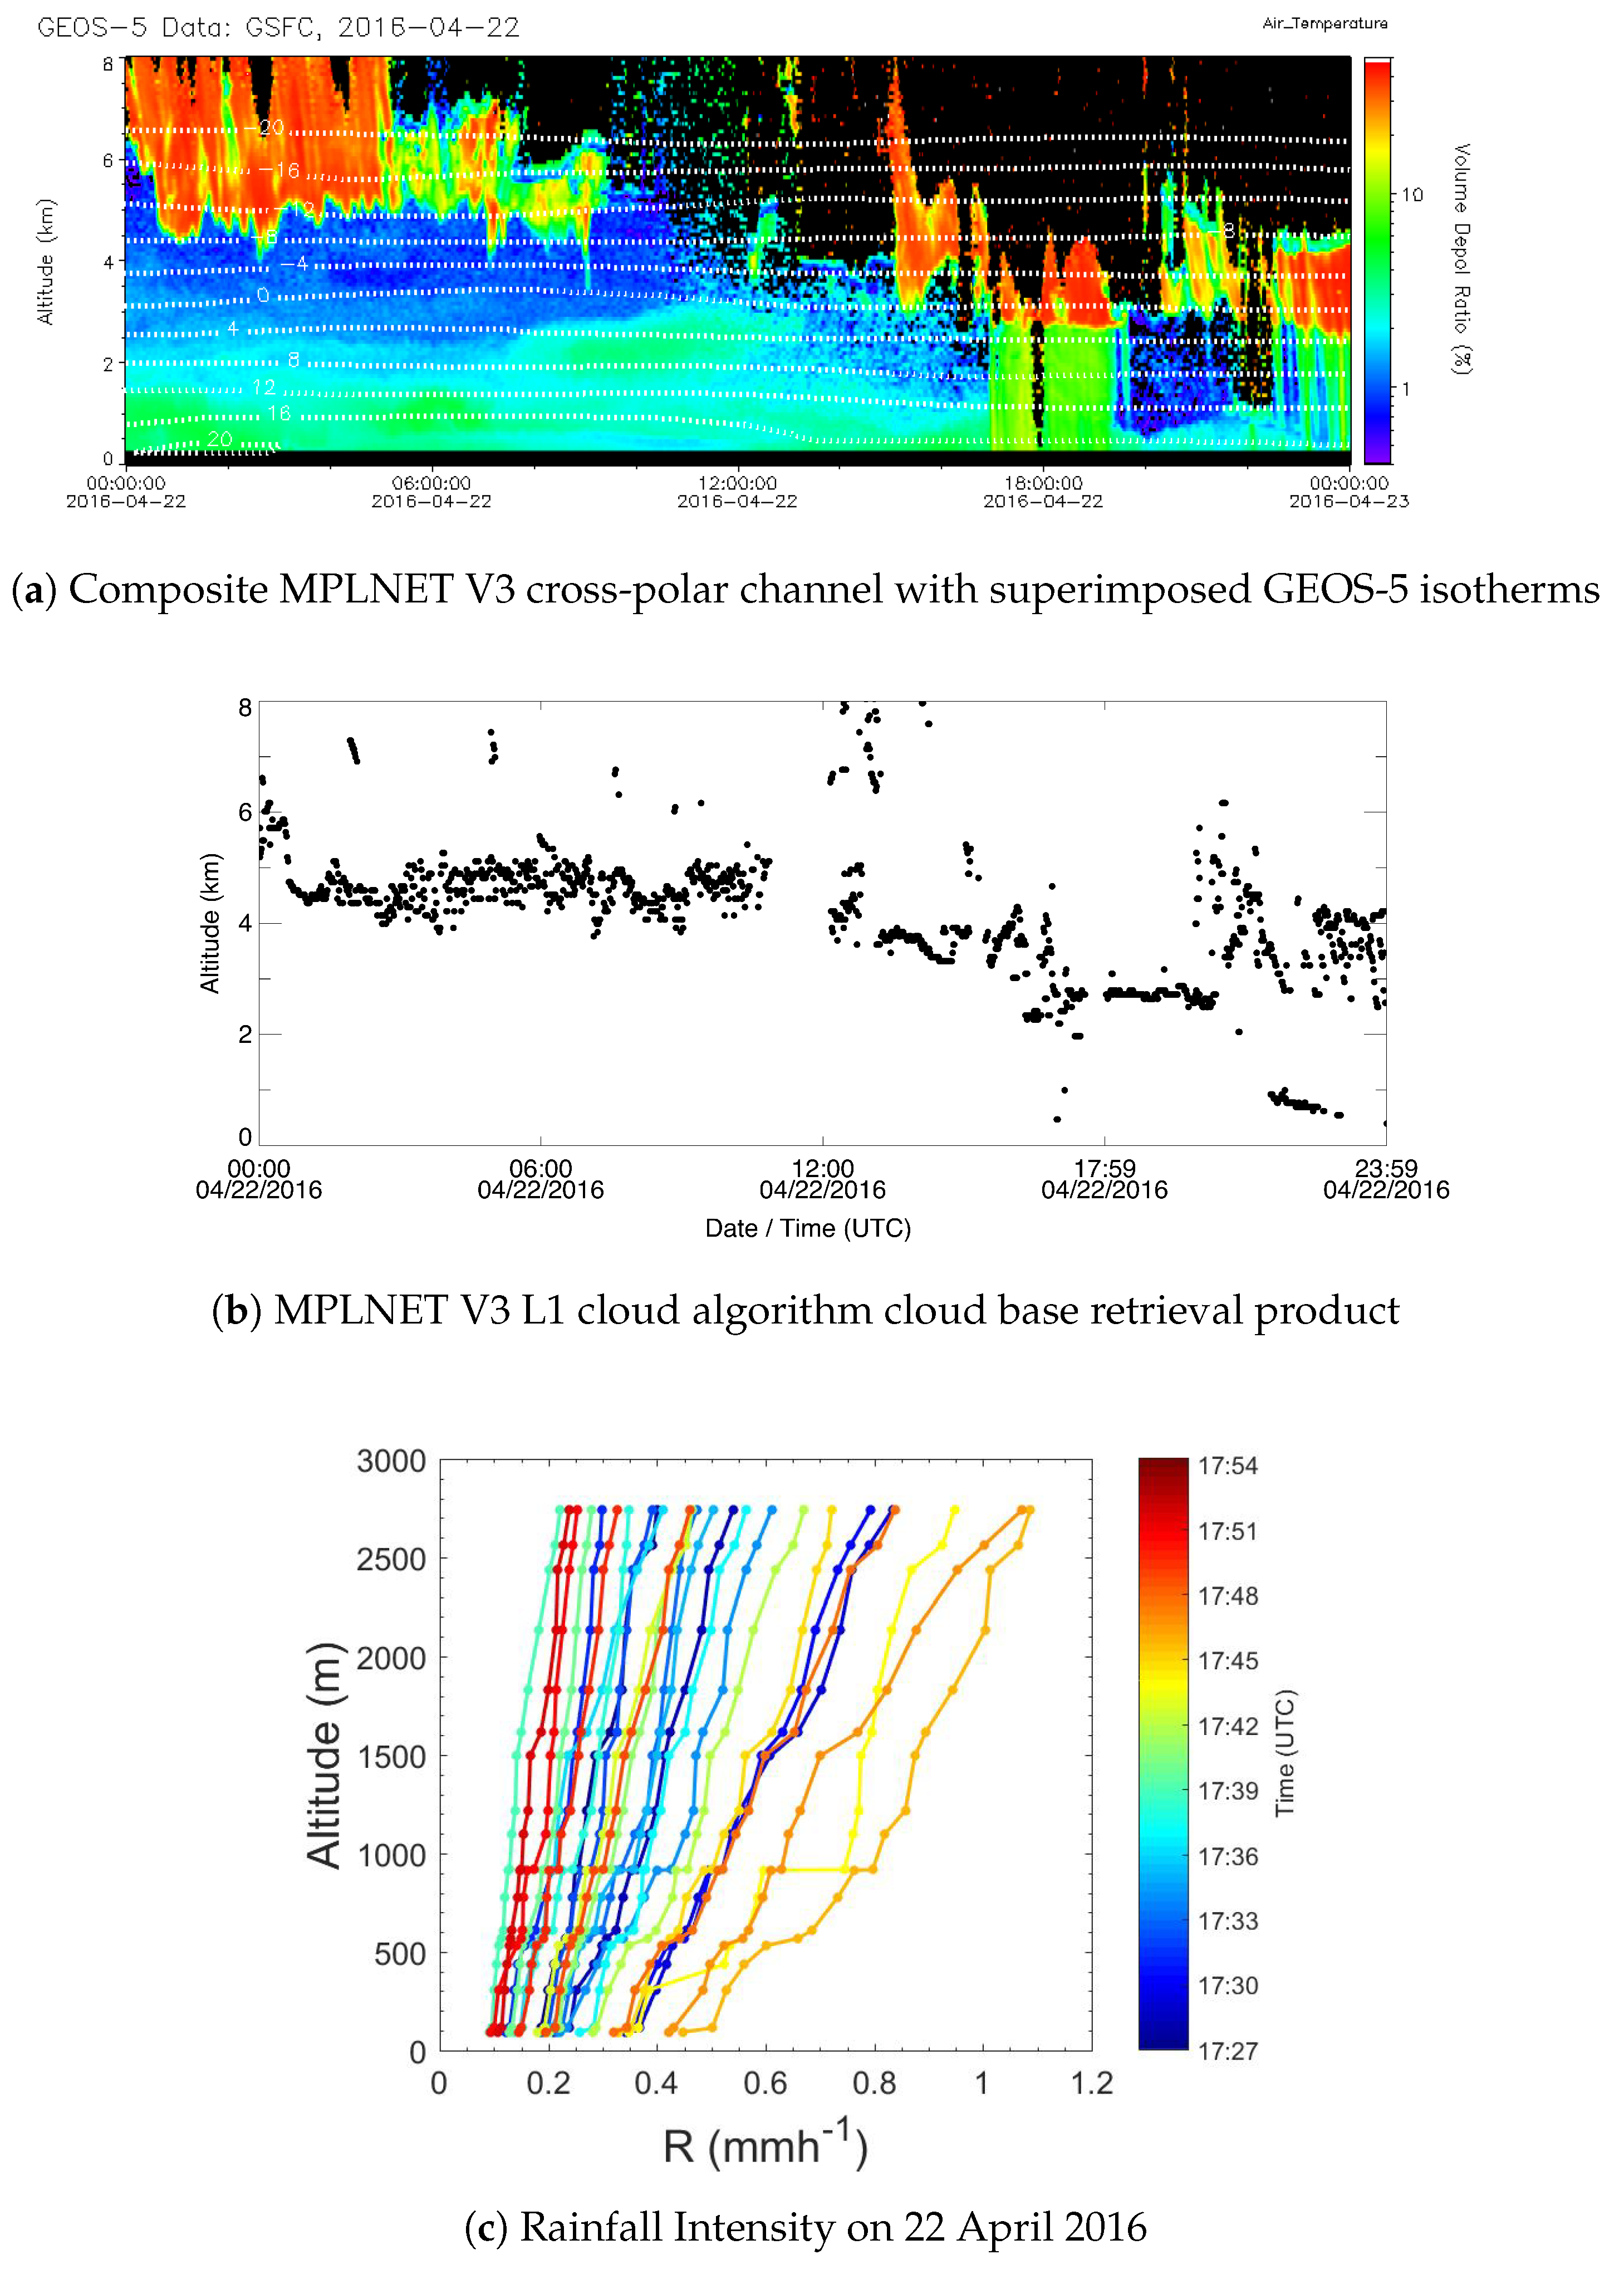
3.2. Case Study Analysis

Two case studies of the analytical model application at UPC and GSFC are presented and discussed in terms of vertically-resolved precipitation temporal evolution.

3.2.1. Retrieval of DSD profiles at UPC

On 4 April 2016, Figure 2a shows the composite plot of the depolarized channel signal, where precipitation contours are visible at around 9:00 a.m. UT and from 4:00 p.m. UT to 7:00 p.m. UT. Figure 2b shows the V3 L1 cloud algorithm cloud base height retrieval used in the inversion. Figure 2c depicts rainfall vertical intensity from 7:40 p.m. UT to 7:50 p.m. UT. Combining local radiosonde data (not showed here) and lidar data, we can state that rain originates from melting ice (cold rain process), with the freezing level detected at 2250 m AGL, just a few tens of meters below the cloud base. This is also confirmed by the GEOS-5 model (Figure 2a), where 0 C isotherm is in very close agreement with radiosonding. In this rainfall event, the steepest gradient of intensity is 0.03 mm h 1 km 1 , which is much smaller than the GSFC case study (see Section 3.2.2).

3.2.2. Retrieval of DSD profiles at GSFC

GSFC disdrometer and co-located lidar measurements were analyzed from November 2015 to April 2016. The vertical profiles of rainfall intensity, after applying the analytical model solution from 5:27 p.m. UT to 5:54 p.m. UT on 22 April 2016, are shown Figure 3. Depicted in Figure 3a is the composite plot of the depolarization channel signal obtained from the lidar on 22 April 2016. The core of the precipitation is clearly visible at around 5:45 p.m. UT. Figure 3b shows the cloud base height retrieval from V3 L1 MPLNET cloud algorithm. In Figure 3c, we can observe that rainfall intensity is weak, but increasing with time. The steepest gradient with respect to altitude is recorded at 5:47 p.m. UT with 0.22 mm h 1 km 1 .

3.3. Evaporation Characteristics at UPC

In order to generalize the rain evaporation properties, UPC data measurements were analyzed as a function of rain parameter differences (i.e., R, the rain rate and Z, an equivalent radar reflectivity) between the cloud base and the ground. This indicates the impact of evaporation on rain integral parameters as R and Z. Figure 4a reports the analysis of R. The evaporation results are more marked (greater Δ R) for higher cloud base heights and increasing R values at the ground. For relatively high cloud bases (higher than 3000 m), the R difference with the ground reaches values as high as 6 mm h 1 . For lower R values and low cloud bases, Δ R is roughly constant, never exceeding 1 mm h 1 , regardless of the cloud base height. For lower cloud base heights (below 1000 m), Δ R is rain intensity insensitive at the ground and does not exceed 0.6–0.8 mm h 1 . For cloud base height over 2000 m, rainfall rate relative difference with respect to the ground exceeds 100%. Figure 4b shows Z properties, calculated as the sixth moment of the DSD. In contrast with R, the plot highlights that Δ Z is dependent only on the cloud base height, with a decrease of a factor two ( Δ Z >= 3 dB) between the cloud base and the ground (cloud base higher than 2000 m). This can be explained, from a microphysical point of view, because of the small drop sizes collected in the analyzed data. That is, the lower the rain intensity, the smaller the drop diameters composing the DSD.

4. Conclusions

We introduce a methodology for computing vertically-resolved rain parameters (i.e., rain intensity) through a synergy between ground-based lidar, in situ disdrometer measurements and an analytical model solution paired with thermodynamic variables measured by atmospheric radiosondes (if unavailable, atmosphere thermodynamic variables can be inferred from a NASA GEOS-5 model). The methodology, applied at two permanent mid-latitude NASA Micro Pulse Lidar Network datasets, the Goddard Space Flight Center (GSFC) and Universitat Politècnica de Catalunya in Barcelona, Spain (UPC), is particularly suited for measurements of low intensity precipitation (rainfall rate, R, <3 mm h 1 ). If implemented operationally in the network, the methodology can generate near real-time rainfall intensity as a standard Level 2 product. Low-intensity precipitation measurements are crucial for better understanding the hydrological cycle and for validating satellite missions, like the Global Precipitation Mission experiment (GPM) [1].
The analysis of a complete year (2016) of precipitation at UPC (4079 min of data) permitted assessing rainfall intensity seasonal variability for different cloud base altitude ranges. Slightly different rain intensity distributions were observed during spring (MAM) and fall (SON), with a higher occurrence of a relatively high rain rate during spring (1.5 vs. 0.6 mm h 1 mean R), and a lower rainfall intensity associated with lower altitudes. This implies rainfall evaporation with consequent atmospheric column cooling. Yearly analysis of UPC MPLNET data shows that the effect of the evaporation on the rainfall rate has different impacts, depending on both rain intensity at ground and cloud base height. On the other hand, the radar reflectivity shows a dependence only on the cloud base height. The comparison between UPC and GSFC indicates that, for approximately the same rain intensity at the ground, the rain intensity gradients observed in GSFC (0.22 mm h 1 km 1 ) are larger than the ones observed at UPC (0.03 mm h 1 km 1 ). This result shows that, for this case study, the GSFC atmosphere is in general drier with respect to UPC.
Both analyzed case studies demonstrate the analytical model capability for reconstructing DSD from ground to cloud base. This also permits computing all of the significant distribution moments (i.e., radar reflectivity, liquid water content, mean mass diameter, etc.) besides rain reflectivity. Future research will focus on assessing light precipitation inter-annual intensity variability from long-term (>15 years) MPLNET stations, especially in polluted regions, to quantifying for the first time the aerosol indirect effects on drizzle reduction/suppression.

Author Contributions

Conceptualization, S.L.; Methodology, S.L., L.P.D., M.S.; Software, S.L., L.P.D., A.R., A.B. and J.R.L.; Validation, S.L., A.R. and A.B.; Formal Analysis, S.L., L.P.D., M.S., J.R.C., F.M.; Investigation, S.L., E.J.W., J.R.C., M.S., L.P.D.; Resources, N.A., A.C., J.B.; Data Curation, S.L., A.T., J.R.L., E.J.W., S.G., J.B.; Writing—Original Draft Preparation, S.L.; Writing—Review & Editing, J.R.C., L.P.D., M.S., J.B., S.G., J.R.L. and N.A.; Visualization, S.L., F.M., N.A.; Supervision, S.L., N.A.; Project Administration, N.A., A.C., J.B., E.J.W., J.R.C.; Funding Acquisition, J.R.C., E.J.W., A.C., J.B. and S.G.

Funding

The MPL measurements and processing in Barcelona are supported by the European Union (H2020, grant 654109, ACTRIS-2), the European Fund for Regional Development, the Spanish Government (grants TEC2015-63832-P, CGL2015-65627-C3-2-R, CGL2016-81828-REDT and CGL2017-90884-REDT) and the Catalan Government (grant 2014 SGR 583). CommSensLab is a Unidad de Excelencia María de Maeztu (grant MDM-2016-0600) funded by the Agencia Estatal de Investigación.

Acknowledgments

The NASA Micro-Pulse Lidar Network (MPLNET) are supported by the NASA Radiation Sciences Program (H. Maring).

Conflicts of Interest

The authors declare no conflict of interest.

References

  1. Hou, A.Y.; Kakar, R.K.; Neeck, S.; Azarbarzin, A.A.; Kummerow, C.D.; Kojima, M.; Oki, R.; Nakamura, K.; Iguchi, T. The Global Precipitation Measurement Mission. Bull. Am. Meteorol. Soc. 2014, 95, 701–722. [Google Scholar] [CrossRef] [Green Version]
  2. Lolli, S.; Campbell, J.R.; Lewis, J.R.; Welton, E.J.; Di Girolamo, P.; Fatkhuroyan, F.; Gu, Y.; Marquis, J.W. Assessment of cirrus cloud and aerosol radiative effect in South-East Asia by ground-based NASA MPLNET lidar network data and CALIPSO satellite measurements. In Remote Sensing of Clouds and the Atmosphere XXII; International Society for Optics and Photonics: Bellingham, WA, USA, 2017; Volume 10424, p. 1042405. [Google Scholar]
  3. Bosilovich, M.G.; Schubert, S.D.; Walker, G.K. Global Changes of the Water Cycle Intensity. J. Clim. 2005, 18, 1591–1608. [Google Scholar] [CrossRef] [Green Version]
  4. Lolli, S.; Welton, E.J.; Campbell, J.R. Evaluating light rain drop size estimates from multiwavelength micropulse lidar network profiling. J. Atmos. Ocean. Technol. 2013, 30, 2798–2807. [Google Scholar] [CrossRef]
  5. Lolli, S.; Di Girolamo, P.; Demoz, B.; Li, X.; Welton, E. Rain Evaporation Rate Estimates from Dual-Wavelength Lidar Measurements and Intercomparison against a Model Analytical Solution. J. Atmos. Ocean. Technol. 2017, 34, 829–839. [Google Scholar] [CrossRef]
  6. Welton, E.J.; Campbell, J.R.; Spinhirne, J.D.; Scott, V.S. Global Monitoring of Clouds and Aerosols Using a Network of Micropulse Lidar Systems; SPIE: Bellingham, WA, USA, 2001; Volume 4153, pp. 151–159. [Google Scholar] [CrossRef]
  7. Campbell, J.R.; Lolli, S.; Lewis, J.R.; Gu, Y.; Welton, E.J. Daytime cirrus cloud top-of-the-atmosphere radiative forcing properties at a midlatitude site and their global consequences. J. Appl. Meteorol. Climatol. 2016, 55, 1667–1679. [Google Scholar] [CrossRef]
  8. Lolli, S.; Campbell, J.R.; Lewis, J.R.; Gu, Y.; Marquis, J.W.; Chew, B.N.; Liew, S.C.; Salinas, S.V.; Welton, E.J. Daytime Top-of-the-Atmosphere Cirrus Cloud Radiative Forcing Properties at Singapore. J. Appl. Meteorol. Climatol. 2017, 56, 1249–1257. [Google Scholar] [CrossRef]
  9. Campbell, J.R.; Peterson, D.A.; Marquis, J.W.; Fochesatto, G.J.; Vaughan, M.A.; Stewart, S.A.; Tackett, J.L.; Lolli, S.; Lewis, J.R.; Oyola, M.I.; et al. Unusually deep wintertime cirrus clouds observed over the alaskan sub-arctic. Bull. Am. Meteorol. Soc. 2017, 99, 27–32. [Google Scholar] [CrossRef]
  10. Lolli, S.; Campbell, J.R.; Lewis, J.R.; Gu, Y.; Welton, E.J. Fu–Liou–Gu and Corti–Peter model performance evaluation for radiative retrievals from cirrus clouds. Atmos. Chem. Phys. 2017, 17, 7025–7034. [Google Scholar] [CrossRef]
  11. Pani, S.K.; Wang, S.H.; Lin, N.H.; Tsay, S.C.; Lolli, S.; Chuang, M.T.; Lee, C.T.; Chantara, S.; Yu, J.Y. Assessment of aerosol optical property and radiative effect for the layer decoupling cases over the northern South China Sea during the 7-SEAS/Dongsha Experiment. J. Geophys. Res. Atmos. 2016, 121, 4894–4906. [Google Scholar] [CrossRef]
  12. Tosca, M.G.; Campbell, J.; Garay, M.; Lolli, S.; Seidel, F.C.; Marquis, J.; Kalashnikova, O. Attributing accelerated summertime warming in the southeast united states to recent reductions in aerosol burden: Indications from vertically-resolved observations. Remote Sens. 2017, 9, 674. [Google Scholar] [CrossRef]
  13. Campbell, J.R.; Hlavka, D.L.; Welton, E.J.; Flynn, C.J.; Turner, D.D.; Spinhirne, J.D.; Scott, V.S.S., III; Hwang, I.H. Full-Time, Eye-Safe Cloud and Aerosol Lidar Observation at Atmospheric Radiation Measurement Program Sites: Instruments and Data Processing. J. Atmos. Ocean. Technol. 2002, 19, 431–442. [Google Scholar] [CrossRef]
  14. Welton, E.J.; Campbell, J.R. Micropulse Lidar Signals: Uncertainty Analysis. J. Atmos. Ocean. Technol. 2002, 19, 2089–2094. [Google Scholar] [CrossRef] [Green Version]
  15. Ciofini, M.; Lapucci, A.; Lolli, S. Diffractive optical components for high power laser beam sampling. J. Opt. A Pure Appl. Opt. 2003, 5, 186. [Google Scholar] [CrossRef]
  16. Welton, E.J.; Voss, K.J.; Gordon, H.R.; Maring, H.; Smirnov, A.; Holben, B.; Schmid, B.; Livingston, J.M.; Russell, P.B.; Durkee, P.A.; et al. Ground-based lidar measurements of aerosols during ACE-2: Instrument description, results, and comparisons with other ground-based and airborne measurements. Tellus B 2000, 52, 636–651. [Google Scholar] [CrossRef]
  17. Welton, E.J.; Voss, K.J.; Quinn, P.K.; Flatau, P.J.; Markowicz, K.; Campbell, J.R.; Spinhirne, J.D.; Gordon, H.R.; Johnson, J.E. Measurements of aerosol vertical profiles and optical properties during INDOEX 1999 using micropulse lidars. J. Geophys. Res. Atmos. 2002, 107, INX2 18-1–INX2 18-20. [Google Scholar] [CrossRef]
  18. Lolli, S.; Madonna, F.; Rosoldi, M.; Campbell, J.R.; Welton, E.J.; Lewis, J.R.; Gu, Y.; Pappalardo, G. Impact of varying lidar measurement and data processing techniques in evaluating cirrus cloud and aerosol direct radiative effects. Atmos. Meas. Tech. 2018, 11, 1639–1651. [Google Scholar] [CrossRef] [Green Version]
  19. Sassen, K.; Knight, N.C.; Takano, Y.; Heymsfield, A.J. Effects of ice-crystal structure on halo formation: cirrus cloud experimental and ray-tracing modeling studies. Appl. Opt. 1994, 33, 4590–4601. [Google Scholar] [CrossRef] [PubMed]
  20. Flynn, C.J.; Mendoza, A.; Zheng, Y.; Mathur, S. Novel polarization-sensitive micropulse lidar measurement technique. Opt. Express 2007, 15, 2785–2790. [Google Scholar] [CrossRef] [PubMed]
  21. Lewis, J.R.; Campbell, J.R.; Welton, E.J.; Stewart, S.A.; Haftings, P.C. Overview of MPLNET Version 3 Cloud Detection. J. Atmos. Ocean. Technol. 2016, 33, 2113–2134. [Google Scholar] [CrossRef]
  22. D’Adderio, L.; Porcù, F.; Tokay, A. Evolution of drop size distribution in natural rain. Atmos. Res. 2018, 200, 70–76. [Google Scholar] [CrossRef]
  23. Löffler-Mang, M.; Joss, J. An Optical Disdrometer for Measuring Size and Velocity of Hydrometeors. J. Atmos. Ocean. Technol. 2000, 17, 130–139. [Google Scholar] [CrossRef]
  24. Li, X.; Srivastava, R.C. An Analytical Solution for Raindrop Evaporation and Its Application to Radar Rainfall Measurements. J. Appl. Meteorol. 2001, 40, 1607–1616. [Google Scholar] [CrossRef]
Figure 1. Probability Distribution Function (PDF) for rainfall intensities at three vertical levels (300 m, 800 m, 1300 m) during Spring (a) and Fall (b) 2016 at the MPLNET Barcelona permanent observation station.
Remotesensing 10 01102 g001
Figure 2. Vertically-resolved rainfall intensity computations at different measurement times for UPC MPLNET station on 4 April 2016. (a) MPL cross-polar channel signal; (b) cloud base height automatically retrieved by V3 L1 Cloud algorithm; (c) vertically-resolved rainfall intensities, computed with the analytical model solution using disdrometer data and V3 L1 cloud base height retrieval, from 7:40 p.m. UT to 7:50 p.m. UT.
Remotesensing 10 01102 g002
Figure 3. Vertically-resolved rainfall intensity computations at different measurement times for the GSFC MPLNET station on 22 April 2016. (a) MPL cross-polar channel signal; (b) cloud base height automatically retrieved by V3 L1 Cloud algorithm; (c) vertically-resolved rainfall intensities, computed with the analytical model solution using disdrometer data and V3 L1 cloud base height retrieval, from 5:27 p.m. UT to 5:54 p.m. UT.
Remotesensing 10 01102 g003
Figure 4. Trend of the difference between the cloud base and the ground of the rain parameters R and Z as a function of parameter values measured at ground and at cloud base height.
Remotesensing 10 01102 g004

