Remote Sensing of Organic Films on the Water Surface Using Dual Co-Polarized Ship-Based X-/C-/S-Band Radar and TerraSAR-X


 ,
,  ,
, 
Abstract
1. Introduction
2. Materials and Methods
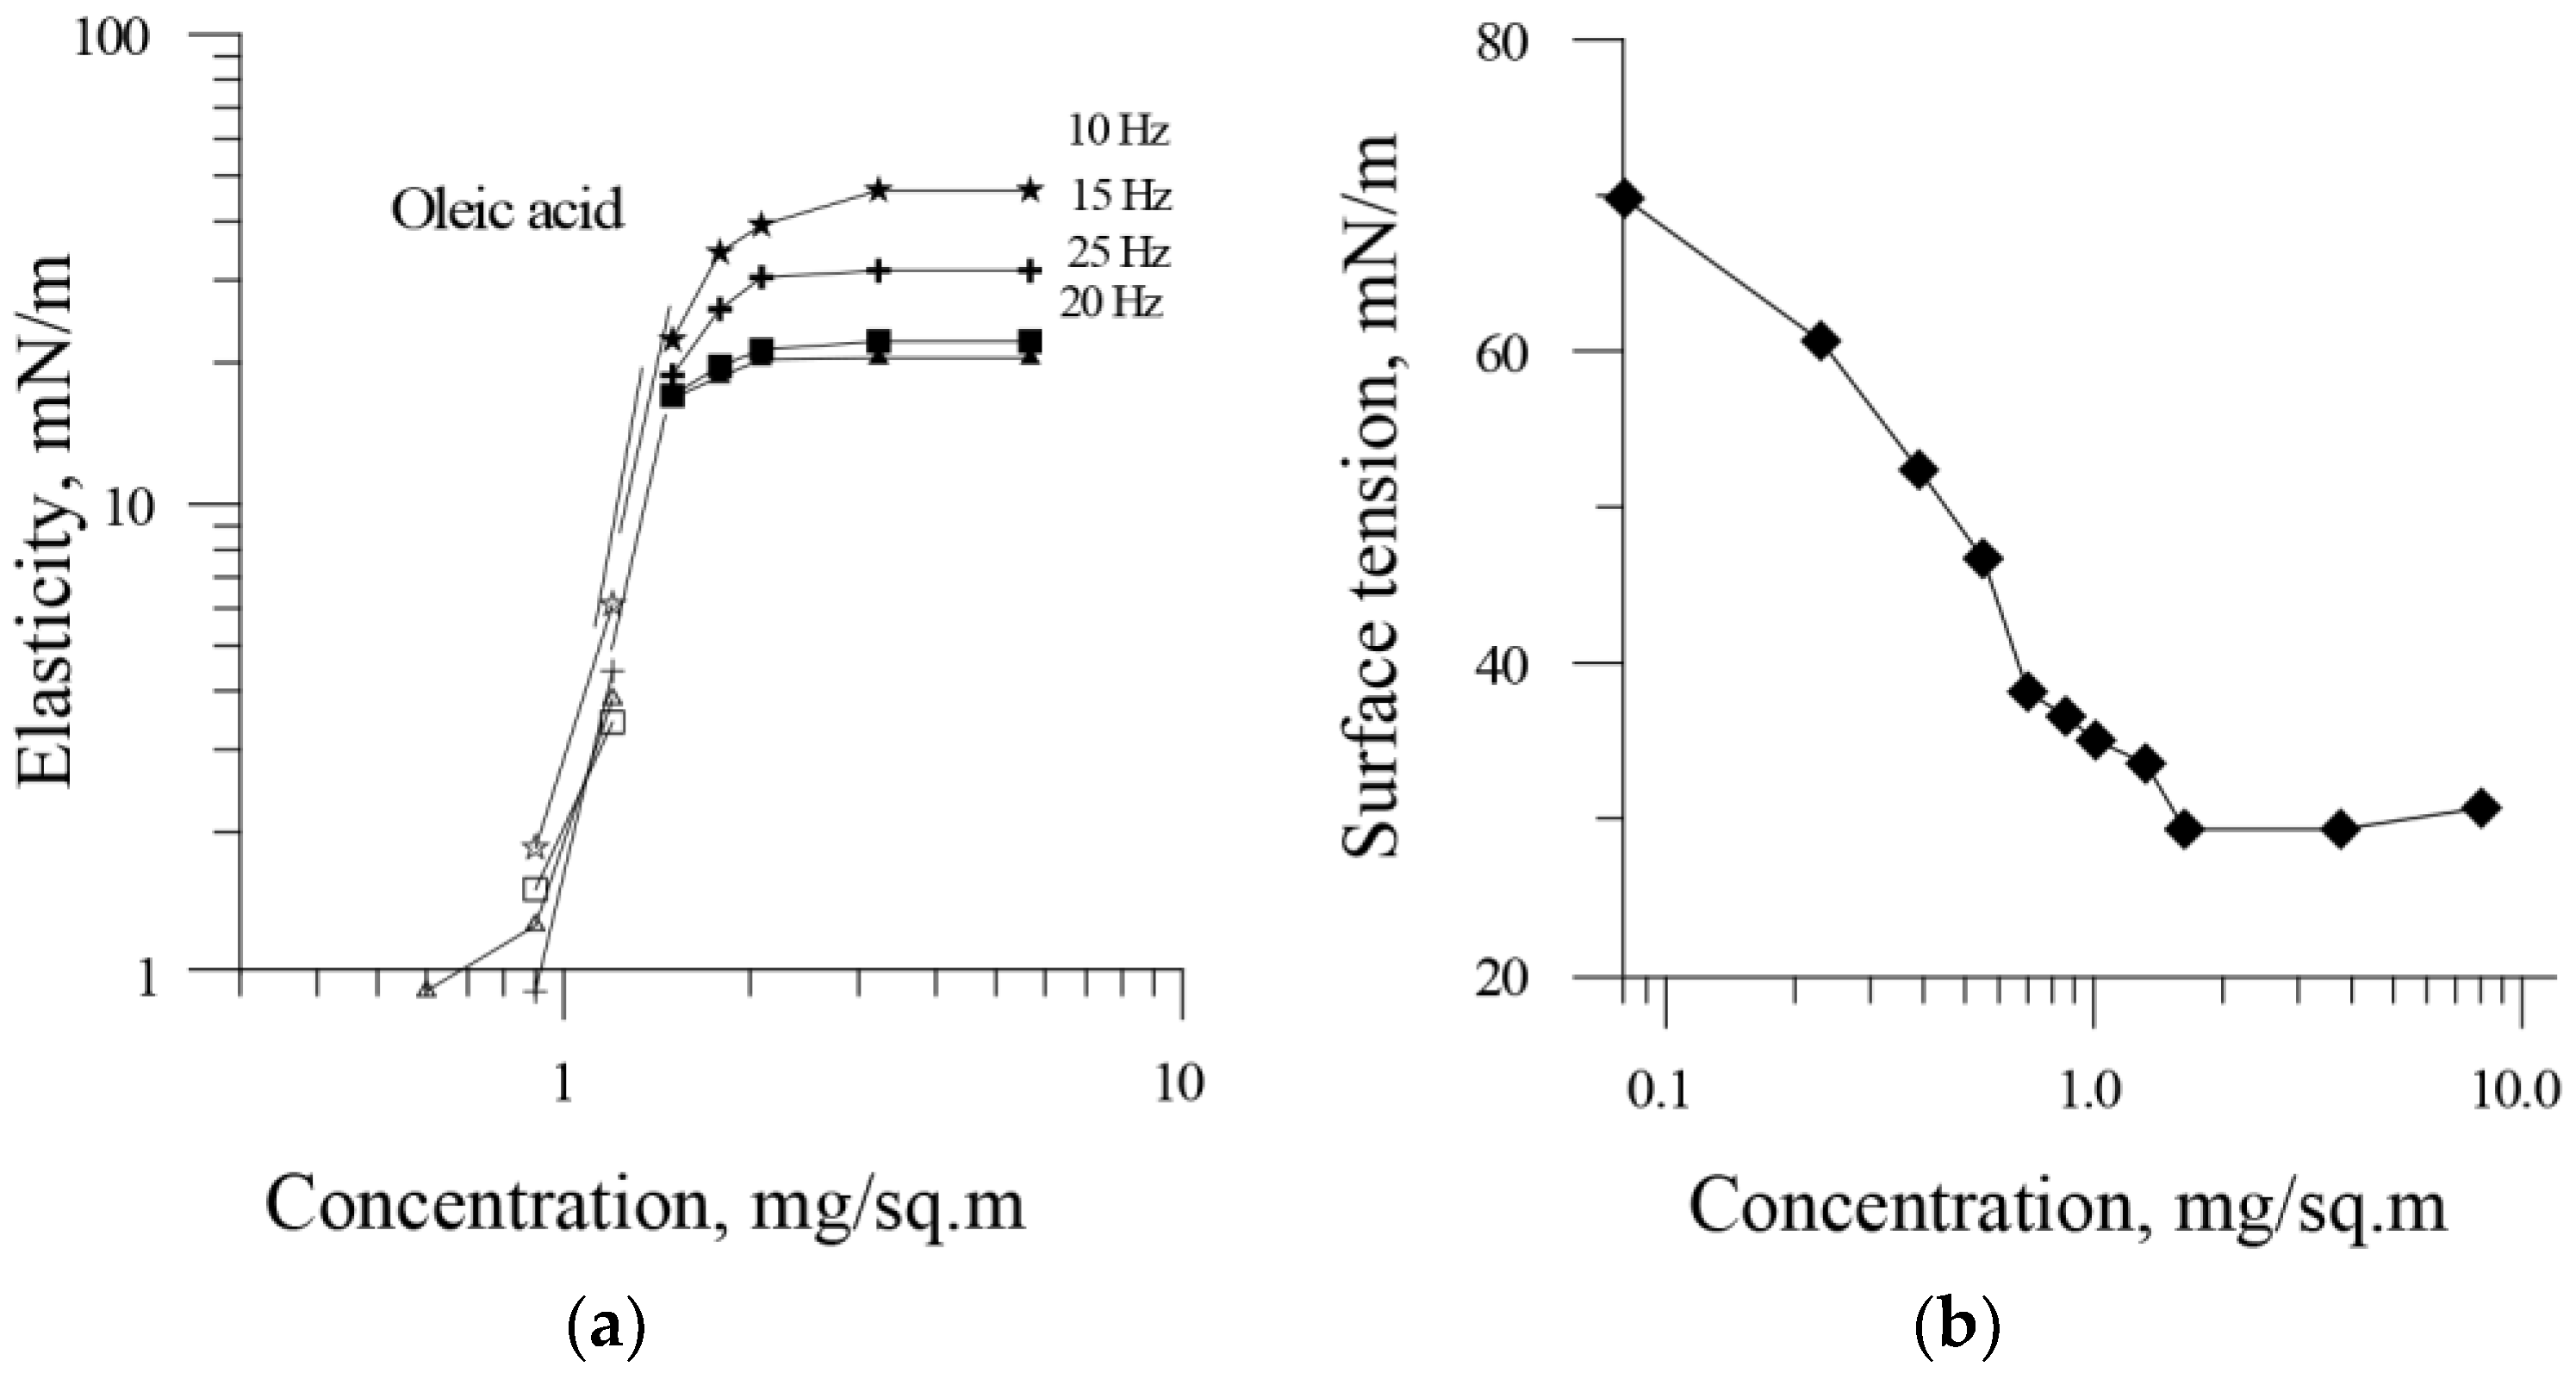
2.1. Theoretical Background
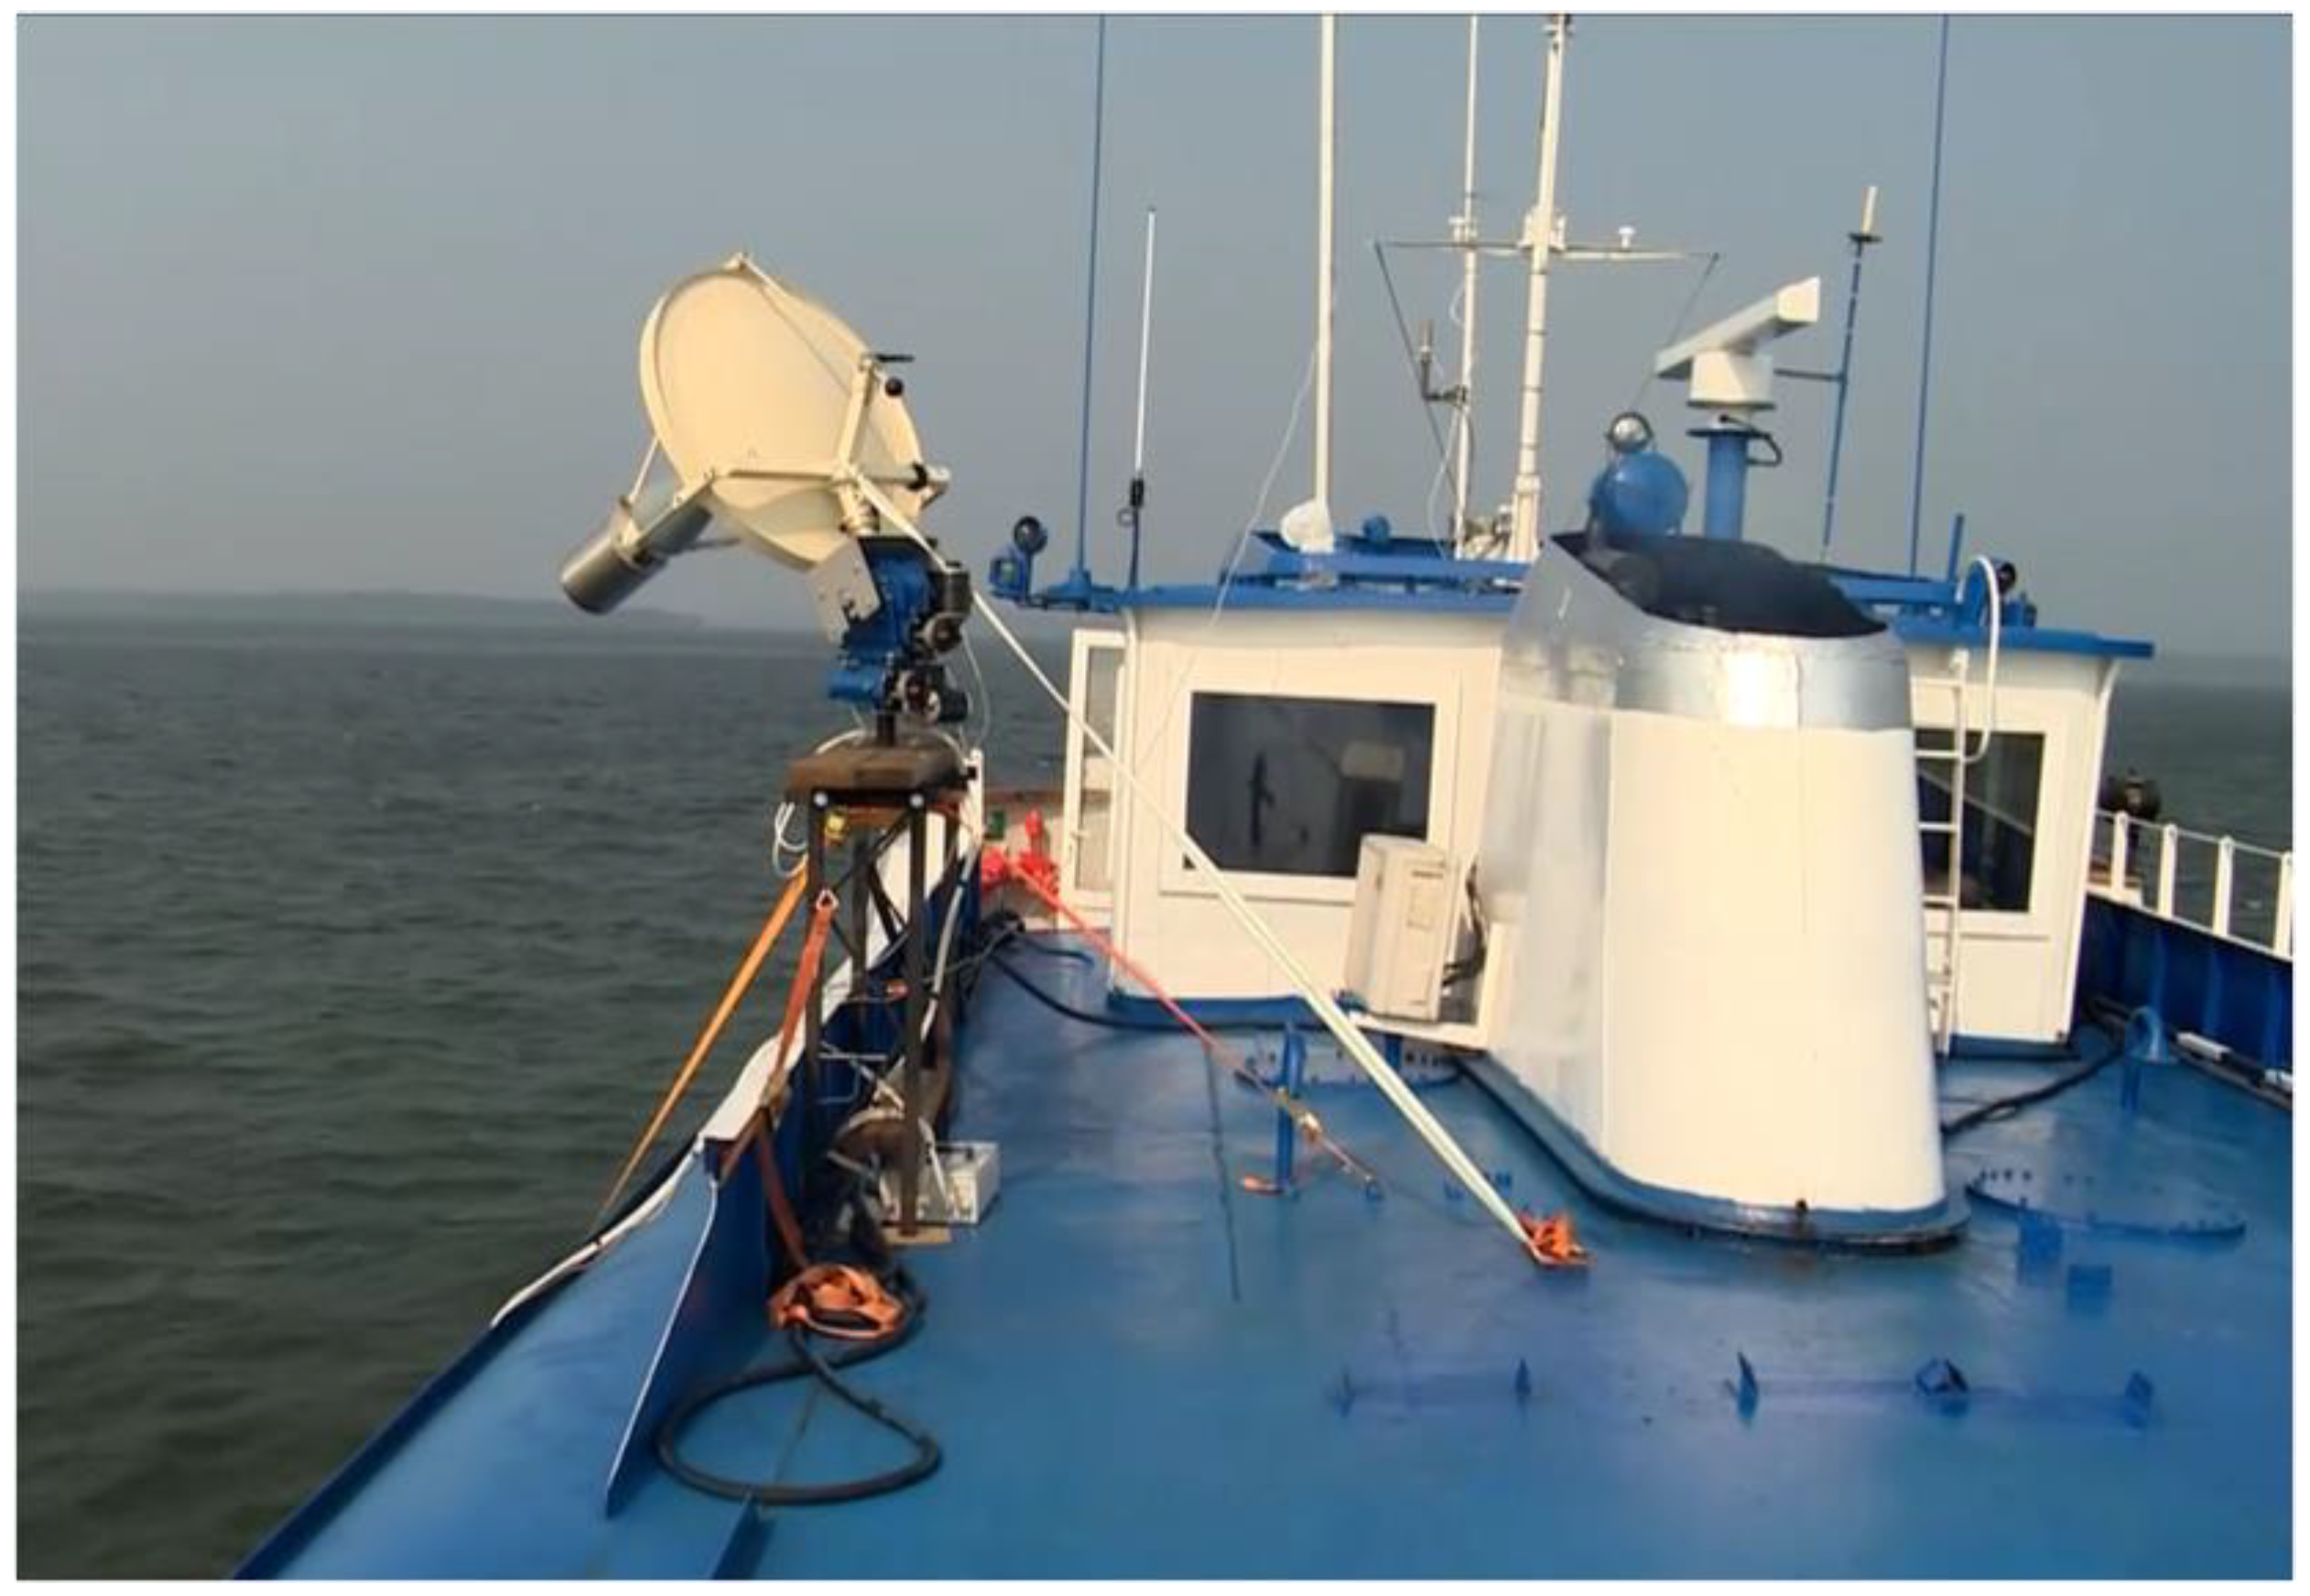
2.2. Experiment
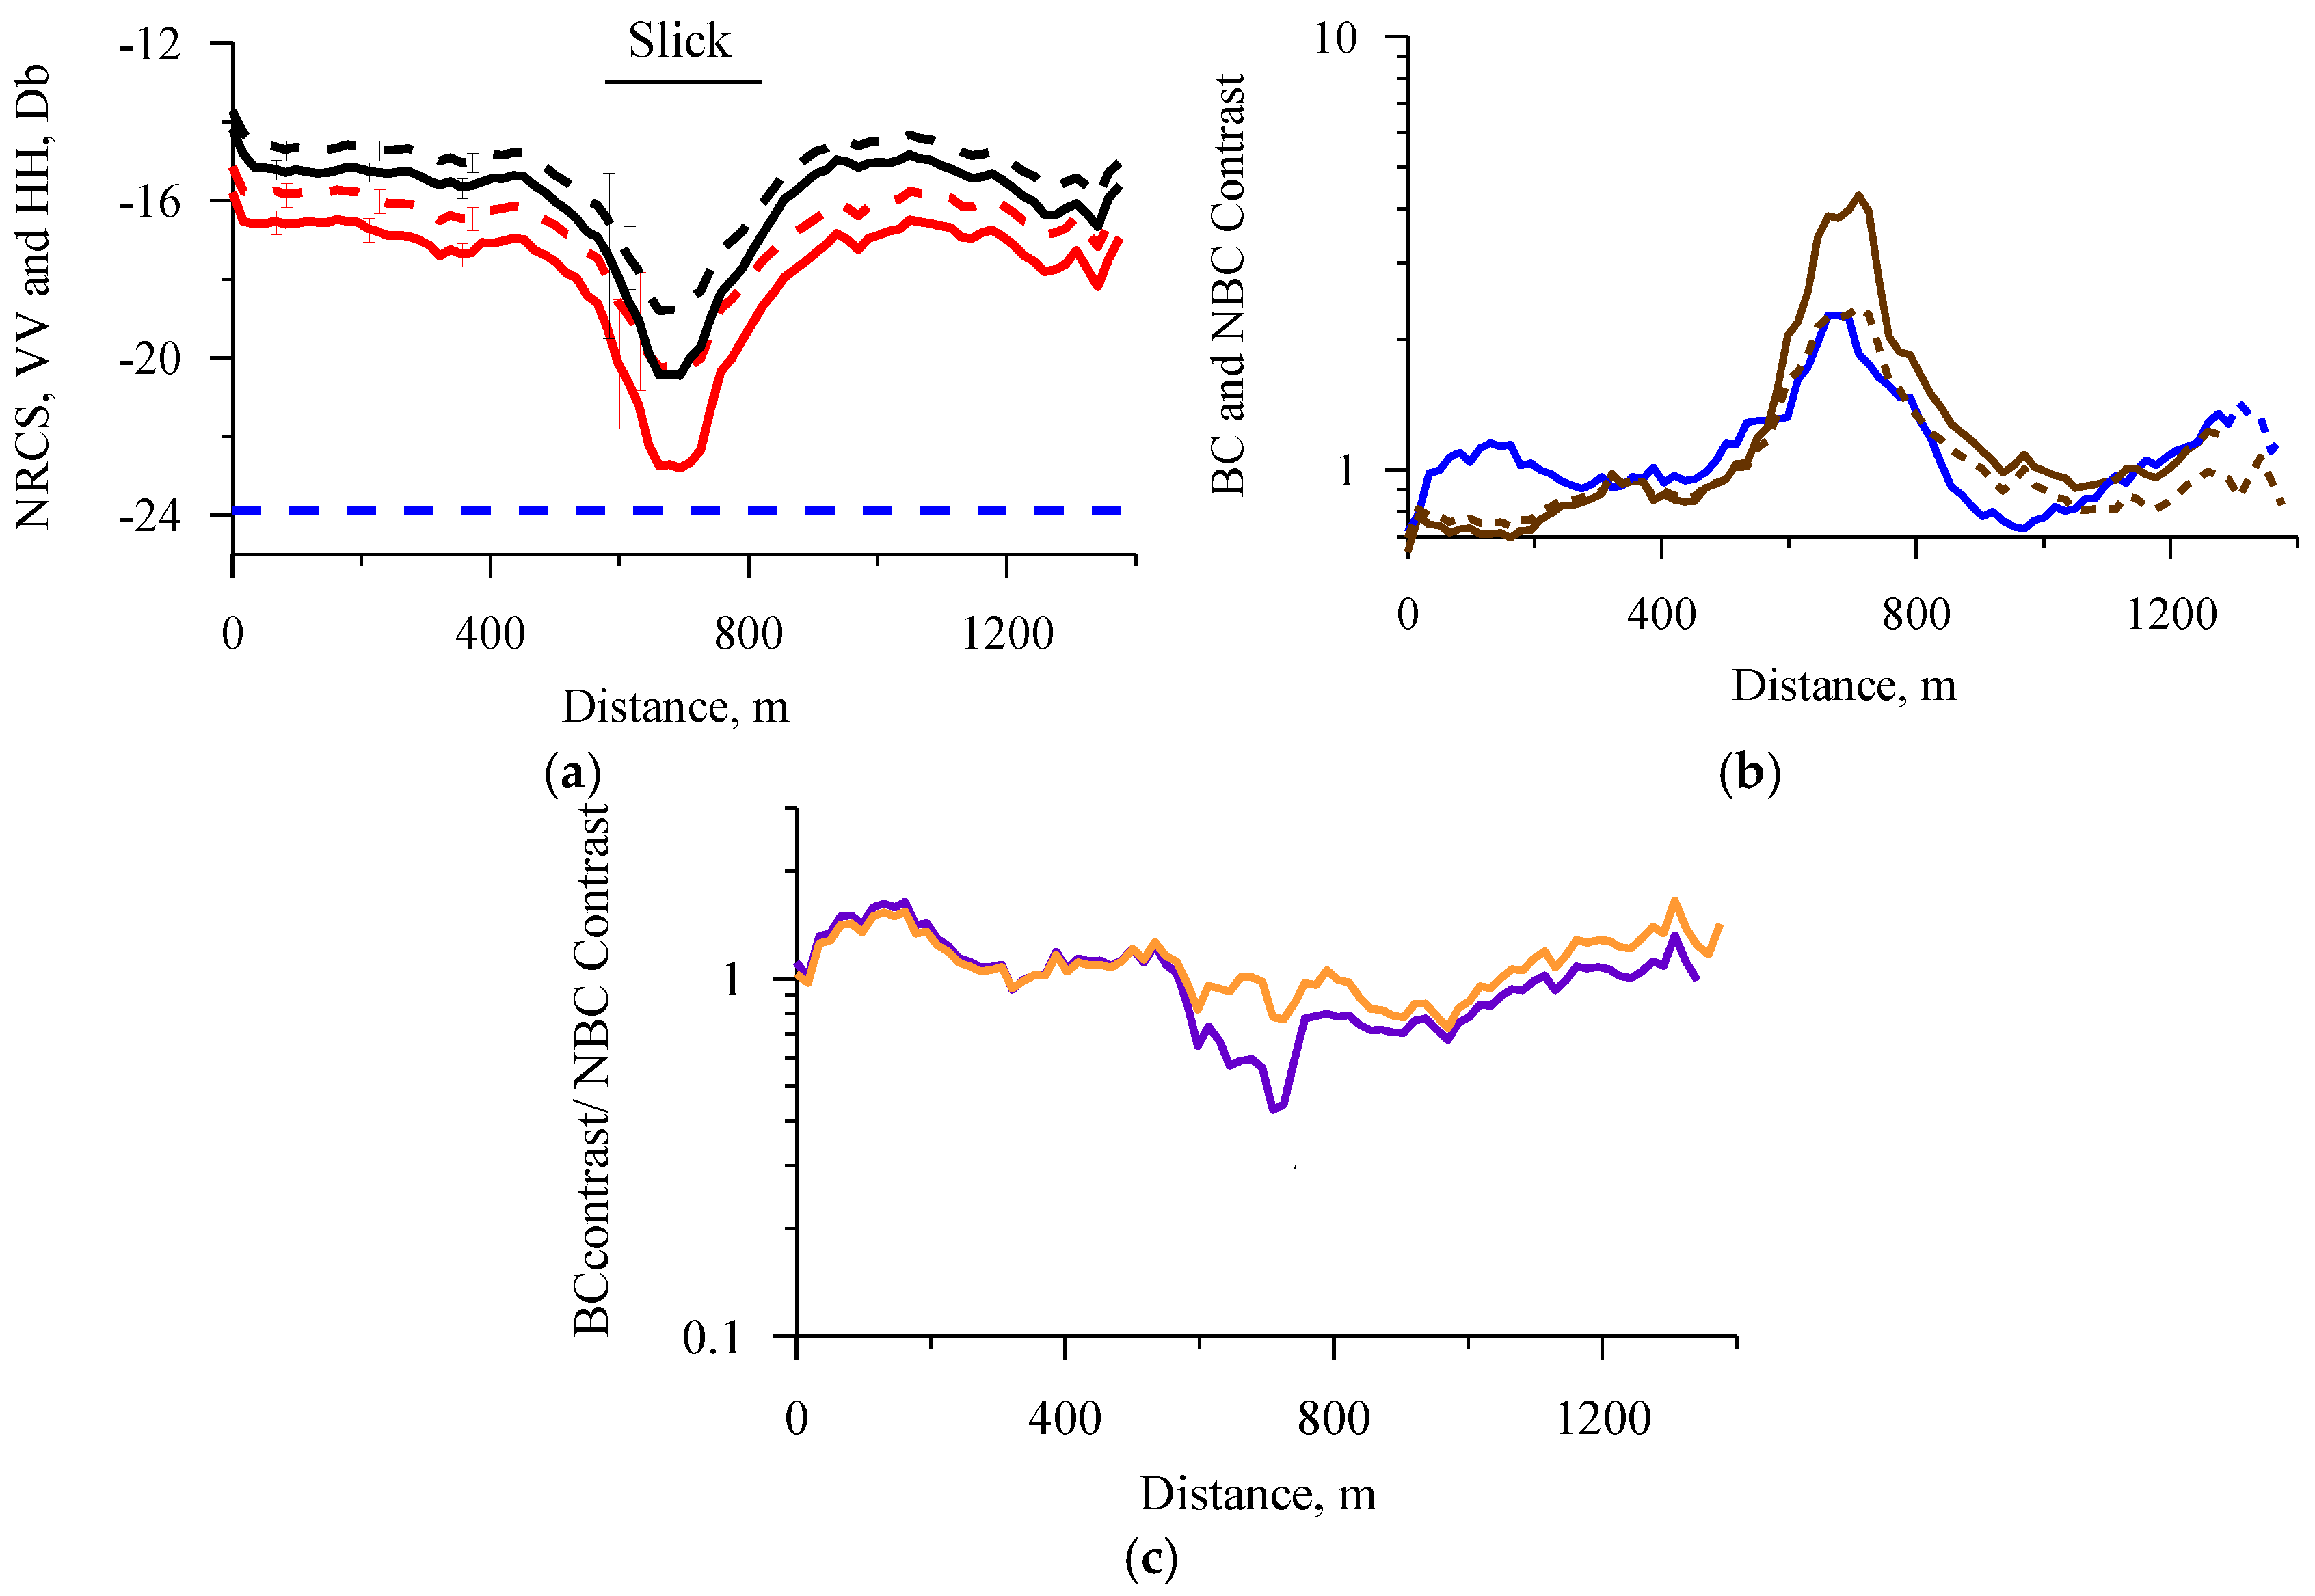
3. Results
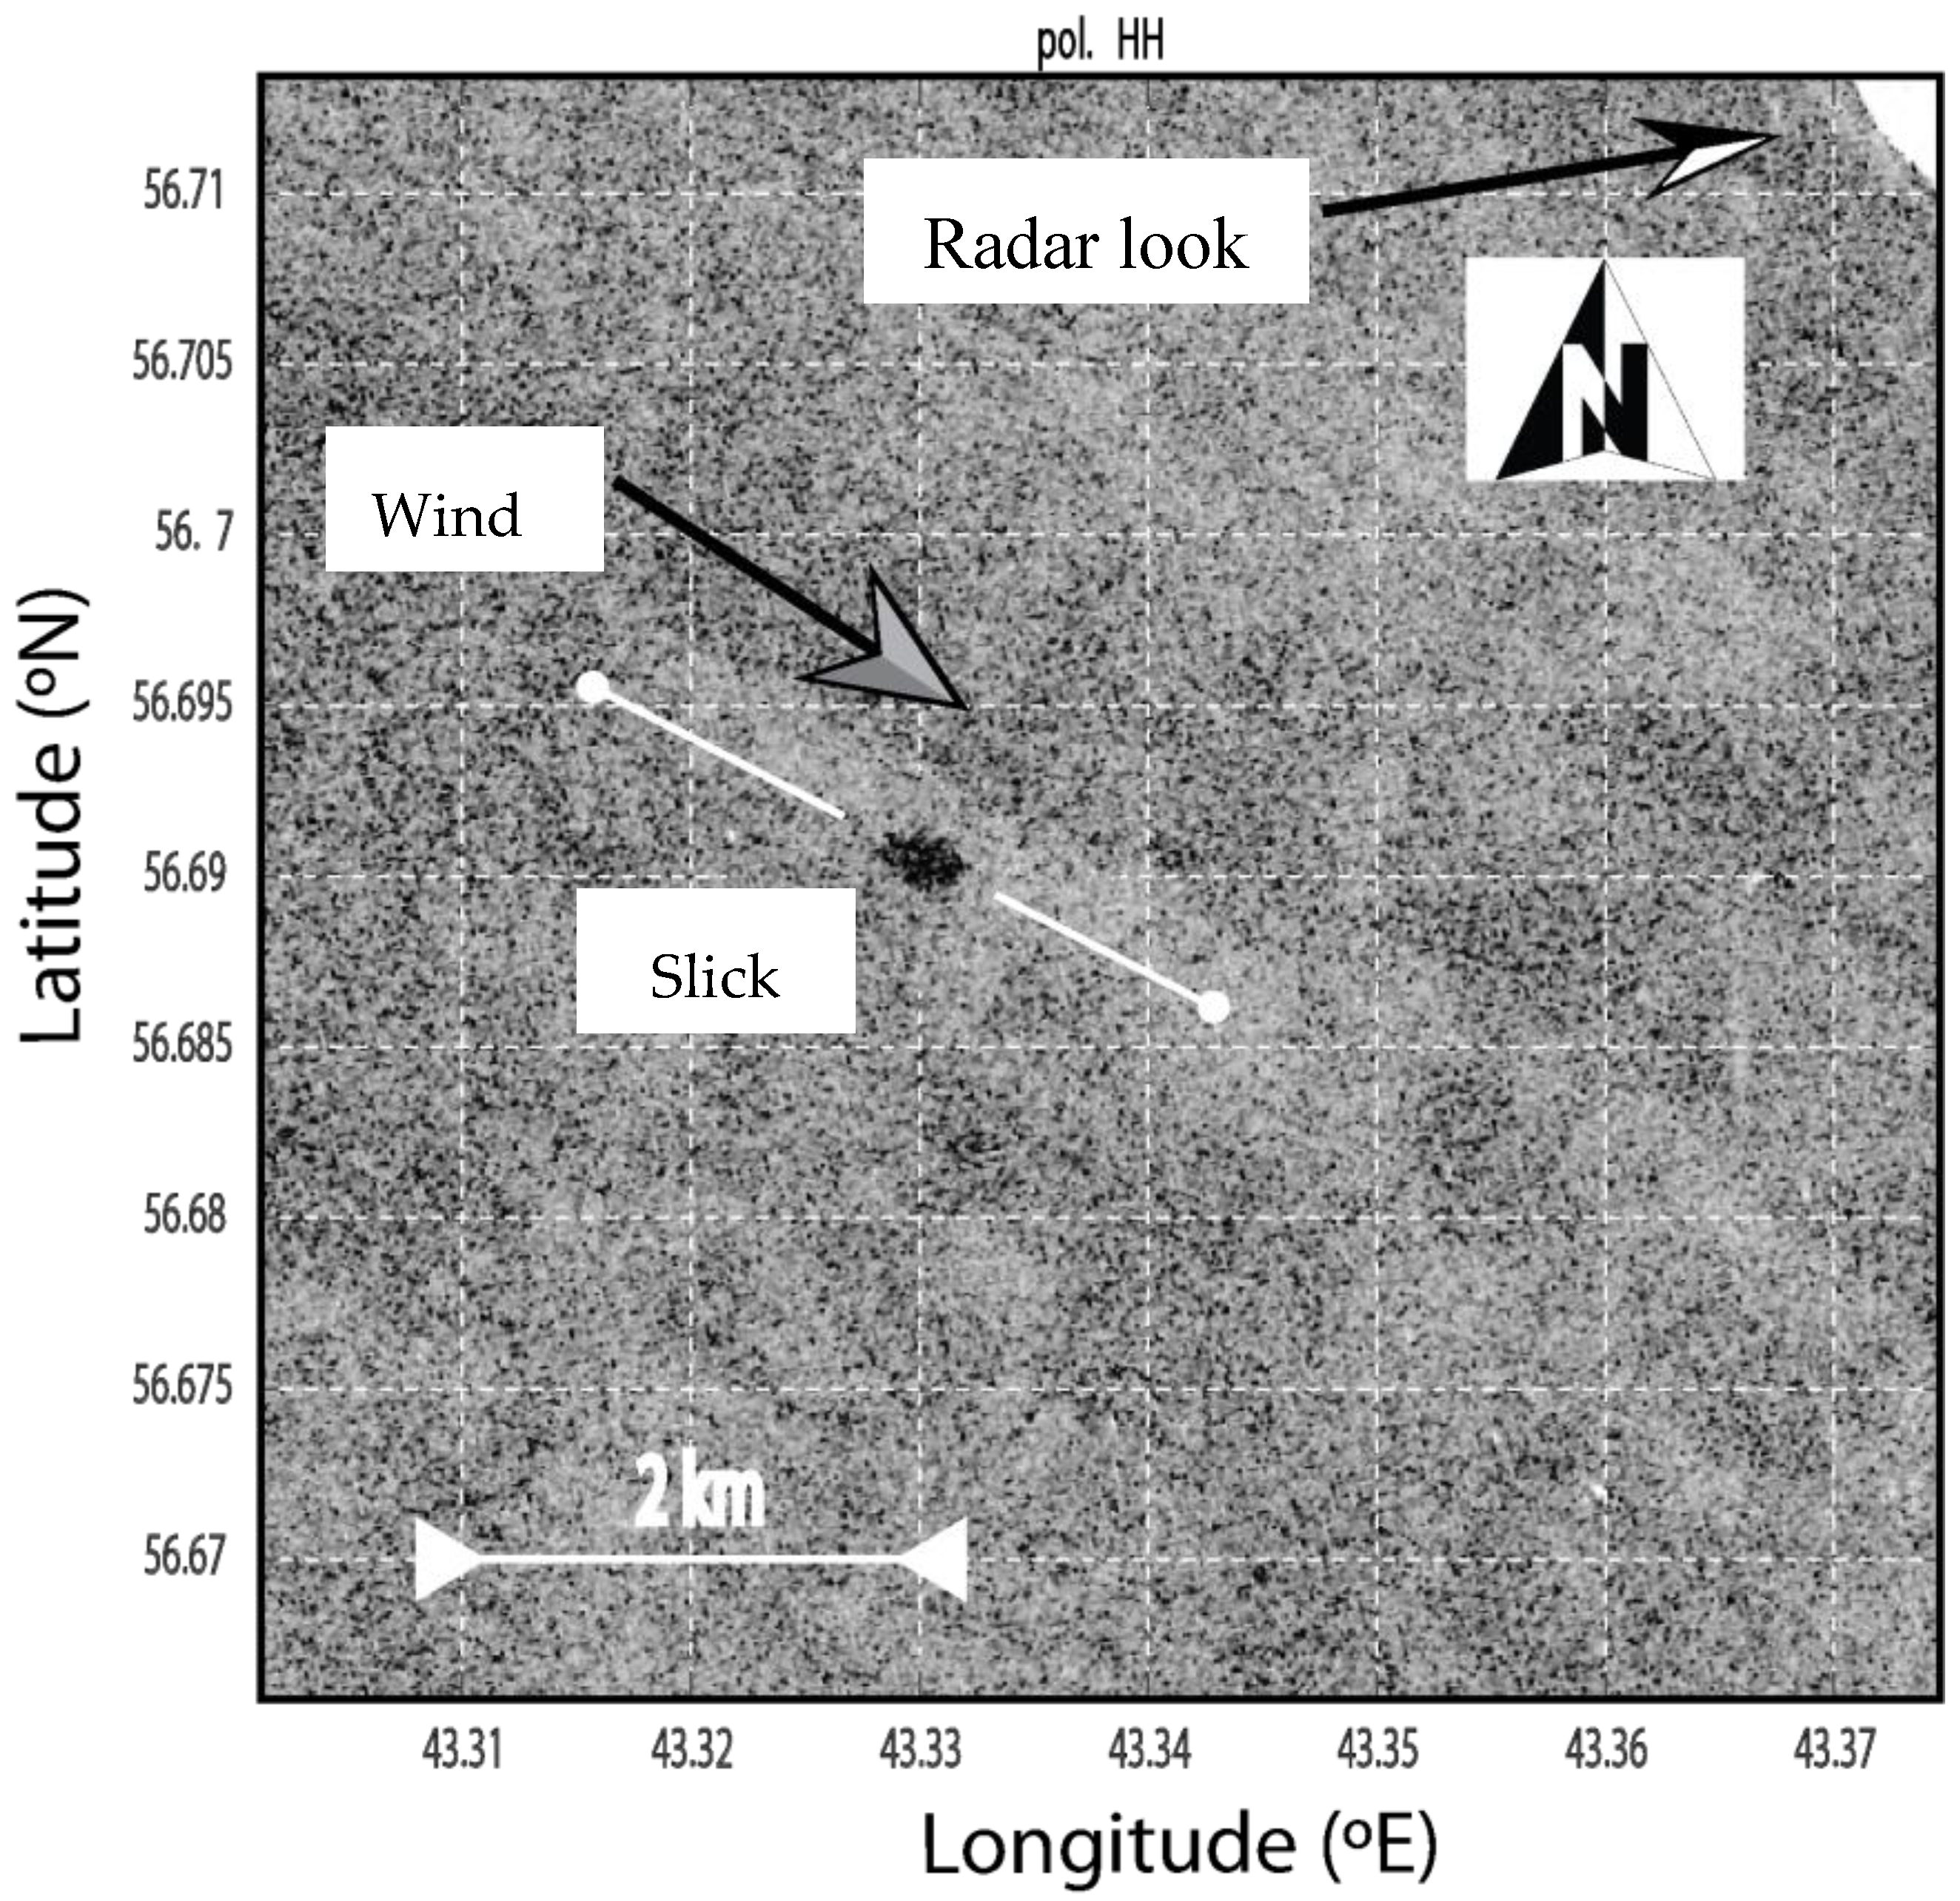
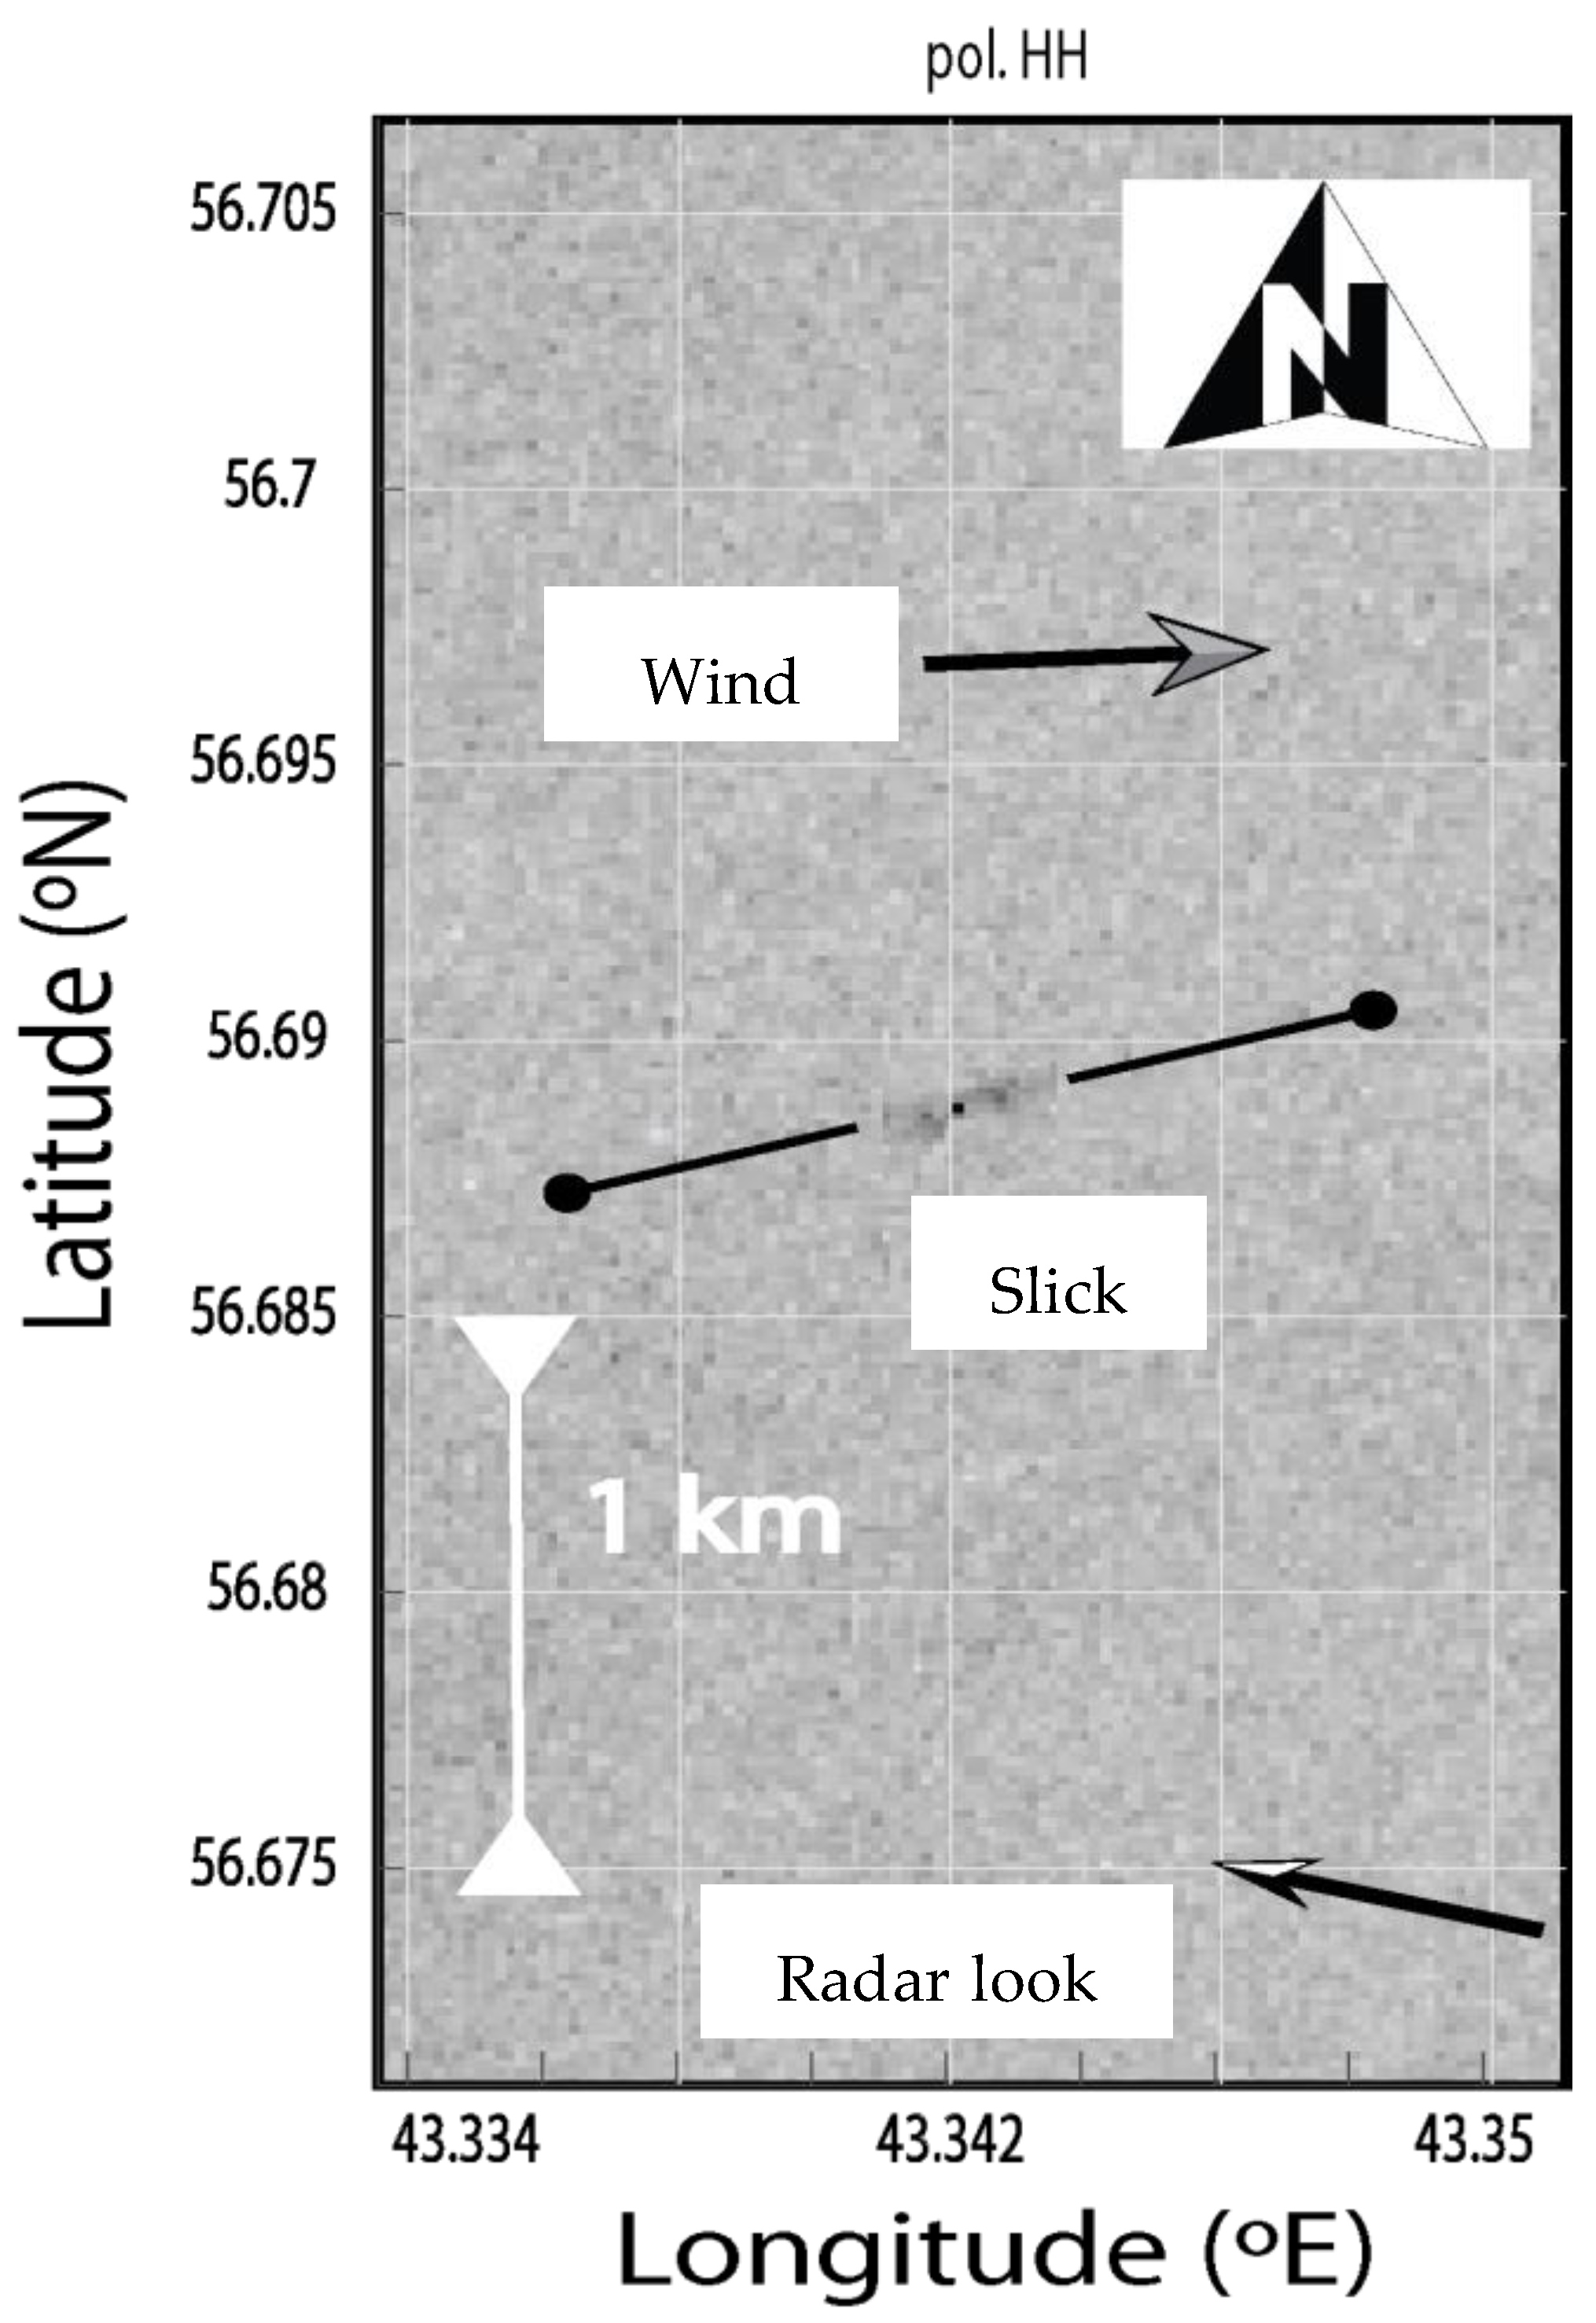
3.1. Satellite Experiment of 31.08.2014
3.2. Satellite Experiment of 03.08.2015
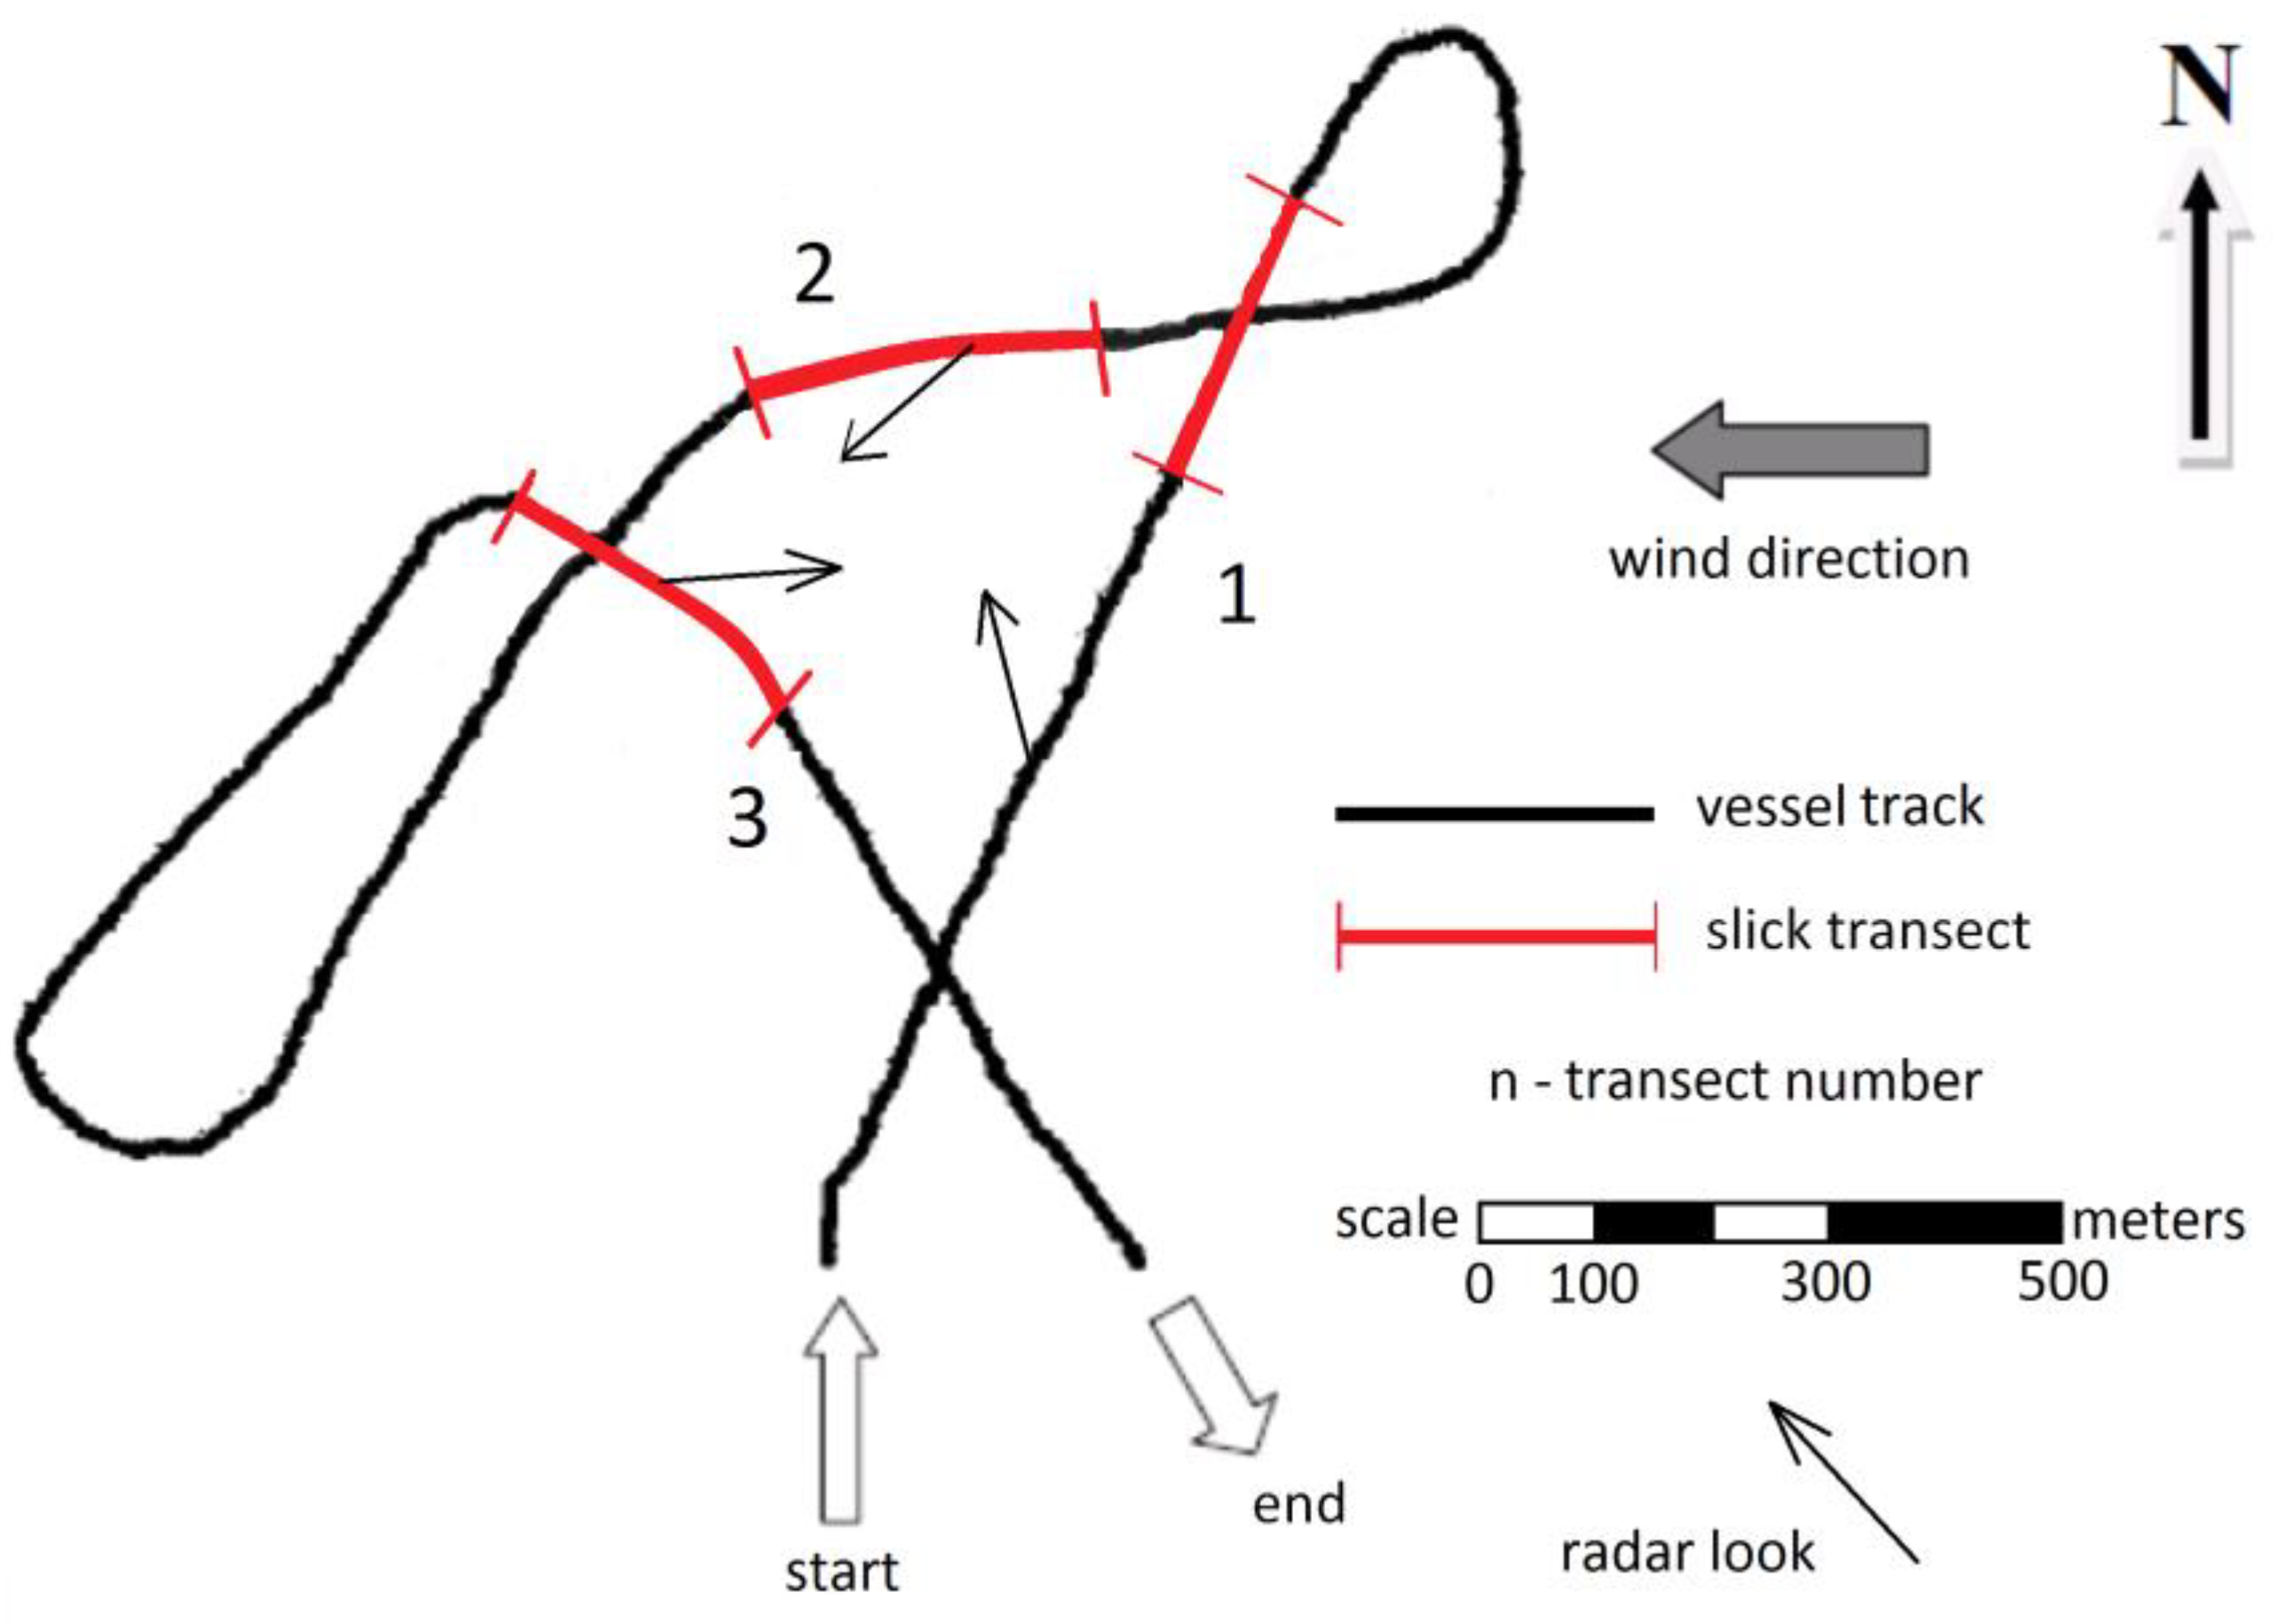
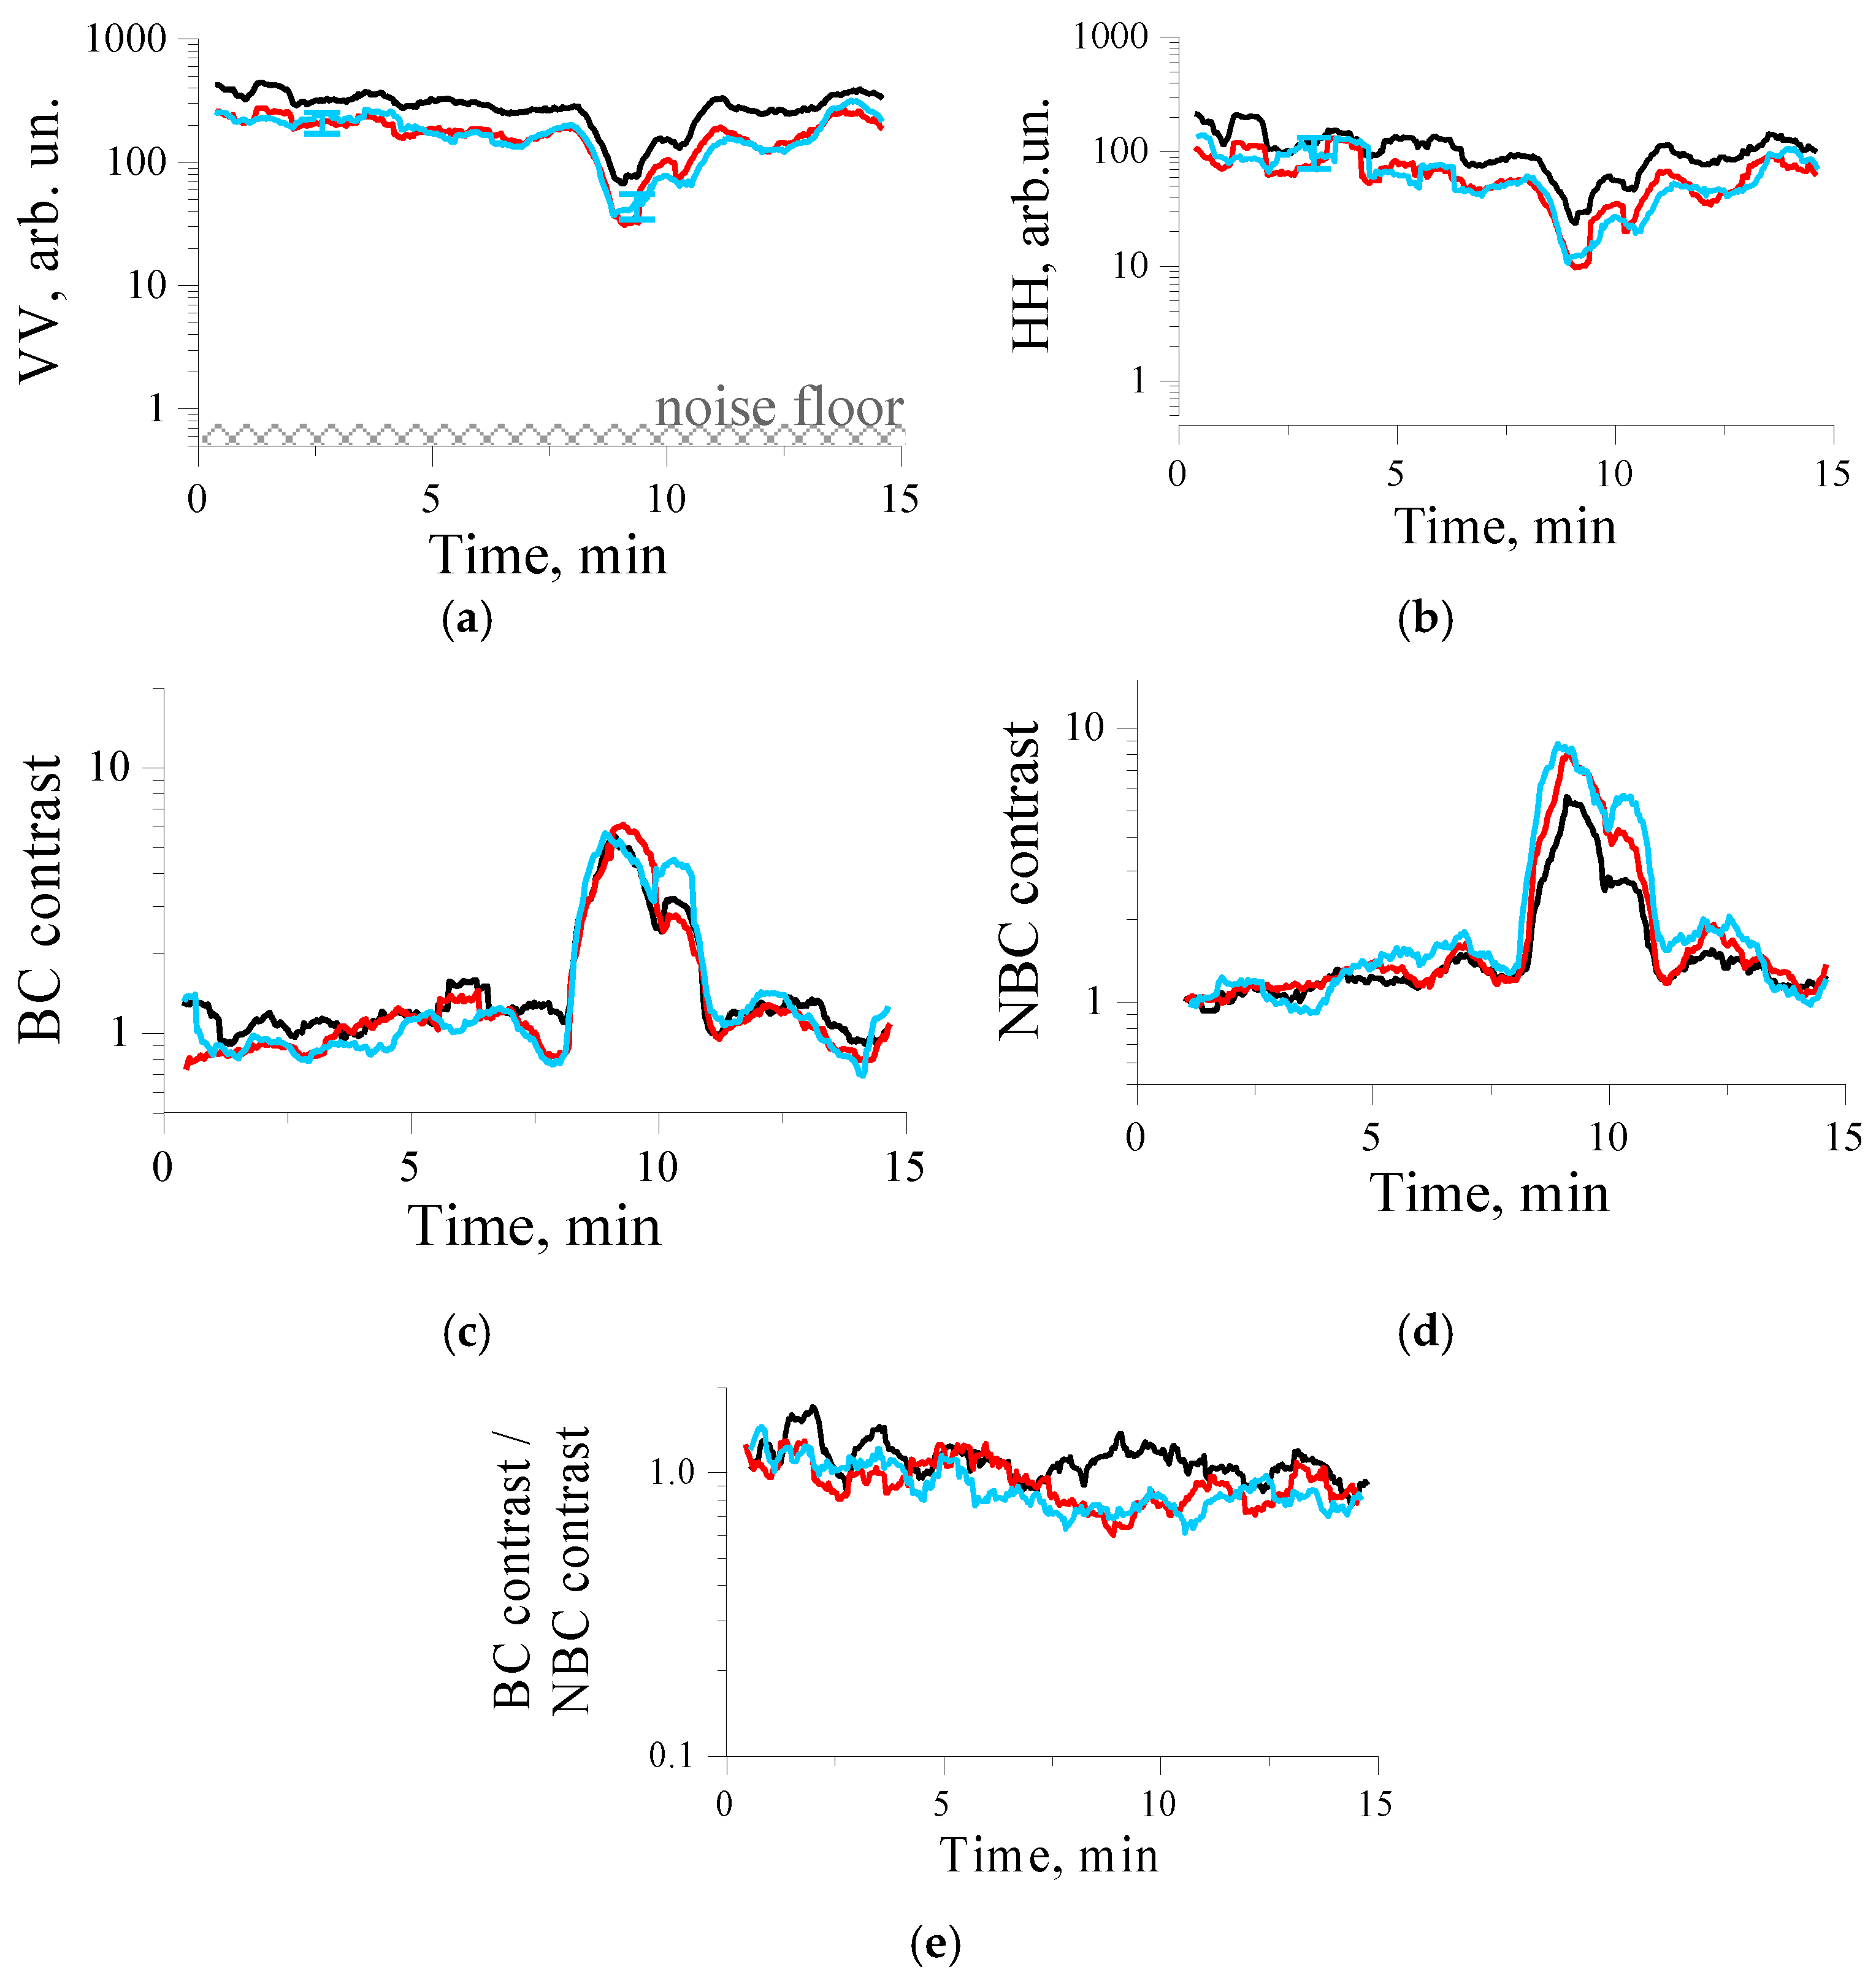
3.3. Boat Experiment of 22.07.2016 with a Three-Band Radar
4. Discussion
5. Conclusions
Author Contributions
Funding
Acknowledgments
Conflicts of Interest
References
- Alpers, W.; Huehnerfuss, H. The damping of ocean waves by surface films: A new look at an old problem. J. Geophys. Res. 1989, 94, 6251–6266. [Google Scholar] [CrossRef]
- Ermakov, S.A.; Panchenko, A.R.; Salashin, S.G. Film Slicks on the Sea Surface and Some Mechanisms of their Formation. Dyn. Atmos. Oceans 1992, 16, 279–304. [Google Scholar] [CrossRef]
- Scott, J.C.; Thomas, N.H. Sea surface slicks–surface chemistry and hydrodynamics in radar remote sensing. In Wind-Over-Wave Couplings. Perspectives and Prospects; Sajjadi, S.G., Thomas, N.H., Hunt, J.C.R., Eds.; Clarendon Press: New York, NY, USA; Oxford, UK, 1999; pp. 221–229. ISBN 0-19-850192-7. [Google Scholar]
- Da Silva, J.C.; Ermakov, S.A.; Robinson, I.S.; Jeans, D.R.G.; Kijashko, S.V. Role of surface films in ERS SAR signatures of internal waves on the shelf. 1. Short-period internal waves. J. Geophys. Res. 1998, 103, 8009–8031. [Google Scholar] [CrossRef]
- Gade, M.; Alpers, W.; Hühnerfuss, H.; Masuko, H.; Kobayashi, T. Imaging of biogenic and anthropogenic ocean surface films by the multifrequency/multipolarization SIR-C/X-SAR. J. Geophys. Res. 1998, 103, 18851–18866. [Google Scholar] [CrossRef]
- Brekke, C.; Solberg, A.H.S. Oil spill detection by satellite remote sensing. Remote Sens. Environ. 2005, 95, 1–13. [Google Scholar] [CrossRef]
- Minchew, B.; Jones, C.E.; Holt, B. Polarimetric analysis of backscatter from the Deepwater horizon oil spill using L-band synthetic aperture radar. IEEE Trans. Geosci. Remote Sens. 2012, 50, 3812–3830. [Google Scholar] [CrossRef]
- Levich, V.G. Physicochemical Hydrodynamics; Prentice-Hall: Englewood Cliffs, NJ, USA, 1962; ISBN 9780136744405. [Google Scholar]
- Lucassen-Reynders, E.H.; Lucassen, J. Properties of capillary waves. Adv. Coll. Int. Sci. 1970, 2, 347–395. [Google Scholar] [CrossRef]
- Ermakov, S.A. Resonance damping of gravity-capillary waves on the water surface covered with a surface-active film. Izv. Atmos. Ocean. Phys. 2003, 39, 624–628. [Google Scholar]
- Jenkins, A.D.; Jacobs, S.J. Wave damping by a thin layer of viscous fluid. Phys. Fluids 1997, 9, 1256–1264. [Google Scholar] [CrossRef]
- Ermakov, S.A.; Sergievskaya, I.A.; Gushchin, L.A. Damping of gravity-capillary waves in the presence of oil slicks according to data from laboratory and numerical experiments. Izv. Atmos. Ocean. Phys. 2012, 48, 565–572. [Google Scholar] [CrossRef]
- Huehnerfuss, H.; Lange, P.; Walter, W. Wave damping by monomolecular surface films and their chemical structure. Pt.II. Variation of the hydtophylic part of the film molecules including natural substances. J. Mar. Res. 1984, 42, 737–759. [Google Scholar] [CrossRef]
- Loglio, G.; Noskov, B.; Pandolfini, P.; Miller, P. Static and dynamic surface tension of marine water: Onshore or platform-based measurements by the oscillating bubble tensionmeter. In Marine Surface Films; Gade, M., Hühnerfuss, H., Korenowski, G.M., Eds.; Springer: New York, NY, USA, 2006; pp. 93–103. ISBN 3-540-33270-7. [Google Scholar]
- Ermakov, S.A.; Kijashko, S.V. Laboratory study of the damping of parametric ripples due to surfactant films. In Marine Surface Films; Gade, M., Hühnerfuss, H., Korenowski, G.M., Eds.; Springer: New York, NY, USA, 2006; pp. 113–128. ISBN 3-540-33270-7. [Google Scholar]
- Sergievskaya, I.A.; Ermakov, S.A. Damping of gravity–capillary waves on water surface covered with a visco-elastic film of finite thickness. Izv. Atmos. Ocean. Phys. 2017, 53, 650–658. [Google Scholar] [CrossRef]
- Phillips, O.M. Spectral and equilibrium properties of the equilibrium range in the wind-generated gravity waves. J. Fluid Mech. 1985, 156, 505–531. [Google Scholar] [CrossRef]
- Ermakov, S.A.; Zujkova, E.M.; Panchenko, A.R.; Salashin, S.G.; Talipova, T.G.; Titov, V.I. Surface film effect on short wind waves. Dyn. Atmos. Oceans 1986, 10, 31–50. [Google Scholar] [CrossRef]
- Donelan, M.A.; Pierson, W.J., Jr. Radar scattering and equilibrium ranges in wind-generated waves with application to scatterometry. J. Geophys. Res. 1987, 92, 4971–5029. [Google Scholar] [CrossRef]
- Kudryavtsev, V.; Hauser, V.; Caudal, D.; Caudal, G.; Chapron, B. A semiempirical model of the normalized radar cross-section of the sea surface: 1. Background model. J. Geophys. Res. 2003, 108, 8054. [Google Scholar] [CrossRef]
- Valenzuela, G.R. Theories for the interaction of electromagnetic and oceanic waves—A review. Bound.-Layer Meteorol. 1978, 13, 61–85. [Google Scholar] [CrossRef]
- Bass, F.G.; Fuks, M. Wave Scattering from Statistically Rough Surfaces; Pergamon: Oxford, UK, 1979; 540p, ISBN 9781483187754. [Google Scholar]
- Ermakov, S.; Kapustin, I.; Sergievskaya, I.; Da Silva, J.C.B. Remote sensing of oil films on the water surface using radar. In Proceedings of the SPIE, Remote Sensing of the Ocean, Sea Ice, Coastal Waters and Large Water Regions 2012, Edinburgh, UK, 19 October 2012; p. 85320M. [Google Scholar] [CrossRef]
- Phillips, O.M. Radar returns from the sea surface—Bragg scattering and breaking waves. J. Phys. Oceanogr. 1988, 18, 1065–1074. [Google Scholar] [CrossRef]
- Kwoh, D.S.; Lake, B.M. The nature of microwave backscattering from water waves. In The Ocean Surface; Toba, Y., Mitsuyasu, H., Eds.; D. Reidel Publishing Company: Dordrecht, The Netherlands, 1985; pp. 249–256. [Google Scholar]
- Kwoh, D.S.; Lake, B.M. A deterministic, coherent, and dual-polarized laboratory study of microwave backscattering from water waves, 1. Short gravity waves without wind. IEEE J. Ocean. Eng. 1984, OE-9, 291–308. [Google Scholar] [CrossRef]
- Jessup, A.T.; Keller, W.C.; Melville, W.K. Measurements of Sea Spikes in Microwave Backscatter at Moderate Incidence. J. Geophys. Res. 1990, 95, 9679–9688. [Google Scholar] [CrossRef]
- Gade, M.; Alpers, W.; Ermakov, S.A.; Huehnerfuss, H.; Lange, P. Wind-wave tank measurements of bound and freely propagating short gravity-capillary waves. J. Geophys. Res. 1998, 103, 21697–21709. [Google Scholar] [CrossRef]
- Ermakov, S.A.; Kapustin, I.A.; Kudryavtsev, V.N.; Sergievskaya, I.A.; Shomina, O.V.; Chapron, B.; Yurovskiy, Y.Y. On the Doppler Frequency Shifts of Radar Signals Backscattered from the Sea Surface. Radiophys. Quantum Electron. 2014, 57, 239–250. [Google Scholar] [CrossRef]
- Ermakov, S.A.; Kapustin, I.A.; Sergievskaya, I.A. On peculiarities of scattering of microwave radar signals by breaking gravity-capillary waves. Radiophys. Quantum Electron. 2012, 55, 239–250. [Google Scholar] [CrossRef]
- Kudryavtsev, V.; Chapron, B.; Myasoedov, A.; Collard, F.; Johannessen, J. On dual co-polarized SAR measurements of the Ocean surface. IEEE Geosci. Remote Sens. Lett. 2013, 10. [Google Scholar] [CrossRef]
- Skrunes, S.; Brekke, C.; Eltoft, T.; Kudryavtsev, V. Comparing near coincident C- and X-band SAR acquisitions of marine oil spills. IEEE Trans. Geosci. Remote Sens. 2015, 53, 1958–1975. [Google Scholar] [CrossRef]
- Hansen, M.W.; Kudryavtsev, V.; Chapron, B.; Brekke, C.; Johannessen, J.A. Wave Breaking in Slicks: Impacts on C-Band Quad-Polarized SAR Measurements. IEEE J. Sel. Top. Appl. Earth Obs. Remote Sens. 2016, 9, 4929–4940. [Google Scholar] [CrossRef]
- Ermakov, S.A.; Kapustin, I.A.; Lazareva, T.N.; Shomina, O.V. Experimental investigation of surfactant film destruction due to breaking gravity waves. Preliminary results. Sovrem. Probl. Distantsionnogo Zondirovaniya Zemli iz Kosmosa 2015, 12, 72–79. [Google Scholar]
- Longuet Higging, M.; Cleaver, R. Crest instability of gravity waves. Part 1. The almost highest wave. J. Fluid Mech. 1994, 258, 115–129. [Google Scholar] [CrossRef]
- Longuet Higgins, M.S. Parasitic capillary waves: A direct calculation. J. Fluid Mech. 1995, 301, 79–107. [Google Scholar] [CrossRef]
- Yermakov, S.A.; Ruvinsky, K.D.; Salashin, S.G. Local correlation of the characteristics of ripples on the crest of capillary gravity waves with their curvature. Izv. Atmos. Ocean. Phys. 1988, 24, 561–563. [Google Scholar]


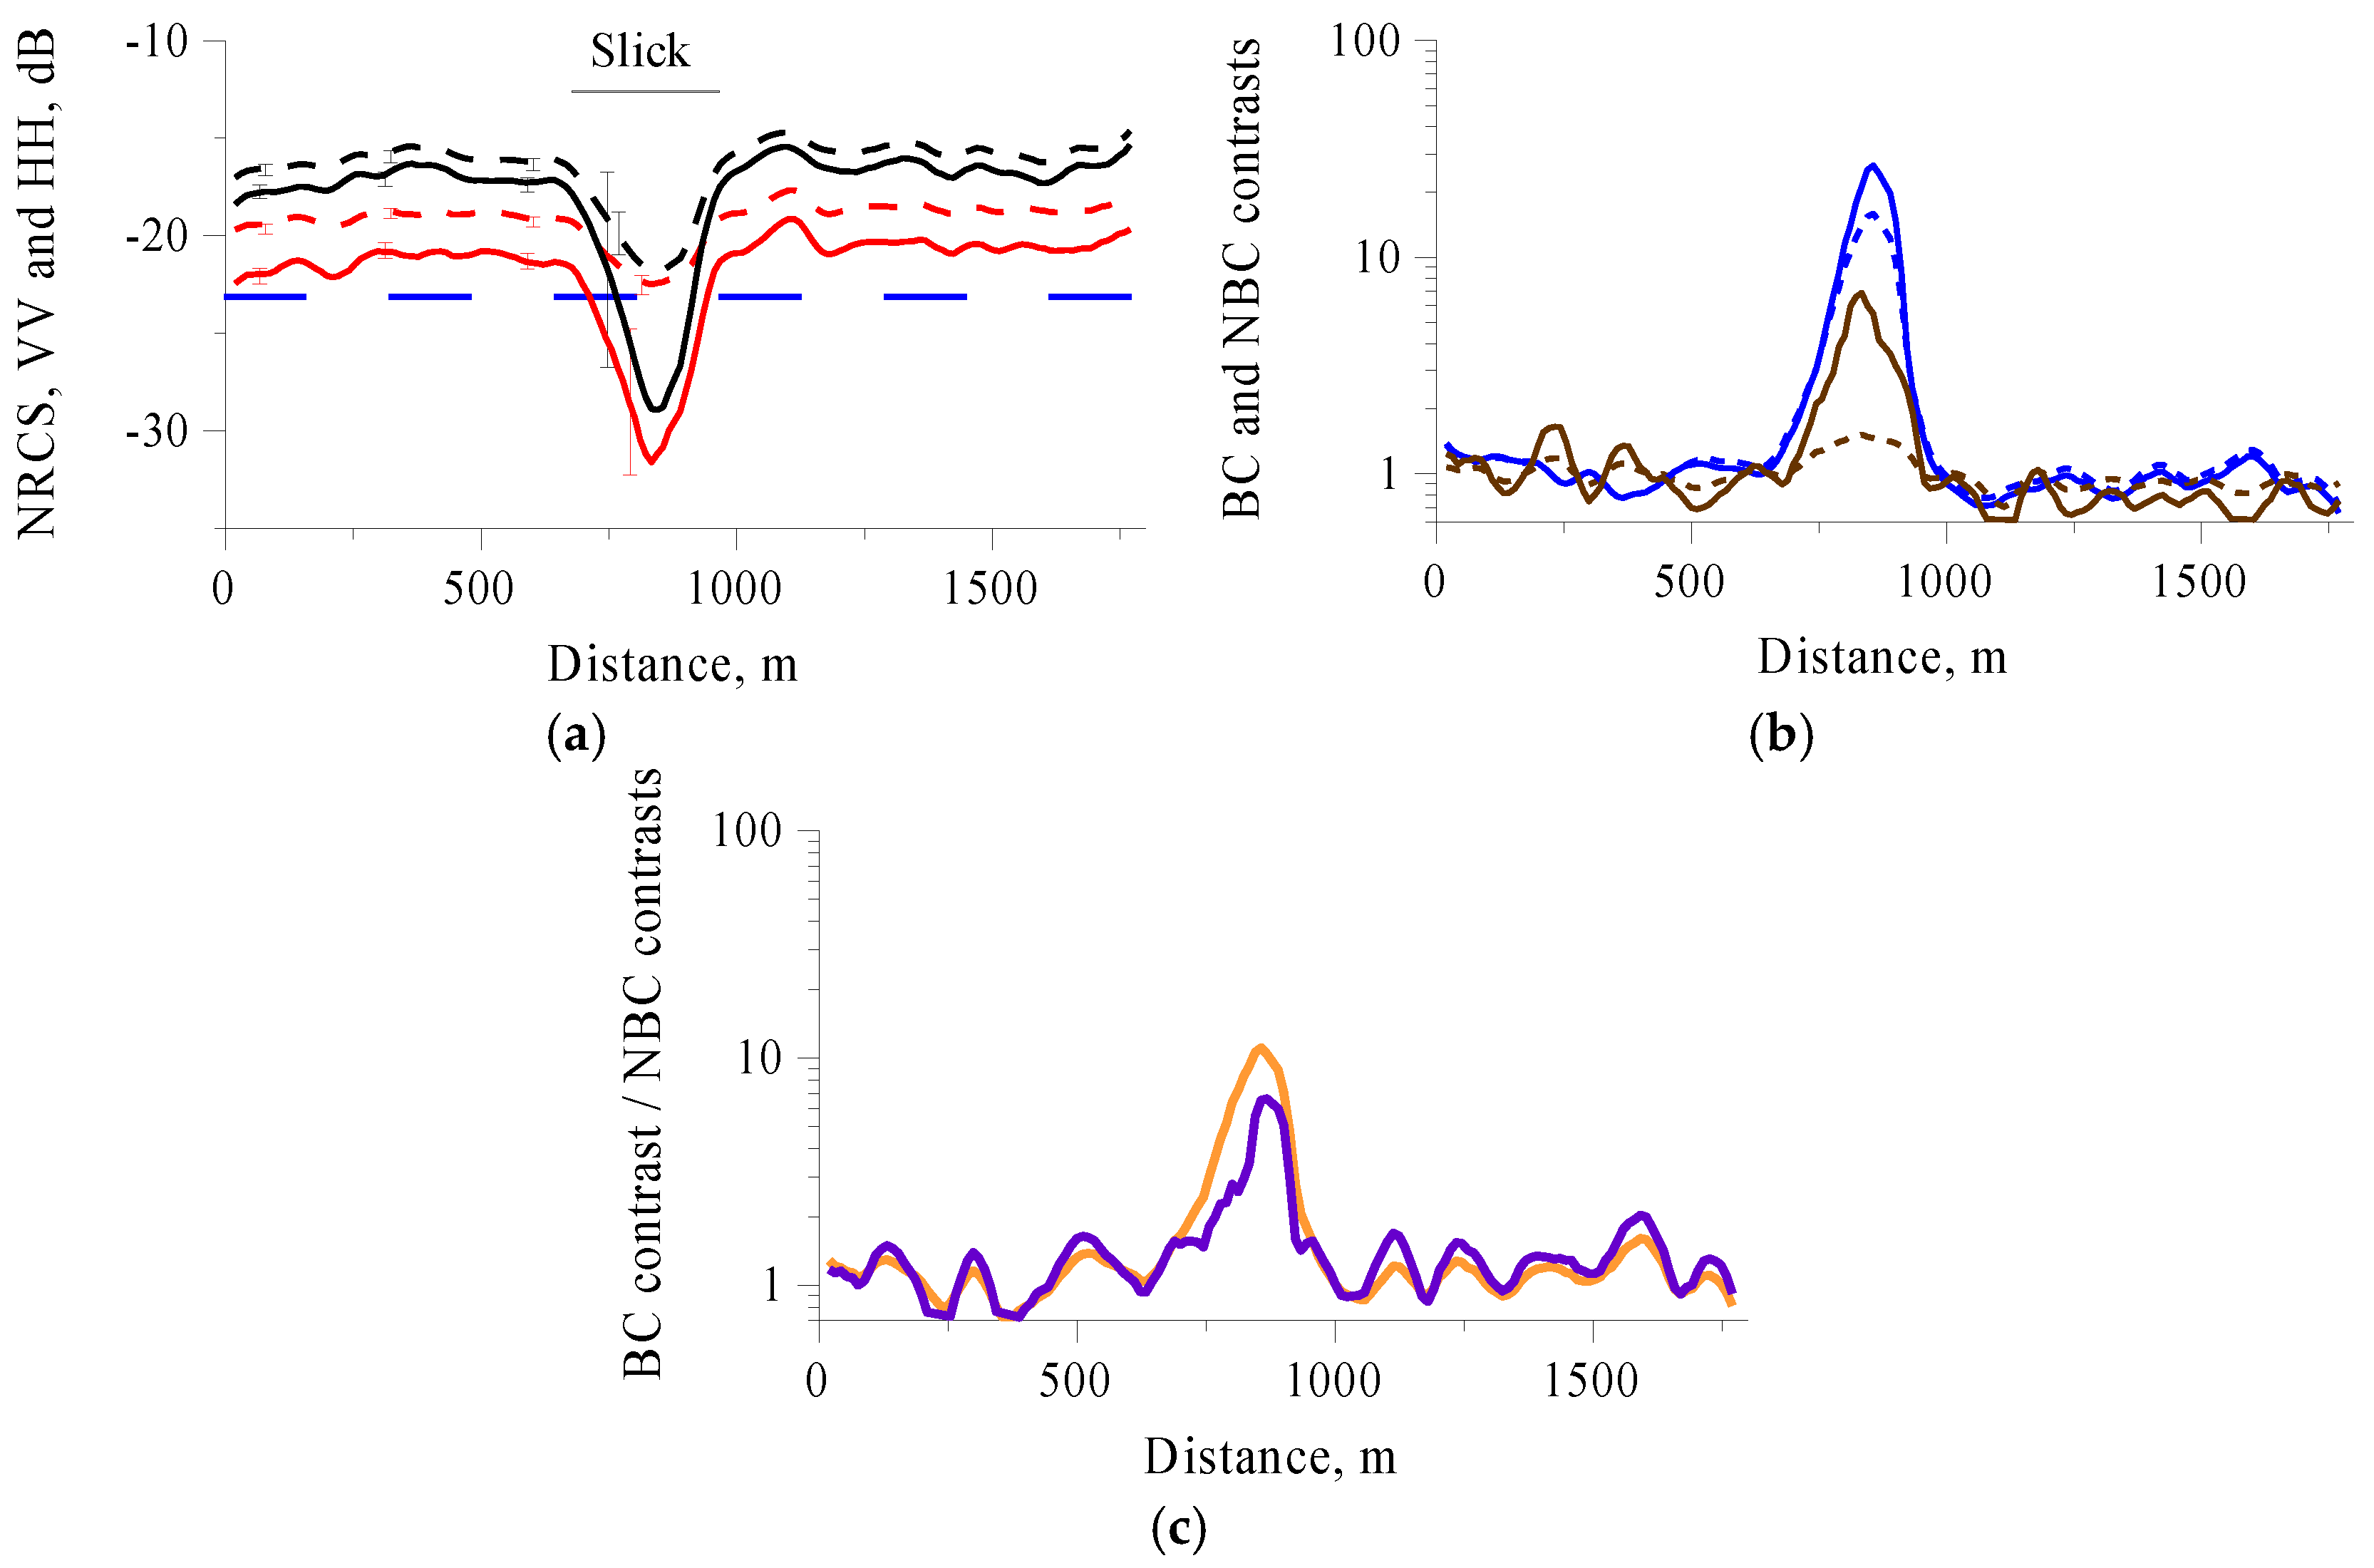
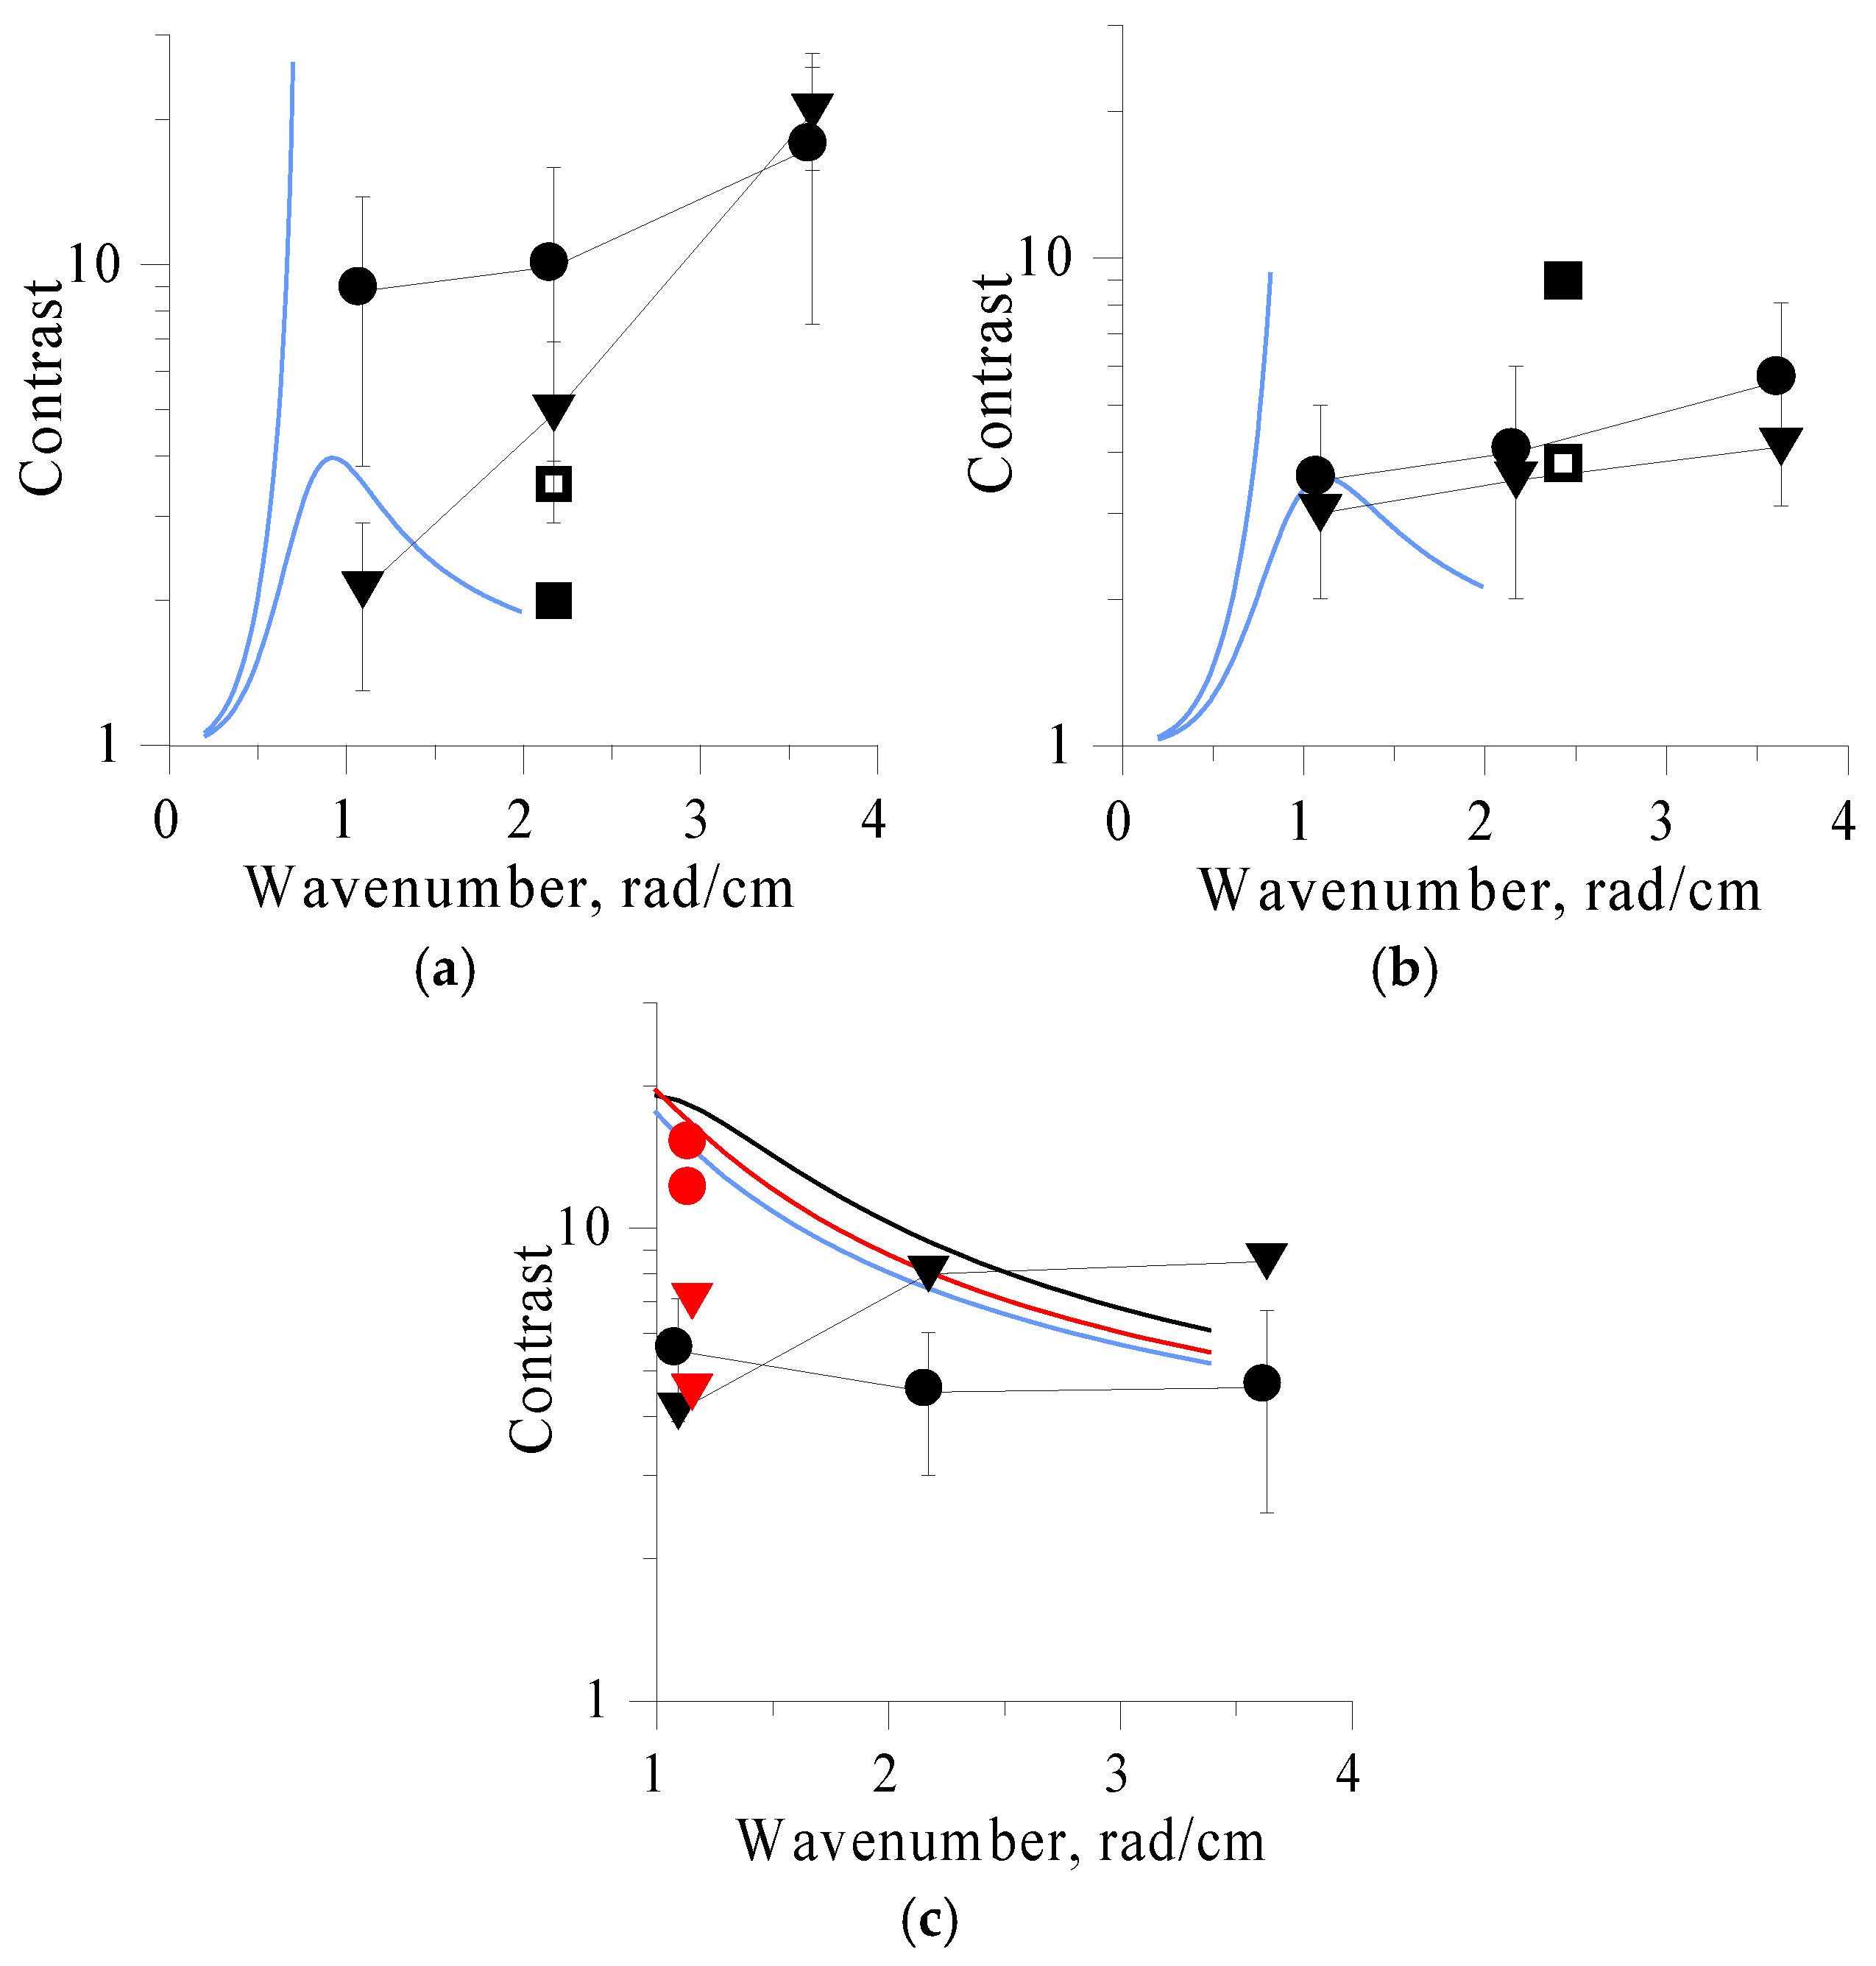
 NBC). (a) Upwind look direction, (b) 40° from downwind, the blue curves: theoretical BC contrasts at two different wind wave growth rates; (c) cross-wind observations; curves: theoretical BC contrasts at elasticity 20 mN/m (black), 30 mN/m (red), and 40 mN/m (blue), the red symbols: Radarsat data [33] for BC (●) and NBC (▼) contrasts for crude oil/emulsion slicks.
NBC). (a) Upwind look direction, (b) 40° from downwind, the blue curves: theoretical BC contrasts at two different wind wave growth rates; (c) cross-wind observations; curves: theoretical BC contrasts at elasticity 20 mN/m (black), 30 mN/m (red), and 40 mN/m (blue), the red symbols: Radarsat data [33] for BC (●) and NBC (▼) contrasts for crude oil/emulsion slicks.
NBC). (a) Upwind look direction, (b) 40° from downwind, the blue curves: theoretical BC contrasts at two different wind wave growth rates; (c) cross-wind observations; curves: theoretical BC contrasts at elasticity 20 mN/m (black), 30 mN/m (red), and 40 mN/m (blue), the red symbols: Radarsat data [33] for BC (●) and NBC (▼) contrasts for crude oil/emulsion slicks.


| Date, Sensor | Inc. Angle | Wind Velocity, Dir. | Azimuth Angle (kV) | Bragg Wavenumber kBragg, rad/cm |
|---|---|---|---|---|
| 31.08.2014, TerraSAR-X | 37° | 7 m/s, NW | (kV) ≈ 40° (40° from downwind) | 2.43 |
| 03.08.2015, TerraSAR-X | 32.5° | 5 m/s, W | (kV) ≈ 180° (upwind) | 2.17 |
| 22 07.2016, 3-band radar, transect 1 | 60° | 7 m/s, E | (kV) ≈ 80° | 1.01, 2.17, 3.63 |
| 22 07.2016, 3-band radar, transect 2 | 60° | 7 m/s, E | (kV) ≈ 40° | 1.01, 2.17, 3.63 |
| 22 07.2016, 3-band radar, transect 3 | 60° | 7 m/s, E | (kV) ≈ 180° | 1.01, 2.17, 3.63 |
| Date, Experiment | Radar Band | kB, rad/cm | Contrasts | ||||
|---|---|---|---|---|---|---|---|
| KVV | KHH | KBragg | KNBC | KBragg/KNBC | |||
| 22.07.2016 Transect1, (kV) ≈ 80° | S | 1.09 | 4.3 | 4.1 | 4.5 | 4.1 | 1.1 |
| C | 2.17 | 5.4 | 7.6 | 4.5 | 8 | 0.6 | |
| X | 3.63 | 5.7 | 8.2 | 4.6 | 8.5 | 0.5 | |
| 22.07.2016 Transect2, (kV) ≈ 40° | S | 1.09 | 3.3 | 3 | 3.5 | 3 | 1.2 |
| C | 2.17 | 3.9 | 3.5 | 4 | 3.5 | 1.1 | |
| X | 3.63 | 5 | 4.2 | 5.6 | 4.1 | 1.4 | |
| 22.07.2016 Transect3, (kV) ≈ 180° | S | 1.09 | 4.5 | 2.3 | 8.8 | 2.1 | 4.2 |
| C | 2.17 | 8 | 5.2 | 9.9 | 4.9 | 2 | |
| X | 3.63 | 18 | 20.5 | 17.5 | 20.7 | 0.8 | |
| 31.08.2014 TerraSAR-X, (kV) ≈ 40° | X | 2.43 | 7.4 | 5.8 | 9 | 3.8 | 2.4 |
| 03.08.2015 TerraSAR-X, (kV) ≈ 180° | X | 2.17 | 2.9 | 2.5 | 2.0 | 3.5 | 0.6 |
© 2018 by the authors. Licensee MDPI, Basel, Switzerland. This article is an open access article distributed under the terms and conditions of the Creative Commons Attribution (CC BY) license (http://creativecommons.org/licenses/by/4.0/).
Share and Cite
Ermakov, S.A.; Sergievskaya, I.A.; Da Silva, J.C.B.; Kapustin, I.A.; Shomina, O.V.; Kupaev, A.V.; Molkov, A.A. Remote Sensing of Organic Films on the Water Surface Using Dual Co-Polarized Ship-Based X-/C-/S-Band Radar and TerraSAR-X. Remote Sens. 2018, 10, 1097. https://doi.org/10.3390/rs10071097
Ermakov SA, Sergievskaya IA, Da Silva JCB, Kapustin IA, Shomina OV, Kupaev AV, Molkov AA. Remote Sensing of Organic Films on the Water Surface Using Dual Co-Polarized Ship-Based X-/C-/S-Band Radar and TerraSAR-X. Remote Sensing. 2018; 10(7):1097. https://doi.org/10.3390/rs10071097
Chicago/Turabian StyleErmakov, Stanislav A., Irina A. Sergievskaya, José C.B. Da Silva, Ivan A. Kapustin, Olga V. Shomina, Alexander V. Kupaev, and Alexander A. Molkov. 2018. "Remote Sensing of Organic Films on the Water Surface Using Dual Co-Polarized Ship-Based X-/C-/S-Band Radar and TerraSAR-X" Remote Sensing 10, no. 7: 1097. https://doi.org/10.3390/rs10071097
APA StyleErmakov, S. A., Sergievskaya, I. A., Da Silva, J. C. B., Kapustin, I. A., Shomina, O. V., Kupaev, A. V., & Molkov, A. A. (2018). Remote Sensing of Organic Films on the Water Surface Using Dual Co-Polarized Ship-Based X-/C-/S-Band Radar and TerraSAR-X. Remote Sensing, 10(7), 1097. https://doi.org/10.3390/rs10071097