Annual Glacier-Wide Mass Balance (2000–2016) of the Interior Tibetan Plateau Reconstructed from MODIS Albedo Products


Abstract
1. Introduction
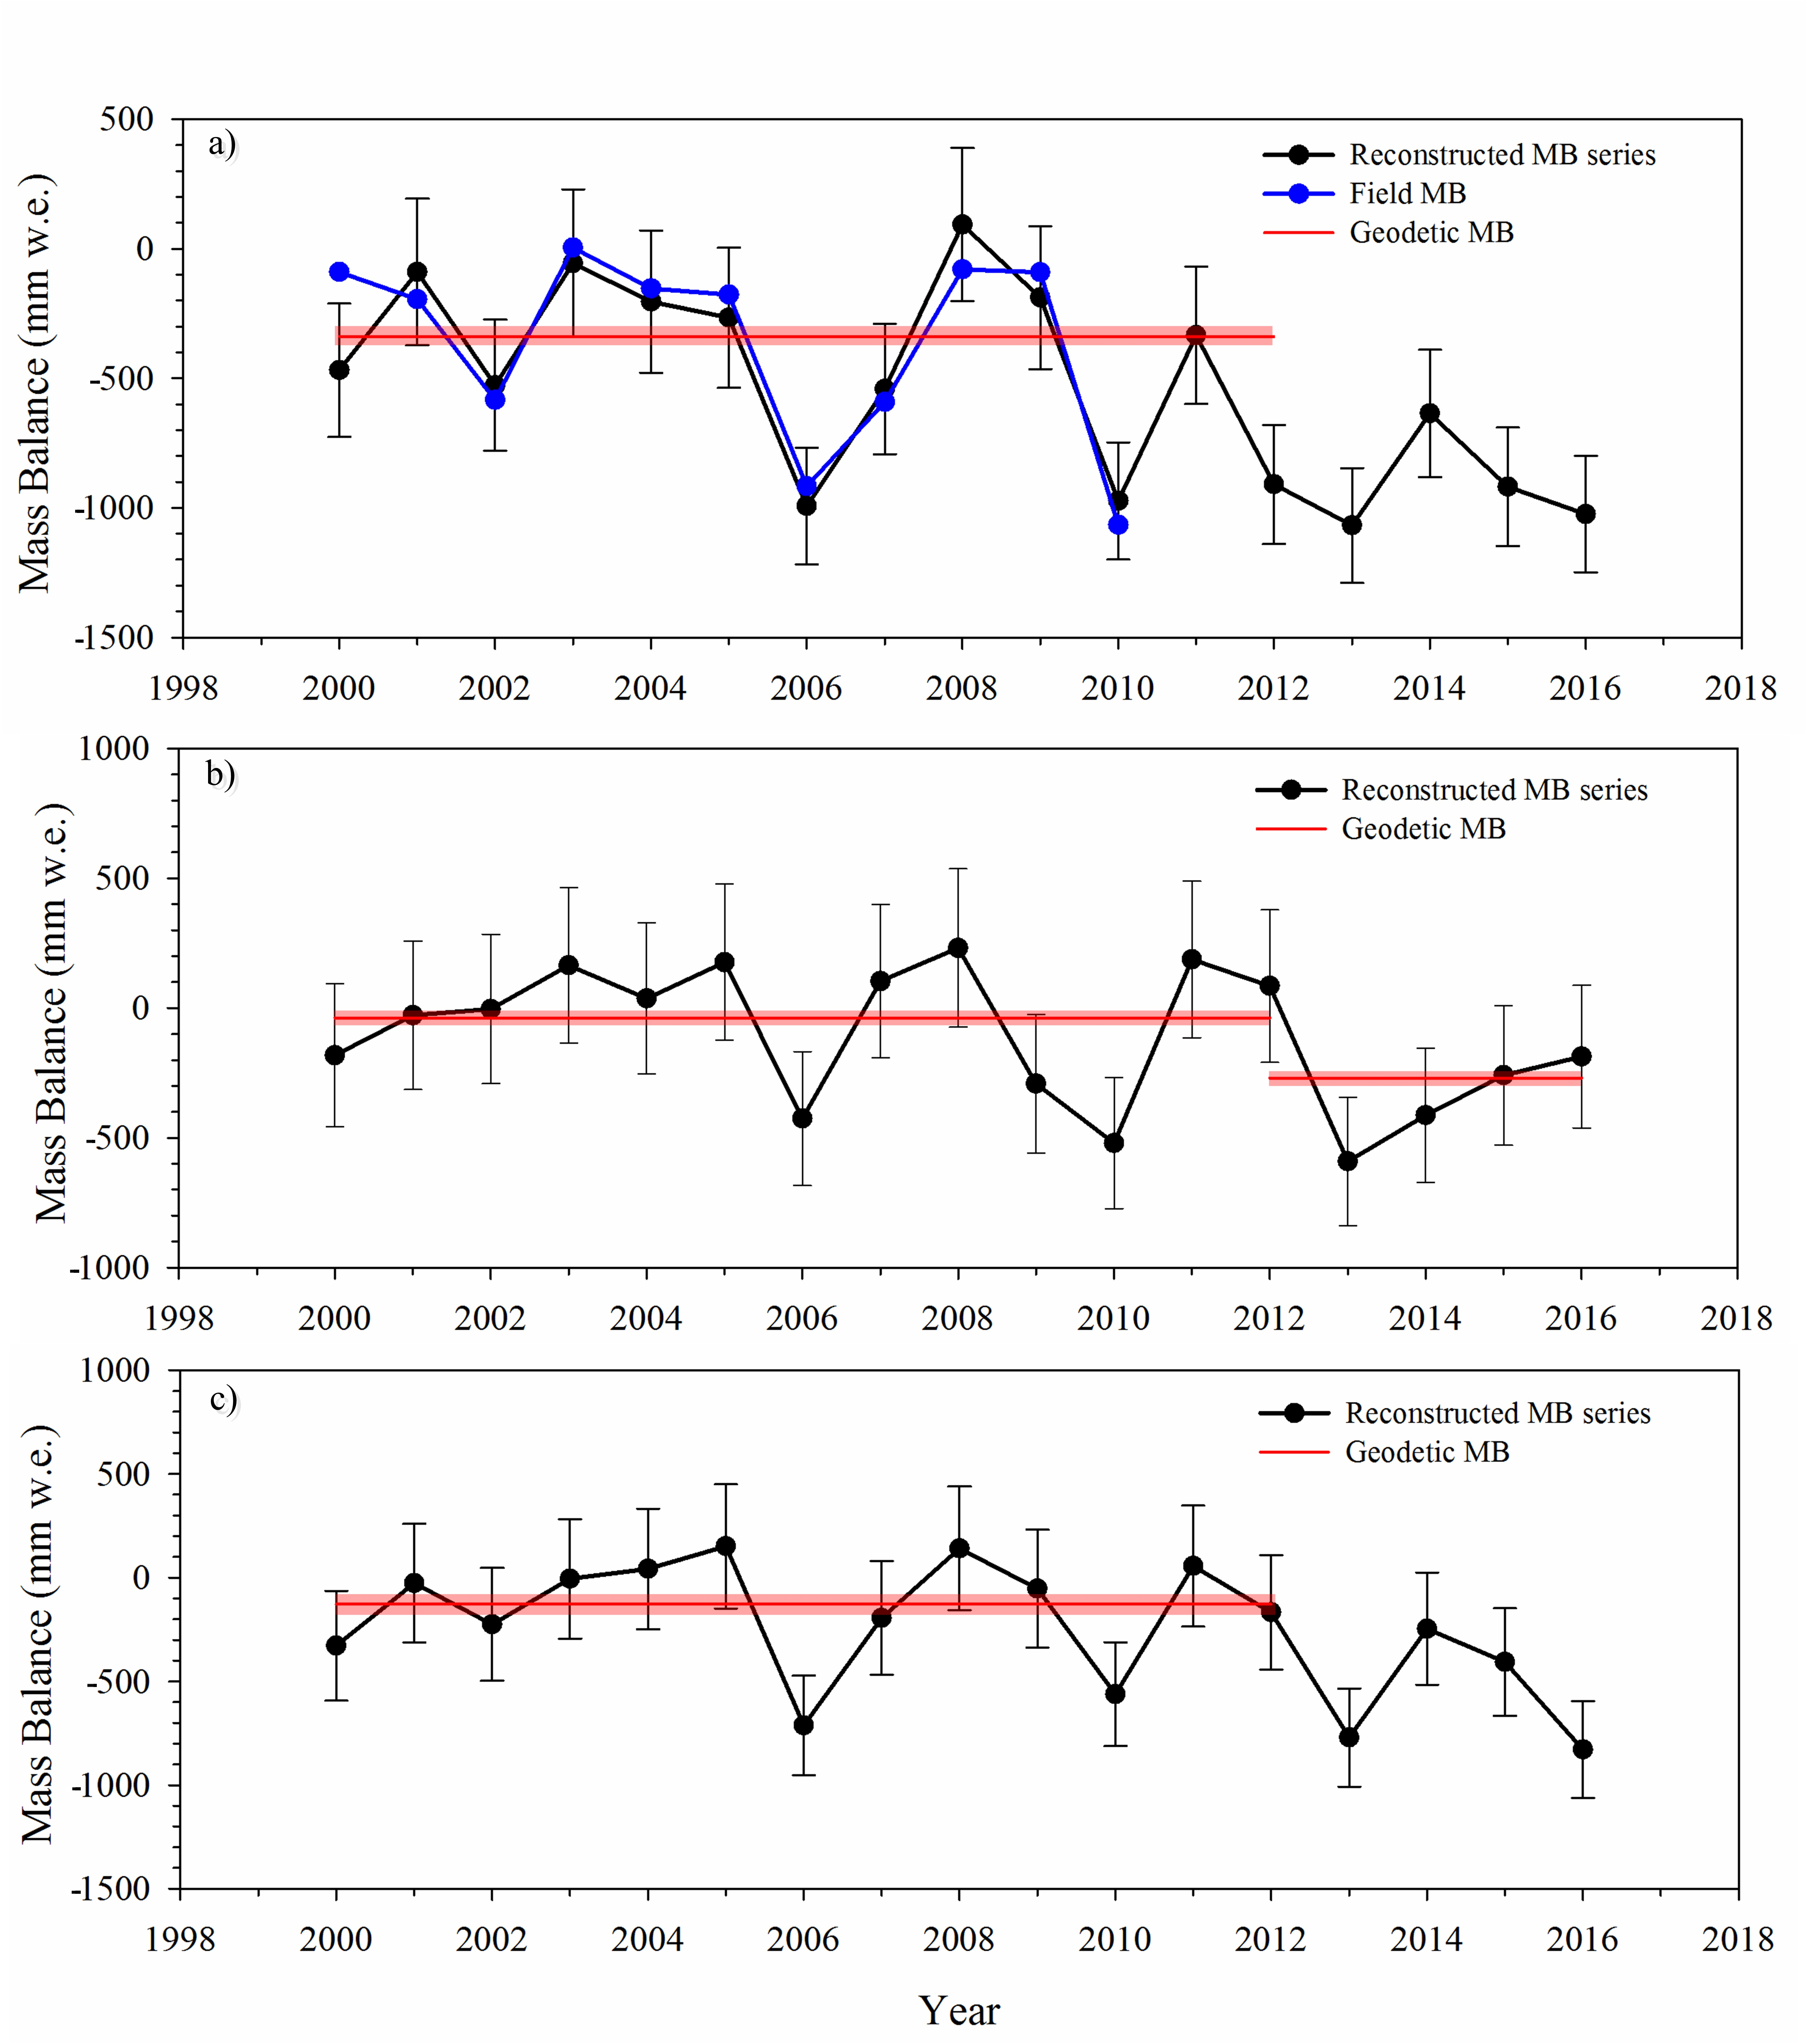
2. Site Description
2.1. Geological and Glaciological Settings of the Study Area
2.2. Previous Studies
3. Datasets
3.1. Observations of Glacier Mass Balance
3.2. MODIS Albedo Products
3.3. Climate Datasets
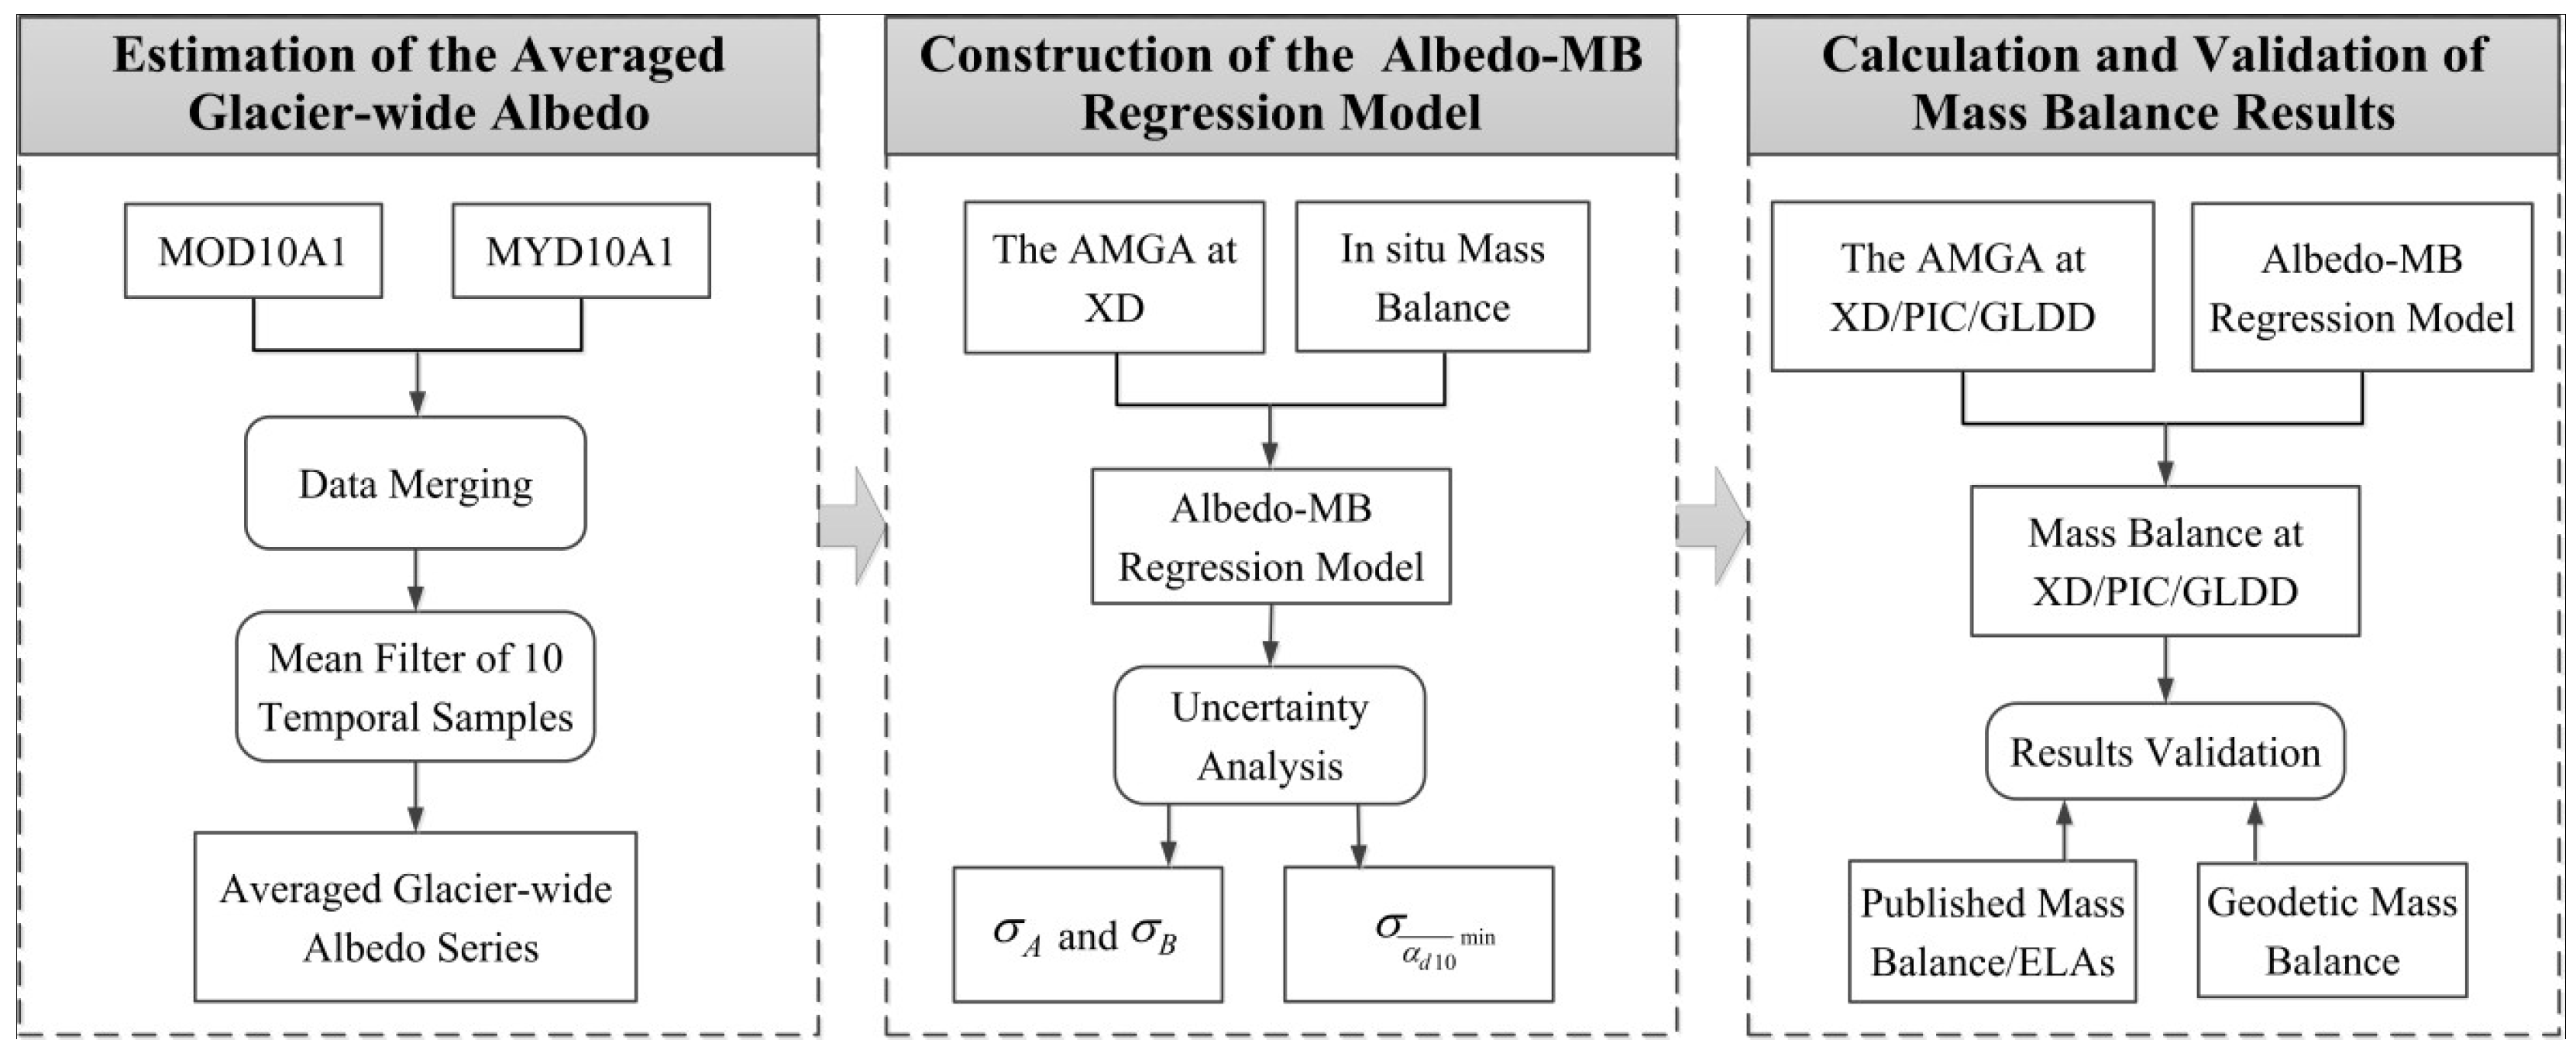
4. Method
4.1. Estimation of Glacier-Wide Albedo from MODIS Products
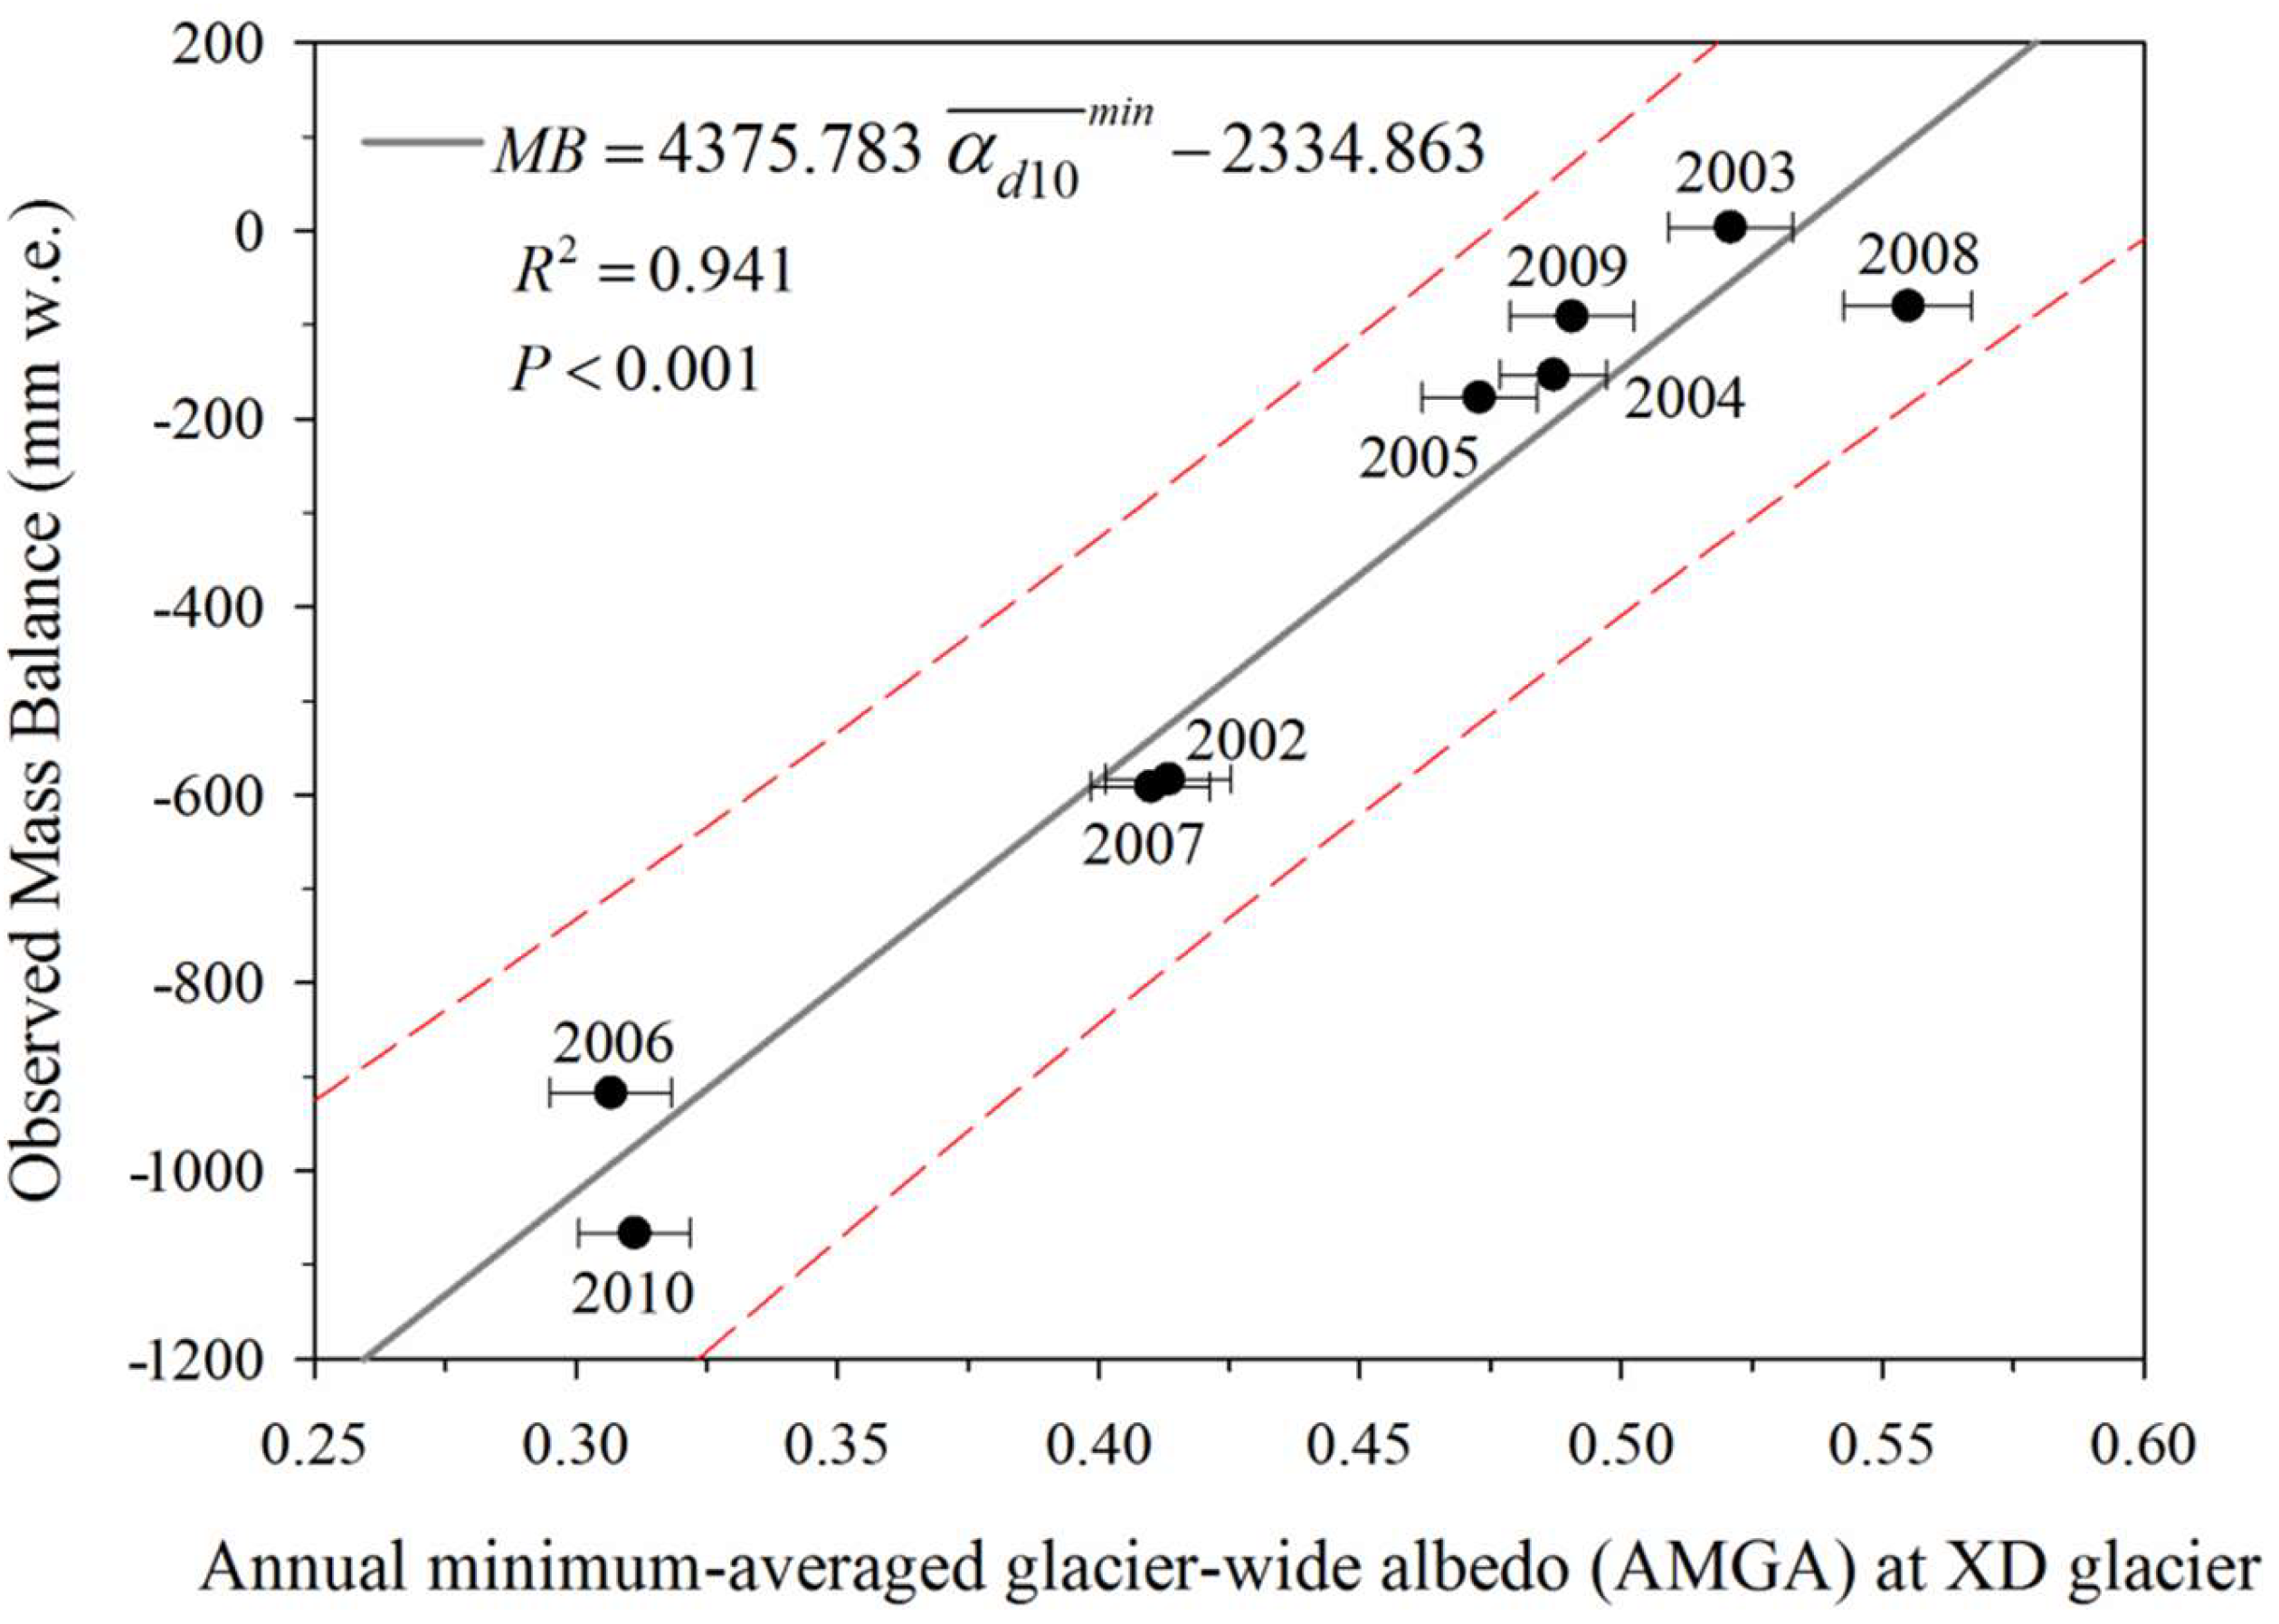
4.2. Construction of the Aass Balance Model
4.3. Uncertainty Analysis
5. Results
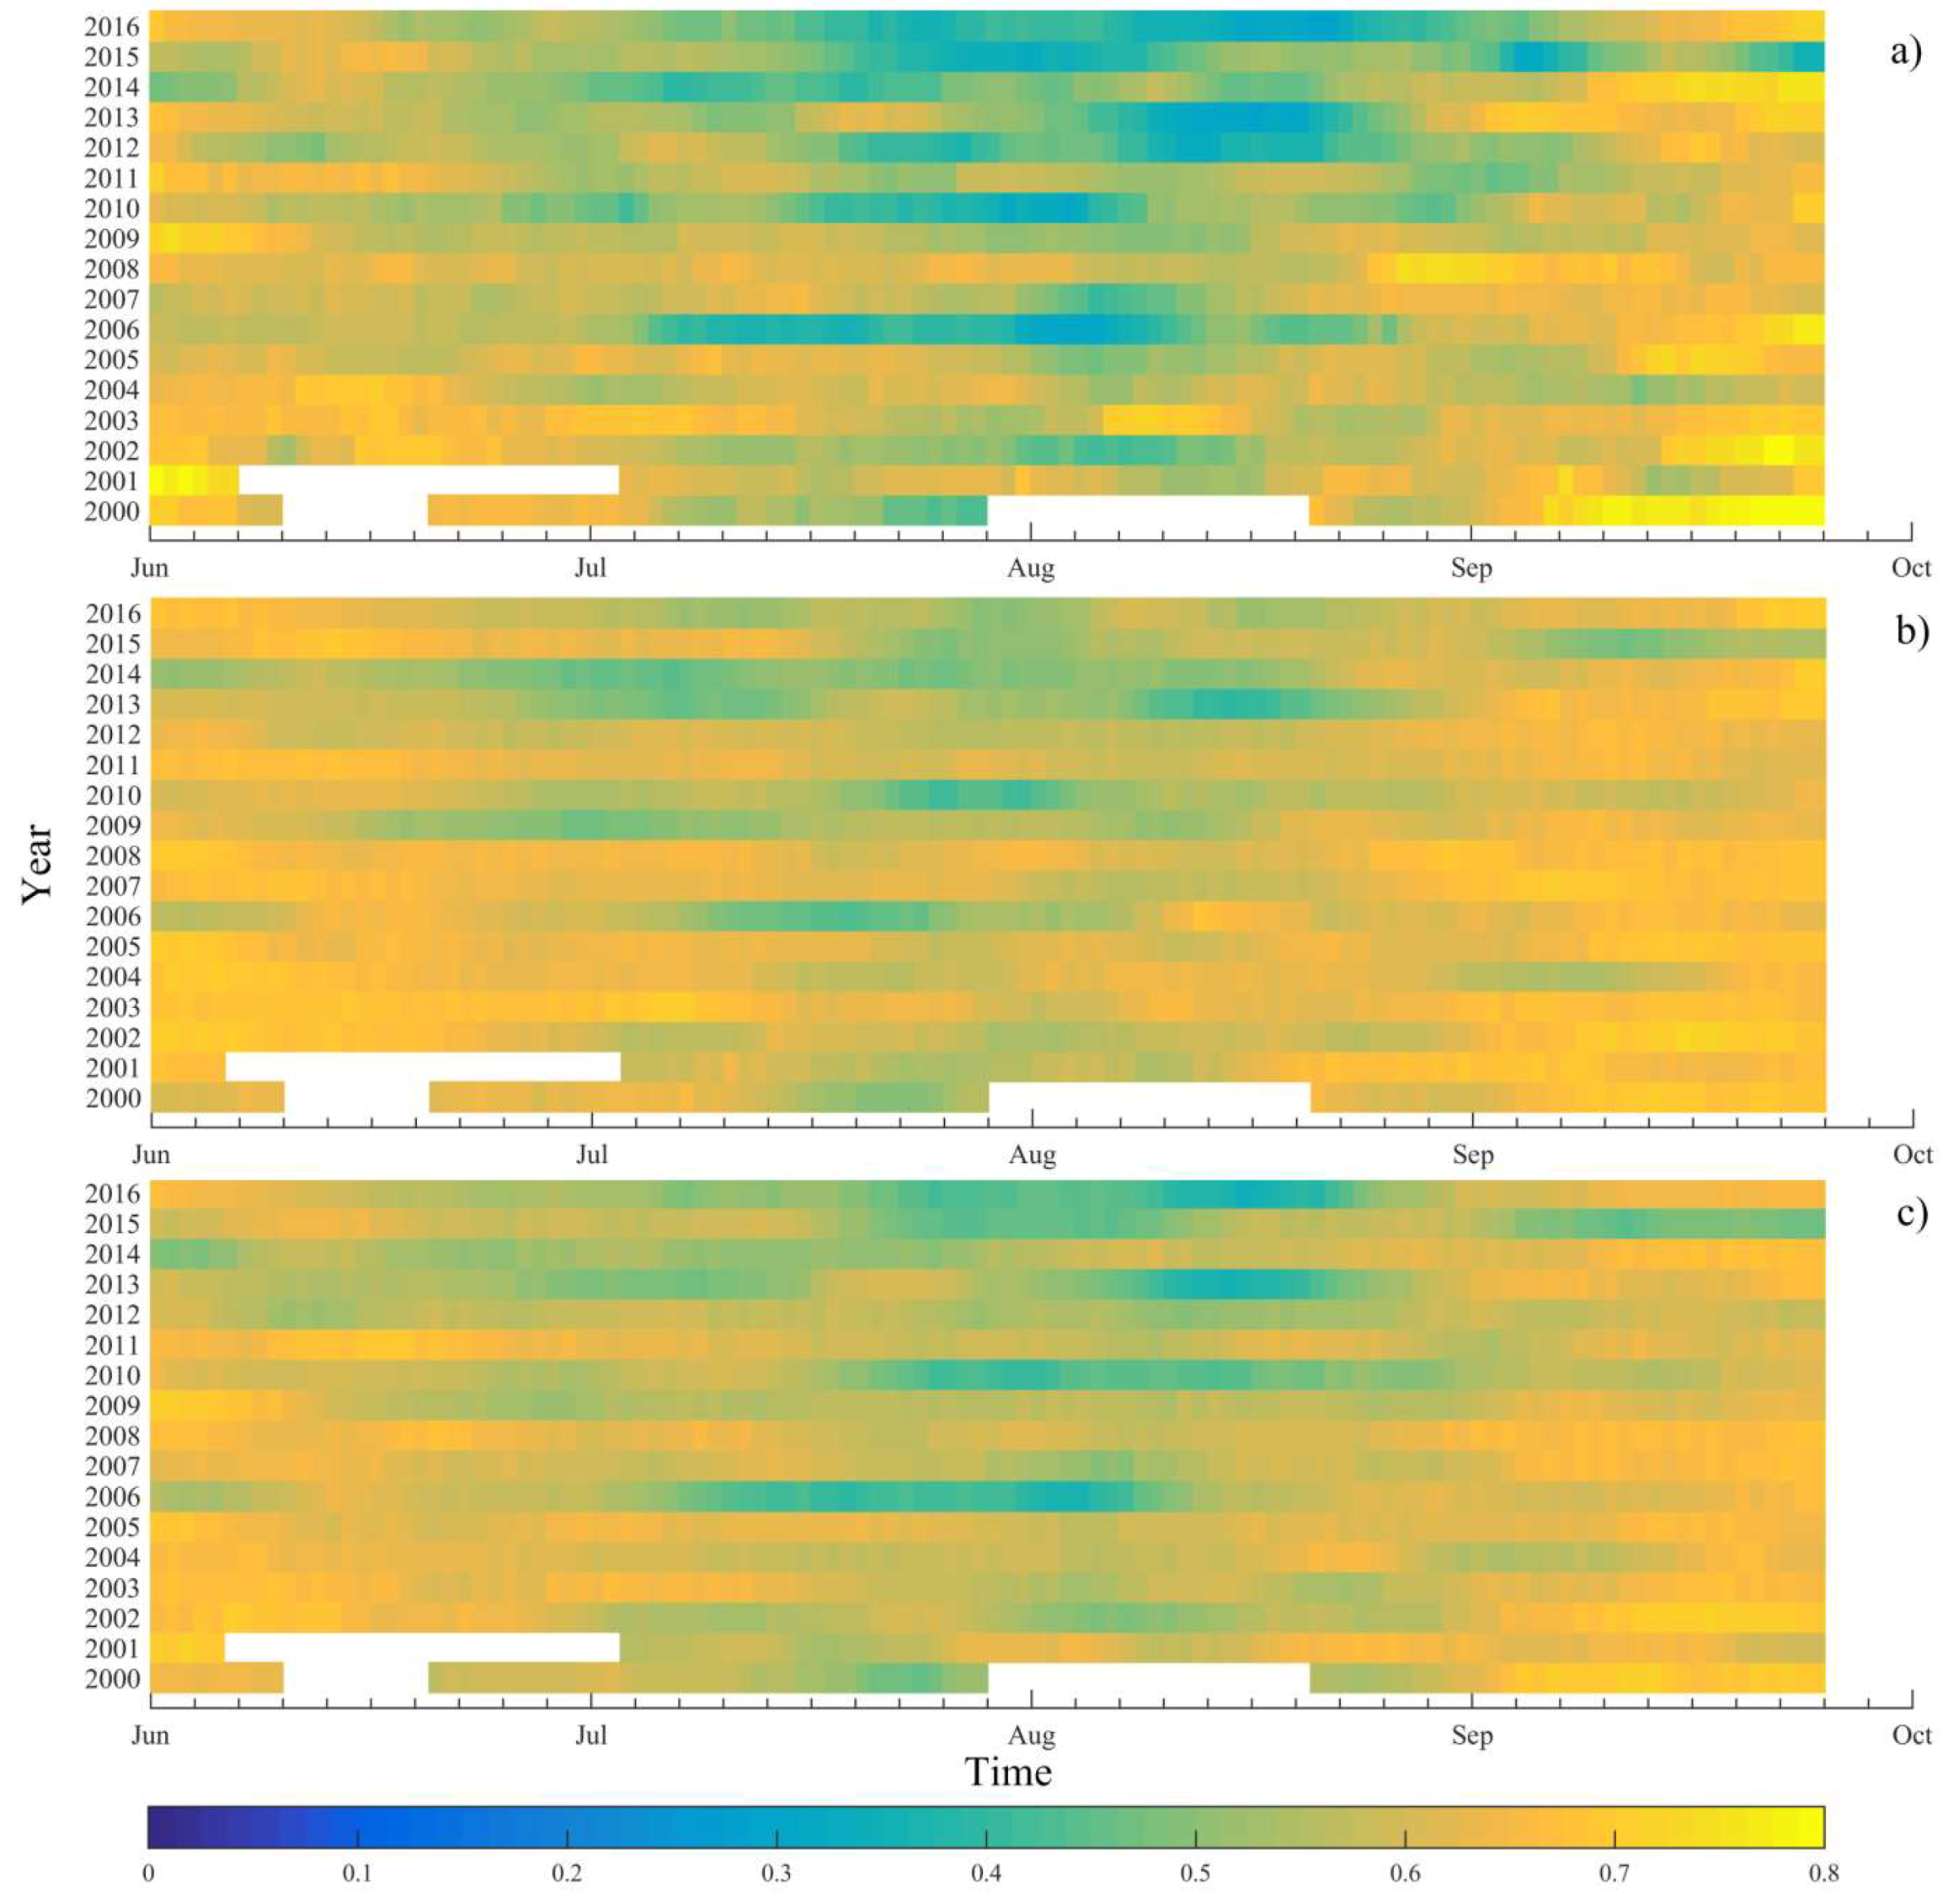
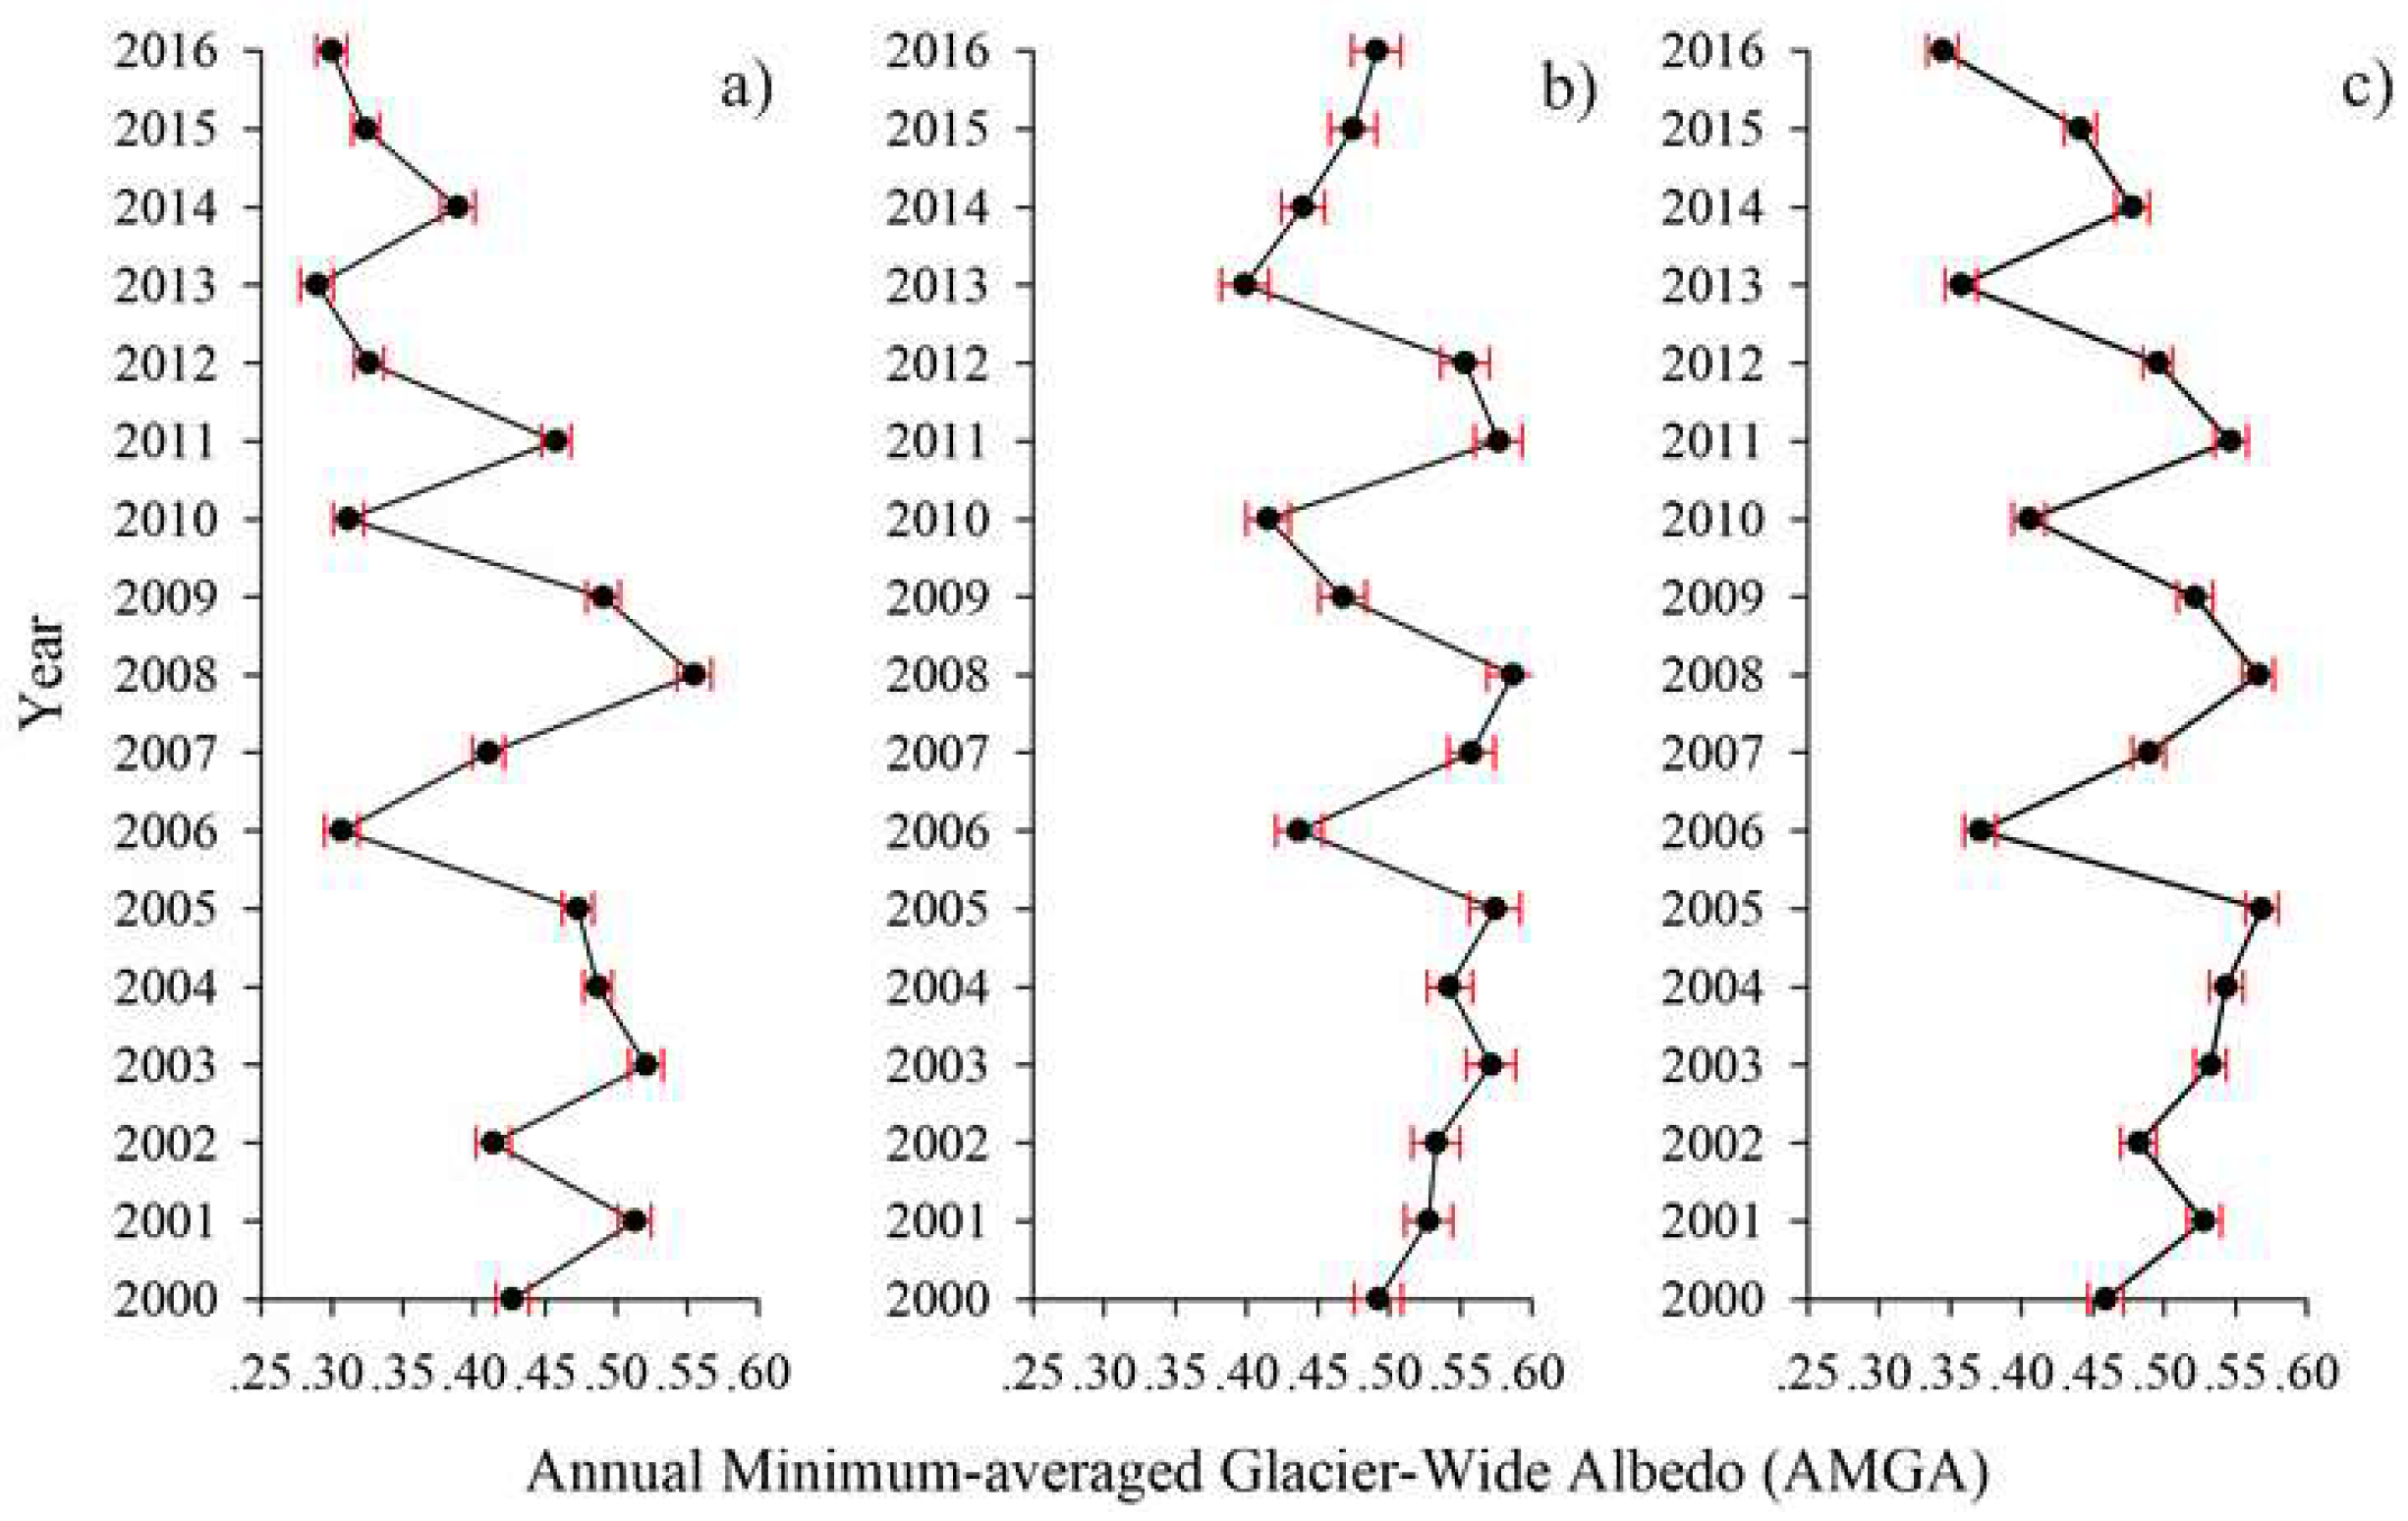
5.1. Variations of the MODIS-Derived Glacier-Wide Albedo
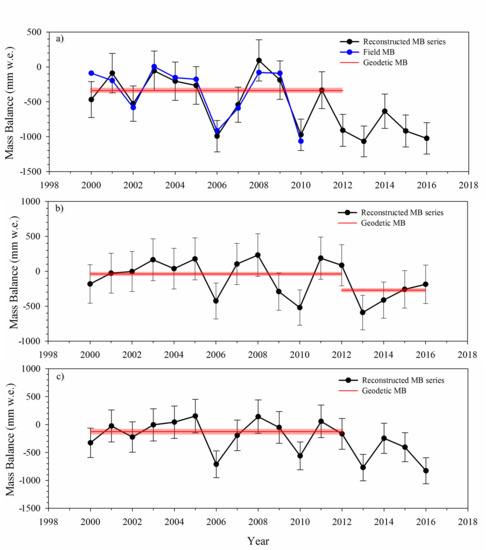
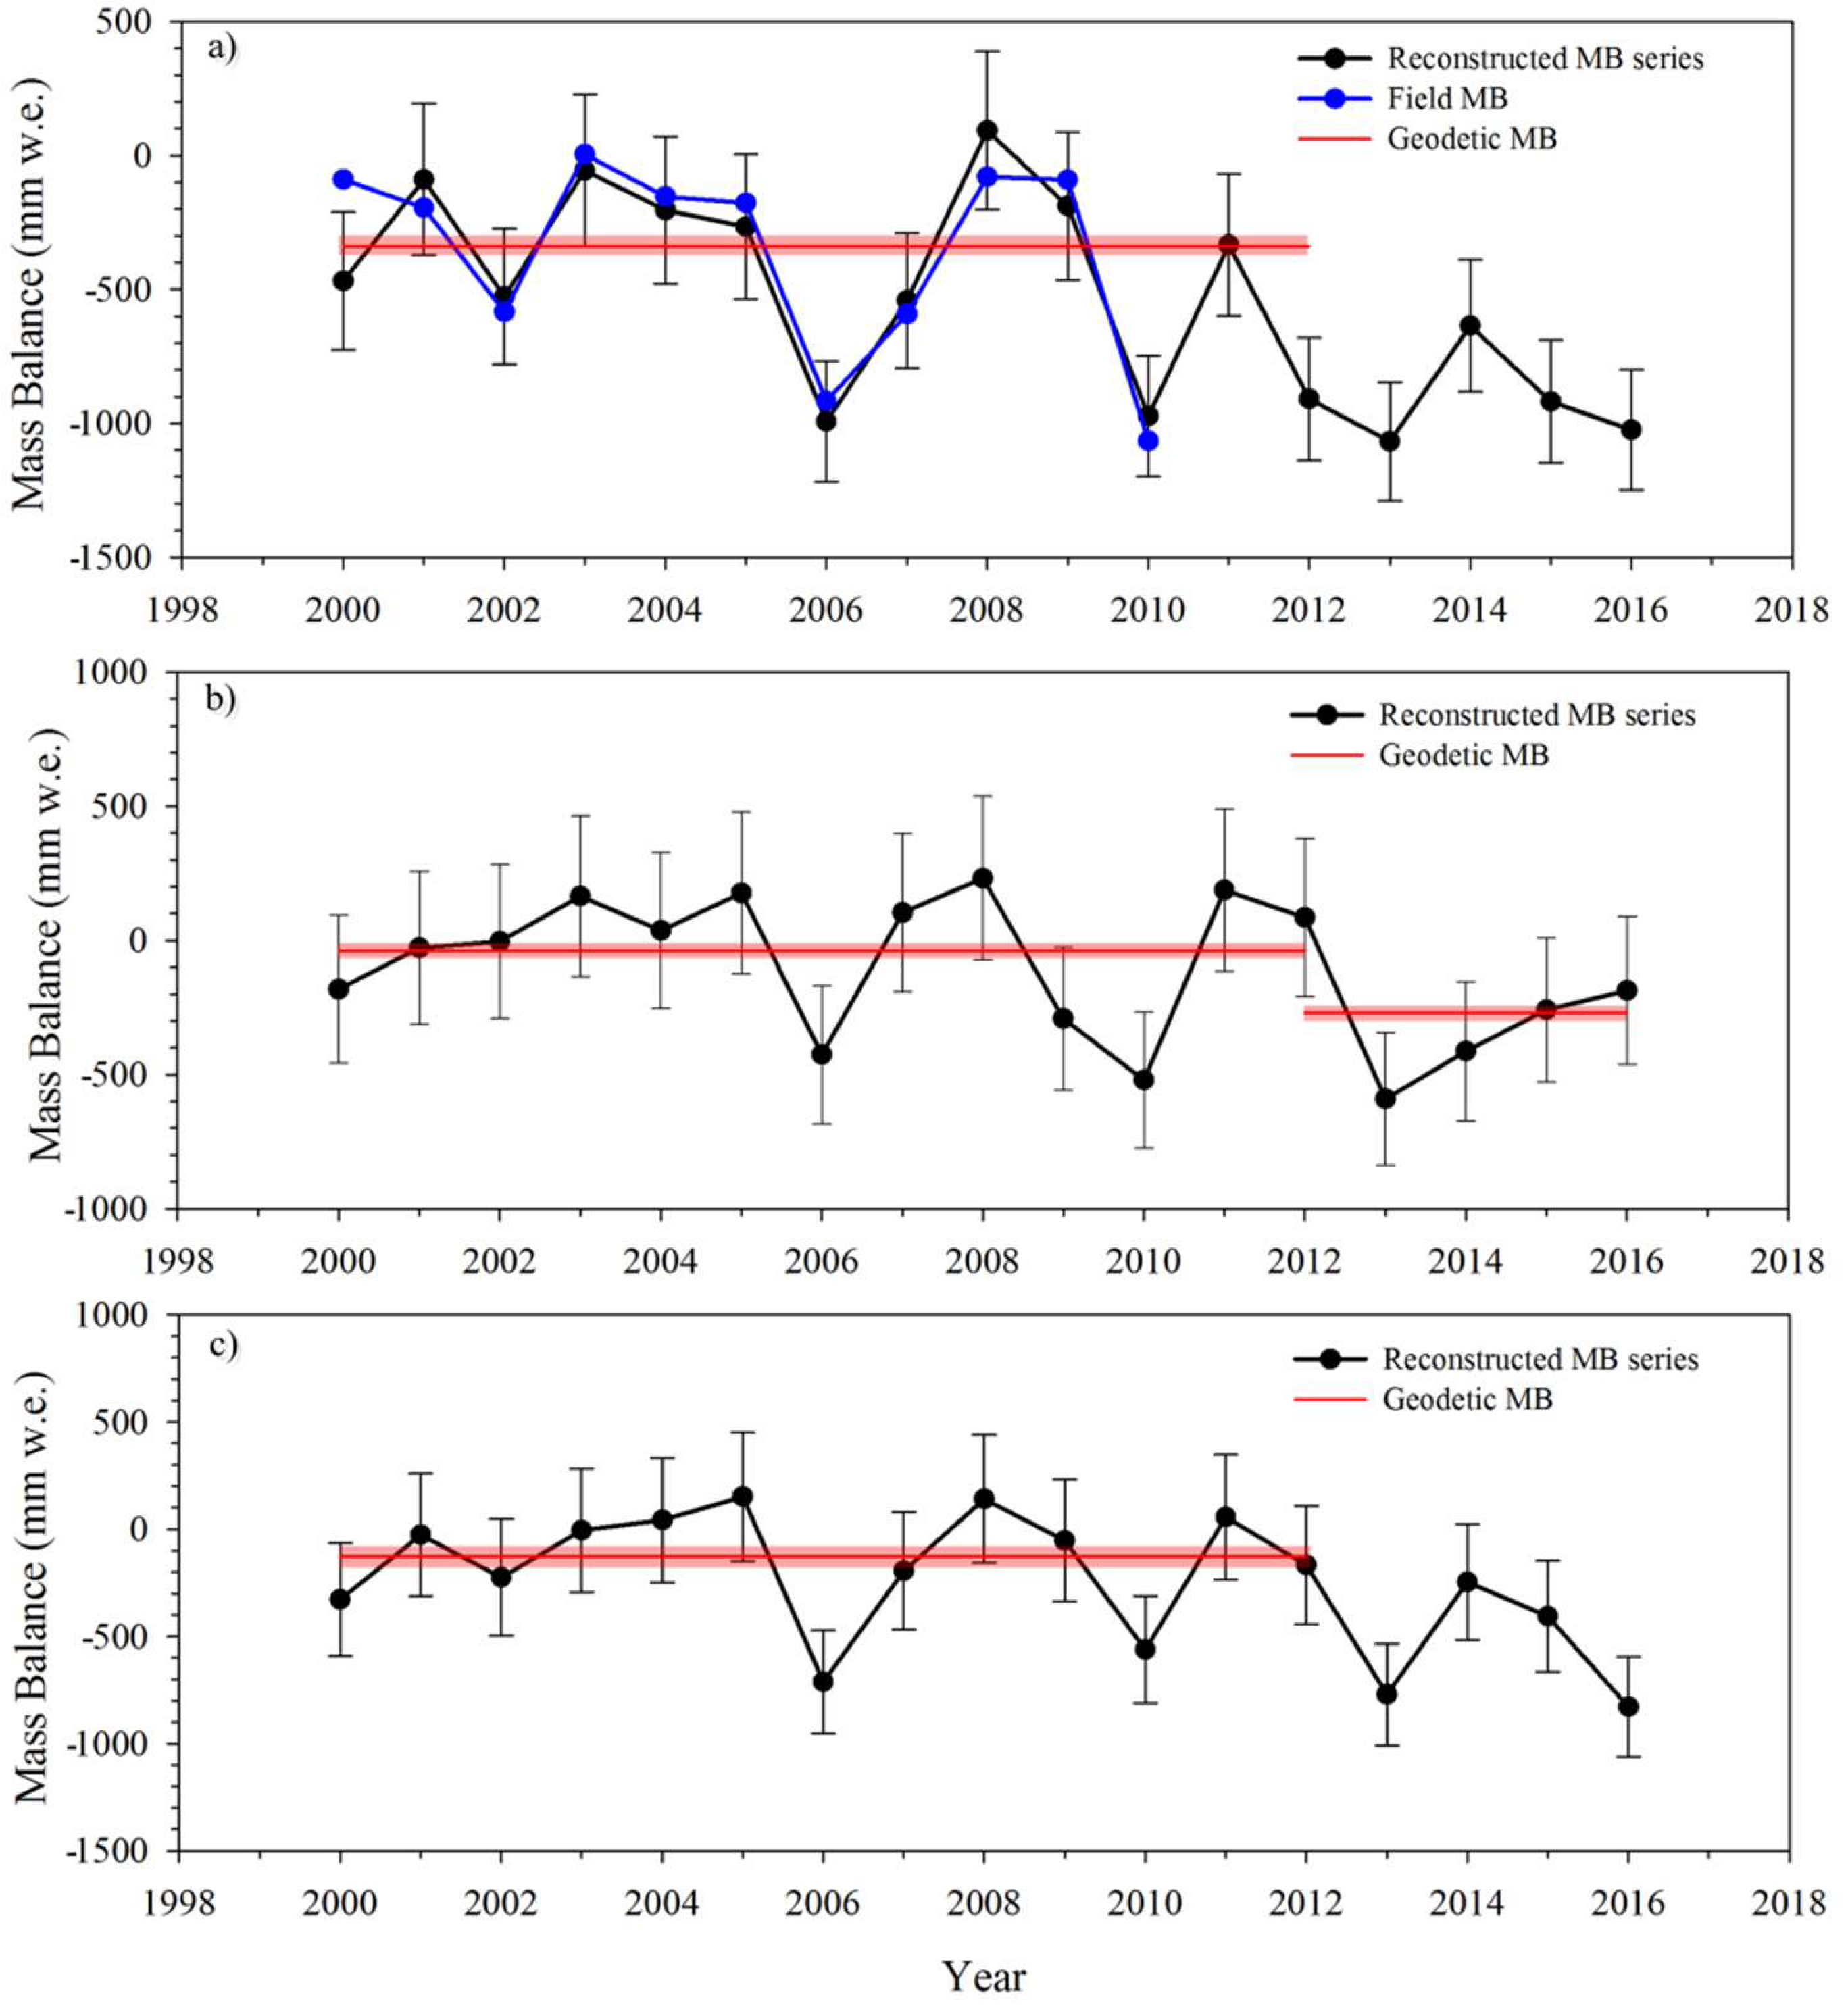
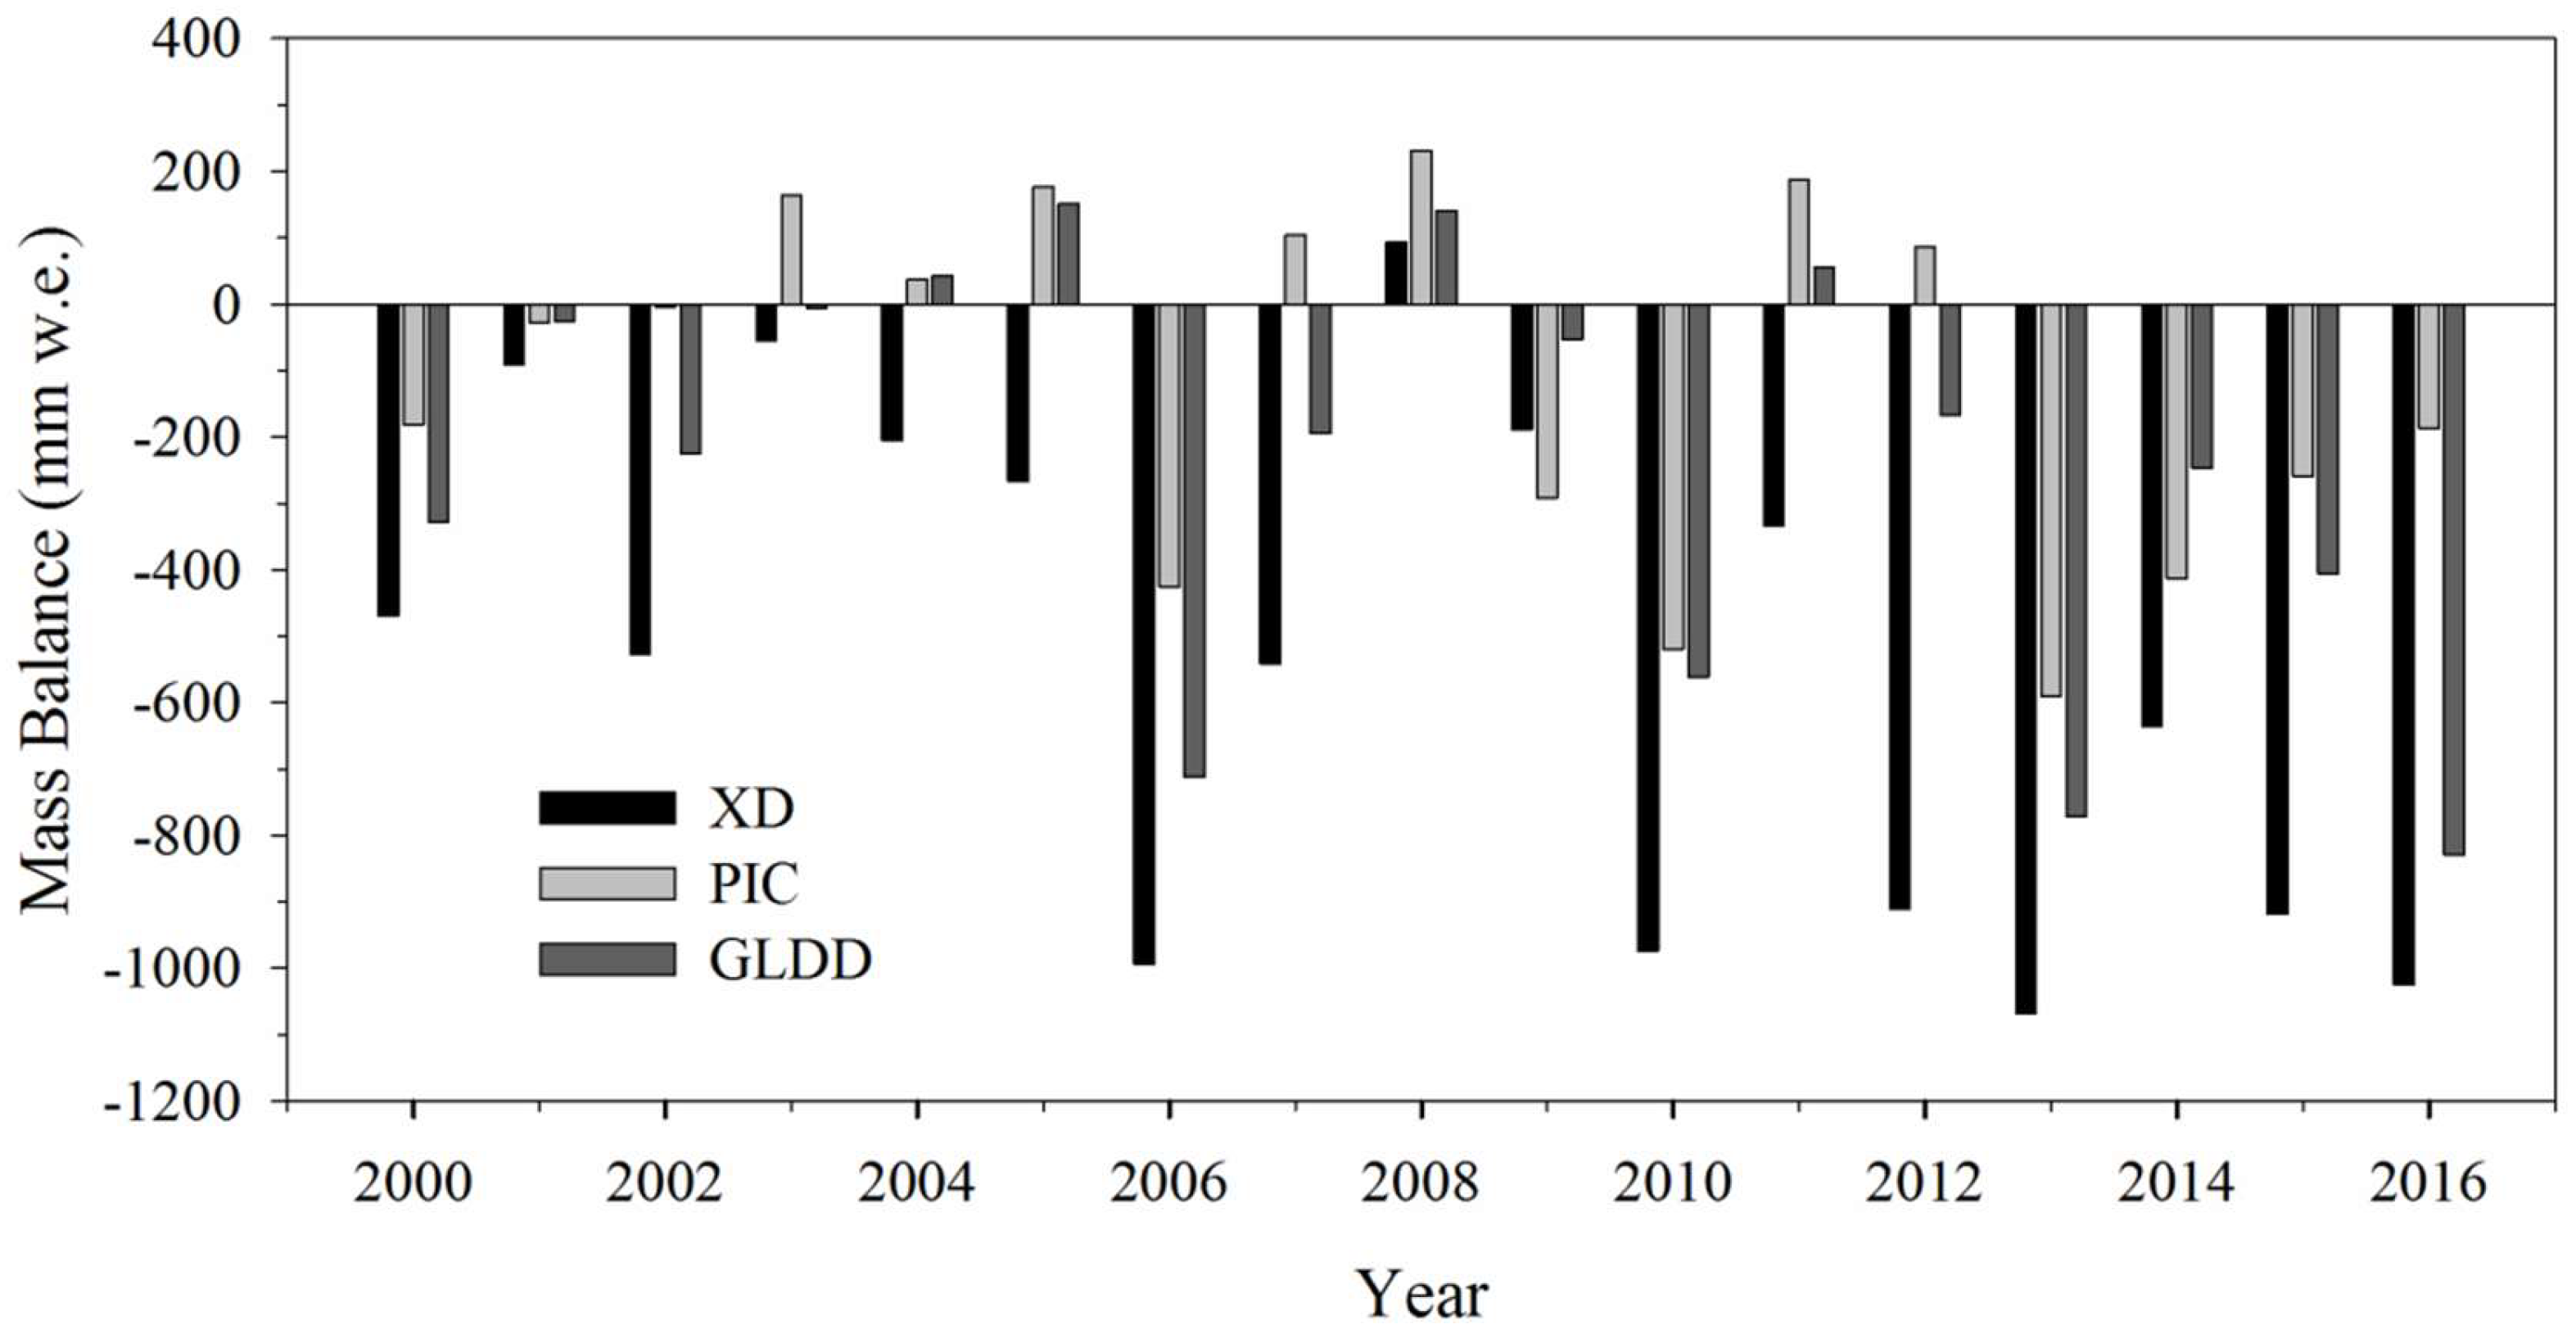
5.2. Reconstructed Annual Mass Balance Series
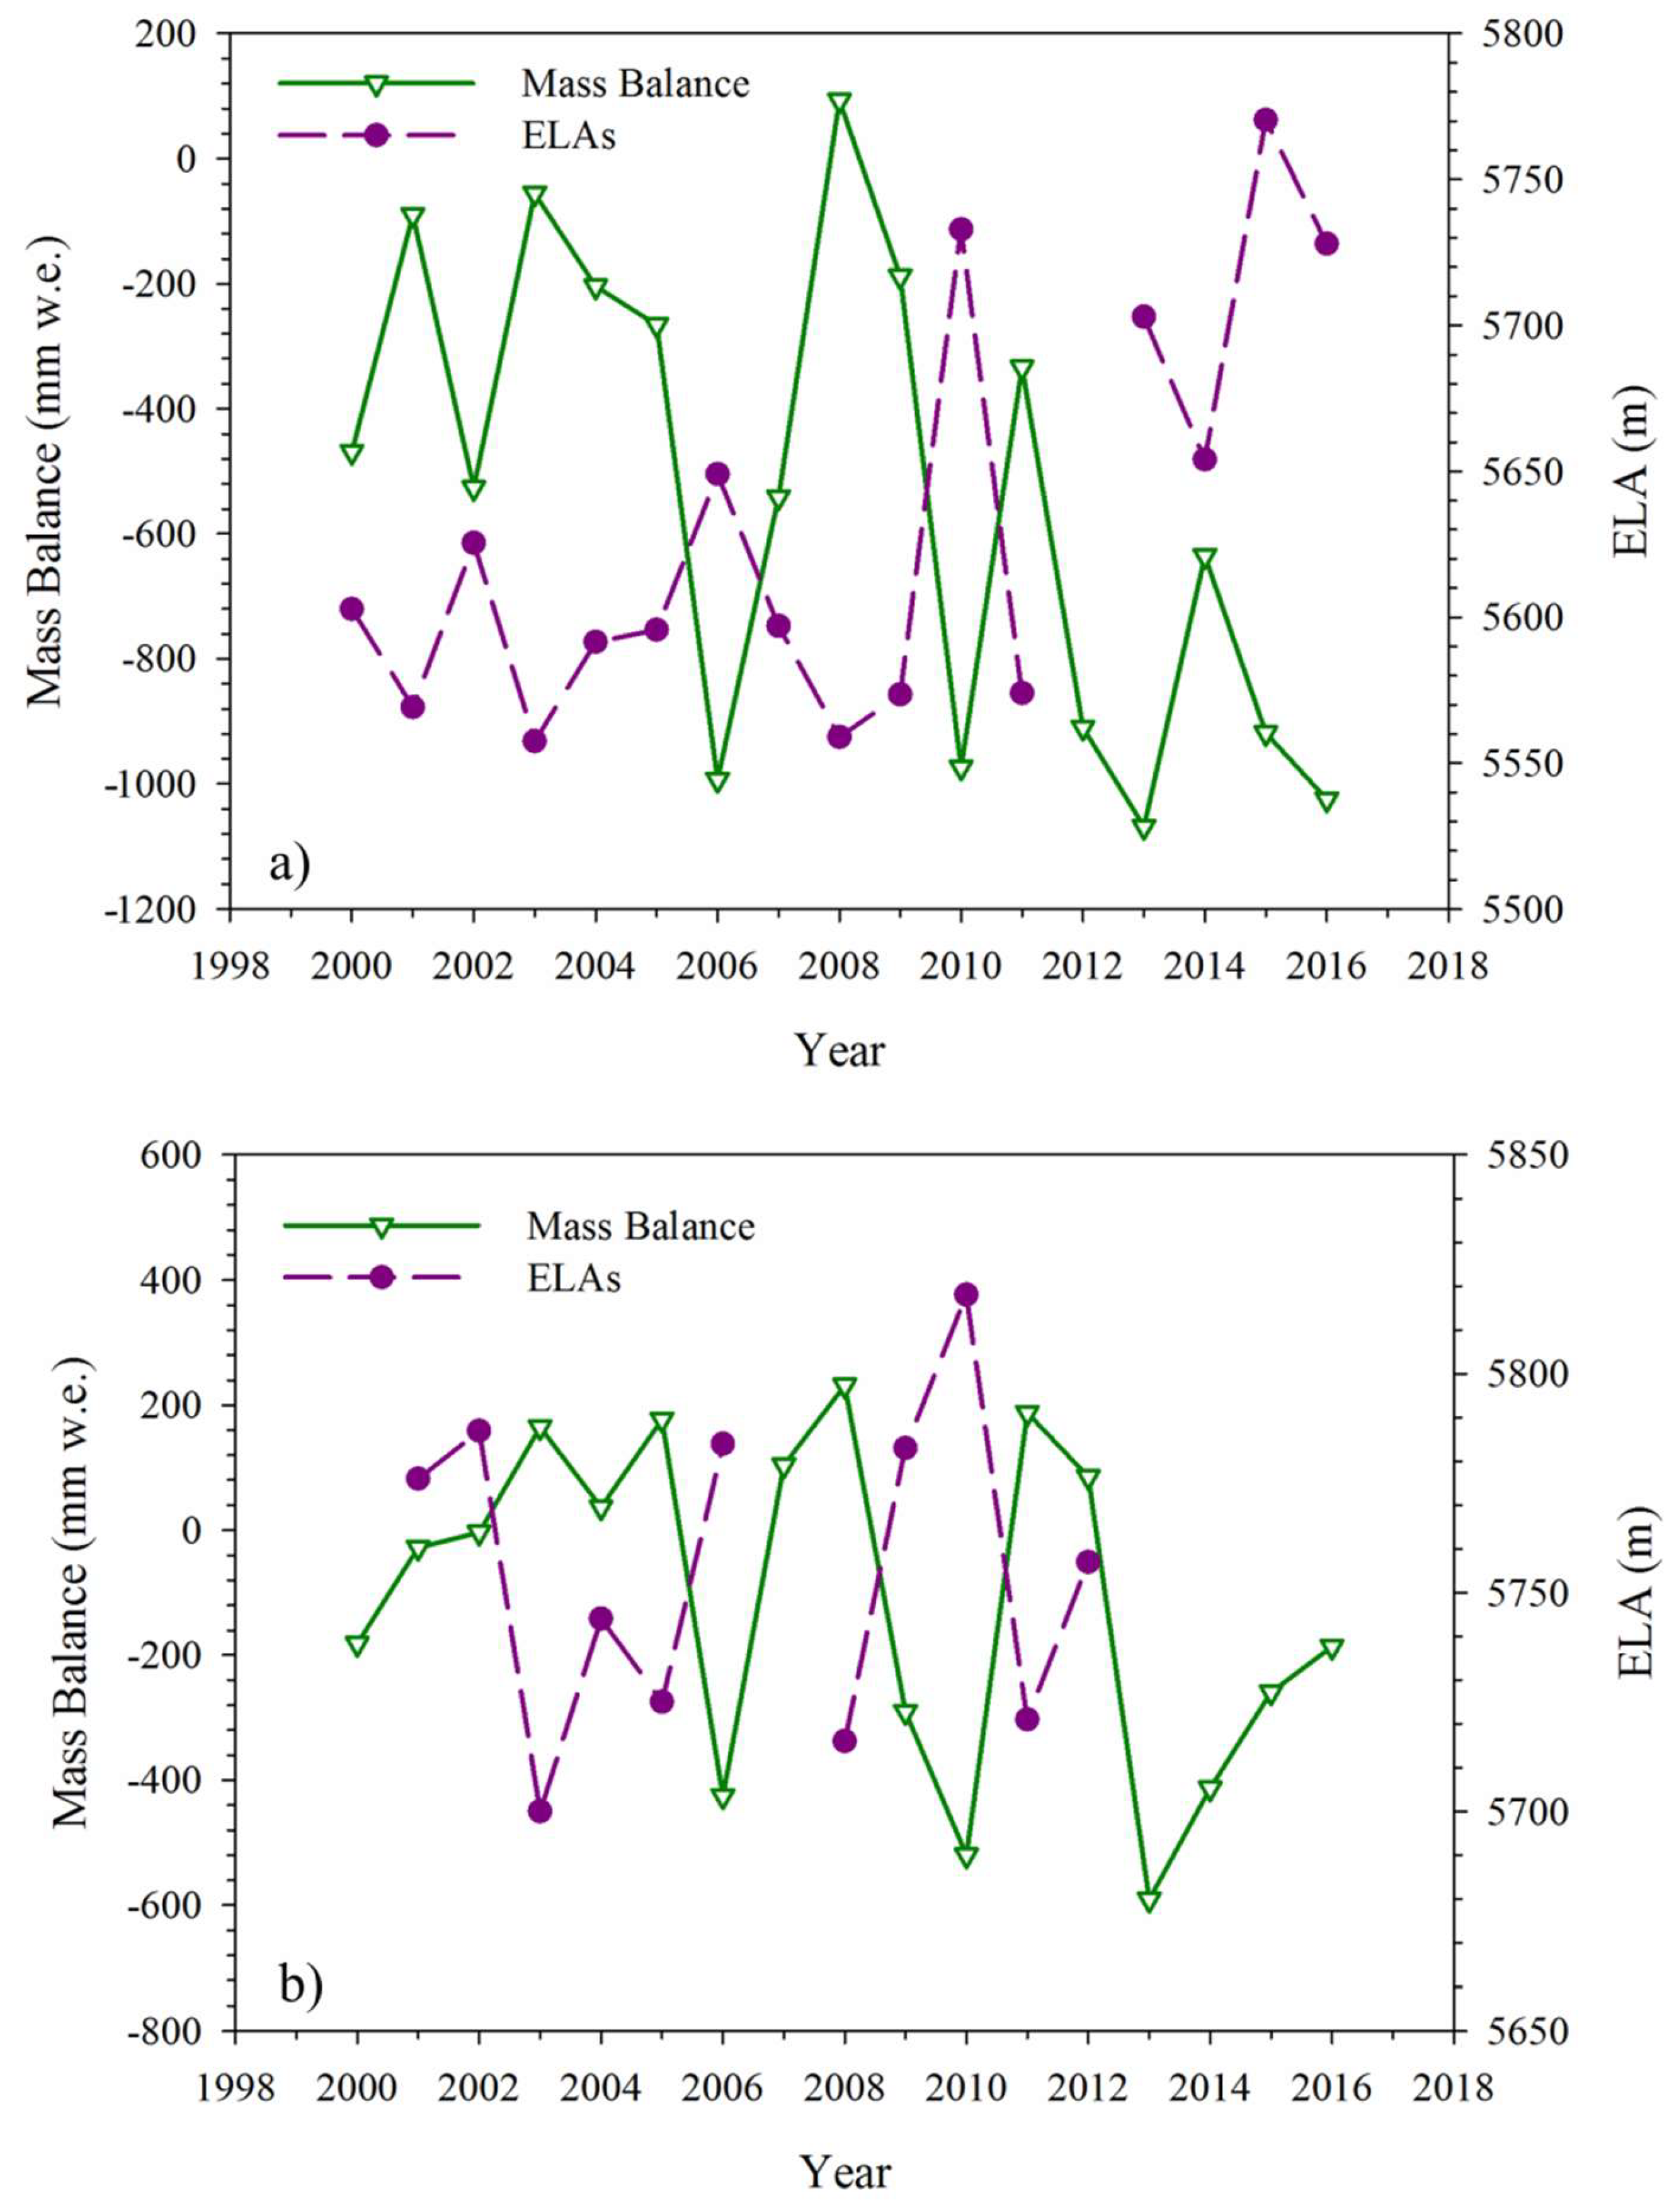
5.3. Comparison with Glacier Mass Balance and ELA Estimates
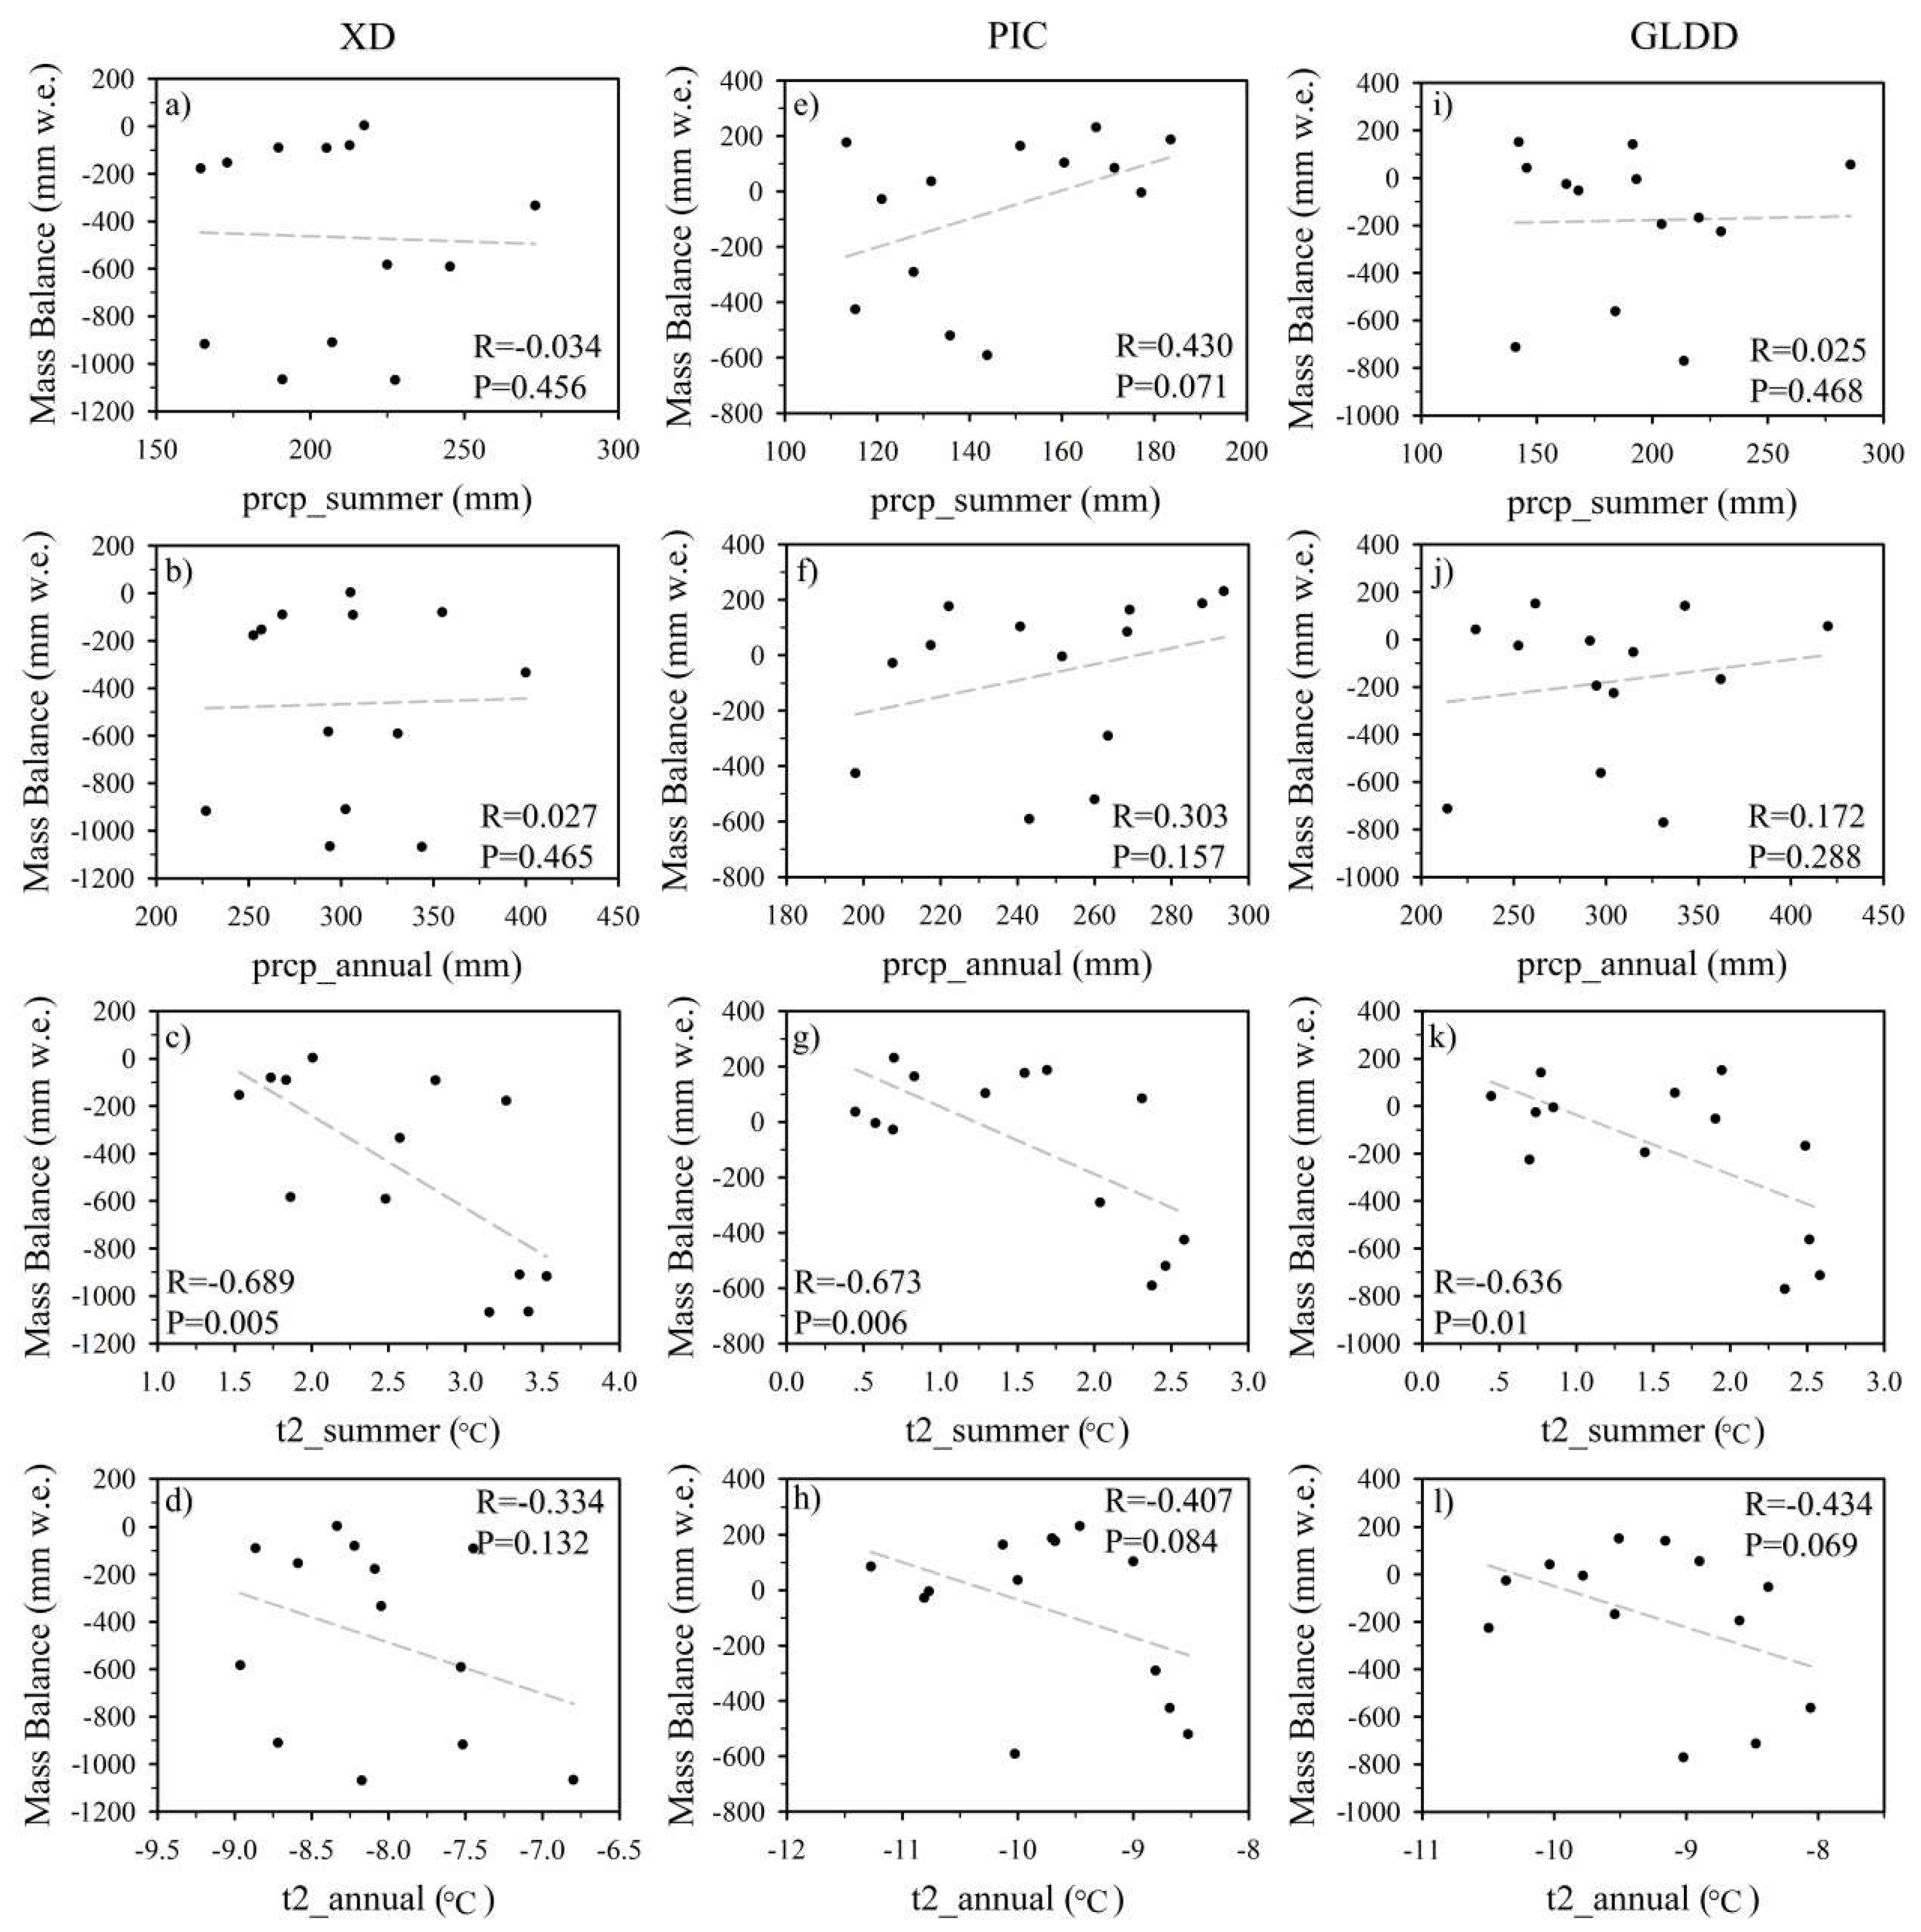
5.4. Linkage to Local Climate Variables
6. Discussions
6.1. Influence of the Local Factors on Glacier Status
6.2. Potential and Limitations
7. Conclusions
Supplementary Materials
Author Contributions
Funding
Acknowledgments
Conflicts of Interest
References
- Rangwala, I.; Miller, J.R.; Russell, G.L.; Xu, M. Using a global climate model to evaluate the influences of water vapor, snow cover and atmospheric aerosol on warming in the tibetan plateau during the twenty-first century. Clim. Dyn. 2009, 34, 859–872. [Google Scholar] [CrossRef]
- Immerzeel, W.W.; van Beek, L.P.H.; Bierkens, M.F.P. Climate change will affect the asian water towers. Science 2010, 328, 1382–1385. [Google Scholar] [CrossRef] [PubMed]
- Immerzeel, W.; Stoorvogel, J.; Antle, J. Can payments for ecosystem services secure the water tower of Tibet? Agric. Syst. 2008, 96, 52–63. [Google Scholar] [CrossRef]
- Azam, M.F.; Wagnon, P.; Berthier, E.; Vincent, C.; Fujita, K.; Kargel, J.S. Review of the status and mass changes of Himalayan-Karakoram glaciers. J. Glaciol. 2018, 64, 61–74. [Google Scholar] [CrossRef]
- Bolch, T.; Kulkarni, A.; Kääb, A.; Huggel, C.; Paul, F.; Cogley, J.G.; Frey, H.; Kargel, J.S.; Fujita, K.; Scheel, M.; et al. The State and Fate of Himalayan Glaciers. Science 2012, 336, 310–314. [Google Scholar] [CrossRef] [PubMed]
- Caidong, C.; Sorteberg, A. Modelled mass balance of Xibu glacier, Tibetan Plateau: Sensitivity to climate change. J. Glaciol. 2010, 56, 235–248. [Google Scholar] [CrossRef]
- Cao, B.; Pan, B.; Guan, W.; Wang, J.; Wen, Z. Changes in ice volume of the Ningchan No. 1 Glacier, China, from 1972 to 2014, as derived from in situ measurements. J. Glaciol. 2017, 63, 1025–1033. [Google Scholar] [CrossRef]
- Neckel, N.; Braun, A.; Kropácek, J.; Hochschild, V. Recent mass balance of the Purogangri Ice Cap, central Tibetan Plateau, by means of differential X-band SAR interferometry. Cryosphere 2013, 7, 1623–1633. [Google Scholar] [CrossRef]
- Yao, T.; Thompson, L.; Yang, W.; Yu, W.; Gao, Y.; Guo, X.; Yang, X.; Duan, K.; Zhao, H.; Xu, B.; et al. Different glacier status with atmospheric circulations in Tibetan Plateau and surroundings. Nat. Clim. Chang. 2012, 2, 663–667. [Google Scholar] [CrossRef]
- Yao, T.; Pu, J.; Lu, A.; Wang, Y.; Yu, W. Recent Glacial Retreat and Its Impact on Hydrol. Process. on the Tibetan Plateau, China, and Surrounding Regions. Arct. Antarct. Alp. Res. 2007, 39, 642–650. [Google Scholar] [CrossRef]
- Rabatel, A.; Sirguey, P.; Drolon, V.; Maisongrande, P.; Arnaud, Y.; Berthier, E.; Davaze, L.; Dedieu, J.; Dumont, M. Annual and Seasonal Glacier-Wide Surface Mass Balance Quantified from Changes in Glacier Surface State: A Review on Existing Methods Using Optical Satellite Imagery. Remote Sens. 2017, 9, 507. [Google Scholar] [CrossRef]
- Rabatel, A.; Dedieu, J.P.; Vincent, C. Spatio-temporal changes in glacier-wide mass balance quantified by optical remote sensing on 30 glaciers in the French Alps for the period 1983–2014. J. Glaciol. 2016, 62, 1153–1166. [Google Scholar] [CrossRef]
- Berthier, E.; Arnaud, Y.; Kumar, R.; Ahmad, S.; Wagnon, P.; Chevallier, P. Remote sensing estimates of glacier mass balances in the Himachal Pradesh (Western Himalaya, India). Remote Sens. Environ. 2007, 108, 327–338. [Google Scholar] [CrossRef]
- Kääb, A. Combination of SRTM3 and repeat ASTER data for deriving alpine glacier flow velocities in the Bhutan Himalaya. Remote Sens. Environ. 2005, 94, 463–474. [Google Scholar] [CrossRef]
- Nuimura, T.; Fujita, K.; Yamaguchi, S.; Sharma, R.R. Elevation changes of glaciers revealed by multitemporal digital elevation models calibrated by GPS survey in the Khumbu region, Nepal Himalaya, 1992–2008. J. Glaciol. 2012, 58, 648–656. [Google Scholar] [CrossRef]
- Li, J.; Li, Z.; Zhu, J.; Li, X.; Xu, B.; Wang, Q.; Huang, C.; Hu, J. Early 21st century glacier thickness changes in the Central Tien Shan. Remote Sens. Environ. 2017, 192, 12–29. [Google Scholar] [CrossRef]
- Braithwaite, R.J. Can the Mass Balance of a Glacier be Estimated from its Equilibrium-Line Altitude? J. Glaciol. 1984, 30, 364–368. [Google Scholar] [CrossRef]
- Rabatel, A.; Dedieu, J.P.; Vincent, C. Using remote-sensing data to determine equilibrium-line altitude and mass-balance time series: Validation on three french glaciers, 1994–2002. J. Glaciol. 2005, 51, 539–546. [Google Scholar] [CrossRef]
- Dyurgerov, M.; Meier, M.F.; Bahr, D.B. A new index of glacier area change: A tool for glacier monitoring. J. Glaciol. 2009, 55, 710–716. [Google Scholar] [CrossRef]
- Dyurgerov, M.B.; Meier, M.F. Glaciers and the Changing Earth System: A 2004 Snapshot; Institute of Arctic and Alpine Research, University of Colorado: Boulder, CO, USA, 2005; Volume 58, p. 23. [Google Scholar]
- Brun, F.; Dumont, M.; Wagnon, P.; Berthier, E.; Azam, M.F.; Shea, J.M.; Sirguey, P.; Rabatel, A.; Ramanathan, A. Seasonal changes in surface albedo of himalayan glaciers from MODIS data and links with the annual mass balance. Cryosphere 2015, 9, 341–355. [Google Scholar] [CrossRef]
- Dumont, M.; Gardelle, J.; Sirguey, P.; Guillot, A.; Six, D.; Rabatel, A.; Arnaud, Y. Linking glacier annual mass balance and glacier albedo retrieved from MODIS data. Cryosphere 2012, 6, 1527–1539. [Google Scholar] [CrossRef]
- Sirguey, P.; Still, H.; Cullen, N.J.; Dumont, M.; Arnaud, Y.; Conway, J.P. Reconstructing the mass balance of brewster glacier, new zealand, using modis-derived glacier-wide albedo. Cryosphere 2016, 10, 2465–2484. [Google Scholar] [CrossRef]
- Davaze, L.; Rabatel, A.; Arnaud, Y.; Sirguey, P.; Six, D.; Letreguilly, A.; Dumont, M. Monitoring glacier albedo as a proxy to derive summer and annual surface mass balances from optical remote-sensing data. Cryosphere 2018, 12, 271–286. [Google Scholar] [CrossRef]
- Liu, S.; Zhang, Y.; Zhang, Y.; Ding, Y. Estimation of glacier runoff and future trends in the Yangtze River source region, China. J. Glaciol. 2009, 55, 353–362. [Google Scholar] [CrossRef]
- Zhang, Y.; Liu, S.; Xu, J.; Shangguan, D. Glacier change and glacier runoff variation in the Tuotuo River basin, the source region of Yangtze River in western China. Environ. Geol. 2008, 56, 59–68. [Google Scholar] [CrossRef]
- Liang, E.; Shao, X.; Qin, N. Tree–ring based summer temperature reconstruction for the source region of the Yangtze River on the Tibetan Plateau. Glob. Planet. Chang. 2008, 61, 313–320. [Google Scholar] [CrossRef]
- Shi, Y.; Li, J. Glaciological research of the Qinghai-Xizang Plateau in China. J. Geogr. 1981, 90, 203–209. (In Japanese) [Google Scholar] [CrossRef]
- Wang, J.; Cui, Y.; He, X.; Zhang, J.; Yan, S. Surface Albedo Variation and Its Influencing Factors over Dongkemadi Glacier, Central Tibetan Plateau. Adv. Meteorol. 2015. [Google Scholar] [CrossRef]
- Fujita, K.; Ageta, Y.; Pu, J.; Yao, T. Mass balance of Xiao Dongkemadi glacier on the central Tibetan Plateau from 1989 to 1995. Ann. Glaciol. 2000, 31, 159–163. [Google Scholar] [CrossRef]
- Yi, C.; Li, X.; Qu, J. Quaternary glaciation of Puruogangri—The largest modern ice field in Tibet. Quat. Int. 2002, 97–98, 111–121. [Google Scholar] [CrossRef]
- Liu, L.; Jiang, L.; Sun, Y.; Wang, H.; Yi, C.; Hsu, H. Morphometric Controls on Glacier Mass Balance of the Puruogangri Ice Field, Central Tibetan Plateau. Water 2016, 8, 496. [Google Scholar] [CrossRef]
- Huintjes, E.; Neckel, N.; Hochschild, V.; Schneider, C. Surface energy and mass balance at Purogangri ice cap, central Tibetan Plateau, 2001–2011. J. Glaciol. 2015, 61, 1048–1060. [Google Scholar] [CrossRef]
- Spiess, M.; Maussion, F.; Möller, M.; Scherer, D.; Schneider, C. MODIS Derived Equilibrium Line Altitude Estimates for Purogangri Ice Cap, Tibetan Plateau, and their Relation to Climatic Predictors (2001–2012). Geogr. Ann. Ser. A Phys. Geogr. 2015, 97, 599–614. [Google Scholar] [CrossRef]
- Zhou, W.; Li, Z.; Li, J.; Cui, Z.; Wang, C. Variations of glaciers and glacial lake in geladandong mountain range in 1992–2009 with remote-sensing technology. J. Cent. South Univ. T. 2014, 45, 3505–3512. (In Chinese) [Google Scholar]
- Wang, J.; He, X.; Ye, B.; Yang, G. Variations of Albedo on the DongkemadiGlacier, Tanggula Range. J. Glaciol. Geocryol. 2012, 34, 21–28. (In Chinese) [Google Scholar]
- Zhang, J.; He, X.; Ye, B.; Wu, J. Recent variation of mass balance of the xiao dongkemadi glacier in the tanggula range and its influencing factors. J. Glaciol. Geocryol. 2013, 35, 263–271. (In Chinese) [Google Scholar]
- Pu, J.; Yao, T.; Wang, N.; Ding, L.; Zhang, Q. Puruogangri Ice Field and Its Variations Since the Little Ice Age of the Northern Tibetan Plateau. J. Glaciol. Geocryol. 2002, 24, 87–92. (In Chinese) [Google Scholar]
- Lei, Y.; Yao, T.; Yi, C.; Wang, W.; Sheng, Y.; Li, J.; Joswiak, D. Glacier mass loss induced the rapid growth of Linggo Co on the central Tibetan Plateau. J. Glaciol. 2012, 58, 177–184. [Google Scholar] [CrossRef]
- Liu, L.; Jiang, L.; Sun, Y.; Yi, C.; Wang, H.; Hsu, H. Glacier elevation changes (2012–2016) of the Puruogangri Ice Field on the Tibetan Plateau derived from bi-temporal TanDEM-X InSAR data. Int. J. Remote Sens. 2016, 37, 5687–5707. [Google Scholar] [CrossRef]
- Ye, Q.; Kang, S.; Chen, F.; Wang, J. Monitoring glacier variations on Geladandong mountain, central Tibetan Plateau, from 1969 to 2002 using remote-sensing and GIS technologies. J. Glaciol. 2006, 52, 537–545. [Google Scholar] [CrossRef]
- Zhang, J.; Liu, Y.; Lv, T.; Wang, Y.; Tao, F. An inventory of glacier change for the Geladandong Mountain area, China. J. Arid Land Resour. Environ. 2015, 29, 184–189. (In Chinese) [Google Scholar]
- Pu, J.; Yao, T.; Yang, M.; Tian, L.; Wang, N.; Ageta, Y.; Fujita, K. Rapid decrease of mass balance observed in the Xiao (Lesser) Dongkemadi Glacier, in the central Tibetan Plateau. Hydrol. Process. 2008, 22, 2953–2958. [Google Scholar] [CrossRef]
- Liu, L. Glacier Mass Balances in the Tibetan Plateau Observed from SAR Interferometry; University of Chinese Academy of Sciences: Beijing, China, 2016. [Google Scholar]
- Sun, Y.; Jiang, L.; Liu, L.; Sun, Q.; Wang, H.; Hsu, H. Mapping Glacier Elevations and Their Changes in the Western Qilian Mountains, Northern Tibetan Plateau, by Bistatic InSAR. IEEE J. Sel. Top. Appl. Earth Obs. Remote Sens. 2017, 11, 68–78. [Google Scholar] [CrossRef]
- Williamson, S.N.; Copland, L.; Hik, D.S. The accuracy of satellite-derived albedo for northern alpine and glaciated land covers. Polar Sci. 2016, 10, 262–269. [Google Scholar] [CrossRef]
- Klein, A.G.; Stroeve, J. Development and validation of a snow albedo algorithm for the MODIS instrument. Ann. Glaciol. 2002, 34, 45–52. [Google Scholar] [CrossRef]
- Hall, D.K.; Riggs, G.A. Accuracy assessment of the MODIS snow products. Hydrol. Process. 2007, 21, 1534–1547. [Google Scholar] [CrossRef]
- Maussion, F.; Scherer, D.; Mölg, T.; Collier, E.; Curio, J.; Finkelnburg, R. Precipitation seasonality and variability over the Tibetan Plateau as resolved by the High Asia Reanalysis. J. Clim. 2014, 27, 1910–1927. [Google Scholar] [CrossRef]
- Curio, J.; Maussion, F.; Scherer, D. A 12-year high-resolution climatology of atmospheric water transport over the Tibetan Plateau. Earth Syst. Dyn. 2015, 6, 109–124. [Google Scholar] [CrossRef]
- Mölg, T.; Maussion, F.; Scherer, D. Mid-latitude westerlies as a driver of glacier variability in monsoonal High Asia. Nat. Clim. Chang. 2014, 4, 68–73. [Google Scholar] [CrossRef]
- York, D.; Evensen, N.M.; Martínez, M.L.; De Basabe Delgado, J. Unified equations for the slope, intercept, and standard errors of the best straight line. Am. J. Phys. 2004, 72, 367–375. [Google Scholar] [CrossRef]
- Senese, A.; Maugeri, M.; Meraldi, E.; Verza, G.P.; Azzoni, R.S.; Compostella, C.; Diolaiuti, G. Estimating the snow water equivalent on a glacierized high elevation site (forni glacier, italy). Cryosphere 2018, 12, 1293–1306. [Google Scholar] [CrossRef]
- Stroeve, J.C.; Box, J.E.; Haran, T. Evaluation of the MODIS (MOD10A1) daily snow albedo product over the Greenland ice sheet. Remote Sens. Environ. 2006, 105, 155–171. [Google Scholar] [CrossRef]
- Tekeli, A.E.; Şensoy, A.; Şorman, A.; Akyürek, Z.; Şorman, Ü. Accuracy assessment of MODIS daily snow albedo retrievals with in situ measurements in Karasu basin, Turkey. Hydrol. Process. 2006, 20, 705–721. [Google Scholar] [CrossRef]
- Wu, X.; Wang, N.; Lu, A.; Pu, J.; Guo, Z.; Zhang, H. Variations in Albedo on Dongkemadi Glacier in Tanggula Range on the Tibetan Plateau during 2002–2012 and Its Linkage with Mass Balance. Arct. Antarct. Alp. Res. 2015, 47, 281–292. [Google Scholar] [CrossRef]
- Wang, H.; Jia, L.; Steffen, H.; Wu, P.; Jiang, L.; Hsu, H.; Xiang, L.; Wang, Z.; Hu, B. Increased water storage in north america and scandinavia from grace gravity data. Nat. Geosci. 2012, 6, 38–42. [Google Scholar] [CrossRef]
- Ke, L.; Ding, X.; Li, W.; Qiu, B. Remote Sensing of Glacier Change in the Central Qinghai-Tibet Plateau and the Relationship with Changing Climate. Remote Sens. 2017, 9, 114. [Google Scholar] [CrossRef]
- Chao, N.; Wang, Z.; Hwang, C.; Jin, T.; Cheng, Y.S. Decline of Geladandong Glacier Elevation in Yangtze River’s Source Region: Detection by ICESat and Assessment by Hydroclimatic Data. Remote Sens. 2017, 9, 75. [Google Scholar] [CrossRef]
- Liu, G.; Fan, J.; Zhao, F.; Mao, K.; Dou, C. Monitoring elevation change of glaciers on Geladandong Mountain using TanDEM-X SAR interferometry. J. Mt. Sci. 2017, 14, 859–869. [Google Scholar] [CrossRef]
- Chen, A.; Wang, N.; Li, Z.; Wu, Y.; Zhang, W.; Guo, Z. Region–wide glacier mass budgets for the Tanggula Mountains between ~1969 and ~2015 derived from remote sensing data. Arct. Antarct. Alp. Res. 2017, 49, 551–568. [Google Scholar] [CrossRef]
- Bhambri, R.; Hewitt, K.; Kawishwar, P.; Pratap, B. Surge-type and surge-modified glaciers in the Karakoram. Sci. Rep. 2017, 7, 15391. [Google Scholar] [CrossRef] [PubMed]
- Zhang, Y.; Fujita, K.; Ageta, Y.; Nakawo, M.; Yao, T.; Pu, J. The response of glacier ELA to climate fluctuations on High-Asia. Bull. Glacier Res. 1998, 16, 1–11. [Google Scholar] [CrossRef]
- Dyurgerov, M.B.; Meier, M.F. Twentieth century climate change: Evidence from small glaciers. Proc. Natl. Acad. Sci. USA 1999, 97, 1406–1411. [Google Scholar] [CrossRef]
- Pepin, N.; Bradley, R.S.; Diza, H.F.; Baraer, M.; Caceres, E.B.; Forsythe, N.; Fowler, H.; Greenwood, G.; Hashmi, M.Z.; et al. Elevation–dependent warming in mountain regions of the world. Nat. Clim. Chang. 2015, 5, 424–430. [Google Scholar] [CrossRef]
- Gou, X.; Chen, F.; Yang, M.; Jacoby, G.; Peng, J.; Zhang, Y. A comparison of tree-ring records and glacier variations over the past 700 years, northeastern Tibetan Plateau. Ann. Glaciol. 2006, 43, 86–90. [Google Scholar] [CrossRef]
- Oerlemans, J.; Anderson, B.; Hubbard, A.; Huybrechts, P.; Johannesson, T.; Knap, W.H.; Schmeits, M.; Stroeven, A.P.; van de Wal, R.S.W.; Wallinga, J.; et al. Modelling the response of glaciers to climate warming. Clim. Dyn. 1998, 14, 267–274. [Google Scholar] [CrossRef]
- Nye, J.F. The response of glaciers and ice–sheets to seasonal and climatic changes. Proc. R. Soc. Lond. A. 1960, 256, 559–584. [Google Scholar] [CrossRef]
- Schaaf, C.B.; Liu, J.; Gao, F.; Strahler, A.H. Aqua and Terra MODIS albedo and reflectance anisotropy products. In Land Remote Sensing and Global Environmental Change; Springer: New York, NY, USA, 2010; pp. 549–561. [Google Scholar]
- Liu, Y.; Wang, Z.; Sun, Q.; Erb, A.M.; Li, Z.; Schaaf, C.B.; Zhang, X.; Román, M.O.; Scott, R.L.; Zhang, Q.; et al. Evaluation of the viirs brdf, albedo and nbar products suite and an assessment of continuity with the long term modis record. Remote Sens. Environ. 2017, 201, 256–274. [Google Scholar] [CrossRef]
- Knap, W.H.; Reijmer, C.H.; Oerlemans, J. Narrowband to broadband conversion of Landsat TM glacier albedos. Int. J. Remote Sens. 1999, 20, 2091–2110. [Google Scholar] [CrossRef]


| Variable | XD | PIC | GLDD |
|---|---|---|---|
| Location | 33°04′ N,92°05′ E | 33°53′ N, 89°10′ E | 33°30′ N, 91°10′ E |
| Surface area (km2) | 1.77 | 420 | 845 |
| Number of glaciers | 1 | 59 | 142 |
| ELA (m a.s.l.) | 5620 | 5750 | 5740 |
| Max. elevation (m a.s.l.) | 5926 | 6370 | 6621 |
| Min. elevation (m a.s.l.) | 5380 | 5350 | 5200 |
| Annual air temperature (°C) | −8.10 ± 0.63 | −9.76 ± 0.86 | −9.25 ± 0.78 |
| Annual precipitation (mm) | 302 ± 47 | 248 ± 30 | 301 ± 56 |
| Type | Continental glacier | Continental glacier | Continental glacier |
| Data type | Sources | Date | Utilization |
|---|---|---|---|
| Annual mass balance series | In situ observations at XD | 2000–2010 | Model reconstruction and validation |
| Average annual mass balance | Geodetic estimates [40,44] | 2000–2016 | Result verification |
| Daily Albedo | MOD10A1/MYD10A1 | 2000–2016 | Glacier-wide albedo calculation |
| Monthly precipitationand air temperature | HAR | 2001–2013 | Influence on glacier change |
| Year | Mass Balance in the j Year/mm w.e. | LOOCV Mass Balance/mm w.e. | Regression Parameters (A and B) |
|---|---|---|---|
| 2002 | −583 | −518 | 4346.9 and −2314.9 |
| 2003 | 4 | −72 | 4277.1 and −2299.8 |
| 2004 | −153 | −213 | 4331.1 and −2321.8 |
| 2005 | −177 | −279 | 4322.8 and −2322.8 |
| 2006 | −917 | −1044 | 4653.4 and −2471.4 |
| 2007 | −591 | −534 | 4347.2 and −2315.9 |
| 2008 | −80 | 175 | 4848.6 and −2514.9 |
| 2009 | −91 | −205 | 4283.2 and −2306.8 |
| 2010 | −1066 | −915 | 4058.7 and −2178.4 |
| Mean | −406 | −400.60 | 4385.44 and −2338.52 |
| Standard Deviation | – | – | 230.51 and 99.06 |
| Glaciers | Mass Balance/mm w.e.a−1 | Period | Area/km2 | Study | Method 1 | Relative Error 2/% |
|---|---|---|---|---|---|---|
| XD | −740 ± 210 | 1999–2015 | 73.60 3 | Chen et al., 2017 [59] | Geod. | |
| −358 | 2000–2010 | – | Yao et al., 2012 [9] | Glac. | ||
| −339 ± 37 | 2000–2012 4 | 73.60 3 | Liu, 2016 [44] | Geod. | ||
| −379 ± 77 | 2000–2011 | 1.77 | Our study | Albe. | 11.80 | |
| PIC | −44 | 2001–2011 | 420 | Huintjes et al., 2015 [33] | Phys. | |
| −44 ± 15 | 2000–2012 5 | 408 | Neckel et al., 2013 [8] | Geod. | ||
| −46 ± 82 | 2000–2011 | 420 | Our study | Albe. | 4.55 | |
| −269 ± 25 | 2012–2016 6 | 420 | Liu et al., 2016 [40] | Geod. | ||
| −294 ± 134 | 2012–2015 | 420 | Our study | Albe. | 9.23 | |
| GLDD | −330 ± 380 | 1999–2015 | 178 (West) | Chen et al., 2017 [59] | Geod. | |
| −134 ± 56 | 2003–2009 | 845 | Chao et al., 2017 [60] | Geod. | ||
| −140 ± 260 | 2000–2014 | 277(West) | Liu et al., 2017 [61] | Geod. | ||
| −128 ± 49 | 2000–2012 7 | 845 | Liu, 2016 [44] | Geod. | ||
| −143 ± 80 | 2000–2011 | 845 | Our study | Albe. | 11.72 | |
| −89 ± 48 | 2000–2012 7 | 185 (West) | Liu, 2016 [44] | Geod. | ||
| −202 ± 79 | 2000–2011 | 185 (West) | Our study | Albe. | ||
| −155 ± 48 | 2000–2012 | 660 (East) | Liu, 2016 [44] | Geod. | ||
| −146 ± 80 | 2000–2011 | 660 (East) | Our study | Albe. |
© 2018 by the authors. Licensee MDPI, Basel, Switzerland. This article is an open access article distributed under the terms and conditions of the Creative Commons Attribution (CC BY) license (http://creativecommons.org/licenses/by/4.0/).
Share and Cite
Zhang, Z.; Jiang, L.; Liu, L.; Sun, Y.; Wang, H. Annual Glacier-Wide Mass Balance (2000–2016) of the Interior Tibetan Plateau Reconstructed from MODIS Albedo Products. Remote Sens. 2018, 10, 1031. https://doi.org/10.3390/rs10071031
Zhang Z, Jiang L, Liu L, Sun Y, Wang H. Annual Glacier-Wide Mass Balance (2000–2016) of the Interior Tibetan Plateau Reconstructed from MODIS Albedo Products. Remote Sensing. 2018; 10(7):1031. https://doi.org/10.3390/rs10071031
Chicago/Turabian StyleZhang, Zhimin, Liming Jiang, Lin Liu, Yafei Sun, and Hansheng Wang. 2018. "Annual Glacier-Wide Mass Balance (2000–2016) of the Interior Tibetan Plateau Reconstructed from MODIS Albedo Products" Remote Sensing 10, no. 7: 1031. https://doi.org/10.3390/rs10071031
APA StyleZhang, Z., Jiang, L., Liu, L., Sun, Y., & Wang, H. (2018). Annual Glacier-Wide Mass Balance (2000–2016) of the Interior Tibetan Plateau Reconstructed from MODIS Albedo Products. Remote Sensing, 10(7), 1031. https://doi.org/10.3390/rs10071031