Scratching Beneath the Surface: A Model to Predict the Vertical Distribution of Prochlorococcus Using Remote Sensing

 ,
,  , ,
, , 
Abstract

1. Introduction
2. Materials and Methods
2.1. Model Parameterization
2.2. Prochlorococcus Abundance Predicted Using Ocean Observables
3. Results
3.1. Two-Component Model Validation
3.2. Two-Component Model Output
4. Discussion
5. Conclusions
Supplementary Materials
Author Contributions
Acknowledgments
Conflicts of Interest
References
- Hirata, T.; Aiken, J.; Hardman-mountford, N.; Smyth, T.J.; Barlow, R.G. Remote Sensing of Environment an absorption model to determine phytoplankton size classes from satellite ocean colour. Remote Sens. Environ. 2008, 112, 3153–3159. [Google Scholar] [CrossRef]
- Karl, D.M. Minireviews: A Sea of Change: Biogeochemical Variability in the North Pacific Subtropical Gyre. Ecosystems 1999, 2, 181–214. [Google Scholar] [CrossRef]
- Longhurst, A. Ecological Geography of the Sea; Academic Press: San Diego, CA, USA, 1998. [Google Scholar]
- Olson, D.M.; Dinerstein, E.; Wikramanayake, E.D.; Burgess, N.D.; Powell, G.V.N.; Underwood, E.C.; D’amico, J.A.; Itoua, I.; Strand, H.E.; Morrison, J.C.; et al. Terrestrial Ecoregions of the World: A New Map of Life on Earth. Bioscience 2001, 51, 933–938. [Google Scholar] [CrossRef]
- Behrenfeld, M.J.; O’Malley, R.T.; Boss, E.S.; Westberry, T.K.; Graff, J.R.; Halsey, K.H.; Milligan, A.J.; Siegel, D.A.; Brown, M.B. Revaluating ocean warming impacts on global phytoplankton. Nat. Clim. Chang. 2015, 6, 323–330. [Google Scholar] [CrossRef]
- Westberry, T.; Behrenfeld, M.J.; Siegel, D.A.; Boss, E. Carbon-based primary productivity modeling with vertically resolved photoacclimation. Glob. Biogeochem. Cycles 2008, 22. [Google Scholar] [CrossRef]
- Aiken, J.; Brewin, R.J.W.; Dufois, F.; Polimene, L.; Hardman-Mountford, N.J.; Jackson, T.; Loveday, B.; Hoya, S.M.; Dall’Olmo, G.; Stephens, J.; et al. A synthesis of the environmental response of the North and South Atlantic Sub-Tropical Gyres during two decades of AMT. Prog. Oceanogr. 2016. [Google Scholar] [CrossRef]
- Cullen, J.J. The deep chlorophyll maximum: Comparing vertical profiles of chlorophyll a. Can. J. Fish. Aquat. Sci. 1982, 39, 791–803. [Google Scholar] [CrossRef]
- Kirk, J.T.O. Light and Photosynthesis in Aquatic Ecosystems, 3rd ed.; Cambridge University Press: Cambridge, UK, 2011; ISBN 978-0-521-15175-7. [Google Scholar]
- Grace, J.; San Jose, J.; Meir, P.; Miranda, H.S.; Montes, R.A. Productivity and carbon fluxes of tropical savannas. J. Biogeogr. 2006, 33, 387–400. [Google Scholar] [CrossRef]
- Chisholm, S.W.; Olson, R.J.; Zettler, E.R.; Goericke, R.; Waterbury, J.B. A novel free-living prochlorophyte abundant in the oceanic euphotic zone. Nature 1988, 334, 340–343. [Google Scholar] [CrossRef]
- Bouman, H.A.; Ulloa, O.; Barlow, R.; Li, W.K.W.; Platt, T.; Zwirglmaier, K.; Scanlan, D.J.; Sathyendranath, S. Water-column stratification governs the community structure of subtropical marine picophytoplankton. Environ. Microbiol. Rep. 2011, 3, 473–482. [Google Scholar] [CrossRef] [PubMed]
- Heywood, J.L.; Zubkov, M.V.; Tarran, G.A.; Fuchs, B.M.; Holligan, P.M. Prokaryoplankton standing stocks in oligotrophic gyre and equatorial provinces of the Atlantic Ocean: Evaluation of inter-annual variability. Deep Sea Res. II Top. Stud. Oceanogr. 2006, 53, 1530–1547. [Google Scholar] [CrossRef]
- Malmstrom, R.R.; Coe, A.; Kettler, G.C.; Martiny, A.C.; Frias-Lopez, J.; Zinser, E.R.; Chisholm, S.W. Temporal dynamics of Prochlorococcus ecotypes in the Atlantic and Pacific oceans. ISME J. 2010, 4, 1252–1264. [Google Scholar] [CrossRef] [PubMed]
- Rabouille, S.; Edwards, C.A.; Zehr, J.P. Modelling the vertical distribution of Prochlorococcus and Synechococcus in the North Pacific Subtropical Ocean. Environ. Microbiol. 2007, 9, 2588–2602. [Google Scholar] [CrossRef] [PubMed]
- Zubkov, M.V.; Sleigh, M.A.; Burkill, P.H.; Leakey, R.J.G. Picoplankton community structure on the Atlantic Meridional Transect: A comparison between seasons. Prog. Oceanogr. 2000, 45, 369–386. [Google Scholar] [CrossRef]
- Zubkov, M.V.; Sleigh, M.A.; Tarran, G.A.; Burkill, P.H.; Leakey, R.J.G. Picoplanktonic community structure on an Atlantic transect from 50 degrees N to 50 degrees S. Deep Sea Res. I Oceanogr. Res. Pap. 1998, 45, 1339–1355. [Google Scholar] [CrossRef]
- Smayda, T.J. Bloom dynamics: Physiology, behavior, trophice: Ffects. Limonaology Oceanogr. 1997, 42, 1132–1136. [Google Scholar] [CrossRef]
- Bertilsson, S.; Berglund, O.; Karl, D.M.; Chisholm, S.W. Elemental composition of marine Prochlorococcus and Synechococcus: Implications for the ecological stoichiometry of the sea. Limnol. Oceanogr. 2003, 48, 1721–1731. [Google Scholar] [CrossRef]
- Flombaum, P.; Gallegos, J.L.; Gordillo, R.A.; Rincon, J.; Zabala, L.L.; Jiao, N.; Karl, D.M.; Li, W.K.W.; Lomas, M.W.; Veneziano, D.; et al. Present and future global distributions of the marine Cyanobacteria Prochlorococcus and Synechococcus. Proc. Natl. Acad. Sci. USA 2013, 110, 9824–9829. [Google Scholar] [CrossRef] [PubMed]
- Williams, R.G.; Follows, M.J. Biological Fundamentals. In Ocean Dynamics and the Carbon Cycle: Principles and Mechanisms; Williams, R.G., Follows, M.J., Eds.; Cambridge University Press: New York, NY, USA, 2011. [Google Scholar]
- NASA Moderate Resolution Imaging Spectroradiometer (MODIS-Aqua) Ocean Color Data; Goddard Space Flight Center Ocean Biology Processing Group: Greenbelt, MD, USA, 2014.
- Gordon, H.R.; Morel, A.Y. Remote Assessment of Ocean Color for Interpretation of Satellite Visible Imagery; Springer-Verlag New York: New York, USA, 1983. [Google Scholar]
- Hosoda, S.; Ohira, T.; Nakamura, T. A monthly mean dataset of global oceanic temperature and salinity derived from Argo float observations. JAMSTEC Rep. Res. Dev. 2008, 8, 47–59. [Google Scholar] [CrossRef]
- Johnson, Z.I.; Zinser, E.R.; Coe, A.; McNulty, N.P.; Woodward, E.M.; Chisholm, S.W. Niche Partitioning Among Prochlorococcus Ecotypes Along Ocean-Scale Environmental Gradients. Science 2006, 311, 1737–1740. [Google Scholar] [CrossRef] [PubMed]
- Zinser, E.R.; Johnson, Z.I.; Coe, A.; Karaca, E.; Veneziano, D.; Chisholm, S.W. Influence of light and temperature on Prochlorococcus ecotype distributions in the Atlantic Ocean. Limnol. Oceanogr. 2007, 52, 2205–2220. [Google Scholar] [CrossRef]
- Platt, T.; Gallegos, C.L.; Harrison, W.G. Photoinhibition of photosynthesis in natural assemblages of marine phytoplankton. J. Mar. Res. 1980, 38, 687–701. [Google Scholar]
- De Boyer Montégut, C.; Madec, G.; Fischer, A.S.; Lazar, A.; Iudicone, D. Mixed layer depth over the global ocean: An examination of profile data and a profile-based climatology. J. Geophys. Res. Oceans 2004, 109, 1–20. [Google Scholar] [CrossRef]
- Morel, A.; Berthon, J.-F. Surface pigments, algal biomass profiles, and potential production of the euphotic layer: Relationships reinvestigated in view of remote-sensing applications. Limnol. Oceanogr. 1989, 34, 1545–1562. [Google Scholar] [CrossRef]
- Venables, W.N.; Ripley, B.D. Modern Applied Statistics with S, 4th ed.; Springer: New York, NY, USA, 2002; Volume 53, ISBN 0387954570. [Google Scholar]
- Brewin, R.J.W.; Sathyendranath, S.; Müller, D.; Brockmann, C.; Deschamps, P.Y.; Devred, E.; Doerffer, R.; Fomferra, N.; Franz, B.; Grant, M.; et al. The Ocean Colour Climate Change Initiative: III. A round-robin comparison on in-water bio-optical algorithms. Remote Sens. Environ. 2015, 162, 271–294. [Google Scholar] [CrossRef]
- Forsythe, W.C.; Rykiel, E.J.; Stahl, R.S.; Wu, H.I.; Schoolfield, R.M. A model comparison for daylength as a function of latitude and day of year. Ecol. Model. 1995, 80, 87–95. [Google Scholar] [CrossRef]
- Cooper, P.I. The absorption of radiation in solar stills. Sol. Energy 1969, 12, 333–346. [Google Scholar] [CrossRef]
- Biller, S.J.; Berube, P.M.; Lindell, D.; Chisholm, S.W. Prochlorococcus: The structure and function of collective diversity. Nat. Rev. Microbiol. 2014, 13, 13–27. [Google Scholar] [CrossRef] [PubMed]
- McClain, C.R.; Signorini, S.R.; Christian, J.R. Subtropical gyre variability observed by ocean-color satellites. Deep Sea Res. II Top. Stud. Oceanogr. 2004, 51, 281–301. [Google Scholar] [CrossRef]
- Brew, H.S.; Moran, S.B.; Lomas, M.W.; Burd, A.B. Plankton community composition, organic carbon and thorium-234 particle size distributions, and particle export in the Sargasso Sea. J. Mar. Res. 2009, 67, 845–868. [Google Scholar] [CrossRef]
- Behrenfeld, M.J.; Falkowski, P.G. Photosynthetic rates derived from satellite-based chlorophyll concentration. Limnol. Oceanogr. 1997, 42, 1–20. [Google Scholar] [CrossRef]
- Babin, M.; Therriault, J.C.; Legendre, L.; Nieke, B.; Reuter, R.; Condal, A. Relationship between the maximum quantum yield of carbon fixation and the minimum quantum yield of chlorophyll a in vivo fluorescence in the Gulf of St. Lawrence. Limnol. Oceanogr. 1995, 40, 956–968. [Google Scholar] [CrossRef]
- Tsubouchi, T.; Suga, T.; Hanawa, K. Comparison study of subtropical mode waters in the world ocean. Front. Mar. Sci. 2016, 3, 270. [Google Scholar] [CrossRef]
- Boggs, S.W. This Hemisphere. J. Geol. 1945, 44, 345–355. [Google Scholar] [CrossRef]
- Dave, A.C.; Barton, A.D.; Lozier, M.S.; McKinley, G.A. What drives seasonal change in oligotrophic area in the subtropical North Atlantic? J. Geophys. Res. Oceans 2015, 120, 3958–3969. [Google Scholar] [CrossRef]
- Polovina, J.J.; Howell, E.A.; Abecassis, M. Ocean’s least productive waters are expanding. Geophys. Res. Lett. 2008, 35, L03618. [Google Scholar] [CrossRef]
- Durand, M.D.; Olson, R.J.; Chisholm, S.W. Phytoplankton population dynamics at the Bermuda Atlantic Time-series station in the Sargasso Sea. Deep Sea Res. II Top. Stud. Oceanogr. 2001, 48, 1983–2003. [Google Scholar] [CrossRef]
- Barton, A.D.; Ward, B.A.; Williams, R.G.; Follows, M.J. The impact of fine-scale turbulence on phytoplankton community structure. Limnol. Oceanogr. Fluids Environ. 2014, 4, 34–49. [Google Scholar] [CrossRef]
- Buitenhuis, E.T.; Li, W.K.W.; Vaulot, D.; Lomas, M.W.; Landry, M.R.; Partensky, F.; Karl, D.M.; Ulloa, O.; Campbell, L.; Jacquet, S.; et al. Picophytoplankton biomass distribution in the global ocean. Earth Syst. Sci. Data 2012, 4, 37–46. [Google Scholar] [CrossRef]
- Mella-Flores, D.; Six, C.; Ratin, M.; Partensky, F.; Boutte, C.; Le Corguillé, G.; Marie, D.; Blot, N.; Gourvil, P.; Kolowrat, C.; Garczarek, L. Prochlorococcus and synechococcus have evolved different adaptive mechanisms to cope with light and uv stress. Front. Microbiol. 2012, 3, 285. [Google Scholar] [CrossRef] [PubMed]
- Partensky, F.; Hess, W.R.; Vaulot, D. Prochlorococcus, a marine photosynthetic prokaryote of global significance. Microbiol. Mol. Biol. Rev. 1999, 63, 106–127. [Google Scholar] [PubMed]


| Symbol | Variable | Units | Source |
|---|---|---|---|
| SST | Sea surface temperature | °C | a |
| Rrs(443) | Remote-sensing reflectance at 443 nm | sr−1 | a |
| Rrs(488) | Remote-sensing reflectance at 488 nm | sr−1 | a |
| T200 | Temperature at the depth of 200 m | °C | b |
| DL | Day length | hours | c |
| θs | Solar zenith angle at noon | degrees | d |
| KdPAR | Calculated attenuation coefficient for the photo-synthetically available radiation | m−1 | f |
| KdPAR | Measured attenuation coefficient for the photo-synthetically available radiation | m−1 | e |
| DCM | Deep chlorophyll maximum | ||
| DPM | Deep Prochlorococcus maximum | ||
| ZDCM | Calculated depth of the deep chlorophyll maximum | metres | f |
| ZDCM | In situ depth of the deep chlorophyll maximum | metres | f |
| fPAR(z) | Fractional PAR (proportion of surface PAR) at depth z | % | f |
| Prosurf | Calculated Prochlorococcus cell abundance at the surface | cells mL−1 | f |
| Prosurf | In situ Prochlorococcus cell abundance at the surface | cells mL−1 | f |
| Promax | Prochlorococcus cell abundance at the DPM | cells mL−1 | f |
| ProI | Calculated cell abundance of Prochlorococcus distributed over depth near the surface | cells mL−1 | f |
| ProII | Calculated cell abundance of Prochlorococcus distributed over depth near the DPM | cells mL−1 | f |
| Prototal(z) | Calculated total Prochlorococcus cell abundance distributed over depth | cells mL−1 | f |
| Proint | Calculated cell abundance of Prochlorococcus integrated in the surface 200 m of the water column | cells m−2 | f |
| Output | Input (s) | Equation | Parameter | Parameter Value | Parameter σ |
|---|---|---|---|---|---|
| KdPAR | (1) | intercept | 0.776 × 10⁻¹ | 0.020 × 10⁻¹ | |
| Rrs(443) | (1) | slope | −3.1673 × 100 | 0.195 × 100 | |
| ZDCM | (8) | intercept | 1.241 × 101 | 0.786 × 101 | |
| Rrs(443) | (8) | slope1 | 1.021 × 10⁴ | 0.066 × 10⁴ | |
| θs | (8) | slope2 | 2.227 × 10⁻¹ | 2.381 × 10⁻¹ | |
| Prosurf | SST | (3)–(5) | a3 | 3.254 × 10⁴ | 0.030 × 10⁴ |
| Rrs(488) | (3)–(5) | b3 | 9.762 × 10⁷ | 0.104 × 10⁷ | |
| DL | (3)–(5) | c3 | −2.080 × 10⁴ | 0.043 × 10⁴ | |
| T200 | (3)–(5) | d3 | −2.117 × 10⁴ | 0.029 × 10⁴ | |
| SST, Rrs(488) | (3)–(5) | e3 | −4.421 × 10⁶ | 0.041 × 10⁶ | |
| Promax | (7) | a7 | −1.153 × 10⁵ | 0.194 × 10⁵ | |
| ZDCM | (7) | b7 | 1.837 × 10³ | 0.014 × 10³ | |
| Prosurf | (7) | c7 | 2.951 × 10⁻¹ | 0.087 × 10⁻¹ |
| Variable | Equation | Ψ | δ | ∆ | r2 |
|---|---|---|---|---|---|
| KdPAR | (1) | 5.136 × 10⁻³ | −0.321 × 10⁻³ | 0.512 × 10⁻³ | 0.75 |
| ZDCM | (8) | 2.084 × 101 | −0.101 × 101 | 2.081 × 101 | 0.73 |
| Promax1 | (7) | 5.872 × 10⁴ | −0.054 × 10⁴ | 5.872 × 10⁴ | 0.44 |
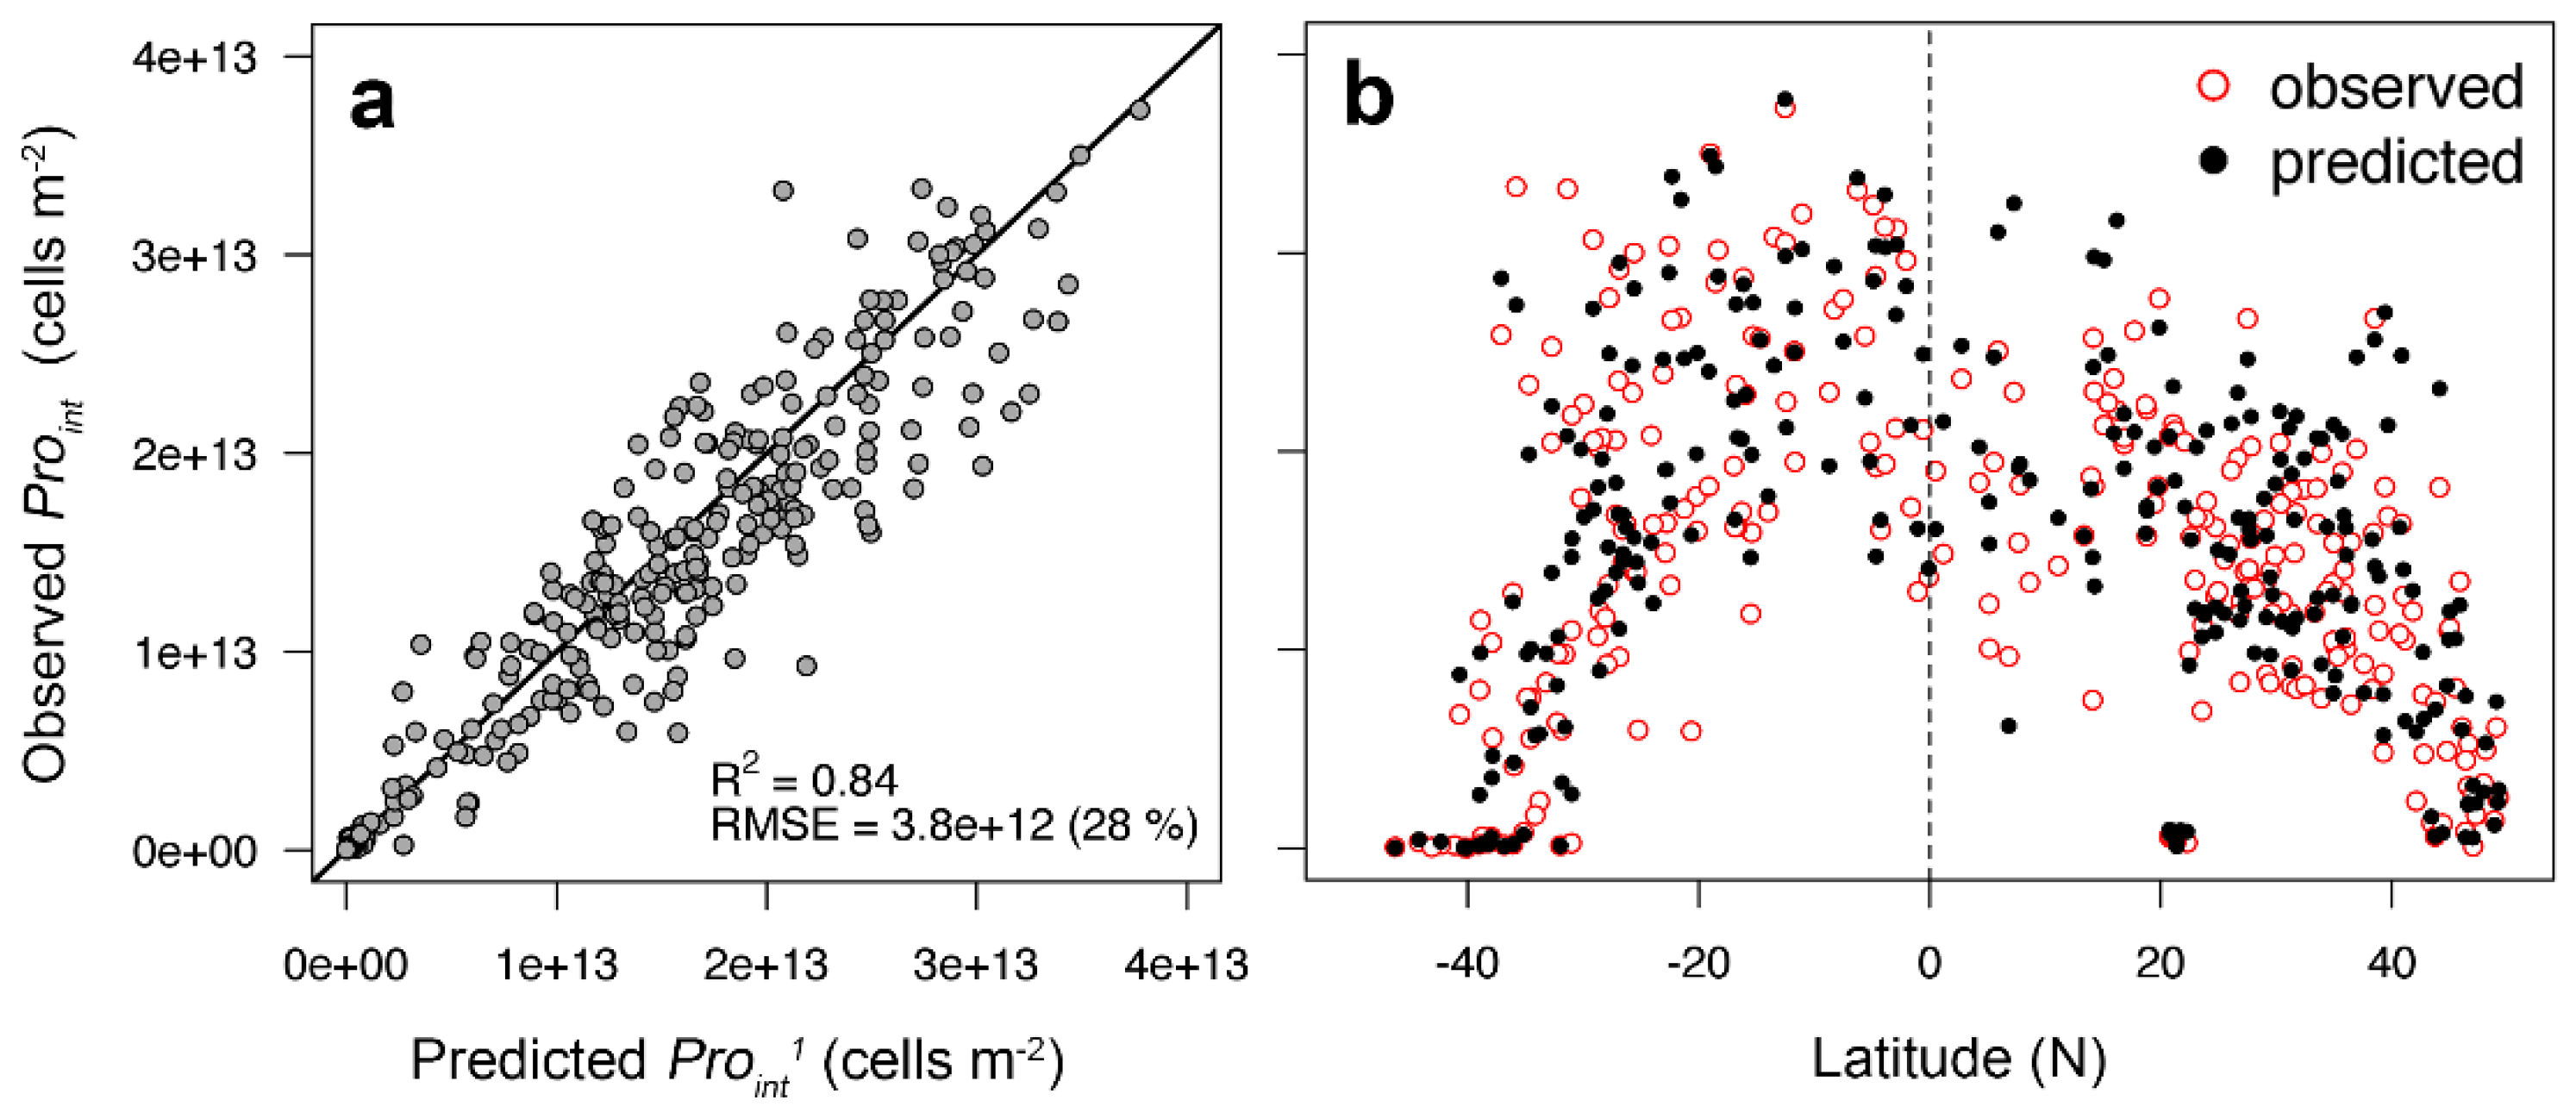
| Prototal(z)1 | (9) | 3.775 × 10⁴ | −0.361 × 10⁴ | 3.758 × 10⁴ | 0.84 |
| Proint1 | (10) | 3.682 × 10¹² | −1.047 × 10¹² | 3.529 × 10¹² | 0.85 |
| Promax2 | (7) | 5.805 × 10⁴ | −0.349 × 10⁴ | 5.794 × 10⁴ | 0.40 |
| Prototal(z)2 | (9) | 4.038 × 10⁴ | −0.479 × 10⁴ | 4.010 × 10⁴ | 0.82 |
| Proint2 | (10) | 4.146 × 10¹² | −1.214 × 10¹² | 3.964 × 10¹² | 0.81 |
| Prosurf3 | (3)–(5) | 6.551 × 10⁴ | 1.237 × 10⁴ | 6.434 × 10⁴ | 0.50 |
| Promax3 | (7) | 6.210 × 10⁴ | 0.297 × 10⁴ | 6.203 × 10⁴ | 0.32 |
| Prototal(z)3 | (9) | 6.176 × 10⁴ | 0.466 × 10⁴ | 6.159 × 10⁴ | 0.58 |
| Proint3 | (10) | 6.651 × 10¹² | −0.572 × 10¹² | 6.651 × 10¹² | 0.48 |
| Standing Stock (Cells) | Total Carbon * (Megatonnes C) | Proint3 (Cells m−2) | Prosurf3 (Cells mL−1) | Promax3 (Cells mL−1) | |
|---|---|---|---|---|---|
| Global | 3.4 × 1027 | 171 | |||
| Atlantic Ocean | 7.4 × 1026 | 37 | |||
| Equatorial Convergence Zone | 2.2 × 1026 | 11 | |||
| ECZ: 2 °S, 22 °W | 1.7 × 10¹³ | 2.2 × 10⁵ | 0.7 × 10⁵ | ||
| North Atlantic Gyre | 1.0 × 1026 | 5.1 | |||
| NAG: 26° N, 50° W | 1.6 × 10¹³ | 0.7 × 10⁵ | 1.3 × 10⁵ | ||
| South Atlantic Gyre | 1.6 × 1026 | 8.2 | |||
| SAG: 20° S, 20° W | 2.2 × 10¹³ | 1.0 × 10⁵ | 1.7 × 10⁵ |
© 2018 by the authors. Licensee MDPI, Basel, Switzerland. This article is an open access article distributed under the terms and conditions of the Creative Commons Attribution (CC BY) license (http://creativecommons.org/licenses/by/4.0/).
Share and Cite
Lange, P.K.; Brewin, R.J.W.; Dall’Olmo, G.; Tarran, G.A.; Sathyendranath, S.; Zubkov, M.; Bouman, H.A. Scratching Beneath the Surface: A Model to Predict the Vertical Distribution of Prochlorococcus Using Remote Sensing. Remote Sens. 2018, 10, 847. https://doi.org/10.3390/rs10060847
Lange PK, Brewin RJW, Dall’Olmo G, Tarran GA, Sathyendranath S, Zubkov M, Bouman HA. Scratching Beneath the Surface: A Model to Predict the Vertical Distribution of Prochlorococcus Using Remote Sensing. Remote Sensing. 2018; 10(6):847. https://doi.org/10.3390/rs10060847
Chicago/Turabian StyleLange, Priscila K., Robert J. W. Brewin, Giorgio Dall’Olmo, Glen A. Tarran, Shubha Sathyendranath, Mikhail Zubkov, and Heather A. Bouman. 2018. "Scratching Beneath the Surface: A Model to Predict the Vertical Distribution of Prochlorococcus Using Remote Sensing" Remote Sensing 10, no. 6: 847. https://doi.org/10.3390/rs10060847
APA StyleLange, P. K., Brewin, R. J. W., Dall’Olmo, G., Tarran, G. A., Sathyendranath, S., Zubkov, M., & Bouman, H. A. (2018). Scratching Beneath the Surface: A Model to Predict the Vertical Distribution of Prochlorococcus Using Remote Sensing. Remote Sensing, 10(6), 847. https://doi.org/10.3390/rs10060847