Review

Spectral Properties of Coniferous Forests: A Review of In Situ and Laboratory Measurements

1
Department of Built Environment, School of Engineering, Aalto University, P.O. Box 14100, FI-00076 Aalto, Finland
2
Department of Electronics and Nanoengineering, School of Electrical Engineering, Aalto University, P.O. Box 15500, FI-00076 Aalto, Finland
3
Global Change Research Institute CAS, Bělidla 986/4a, 603 00 Brno, The Czech Republic
4
Tartu Observatory, University of Tartu, Observatooriumi 1, Tõravere, 61602 Tartumaa, Estonia
5
VTT Technical Research Centre of Finland, P.O. Box 1000, FI-02044 Espoo, Finland
*
Author to whom correspondence should be addressed.
Remote Sens. 2018, 10(2), 207; https://doi.org/10.3390/rs10020207
Submission received: 2 December 2017 / Revised: 17 January 2018 / Accepted: 26 January 2018 / Published: 30 January 2018
(This article belongs to the Special Issue Recent Progress and Developments in Imaging Spectroscopy)

Abstract

:
Coniferous species are present in almost all major vegetation biomes on Earth, though they are the most abundant in the northern hemisphere, where they form the northern tree and forest lines close to the Arctic Circle. Monitoring coniferous forests with satellite and airborne remote sensing is active, due to the forests’ great ecological and economic importance. We review the current understanding of spectral behavior of different components forming coniferous forests. We look at the spatial, directional, and seasonal variations in needle, shoot, woody element, and understory spectra in coniferous forests, based on measurements. Through selected case studies, we also demonstrate how coniferous canopy spectra vary at different spatial scales, and in different viewing angles and seasons. Finally, we provide a synthesis of gaps in the current knowledge on spectra of elements forming coniferous forests that could also serve as a recommendation for planning scientific efforts in the future.

Graphical Abstract

1. Introduction

There are over 600 living coniferous tree or shrub species in the world [1]. Conifers are present in almost all major vegetation biomes on Earth, though they are the most abundant in the northern hemisphere where they form the northern tree and forest lines close to the Arctic Circle. Coniferous species are often only associated with northern areas; 35 of the coniferous genera occur only in the northern hemisphere. However, there are many species (25 coniferous genera) in the southern hemisphere and also some species (10 genera) occurring in both hemispheres. Coniferous trees are often the attention of general interest because they have broken world records: representatives of conifers are, for example, the tallest [2] and oldest [3] living trees on Earth.
Monitoring coniferous areas through satellite and airborne remote sensing is active, due to the forests’ great ecological and economic importance. Coniferous species have a key role in global ecological processes: a large terrestrial carbon stock is present in the soils and biomass of coniferous-dominated forests [4]. Conifers also have high economic value in the forest industry [5] in the production of softwood lumber and paper, as well as in providing sources for non-wood products (e.g., nuts, resin, anti-cancer agents, essential oils) and modern wood-derived products to replace e.g., oil or petroleum-based products. Coniferous forests cover geographically extensive areas: for example, in Europe, 113 million hectares of all forest areas are covered by conifers, 90 million hectares by broadleaved species, and 48 million hectares by mixed forests [6].
The unique structures and optical properties of these forests have posed serious challenges for developing methods to interpret remotely sensed spectral data acquired from conifer-dominated areas. Most conifers are evergreen, but five genera (incl. Larix sp.) shed their leaves in the fall and are leafless throughout the winter period. The leaves of coniferous species are typically long and thin (also called needle-like), and are often arranged in spiral structures called shoots. Some species (e.g., in Cuprassaceae) have instead flat, scale-like leaves arranged in whorls. The size of coniferous needles varies from a few millimeters to tens of centimeters in length. Thin and long needles, arranged in whorls or shoots, are responsible for the high levels of multiple scattering of photons occurring in coniferous canopies [7,8]—a phenomenon not seen in broadleaved forests. The thin-needle structures have also proven to be a challenge when spectral reference libraries of coniferous species are collected using standard spectral measurement techniques originally developed for broadleaved tree or crop species [9,10,11]. In addition to the three-dimensional (3D) arrangement of foliage in the canopy and optical properties of leaves, a significant contribution to the remotely sensed reflectance of coniferous forests is produced by the understory (or forest floor) layer e.g., [12,13].
In this paper, we review the current understanding of spectral behavior of different components forming coniferous forests. We look at the spatial, directional and seasonal variations in needle, shoot, woody element and understory spectra in coniferous forests based on empirical measurements. We also demonstrate how coniferous canopy spectra vary at different spatial scales, and in different viewing angles and seasons. Finally, we provide a synthesis of gaps in the current knowledge on spectra of elements forming coniferous forests that could also serve as a recommendation for planning scientific efforts in the future.

2. Spectral Properties of Coniferous Needles

2.1. Measurements of Needle Optical Properties

Measuring optical properties of coniferous needles has been considered difficult already for decades. Because of their small size (i.e., width and/or length), conifer needles do not usually cover the sample ports of typical integrating spheres. This poses challenges to the measurements of needle optical properties, and is one reason why only a small amount of data is available on needle spectra when compared to broadleaved plant species. Early studies measured the reflectance of mats (also called “mosaics” or “stacks”) of needles with an integrating sphere [14,15,16]. Contact probes and bare spectrometer detectors have also been used (e.g., [17,18,19,20]). By using a contact probe together with a needle clip, it is possible to measure only one needle at a time [21,22,23]. This approach is best suited for measuring living needles in the field. Measuring only reflectance, however, is not always sufficient. Data on spectral transmittance (and absorption) are also commonly needed. Measuring both reflectance and transmittance of individual needles is possible with sample holders (often called “needle carriers”) that hold the needles in the sample port of an integrating sphere. The drawback of the method, in general, is that it requires accurate determination of the area of gaps between the needles in the sample holder [9,10]. The measurement method and processing parameters used e.g., in determining gap fractions between needles can have a large influence on the measured needle spectra, which complicates comparison of results (e.g., concerning interspecific variation in needle spectra) from different studies.

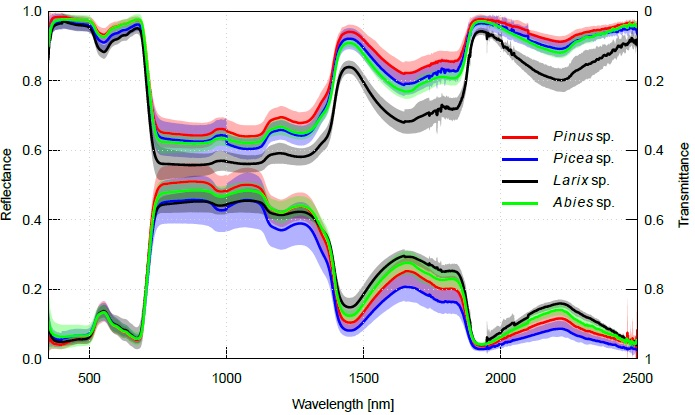
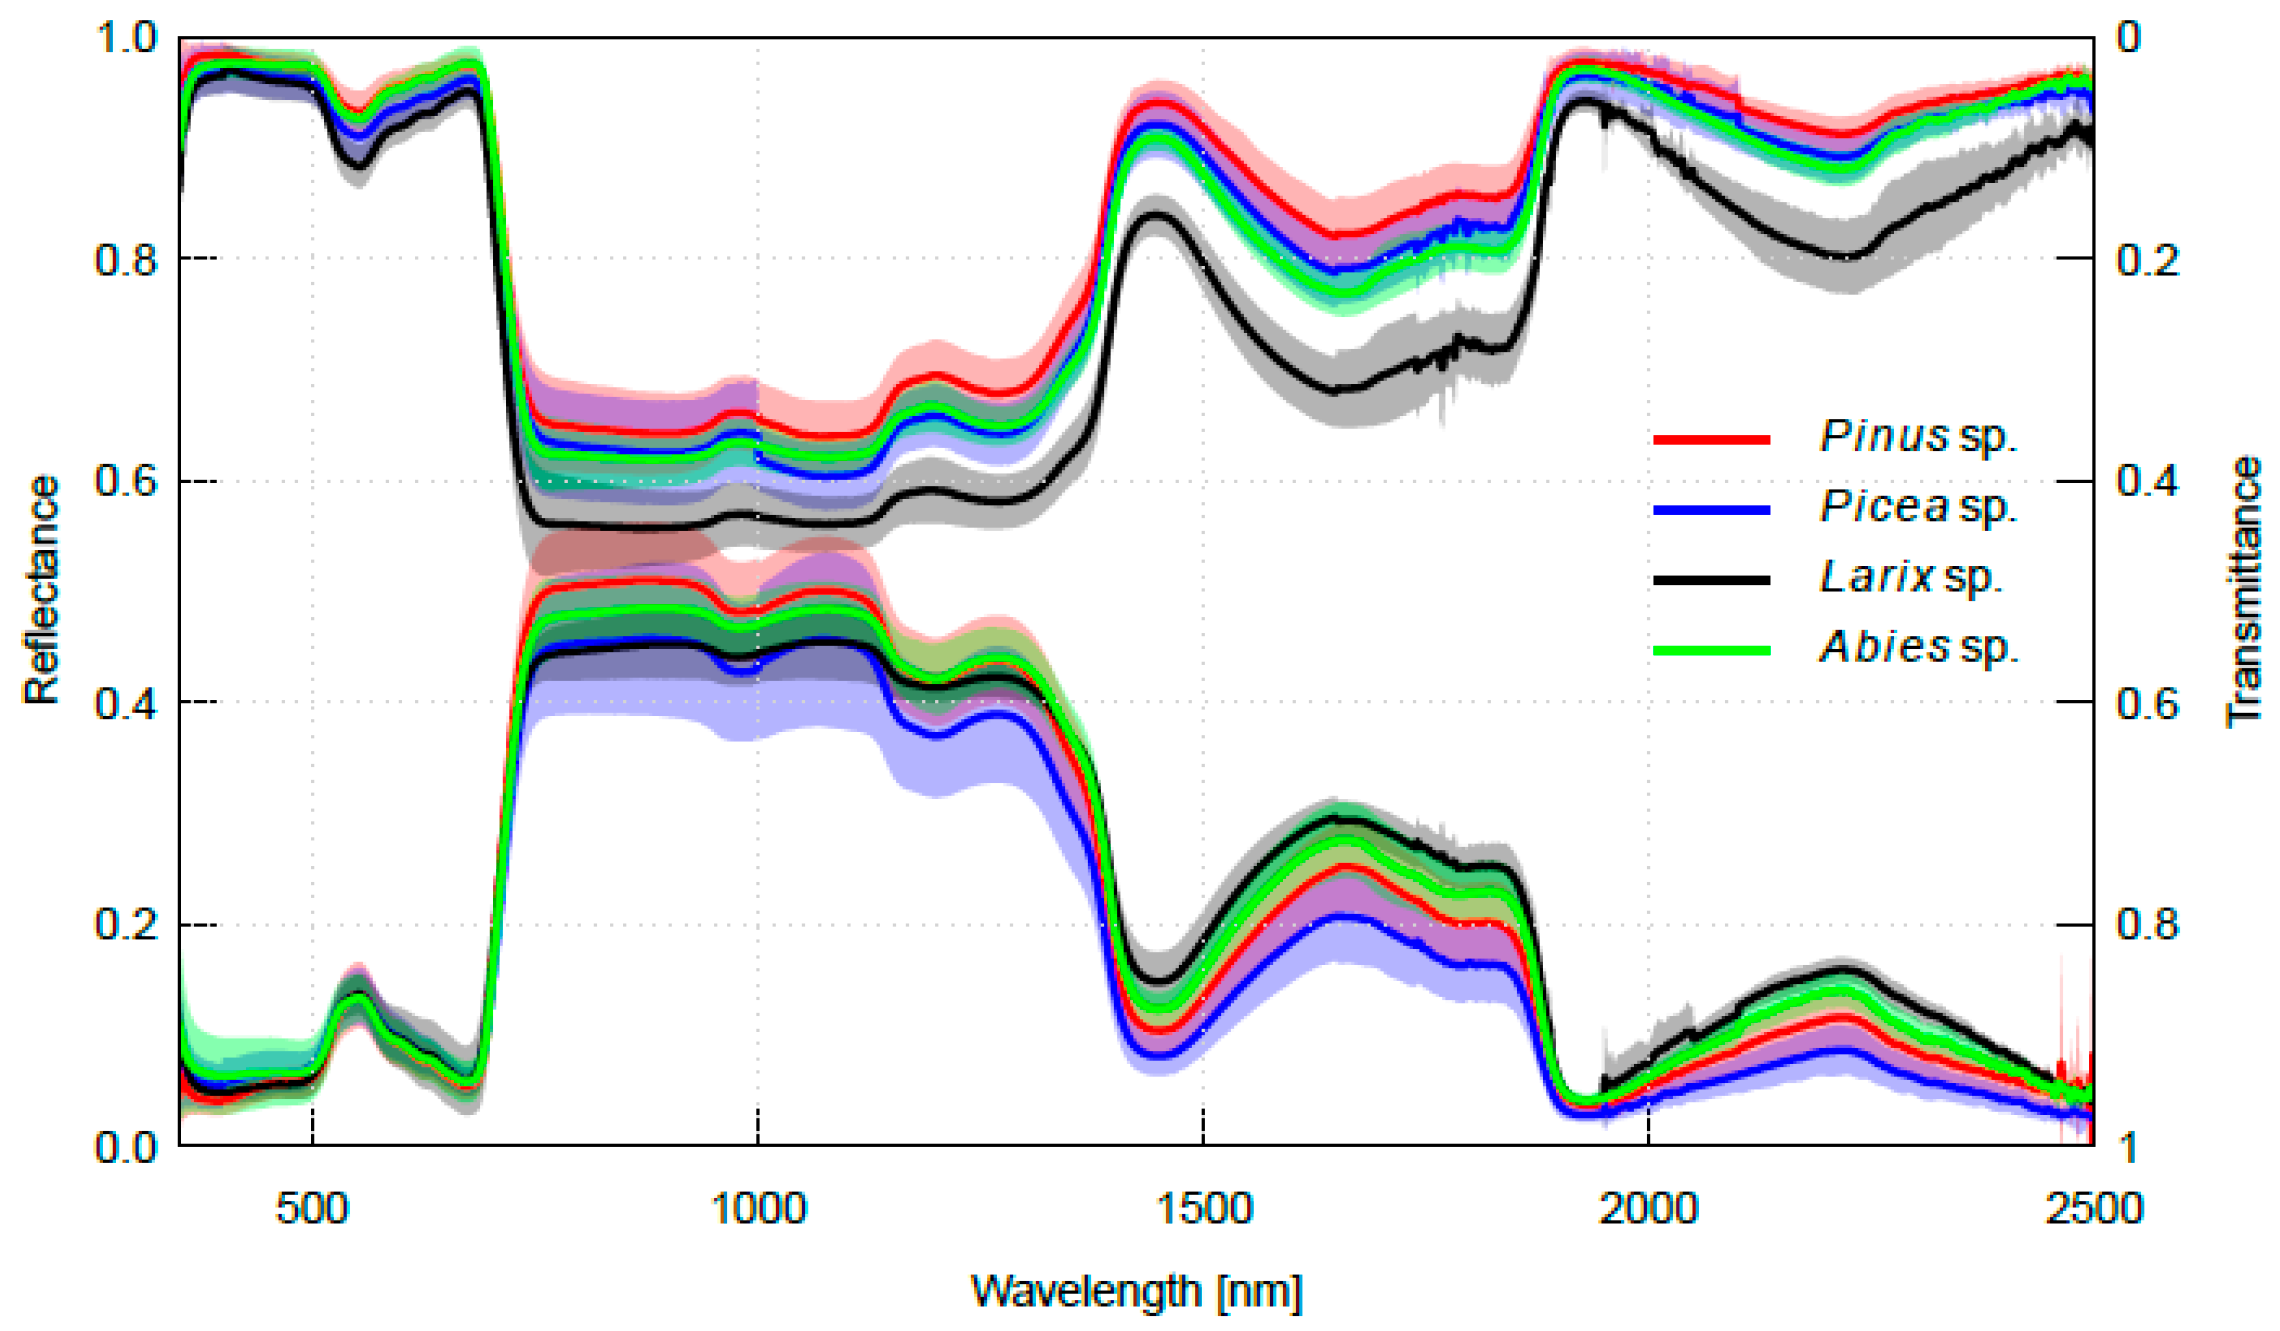
2.2. Interspecific Variation in Needle Spectra

To identify which coniferous species and geographical regions are best represented in literature, we listed all openly available datasets containing needle spectra (Table 1), as well as publications in which needle spectra had been measured, even if the data are not openly accessible (Appendix A). For completeness, all datasets and publications were included, regardless of whether they explicitly reported species differences. We restricted the analysis to fresh (either detached from the branch or intact) needles collected from trees grown outdoors. Literature reporting spectra of dried needle material, and experiments on greenhouse or laboratory-cultivated seedlings were not included.
For each species, we counted the number of occurrences, i.e., in how many databases and publications the species occurred. Of the coniferous genera, Pinus and Picea are best represented with a total of 49 and 34 occurrences when all species are summed per genera, followed by Abies (9), Larix (6), Pseudotsuga (4), Thuja (4), Tsuga (4), and Juniperus (2). Other genera (Calocedrus, Chmaecyparis, Cryptomeria, Cunninghamia) had only a single occurrence. Of single species, the most common were Pinus sylvestris (14), Picea abies (12), Pinus banksiana (10), and Picea mariana (9). Other species had a maximum of 5 occurrences per species. Data from boreal and temperate regions in the northern hemisphere dominate in the studies (Table 1, Appendix A, Figure 1). Studies on needle spectra have not been conducted in tropical regions, and only one study is from the in the southern hemisphere [18].
Coniferous needles exhibit spectral features typical for green vegetation. There is a minimum in reflectance and transmittance, and a maximum in absorption in the visible (VIS) region due to the presence of various pigments in green leaves. Reflectance increases (and absorption decreases) dramatically towards near infrared (NIR), and has distinct water absorption features both in NIR and shortwave infrared (SWIR) regions. The largest differences between coniferous needles and broad (flat) leaves are in transmittance, and in SWIR reflectance. Coniferous needles have lower transmittance than broad leaves throughout all wavelengths [24,25,26,27], which results in larger absorption for coniferous needles. Several authors have also emphasized that SWIR reflectance for coniferous needles is low compared to broad leaves [11,25,26]. For VIS and NIR reflectance, the differences are not as evident. Individual studies have reported that coniferous needles have slightly lower VIS reflectance than broad leaves [26], and some have indicated that conifers may have higher NIR reflectance than broadleaved species [24,26]. The local depressions in reflectance in the NIR plateau due to water absorption are more pronounced in conifers [25,26].
Needles of coniferous species differ by their biochemical composition [21,28,29,30], leaf thickness, or mass per area [21,28,29,31], position and density of stomata [31], and internal anatomical structure [28,31]. Therefore, it is not surprising that interspecies differences in spectra have been observed [11,21,26,27,30,31,32]. Drawing general conclusions about interspecies differences and their magnitude compared to other factors is however difficult, because most studies (Table 1, Appendix A) are local, with only few species and sites measured, and data across campaigns cannot be readily compared, due to methodological differences. Studies that have examined a large number of species, using comparable methodology for each, clearly show that species is important, although not the only factor explaining spectral differences [11,30,33]. For example, for a set of 12 boreal species belonging to five taxonomic genera, species explained up to 71%, 70%, and 78% of variability in the reflectance, transmittance, and albedo spectra, respectively [11]. On the other hand, a study containing 18 plant species (of which 7 were conifers) in California, USA, reported that species explained 20%, 80%, and 47% of variability in the three first principal components derived from the reflectance spectra [33]. In addition, for four temperate and boreal species in North America, it was shown that differences (range) in photochemical reflectance index (PRI) were larger between species than between light conditions [30].
Similarity of species belonging to same taxonomic genera has been demonstrated [11,26]. Of individual species, Larix sp. clearly stands out (Figure 1, and [11]) with its spectra resembling those of broadleaved trees. This is logical because Larix sp. are deciduous, and differ also morphologically from the evergreen species. Because many of the reviewed studies focused on limited wavelength ranges (Appendix A), very little is known about best wavelength regions to separate coniferous species. Typically, the interspecies differences increase towards longer wavelengths, and are the largest in SWIR region [11]. Among principal components derived from the spectra, species explained largest amount of variation in the component that was correlated with SWIR region [34].
Finally, it should be noted that the spectra of adaxial and abaxial sides of needles are different. Some studies have shown interspecies differences to be larger in abaxial than adaxial needle sides [31,34]. In addition, the differences in optical properties between the two leaf sides depend on species [11]. For coniferous species with distinct abaxial and adaxial needle sides, it is thus important to measure both sides of needles to understand species-specific reflectance patterns at canopy-level. In practice, however, measuring the spectral properties of different sides of needles is very challenging, due to their thin and often also sensitive structures.

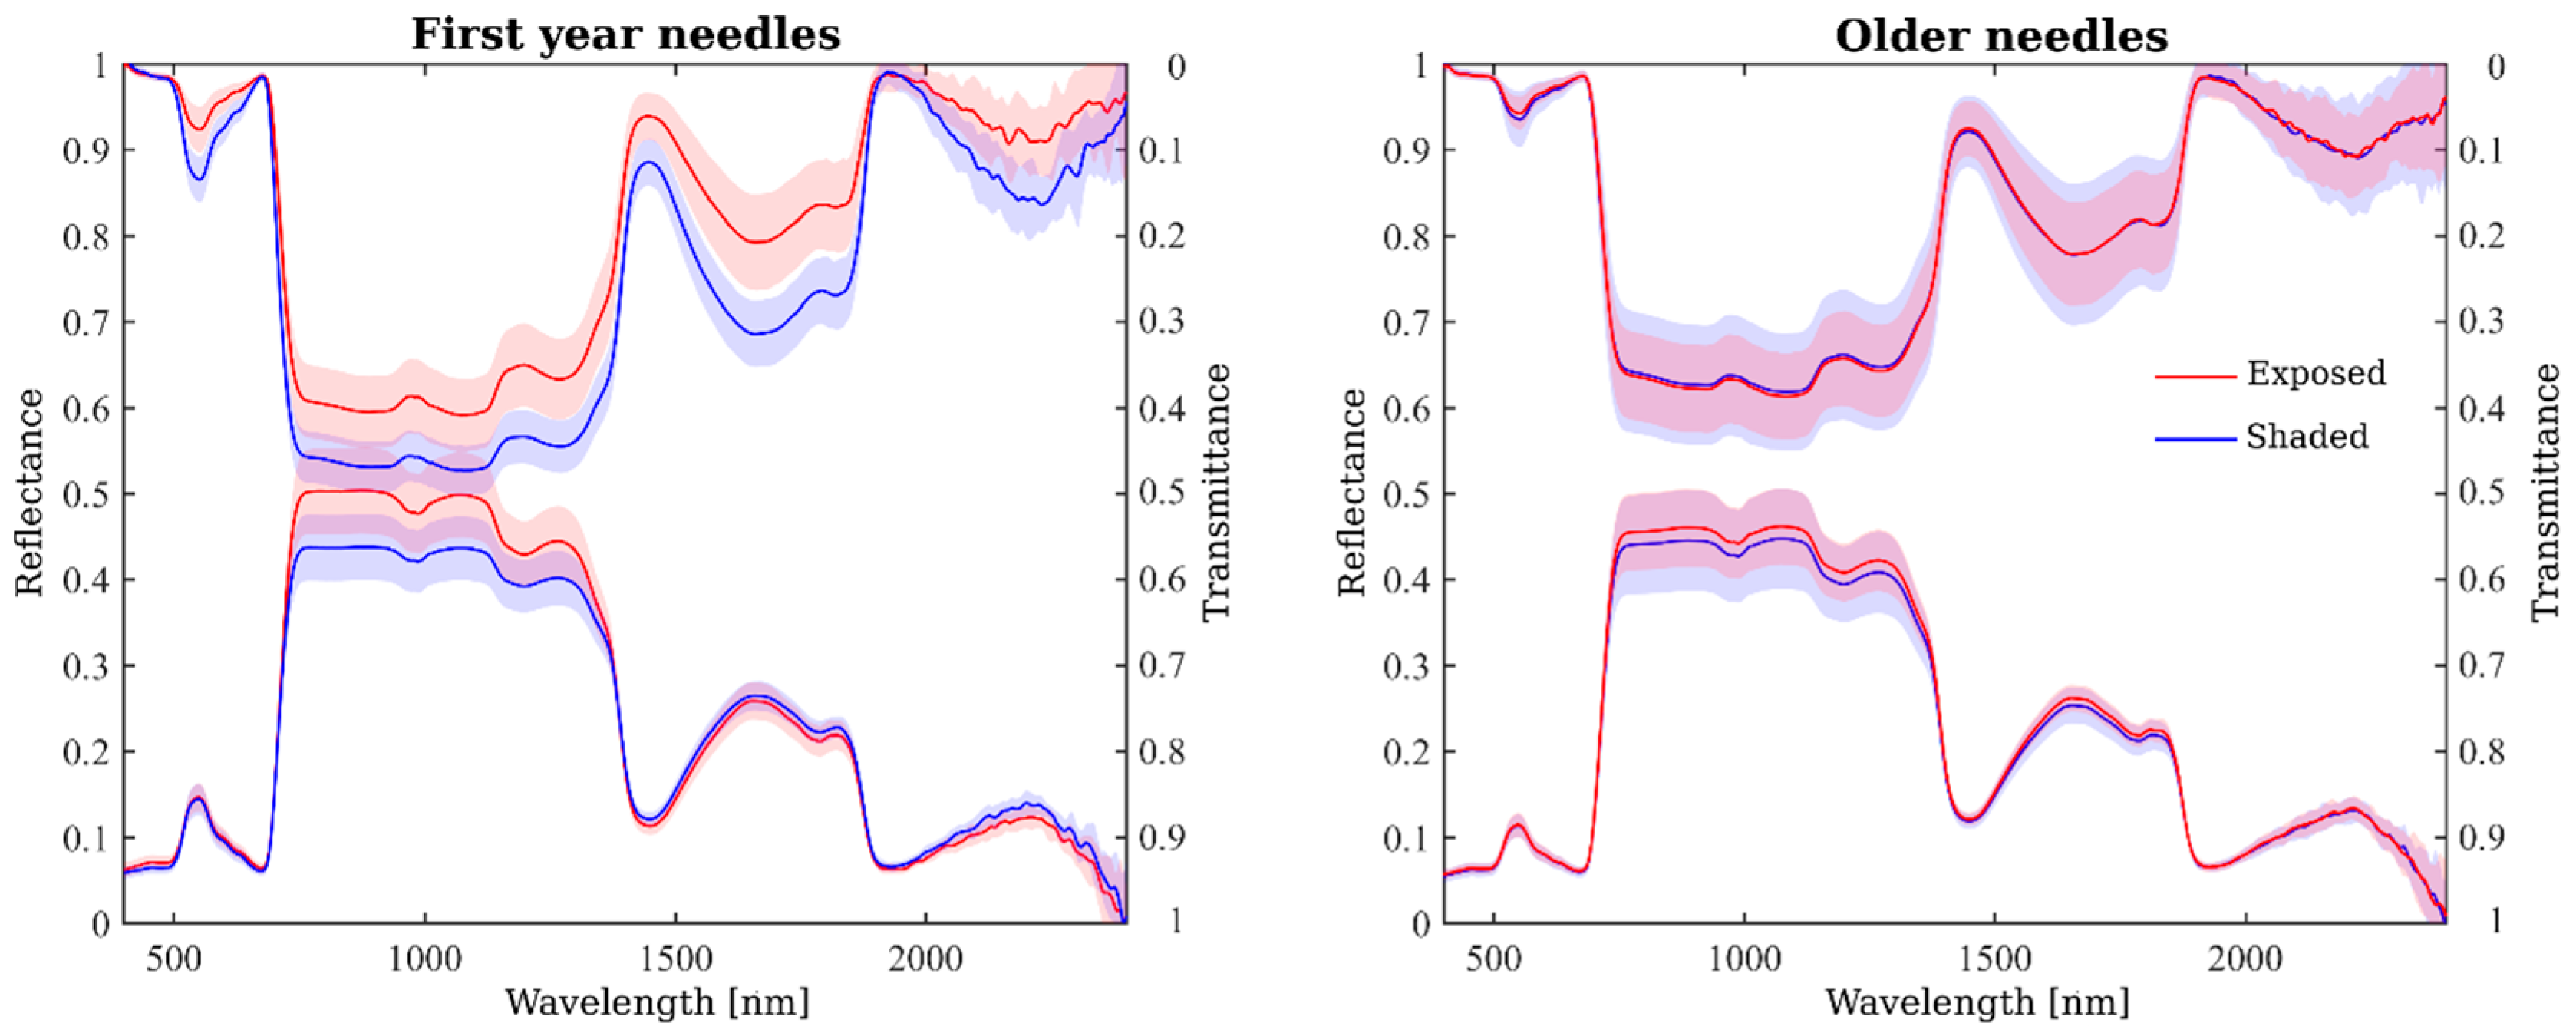
2.3. Spatial Variation in Needle Spectra

A few coniferous species (e.g., Larix sp.) shed their needles every year, but most of the species retain their needles for several years. The average lifespan, defined as the leaf age-class retaining at least 50% of leaves, varies for coniferous species from 6 to 110 months [46]. Spectral differences within coniferous crowns are mainly observed (1) between needles of different age, and (2) between vertical canopy layers with different levels of adaptation to direct/diffuse radiation conditions [11,17,27,47]. For example, current-year Norway spruce needles collected from a study site in the Czech Republic (see Appendix B for details) show the largest spectral differences between two vertical canopy levels, whereas older cohorts of needles exhibit almost no differences in their spectral properties (Figure 2). The wavelengths that are the most influenced by needle age are located in the green peak region, as well as in NIR and SWIR regions, where transmittance of shade-adapted needles is higher than that of sun-exposed needles. Needle reflectance is less influenced than transmittance by needle age. Measurements of spectral properties of 13 boreal broadleaf and 12 coniferous tree species also revealed that shaded foliage in general had higher transmittance than sun-exposed foliage throughout the 400–2400 nm spectral region (being the most prominent in NIR and SWIR regions) [11]. Canopy position, however, explained only a relatively small proportion (<10%) of the overall variability in the measured spectra for the 12 coniferous species. Needle age (current-year vs. previous-year needles), on the other hand, explained up to 37% of the total variance in measured transmittance for the same set of species. In addition, canopy position, and thus light environment, had a relatively small influence on needle spectra [11], which is in line with other studies that have emphasized importance of species and needle age over light environment [17,47]. On the other hand, in another study limited to three species, larger differences in coniferous needle reflectance were indeed observed between canopy positions [27]. Reasons for these somewhat contradictory findings may be differences in forest structures and/or definitions of canopy positions between studies, and the fact that the statistical analysis in the study comprising 12 species [11] did not consider interaction effects by canopy position, needle age, and species. Overall, the effect of canopy position is well documented in literature, but its magnitude in relation to other factors (e.g., species, needle age, site type) is still uncertain.
Almost all studies on spectral properties of conifers do consider, to some extent, variability in the canopy vertical gradient, but typically, no attention is paid to the spatial variation caused by the azimuth orientation of branches. Based on our literature searches, there is only one study that addressed the effect of azimuthal branch orientation on spectral characteristics of coniferous needles [48]. The study confirmed that the azimuth orientation of branches does not induce different microclimatic and irradiance conditions, which would affect needle biochemical, structural, and hence, spectral features of the study species, Norway spruce [48]. Even though the study included only one species, this finding is important for collecting spectral libraries for use in e.g., remote sensing of conifer physiology, because it allows random sampling of needles from upper tree crowns, so that azimuth orientation does not need to be taken into account. Similar observations have been reported for morphology and anatomy parameters of Scots pine needles sampled from the south- and north-oriented branches at three vertical layers (top, middle, and lower part of the canopy) [49]. Once again, branch azimuth orientation had no significant impact on studied parameters, whereas significant differences were found between the samples from different canopy vertical layers.

2.4. Seasonal Variation in Needle Spectra

Studies on seasonal variation of needle spectra are only available for evergreen conifers in the boreal and northern temperate regions [11,20,29,34,43,50,51,52]. The seasonal variations are driven by structural (i.e., expansion of needles) and biochemical changes in current-year needles, and biochemical changes in older (overwintered) needles. In addition, the contribution of epicuticular waxes to needle reflectance is at its maximum in summertime, probably serving as a photoprotective mechanism [20]. Overwintered needles can be monitored throughout the season, and more results on them are thus available. Current-year needles are difficult to measure, particularly in the beginning of growing season, because newly emerged needles are thin, fragile, and may have a large water content [27,43].
When examining overwintered needles, notable changes are observed in the pigment composition in the spring, associated with activation of the photosynthesis [51]. These changes, e.g., in chlorophyll content, affect the spectra in visible wavelengths: an increase in PAR absorption and a shift in the red edge position, and a decrease in the green peak reflectance and PRI from spring to summer are therefore observed [34,50,51,52]. Changes between summer and early autumn (September) seem to be inverse, but small [11,34]. Currently, there is no time series spanning from summer to winter available for overwintered needles. In the NIR region, absorption increases through growing season, particularly in the oldest needle age classes [34]. This could be caused by older needles serving as storage organs for starch; the storage is depleted during winter, resulting in low absorption in spring, and the absorption then increases gradually through growing season [34]. Similarly, a clear decrease in NIR reflectance from June to September has been observed for one-year-old needles, while transmittance increased only little, thus resulting in higher absorption [11]. Results regarding SWIR region are rare and mixed, indicating small, but either opposite [43] or similar [11] changes, as in NIR.
When examining current-year needles, no large differences in the visible region are observed from summer to early autumn [11,34]. Measurements of PRI (a vegetation index originally defined by [53]) suggest that the changes due to deactivation of the photosynthesis mechanisms are opposite, but more gradual, compared to those observed for overwintered needles in the spring [51]. NIR reflectance slightly increases [11,43] and transmittance slightly decreases [11] from summer to autumn. The seasonal courses of NIR spectra in current-year needles, therefore, resemble those of deciduous broadleaved species [11,54], and are probably related to changes in structure (thickness) and water content [43]. Seasonal variations observed for current-year needles in SWIR are similar to those in NIR region [11,43].

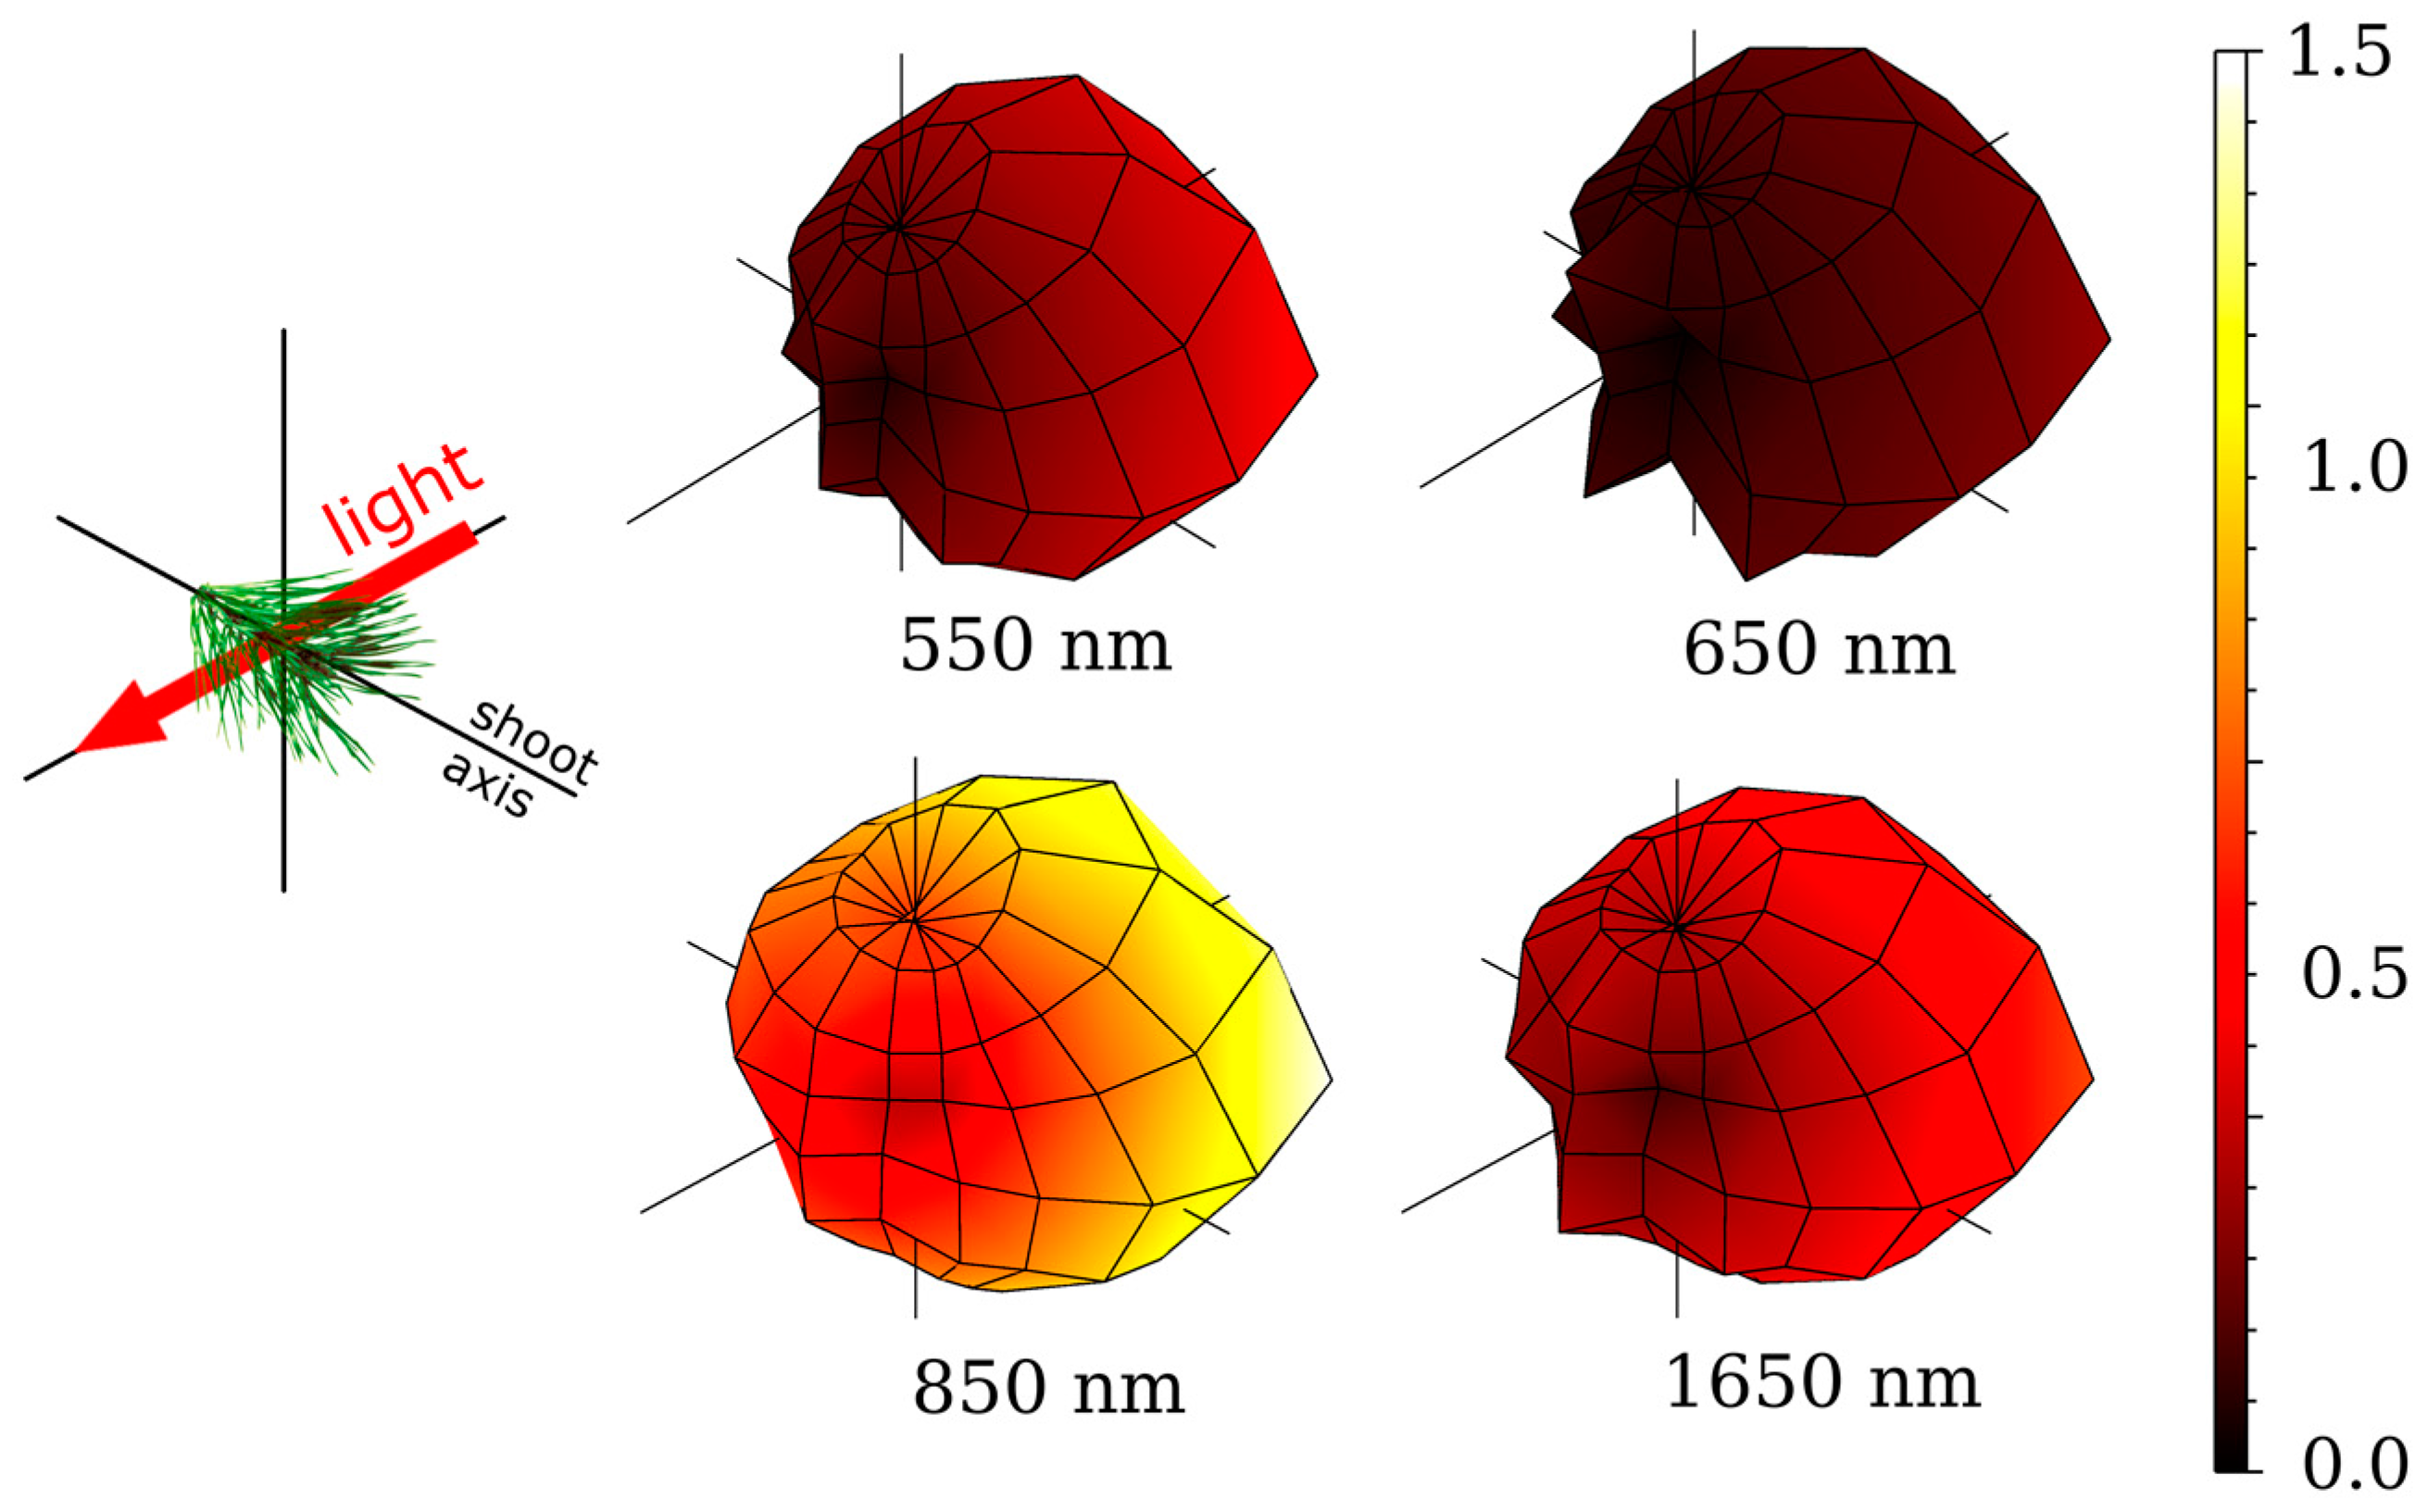
2.5. Directional Variation in Needle Spectra

Contrary to flat leaves, no spectral measurements with full directional characterization are available for individual needles. Even in most elaborate laboratory measurements with integrating spheres, only two directional scattering components are distinguished for needles: reflectance (RN) and transmittance (TN) [9,10]. The leaf reflectance (RL) and transmittance (TL) are defined similarly to flat leaves, i.e., as the directional-hemispherical reflectance factor, DHRF, and the directional-hemispherical transmittance factor, DHTF. These two quantities are defined relative to an imaginary surface [55]. When measuring flat leaves, the leaves themselves are assumed to approximate this imaginary surface, and the two directions include physically distinct scattering components: leaf reflectance (RL) is contributed by light reflected at the leaf–air interface (and not entering the leaf) and a diffuse component scattered backward by leaf interior, while leaf transmittance (TL) consists only of the latter interior component. During needle reflectance and transmittance measurements with an integrating sphere, needles do not cover the whole measured area [9,10]. Hence, needle RN and TN contain both surface and interior components: photons hitting the curved sides of needles can be easily scattered forward by the needle surface, pass through the gaps between the needles, and contribute to TN. The needles of many coniferous species lack a physical flat surface required by the definition of DHRF and DHTF; hence, it is more justified to interpret RN and TN as backward and forward scattering, respectively. The spectral variation in scattering directionality is the largest in the visible part of the spectrum (Figure 2). This directional variation in pine needle optical properties has also been shown to have implications on interpreting remote sensing signals [56].

2.6. Drivers of Spectral Variability in Needle Spectra

The main drivers of the spectral variability in needle spectra are biochemical and structural properties of needles [57,58], which vary between and within tree species. These properties are influenced by many factors, such as species, site conditions, altitude, tree and needle age, forest structure, and adaptation of needles to various light regimes.
Spectral properties of needles in the VIS region are dominated by strong absorption of plant pigments (chlorophylls a and b, carotenoids, and anthocyanins), resulting in low reflectance and transmittance. The NIR region is characterized by low absorption caused mainly by water, and to lesser extent, by the presence of structural carbohydrates such as lignin and cellulose, resulting in high needle reflectance and transmittance. The SWIR region, on the other hand, is characterized by strong absorption of water that masks absorption features of other leaf constituents (lignin, cellulose, proteins, starch), thus resulting in lower reflectance and transmittance.
Intraspecific variability in needle chlorophyll (Chl) and carotenoid (Car) contents and other constituents (e.g., cellulose and lignin) is demonstrated here using three coniferous species included in the LOPEX93 database [16] (Table 2), and has been further reported by other studies [29,59]. Interspecific variability in needle chlorophyll content is caused by needle aging: chlorophyll content of the current-year needles increases during the growing season compared to older needles, which have stable chlorophyll content (e.g., [60]). Older and shade-adapted needles typically exhibit higher chlorophyll content as demonstrated for Sitka spruce [17] or Norway spruce (Table 3 and [61]).
Chlorophyll (and other pigments) can be expressed per dry or fresh mass weight, or per leaf area (total or projected leaf area). Most coniferous species have non-flat needles, and thus, the ratio between the total-to-projected leaf area varies between species, as well as within individual tree crowns, as adaptation to different incident light levels [46,61]. The shaded needles are flatter, which improves their light harvesting efficiency [46]. Thus, different expressions of leaf chlorophyll (per mass or area basis) might show different patterns and gradients with respect to needle age and illumination conditions, and must be interpreted and cross-compared with care [46,61]. As shown in the example of the within-species variability of Norway spruce biochemical properties (Table 3), pigments per mass weight show stronger differences between needles of different age and light exposures than the equivalent expressed per hemisurface leaf area.
The NIR and SWIR regions are also strongly influenced by leaf inner structure of air–cell interfaces, and outer surface features such as waxes [62]. The leaf inner structure, such as volume of mesophyll cells, differs between tree species [28,63], as well as within species, as observed for e.g., in sun- and shade-adapted needles of Picea abies [64], needles of different age of Picea rubens [28], and between populations of Picea omorika belonging to two different gene pools [65].

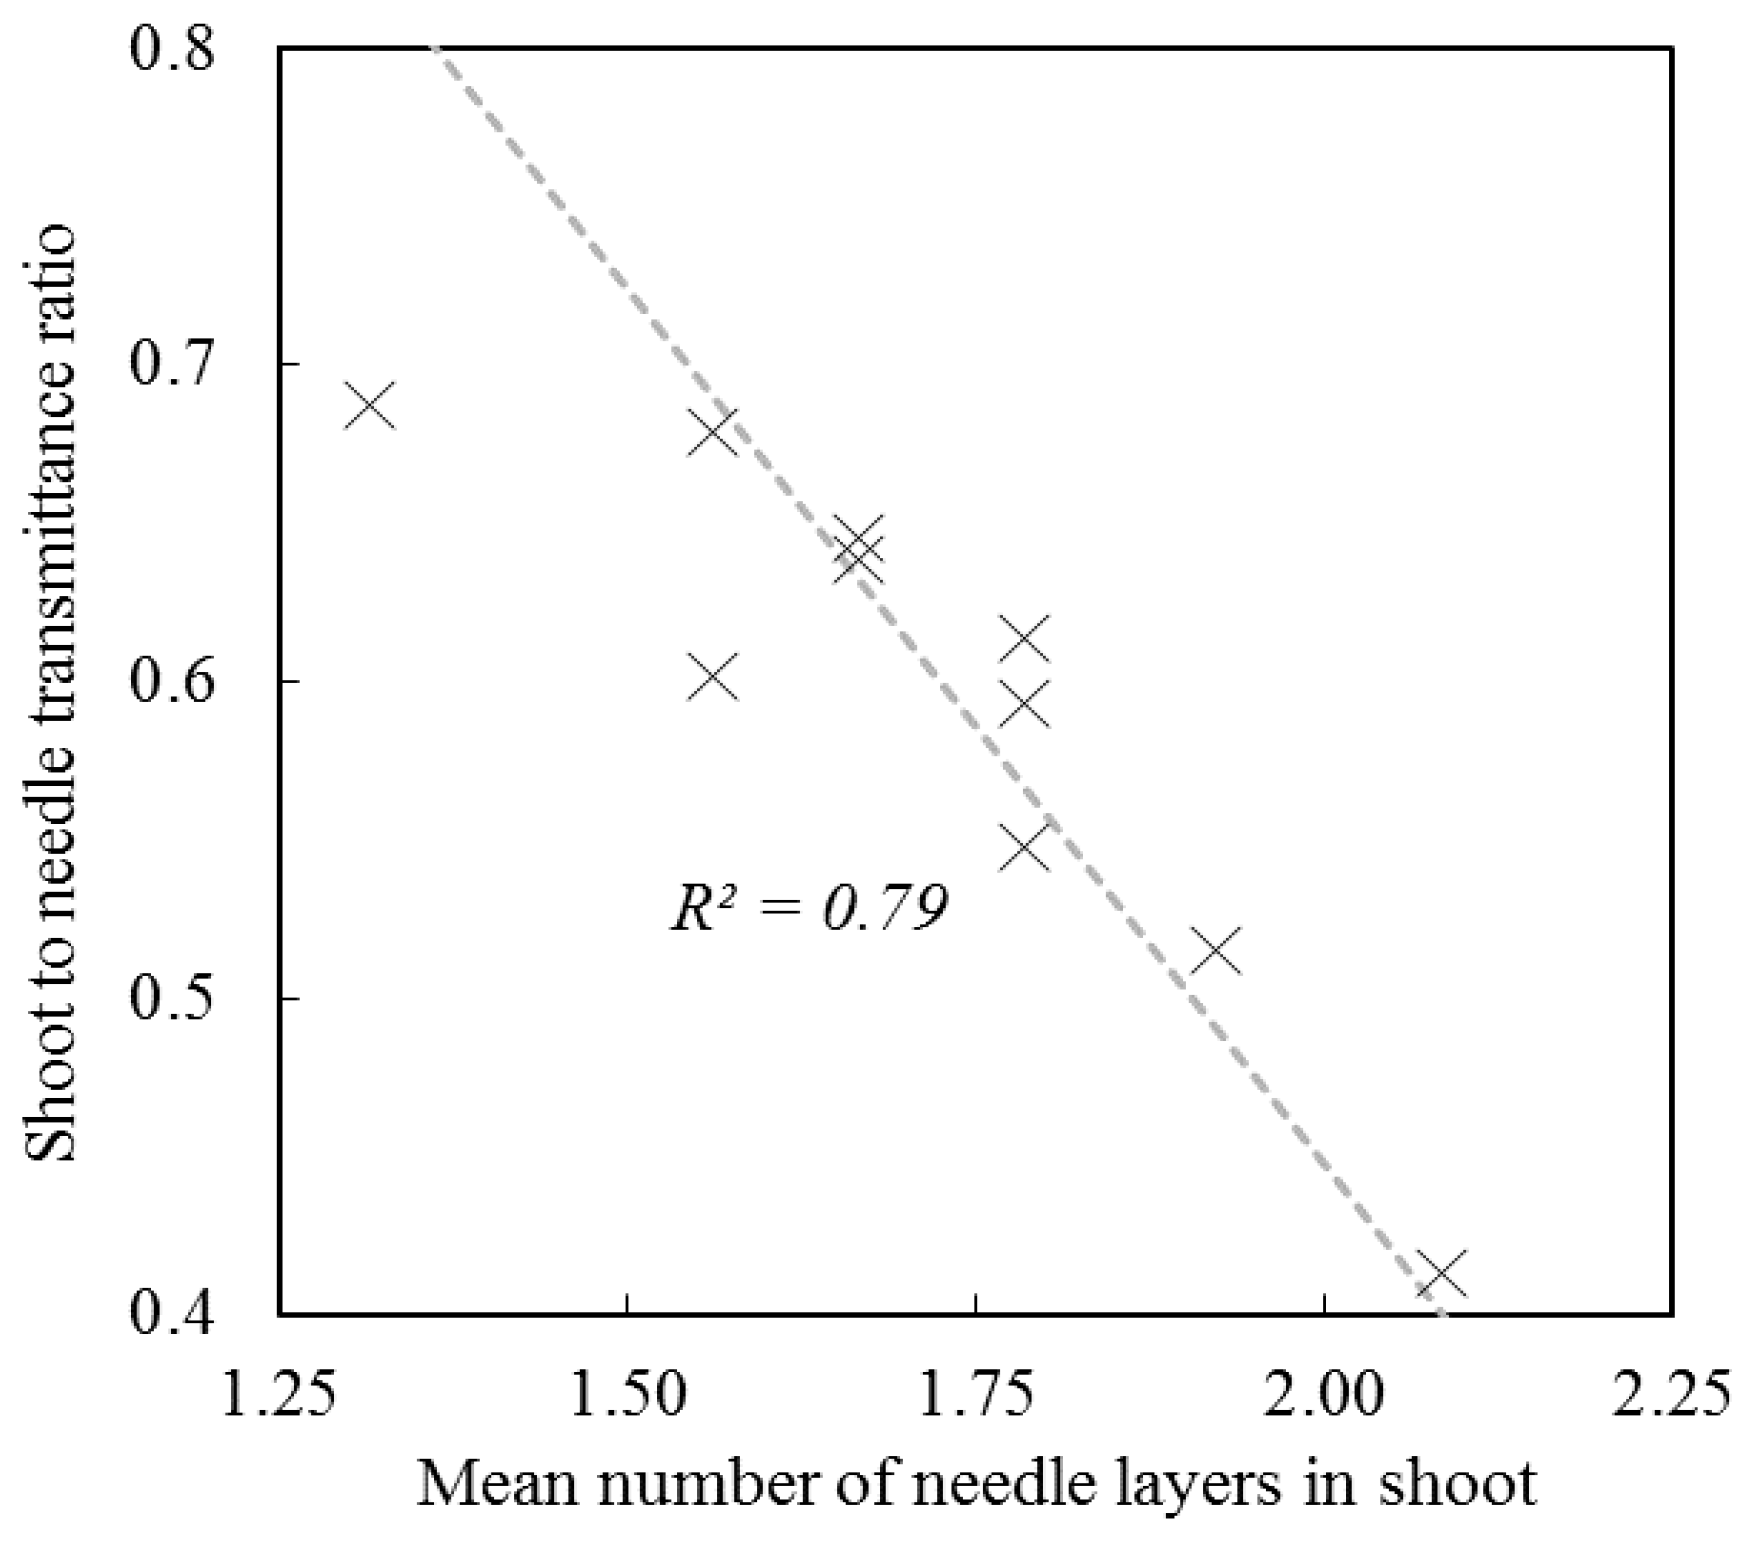
3. Spectral and Directional Optical Properties of Coniferous Shoots

Coniferous needles are usually arranged in spiral structures called shoots. The number of reported measurements of the spectral properties of coniferous shoots is small. Shoot scattering phase functions were measured for the first time in Estonia, for Scots pine, in the 1990s [66,67]. The direction of illumination (relative to shoot axis) was varied, and the scattered radiation in a single plane was measured. Shoots were found to scatter most strongly in the backward directions with very little forward scattering in blue and red; in NIR, the phase function was smoother. Strong scattering peaks, most evident in VIS, were detected for some illumination orientations, and contributed to the specular reflection from needle surfaces. Nearly twenty years later, the scattering phase function of 10 shoots of the same species (Scots pine) from Switzerland were measured, so that the shoots were illuminated from their longest side [68]. The results corroborated the strong backscattering properties of shoots (Figure 3), and an empirical shoot scattering model was proposed, consisting of two wavelength-dependent components: (1) isotropic and (2) Lambertian backscattering. Scattered radiation was measured on a cubature covering 4π, allowing to determine the total spectral scattering and absorption by the shoots. The physical link between the spectral absorptions of the shoot and the needle quantified by the photon recollision probability in the shoot has also been demonstrated [69]. The recollision probability was calculated from the spherically averaged shoot Silhouette to Total Area Ratio (STAR [70]) determined from photographs of the shoots and needles.
It is noteworthy that all reported measurements are directional. The size of the shoots and their 3D nature makes it difficult to measure their absorption using the optical ports of common integrating spheres. However, measuring shoots inside integrating spheres could be a feasible alternative, following the example of for measuring leaves [71]. To our knowledge, the measurements in Switzerland [68,69,72] are the only ones which can been used to scale optical properties between the needle and shoot levels. Despite the small number of measured shoots, the shoot structure had a pronounced effect on its total scattering [69], as well as on scattering directionality.
We can define the average number of needle layers (NNL) in a shoot (a concept similar to the contact number in vegetation canopies) as the ratio of the mean projected area of a needle to that of a shoot. According to the definition of STAR, NNL = 1/(4STAR). This parameter was strongly correlated with ratio of shoot transmittance (TSH) to needle transmittance (TN), TSH/TN in the whole wavelength range used in measurements, 400–2100 nm (R2 = 0.79, Figure 4) in the Scots pine measurements in Switzerland. The structural variation included in the measured dataset affected TSH/TN by a factor of almost two.

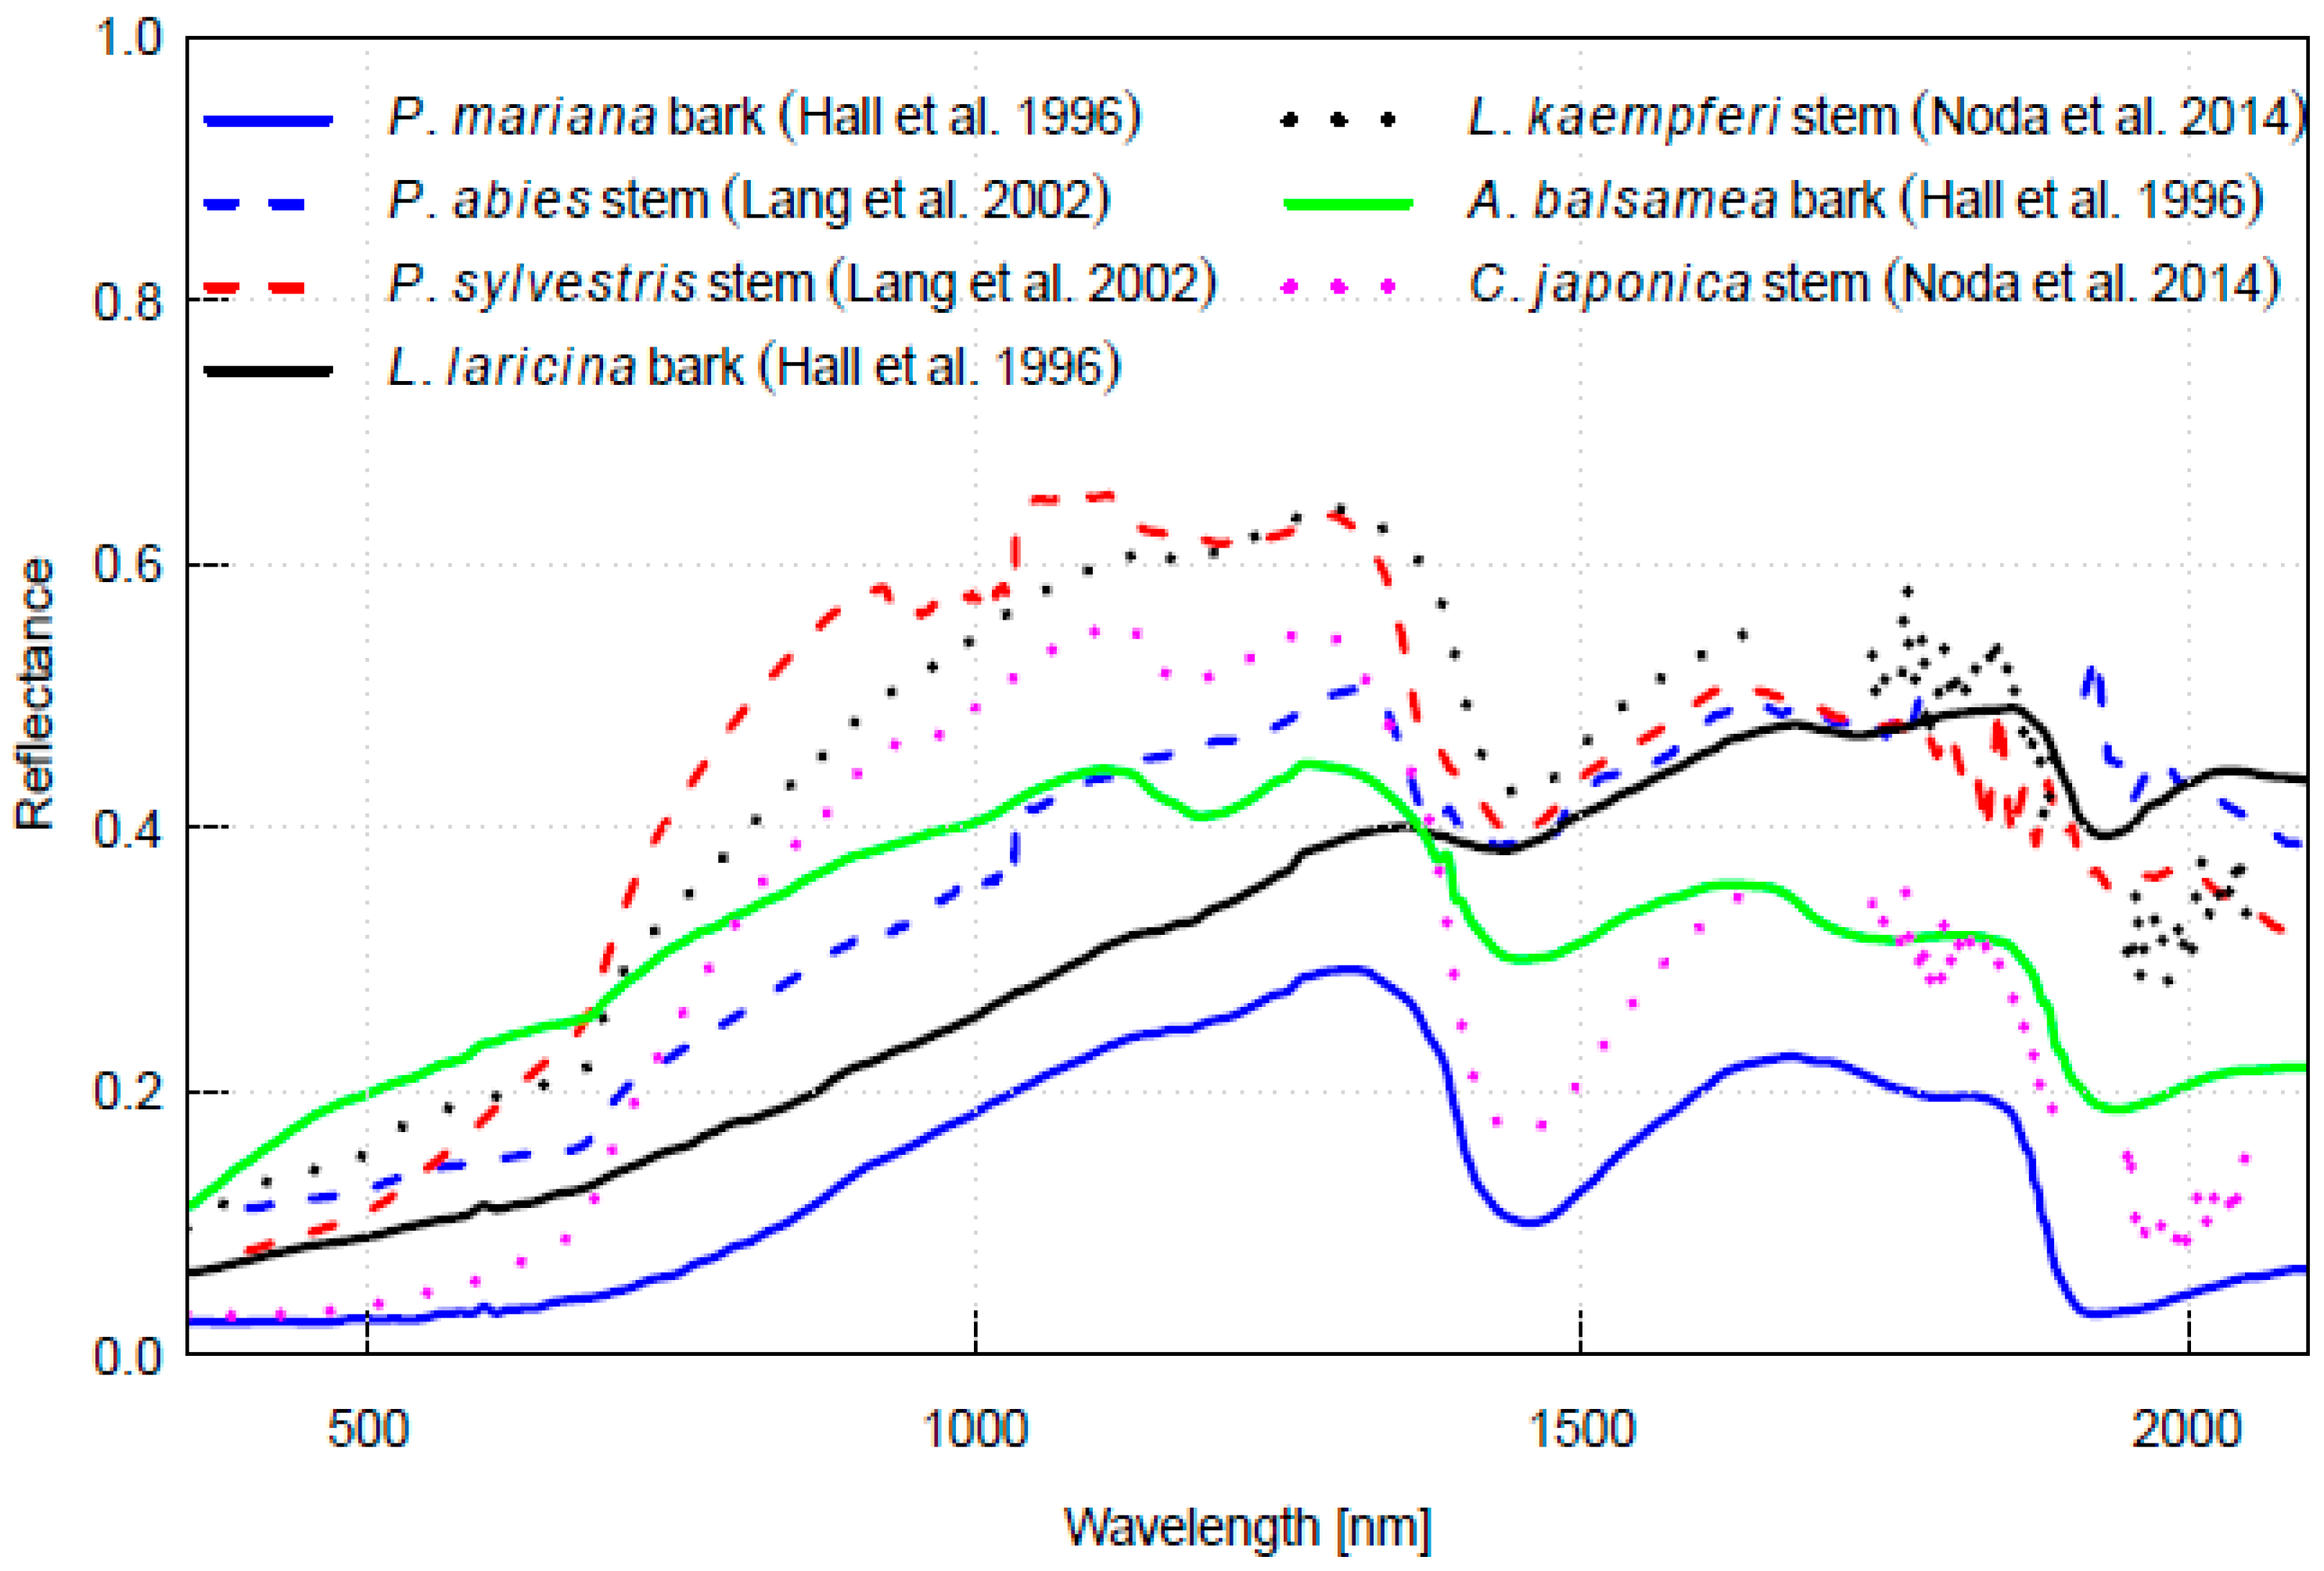
4. Spectral Properties of Woody Parts

Spectral properties of woody parts of coniferous trees have been less studied compared to leaves. Bark spectra are available only for a few coniferous species in public databases (Figure 5, Table 4). Reflectance of bark is highly variable between species, but generally, bark reflectance increases monotonically through visible and NIR [25]. Bark reflectance is therefore similar to reflectance of soil [24]. In the SWIR, water absorption bands are usually observed (Figure 6). In current-year twigs of some species, near-infrared reflectance is high, and there is some chlorophyll absorption seen at approximately 680 nm, but these features become less evident as the twigs become older [24].

5. Spectral Properties of Understory in Coniferous Forests

5.1. Spectral Differences between Understory Types

The understory, or forest floor, of a coniferous forest can vary from nearly bare soil and litter (in e.g., the temperate zone) to a mix of dwarf shrubs, herbaceous species, mosses, and lichens in the boreal zone. There is a correlation, albeit not necessarily strong, between the density of the tree layer (i.e., canopy cover) and abundance of understory vegetation in managed forests [74]. The forest floor can contribute significantly to the reflectance of coniferous forests measured by remote sensors [13,75,76,77,78,79]. As the contribution of forest floor in sparse coniferous stands can easily reach up to 50% of forest total reflectance [12], several approaches for retrieving understory properties from optical satellite data have been developed [80,81,82,83]. All these methods need in situ data to evaluate their performance. In addition, global algorithms for estimation of leaf area index from satellite data (e.g., [84]) utilize a spectral database of “soil” (forest floor) spectra in the inversion of radiative transfer models.
Currently, there are only few publicly open databases containing spectral libraries of different understory types of coniferous forests (e.g., [73]). Nevertheless, in situ measurements of understory layers or plants have been collected and reported in scientific publications by a few research teams in boreal and subarctic coniferous forests in Scandinavia [85,86] and North America [83,87,88], in European hemiboreal forests [89,90], and in larch forests in Siberia [91]. These sites do not cover the full variation in different understory types, nor do most of the datasets cover the SWIR region. There is also a clear bias towards availability of spectral understory data from the boreal region compared to other coniferous forests which are clearly underrepresented in the existing spectral datasets.
The spectra of understory coniferous forests differ considerably (Figure 6A). Stands with bare soil or the ground layer composed of dead plant material (e.g., Yatir, Bílý Kříž) are characterized by the brightest values in the visible, and little contrast with the NIR part of the spectrum. Sodankylä site illustrates the case of forest floor spectra dominated by lichens. Värriö and Lettosuo sites have spectrally similar understory spectra, yet their forest floor conditions are different: at Värriö the measurements were collected very early into the growing season with pockets of snow still on the ground, while Lettosuo stand has been partly clearcut, with exposed bare soil and wood debris left of the ground. Differences between other, more fertile sites can be then observed mainly in the NIR part of the spectrum, driven mainly by the site fertility and moisture conditions.

5.2. Seasonal Variation in Understory Spectra

Seasonal variation in understory spectra may play a major role in remote sensing of regional and global phenological events. The relative contributions of the understory and tree layers to coniferous forest reflectance may change during a growing season [12]. If the seasonal cycles of the tree canopy and understory spectra differ from each other considerably, the greening of the forest floor vegetation out of sync with the tree canopy may interfere with interpreting common phenological metrics from optical satellite images.
Already the first studies on the seasonal dynamics of understory reflectance in coniferous forests of the Boreal Ecosystem-Atmospheric Study (BOREAS) two decades ago in North America showed that spectral differences between understory types become more significant as the growing season progresses [88]. More recently, detailed studies in European forests have further confirmed that understory layers in boreal and hemiboreal coniferous forests have strong seasonal dynamics during their snow-free period, and that the seasonal courses of understory reflectance are most likely also specific to forest site fertility type [85,90]. Typically, the spectral differences both between and within hemiboreal and boreal understory types are the largest at the peak growing season, whereas in the beginning and end of the growing season, the differences between understory types are rather marginal [85,90].
Overall, the current understanding of the seasonal variation in understory spectra is very limited, and there are no published datasets on the seasonality of spectra for most of the coniferous forest types with large spatial coverage (e.g., temperate forests). Most of the existing boreal datasets also do not cover the SWIR region which is potentially of high interest due to e.g., the changing moisture content of forest floor during a growing period. In addition, studies showing how different phenological phases of the understory, such as flowering and ripe berries of dwarf shrubs, affect the understory spectra are currently also almost completely missing [92].

5.3. Spatial and Directional Variation in Understory Spectra

Understories are not homogeneous, and their spectra tend to show very high spatial variability due to their patchiness, large species variation, and structural complexity of ground vegetation. Figure 6B illustrates this with the understory spectra collected every 2 m along a 100 m long transect at a drained dwarf-shrub pine bog at Kalevansuo, Finland [93]. The signal variation reflects the spatially changing understory, which may vary from green, lush Vaccinium bushes, peat- and forest-mosses, to dead grass and ground patches covered with dead needles.
The directional signatures or the bidirectional reflectance distribution functions (BRDF) of the forest background may be sometimes needed as well [94]. In the case of strong angular anisotropy of the understory layer, more detailed knowledge on understory BRDF can be expected to improve, for example, radiative transfer simulations for a forest. Directional features of forest floor vegetation of boreal coniferous forests can be significant and non-Lambertian, more striking at larger solar zenith angles than at smaller ones [95]. All targets in the cited study showed some signs of backscattering enhancement—heather and lichen the strongest, moss the weakest. Lingonberry and blueberry also scattered relatively strongly forward. The BRDF may also depend strongly on the wavelength [95]. Importantly, measuring properties of single understory species is not necessarily useful for remote sensing applications [95], because a remote sensing signal is a mixture of many species.

5.4. Drivers of Spectral Variability in Understory Spectra

A logical phase in creating an ideal spectral library of coniferous forests’ understories should be linking the spectral in situ data to a detailed description of both vegetation and non-vegetation constituents, as well as the season, since understory is highly variable with the time of the year. To date, only a few studies have been conducted to identify the biochemical or structural drivers of spectral variability in understory vegetation. In hemiboreal forests, the biochemical descriptors (such as water content, chlorophyll content, and dry biomass) that could be coupled with spectral properties of the understory vegetation, have been identified [96]. On the other hand, the general sensitivity of understory reflectance to leaf biochemical variables in at least hemiboreal forests has been shown to be relatively weak [89]. Besides biochemical properties of the understory layer, other factors have been used to explain spectral variation in forest floor vegetation. For example, the team of [97] studied several species occurring in the tundra (similar to the species abundant in large parts of the coniferous boreal zone), and successfully linked spectral in situ measurements to estimates of fractional cover of major plant functional types. Similar studies also showed an existing, albeit weak correlation between plant fractional cover and spectral properties of boreal and hemiboreal understory vegetation [85,90].

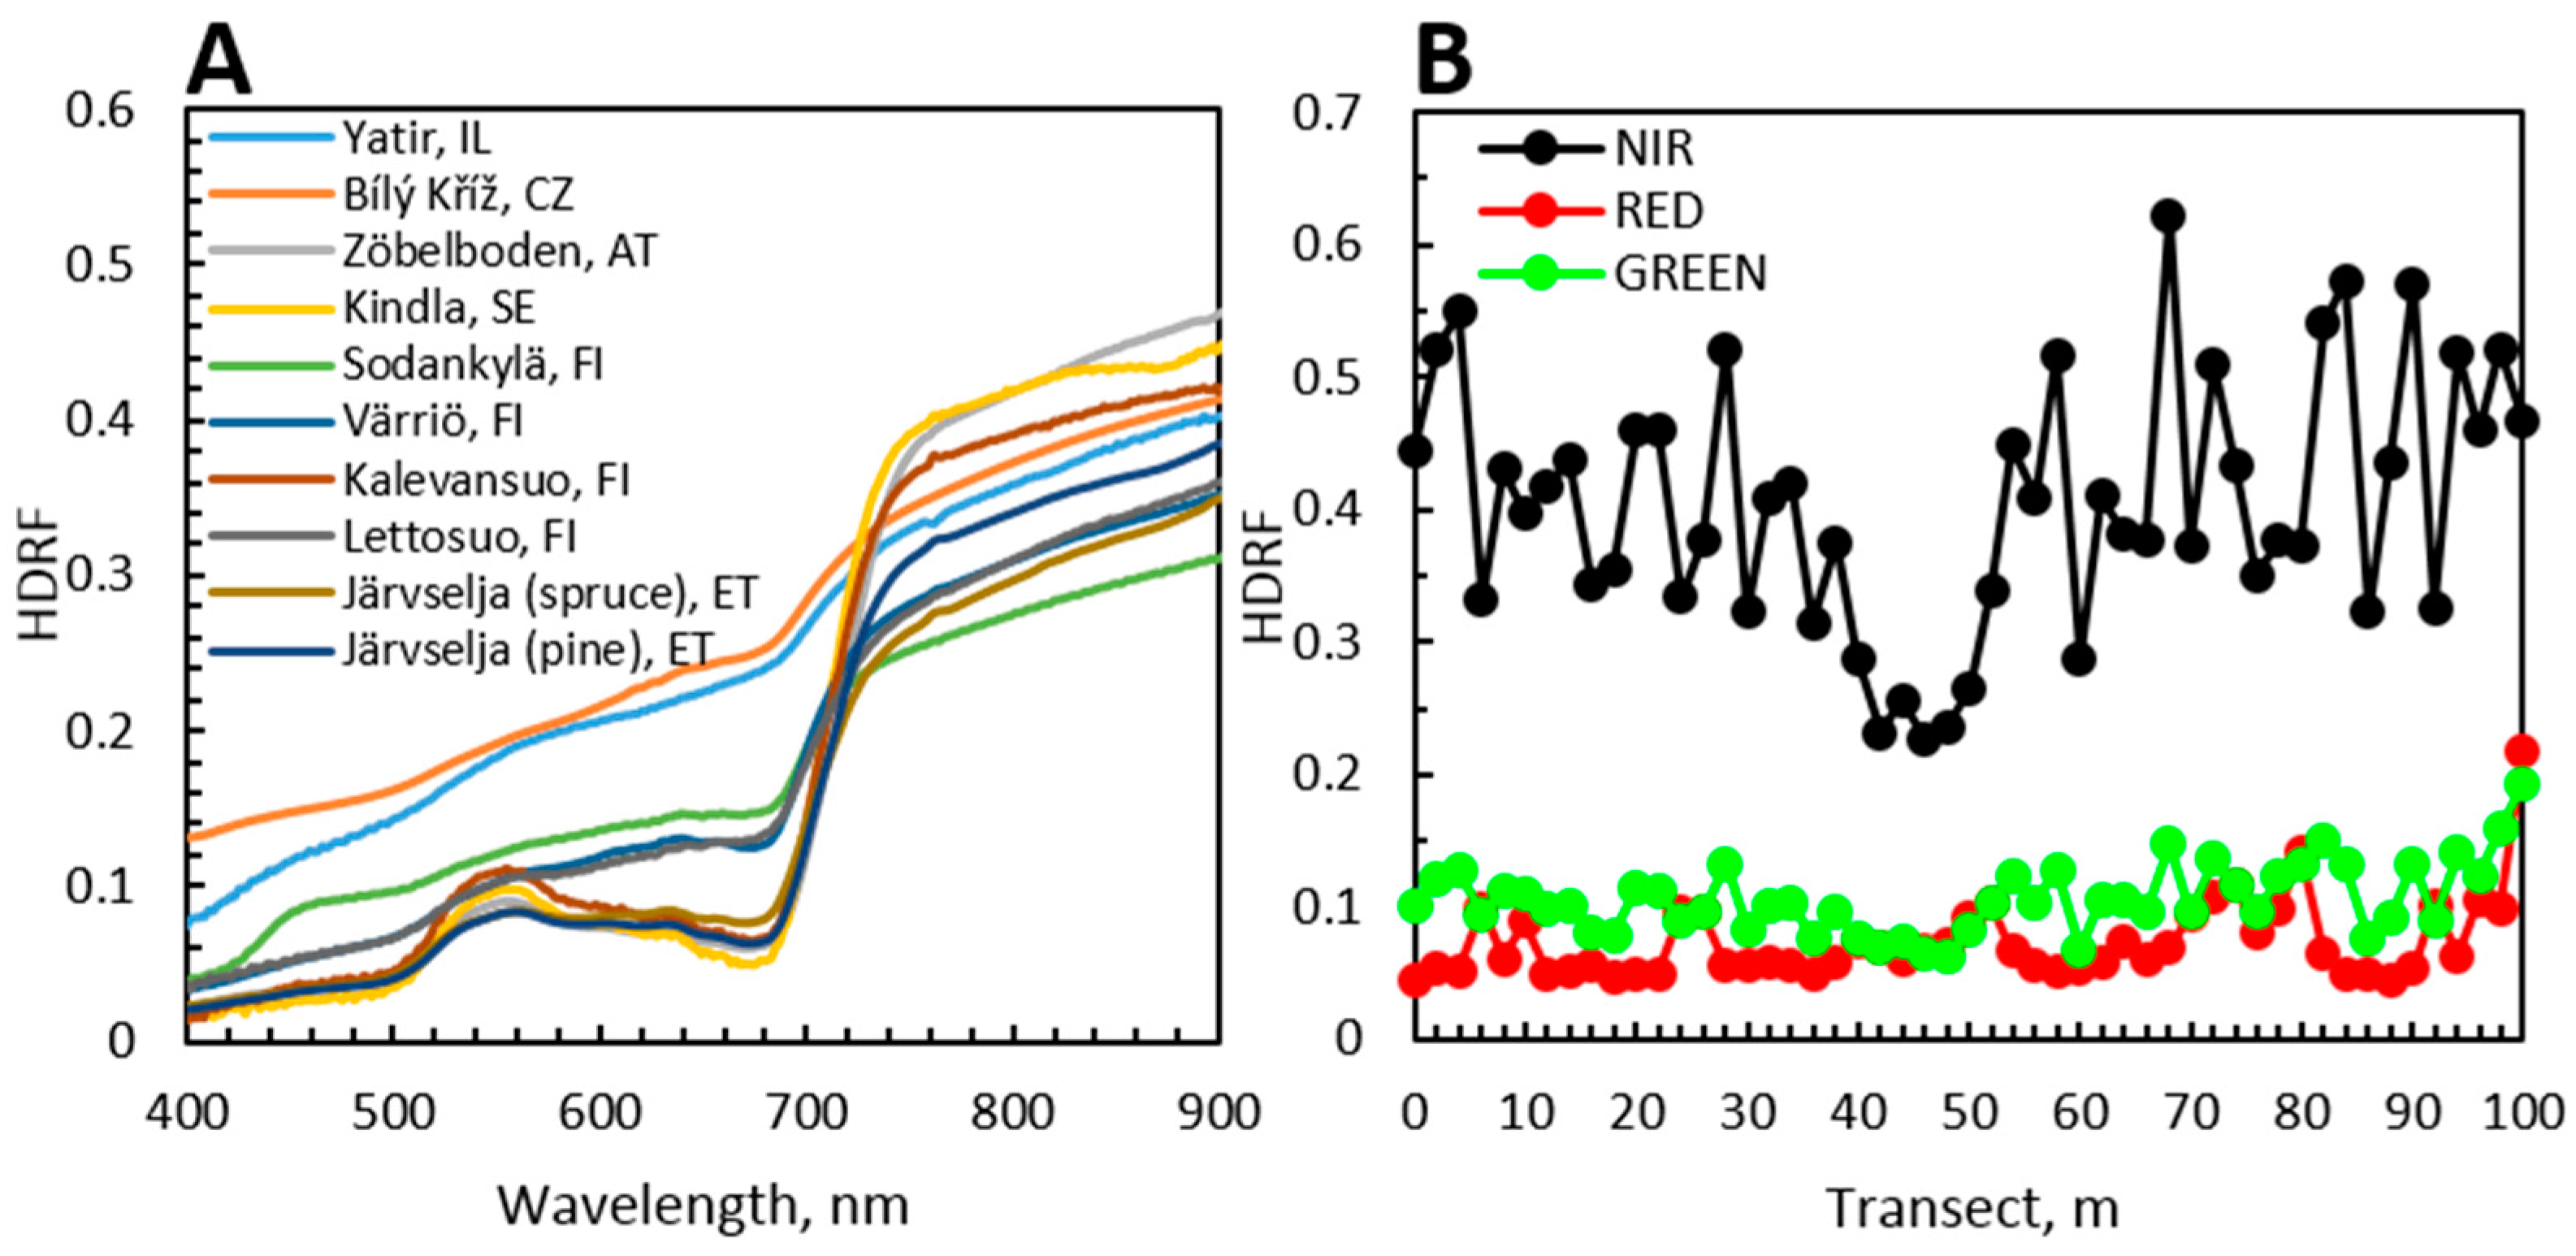
6. Case Studies: Spectra of Coniferous Canopies

6.1. Introduction to Case Studies

The previous sections have reviewed the spectral properties of different elements forming coniferous forests. In this section, we pool all these elements together, and provide selected examples of canopy-level spectra of coniferous forests. We use empirical case studies to illustrate the influence of spatial scale (Section 6.2), viewing angle (Section 6.3), and growing season phase (Section 6.4) on the reflectance spectra of Scots pine and Norway spruce forests.

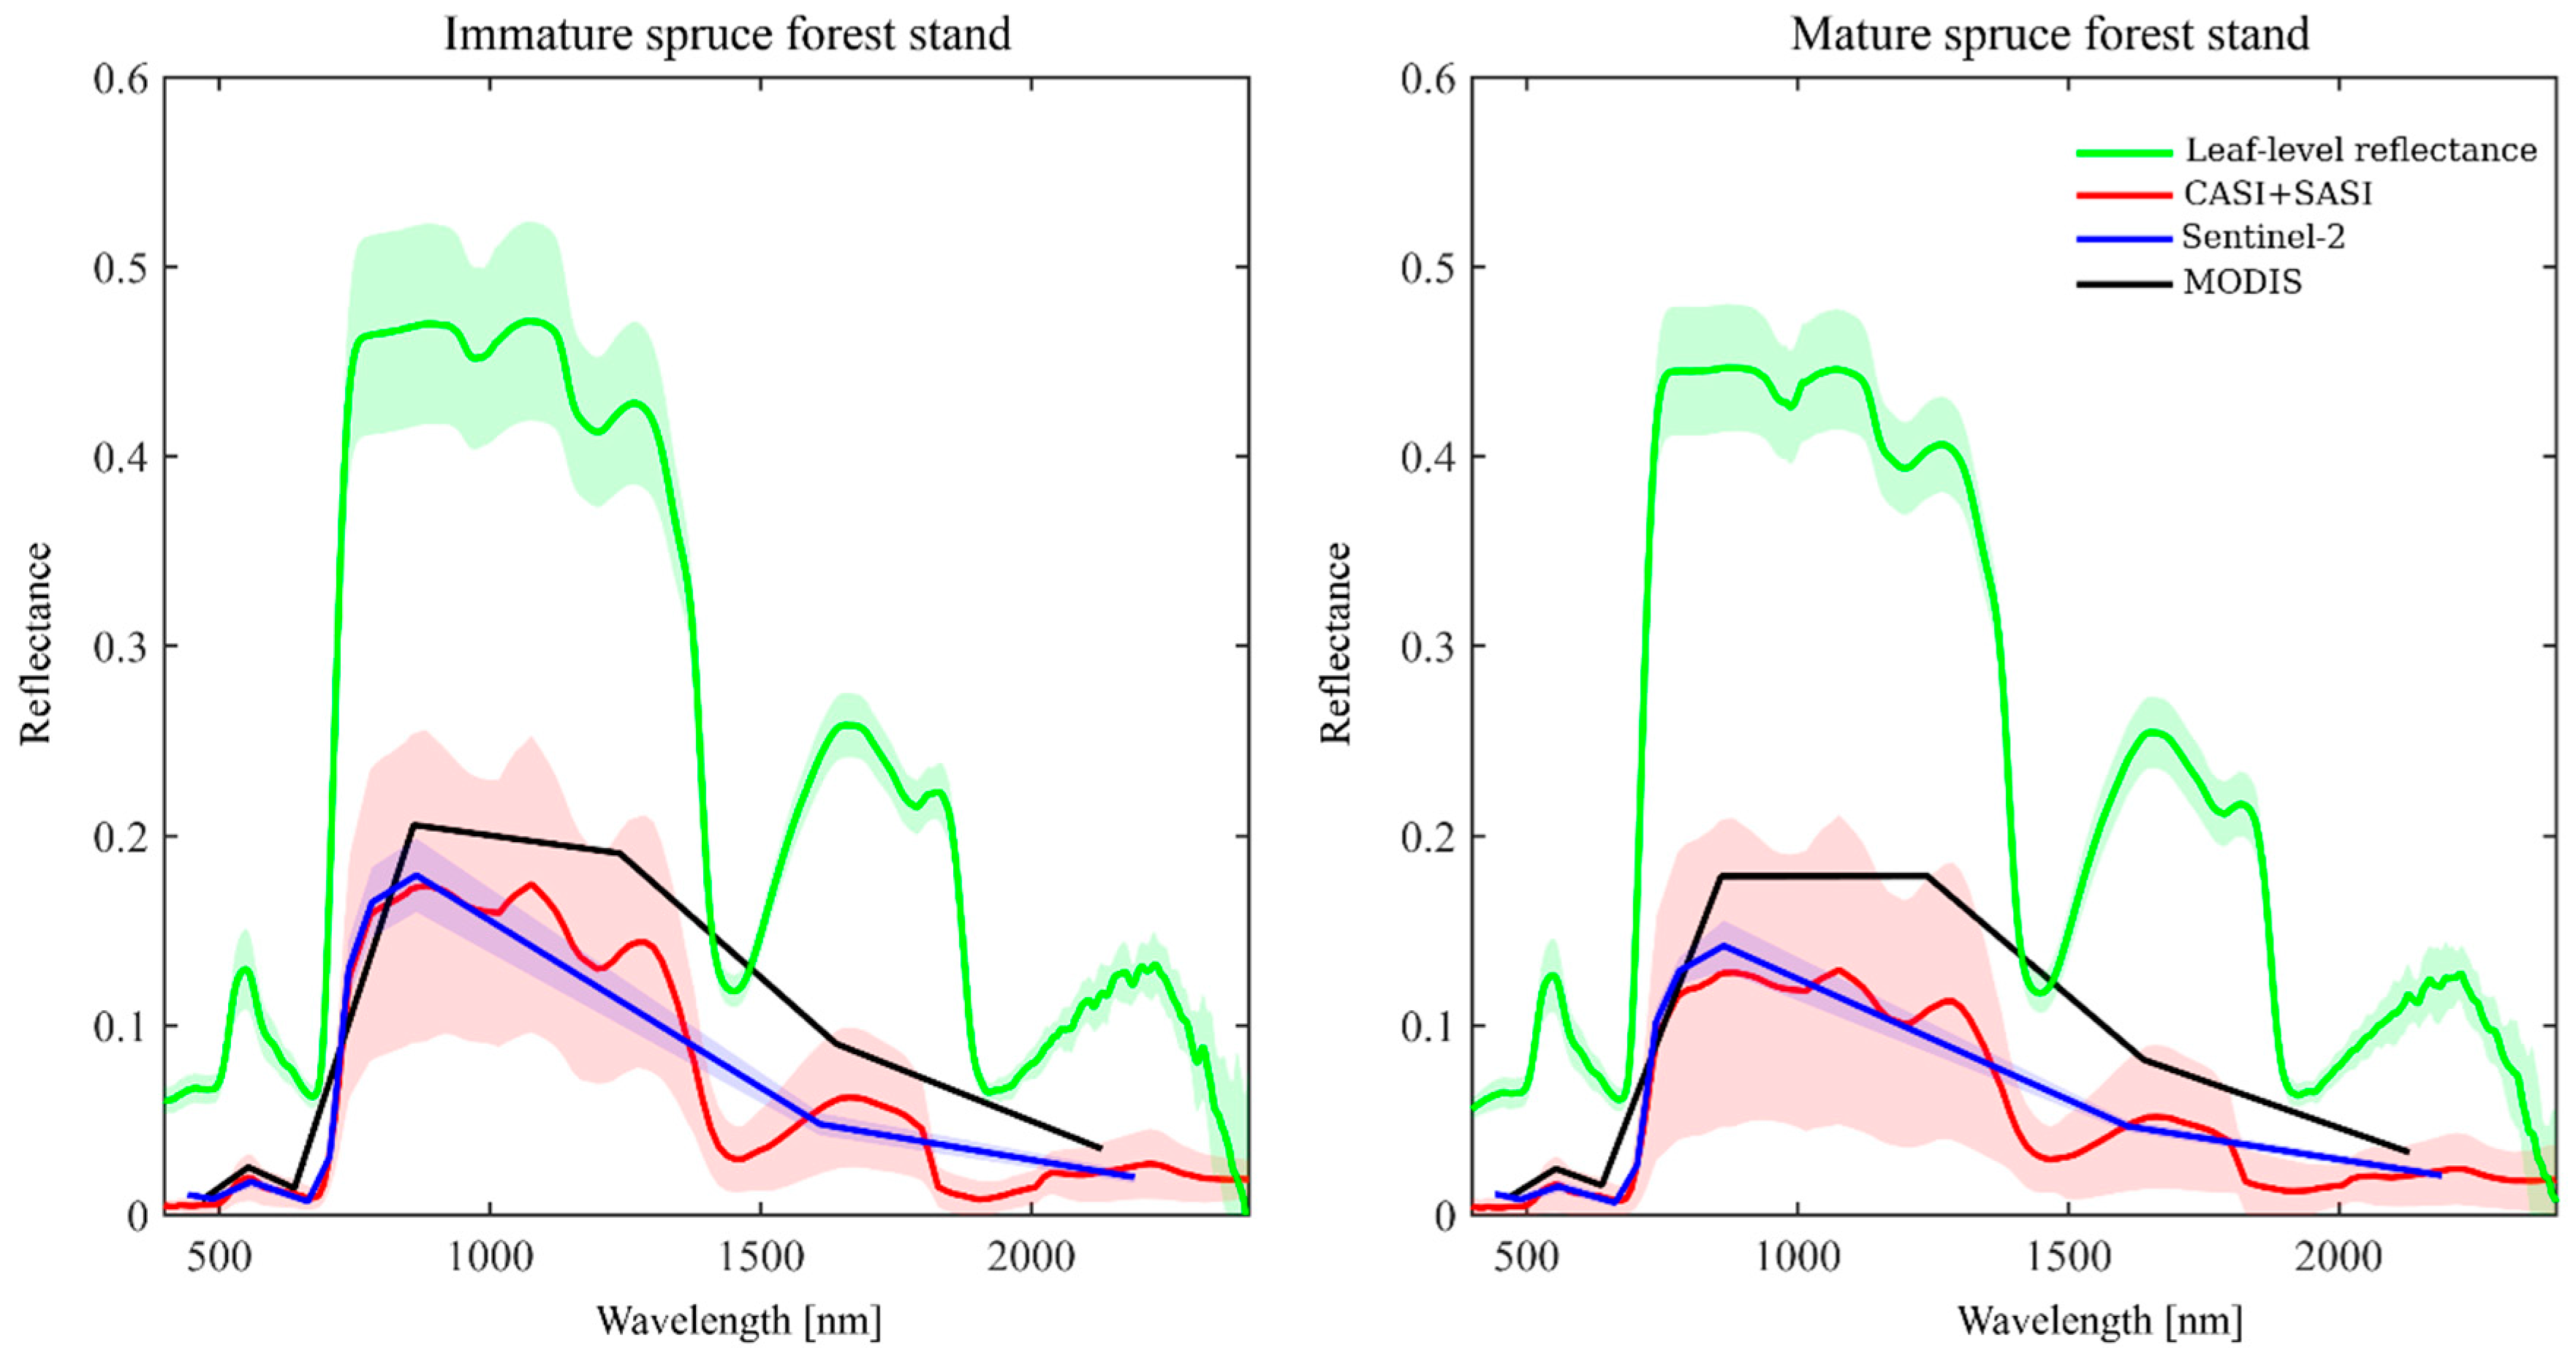
6.2. Nested Scales of Spectra of Coniferous Canopies

The reflectance spectra of coniferous forests vary with the spatial resolution of the remotely sensed dataset. When using airborne hyperspectral data and high-spatial resolution satellite multispectral data (such as Sentinel-2), the reflected signal originates from tree- or stand-level scales, whereas when using coarse resolution data (such as MODIS data), it originates from a landscape or ecosystem scale. Here, we present a case study to demonstrate the nested scales of coniferous spectra from leaf to canopy scales at multiple spatial resolutions. The study area comprises two Norway spruce dominated stands: 40-year-old (“immature stand”) and an over 80-year-old stand (“mature stand”) located in the Czech Republic. Four remote sensing data sources on coniferous forest spectra are visualized for the exact same study site and time period (in late summer 2016): (1) needle-level measurements of reflectance measured by a field spectroradiometer attached to an integrating sphere; (2) very high spatial and spectral airborne hyperspectral data (SASI+CASI, spatial resolution 2.5 m); (3) high resolution satellite multispectral data (Sentinel-2, spatial resolution 20 m); and (4) medium resolution multispectral satellite data (MODIS MCD43 nadir-normalized product, spatial resolution 500 m) (Figure 7). To be able to cross-compare spectral data acquired by different remotely sensed instruments, we used products with close-to-nadir observation. More details on the study sites and data are provided in Appendix B.
The highest spruce reflectance is observed for needle-level measurements with average reflectance in NIR-plateau around 1000 nm between 0.4 and 0.5. In NIR wavelengths, also, the standard deviation of measured needle reflectance is the highest (±0.07 in absolute units), whereas at visible and SWIR wavelengths, the variation is low (±0.01 in absolute units). Both airborne and spaceborne observations of top-of-canopy reflectance exhibit similar magnitudes of reflectances, having an NIR reflectance of 0.12 for mature spruce stand, and 0.18 for immature spruce stand. From the three remote sensing instruments, airborne hyperspectral data of joint CASI and SASI sensors (with the highest spatial resolution) had the highest within-plot variability. By contrast, the stand variability obtained by Sentinel-2 sensor is very low, but the mean reflectances are comparable to airborne data of CASI and SASI, in particular, in the red-edge spectral region. The individual pixels of MODIS nadir-normalized product showed the highest reflectance among the three studied remote sensing instruments, especially in the infrared spectral region. Possible explanations for this phenomenon may be the lower spatial resolution of MODIS, resulting in mixed pixels of reflectances originating from different land cover types and the radiometric calibration of the instruments.
The largest difference between the studied remote sensing datasets is indeed observed between needle-level and canopy/ecosystem-level data. At the needle-level, the main driver of needle reflectance is biochemistry (particularly leaf chlorophyll and water content) and inner leaf structure, specific leaf area being the key needle-level trait describing the allocation of leaf biomass per area. When moving from leaf to canopy scale observations, the additional role of canopy structure and optical properties of various forest elements (e.g., leaves, trunks, branches, understory) is introduced. For closed forest canopies, the canopy structure dominates. Due to the effect of multiple scattering, the light penetrating forest canopies is attenuated upon multiple interactions with canopy elements and mutual shadowing of tree crowns. Crown-level multiple scattering, in contrast to leaf biochemistry, shows no distinctive spectral absorption features, but rather systematically decreases canopy reflectance. This phenomenon is the basis for the spectral invariants theory [98], which links leaf and canopy reflectance via several spectrally invariant parameters describing canopy structure (e.g., photon recollision probability and directional escape factor).
When comparing the two spruce stands, we observe systematically higher reflectance for the immature forest stand compared to the mature one at all spatial scales. At needle-level scale, the higher reflectance can be attributed to different biochemical properties and specific leaf area when compared to mature spruce needles (see Section 2.6 and Appendix B for more details). At canopy level, the higher proportion of first-year needles in canopy and differences in canopy structures (such as high tree density, and thus, less shadowing between the crowns) are possible driving factors of the spectral differences between the stands.

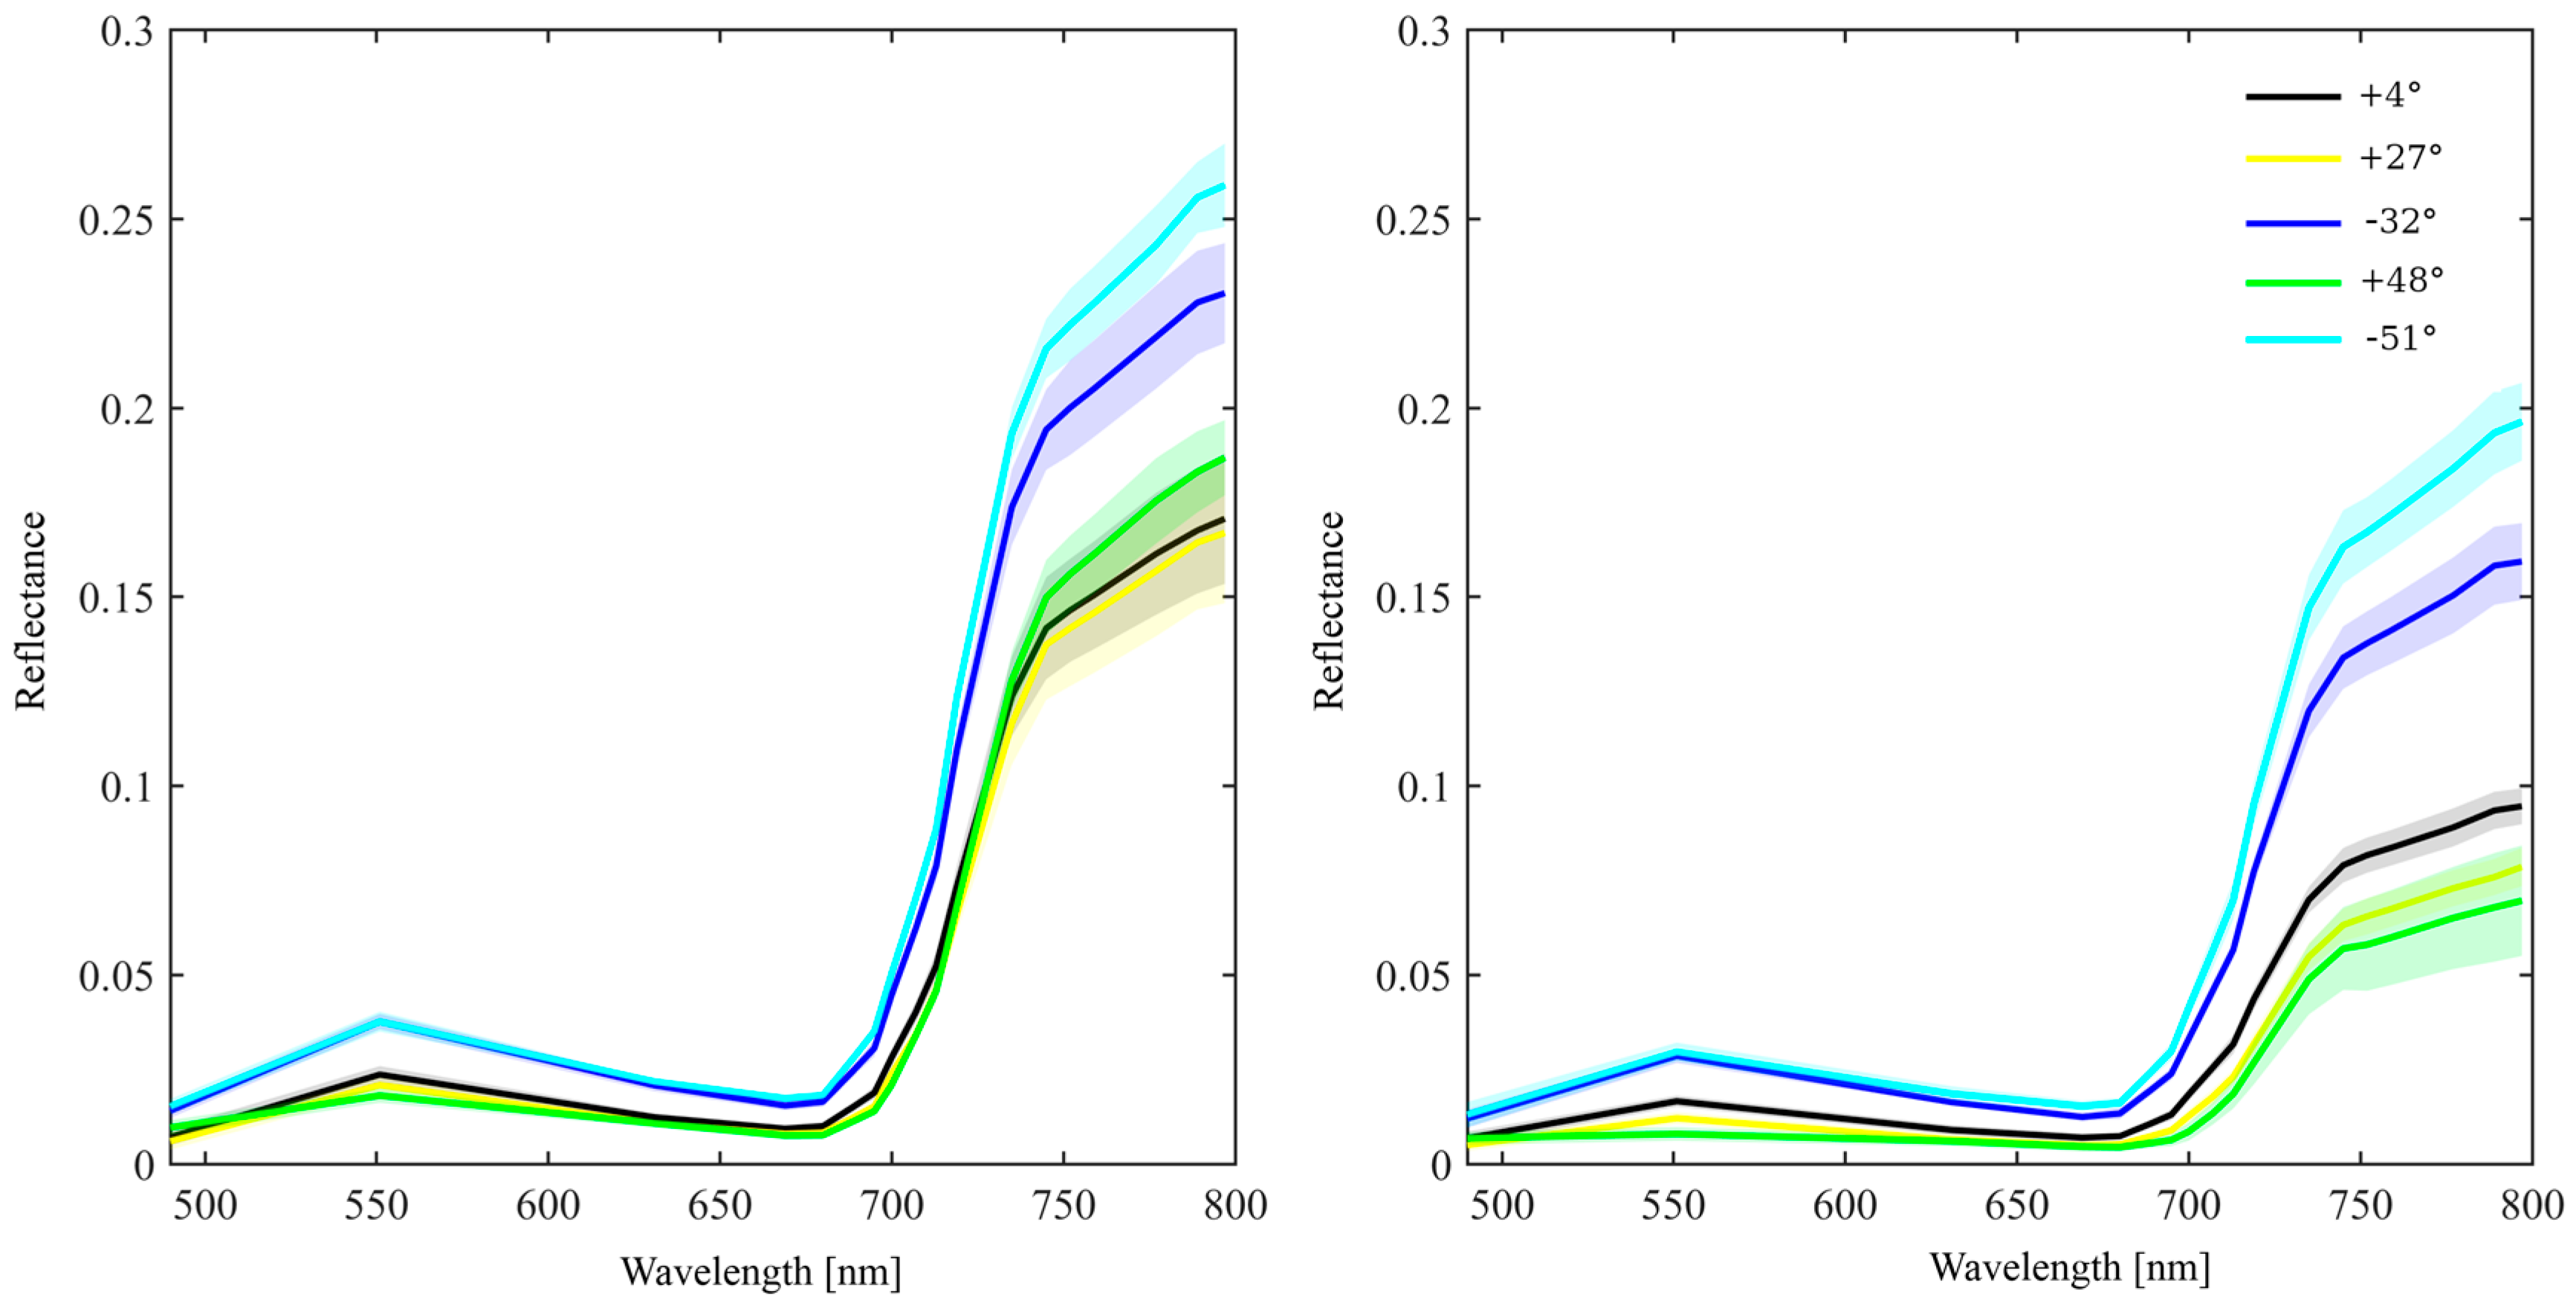
6.3. Angular Variation in Spectra of Coniferous Canopies

The reflectance spectrum of a coniferous forest varies as a function of viewing geometry. Modeling studies (e.g., [99,100]) have analyzed the BRDFs of coniferous forests together with satellite data. However, remote sensing instruments are typically limited to close-to-nadir observation geometries, so only little empirical data are available for validation of multiangular reflectance simulations. Only two spaceborne instruments, the low spatial resolution MISR onboard TERRA platform [101] and the high-spatial resolution CHRIS onboard PROBA-1 platform [102], have a capability of providing near-simultaneously acquired data for a given location at multiple angles. The spatial resolution of the MISR instrument (between 275 m and 1.1 km) is too coarse for stand-level observations, and therefore, data provided by the CHRIS instrument is the only possibility to analyze the angular variation in stand-level reflectance of coniferous canopies from space.
Using the same Norway spruce stands as in the previous section (Section 6.2, Figure 8) but from a different year (fall 2007), we demonstrate the angular variation in coniferous forests’ spectra (Figure 8). Top-of-canopy reflectances were acquired for five different view angles of the CHRIS instrument (actual viewing angles: −51°, −32°, 4°, 27°, 48°, with negative angles denoting backscatter) in 18 different spectral channels, from 400 to 800 nm. Both forest stands exhibit similar angular behavior—their reflectance is the highest for backward-looking observation geometries (reflectance at −51° being higher than reflectance at −32°), whereas forward scattering observation geometries have the lowest reflectances. The magnitude of angular differences was higher for the mature spruce stand; reflectances in the view nadir angle of −51° were on average 1.9 × higher than reflectances in the + 48° viewing angle for the immature and 2.8 × higher for the mature stand. Qualitatively, this can be explained by their different canopy structures: the immature spruce forest has a slightly higher canopy closure than the mature forest. The canopy was also shorter: 34 m in the mature stand, and only 17 m in the immature forest. These factors result in a smaller change in the visible proportions of sunlit and shaded canopy parts (when moving from one viewing angle to another), compared to the more open and taller mature forest.

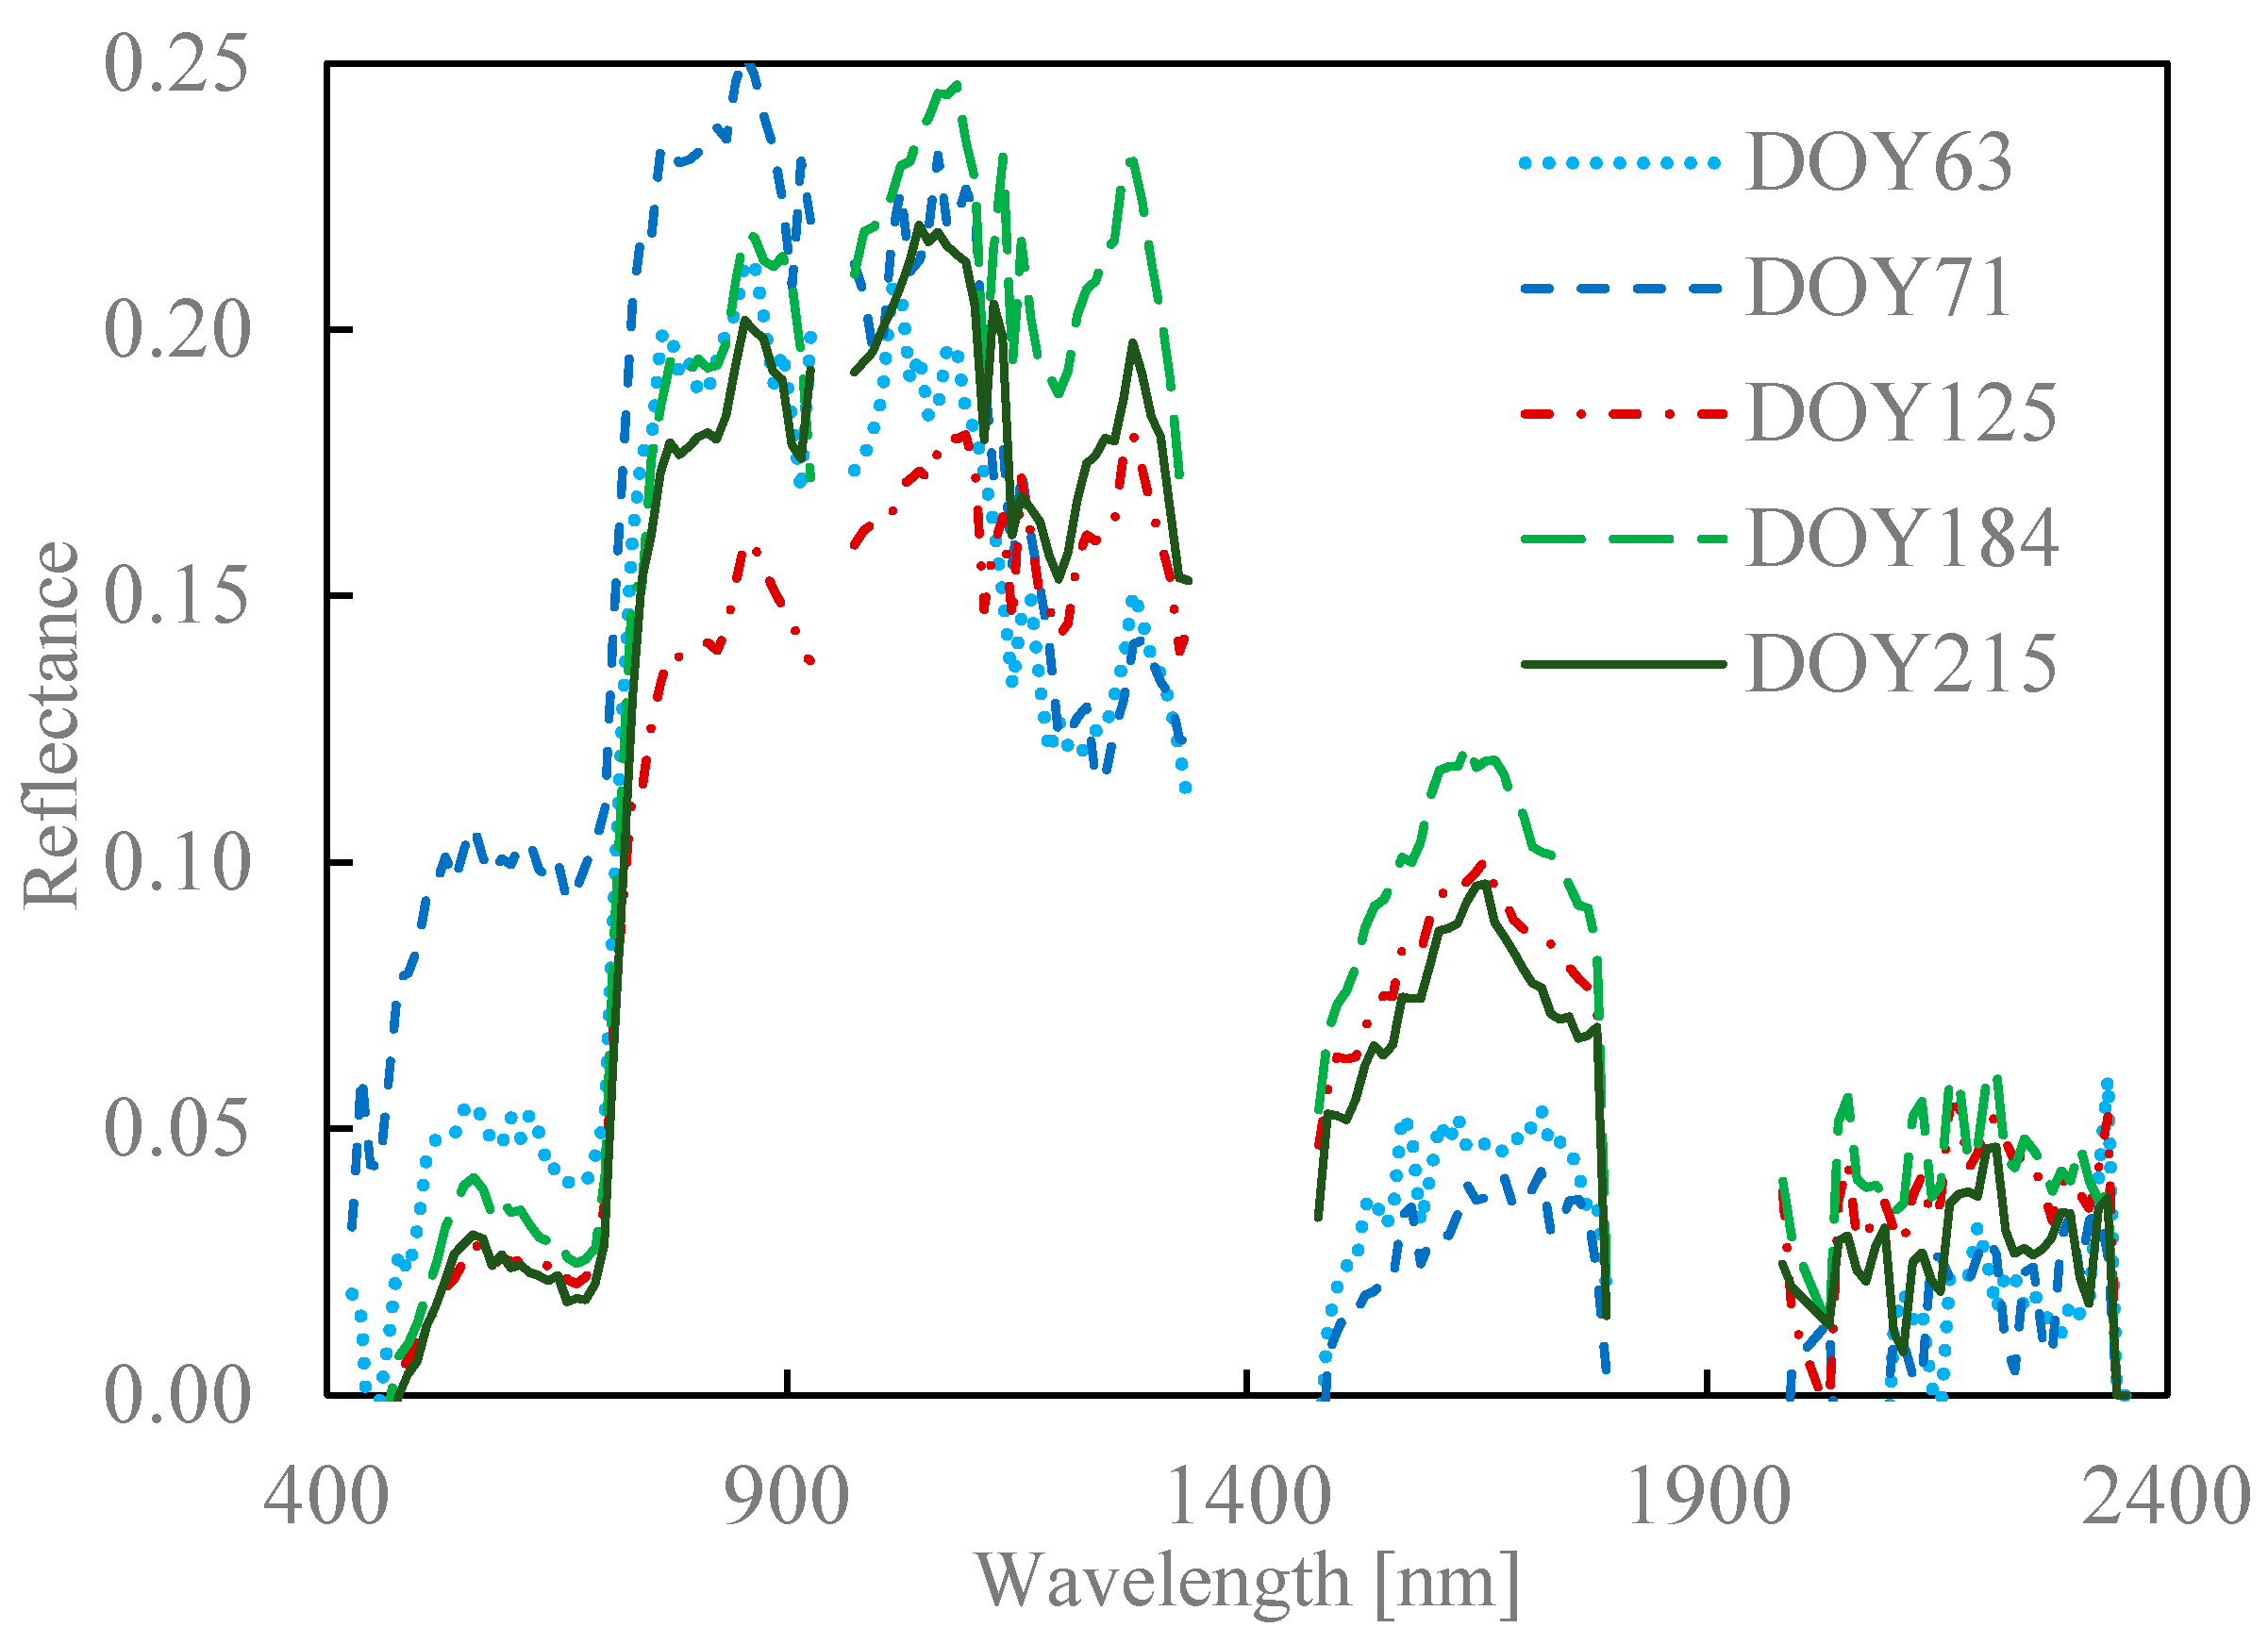
6.4. Seasonal Variation in Spectra of Coniferous Canopies

In addition to spatial and angular variation in reflectance, coniferous forests also exhibit clear seasonal patterns in their spectra. To demonstrate the seasonal variation in spectra of coniferous forests, we selected a pure Scots pine site from Finland. Four pixels covering a total area of 60 m × 60 m from a time series of EO-1 Hyperion spectral imagery corresponding to the area around the SMEAR II flux tower in Hyytiälä, central Finland (61°51′N, 24°18′E) were used to illustrate the seasonality in a coniferous forest’s reflectance (Figure 9). The site is dominated by mature Scots pine trees, with only some scattered birch species and Norway spruce, and has a peak growing season effective overstory LAI of 2.14 (in 2014). Due to the infrequent overpasses of EO-1 and the typical presence of cloud cover in this region, satellite data from 2010 to 2012 were combined.
The time series, arranged in the order of vegetation development, starts on Day Of Year (DOY) 63 (acquisition date 3 March 2012), when snow was present everywhere in the scene. A snowfall took place on the night before the second image from DOY 71 (11 March 2012). The third measurement of the series, DOY 125 (5 May 2010), corresponds to the beginning of the growing season, with no snow in open places and very little snow left in the most shaded areas below the canopy. On DOY 184 (3 July 2010) and DOY 215 (3 August 2011), the canopy and understory layers were fully developed. No significant stress events were detected during these years. The biggest change on the spectrum was caused by the snowfall in the spring, before DOY 71. It increased the reflectance factor by 0.05 in visible and NIR parts of the spectrum (400–900 nm); in SWIR, reflectance decreased by approximately 0.01. The lowest NIR reflectance was recorded for early May, when almost all snow had melted, but the deciduous species and understory vegetation inevitably present in the pixels had not greened up yet. The two midsummer measurements (DOY 184 and 215) show increased NIR reflectance, with values still beyond what was recorded with the presence of snow. The changes in visible and SWIR parts of the spectrum were noticeably low during the snowless season.

7. Conclusions

Despite the fact that coniferous structures are often complex and difficult to measure, a large number of efforts have been made to collect empirical data on coniferous forests’ spectra in Northern and Central Europe and North America. The number of scientific studies especially on the spectral properties of coniferous needles has notably increased during the past decade: based on our literature review, approximately 40% of the studies reporting e.g., needle spectral data have been published after 2010, and 75% of the studies have been published after 2000. We summarized the main points from our literature review as a strengths, weaknesses, opportunities, and threats (SWOT) matrix (Table 5).
Our literature review shows that, in general, the spectral properties of coniferous forests growing in the boreal biome are better documented than the spectral properties of coniferous forests elsewhere. For boreal coniferous forests, there are already a few open access datasets on needle and bark spectra for key species, and one open access dataset on understory spectra. Typically, the spectral data reported in these databases and other scientific articles have been collected during peak growing season. The general behavior of the spectral response of coniferous needles is now much better understood than fifteen years ago. There is a clear gap, however, in knowledge concerning the optical properties of needle and bark of coniferous species growing in the tropics, and also for many species growing in the temperate zone.
Also, some key coniferous species, such as Larix sp., have been rarely measured for their optical properties, even though they cover geographically extensive areas in the boreal zone. Some of the spectral measurements are poorly documented or performed under varying or unfavorable light conditions outdoors, which makes it difficult to compare and use the spectral data collected in different field campaigns. A general limitation is also the narrow wavelength range: many datasets lack the SWIR wavelengths that are critical in interpreting data from new remote sensing instruments. The seasonality of spectra of needles and understory layers in coniferous forests have been measured and published only for a few sites in the boreal zone. Currently, the basic mechanisms influencing the seasonal variations in spectra in the visible domain have been described, yet we do not have a clear understanding of the differences in seasonal courses of different species and understories in different site fertility conditions. There are also very limited studies showing how the spectral properties of needles, bark, and understory vary spatially in different environmental conditions. Sampling strategies have a noteworthy influence on the quality and extent of spectral databases. Thus, it is difficult to make quantitative conclusions about, for example, the inter- and intraspecific variation in needle spectra. From an application point-of-view, we also do not have a clear understanding of which wavelength regions or wavelength combinations could be potentially used to separate coniferous tree species (at needle, tree, or stand levels) or site types (at stand level) from each other, nor have we established universal relationships between spectral and biochemical/structural properties of coniferous elements.
Spectral properties of coniferous shoots, that is, the spectral scattering phase functions of shoots, have been measured only for a very limited set of samples from one species, so far, even though shoot-level clumping is known to significantly influence forest spectra. Future studies should develop faster set-ups for measuring the spectral properties of shoots, and also aim to cover more species, in order to investigate how universal the scaling relationships between needle- and shoot-level spectra actually are. Similarly, the directionality of spectral scattering of larger coniferous elements (from whorls to entire trees) should be investigated, although creating the measurement set-up for the experiments can be challenging.
Future technologies will offer possibilities for increasing the understanding of spectral signatures of conifers. For example, further development of multiangular measurements—using goniometers, and air- and satellite-borne sensors—will add to our comprehension of directionality of reflectance data, and how it can be used to monitor coniferous forests and their understory layers. Also, very high spectral resolution data, such as fluorescence measurements, may open up new insights to understanding physiological processes of conifers. Nevertheless, spectral in situ measurements will remain very labor intensive: extensive campaigns to cover intra- and interspecies variability will be challenging to plan also in future, and accounting for physiological status of needles will often be difficult in spectral data collection. Hopefully, however, the measurement techniques will become faster.

Acknowledgments

M.R., A.H., M.M. were supported by the Academy of Finland (grants: 13286390 and 266152). J.P. was supported by the Estonian Research Council grant PUT1355 and Mobilitas Pluss MOBERC-11. P.L. and L.H. were supported by the Ministry of Education, Youth and Sports of CR within the National Sustainability Program I (NPU I), grant number LO1415. P.L. was also supported by the Czech Science Foundation through Project No. GJ17-05608Y. L.H. was also supported by the Czech Science Foundation grant No. 17-05743S. Hyperion EO-1 data were made available courtesy of USA Geological Survey. We thank the reviewers for the time they invested into the review of our manuscript.

Author Contributions

M.R., P.L. and M.M. conceived the idea and planned the structure of the article; M.R., P.L., L.H., A.H., J.P. and M.M. wrote the paper.

Conflicts of Interest

The authors declare no conflict of interest.

Appendix A

Table A1. A summary of publications that report measurements of coniferous needle spectra. The references are in chronological order: the oldest dataset (from 1965) is first and the most recent dataset (from 2017) is last in the table.
DatasetRegionBiomenmGeom. 1R or T 2Species
[14]--VIS/NIR 3ISRPinus strobus, Thuja occidentalis
[15]--400–1100ISRPinus resinosa
[50]ON, CanadaTemperateVIS/NIR 3BFRAbies balsamea, Pinus sylvestris, Thuja occidentalis
[24]VT, USATemperate400–1100ISR, TPicea abies, Pinus resinosa, Pinus strobus
[28]ME, USATemperate400–1100ISR, TPicea rubens, Tsuga canadensis
[34]SK, CanadaBoreal400–1000ISR, TPicea mariana, Pinus banksiana
[29]SK, CanadaBoreal400–1000ISR, TPicea glauca, Picea mariana, Pinus banksiana
[104]MS & KS, USATemperate400–850ISR, TPinus palustris
[21]NH, USATemperate306–1138NCRAbies balsamea, Picea rubens
[17]UKTemperate400–2500BFRPicea sitchensis
[32]AK, USABoreal306–1138NCRPicea glauca, Picea mariana
[26]WA, USATemperate200–2350ISR, TPseudotsuga menziesii, Thuja plicata, Tsuga heterophylla
[105]ON, CanadaBoreal400–800ISR, TPinus banksiana
[18]AustraliaTemperate350–1100BFRPinus radiata
[106]NM, USATemperate350–2500ISRJuniperus monosperma, Pinus edulis
[107]Czech RepublicTemperate450–1000ISR, TPicea abies
[48]Czech RepublicTemperate350–1000BFR, TPicea abies
[108]SwedenBoreal400–1000ISR, TPicea abies
[60]ON, CanadaBoreal350–1050ISR, TPinus banksiana
[109]ON, CanadaBoreal350–2500ISR, TPicea mariana
[110]CA, USATemperate400–800ISR, TPinus jefferyi
[111]EstoniaTemperate400–1050ISRPicea abies, Pinus sylvestris
[30]NW, USA; MB, CanadaTemperate/boreal400–1000 4NCRPinus banksiana, Pinus ponderosa, Pseudotsuga menziesii, Tsuga heterophylla
[22]SpainMediterr.306–1138NCRPinus sylvestris
[69]SwitzerlandTemperate400–1800ISR, TPinus sylvestris
[112]ON, CanadaTemperate400–900 4ISR, TPicea mariana, Pinus banksiana
[113]FinlandBoreal400–900BFRPinus sylvestris
[19]Czech RepublicTemperate350–2500CBRPinus sylvestris
[20]FinlandBoreal325–1075CBRPinus sylvestris
[31]SloveniaTemperate250–880ISRAbies alba, Picea abies, Picea omorika, Pinus sylvestris
[51]AB, CanadaBoreal400–900NCRPicea glauca, Pinus contorta, Pinus ponderosa
[52]AB, CanadaBoreal400–900NCRPinus contorta 5
[114]FinlandBoreal325–1075IS/CBR, TPicea pungens, Pinus sylvestris
[115]Czech RepublicTemperate350–2500IS/CBRPicea abies
[33]CA, USATemperate/mediterr.350–2500ISRAbies concolor, Abies magnifica, Calocedrus decurrens, Pinus jeffreyi, Pinus lambertiana, Pinus ponderosa, Pinus sabiniana
[47]FinlandBoreal400–900 4CBRPicea abies, Pinus sylvestris
[23]FinlandBoreal400–1100NCRPinus sylvestris
1 IS = integrating sphere: sample containing several needles (with or without gaps) attached to the port of the integrating sphere (directional-hemispherical reflectance/transmittance factor), NC = needle clip: individual needles measured in hotspot geometry (bidirectional reflectance factor), CB = contact probe: mats or stacks of needles measured in hotspot geometry (bidirectional reflectance factor), BF = bare optical fiber or optical head of spectrometer pointed at a mat or stack of needles illuminated with external light source (bidirectional reflectance factor), NA = not described. 2 R = reflectance, T = transmittance. 3 Wavelengths not given numerically. 4 Exact wavelengths not given. Wavelengths deduced from figures shown in the articles. 5 The same measurements as described in [51].

Appendix B

Appendix B.1. Data Description

Section 2.3, Section 2.6, Section 6.2 and Section 6.3 are supported with field, airborne, and satellite remote sensing data collected for Norway spruce forest stands located in the vicinity of the permanent ecosystem research site Bílý Kříž (Czech Republic). Field data, airborne hyperspectral, and Sentinel-2 multispectral data were acquired in August 2016 [116], and CHRIS/PROBA multiangular satellite data were acquired in September 2007 (unpublished data). This appendix provides details on data acquisition and pre-processing of the datasets.

Appendix B.2. Site Description

The ecosystem research site Bílý Kříž in the Moravian-Silesian Beskydy Mts. (Czech Republic, 49°30′N, 18°32′E, 800–920 m a.s.l.) is used for long-term research on tree ecophysiology and carbon fluxes as a part of national (Czech Carbon Observation System CzeCOS) and international (Integrated Carbon Observation System ICOS) research networks. The site is characterized by annual mean air temperature of 6.8 °C, annual mean relative air humidity of 84%, and annual precipitation of 1280 mm (recorded between 1998 and 2012). The site is covered predominantly by Norway spruce (Picea abies) stands of different age, with minor admixture of silver fir (Abies alba), European beech (Fagus sylvatica), and European mountain ash (Sorbus acuparia).
Two plots with Norway spruce stands contrasting in canopy structure and age were selected to demonstrate the variability of forest reflectance properties. The immature spruce is located right at the ecosystem station (49°30′7.8′′N, 18°32′16.4′′E) on a south oriented slope (with an 11 degree slope). This stand is a row plantation, and in 2016, trees were 40 years old with leaf area index (LAI) equal to 8.5. The mature stand is located in the vicinity of the ecosystem station (49°29′35.5′′N, 18°32′8.2′′E) on a south-west oriented slope (with an 8 degree slope). This stand is over 80 years old, and has LAI equal to 6.7. Although both sites are located in a mountainous area, the sites were chosen purposely with comparable azimuths (southward facing) and that both were small. Thus, we assume similar topographic effects at both sites.

Appendix B.3. Field Data on Leaf Optical and Biochemical Properties

Leaf optical and biochemical properties, (reflectance, transmittance, chlorophyll a+b and carotenoids content, leaf water content, and leaf mass per area) were measured at the peak of growing season at the end of August 2016. As such, they are compatible with airborne hyperspectral and Sentinel-2 images acquired on 31 August of the same year. Needle samples were collected from three representative trees at each spruce plot. Current, one- and two-years-old shoots were cut off from two branches representing sunlit (i.e., crown top) and shaded (i.e., crown bottom) illumination conditions.
Directional-hemispherical reflectance (DHRF) and transmittance factors (DHTF) were measured using the combination of ASD FieldSpec 3 and FieldSpec 4 spectroradiometers attached to ASD RTS-3ZC integrating spheres with the ASD halogen light source supplied with the sphere. A FieldSpec 4 with the first integrating sphere was used to measure reflectance and a FieldSpec 3 attached to the second sphere was used to measure transmittance, that allowed faster measurements and lower uncertainty due to the fixed position of a light source. Needles were placed into specifically designed carriers so that small gaps were allowed in between [9,10,107]. Gap fraction, i.e., percentage of gaps within the illuminated needle sample, was estimated from scanning the carriers and applying a mask of the actual light beam position. Final reflectance and transmittance were computed using the following formulas:
D H R F = ( S A M P L E S T R A Y ) S P E C T W R S T R A Y 1 1 G F R
D H T F = S A M P L E W R S T R A Y 1 1 G F T
where SAMPLE is the sample reflectance or transmittance measured in DN values, STRAY is measured stray light in DN values, SPECT is reflectance of the inner sphere wall, WR is white reference reflectance in DN values and GF is the gap fraction value different for the reflectance and transmittance sample. The final spectra were smoothed using Savitzky–Golay filtering with 5th degree polynomial.
Leaf samples for pigment analyses were immediately frozen in liquid nitrogen, and stored in deep freeze (−80 °C) until being processed in a laboratory. Pigments were extracted according to the method of [117], using the 80% acetone solvent, and the pigment concentration was determined spectrophotometrically according to the empirical equations of [118]. Leaf pigment and water content values were converted from mass-based to area-based units using specific leaf area, defined as ratio between half of the hemisurface needle area [61] and the sample dry matter weight.

Appendix B.4. Airborne Hyperspectral Data

Airborne hyperspectral images were acquired with the pushbroom CASI (372–1044 nm) and SASI (957–2442 nm) spectroradiometers (ITRES Research Limited, Canada). Both sensors were operated simultaneously on board of the CzechGlobe’s Flying Laboratory of Imaging Systems (FLIS [119]). Images were acquired under clear sky and sunny conditions on 31 August 2016 in a high-resolution mode (i.e., pixel size of 1 m for CASI and 2.5 m for SASI, 72 spectral bands for CASI and 100 bands for SASI). Corrections of the hyperspectral images were performed according to a processing chain established at CzechGlobe [119]. Radiometric corrections were performed using the factory calibration coefficients in the RCX software (post-processing software developed by ITRES that runs in the ENVI/IDL programming environment). Geometric corrections, i.e., image orthorectification and geo-referencing, were performed using the GeoCorr software provided also by ITRES. Atmospheric corrections were performed using the ATCOR-4 software [120]. For both spruce stands, mean canopy reflectance and its standard deviation was extracted from the CASI, SASI hyperspectral images for a representative, homogeneous square area of 100 × 100 m located at each study plot center. Data were acquired in north-south flight direction, in order to minimalize BRDF effects on image.

Appendix B.5. Multispectral Satellite Data

CHRIS/PROBA: Satellite multiangular data from CHRIS sensor on board the PROBA platform were acquired on 21 September 2007 in so-called chlorophyll mode, resulting in 18 bands covering visible to near-infrared wavelengths from 490 nm to 797 nm, with a nominal spatial resolution of 17 m (in near-NADIR +4° observation geometry) and five actual observation view angles, ranging from backward scattered −51° and −32° to NADIR and forward scattered +27° and +48°. Raw data supplied by ESA were processed to top-of-canopy reflectances using CHRIS Proba Toolbox for BEAM. In first step, image vertical stripping was removed by applying Noise removal algorithm. In the next step, atmospheric corrections were performed using the dedicated atmospheric correction module of CHRIS Toolbox. No geometrical corrections were applied. From each of the observation geometries’ mean and standard deviation of forest reflectances from two plots, immature and mature Norway spruce forest were extracted.
Sentinel-2: A cloud free Sentinel-2 MSI image was acquired on 31 August 2016, almost simultaneously with airborne hyperspectral data acquisition. The image was processed using sen2cor ESA toolbox (version 2.3.0), including the atmospheric and topographic corrections. Only the spectral bands with the nominal spatial resolution of 10 m and 20 m (i.e., bands B2–B7, B8a, B11, and B12) were retained and resampled to the common pixel size of 20 m. For both spruce stands, mean canopy reflectance and its standard deviation from Sentinel-2 was extracted for the same 100 × 100 m area (i.e., 5 × 5 Sentinel-2 image pixels). The observation zenith angle of Sentinel-2 was 2° off-nadir.
MODIS: Medium resolution satellite data from MODIS sensor on board Terra and Aqua platforms were obtained in the form of “NADIR BRDF-Adjusted reflectance” product (MODIS name MCD43A4, version 05). This synthetic product uses best-available observations within a 16 days period to generate nadir-normalized surface reflectance using a simple kernel-driven radiative transfer model. Data are produced every 16 days as cloud-free tiles with global coverage. Spatial resolution of the product is 500 m. We downloaded the tile h19.v04 generated from all MODIS Terra and Aqua observations between 20 August 2016 and 6 September 2016. Two nadir-normalized reflectances in seven spectra channels between 640 nm and 2130 nm were extracted for the areas corresponding to immature and mature forest stands. We carefully examined ancillary metadata layer of the scene; all MODIS pixels were retrieved using full BRDF model inversion, indicating good quality of input MODIS observations.

References

  1. Farjon, A. A Hand-Book of the World’s Conifers; Brill: Aylesbury, UK, 2010; pp. 1–1111. ISBN 9789047430629. [Google Scholar]
  2. Rocky Mountain Tree-Ring Research. Available online: http://www.rmtrr.org/oldlist.htm (accessed on 22 November 2017).
  3. Preston, R. Tall for its age. The New Yorker, 9 October 2006; 4. [Google Scholar]
  4. Ciais, P.; Sabine, C.; Bala, G.; Bopp, L.; Brovkin, V.; Canadell, J.; Chhabra, A.; DeFries, R.; Galloway, J.; Heimann, M.; et al. Carbon and Other Biogeochemical Cycles. In Climate Change 2013: The Physical Science Basis. Contribution of Working Group I to the Fifth Assessment Report of the Intergovernmental Panel on Climate Change; Stocker, T.F., Qin, D., Plattner, G.-K., Tignor, M., Allen, S.K., Boschung, J., Nauels, A., Xia, Y., Bex, V., Midgley, P.M., Eds.; Cambridge University Press: Cambridge, UK; New York, NY, USA, 2013. [Google Scholar]
  5. United Nations Economic Commission for Europe/Food and Agriculture Organization of the United Nations (UNECE/FAO). Forest Products Annual Market Review 2016; UNECE: Geneva, Switzerland, 2016; Available online: https://www.unece.org/fileadmin/DAM/timber/publications/FPAMR2017AdvanceDraft.pdf (accessed on 30 November 2017).
  6. Forest Europe. State of Europe’s Forests 2015; Forest Europe: Zvolen, Slovakia, 2015; pp. 1–314. Available online: http://www.foresteurope.org/docs/fullsoef2015.pdf (accessed on 30 November 2017).
  7. Smolander, S.; Stenberg, P. Simple parameterizations of the radiation budget of uniform broadleaved and coniferous canopies. Remote Sens. Environ. 2005, 94, 355–363. [Google Scholar] [CrossRef]
  8. Rautiainen, M.; Stenberg, P. Application of photon recollision probability in coniferous canopy reflectance simulations. Remote Sens. Environ. 2005, 96, 98–107. [Google Scholar] [CrossRef]
  9. Yáñez-Rausell, L.; Schaepman, M.E.; Clevers, J.G.P.W.; Malenovský, Z. Minimizing measurement uncertainties of coniferous needle-leaf optical properties, part i: methodological review. IEEE J. Sel. Top. Appl. Earth Obs. Remote Sens. 2014, 7, 399–405. [Google Scholar] [CrossRef]
  10. Yáñez-Rausell, L.; Malenovsky, Z.; Clevers, J.G.P.W.; Schaepman, M.E. Minimizing measurement uncertainties of coniferous needle-leaf optical properties, Part II: Experimental Setup and Error Analysis. IEEE J. Sel. Top. Appl. Earth Obs. Remote Sens. 2014, 7, 406–420. [Google Scholar] [CrossRef]
  11. Hovi, A.; Raitio, P.; Rautiainen, M. Spectral analysis of 25 boreal tree species. Silva Fenn. 2017, 51, 1–16. [Google Scholar] [CrossRef]
  12. Rautiainen, M.; Lukeš, P. Spectral contribution of understory to forest reflectance in a boreal site: An analysis of EO-1 Hyperion data. Remote Sens. Environ. 2015, 171, 98–104. [Google Scholar] [CrossRef]
  13. Eriksson, H.; Eklundh, L.; Kuusk, A.; Nilson, T. Impact of understory vegetation on forest canopy reflectance and remotely sensed LAI estimates. Remote Sens. Environ. 2006, 103, 408–418. [Google Scholar] [CrossRef]
  14. Gates, D.M.; Keegan, H.J.; Schleter, J.C.; Weidner, V.R. Spectral properties of plants. Appl. Opt. 1965, 4, 11–20. [Google Scholar] [CrossRef]
  15. Daughtry, C.S.T.; Biehl, L.L. Changes in Spectral Properties of Detached Leaves; LARS Technical Report 061584; Purdue University Laboratory for Applications of Remote Sensing: West Lafayette, IN, USA, 1984; p. 25.
  16. Hosgood, B.; Jacquemoud, S.; Andreoli, G.; Verdebout, J.; Pedrini, A.; Schmuck, G. Leaf Optical Properties EXperiment 93 (LOPEX93); Report EUR 16095 EN (Revised 2005); Joint Research Centre/Institute for Remote Sensing Applications: Ispra, Italy, 2005; Available online: http://ies-webarchive.jrc.ec.europa.eu/ies/uploads/fileadmin/H03/LOPEX_Jan09.zip (accessed on 8 November 2017).
  17. O’Neill, A.L.; Kupiec, J.A.; Curran, P.J. Biochemical and reflectance variation throughout a Sitka spruce canopy. Remote Sens. Environ. 2002, 80, 134–142. [Google Scholar] [CrossRef]
  18. Coops, N.C.; Stone, C. A comparison of field-based and modelled reflectance spectra from damaged Pinus radiata foliage. Aust. J. Bot. 2005, 53, 417–429. [Google Scholar] [CrossRef]
  19. Lhotáková, Z.; Brodský, L.; Kupková, L.; Kopačková, V.; Potůčková, M.; Mišurec, J.; Klement, A.; Kovářová, M.; Albrechtová, J. Detection of multiple stresses in Scots pine growing at post-mining sites using visible to near-infrared spectroscopy. Environ. Sci. Process. Impacts 2013, 15, 2004–2015. [Google Scholar] [CrossRef]
  20. Olascoaga, B.; Juurola, E.; Lukeš, P.; Nikinmaa, E.; Bäck, J.; Porcar-Castell, A.; Juurola, E.; Pinho, P.; Halonen, L. Seasonal variation in the reflectance of photosynthetically active radiation from epicuticular waxes of Scots pine (Pinus sylvestris) needles. Boreal Environ. Res. 2014, 19, 132–141. [Google Scholar]
  21. Richardson, A.D.; Berlyn, G.P.; Gregoire, T.G. Spectral reflectance of Picea rubens (Pinaceae) and Abies balsamea (Pinaceae) needles along an elevational gradient, Mt. Moosilauke, New Hampshire, USA. Am. J. Bot. 2001, 88, 667–676. [Google Scholar] [CrossRef] [PubMed]
  22. Hernández-Clemente, R.; Navarro-Cerrillo, R.M.; Zarco-Tejada, P.J. Carotenoid content estimation in a heterogeneous conifer forest using narrow-band indices and PROSPECT+DART simulations. Remote Sens. Environ. 2012, 127, 298–315. [Google Scholar] [CrossRef]
  23. Mõttus, M.; Hernández-Clemente, R.; Perheentupa, V.; Markiet, V. In situ measurement of Scots pine needle PRI. Plant Methods 2017, 13, 1–8. [Google Scholar] [CrossRef] [PubMed]
  24. Williams, D.L. A comparison of spectral reflectance properties at the needle, branch, and canopy levels for selected conifer species. Remote Sens. Environ. 1991, 35, 79–93. [Google Scholar] [CrossRef]
  25. Hall, F.G.; Huemmrich, K.F.; Strebel, D.E.; Goetz, S.J.; Nickeson, J.E.; Woods, K.E. Biophysical, Morphological, Canopy Optical Property, and Productivity Data from the Superior National Forest; NASA Technical Memorandum 104568; NASA Goddard Space Flight Center: Greenbelt, MD, USA, 1992; p. 150.
  26. Roberts, D.A.; Ustin, S.L.; Ogunjemiyo, S.; Greenberg, J.; Dobrowski, S.Z.; Chen, J.; Hinckley, T.M. Spectral and Structural Measures of Northwest Forest Vegetation at Leaf to Landscape Scales. Ecosystems 2004, 7, 545–562. [Google Scholar] [CrossRef]
  27. Lukeš, P.; Stenberg, P.; Rautiainen, M.; Mõttus, M.; Vanhatalo, K. Optical properties of leaves and needles for boreal tree species in Europe. Remote Sens. Lett. 2013, 4, 667–676. [Google Scholar] [CrossRef]
  28. Rock, B.N.; Williams, D.L.; Moss, D.M.; Lauten, G.N.; Kim, M. High-spectral resolution field and laboratory optical reflectance measurements of red spruce and eastern hemlock needles and branches. Remote Sens. Environ. 1994, 47, 176–189. [Google Scholar] [CrossRef]
  29. Middleton, E.M.; Sullivan, J.H.; Bovard, B.D.; Deluca, A.J.; Chan, S.S.; Cannon, T.A. Seasonal variability in foliar characteristics and physiology for boreal forest species at the five Saskatchewan tower sites during the 1994 Boreal Ecosystem-Atmosphere Study. J. Geophys. Res. 1997, 102, 28831–28844. [Google Scholar] [CrossRef]
  30. Gamon, J.A.; Berry, J.A. Facultative and constitutive pigment effects on the Photochemical Reflectance Index (PRI) in sun and shade conifer needles. Isr. J. Plant Sci. 2012, 60, 85–95. [Google Scholar] [CrossRef]
  31. De Tomás Marín, S.; Novák, M.; Klančnik, K.; Gaberščik, A. Spectral signatures of conifer needles mainly depend on their physical traits. Pol. J. Ecol. 2016, 64, 1–13. [Google Scholar] [CrossRef]
  32. Richardson, A.D.; Berlyn, G.P.; Duigan, S.P. Reflectance of Alaskan black spruce and white spruce foliage in relation to elevation and latitude. Tree Physiol. 2003, 23, 537–544. [Google Scholar] [CrossRef] [PubMed]
  33. Roth, K.L.; Casas, A.; Huesca, M.; Ustin, S.L.; Alsina, M.M.; Mathews, S.A.; Whiting, M.L. Leaf spectral clusters as potential optical leaf functional types within California ecosystems. Remote Sens. Environ. 2016, 184, 229–246. [Google Scholar] [CrossRef]
  34. Middleton, E.M.; Chan, S.S.; Rusin, R.J.; Mitchell, S.K. Optical properties of black spruce and jack pine needles at BOREAS sites in SK, Canada. Can. J. Remote Sens. 1997, 23, 108–119. [Google Scholar] [CrossRef]
  35. Hall, F.G.; Huemmrich, K.F.; Strebel, D.E.; Goetz, S.J.; Nickeson, J.E.; Woods, K.D. SNF Leaf Optical Properties: Cary-14; Superior National Forest Leaf Optical Properties: Cary-14; Data Set; Oak Ridge National Laboratory Distributed Active Archive Center: Oak Ridge, TN, USA, 1996. Available online: http://daac.ornl.gov (accessed on 8 November 2017).
  36. Middleton, E.; Sullivan, J. BOREAS TE-10 Leaf Optical Properties for SSA Species; Data Set; Oak Ridge National Laboratory Distributed Active Archive Center: Oak Ridge, TN, USA, 2000. Available online: http://www.daac.ornl.gov (accessed on 8 November 2017).
  37. Hueni, A.; Nieke, J.; Schopfer, J.; Kneubühler, M.; Itten, K. The spectral database SPECCHIO for improved long term usability and data sharing. Comput. Geosci. 2009, 35, 557–565. [Google Scholar] [CrossRef] [Green Version]
  38. SPECCHIO Spectral Information System. Available online: http://www.specchio.ch/ (accessed on 8 November 2017).
  39. Noda, H.M.; Motohka, T.; Murakami, K.; Muraoka, H.; Nasahara, K.N. Reflectance and transmittance spectra of leaves and shoots of 22 vascular plant species and reflectance spectra of trunks and branches of 12 tree species in Japan. Ecol. Res. 2014, 29, 111. [Google Scholar] [CrossRef]
  40. Noda, H. Reflectance and Transmittance Spectra of Leaves and Shoots of 22 Vascular Plant Species and Reflectance Spectra of Trunks and Branches of 12 Tree Species in Japan. ERDP-2013-02.1.1. Available online: http://db.cger.nies.go.jp/JaLTER/metacat/metacat/ERDP-2013-02.1.1/default (accessed on 8 November 2017).
  41. Serbin, S. Fresh Leaf Spectra to Estimate Leaf Morphology and Biochemistry for Northern Temperate Forests. Data Set. Ecological Spectral Information System (EcoSIS, USA), 2014. Available online: http://ecosis.org (accessed on 8 November 2017).
  42. EcoSIS Spectral Library. Available online: https://ecosis.org/ (accessed on 8 November 2017).
  43. Qi, Y.; Dennison, P.E.; Jolly, W.M.; Kropp, R.C.; Brewer, S.C. Spectroscopic analysis of seasonal changes in live fuel moisture content and leaf dry mass. Remote Sens. Environ. 2014, 150, 198–206. [Google Scholar] [CrossRef]
  44. Kokaly, R.F.; Clark, R.N.; Swayze, G.A.; Livo, K.E.; Hoefen, T.M.; Pearson, N.C.; Wise, R.A.; Benzel, W.M.; Lowers, H.A.; Driscoll, R.L.; et al. USGS Spectral Library Version 7; U.S. Geological Survey Data Series 1035; United States Geological Survey: Reston, VA, USA, 2017; p. 61. [CrossRef]
  45. USGS Spectral Library Version 7. Available online: https://speclab.cr.usgs.gov/spectral-lib.html (accessed on 8 November 2017).
  46. Niinemets, Ü. A review of light interception in plant stands from leaf to canopy in different plant functional types and in species with varying shade tolerance. Ecol. Res. 2010, 25, 693–714. [Google Scholar] [CrossRef]
  47. Atherton, J.; Olascoaga, B.; Alonso, L.; Porcar-Castell, A. Spatial Variation of Leaf Optical Properties in a Boreal Forest Is Influenced by Species and Light Environment. Front. Plant Sci. 2017, 8, 309. [Google Scholar] [CrossRef] [PubMed]
  48. Lhotáková, Z.; Albrechtová, J.; Malenovský, Z.; Rock, B.N.; Polák, T.; Cudlín, P. Does the azimuth orientation of Norway spruce (Picea abies L. Karst.) branches within sunlit crown part influence the heterogeneity of biochemical, structural and spectral characteristics of needles? Environ. Exp. Bot. 2007, 59, 283–292. [Google Scholar] [CrossRef] [Green Version]
  49. Gebauer, R.; Čermák, J.; Plichta, R.; Špinlerová, Z.; Uban, J.; Volařík, D.; Ceulemans, R. Within-canopy variation in needle morphology and anatomy of vascular tissues in a sparse Scots pine forest. Trees 2015, 29, 1447–1457. [Google Scholar] [CrossRef]
  50. Miller, J.R.; Wu, J.; Boyter, M.G.; Belanger, M.; Hare, E.W. Seasonal patterns in leaf reflectance red-edge characteristics. Int. J. Remote Sens. 1991, 12, 1509–1523. [Google Scholar] [CrossRef]
  51. Wong, C.Y.S.; Gamon, J.A. The photochemical reflectance index provides an optical indicator of spring photosynthetic activation in evergreen conifers. New Phytol. 2015, 206, 196–208. [Google Scholar] [CrossRef] [PubMed]
  52. Gamon, J.A.; Huemmrich, K.F.; Wong, C.Y.S.; Ensminger, I.; Garrity, S.; Hollinger, D.Y.; Noormets, A.; Peñuelas, J. A remotely sensed pigment index reveals photosynthetic phenology in evergreen conifers. Proc. Natl. Acad. Sci. USA 2016, 113, 13087–13092. [Google Scholar] [CrossRef] [PubMed]
  53. Peñuelas, J.; Filella, I.; Gamon, J.A. Assessment of photosynthetic radiation-use efficiency with spectral reflectance. New Phytol. 1995, 131, 291–296. [Google Scholar] [CrossRef]
  54. Mõttus, M.; Sulev, M.; Hallik, L. Seasonal course of the spectral properties of alder and birch leaves. IEEE J. Sel. Top. Appl. 2013, 7, 2496–2505. [Google Scholar] [CrossRef]
  55. Schaepman-Strub, G.; Schaepman, M.E.; Painter, T.H.; Dangel, S.; Martonchik, J.V. Reflectance quantities in optical remote sensing-definitions and case studies. Remote Sens. Environ. 2006, 103, 27–42. [Google Scholar] [CrossRef]
  56. Markiet, V.; Hernández-Clemente, R.; Mõttus, M. Spectral Similarity and PRI Variations for a Boreal Forest Stand Using Multi-angular Airborne Imagery. Remote Sens. 2017, 9, 1005. [Google Scholar] [CrossRef]
  57. Kokaly, R.F.; Asner, G.P.; Ollinger, S.V.; Martin, M.E.; Wessman, C.A. Characterizing canopy biochemistry from imaging spectroscopy and its application to ecosystem studies. Remote Sens. Environ. 2009, 113, S78–S91. [Google Scholar] [CrossRef]
  58. Ustin, S.L.; Roberts, D.A.; Gamon, J.A.; Asner, G.P.; Green, R.O. Using imaging spectroscopy to study ecosystem processes and properties. BioScience 2004, 54, 523–534. [Google Scholar] [CrossRef]
  59. Bond, B.J.; Farnsworth, B.T.; Coulombe, R.A.; Winner, W.E. Foliage physiology and biochemistry in response to light gradients in conifers with varying shade tolerance. Oecologia 1999, 120, 183–192. [Google Scholar] [CrossRef] [PubMed]
  60. Moorthy, I.; Miller, J.R.; Noland, T.L. Estimating chlorophyll concentration in conifer needles with hyperspectral data: An assessment at the needle and canopy level. Remote Sens. Environ. 2008, 112, 2824–2838. [Google Scholar] [CrossRef]
  61. Homolová, L.; Lukeš, P.; Malenovský, Z.; Lhotáková, Z.; Kaplan, V.; Hanuš, J. Measurement methods and variability assessment of the Norway spruce total leaf area: Implications for remote sensing. Trees 2013, 27, 111–121. [Google Scholar] [CrossRef]
  62. Grant, L. Diffuse and specular characteristics of leaf reflectance. Remote Sens. Environ. 1987, 22, 309–322. [Google Scholar] [CrossRef]
  63. Niinemets, Ü.; Lukjanova, A.; Turnbull, M.H.; Sparrow, A.D. Plasticity in mesophyll volume fractions modulates light-acclimation in needle photosynthesis in two pines. Tree Physiol. 2007, 12, 1137–1151. [Google Scholar] [CrossRef]
  64. Lhotáková, Z.; Urban, O.; Dubánková, M.; Cvikrová, M.; Tomášková, I.; Kubínová, L.; Zvára, K.; Marek, M.V.; Albrechtová, J. The impact of long-term CO2 enrichment on sun and shade needles of Norway spruce (Picea abies): Photosynthetic performance, needle anatomy and phenolics accumulation. Plant Sci. 2012, 188–189, 60–70. [Google Scholar] [CrossRef] [PubMed]
  65. Radovanović, B.; Šinžar-Sekulić, J.; Rakić, T.; Živković, I.; Lakušić, D. Variation in needle anatomy of Picea omorika (Pinaceae) plants belonging to different gene pools in natural populations on Tara Mt. in Serbia. Bot. Serbica 2014, 38, 237–246. [Google Scholar]
  66. Ross, J.; Meinander, O.; Sulev, M. Spectral scattering properties of Scots pine shoots. In Proceedings of the Surface and Atmospheric Remote Sensing: Technologies, Data Analysis and Interpretation, Pasadena, CA, USA, 8–12 August 1994; Volume 1–4, pp. 1451–1454. [Google Scholar]
  67. Nilson, T.; Ross, J. The use of remote sensing in the modeling of forest productivity. In Modeling Radiative Transfer through Forest Canopies: Implications for Canopy Photosynthesis and Remote Sensing; Gholz, H.L., Nakane, K., Shimoda, H., Eds.; Kluwer Academic Publishers: Dordrecht, The Netherlands, 1997; pp. 23–60. [Google Scholar]
  68. Mõttus, M.; Rautiainen, M.; Schaepman, M.E. Shoot scattering phase function for Scots pine and its effect on canopy reflectance. Agric. For. Meteorol. 2012, 154–155, 67–74. [Google Scholar] [CrossRef]
  69. Rautiainen, M.; Mõttus, M.; Yáñez-Rausell, L.; Homolová, L.; Malenovský, Z.; Schaepman, M.E. A note on upscaling coniferous needle spectra to shoot spectral albedo. Remote Sens. Environ. 2012, 117, 469–474. [Google Scholar] [CrossRef]
  70. Carter, G.A.; Smith, W.K. Influence of shoot structure on light interception and photosynthesis in conifers. Plant Physiol. 1985, 79, 1038–1043. [Google Scholar] [CrossRef] [PubMed]
  71. Woolley, J.T. Reflectance and Transmittance of Light by Leaves. Plant Physiol. 1971, 47, 656–662. [Google Scholar] [CrossRef] [PubMed]
  72. Mõttus, M.; Rautiainen, M. Scaling PRI between coniferous canopy structures. IEEE J. Sel. Top. Appl. 2013, 6, 708–714. [Google Scholar] [CrossRef]
  73. Lang, M.; Kuusk, A.; Nilson, T.; Lükk, T.; Pehk, M.; Alm, G. Reflectance Spectra of Ground Vegetation in Sub-Boreal Forests. 2002. Available online: http://www.aai.ee/bgf/ger2600/ (accessed on 8 November 2017).
  74. Cole, E.; Newton, M.; Bailey, J. Understory vegetation dynamics 15 years post-thinning in 50-year-old Douglas-fir and Douglas-fir/western hemlock stands in western Oregon, USA. For. Ecol. Manag. 2017, 384, 358–370. [Google Scholar] [CrossRef]
  75. Iiames, J.S.; Congalton, R.G.; Pilant, A.N.; Lewis, T.E. Leaf Area Index (LAI) Change Detection Analysis on Loblolly Pine (Pinus taeda) Following Complete Understory Removal. Photogramm. Eng. Remote Sens. 2008, 11, 1389–1400. [Google Scholar] [CrossRef]
  76. Kuusinen, N.; Stenberg, P.; Tomppo, E.; Bernier, P.; Berninger, F. Variation in understory and canopy reflectance during stand development in Finnish coniferous forests. Can. J. For. Res. 2015, 45, 1077–1085. [Google Scholar] [CrossRef]
  77. Spanner, M.; Pierce, L.; Peterson, D.; Running, S. Remote sensing of temperate coniferous leaf area index: The influence of canopy closure, understory vegetation, and background reflectance. Int. J. Remote Sens. 1990, 11, 95–111. [Google Scholar] [CrossRef]
  78. Deering, D.W.; Eck, T.F.; Banerjee, B. Characterization of the reflectance anisotropy of three boreal forest canopies in spring–summer. Remote Sens. Environ. 1999, 67, 205–229. [Google Scholar] [CrossRef]
  79. Suzuki, R.; Kobayashi, H.; Delbart, N.; Asanuma, J.; Hiyama, T. NDVI responses to the forest canopy and floor from spring to summer observed by airborne spectrometer in eastern Siberia. Remote Sens. Environ. 2011, 115, 3615–3624. [Google Scholar] [CrossRef]
  80. Canisius, F.; Chen, J.M. Retrieving forest background reflectance in a boreal region from Multi-angle Imaging SpectroRadiometer (MISR) data. Remote Sens. Environ. 2007, 107, 312–321. [Google Scholar] [CrossRef]
  81. Chopping, M.; Nolin, A.W.; Moisen, G.G.; Martonchik, J.V.; Bull, M. Forest canopy height from the Multiangle Imaging Spectro-Radiometer (MISR) assessed with high resolution discrete return lidar. Remote Sens. Environ. 2009, 113, 2172–2185. [Google Scholar] [CrossRef]
  82. Pisek, J.; Chen, J.M.; Miller, J.; Freemantle, J.; Peltoniemi, J.; Simic, A. Mapping forest background in a boreal region using multiangle Compact Airborne Spectrographic Imager data. IEEE Trans. Geosci. Remote Sens. 2010, 48, 499–510. [Google Scholar] [CrossRef]
  83. Yang, W.; Kobayashi, H.; Suzuki, R.; Nasahara, K. A simple method for retrieving understory NDVI in sparse needleleaf forests in Alaska using MODIS BRDF data. Remote Sens. 2014, 6, 11936–11955. [Google Scholar] [CrossRef]
  84. Knyazikhin, Y.; Martonchik, J.; Myneni, R.; Diner, D.; Running, S. Synergistic algorithm for estimating vegetation canopy leaf area index and fraction of absorbed photosynthetically active radiation from MODIS and MISR data. J. Geophys. Res. 1998, D103, 32257–32276. [Google Scholar] [CrossRef]
  85. Rautiainen, M.; Mõttus, M.; Heiskanen, J.; Akujärvi, A.; Majasalmi, T.; Stenberg, P. Seasonal reflectance dynamics of common understory types in a northern European boreal forest. Remote Sens. Environ. 2011, 115, 3020–3028. [Google Scholar] [CrossRef]
  86. Rautiainen, M.; Suomalainen, J.; Mottus, M.; Stenberg, P.; Voipio, P.; Peltoniemi, J.; Manninen, T. Coupling forest canopy and understory reflectance in the Arctic latitudes of Finland. Remote Sens. Environ. 2007, 110, 332–343. [Google Scholar] [CrossRef]
  87. Goward, S.N.; Huemmrich, K.F.; Waring, R.H. Visible-near infrared spectral reflectance of landscape components in western Oregon. Remote Sens. Environ. 1994, 47, 190–203. [Google Scholar] [CrossRef]
  88. Miller, J.; White, P.; Chen, J.M.; Peddle, D.; McDemid, G.; Fournier, R.; Shepherd, P.; Rubinstein, I.; Freemantle, J.; Soffer, R.; et al. Seasonal change in the understory reflectance of boreal forests and influence on canopy vegetation indices. J. Geophys. Res. 1997, 102, 29475–29482. [Google Scholar] [CrossRef]
  89. Kuusk, A.; Lang, M.; Nilson, T. Simulation of the reflectance of ground vegetation in sub-boreal forests. Agric. For. Meteorol. 2004, 126, 33–46. [Google Scholar] [CrossRef]
  90. Nikopensius, M.; Pisek, J.; Raabe, K. Spectral reflectance patterns and seasonal dynamics of common understory types in three mature hemi-boreal forests. Int. J. Appl. Earth Obs. Geoinf. 2015, 43, 84–91. [Google Scholar] [CrossRef]
  91. Kobayashi, H.; Suzuki, R.; Kobayashi, S. Reflectance seasonality and its relation to the canopy leaf area index in an eastern Siberian larch forest: Multi-satellite data and radiative transfer analyses. Remote Sens. Environ. 2007, 106, 238–252. [Google Scholar] [CrossRef]
  92. Peterson, U. Seasonal Reflectance Profiles for Forest Clearcut Communities at Early Stages of Secondary Succession; Section of Physics and Astronomy; Preprint A-5; Academy of Sciences of the Estonian SSR: Tartu, Estonia, 1989. [Google Scholar]
  93. Lohila, A.; Minkkinen, K.; Aurela, M.; Tuovinen, J.-P.; Pentilla, T.; Ojanen, P.; Laurila, T. Greenhouse gas flux measurements in a forestry-drained peatland indicate a large carbon sink. Biogeosciences 2011, 8, 3203–3218. [Google Scholar] [CrossRef] [Green Version]
  94. Chopping, M.; Schaaf, C.B.; Zhao, F.; Wang, Z.; Nolin, A.W.; Moisen, G.G.; Martonchik, J.V.; Bull, M. Forest structure and aboveground biomass in the southwestern United States from MODIS and MISR. Remote Sens. Environ. 2011, 115, 2943–2953. [Google Scholar] [CrossRef]
  95. Peltoniemi, J.; Kaasalainen, S.; Näränen, J.; Rautiainen, M.; Stenberg, P.; Smolander, H.; Smolander, S.; Voipio, P. BRDF measurement of understory vegetation in pine forests: Dwarf shrubs, lichen and moss. Remote Sens. Environ. 2005, 94, 343–354. [Google Scholar] [CrossRef]
  96. Hallik, L.; Kull, O.; Nilson, T.; Penuelas, J. Spectral reflectance of multispecies herbaceous and moss canopies in the boreal forest understory and open field. Can. J. Remote Sens. 2009, 35, 474–485. [Google Scholar] [CrossRef]
  97. Schaepman-Strub, G.; Limpens, J.; Menken, M.; Bartholomeus, H.; Schaepman, M. Towards spatial assessment of carbon sequestration in peatlands: Spectroscopy based estimation of fractional cover of three plant functional types. Biogeosciences 2009, 6, 275–284. [Google Scholar] [CrossRef] [Green Version]
  98. Stenberg, P.; Mõttus, M.; Rautiainen, M. Photon recollision probability in modelling the radiation regime of canopies—A review. Remote Sens. Environ. 2016, 183, 98–108. [Google Scholar] [CrossRef]
  99. Rautiainen, M.; Lang, M.; Mõttus, M.; Kuusk, A.; Nilson, T.; Kuusk, J.; Lükk, T. Multi-angular reflectance properties of a hemiboreal forest: An analysis using CHRIS PROBA data. Remote Sens. Environ. 2008, 112, 2627–2642. [Google Scholar] [CrossRef]
  100. Verrelst, J.; Schaepman, M.E.; Koetz, B.; Kneubühler, M. Angular sensitivity analysis of vegetation indices derived from CHRIS/PROBA data. Remote Sens. Environ. 2008, 112, 2341–2353. [Google Scholar] [CrossRef]
  101. Diner, D.J.; Beckert, J.C.; Reilly, T.H.; Bruegge, C.J.; Conel, J.E.; Kahn, R.A.; Martonchik, J.V.; Ackerman, T.P.; Davies, R.; Gerstl, S.A.W.; et al. Multi-angle Imaging SpectroRadiometer (MISR) instrument description and experiment overview. IEEE Trans. Geosci. Remote Sens. 1998, 36, 1072–1087. [Google Scholar] [CrossRef]
  102. Barnsley, M.J.; Settle, J.J.; Cutter, M.A.; Lobb, D.R.; Teston, F. The PROBA/CHRIS mission: A low-cost smallsat for hyperspectral multiangle observations of the Earth surface and atmosphere. IEEE Trans. Geosci. Remote Sens. 2004, 42, 1512–1520. [Google Scholar] [CrossRef]
  103. Hernández-Clemente, R.; Kolari, P.; Porcar-Castell, A.; Korhonen, L.; Mõttus, M. Tracking the seasonal dynamics of boreal forest photosynthesis using EO-1 Hyperion reflectance: sensitivity to structural and illumination effects. IEEE Trans. Geosci. Remote Sens. 2016, 54, 5105–5116. [Google Scholar] [CrossRef]
  104. Knapp, A.K.; Carter, G.A. Variability in leaf optical properties among 26 species from a broad range of habitats. Am. J. Bot. 1998, 85, 940–946. [Google Scholar] [CrossRef] [PubMed]
  105. Zarco-Tejada, P.J.; Miller, J.R.; Harron, J.; Hu, B.; Noland, T.L.; Goel, N.; Mohammed, G.H.; Sampson, P. Needle chlorophyll content estimation through model inversion using hyperspectral data from boreal conifer forest canopies. Remote Sens. Environ. 2004, 89, 189–199. [Google Scholar] [CrossRef]
  106. Stimson, H.C.; Breshears, D.D.; Ustin, S.L.; Kefauver, S.C. Spectral sensing of foliar water conditions in two co-occurring conifer species: Pinus edulis and Juniperus monosperma. Remote Sens. Environ. 2005, 96, 108–118. [Google Scholar] [CrossRef]
  107. Malenovský, Z.; Albrechtová, J.; Lhotáková, Z.; Zurita-Milla, R.; Clevers, J.G.P.W.; Schaepman, M.E.; Cudlín, P. Applicability of the PROSPECT model for Norway spruce needles. Int. J. Remote Sens. 2006, 27, 5315–5340. [Google Scholar] [CrossRef]
  108. Huang, D.; Knyazikhin, Y.; Dickinson, R.E.; Rautiainen, M.; Stenberg, P.; Disney, M.; Lewis, P.; Cescatti, A.; Tian, Y.; Verhoef, W.; et al. Canopy spectral invariants for remote sensing and model applications. Remote Sens. Environ. 2007, 106, 106–122. [Google Scholar] [CrossRef]
  109. Zhang, Y.; Chen, J.M.; Miller, J.R.; Noland, T.L. Retrieving chlorophyll content in conifer needles from hyperspectral measurements. Can. J. Remote Sens. 2008, 34, 296–310. [Google Scholar] [CrossRef]
  110. Di Vittorio, A.V.; Biging, G.S. Spectral identification of ozone-damaged pine needles. Int. J. Remote Sens. 2009, 30, 3041–3073. [Google Scholar] [CrossRef]
  111. Kuusk, A.; Kuusk, J.; Lang, M. A dataset for the validation of reflectance models. Remote Sens. Environ. 2009, 113, 889–892. [Google Scholar] [CrossRef]
  112. Croft, H.; Chen, J.M.; Zhang, Y.; Simic, A. Modelling leaf chlorophyll content in broadleaf and needle leaf canopies from ground, CASI, Landsat TM 5 and MERIS reflectance data. Remote Sens. Environ. 2013, 133, 128–140. [Google Scholar] [CrossRef]
  113. Dengel, S.; Grace, J.; Aakala, T.; Hari, P.; Newberry, S.L.; Mizunuma, T. Spectral characteristics of pine needles at the limit of tree growth in subarctic Finland. Plant Ecol. Divers. 2013, 6, 31–44. [Google Scholar] [CrossRef]
  114. Olascoaga, B.; Mac Arthur, A.; Atherton, J.; Porcar-Castell, A. A comparison of methods to estimate photosynthetic light absorption in leaves with contrasting morphology. Tree Physiol. 2016, 36, 368–379. [Google Scholar] [CrossRef] [PubMed]
  115. Potůčková, M.; Červená, L.; Kupková, L.; Lhotáková, Z.; Lukeš, P.; Hanuš, J.; Novotný, J.; Albrechtová, J. Comparison of reflectance measurements acquired with a contact probe and an integration sphere: Implications for the spectral properties of vegetation at a needle-level. Sensors 2016, 16, 1801. [Google Scholar] [CrossRef] [PubMed]
  116. Homolová, L.; Janoutová, R.; Lukeš, P.; Hanuš, J.; Novotný, J.; Brovkina, O.; Loyaza Fernandez, R.R. In situ data collection supporting remote sensing estimation of spruce forest parameters at the ecosystem station Bílý Kříž. Beskydy 2017. under review. [Google Scholar]
  117. Porra, R.J.; Thompson, W.A.; Kriedemann, P.E. Determination of accurate extinction coefficients and simultaneous equations for assaying chlorophylls a and b extracted with four different solvents: Verification of the concentration of chlorophyll standards by atomic absorption spectroscopy. Biochem. Biophys. Acta 1989, 975, 384–394. [Google Scholar] [CrossRef]
  118. Lichtenthaler, H.K. Chlorophylls and carotenoids: Pigments of photosynthetic membranes. Method Enzymol. 1987, 148, 350–382. [Google Scholar]
  119. Hanuš, J.; Fabiánek, T.; Fajmon, L. Potential of airborne imaging spectroscopy at CzechGlobe. Int. Arch. Photogramm. Remote Sens. Spat. Inf. Sci. 2016, XLI-B1, 15–17. [Google Scholar] [CrossRef]
  120. Richter, R.; Schläpfer, D. Geo-atmospheric processing of airborne imaging spectrometry data. Part 2: Atmospheric/topographic correction. Int. J. Remote Sens. 2002, 23, 2631–2649. [Google Scholar] [CrossRef]
Figure 1. Spectra of needles of four coniferous genera that were the most abundant in the existing spectral datasets (Table 1). Mean spectra of each species in each dataset were first calculated, and all available species mean spectra were averaged. In addition, standard deviation was calculated (half-transparent regions in the figure). The slight discontinuities observed e.g., at 1000 nm are due to different number of observations in different wavelength regions (there were less spectra available for wavelengths above 1000 nm).
Remotesensing 10 00207 g001
Figure 2. Variability of needle optical properties for first year (left) and older (right) Norway spruce needles sampled for two vertical canopy positions: sun exposed (red line) and shaded (blue line). See Appendix B for details.
Remotesensing 10 00207 g002
Figure 3. Sample Scots pine shoot scattering phase functions at four wavelengths as measured by [68]. The diagram in upper-left illustrates illumination geometry.
Remotesensing 10 00207 g003
Figure 4. The effect of shoot structure on its average transmittance between 400 and 2100 nm based on the measurements of ten Scots pine shoots. The equation is: y = −0.553x + 1.553. See [68,69] for measurement details.
Remotesensing 10 00207 g004
Figure 5. Reflectance spectra of woody components (tree stem or pieces of bark) measured in a laboratory for Picea, Larix, Abies, and Cryptomeria genera. The data represent mean spectra for each species, and they were obtained from three public databases [42,44,73]. Extremely noisy regions were removed before plotting the spectra.
Remotesensing 10 00207 g005
Figure 6. (A) The understory spectra of various coniferous forest stands. HDRF = Hemispherical-directional reflectance factor measured by a field spectrometer. (B) Variation of HDRFs corresponding to MODIS channels GREEN (545–565 nm); RED (620–670 nm); NIR (842–875 nm) along a 100 m long transect at Kalevansuo site, Finland in June 2017.
Remotesensing 10 00207 g006
Figure 7. Leaf and canopy level reflectance factors of two Norway spruce forests with contrasting age and structure (left—40-year-old stand, right—80+-year-old stand) in late August 2016 in Bílý Kříž (the Czech Republic). Canopy level reflectance signatures (as hemispherical-directional reflectance factors, HDRF) were extracted for exactly the same polygons from nearly synchronous acquisitions of the airborne hyperspectral sensors CASI + SASI mounted on the same platform, and satellite sensors Sentinel-2 and MODIS. All remote sensing data have similar close-to-nadir observation geometries. Leaf level reflectance (directional-hemispherical reflectance factors) were collected with an integrating sphere attached to a spectrometer.
Remotesensing 10 00207 g007
Figure 8. Top-of-canopy hemispherical-directional reflectance factors (HDRF) of immature (left) and mature (right) Norway spruce forest stands at Bílý Kříž site sampled in five angular observation geometries: near-nadir +4° (black), +27° (yellow), −32° (blue), +48° (green), and −51° (cyan) from nadir. Data were acquired by the CHRIS sensor onboard the tiltable PROBA satellite on 21 September 2007. Sun zenith angle during the data acquisition was 50° and azimuth 163°.
Remotesensing 10 00207 g008
Figure 9. An example of seasonality of coniferous forests’ spectra. Seasonal variation in Scots pine canopy hemispherical-directional reflectance factors (HDRF) at SMEAR II station (Hyytiälä, central Finland) as measured by the EO-1 Hyperion sensor on 3 March 2012 (Day of Year, DOY = 63), 11 March 2012 (DOY = 71), 5 May 2010 (DOY = 125), 3 July 2010 (DOY = 184), and 3 August 2011 (DOY = 215). The imagery was corrected radiometrically (for the striping and spectral smile effects) and atmospherically (using the FLAASH algorithm implemented in ENVI by Harris Geospatial, Inc. See [103] for details. The atmospheric absorption bands near 950, 1400, and 1900 nm were removed. The spectrum includes noticeable noise, especially at longer wavelengths, and negative values for wavelengths below 450 nm (blue to violet light), caused by the low signal to noise ratio and decreasing performance of the ageing experimental instrument.
Remotesensing 10 00207 g009
Table 1. Datasets of coniferous needle spectra that are openly available in public repositories. Reference is given to the original scientific publication or other documentation of the data. In addition, references to the data repository are given if they are separate from the documentation.
DatasetRegionnmGeom 1R or T 2Species
[16]Italy
(Temperate)
400–2500ISRPicea abies, Pinus contorta, Pinus wallichiana, Pseudotsuga menziesii
[25,35]MN, USA
(Boreal)
350–2100NAR, TAbies balsamea, Larix laricina, Picea mariana, Pinus banksiana, Pinus resinosa
[36]SK, Canada
(Boreal)
400–1000ISR, TPicea glauca, Picea mariana, Pinus banksiana
[27,37,38]Finland
(Boreal)
350–2500ISR, TPicea abies, Pinus sylvestris
[39,40]Honshu, Japan
(Temperate)
350–2500ISR, TChamaecyparis obtusa, Cryptomeria japonica, Cunninghamia lanceolata, Larix kaempferi, Picea abies, Pinus densiflora
[41,42]North Central and NE USA
(Temperate)
350–2500NC/IS 4R, TAbies balsamea, Juniperus virginiana, Larix laricina, Picea mariana, Picea rubens, Pinus banksiana, Pinus resinosa, Pinus strobus, Pinus sylvestris, Thuja occidentalis, Tsuga canadensis
[42,43]MT, USA
(Temperate)
350–2500ISRPinus contorta
[11,37,38]Finland
(Boreal)
350–2500ISR, TAbies balsamea, Abies sibirica, Larix gmelinii, Larix laricina, Larix sibirica, Picea abies, Picea glauca, Picea mariana, Pinus banksiana, Pinus contorta, Pinus sylvestris, Pseudotsuga menziesii
[44,45]USA
(Temperate)
350–2500 3BF/NA 5RPicea engelmannii, Picea pungens, Pinus edulis, Pinus sabiniana
1 Measurement geometry: IS = integrating sphere: sample containing several needles (with or without gaps) attached to the port of the integrating sphere (directional-hemispherical reflectance/transmittance factor), NC = needle clip: individual needles measured in hotspot geometry (bidirectional reflectance factor), BF = bare optical fiber or optical head of spectrometer pointed at a mat or stack of needles illuminated with external light source (bidirectional reflectance factor), NA = not described; 2 R = reflectance measurement, T = transmittance measurement; 3 Varies slightly but all spectra cover at least 350–2500 nm; 4 Not all species measured with both methods; 5 Method not described for all species: most of the species measured by pointing a bare fiber to a stack of needles.
Table 2. Biochemical differences between coniferous tree species extracted from the LOPEX93 database [16]. n = number of samples.
Species (n)Chl a+b (mg/g)Car (mg/g)Nitrogen (%)Cellulose (%)Lignin (%)Starch (%)
Picea abies (5)7.361.537.0827.2313.430.59
Pseudotsuga menziesii (2)6.671.438.5825.1714.92n.a.
Pinus contorta (2)10.442.358.9334.1712.830.82
Table 3. An example of variability of biochemical and structural properties of coniferous needles. Study species: Norway spruce (Picea abies). See Appendix B for details on measurement procedure.
Stand AgeCanopy PositionNeedle AgeSLAh (cm2/g)LAT CFCab Per Dry Matter (mg/g)Car Per Dry Matter (mg/g)Cab Per Needle Area (µg/cm2)Car Per Needle Area (µg/cm2)Cm Per Needle Area (g/cm2)Cw Per Needle Area (g/cm2)
Immature
(~40 years)
Exposedcurrent64.733.460.750.1429.275.680.0160.024
older53.743.481.030.2342.179.240.0190.022
Shadedcurrent104.262.880.800.1622.054.390.0100.017
older69.342.881.250.2644.129.120.0140.020
Mature
(~80 years)
Exposedcurrent79.573.510.720.1422.514.450.0130.018
older58.443.361.090.2341.868.780.0170.020
Shadedcurrent102.702.780.960.1923.654.770.0100.014
older92.382.761.210.2430.296.080.0110.014
SLAh—specific leaf area calculated on needle hemisurface area basis; LAT CF—projected to total leaf area correction factor (see [61] for more details); Cab per dry matter–total needle chlorophyll a+b content expressed on needle dry matter basis; Car per dry matter–total needle carotenoid content expressed on needle dry matter basis; Cab per needle area–total needle chlorophyll a+b content expressed on hemisurface leaf area basis; Car per needle area–total needle carotenoid content expressed on hemisurface leaf area basis; Cm per needle area–needle dry matter content expressed on hemisurface leaf area basis; Cw per needle area–needle water content expressed on hemisurface leaf area basis.
Table 4. Datasets of coniferous bark spectra that are openly available in public repositories.
DatasetRegionBiomeWavelengthsSpecies
[25,35]MN, USABoreal350–2100 nmAbies balsamea, Larix laricina, Picea mariana
[73]Estonia(Hemi) boreal400–2460 nmPicea abies, Pinus sylvestris
[39,40]Honshu, JapanTemperate350–2500 nmCryptomeria japonica, Larix kaempferi
Table 5. A summary of scientific studies on the spectral properties of coniferous forests.
StrengthsWeaknesses
  • The number of scientific studies on coniferous spectra has rapidly increased during the past decade.
  • High quality instrumentation available for in situ and lab spectral measurements.
  • Spectra of dominant boreal coniferous species and different understory types have been reported.
  • A few open access datasets for needle and bark spectra already exist.
  • Basic factors influencing needle spectra and their seasonality are understood.
  • Spectral measurements often not well documented and not quantitatively comparable between campaigns due to varying sampling schemes.
  • SWIR wavelengths and transmittance data often missing in datasets.
  • Spectra of coniferous species growing in tropical regions rarely measured.
  • Older age classes of needles better represented than young needles in spectral datasets.
  • Seasonal courses of needle and understory spectra rarely measured.
  • Only one open access dataset available for understory spectra.
  • Spectral scattering phase functions of coniferous elements poorly understood.
  • Leaf biochemical and structural parameters rarely measured simultaneously with spectral measurements.
OpportunitiesThreats
  • Faster methods for spectral measurements of needles in lab and field conditions can be developed.
  • Development of multiangular measurement methodologies will add to the understanding of directional scattering properties of coniferous elements.
  • New imaging spectroradiometers may offer a possibility to study e.g., spatial scaling of spectra and fluorescence of coniferous forests and their understory layers.
  • New opportunities for distributing spectral data in open repositories.
  • Scaling of spectra from needles to forest canopies offers possibilities for new concepts in theoretical modeling of radiation regimes of coniferous forests.
  • Spectral in situ measurements are very labor intensive: extensive campaigns to cover intra- and interspecies variability difficult to plan also in future.
  • Physiological status of needles often difficult to take into account in spectral data collection.

