Article

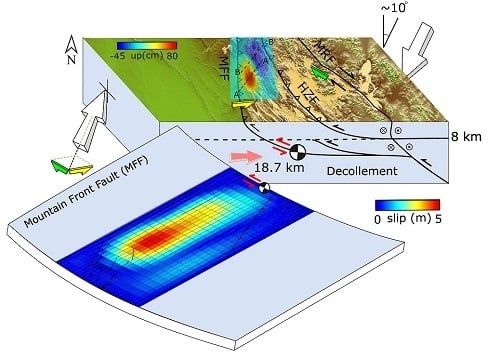
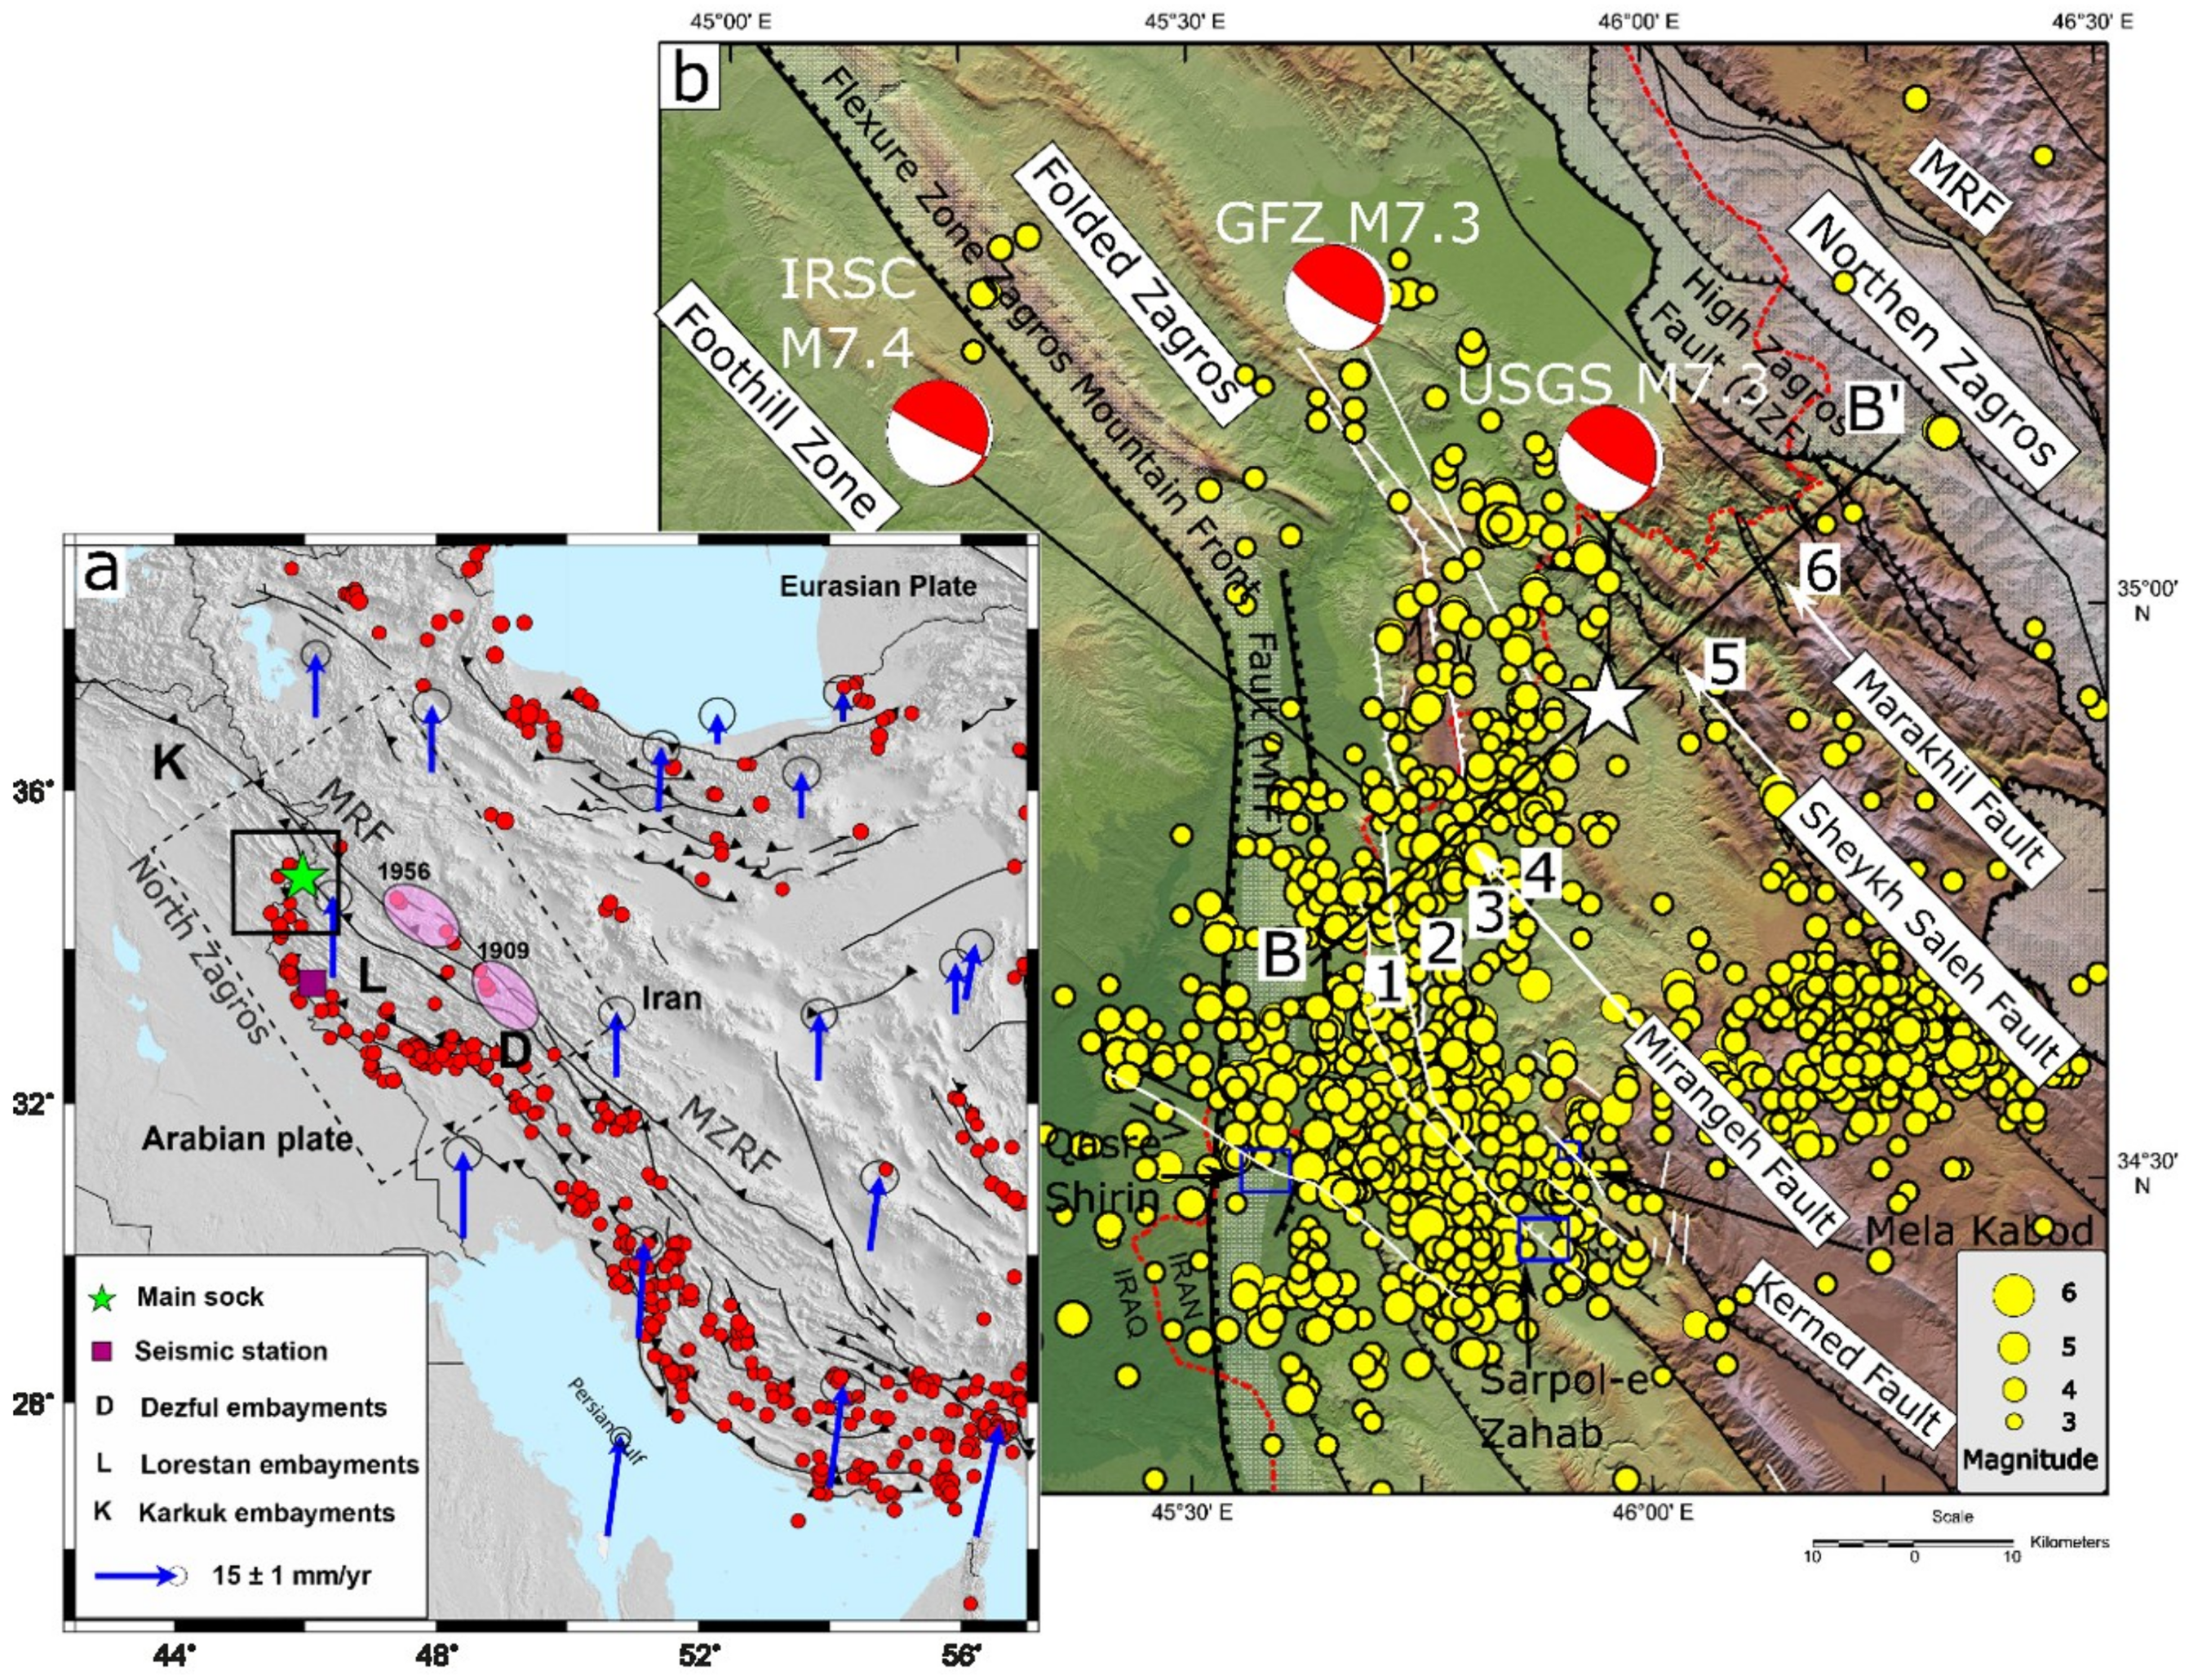
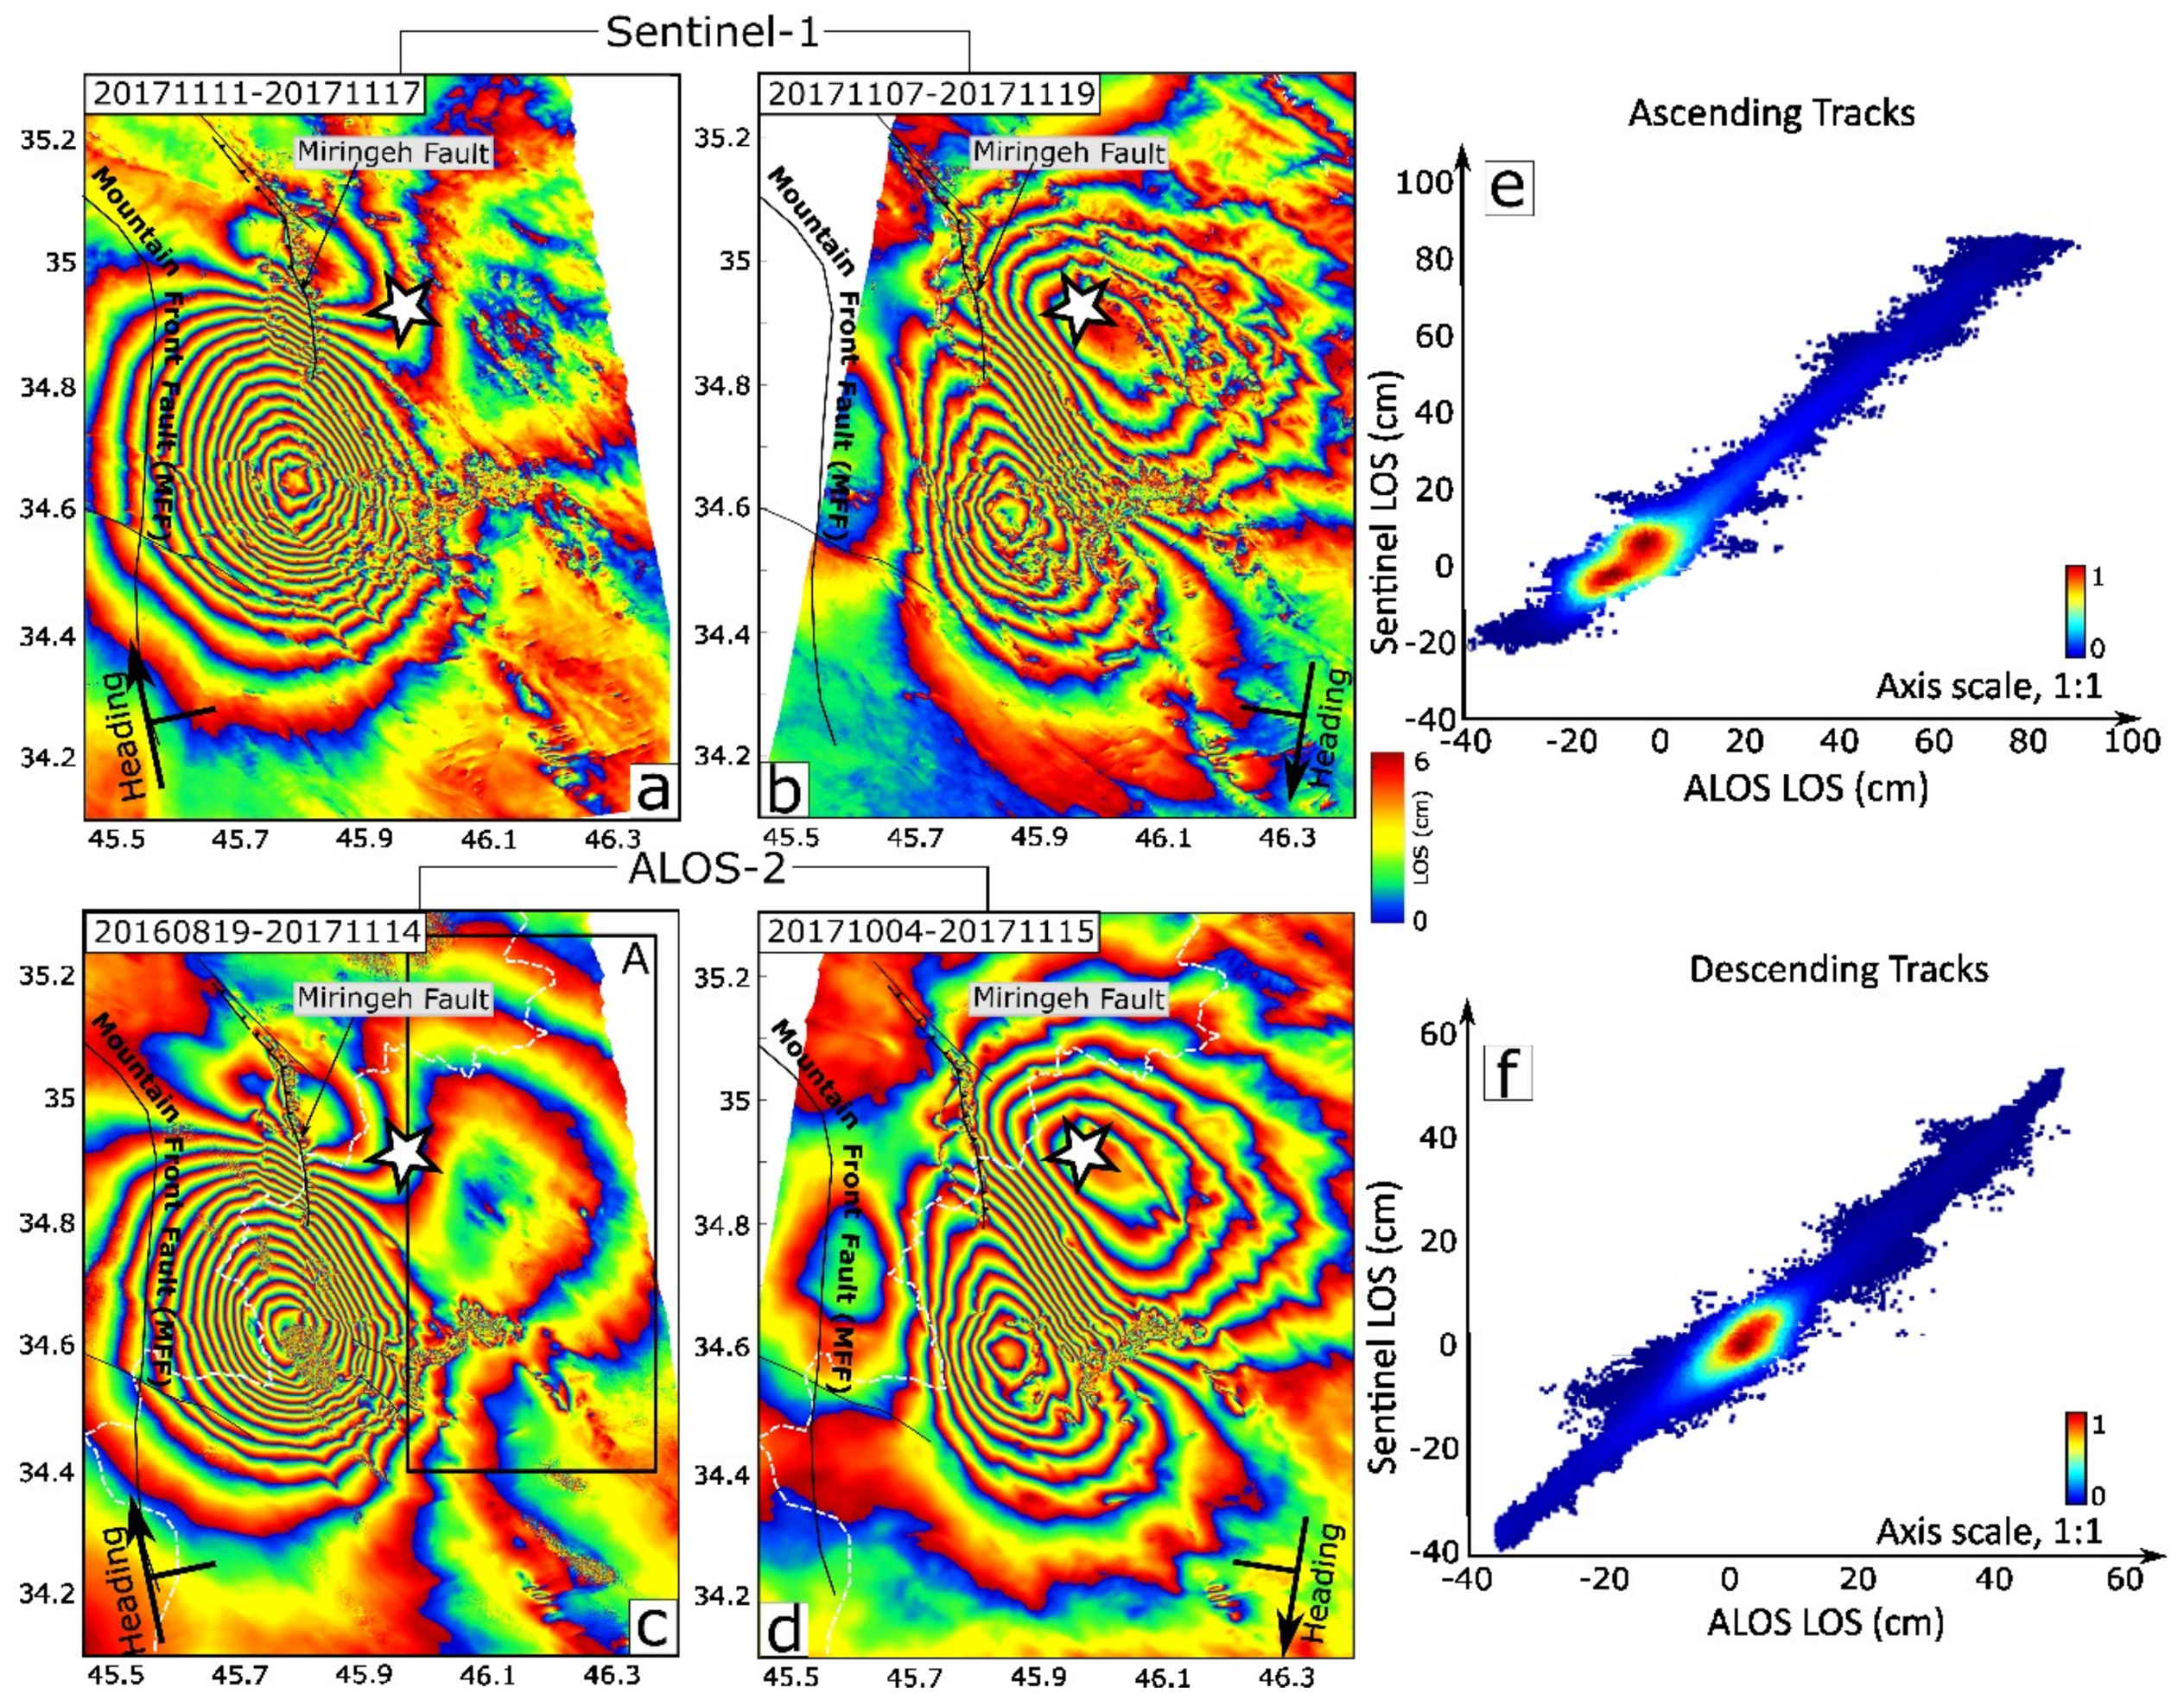
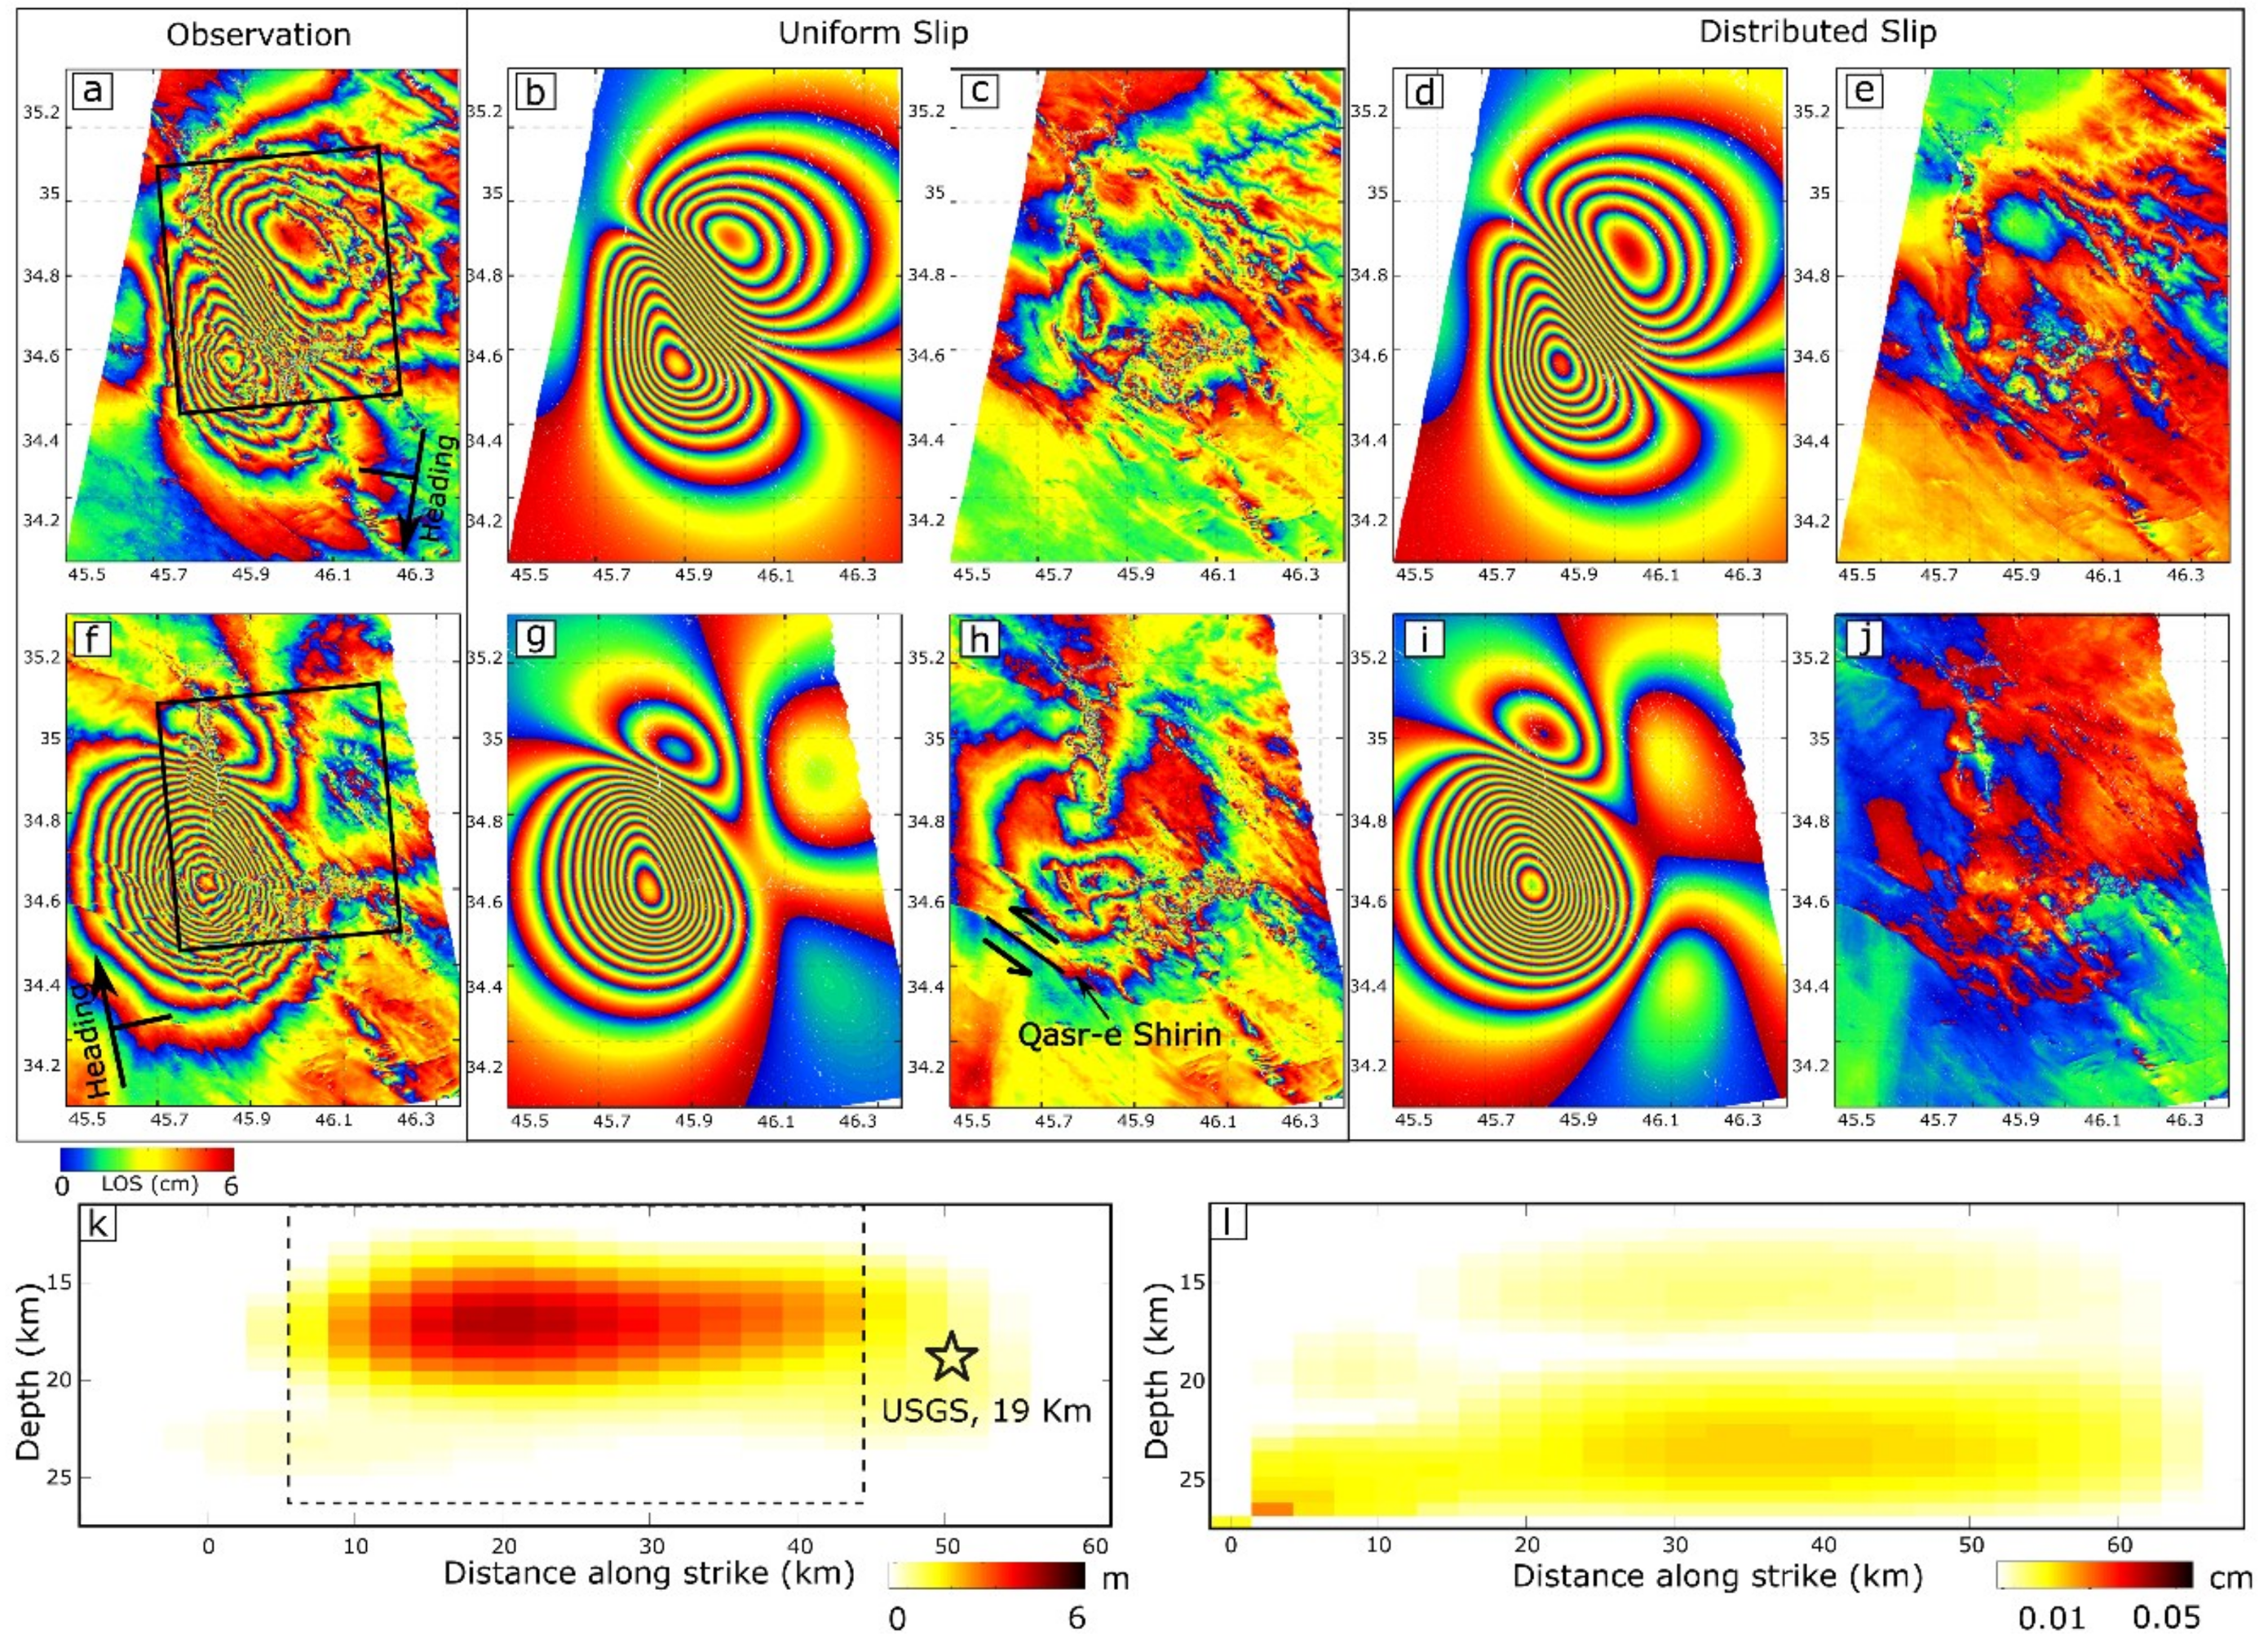
Coseismic Deformation Field of the Mw 7.3 12 November 2017 Sarpol-e Zahab (Iran) Earthquake: A Decoupling Horizon in the Northern Zagros Mountains Inferred from InSAR Observations

1
Institute of Photogrammetry and GeoInformation, Leibniz University Hannover, 30167 Hannover, Germany
2
GFZ German Research Centre for Geosciences (GFZ), Section of Remote Sensing, 14473 Potsdam, Germany
3
Department of Earth Sciences, Institute for Advanced Studies in Basic Sciences, 45137-66731 Zanjan (IASBS), Iran
4
Jet Propulsion Laboratory (JPL), California Institute of Technology, Pasadena, CA 91109, USA
5
Forest, Range and Watershed Management Organization of Iran, 1955756113 Tehran, Iran
*
Author to whom correspondence should be addressed.
Remote Sens. 2018, 10(10), 1589; https://doi.org/10.3390/rs10101589
Submission received: 26 August 2018 / Revised: 21 September 2018 / Accepted: 25 September 2018 / Published: 3 October 2018
(This article belongs to the Special Issue Applications of Sentinel Satellite for Geohazards Prevention)

Abstract

:
The study of crustal deformation fields caused by earthquakes is important for a better understanding of seismic hazard and growth of geological structures in tectonically active areas. In this study, we present, using interferometric measurements constructed from Sentinel-1 Terrain Observation with Progressive Scan (TOPS) data and ALOS-2 ScanSAR, coseismic deformation and source model of the Mw 7.3, 12 November 2017 earthquake that hit northwest of the Zagros Mountains in the region between Iran–Iraq border. This was one of the strongest seismic events to hit this region in the past century, and it resulted in an uplift area of about 3500 km2 between the High Zagros Fault (HZF) and Mountain Front Fault (MFF) with a maximum amount of 70 cm south of Miringe fault. A subsidence over an area of 1200 km2 with a maximum amount of 35 cm occurred near Vanisar village at the hanging wall of the HZF. Bayesian inversion of interferometric synthetic aperture radar (InSAR) observations suggests a source model at a depth between 14 and 20 km that is consistent with the existence of a decoupling horizon southwest edge of the northern portion of the Zagros Mountains near the MFF. Moreover, we present evidence for a number of coseismically induced rockslides and landslides, the majority of them which occurred along or close to pre-existing faults, causing decorrelation in differential interferograms. Exploiting the offset-tracking technique, we estimated surface motion by up to 34 and 10 m in horizontal and vertical directions, respectively, due to lateral spreading on a big coseismic-induced landslide near Mela-Kabod. Field observations also revealed several zones of en echelon fractures and crack zones developed along a pre-existing fault passing through Qasr-e Shirin City, which exhibited secondary surface slip by up to 14 cm along its strike.

Graphical Abstract

1. Introduction

Basement-involved thrust faulting is common in fold and thrust belts and is mostly associated with irregular tectonic relief and structures [1,2]. However, as it occurs beneath the sedimentary cover and rarely reaches the ground surface, its faulting is mainly dominated by buried dislocation accommodated by basement. This makes determining the accurate geometry of the source and the relationship between the deep seismic displacement and the tectonic structure in the overlying area very challenging. Therefore, indirect information such as that obtained by seismic and/or geodetic measurements is required to identify and investigate the detailed nature of faulting settings [3,4,5,6,7,8,9,10].
The Zagros convergent boundary is a young continental collision zone between the Arabian plate and the Eurasian plate in western Asia. The convergence generated a huge mountain range striking N130°E with varying width along the strike from 200 km in the northern and southern Zagros, to less than 100 km in the central Zagros. The suture zone is located on the northeast (NE) edge of the mountain belt along the Main Zagros Reverse Fault (MZRF) and the Main Recent Fault (MRF) in the southern and northern Zagros, respectively (Figure 1). These major faults take up ∼10 mm/year of oblique convergence in the region [11].
The southwest (SW) edge of the Zagros is limited by the Mountain Front Fault (MFF), an overthrust fault on which most of seismic moment release occurs currently (e.g., Reference [2]). This implies that the Zagros suture zone should not experience significant seismic activity (see Figure 1a, inset). However, medium and large earthquakes (e.g., the Mw 7.3, 1909 Silakhur earthquake, the Mw 7.1, 1957 Sahneh earthquake, and the Mw 6.2, 2006 Silakhur earthquake) occurred on the north Zagros suture, i.e., the MRF. Explanation for this different seismicity occurrence is that the ∼45° obliquity of convergence to the main structural trend of the north Zagros belt implies two nearly equal along- and across-strike components of convergence. In other words, the deformation in the north Zagros is partitioned along parallel major reverse and strike-slip faults (e.g., References [2,12,13]). Numerical modeling of strain partitioning in a elastoplastic medium shows that accommodation of the oblique deformation at shallow depths is controlled by the three-dimensional (3D) geometry of the main structures in the collision zone (e.g., Reference [14]). One of the key structures in this geometry is a crustal decoupling horizon which connects the major faults to each other. Motaghi et al. (2017) [15] employed teleseismic waves to study the geometry of intra-crustal velocity boundaries in the north Zagros and detected a sub-horizontal velocity discontinuity in the region at a depth of ~17 km. They suggested that this boundary should be the expected horizon; however, it is not proven if their velocity discontinuity is a fault zone. This paper presents geodetic evidence for the existence of a decoupling horizon on the SW edge of the mountain belt (i.e., near the MFF) at approximately the same depth in the north Zagros.
Geodetic measurements (e.g., synthetic aperture radar (SAR) interferometry) were already employed to identify and investigate the basement fault settings responsible for medium and large earthquakes in the Zagros. Some researchers suggested that the earthquakes in Zagros mostly occur within the bedrock (e.g., References [16,17,18]). However, modeling of interferometric synthetic aperture radar (InSAR) signals following some recent moderate and large earthquakes in Zagros provides clear evidence for faulting within the sedimentary layer at a depth of <10 km (e.g., References [19,20,21,22]).
On 12 November 2017, an oblique overthrust earthquake with a magnitude of Mw 7.3 occurred at the SW edge of the northern portion of the Zagros Mountains, at a border region between Iran and Iraq. It was the largest instrumental earthquake that occurred in the region since 958 and 1150 AD [23], which generated a unique opportunity to investigate the source of large earthquakes in the Zagros. The main shock was followed by 50 moderate (Mw > 4) earthquakes within the next 30 days elongated in a north–south direction distributed in an area of 120 km × 150 km, west of the main shock. It left ~600 dead, who were mostly from Sarpol-e Zahab, a city 50 km southeast (SE) of the epicenter. The moment tensor solutions determined by various agencies (Table S1) suggest two types of fault mechanisms: One is right-lateral thrust slip on a shallow NE or SE dipping fault, and the other is left-lateral thrust slip on a steeply SW dipping fault. We used the geodetic data to evaluate the earthquake causative fault plane.
The 12 November 2017 earthquake occurred between the High Zagros Fault (HZF) and MFF northwest (NW) of the Zagros Mountains, which accommodates 40–50% of approximately ~21 mm/year convergence between the Arabian and Eurasian plates [11]. Seismic and detailed geological interpretations indicate a number of strike-slip and thrust faults that are scattered between the HZF and MFF, including the Marakhil, Sheikh Saleh, and Miringeh Faults and some other structures, as indicated in Figure 1 [24]. However, due to a lack of geodetic stations, the detailed kinematics and geometry of all structures in this region are not well known.
Several studies already investigated source parameters of this earthquake and its damage effect using seismic, geodetic, and remote-sensing data: Tavani et al. (2018) [24] presented a detailed seismic profile of the study area and attributed the coseismic faulting to basement rupture at a depth which reactivated some shallow structures within the sedimentary cover. Barnhart et al. (2018) [25] retrieved coseismic and early postseismic deformation maps based on Sentinel-1 SAR data, and suggested that the main shock occurred in the basement at a depth of ~15 km, which is propagated onto the horizon with a dip between 1° and 5°. Feng et al. (2018) [26] used SAR data spanning the coseismic and early postseismic event to resolve the geometry of the fault and the distribution of slip in it. Vajedian and Motagh (2018) [27] presented a preliminary source model of the earthquake using Sentinel-1 data. Washaya et al. (2018), Karimzadeh et al. (2018), and Olen et al. (2018) used coherence analysis to identify the potential damage areas in Sarpol-e Zahab [28,29,30]. Miyajima et al. (2018) [31] investigated the site effect of the earthquake in this area including triggered massive landslides, liquefaction, and rock fall.
In this study, we integrated observations from radar and optical remote sensing, seismology, and field mapping to investigate source parameters, coseismically triggered slope failures, and secondary faulting related to the Mw 7.3, Sarpol-e Zahab earthquake in Iran. Firstly, coseismic surface deformation was constrained by interferometric synthetic aperture radar (InSAR) analysis from InSAR measurements constructed from Sentinel-1 TOPS and ALOS-2 ScanSAR images. Secondly, we used the combination of offset tracking and burst overlap interferometry to resolve the displacement map in both across- and along-track directions. Thirdly, source parameters and slip models of the earthquake were then obtained through the Bayesian inversion of interferometric results using elastic dislocation modeling, considering the seismic parameters as a priori information. Fourthly, the obtained inversion model was interpreted in light of a seismological velocity model, clarifying crustal structure to answer the open structural questions raised above, in the northern portion of the Zagros collision zone. Finally, we present the result of our field survey and provide detailed information for the characteristics of the earthquake-induced geological effects, such as landslides and secondary faulting.

2. Data Processing

2.1. Across-Track Interferometry

In this study, we used six C-band (wavelength of 5.6 cm) Copernicus Sentinel-1A/B interferometric wide-swath TOPS data and four L-band (wavelength of 24 cm) Japanese Aerospace Exploration Agency (JAXA) ALOS-2 ScanSAR to produce two descending and three ascending coseismic interferograms associated with the 12 November 2017, Mw 7.3 Sarpol-e Zahab Iran earthquake. The details are listed in Table S2.
The interferometric processing of both Sentinel-1 and ALOS-2 data was done using the GAMMA software, developed by GAMMA Remote Sensing and Consulting AG, Bern, Switzerland [32]. For the TOPS processing, the radiometric calibration was first applied to generate a mosaic of single-look complex (SLC) and multi-look intensity (MLI) images. The MLI data were then imported to the TOPS interferometry processing, including coregistration of master and slave images using the enhanced spectral diversity (ESD) method [33], conjugate multiplication of coregistered images, refinement and reflattening, subtracting the simulated topographic phase using the 30-m-resolution Shuttle Radar Topography Mission (SRTM) model [34], and finally, unwrapping and geocoding of the resultant interferogram. For the interferometric processing of the ALOS-2 dataset, the interferometric processing was performed for each sub-swath SLC in the slant range geometry. A simulated phase model based on orbit geometry was used to avoid phase jump across the sub-swath boundaries [35]. The processing was then followed by mosaicking of the resultant interferograms to produce a large interferogram, before correcting for topography phase and geocoding using 30-m-resolution SRTM. Both Sentinel-1 and ALOS-2 data were unwrapped using the minimum cost flow (MCF) algorithm [36].
Figure 2 shows the coseismic interferograms derived from TOPS interferometry and ALOS-2 processing in both ascending and descending tracks. Sentinel-1 pairs span the main shock plus five and seven days of postseismic events in ascending and descending geometry, respectively. ALOS-2 observations cover the period of the main shock and 2–3 days of postseismic deformation through ascending and descending geometry, respectively. The constructed interferograms in both geometries reveal a clear coseismic signal corresponding to a buried NW-striking structure. For the descending geometry, the coseismic signals are represented by a symmetric double-lobe pattern of deformation showing maximum movement of 45 cm and 30 cm toward and away from the satellite, respectively. In the ascending observation, the deformations are represented by closely spaced elliptical-shaped fringes SW of the epicenter (white star in Figure 1) with a peak of about 64 cm toward the satellite (along the Line Of Sight (LOS)), and more spaced fringes located at the SE of the epicenter, showing 14 cm moving away from the satellite. The difference in the pattern of coseismic signals between ascending and descending geometry indicates that the main shock did not have only pure vertical movement, but included also horizontal motion, which appear differently in ascending and descending data [37].
Figure 2e,f shows a visual representation of the correlation between C-band- and L-band-derived deformation maps in the ascending and descending geometries. The best-fit line to the scatter plot results in a correlation coefficient of 0.9 for both ascending and descending data, indicating a strong correlation and similarity between the two observations. This level of similarity in Figure 2 is due to the appropriate condition of the area for interferometry, as it is not covered by dense vegetation, and the similar geometry of ALOS-2 and Sentinel-1, causing coseismic signals to appear roughly the same in both L- and C-band interferograms. There is a difference, however, in the east part of the epicenter (black rectangle in Figure 2c), where we observe LOS subsidence. As seen in Figure 2c, two more parallel fringes appear in the L-band ascending interferogram, but not in the C-band Sentinel-1 interferogram. This might be related to the effect of the ionosphere, which affects L-band data more than C-band data [38], or to differences in tropospheric water vapor, which affects both L-band and C-band data. The other small localized difference between the Sentinel-1 and ALOS-2 data is related to the higher sensitivity of C-band data relative to L-band data in resolving localized deformation signals. Moreover, L-band observations retrieve a more coherent phase map compared to C-band observations, as they are less affected by decorrelation problems [39].

2.2. Offset Tracking

Interferometric processing measures ground movement in across-track or LOS projection, and cannot resolve ground motion in a north–south (NS) direction due to near-polar orbits of SAR satellites [40]. All seismic solutions of the 2017 earthquake suggest the existence of strike-slip motion in approximately the NS direction, which cannot be neglected. To extract this motion, we used a combination of burst overlap interferometry and offset-tracking analysis, which allowed a more sensitive measurement in the along-track direction [41]. The linear interpolations of the offset values resulting from the ESD analysis, utilized during the TOPS coregistration, were considered as the initial along-track values for the offset tracking. Offset tracking was then performed using a window size of 512 × 256 pixels to derive ground motion in both range and along-track direction.
Figure 3 represents the comparison between interferometric and combined offset-tracking results; all the results were unwrapped and plotted with the same color bar. As expected, the range-offset results (Figure 3b,f) shows the same coseismic pattern as seen in interferometric result (Figure 3a,e). However, one benefit of using the combined offset-tracking method is that the technique is less affected by the decorrelation problem. Therefore, the deformation signal could be better resolved even in some damaged areas where the interferometric phase may be lost due to decorrelation [42,43]. An example of this is illustrated for the open rectangle A in Figure 3e,f, illustrating the location of a big landslide that was triggered after the earthquake (see Section 4.3.1). The steep slip gradient of this landslide caused strong decorrelation in the InSAR result, and therefore, was not detected using interferometric processing. However, a close-up view of the offset-tracking results (Figure 3f) shows an evident range change in the area of the displaced block. The Sentinel-1 SAR has much higher resolution in the range direction than in the along-track direction; thus, the range offsets had higher accuracy.
Another advantage of performing the combined offset-tracking method is to retrieve the along-track component of the deformation. Figure 3c,g represent the obtained along-track displacement in both descending and ascending geometries, respectively. The deformation signal is evident in both geometries with a similar pattern, but different color. This is related to the different viewing geometries of ascending and descending tracks. The southward coseismic displacement with a peak amount of 45 cm appears positive (red color) in the descending observations (Figure 3c) and negative (blue color) in the ascending direction (Figure 3f).
As seen in Figure 3, along-track observations (Figure 3c,g), are affected by high-frequency noise, resulting from the offset-tracking algorithm, causing the uncertainty of the observations to rise up to 200 and 400 mm for ascending and descending geometries, respectively (Table S5). To better resolve the coseismic signal in the along-track direction, we used a series of Gaussian filters with different scales (power of two) to decompose the original signal to a series of components showing different spatial scales, and then, calculated the difference between neighboring scales to generate the band-pass components. Among all the multi spatial components derived from the band-pass decomposition with length scales between 5.6 and 45 km, the low-pass component shows the best fit with the coseismic signal (Figure S1b).
Applying band-bass decomposition to the along-track observations caused the uncertainty of the observations to decrease to 45 mm and 60 mm for the descending and ascending geometries, respectively. Figure 3d,h shows the low-pass component derived from the band-pass decomposition, which was imported into the inversion process.

3. Fault Geometry and Slip Distribution

Except for some minor discontinuities, the coseismic signal derived from the SAR data represents a continuous pattern that is proof of the buried causative fault. We inverted the observed data, resulting from the interferometric processing of Sentinel-1 and ALOS-2 data (Table S2), as well as the offset-tracking results derived from Sentinel-1 data, to infer the geometry of a single fault plane with uniform slip that best fit the data through the uniform elastic half-space model [44].
We calculated the uncertainty value based on the standard deviation of the deformation map in the far-field area, which is a measure of the non-tectonic noise, including temporal decorrelation and atmospheric phase effects either in the troposphere or ionosphere (Table S5). Values of 10 mm and 4 mm were estimated as the uncertainties of across-track observations in descending and ascending geometries, respectively. The uncertainties rose up to 45 mm and 60 mm for the noise-reduced along- track observations in descending and ascending geometries, respectively.
We used a modified version of the open-source software called Geodetic Bayesian Inversion Software (GBIS) to apply non-linear inversion for the fault geometry [45]. The GBIS software uses the Markov-chain Monte Carlo algorithm and the Metropolis–Hastings algorithm [46] to calculate the posterior probability distribution of each unknown parameter. Our modification included applying a recursive method for the quadtree downsampling, and adding slip distribution analysis after inferring the source parameters.
The downsampling method could be affected by an oversampling problem most probably in the area by noise, decorrelation, and unwrapping errors. To overcome the problem, we used the iterative method proposed by Lohman and Simons (2005) [47], in which the inversion was initially performed on a coarsely sampled observation map to infer the primary slip model. The estimated slip model was then used to generate the synthetic coseismic map. The process iterated until the change between the subsequent iterations no longer decreased significantly.
Bayesian inversion allows the fault characteristics either in geometry or slip direction (rake) to vary within a defined range, and minimizes the residual between the modeled and observed deformation. No constraint is considered in running Bayesian inversion, and all the fault parameters, comprising orientation and position, were allowed to vary in a defined range through the Bayesian inversion. The lower and upper bounds of each parameter were selected based on the seismic solutions, listed in Table S3, so that adequate cover could be provided on the suggested mechanisms (Table S1). As seen in Figure 2, the coseismic maps obtained through the interferometric processing provide a good coverage of the coseismic displacement map. Moreover, they were made from multiple observations in LOS geometries and along-track offsets that helped us better constrain fault parameters within the inversion process.
Once the geometry of the fault plane with uniform slip was estimated based on Bayesian inversion, we expanded the fault plane in along-strike and down-dip directions, and divided it into 25 × 25 individual patches to obtain the distributed slip on the fault plane, using the same set of observations. Each patch has a fixed geometry according to optimal source parameters obtained from the non-linear modeling, and two components of right-lateral and thrust slip were allowed to vary freely on the fault plane. The linear inversion for the regularization was then performed to retrieve the slip model using the following function [48]:
  ϕ = G s d 2 + α 2 H s ,  
where G is the dislocation Green function, s is the slip, H is the finite difference approximation of the Laplacian operator, and α is the smoothing factor that controls the trade-off between the weighted misfit and model roughness. We estimated α = 0.15 using an L-curve plot [49].
Table S4 represents the fault parameters obtained from the Bayesian inversion including the best-fit solution resolved from the uniform slip model applied to ascending and descending data individually, and the joint inversion of both geometries. The inversion results agree well with a single fault geometry, having a size of 39 × 16 km, striking 354°, dipping 17°, and slipping 4 m with a rake of 141°. The results are consistent with oblique thrust slip on a shallow NE dipping fault as suggested by seismic solutions [50]. Figure S4 shows the marginal posterior probabilities indicating relationships and trade-offs between estimated fault parameters. There were correlations between fault width, slip, and horizontal position, indicating a well-known trade-off between fault width and slip for buried faults [19,51]. There was also another known trade-off between fault strike and rake, which indicated contribution of the strike-slip mechanism in the seismic process and the uncertainty in determining strike of a shallowly dipping fault plane. However, as seen in Figure S4 (scatter plots), all the parameters were resolved well within the bounds set during the inversion process.
The slip distribution map resulting from regularization of the variable slip fault model is presented in Figure 4k. The distributed slip map is outlined by a dashed rectangle, showing the region of fault rupture derived from Bayesian inversion of the uniform slip model. The variable slip model shows a homogenous pattern which was elongated along the strike direction. The main coseismic rupture was concentrated at a depth between 14 and 20 km with a maximum slip of 5 m and an average rake angle of 141.5°. This rupture occurred at a depth of 18.7 km which is in agreement with the centroid depth obtained from the uniform slip model. Considering 30 Gpa for the rigidity modulus, we estimated a geodetic moment of 1.0565 × 10²⁰ Nm and a magnitude of 7.29 Mw. We also estimated the standard deviation of the variable slip fault model using least-squares inversion, shown in Figure 4l, based on the covariance matrix of unknown slip parameters estimated as follows [52]:
  Q x x = A P A ( r n ) ,  
where A is design matrix, estimated within the least-squares solution, P is the weight matrix of the observations, calculated based on uncertainty values, and r and n are the numbers of observations and unknown values, respectively.
The uncertainty map of the slip distribution shows a standard deviation on the order of 2 cm in the main rupture area on the fault plane with a maximum value of 3 cm at a depth of 25 km.
Figure 4 and Figure S3 show InSAR observations, models, and residuals obtained from the best-fitting parameters based upon uniform slip compared to the results derived from distributed slip modeling (Figure 4k) for the Sentinel-1 and ALOS-2 datasets, respectively. The Root Mean Square (RMS) misfits were approximately 3.9 and 4.8 cm for ascending and descending geometries for the uniform slip model, respectively. The RMS misfits decreased to 2.9 cm for the descending geometry and 3.7 cm for the ascending geometry after applying the variable slip model, indicating an improvement of about 25% achieved after performing distributed slip modeling. This improvement is also obvious schematically in Figure 4 by comparing Figure 4c,e, related to descending geometry, or Figure 4h,j for ascending tracks. The model also provides a good fit to along-track observations, as demonstrated in Figure S2.

4. Discussion

4.1. Comparison of the Slip Models

As presented in Figure 4 and Table S2, our estimations of strike, dip, and rake values retrieved from uniform slip and distributed slip agree with the USGS solution resulting from body waveform data.
Our InSAR-derived slip distribution model for the 2017 Sarpol-e Zahab earthquake suggests shallowly dipping oblique reverse faulting at a depth between 14 and 20 km with a maximum slip of 5 m. Figure 5 shows the comparison between the surface projection of our distributed slip model (details are available in the Supplementary Materials) with that from the teleseismic body and surface waveform modeling prepared by the USGS from the global seismic network (GSN) [50]. The GSN-derived slip map represents a single contiguous slip patch at a depth of 24 km with a peak value of 6 m. In addition the slip map estimated by the USGS GSN network is concentrated close to the USGS epicenter, since they based their finite fault model on that location. However, our results (Figure 5a) indicate that the fault slip is elongated in the upper southwestern part of the fault plane toward the region with many aftershocks (shown in Figure 1), within an area of 25 km × 15 km in the along-strike and down-dip directions. The USGS teleseismic slip distribution map suffers from poor spatial resolution on the fault plane (grid size of 10 km × 10 km). This is due to the fact that the USGS map was generated by modeling of the teleseismic seismograms recorded by the global seismic network and possible biases in their global seismic velocity model. Instead, the InSAR slip distribution, generated in this study, was calculated by modeling the ground surface deformation above the fault plane, which, in turn, enabled us to make smaller grid sizes and derive a better and more detailed spatial pattern for the slip at depth. The aftershock distribution (Figure 5a) is very consistent with the spatial extent of the high-resolution fault plane calculated in this study. The aftershocks (extracted from the Iranian Seismological Center catalog) have a U-shaped pattern around the main shock rupture plane. They occurred on the barriers [53], breaking eventually around the main shock asperity (i.e., rupture plane).
Regarding the previous studies, as presented in Table S6, the source fault parameters obtained in our study are consistent with previous studies [25,26]. The slip model inferred in this study is compatible with the result derived by Barnhart et al. (2018) [25]. They presented almost the same pattern of deformation extended to the southwest of the epicenter with a peak displacement around 5 m occurring at a depth of 19 km. However, our result does not indicate any evidence for two asperities, as suggested by Feng et al. (2018) [26].

4.2. Geodynamics Implication

Our geodetic fault slip model of the 2017 Sarpol-e Zahab earthquake suggests a shallowly dipping fault at a depth between 14 and 20 km. An open question is whether this faulting is inside thick sedimentary basin or crystalline basement. Figure 6 shows a one-dimensional (1D) velocity model (red solid line in subpanel c) beneath a seismic station (purple station in Figure 1a) in the north Zagros. The model was calculated by a joint inversion of a P-wave receiver function and a Rayleigh wave phase velocity dispersion curve (e.g., Reference [54]), showing shear wave velocity variation with depth. The P-wave receiver function (Figure 6a) was calculated using teleseismic data recorded by the seismic station, and the dispersion curve was extracted from the phase velocity tomography of Jiang et al. (2016) [55]. For a brief description of the inversion procedure, please refer to the articles by Motaghi et al. (2015 and 2017) [15,56]. The final velocity model (red solid line in Figure 6c) shows a shear wave velocity of 3.8 km/s at a depth range of 14–20 km, which is the faulting area. Comparing the velocity value of 3.8 km/s with the global velocity model of IASP91 [44,57] and local velocity models of Hatzfeld et al. (2003) [58] and Yaminifard et al. (2012) [17] for the Zagros, one can definitely infer that the reported shear wave velocity belongs to crystalline basement rocks and not the sedimentary cover. Thus, we conclude that the modeled fault in Figure 5 cut the basement beneath the north Zagros. This is consistent with studies suggesting that the seismicity of the Zagros is dominated by blind thrust faulting accommodated in the basements [12,59,60,61,62]. The depth distribution of aftershocks obtained from the Iranian Seismological Center (irsc.ut.ac.ir) catalog also demonstrates that the fault rupture barely reaches the sedimentary cover since the aftershocks were mostly distributed at a depth range of 7–12 km (Figure 5c). Previous well-located seismicity of the region, for example, the Qasr-e Shirin earthquake swarm which occurred in November 2013, shows a depth range of 8–16 km, confirming that sedimentary cover does not behave as a seismogenic layer in this region, probably due to its ductile rheology.
The InSAR-derived fault geometry shows that the rupture area has a shallow dip angle of 17.5–19.5° at depth of ~18.7 km. A sub-horizontal velocity discontinuity at the same depth (~17 ± 3 km) was detected using teleseismic data, and was interpreted as a shear zone beneath the north Zagros connecting the MFF and MRF [15]. Thus, we conclude that the rupture area responsible for the 2017 Sarpol-e Zahab earthquake is located on a low-dip-angle ramp connecting to a flat shear zone between two major faults of the study region (see Figure 7 for a sketch). The thrust ramp and flat shear zone (i.e., decollement) are required if strain partitioning is occurring in the north Zagros, and they help the oblique convergence to be accommodated by the overthrust MFF and the strike-slip MRF. Our suggested ramp–flat structure is not similar to the structure suggested by Barnhart et al. (2018) for the same region. By calculation of the Coulomb stress change generated by the main shock rupture, they showed that afterslip occurrred on a flat plane at a depth range of 10–14 km at the front of the mountain and considered it as a flat decollement between the sedimentary cover and basement. However, the flat plane discussed in this study is located inside the basement beneath the Zagros Mountains. This ramp–flat structure is a signature for the thick-skin style of deformation in the north Zagros collision zone.
The existence of a thrust ramp and flat shear zone could also explain why the north Zagros is unusually wide (~200 km) in comparison with some other parts of the Zagros (e.g., Dezful and Karkuk embayments, marked by D and K in Figure 1a, respectively). This unusual extent results in the north Zagros being known as a salient arc with relatively low topography and low intensity of deformation (see Figure 1 for its geometry). Available geological data (e.g., References [63,64]) do not confirm the presence of the Precambrian Hormuz salt (which is responsible for wide deformation in the southern portion of the Zagros) at the base of the sedimentary column in this part of the Zagros. Instead, the discovered shear zone may transfer the across-strike shortening component of deformation to the front of the belt (i.e., the MFF) beyond the backstop (Figure 2). The transfer of deformation on a low-friction intracrustal decollement results in a different style of deformation than the surrounding regions of Dezful and Karkuk embayments. The decollement may also explain why no aftershock was located northeast of the rupture plane (see Figure 5a) because our NE dipping plain is limited by a low-friction decollement zone on its NE side.
A schematic cartoon in Figure 7 shows a geodynamic model illustrating how convergence is accommodated in the north Zagros collision zone. The 2017 main shock occurred on the overthrust fault of the MFF and accommodated the across-strike part of the oblique convergence in the region. Occurrence of this large event may lead someone to speculate that the next potential large earthquake will occur on the strike-slip MRF to release the along-strike part of the convergence in the region. Tectonic complexity prevents the prediction of origin time of large future events.
Figure 8a illustrates the vertical component of surface displacement, calculated based on the slip model (Figure 4k). Figure 8b shows changes in the vertical displacement along profile AA’, passing through the uplift and subsidence area. The peak uplift value is just over 70 cm, located around Mount Bamo. The peak subsidence is about 35 cm, located near Vanisar village. As mentioned earlier, the recent earthquake was the largest event in the area since 958 and 1150 AD. Therefore, using a simple calculation, a rate of ~1 mm/year was estimated as the rate of permanent uplift which happens during the earthquake cycle in NW Zagros. Geomorphological studies suggest that, on average, 10% of the 10–15 mm/year of shortening in Zagros is accommodated by vertical deformation [67]. Therefore, it seems that a significant component of the inter-seismic strain contributes to permanent deformation and changes in topography in NW Zagros during episodes of major earthquakes.

4.3. Field Survey

The 2017 Sarpol-e Zahab earthquake also triggered a number of geological effects such as landslides, rockslides, and secondary shallow faulting. Investigating such geological features that are triggered after earthquakes is important for hazard reduction in seismically active areas [68,69,70,71].
A closer look into the interferograms illustrated in Figure 2 reveals a number of decorrelated areas which were masked from the unwrapped result for the source modeling. We also observe horizontal offset and discontinuity in fringes in a number of places, causing a line of decorrelation in the interferograms. We performed further analysis in some of these regions, and we provide below some detailed information about the earthquake-induced geological effects that caused decorrelation in the InSAR images. The points we visited in the field are marked by P1, P2, P3, P4, and P5 in Figure 9.

4.3.1. Mela-Kabod Landslide

One of the most severe earthquake-induced landslides happened near Mela-Kabod village (point P1 in Figure 9). Geological and geomorphological analyses suggest that this big landslide occurred along a pre-existing strike-slip fault, whose scarp is identified by black arrows in Figure 10a. Many horst and graben structures resulting from normal faulting were documented on top of this landslide near the main scarp, an example of which is shown Figure 10a. We also observed ridge and flow material at the toe of the landslide due to liquefaction caused by the earthquake (Figure 10b). All these evidences suggest the occurrence of lateral spreading at the Mela-Kabod landslide in response to the 2017 Sarpol-e Zahab earthquake. Rising of pore water pressure during an earthquake reduces effective stress in fine-grained subsurface materials saturated with water. This leads to liquefaction, in which subsurface materials come to the ground surface like a caliginous liquid. Horst and graben structures are then created on the ground as a result of this empty underground [72].
As illustrated in Figure 3, due to strong phase decorrelation, we cannot measure the kinematics of this large earthquake-induced landslide using phase information. In contrast, the combined offset-tracking method provides a detailed pattern of what happened in this large structure in both along-track and across-track directions. Figure 11 shows the 3D decomposition results over an area of 4 km2 indicating horizontal displacement by up to 34 m and maximum vertical movement of 10 m.

4.3.2. Rockslides

Regarding earthquake-induced slope failures, several medium- and large-sized debris and rockfalls happened along pre-existing fault zones. Figure 12a illustrates a small-sized rockslide and debris near Piran Waterfall, in which the debris blocked the waterway of this waterfall (P2 in Figure 9). Figure 12b illustrates a big rockslide (marked by P3 in Figure 9) that occurred within a fault zone blocking the valley. Further north of P3, we observed a region of distorted fringes (P4 in Figure 9) corresponding to a big landslide that blocked the road (Figure 12c). It is worth noting that all these medium-to-large-sized slope failures created zones of decorrelation in differential interferograms, helping us to easily identify and locate them on our field survey. Of particular interest are also two regions of decorrelation north of profile BB’ in Figure 9, where the seismic profile by Tavani et al. (2018) [24] showed evidence for hidden faults, labeled 3 and 4 in Figure 1 and Figure 9a. From the interferograms, it seems that many rockslides and slope failures happened along fault 4, causing a line of decorrelation in the interferograms. We also see a small offset in the fringes along fault 3 that might be related to secondary faulting there. As the majority of the region along faults 3 and 4 falls into Iraq, we could not proceed further in our field survey to document ground pictures at these locations.

4.3.3. Secondary Faulting

Another striking feature that we observed in the coseismic interferograms was related to an offset in the fringes around Qasr-e Shirin (marked by P5 in Figure 9a). This region is also highlighted in the residual map derived from modeling by black arrows (Figure 4h). We attributed this offset to a shallow surface creep along a pre-existing fault that goes through this area. In order to have a better estimation of the fault movement in this area, we drew a profile over the residual map across the fault crack (line PP’ in Figure 9d). Figure 9e,f shows the profile plot for ascending and descending geometries depicted by blue and red colors for Sentinel-1 and ALOS-2, respectively; the profiles represent movement of about +7 and −3 cm toward the LOS direction in ascending and descending geometries, respectively, suggesting a fault parallel motion of around 14 cm along this structure. Based on the LOS displacement with opposite signs for ascending and descending directions, the triggered slip mechanism was dominated by strike-slip motion. Several parallel and en echelon cracks were found in this region in response to the secondary shallow faulting along the structure passing through Qasr-e Shirin City (Figure 13). It is worth noting that this structure was not previously mapped in generalized geological maps of this area, but its existence can be easily verified by geomorphological analysis using 30-m DEM and Sentinel-2 data. Similar observations of shallow faulting in the surrounding region of the main shock were observed elsewhere [3,69,70,71].

5. Conclusions

We determined a coseismic deformation field and source model for the Mw 7.3, 2017 Sarpole-Zahab earthquake using Sentinel-1 and ALOS-2 SAR data. The InSAR-derived coseismic deformation pattern confirms that a buried oblique thrust fault is responsible for this event. Bayesian inversion of Sentinel-1 and ALOS-2 data suggests that a shallowly dipping fault at a depth 14–20 km striking NW with a maximum oblique slip of 5 m was the main source of this earthquake. The moment release calculated from the distributed slip model was 1.0565 × 10²⁰ N, equivalent to Mw 7.3. The inferred fault geometry from the geodetic data is in good agreement with the seismic observations, suggesting the existence of a decoupling horizon NW of the Zagros that contributes to seismogenic thick-skinned crustal shortening and vertical deformation there. Earthquake-induced failures in the form of rockslides, debris, and landslides were also observed along or close to pre-existing faults; the largest one was documented close to Mela-Kabod village, exhibiting motion of up to 34 m in the horizontal direction. Strike-slip motion on a shallow fault was triggered in and near the city of Qasr-e Shirin. We saw no evidence of primary ruptures from the main fault slip reaching the surface.

Supplementary Materials

The following are available online at https://www.mdpi.com/2072-4292/10/10/1589/s1: Figure S1: Band-pass decomposed signals; Figure S2: Sentinel-1 along-track observations; Figure S3: ALOS-2 observations, models, and residuals; Figure S4: Joint posterior probability distributions for source parameters; Table S1: Moment tensor solutions from various agencies; Table S2: Details of interferograms processed in this study; Table S3: Fault parameter intervals and best-fit solution from uniform slip inversion; Table S4. Fault plane solution suggested from geodetic and seismic data; Table S5. Uncertainty values calculated for across-track and along-track observations; Text file (slip_EQ2017_sarpole_zahab.txt): Slip distribution map details.

Author Contributions

S.V. did the modeling and the computational framework, analyzed the data, and drafted the original manuscript. M.M. was involved in planning for the project, writing of the manuscript, and supervision of the work. Z.M. participated in writing and substantively revising the article. K.M. processed the experimental seismic data to develop geodynamics implications, and modified the introduction in terms of the tectonic setting of the area. Z.M. and E.J.F. discussed the results and commented on the manuscript. H.-U.W. provided the geological map based on the available geology map and sentinel-2 optical data. M.M, B.A., and A.D. contributed to the field work.

Funding

This research received no external funding.

Acknowledgments

The Sentinel InSAR original data used in this paper are freely available and provided by Copernicus and ESA. Original ALOS-2 data are copyrighted by the Japanese Aerospace Exploration Agency (JAXA) and were provided under JAXA ALOS RA-4 project PI1162. Part of this research was supported by the NASA Earth Surface and Interior focus area and performed at the Jet Propulsion Laboratory, California Institute of Technology. Maps were prepared using the Generic Mapping Tools (GMT) , SOEST, University of Hawaii, USA [57]. We appreciate Mahmud Haghshenas-Haghighi for sharing his ALOS-2 results, Sigrid Roessner from GFZ for her assistance in the field, and Esmaeil Shabanian from IASBS for his constructive comments on the geodynamic model. We thank three anonymous reviewers for their careful reading of our manuscript and their insightful comments and suggestions.

Conflicts of Interest

The authors declare no conflicts of interest.

References

  1. Jackson, J.; Fitch, T. Basement faulting and the focal depths of the larger earthquakes in the Zagros mountains (Iran). Geophys. J. R. Astron. Soc. 1981. [Google Scholar] [CrossRef]
  2. Talebian, M.; Jackson, J. A reappraisal of earthquake focal mechanisms and active shortening in the Zagros mountains of Iran. Geophys. J. Int. 2004. [Google Scholar] [CrossRef]
  3. Angster, S.; Fielding, E.J.; Wesnousky, S.; Pierce, I.; Chamlagain, D.; Gautam, D.; Upreti, B.N.; Kumahara, Y.; Nakata, T. Field Reconnaissance after the 25 April 2015 M 7.8 Gorkha Earthquake. Seismol. Res. Lett. 2015. [Google Scholar] [CrossRef]
  4. Biggs, J.; Bergman, E.; Emmerson, B.; Funning, G.J.; Jackson, J.; Parsons, B.; Wright, T.J. Fault identification for buried strike-slip earthquakes using InSAR: The 1994 and 2004 Al Hoceima, Morocco earthquakes. Geophys. J. Int. 2006. [Google Scholar] [CrossRef]
  5. Bürgmann, R.; Hilley, G.; Ferretti, A.; Novali, F. Resolving vertical tectonics in the San Francisco Bay Area from permanent scatterer InSAR and GPS analysis. Geology 2006. [Google Scholar] [CrossRef]
  6. Grandin, R.; Doin, M.P.; Bollinger, L.; Pinel-Puysségur, B.; Ducret, G.; Jolivet, R.; Sapkota, S.N. Long-term growth of the Himalaya inferred from interseismic InSAR measurement. Geology 2012. [Google Scholar] [CrossRef]
  7. Nissen, E.; Ghorashi, M.; Jackson, J.; Parsons, B.; Talebian, M. The 2005 Qeshm Island earthquake (Iran)—A link between buried reverse faulting and surface folding in the Zagros Simply Folded Belt? Geophys. J. Int. 2007. [Google Scholar] [CrossRef]
  8. Motagh, M.; Schurr, B.; Anderssohn, J.; Cailleau, B.; Walter, T.R.; Wang, R.; Villotte, J.P. Subduction earthquake deformation associated with 14 November 2007, Mw 7.8 Tocopilla earthquake in Chile: Results from InSAR and aftershocks. Tectonophysics 2010. [Google Scholar] [CrossRef]
  9. Moreno, M.; Li, S.; Melnick, D.; Bedford, J.R.; Baez, J.C.; Motagh, M.; Metzger, S.; Vajedian, S.; Sippl, C.; Gutknecht, B.D.; et al. Chilean megathrust earthquake recurrence linked to frictional contrast at depth. Nat. Geosci. 2018. [Google Scholar] [CrossRef]
  10. Motagh, M.; Beavan, J.; Fielding, E.J.; Haghshenas, M. Postseismic ground deformation following the September 2010 Darfield, New Zealand, earthquake from terraSAR-X, COSMO-SkyMed, and ALOS InSAR. IEEE Geosci. Remote Sens. Lett. 2014. [Google Scholar] [CrossRef]
  11. Vernant, P.; Nilforoushan, F.; Hatzfeld, D.; Abbassi, M.R.; Vigny, C.; Masson, F.; Nankali, H.; Martinod, J.; Ashtiani, A.; Bayer, R.; et al. Present-day crustal deformation and plate kinematics in the Middle East constrained by GPS measurements in Iran and northern Oman. Geophys. J. Int. 2004. [Google Scholar] [CrossRef]
  12. Berberian, M. Master “blind” thrust faults hidden under the Zagros folds: Active basement tectonics and surface morphotectonics. Tectonophysics 1995. [Google Scholar] [CrossRef]
  13. Authemayou, C.; Chardon, D.; Bellier, O.; Malekzadeh, Z.; Shabanian, E.; Abbassi, M.R. Late Cenozoic partitioning of oblique plate convergence in the Zagros fold-and-thrust belt (Iran). Tectonics 2006. [Google Scholar] [CrossRef]
  14. Bowman, D.; King, G.; Tapponnier, P. Slip partitioning by elastoplastic propagation of oblique slip at depth. Science 2003. [Google Scholar] [CrossRef] [PubMed]
  15. Motaghi, K.; Shabanian, E.; Kalvandi, F. Underplating along the northern portion of the Zagros suture zone, Iran. Geophys. J. Int. 2017. [Google Scholar] [CrossRef]
  16. Tatar, M.; Hatzfeld, D.; Ghafory-Ashtiany, M. Tectonics of the Central Zagros (Iran) deduced from microearthquake seismicity. Geophys. J. Int. 2004. [Google Scholar] [CrossRef]
  17. Yaminifard, F.; Sedghi, M.H.; Gholamzadeh, A.; Tatar, M.; Hessami, K. Active faulting of the southeastern-most Zagros (Iran): Microearthquake seismicity and crustal structure. J. Geodyn. 2012. [Google Scholar] [CrossRef]
  18. Jackson, J.A. Reactivation of basement faults and crustal shortening in orogenic belts. Nature 1980. [Google Scholar] [CrossRef]
  19. Roustaei, M.; Nissen, E.; Abbassi, M.; Gholamzadeh, A.; Ghorashi, M.; Tatar, M.; Yamini-Fard, F.; Bergman, E.; Jackson, J.; Parsons, B. The 2006 March 25 Fin earthquakes (Iran)—Insights into the vertical extents of faulting in the Zagros Simply Folded Belt. Geophys. J. Int. 2010. [Google Scholar] [CrossRef]
  20. Nissen, E.; Tatar, M.; Jackson, J.A.; Allen, M.B. New views on earthquake faulting in the Zagros fold-and-thrust belt of Iran. Geophys. J. Int. 2011. [Google Scholar] [CrossRef] [Green Version]
  21. Motagh, M.; Bahroudi, A.; Haghighi, M.H.; Samsonov, S.; Fielding, E.; Wetzel, H.-U. The 18 August 2014 Mw 6.2 Mormori, Iran, Earthquake: A Thin-Skinned Faulting in the Zagros Mountain Inferred from InSAR Measurements. Seismol. Res. Lett. 2015, 86, 775–782. [Google Scholar] [CrossRef] [Green Version]
  22. Copley, A.; Karasozen, E.; Oveisi, B.; Elliott, J.R.; Samsonov, S.; Nissen, E. Seismogenic faulting of the sedimentary sequence and laterally variable material properties in the Zagros Mountains (Iran) revealed by the August 2014 murmuri (E. Dehloran) earthquake sequence. Geophys. J. Int. 2015. [Google Scholar] [CrossRef]
  23. Ambraseys, N.N.; Melville, C.P. A History of Persian Earthquakes; Cambridge Earth Science Series; Cambridge University Press: Cambridge, UK, 2005; ISBN 1107645794. [Google Scholar]
  24. Tavani, S.; Parente, M.; Puzone, F.; Corradetti, A.; Gharabeigli, G.; Valinejad, M.; Morsalnejad, D.; Mazzoli, S. The seismogenic fault system of the 2017 Mw7.3 Iran-Iraq earthquake: Constraints from surface and subsurface data, cross-section balancing, and restoration. Solid Earth 2018. [Google Scholar] [CrossRef]
  25. Barnhart, W.D.; Brengman, C.M.J.; Li, S.; Peterson, K.E. Ramp-flat basement structures of the Zagros Mountains inferred from co-seismic slip and afterslip of the 2017 Mw7.3 Darbandikhan, Iran/Iraq earthquake. Earth Planet. Sci. Lett. 2018. [Google Scholar] [CrossRef]
  26. Feng, W.; Samsonov, S.; Almeida, R.; Yassaghi, A.; Li, J.; Qiu, Q.; Li, P.; Zheng, W. Geodetic Constraints of the 2017 Mw7.3 Sarpol Zahab, Iran Earthquake, and Its Implications on the Structure and Mechanics of the Northwest Zagros Thrust-Fold Belt. Geophys. Res. Lett. 2018. [Google Scholar] [CrossRef]
  27. Vajedian, S.; Motagh, M. Coseismic Displacement Analysis of the 12 17 MW 7.3 Sarpol-e Zahab (IRAN) Earthquake from SAR Interferometry, Burst Overlap Interferometry and Offset Tracking. In Proceedings of the ISPRS TC III Mid-term Symposium Developments, Technologies and Applications in Remote Sensing, Beijing, China, 7–10 May 2018. [Google Scholar]
  28. Washaya, P.; Balz, T. SAR COHERENCE change detection of urban areas affected by disasters using Sentinel-1 imagery. ISPRS 2018, XLII-3, 1857–1861. [Google Scholar] [CrossRef]
  29. Karimzadeh, S.; Matsuoka, M.; Miyajima, M.; Adriano, B.; Fallahi, A.; Karashi, J. Sequential SAR coherence method for the monitoring of buildings in Sarpole-Zahab, Iran. Remote Sens. 2018. [Google Scholar] [CrossRef]
  30. Olen, S.; Bookhagen, B. Mapping damage-affected areas after natural hazard events using Sentinel-1 coherence time series. Remote Sens. 2018. [Google Scholar] [CrossRef]
  31. Miyamjima, M.; Fallahi, A.; Ikemoto, T.; Samaei, M.; Karimzadeh, S.; Setiawan, H.; Talebi, F.; Karashi, J. Site Investigation of the Sarpole-Zahab Earthquake, Mw 7.3 in SW Iran of November 12, 2017. JSCE J. Disaster FactSheets 2018. [Google Scholar]
  32. Wegmüller, U.; Werner, C. Gamma SAR processor and interferometry software. In Proceedings of the 3rd ERS Symposium, Florence, Italy, 14–21 March 1997. [Google Scholar]
  33. Prats-Iraola, P.; Scheiber, R.; Marotti, L.; Wollstadt, S.; Reigber, A. TOPS interferometry with terraSAR-X. IEEE Trans. Geosci. Remote Sens. 2012. [Google Scholar] [CrossRef] [Green Version]
  34. Farr, T.G.; Kobrick, M. Shuttle radar topography mission produces a wealth of data. Eos 2000. [Google Scholar] [CrossRef]
  35. Wegmüller, U.; Werner, C.; Wiesmann, A. ALOS-2 PALSAR-2 support in GAMMA Software; Gamma Remote Sensing: Gümligen, Switzerland, 2014. [Google Scholar]
  36. Costantini, M. A novel phase unwrapping method based on network programming. Geosci. Remote Sens. IEEE Trans. 1998. [Google Scholar] [CrossRef]
  37. Wang, H.; Liu-Zeng, J.; Ng, A.H.-M.; Ge, L.; Javed, F.; Long, F.; Aoudia, A.; Feng, J.; Shao, Z. Sentinel-1 observations of the 2016 Menyuan earthquake: A buried reverse event linked to the left-lateral Haiyuan fault. Int. J. Appl. Earth Obs. Geoinf. 2017. [Google Scholar] [CrossRef]
  38. Fattahi, H.; Simons, M.; Agram, P. InSAR Time-Series Estimation of the Ionospheric Phase Delay: An Extension of the Split Range-Spectrum Technique. IEEE Trans. Geosci. Remote Sens. 2017. [Google Scholar] [CrossRef]
  39. Wei, M.; Sandwell, D.T. Decorrelation of L-band and C-band interferometry over vegetated areas in California. IEEE Trans. Geosci. Remote Sens. 2010. [Google Scholar] [CrossRef]
  40. Wright, T.J. Toward mapping surface deformation in three dimensions using InSAR. Geophys. Res. Lett. 2004. [Google Scholar] [CrossRef]
  41. Grandin, R.; Klein, E.; Métois, M.; Vigny, C. Three-dimensional displacement field of the 2015 Mw8.3 Illapel earthquake (Chile) from across- and along-track Sentinel-1 TOPS interferometry. Geophys. Res. Lett. 2016. [Google Scholar] [CrossRef]
  42. Pathier, E.; Fielding, E.J.; Wright, T.J.; Walker, R.; Parsons, B.E.; Hensley, S. Displacement field and slip distribution of the 2005 Kashmir earthquake from SAR imagery. Geophys. Res. Lett. 2006. [Google Scholar] [CrossRef]
  43. Wang, T.; Shi, Q.; Nikkhoo, M.; Wei, S.; Barbot, S.; Dreger, D.; Bürgmann, R.; Motagh, M.; Chen, Q.F. The rise, collapse, and compaction of Mt. Mantap from the 3 September 2017 North Korean nuclear test. Science 2018. [Google Scholar] [CrossRef] [PubMed]
  44. Okada, Y. Surface deformation due to shear and tensile faults in a half-space Okada, Y Bull Seismol Soc AmV75, N4, Aug 1985, P1135–1154. Int. J. Rock Mech. Min. Sci. Geomech. Abstr. 1985. [Google Scholar] [CrossRef]
  45. Bagnardi, M.; Hooper, A. Inversion of Surface Deformation Data for Rapid Estimates of Source Parameters and Uncertainties: A Bayesian Approach. Geochem. Geophys. Geosyst. 2018. [Google Scholar] [CrossRef]
  46. Hastings, W.K. Monte carlo sampling methods using Markov chains and their applications. Biometrika 1970. [Google Scholar] [CrossRef]
  47. Lohman, R.B.; Simons, M. Some thoughts on the use of InSAR data to constrain models of surface deformation: Noise structure and data downsampling. Geochem. Geophys. Geosyst. 2005. [Google Scholar] [CrossRef]
  48. Harris, R.A.; Segall, P. Detection of a locked zone at depth on the Parkfield, California, segment of the San Andreas fault (USA). J. Geophys. Res. 1987. [Google Scholar] [CrossRef]
  49. Hansen, P.C.; O’Leary, D.P. The Use of the L-Curve in the Regularization of Discrete Ill-Posed Problems. SIAM J. Sci. Comput. 1993. [Google Scholar] [CrossRef]
  50. USGS U. S. Geological Survey (12 November 2017): M7.3—30km S of Halabjar, Iraq. Available online: https://earthquake.usgs.gov/earthquakes/eventpage/us2000bmcg#impact (accessed on 1 October 2018).
  51. Elliott, J.R.; Parsons, B.; Jackson, J.A.; Shan, X.; Sloan, R.A.; Walker, R.T. Depth segmentation of the seismogenic continental crust: The 2008 and 2009 Qaidam earthquakes. Geophys. Res. Lett. 2011. [Google Scholar] [CrossRef]
  52. Zhdanov, M.S. Inverse Theory and Applications in Geophysics; Elsevier: New York, NY, USA, 2015; ISBN 9780444626745. [Google Scholar]
  53. Aki, K. Asperities, barriers, characteristic earthquakes and strong motion prediction (Japan). J. Geophys. Res. 1984. [Google Scholar] [CrossRef]
  54. Julià, J.; Ammon, C.J.; Herrmann, R.B.; Correig, A.M. Joint inversion of receiver function and surface wave dispersion observations. Geophys. J. Int. 2000. [Google Scholar] [CrossRef]
  55. Jiang, M.; Chen, L. Fine Crustal Structure in the Northwestern Iranian Plateau Revealed by Ambient Noise Tomography. In Proceedings of the EGU General Assembly Conference Abstracts, Vienna Austria, 17–22 April 2016. [Google Scholar]
  56. Motaghi, K.; Tatar, M.; Priestley, K.; Romanelli, F.; Doglioni, C.; Panza, G.F. The deep structure of the Iranian Plateau. Gondwana Res. 2015. [Google Scholar] [CrossRef] [Green Version]
  57. Kennett, B.L.N.; Engdahl, E.R.; Buland, R. Constraints on seismic velocities in the Earth from traveltimes. Geophys. J. Int. 1995. [Google Scholar] [CrossRef]
  58. Hatzfeld, D.; Tatar, M.; Priestley, K.; Ghafory-Ashtiany, M. Seismological constraints on the crustal structure beneath the Zagros Mountain belt (Iran). Geophys. J. Int. 2003. [Google Scholar] [CrossRef]
  59. Alavi, M. Structures of the Zagros fold-thrust belt in Iran. Am. J. Sci. 2007. [Google Scholar] [CrossRef]
  60. Blanc, E.J.-P.; Allen, M.B.; Inger, S.; Hassani, H. Structural styles in the Zagros Simple Folded Zone, Iran. J. Geol. Soc. London 2003. [Google Scholar] [CrossRef]
  61. Emami, H.; Vergés, J.; Nalpas, T.; Gillespie, P.; Sharp, I.; Karpuz, R.; Blanc, E.P.; Goodarzi, M.G.H. Structure of the Mountain Front Flexure along the Anaran anticline in the Pusht-e Kuh Arc (NW Zagros, Iran): Insights from sand box models. Geol. Soc. London, Spec. Publ. 2010. [Google Scholar] [CrossRef]
  62. McQuarrie, N. Crustal scale geometry of the Zagros fold-thrust belt, Iran. J. Struct. Geol. 2004. [Google Scholar] [CrossRef]
  63. Jackson, M.P.A.; Talbot, C.J. External shapes, strain rates, and dynamics of salt structures. Geol. Soc. Am. Bull. 1986. [Google Scholar] [CrossRef]
  64. Talbot, C.J.; Alavi, M. The past of a future syntaxis across the Zagros. Geol. Soc. Lond. Spec. Publ. 1996. [Google Scholar] [CrossRef]
  65. Vergés, J.; Saura, E.; Casciello, E.; Fernàndez, M.; Villaseñor, A.; Jiménez-Munt, I.; García-Castellanos, D. Crustal-scale cross-sections across the NW Zagros belt: Implications for the Arabian margin reconstruction. Geol. Mag. 2011. [Google Scholar] [CrossRef]
  66. Hessami, K.; Jamali, F.; Tabassi, H. Major Active Faults of Iran; International Institute of Earthquake Engineering and Seismology (IIEES): Tehran, Iran, 2003. [Google Scholar]
  67. Tatar, M.; Hatzfeld, D.; Martinod, J.; Walpersdorf, A.; Ghafori-Ashtiany, M.; Chéry, J. The present-day deformation of the central Zagros from GPS measurements. Geophys. Res. Lett. 2002. [Google Scholar] [CrossRef]
  68. Wasowski, J.; Keefer, D.K.; Lee, C.T. Toward the next generation of research on earthquake-induced landslides: Current issues and future challenges. Eng. Geol. 2011, 122, 1–8. [Google Scholar] [CrossRef]
  69. Huang, M.H.; Tung, H.; Fielding, E.J.; Huang, H.H.; Liang, C.; Huang, C.; Hu, J.C. Multiple fault slip triggered above the 2016 Mw6.4 MeiNong earthquake in Taiwan. Geophys. Res. Lett. 2016. [Google Scholar] [CrossRef]
  70. Huang, M.H.; Fielding, E.J.; Liang, C.; Milillo, P.; Bekaert, D.; Dreger, D.; Salzer, J. Coseismic deformation and triggered landslides of the 2016 Mw6.2 Amatrice earthquake in Italy. Geophys. Res. Lett. 2017. [Google Scholar] [CrossRef]
  71. Wright, T.; Fielding, E.; Parsons, B. Triggered slip : Observations of the 17 August 1999 Izmit (Turkey) earthquake using radar interferometry. Geophys. Res. Lett. 2001. [Google Scholar] [CrossRef]
  72. Kramer, S.L. Geotechnical Earthquake Engineering; Pearson Education: London, UK, 1996; ISBN 0133749436. [Google Scholar]
Figure 1. (a) The tectonic settings of Iran. Red dots are earthquakes (Mw > 4.5) from the Global Centroid-Moment-Tensor (CMT) catalog (1976–2018), and blue arrows are GPS velocities relative to stable Eurasia from Vernant et al. (2004) [11]. The location of the study area shown in (b) is marked with a solid open rectangle. Two purple ellipses outline the location of the 1909 Silakhur and 1956 Sahneh earthquakes. MRF—Main Recent Fault; MZRF—Main Zagros Reverse Fault. (b) Shaded relief map of the study area. The beach balls show the location and focal mechanisms of the Mw 7.3, 12 November 2017 earthquake from various sources. The white star represents the location of the main shock suggested by the U.S. Geological Survey (USGS). The white lines are faults and lineaments extracted from a detailed geological interpretation based on DEM and Sentinel-2 optical data, as well as discontinuity observed in the interferometric synthetic aperture radar (InSAR) measurements. Line BB’ is the seismic profile of this region (Figure 6 in Reference [24]). Numbers 1–6 represent the surface expression of geological structures along line BB’. Yellow circles show the location of aftershocks (Mw > 2.5) provided by the Iranian Seismological Center (IRSC) during the 80 days after the main shock.
Remotesensing 10 01589 g001
Figure 2. Coseismic interferograms resulting from (a,b) Sentinel-1 C-band and (c,d) ALOS-2 L-band data. All interferograms were unwrapped and rewrapped again with each fringe representing 6 cm of ground deformation in the LOS direction. The white star shows the location of the main shock suggested by the USGS. (e,f) Scatter plots showing the correlation between Sentinel-1 and ALOS-2 data for ascending and descending geometry, respectively; the color bar corresponds to the density number of each point in the scatter plot (0—lowest density; 1—highest density).
Remotesensing 10 01589 g002
Figure 3. Interferometric versus combined offset tracking. (a,e) Across-track displacement map (unwrapped) derived from the interferometry in both descending and ascending geometries, respectively. (b,f) Across-track displacement map retrieved from the combined offset tracking in both descending and ascending geometries, respectively. (c,g) Along-track displacement map resulting from the combined offset tracking in descending and ascending geometries, respectively. (d,h) Low-pass components of (c,g), respectively. (i,j) Close-up views of (e,f), respectively, for a region affected by a big landslide (see Section 4.3.1). In (c,d,g,h), positive (red) and negative (blue) signs in descending and ascending directions indicate southward motion.
Remotesensing 10 01589 g003
Figure 4. (a,f) Sentinel-1 observations; (b,g) and (c,h) models and residuals constructed from uniform slip dislocation, respectively. (d,i) Models resulting from distributed slip, and (e,j) residuals after subtracting the distributed slip model from observations. The black rectangles depicted in (a,f) show the projection of the fault plane on the surface. The black line in (h) shows the fault crossing the Qasr-e Shirin region; the triggered motion on this fault is more obvious on the residual map (see Section 4.3.3). (k) Best-fitting distributed slip resulting from the least-squares inversion of InSAR data; the black dashed rectangle shows the region of the single uniform fault slip model. (l) Standard deviation of the slip distribution model.
Remotesensing 10 01589 g004
Figure 5. Surface projection of the coseismic slip distribution retrieved from (a) InSAR observations and (b) teleseismic waveform data. Black arrows denote slip directions of each fault patch on the hanging wall. Green dots in (a) are aftershocks (Mw > 2.5) in the first 60 days following the earthquake, obtained from the IRSC. The white, blue, and magenta stars mark the USGS, GFZ, and International Seismological Centre (ISC) locations, respectively, for the main shock epicenter. (c) Histogram of the aftershock with depth distribution reported by the IRSC catalog (Mw > 2.5) showing concentration of the aftershocks in a depth range of 7–12 km.
Remotesensing 10 01589 g005
Figure 6. Seismic data inversion for the velocity model. (a) Observed stacked receiver function (black line) with its error bar (black dashed lines) and synthetic (red line) receiver function computed for the simplified crustal model shown by the red line in (c). (b) Observed (solid black line) phase velocity with its error bar (black dashed lines) and synthetic (red line) phase velocity computed for the simplified crustal model shown by the red line in (c). (c) Shear-wave velocity model obtained from joint inversion (solid blue line) and the simplified crustal model (solid red line), which is considered as the final model. The dashed line is the initial velocity model.
Remotesensing 10 01589 g006
Figure 7. Block diagram illustrating how oblique convergence is accommodated in the northern portion of the Zagros collision zone. This model is supported by the slip distribution plane calculated in this study, as well as seismological (e.g., Reference [15]) and geological (e.g., Verges et al. 2011 [65]) observations. The white arrows show the N10°E direction of the Arabian plate convergence relative to the Eurasian plate. Solid black lines mark the major active faults in the region [66]. The geometries of the fault planes in the cross-section were extracted from our slip distribution plane aligned by the Main Frontal Fault (MFF) structure and the seismological model of Motaghi et al. (2017) [15]. Yellow and green arrows mark the convergence components accommodated by the MFF and Main Recent Fault (MRF), respectively. The beach balls show the cross-section view of the focal sphere, corresponding to the 2017 Sarpol-e Zahab earthquake. The dashed line marks the approximate bottom of the sedimentary layer based on Verges et al. (2011) [65]. MFF—Main Frontal Fault; HZF—High Zagros Fault; MRF—Main Recent Fault. The dashed line marked by AA’ shows the location of the profile presented in Figure 8. Line BB’ indicates the location of the seismic profile presented by Tavani et al. (2018) [24].
Remotesensing 10 01589 g007
Figure 8. (a) Three-dimensional (3D) surface deformation field of the 2017 Sarpol-e Zahab earthquake estimated from the distributed slip model in Figure 5a. (b) Vertical ground motion along profile AA’ in (a) with the shaded region representing topography variation along the profile (scale on the right axis); the beach ball represents the cross-sectional view of the focal mechanism of the 2017 Sarpol-e Zahab earthquake, and the red region represents the slip at depth.
Remotesensing 10 01589 g008
Figure 9. ALOS-2 coseismic ascending interferogram overlaid by pre-existing and recent structures of the area (a). Line AA’ in this figure shows the location of the profile plotted in Figure 8. (b) Close-up view of the interferograms in the area of the seismic profile, BB’ in (a), presented by Tavani et al. 2018 [24]. Numbers 1, 2, 3, and 4 are fault traces extracted after detailed geological interpretation based on DEM and Sentinel-2 data (See also Figure 1). (c,d) Close-up views of some of the areas affected by rockfalls and landslides; P1–P5 are the locations of field surveys. (e,f) Profiles along PP’ over the residual map.
Remotesensing 10 01589 g009
Figure 10. (a) Horst and graben structures due to normal faulting at the top of the Mela-Kabod landslide. The black arrows mark the scarp of a strike-slip fault. (b) The toe of the Mela-Kabod landslide and its direction of movement.
Remotesensing 10 01589 g010
Figure 11. 3D decomposition of along-track and across-track observations to derive (a) east–west displacement, (b) north–south horizontal movement, and (c) up–down displacement. Along-track and across-track observations were generated based on the combined offset-tracking method. Due to decorrelation, SAR interferometry was not able to resolve deformation signal in this area (see Figure 3i). (d) Horizontal movement represented as a vector shape. Blue arrows correspond to strike-slip motion along the fault passing through the landslide.
Remotesensing 10 01589 g011
Figure 12. (a) A small-sized rockslide blocking Piran waterfall (P2 in Figure 9). (b) A big rockslide at the fault zone identified by P3 in Figure 9. (c) A large landslide that blocked the connecting road and caused a region of phase distortion in Figure 9a (P4).
Remotesensing 10 01589 g012
Figure 13. (a,b) Ground photos of en echelon cracks developed at P5 in Figure 9. (c) Some cracks in Qasr-e Shirin City developed along the fault (white line passing through P5 in Figure 9) that was activated in the 2017 earthquake. (d) Close-up photo of area marked by the yellow rectangle in Figure 13c. The yellow arrow marks the region of fallen bricks at the building damaged by the earthquake.
Remotesensing 10 01589 g013

