Google Earth as a Powerful Tool for Archaeological and Cultural Heritage Applications: A Review

 ,
, 


 ,
, 
Abstract
1. Introduction
2. Google Earth
2.1. Google Earth Software
2.2. Data Sharing in KML Datasets
2.3. Google Earth in Literature
3. GE Based ACH Applications
3.1. Visualization and Integration of ACH Data
3.2. Data Collection and Exploration for ACH Prospection
3.3. Validation and Reference of ACH Interpretation
3.4. Monitoring and Assessment for Decision-Making Support of ACH Management
3.5. 3D Modelling and Virtual Tourism at ACH Sites
3.6. Communication and Dissemination of ACH Data and Results
4. The Merits and Limitations of GE
4.1. Comparative Analysis with Other Virtual Globes
4.2. Merits of GE for ACH Applications
- (i)
- User-friendly virtual globe software with an easy-to-use interface. GE provides great opportunities for public participation in archaeological prospection and cultural heritage management. The public can survey and browse the ACH site by using the measuring and flight tools in GE, respectively. All of the targets can be abstracted as geographical objects (points/lines/polygons) by using the geometric tools in GE. Users can directly label interesting features and upload related photos and videos by using the desktop application, even on-the-spot by using the mobile app from a smart phone or pad [140].
- (ii)
- GE has sufficient horizontal positional accuracy for searching and locating ACH sites. An evaluation of horizontal positional accuracies for GE’s images gives a 40 m root mean square error calculated from 436 points chosen worldwide [71]. Thus, for archaeological fieldwork, GE can be used in place of Global Positioning System (GPS) instruments as a navigational tool because it provides comprehensive Earth surface background information, especially in the trackless wilderness. It also indicates that GE VHR images are sufficient for site validation, which is a difficult-to-accomplish requirement in large-scale prospecting [43].
- (iii)
- Freely accessible multi-temporal and multi-resolution remote sensing imagery in GE promotes scientific research in archaeological prospection (investigation) and cultural heritage management (monitoring, assessment, and decision-making) by providing base data. The VHR and seamless mosaic remote sensing images in GE have an irreplaceable advantage for archaeological investigation, even on a global scale, which is a cost saving.
- (iv)
- Easy visualization is another significant merit. GE allows simultaneous access to diverse types of data (text, image and video), making it well-suited for the different purposes of ACH applications (management, education, training, and communication). KML, in combination with GE as a visualization platform, can be of great value once archaeological research has ended as it allows researchers to disseminate their results to the general public.
- (v)
- Up-to-date thematic layers deepen the understanding of the ACH site and its surroundings. For instance, the layers of 3D models and 360° panoramic street-level photos in GE could support virtual cultural heritage tourism and find clues that could allow the rediscovery of archaeological knowledge.
4.3. Limitations of GE
4.3.1. The Inconsistency of Remote Sensing Image Quality in GE
4.3.2. The Lack of Quantitative Measurements and Spatial Analysis in GE
4.3.3. Ethical Issues Related to the Use of GE in ACH Applications
5. GE-Based ACH Applications: Trends and Perspectives
5.1. Towards Big Remote Sensing Data
5.2. Towards an Analysis-Enhanced Virtual Globe
5.3. Towards a Harmonious Virtual Environment
5.4. Towards a Down-to-Earth Archaeological Tool
6. Conclusions
Supplementary Materials
Author Contributions
Funding
Acknowledgments
Conflicts of Interest
References
- Lasaponara, R.; Masini, N. Satellite remote sensing in archaeology: Past, present and future perspectives. J. Archaeol. Sci. 2011, 38, 1995–2002. [Google Scholar] [CrossRef]
- Hadjimitsis, D.G.; Agapiou, A.; Themistocleous, K.; Alexakis, D.D.; Sarris, A. Remote Sensing for Archaeological Applications: Management, Documentation and Monitoring. In Remote Sensing of Environment—Integrated Approaches; Hadjimitsis, D.G., Ed.; InTech: Paphos, Cyprus, 2013; pp. 57–95. [Google Scholar]
- Luo, L.; Wang, X.; Liu, J.; Guo, H.; Zong, X.; Ji, W.; Cao, H. VHR GeoEye-1 imagery reveals an ancient water landscape at the Longcheng site, northern Chaohu Lake Basin (China). Int. J. Digit. Earth 2017, 10, 139–154. [Google Scholar] [CrossRef]
- Brivio, P.A.; Pepe, M.; Tomasoni, R. Multispectral and multiscale remote sensing data for archaeological prospecting in an alpine alluvial plain. J. Cult. Herit. 2000, 1, 155–164. [Google Scholar] [CrossRef]
- Aminzadeh, B.; Samani, F. Identifying the boundaries of the historical site of Persepolis using remote sensing. Remote Sens. Environ. 2006, 102, 52–62. [Google Scholar] [CrossRef]
- Lasaponara, R.; Masini, N. Detection of archaeological crop marks by using satellite QuickBird multispectral imagery. J. Archaeol. Sci. 2007, 34, 214–221. [Google Scholar] [CrossRef]
- Evans, D.; Pottier, C.; Fletcher, R.; Hensley, S.; Tapley, I.; Milne, A.; Barbetti, M. A comprehensive archaeological map of the world’s largest preindustrial settlement complex at Angkor, Cambodia. Proc. Natl. Acad. Sci. USA 2007, 104, 14277–14282. [Google Scholar] [CrossRef] [PubMed]
- Garrison, T.G.; Houston, S.D.; Golden, C.; Inomata, T.; Nelson, Z.; Munson, J. Evaluating the use of IKONOS satellite imagery in lowland Maya settlement archaeology. J. Archaeol. Sci. 2008, 35, 2770–2777. [Google Scholar] [CrossRef]
- Alexakis, D.; Sarris, A.; Astaras, T.; Albanakis, K. Detection of Neolithic settlements in Thessaly (Greece) through multispectral and hyperspectral satellite imagery. Sensors 2009, 9, 1167–1187. [Google Scholar] [CrossRef] [PubMed]
- Rajani, M.B.; Rajawat, A.S. Potential of satellite based sensors for studying distribution of archaeological sites along palaeochannels: Harappan sites a case study. J. Archaeol. Sci. 2011, 38, 2010–2016. [Google Scholar] [CrossRef]
- Agapiou, A.; Alexakis, D.D.; Hadjimitsis, D.G. Spectral sensitivity of ALOS, ASTER, IKONOS, LANDSAT and SPOT satellite imagery intended for the detection of archaeological crop marks. Int. J. Digit. Earth 2014, 7, 351–372. [Google Scholar] [CrossRef]
- Luo, L.; Wang, X.; Liu, C.; Guo, H.; Du, X. Integrated RS, GIS and GPS approaches to archaeological prospecting in the Hexi Corridor, NW China: A case study of the royal road to ancient Dunhuang. J. Archaeol. Sci. 2014, 50, 178–190. [Google Scholar] [CrossRef]
- Agapiou, A.; Alexakis, D.D.; Sarris, A.; Hadjimitsis, D.G. Evaluating the potentials of Sentinel-2 for archaeological perspective. Remote Sens. 2014, 6, 2176–2194. [Google Scholar] [CrossRef]
- Lasaponara, R.; Leucci, G.; Masini, N.; Persico, R.; Scardozzi, G. Towards an operative use of remote sensing for exploring the past using satellite data: The case study of Hierapolis (Turkey). Remote Sens. Environ. 2016, 174, 148–164. [Google Scholar] [CrossRef]
- Aqdus, S.A.; Hanson, W.S.; Drummond, J. The potential of hyperspectral and multi-spectral imagery to enhance archaeological cropmark detection: A comparative study. J. Archaeol. Sci. 2012, 39, 1915–1924. [Google Scholar] [CrossRef]
- Abrams, M.; Comer, D. Multispectral and hyperspectral technology and archaeological applications. In Mapping Archaeological Landscapes from Space; Comer, D.C., Harrower, M.J., Eds.; Springer: New York, NY, USA, 2013; pp. 51–71. [Google Scholar]
- Agapiou, A.; Hadjimitsis, D.G.; Sarris, A.; Georgopoulos, A.; Alexakis, D.D. Optimum temporal and spectral window for monitoring crop marks over archaeological remains in the Mediterranean region. J. Archaeol. Sci. 2013, 40, 1479–1492. [Google Scholar] [CrossRef]
- Atzberger, C.; Wess, M.; Doneus, M.; Verhoeven, G. ARCTIS—A MATLAB® Toolbox for archaeological imaging spectroscopy. Remote Sens. 2014, 6, 8617–8638. [Google Scholar] [CrossRef]
- Doneus, M.; Verhoeven, G.; Atzberger, C.; Wess, M.; Ruš, M. New ways to extract archaeological information from hyperspectral pixels. J. Archaeol. Sci. 2014, 52, 84–96. [Google Scholar] [CrossRef]
- McCauley, J.F.; Schaber, G.G.; Breed, C.S.; Grolier, M.J.; Haynes, C.V.; Issawi, B.; Elachi, C.; Blom, R. Subsurface valleys and geoarchaeology of the eastern Sahara revealed by shuttle radar. Science 1982, 218, 1004–1020. [Google Scholar] [CrossRef] [PubMed]
- Moore, E.; Freeman, T.; Hensley, S. Spaceborne and airborne radar at Angkor: Introducing new technology to the ancient site. In Remote Sensing in Archaeology; Wiseman, J., El-Baz, F., Eds.; Springer: New York, NY, USA, 2007; pp. 185–216. [Google Scholar]
- Dore, N.; Patruno, J.; Pottier, E.; Crespi, M. New research in polarimetric SAR technique for archaeological purposes using ALOS PALSAR data. Archaeol. Prospect. 2013, 20, 79–87. [Google Scholar] [CrossRef]
- Stewart, C.; Lasaponara, R.; Schiavon, G. Multi-frequency, polarimetric SAR analysis for archaeological prospection. Int. J. Appl. Earth Obs. Geoinf. 2014, 28, 211–219. [Google Scholar] [CrossRef]
- Chen, F.; Masini, N.; Yang, R.; Milillo, P.; Feng, D.; Lasaponara, R. A space view of radar archaeological marks: First applications of COSMO-SkyMed X-Band Data. Remote Sens. 2015, 7, 24–50. [Google Scholar] [CrossRef]
- Tapete, D.; Cigna, F.; Donoghue, D. ‘Looting marks’ in space-borne SAR imagery: Measuring rates of archaeological looting in Apamea (Syria) with TerraSAR-X Staring Spotlight. Remote Sens. Environ. 2016, 178, 42–58. [Google Scholar] [CrossRef]
- Stewart, C.; Montanaro, R.; Sala, M.; Riccardi, P. Feature extraction in the north Sinai Desert using spaceborne synthetic aperture radar: Potential archaeological applications. Remote Sens. 2016, 8, 825. [Google Scholar] [CrossRef]
- Challis, K.; Howard, A.J. A review of trends within archaeological remote sensing in alluvial environments. Archaeol. Prospect. 2006, 13, 231–240. [Google Scholar] [CrossRef]
- Nie, Y.; Yang, N. Applications and development of archaeological remote sensing technology in China. J. Remote Sens. 2009, 13, 940–962. [Google Scholar]
- Deng, B.; Guo, H.D.; Wang, C.L.; Nie, Y.P. Application of remote sensing technique in archaeology: A review. J. Remote Sens. 2010, 14, 187–206. [Google Scholar]
- Chen, F.; Lasaponara, R.; Masini, N. An overview of satellite synthetic aperture radar remote sensing in archaeology: From site detection to monitoring. J. Cult. Herit. 2017, 23, 5–11. [Google Scholar] [CrossRef]
- Tapete, D.; Cigna, F. Trends and perspectives of space-borne SAR remote sensing for archaeological landscape and cultural heritage applications. J. Archaeol. Sci. Rep. 2017, 14, 716–726. [Google Scholar] [CrossRef]
- Lasaponara, R.; Masini, N. Remote sensing in archaeology: From visual data interpretation to digital data manipulation. In Satellite Remote Sensing: A New Tool for Archaeology; Lasaponara, R., Masini, N., Eds.; Springer: New York, NY, USA, 2012; pp. 3–16. [Google Scholar]
- Stubbs, J.H.; McKee, K.L.R. Application of remote sensing to understanding and management of cultural heritage sites. In Remote Sensing in Archaeology; Wiseman, J., El-Baz, F., Eds.; Springer: New York, NY, USA, 2007; pp. 515–540. [Google Scholar]
- Myers, A. Camp Delta, Google Earth and the ethics of remote sensing in archaeology. World Archaeol. 2010, 42, 455–467. [Google Scholar] [CrossRef]
- Myers, A. Field work in the age of digital reproduction: A review of the potentials and limitations of Google Earth for archaeologists. SAA Archaeol. Rec. 2010, 4, 7–11. [Google Scholar]
- Luo, L.; Wang, X.; Guo, H.; Liu, C.; Liu, J.; Li, L.; Du, X.; Qian, G. Automated extraction of the archaeological tops of Qanat shafts from VHR Imagery in Google Earth. Remote Sens. 2014, 6, 11956–11976. [Google Scholar] [CrossRef]
- Schadla-Hall, D. Editorial: Public archaeology. Eur. J. Archaeol. 1999, 2, 147–158. [Google Scholar] [CrossRef]
- Conolly, J.; Lake, M. Geographical Information Systems in Archaeology; Cambridge University Press: Landon, UK, 2006; pp. 33–50. [Google Scholar]
- Church, T.; Brandon, J.R.; Burgett, G. GIS Applications in Archaeology, Method in Search of Theory, Practical Applications of GIS for Archaeologists e a Predictive Modeling Toolkit; Taylor & Francis: London, UK, 2000. [Google Scholar]
- Woodman, P.E. A predictive model for Mesolithic site location on Islay using logistic regression and GIS. In Hunter-Gatherer Landscape Archaeology: The Southern Hebrides Mesolithic Project 1988e1998, Archaeological Fieldwork on Colonsay, Computer Modelling, Experimental Archaeology, and Final Interpretations; McDonald Institute Monographs: Cambridge, UK, 2000; Volume 2, pp. 444–464. [Google Scholar]
- Conroy, G.C.; Anemone, R.L.; Regenmorter, J.V.; Addison, A. Google Earth, GIS and the Great Divide: A new and simple method for sharing paleontological data. J. Hum. Evol. 2008, 55, 751–755. [Google Scholar] [CrossRef] [PubMed]
- Renner, R.D.; Hemani, Z.Z.; Tjouman, G.C. Extending advanced geospatial analysis capabilities to popular visualization tools. Technol. Rev. J. 2009, 17, 89–106. [Google Scholar]
- Yu, L.; Gong, P. Google Earth as a virtual globe tool for Earth science applications at the global scale: Progress and perspectives. Int. J. Remote Sens. 2012, 33, 3966–3986. [Google Scholar] [CrossRef]
- Wood, J.; Dykes, J.; Slingsby, A.; Clarke, K. Interactive visual exploration of a large spatio-temporal dataset: Reflections on a geovisualization mashup. IEEE Trans. Vis. Comput. Graph. 2007, 13, 1176–1183. [Google Scholar] [CrossRef] [PubMed]
- Mccoy, M.D. Geospatial big data and archaeology: Prospects and problems too great to ignore. J. Archaeol. Sci. 2017, 84, 74–94. [Google Scholar] [CrossRef]
- Agapiou, A. Remote sensing heritage in a petabyte-scale: Satellite data and heritage Earth Engine applications. Int. J. Digit. Earth 2017, 10, 85–102. [Google Scholar] [CrossRef]
- Craglia, M.; Goodchild, M.F.; Annoni, A.; Camara, G.; Gould, M.; Kuhn, W.; Mark, D.; Masser, I.; Maguire, D.; Liang, S.; et al. Next-generation digital Earth—A position paper from the Vespucci Initiative for the Advancement of Geographic Information Science. Int. J. Spat. Data Infrastruct. Res. 2008, 3, 146–167. [Google Scholar]
- Goodchild, M.F. The use cases of digital earth. Int. J. Digit. Earth 2008, 1, 31–42. [Google Scholar] [CrossRef]
- Goodchild, M.F.; Guo, H.; Annoni, A.; Bian, L.; De, B.K.; Campbell, F.; Craglia, M.; Ehlers, M.; van Genderen, J.; Jackson, D.; et al. Next-generation digital earth. Proc. Natl. Acad. Sci. USA 2012, 109, 11088–11094. [Google Scholar] [CrossRef] [PubMed]
- Foresman, T.W. Evolution and implementation of the Digital Earth vision, technology and society. Int. J. Digit. Earth 2008, 1, 4–16. [Google Scholar] [CrossRef]
- Stensgaard, A.S.; Saarnak, C.F.L.; Utzinger, J.; Vounatsou, P.; Simoonga, C.; Mushinge, G.; Rahbek, C.; Møhlenberg, F.; Kristensen, T.K. Virtual globes and geospatial health: The potential of new tools in the management and control of vector-borne diseases. Geospat. Health 2009, 3, 127–141. [Google Scholar] [CrossRef] [PubMed]
- Pringle, H. Google Earth shows clandestine worlds. Science 2010, 329, 1008–1009. [Google Scholar] [CrossRef] [PubMed]
- Guo, H. Big Earth data: A new frontier in Earth and information sciences. Big Earth Data 2017, 1, 4–20. [Google Scholar] [CrossRef]
- Hansen, M.C.; Potapov, P.V.; Moore, R.; Hancher, M.; Turubanova, S.A.; Tyukavina, A.; Thau, D.; Stehman, S.V.; Goetz, S.J.; Loveland, T.R.; et al. High-resolution global maps of 21st-century forest cover change. Science 2014, 344, 850–853. [Google Scholar] [CrossRef] [PubMed]
- Kobayashi, T.; Tsend-Ayush, J.; Tateishi, R. A New Tree Cover Percentage Map in Eurasia at 500 m Resolution Using MODIS Data. Remote Sens. 2014, 6, 209–232. [Google Scholar] [CrossRef]
- Carroll, M.L.; Townshend, J.R.; Dimiceli, C.M.; Noojipady, P.; Sohlberg, R.A. A new global raster water mask at 250 m resolution. Int. J. Digit. Earth 2009, 2, 291–308. [Google Scholar] [CrossRef]
- Pekel, J.F.; Cottam, A.; Gorelick, N.; Belward, A.S. High-resolution mapping of global surface water and its long-term changes. Nature 2016, 540, 418–422. [Google Scholar] [CrossRef] [PubMed]
- Schneider, A.; Friedl, M.A.; Potere, D. Mapping global urban areas using MODIS 500-m data: New methods and datasets based on ‘urban ecoregions’. Remote Sens. Environ. 2010, 114, 1733–1746. [Google Scholar] [CrossRef]
- Melchiorri, M.; Florczyk, A.J.; Freire, S.; Schiavina, M.; Pesaresi, M.; Kemper, T. Unveiling 25 Years of Planetary Urbanization with Remote Sensing: Perspectives from the Global Human Settlement Layer. Remote Sens. 2018, 10, 768. [Google Scholar] [CrossRef]
- Wikipedia. Available online: https://en.wikipedia.org/wiki/Virtual_globe (accessed on 31 January 2018).
- Wikipedia. Available online: https://en.wikipedia.org/wiki/Google_Earth (accessed on 31 January 2018).
- Lesiv, M.; See, L.; Laso-Bayas, J.; Sturn, T.; Schepaschenko, D.; Karner, M.; Moorthy, I.; McCallum, I.; Fritz, S. A global snapshot of the spatial and temporal distribution of very high resolution satellite imagery in Google Earth and Bing Maps as of 11th of January, 2017. PANGAEA 2018. [Google Scholar] [CrossRef]
- Bar-Zeev, A. How Google Earth [Really] Works. 2007. Available online: http://www.realityprime.com/articles/how-google-earth-really-works (accessed on 11 April 2018).
- Bailey, J.E.; Chen, A. The role of virtual globes in geoscience. Comput. Geosci. 2011, 37, 1–2. [Google Scholar] [CrossRef]
- Visser, V.; Langdon, B.; Pauchard, A.; Richardson, D.M.; Richardson, D.M.; Hui, C. Unlocking the potential of Google Earth as a tool in invasion science. Biol. Invasions 2014, 16, 513–534. [Google Scholar] [CrossRef]
- Chien, N.; Tan, S. Google earth as a tool in 2-D hydrodynamic modeling. Comput. Geosci. 2011, 37, 38–46. [Google Scholar] [CrossRef]
- Aurambout, J.P.; Pettit, C. Digital globes: Gates to the digital Earth. In Digital Earth Summit on Geoinformatics 2008: Tools for Global Change Research; Ehlers, M., Behncke, K., Gerstengarbe, F.-W., Hillen, F., Koppers, L., Stroink, L., Wachter, J., Eds.; Wichmann: Heidelberg, Germany, 2008; pp. 233–238. [Google Scholar]
- Creating KML in ArcGIS Desktop, ESRI ArcGIS. Available online: http://desktop.arcgis.com/en/arcmap/latest/manage-data/kml/creating-kml-in-arcgis-for-desktop.htm (accessed on 11 April 2018).
- Global Mapper User Guide, 2016. Available online: http://www.bluemarblegeo.com/knowledgebase/global-mapper-19-1-v2/ (accessed on 11 April 2018).
- OGC KML 2.3 Standard, 2015. Available online: http://docs.opengeospatial.org/is/12-007r2/12-007r2.html (accessed on 11 April 2018).
- Potere, D. Horizontal positional accuracy of Google Earth’s high-resolution imagery archive. Sensors 2008, 8, 7973–7981. [Google Scholar] [CrossRef] [PubMed]
- Guirado, E.; Tabik, S.; Alcaraz-Segura, D.; Cabello, J.; Herrera, F. Deep-learning Versus OBIA for Scattered Shrub Detection with Google Earth Imagery: Ziziphus lotus as Case Study. Remote Sens. 2017, 9, 1220. [Google Scholar] [CrossRef]
- Yang, X.; Sun, H.; Fu, K.; Yang, J.; Sun, X.; Yan, M.; Guo, Z. Automatic Ship Detection in Remote Sensing Images from Google Earth of Complex Scenes Based on Multiscale Rotation Dense Feature Pyramid Networks. Remote Sens. 2018, 10, 132. [Google Scholar] [CrossRef]
- Chen, Z.; Zhang, T.; Ouyang, C. End-to-End Airplane Detection Using Transfer Learning in Remote Sensing Images. Remote Sens. 2018, 10, 139. [Google Scholar] [CrossRef]
- Fritz, S.; McCallum, I.; Schill, C.; Perger, C.; Grillmayer, R.; Achard, F.; Kraxner, F.; Obersteiner, M. Geo-Wiki.Org: The Use of Crowdsourcing to Improve Global Land Cover. Remote Sens. 2009, 1, 345–354. [Google Scholar] [CrossRef]
- See, L.; Fritz, S.; Perger, C.; Schill, C.; McCallum, I.; Schepaschenko, D.; Duerauer, M.; Sturn, T.; Karner, M.; Kraxner, F.; et al. Harnessing the power of volunteers, the internet and Google Earth to collect and validate global spatial information using Geo-Wiki. Technol. Forecast. Soc. Chang. 2015, 98, 324–335. [Google Scholar] [CrossRef]
- Clark, M.; Aide, T. Virtual Interpretation of Earth Web-Interface Tool (VIEW-IT) for Collecting Land-Use/Land-Cover Reference Data. Remote Sens. 2011, 3, 601–620. [Google Scholar] [CrossRef]
- Han, G.; Chen, J.; He, C.; Li, S.; Wu, H.; Liao, A.; Peng, S. A web-based system for supporting global land cover data production. ISPRS J. Photogramm. Remote Sens. 2015, 103, 66. [Google Scholar] [CrossRef]
- Bey, A.; Sánchez-Paus Díaz, A.; Maniatis, D.; Marchi, G.; Mollicone, D.; Ricci, S.; Bastin, J.; Moore, R.; Federici, S.; Rezende, M.; et al. Collect Earth: Land Use and Land Cover Assessment through Augmented Visual Interpretation. Remote Sens. 2016, 8, 807. [Google Scholar] [CrossRef]
- Collect Earth, 2016. Available online: http://collectearth.net/ (accessed on 11 April 2018).
- Parks, L. Digging into Google Earth: An analysis of “Crisis in Darfur”. Geoforum 2009, 40, 535–545. [Google Scholar] [CrossRef]
- Chang, M.; Parrales, J.; Jimenez, M.; Sobieszczyk, S.; Hammer, D.; Copenhaver, R. Kulkarni, Combining Google Earth and GIS mapping technologies in a dengue surveillance system for developing countries. Int. J. Health Geogr. 2009, 8, 1–11. [Google Scholar] [CrossRef] [PubMed]
- Yang, X.; Jiang, G.; Luo, X.; Zheng, Z. Preliminary mapping of high-resolution rural population distribution based on imagery from Google Earth: A case study in the Lake Tai basin, eastern China. Appl. Geogr. 2012, 32, 221–227. [Google Scholar] [CrossRef]
- Trujillo, P.; Piroddi, C.; Jacquet, J. Fish Farms at Sea: The Ground Truth from Google Earth. PLoS ONE 2012, 7, e30546. [Google Scholar] [CrossRef] [PubMed]
- Palmer, R. Google Maps. AARGnews 2005, 31, 38–39. [Google Scholar]
- Beck. Google earth and world wind: Remote sensing for the masses? Antiquity 2006, 80, 308. [Google Scholar]
- Ur, J. Google Earth and archaeology. SAA Archaeol. Rec. 2006, 6, 35–38. [Google Scholar]
- Parcak, S. Satellite Remote Sensing for Archaeology; Routledge Press: New York, NY, USA, 2009. [Google Scholar]
- Kaimaris, D.; Georgoula, O.; Patias, P.; Stylianidis, E. Comparative analysis on the archaeological content of imagery from Google Earth. J. Cult. Herit. 2011, 12, 263–269. [Google Scholar] [CrossRef]
- Lasaponara, R.; Masini, N. Beyond modern landscape features: New insights in the archaeological area of Tiwanaku in Bolivia from satellite data. Int. J. Appl. Earth Obs. Geoinf. 2014, 26, 464–471. [Google Scholar] [CrossRef]
- World Heritage List. Available online: http://whc.unesco.org/en/list/xls/?2018 (accessed on 3 May 2018).
- World Heritage List Statistics. Available online: http://whc.unesco.org/en/list/stat (accessed on 3 May 2018).
- Luo, L. Spatial distribution characteristics of world heritage sites in China: A geographical perspective. In Proceedings of the 3rd Pan–Eurasian Experiment (PEEX) Science Conference, Moscow, Russia, 19–22 September 2017. [Google Scholar]
- Stein, A. Innermost Asia: Detailed Report of Explorations in Central Asia, Kansu and Eastern Iran; Clarendon Press: Oxford, UK, 1928. [Google Scholar]
- Hedin, S. Scientific Results of a Journey in Central Asia 1899–1902; Lithographic Institute of the General Staff of the Swedish Army: Stockholm, UK, 1907; Volume 6. [Google Scholar]
- Luo, L.; Wang, X.; Lasaponara, R.; Xiang, B.; Zhen, J.; Zhu, L.; Yang, R.; Liu, D.; Liu, C. Auto-Extraction of Linear Archaeological Traces of Tuntian Irrigation Canals in Miran Site (China) from Gaofen-1 Satellite Imagery. Remote Sens. 2018, 10, 718. [Google Scholar] [CrossRef]
- Luo, L.; Wang, X.; Liu, J.; Guo, H.; Lasaponara, R.; Ji, W. Uncovering the ancient canal-based Tuntian agricultural landscape at China’s northwestern frontiers. J. Cult. Herit. 2017, 23, 79–88. [Google Scholar] [CrossRef]
- Hu, Q.; Wu, W.; Xia, T.; Yu, Q.; Yang, P.; Li, Z.; Song, Q. Exploring the Use of Google Earth Imagery and Object-Based Methods in Land Use/Cover Mapping. Remote Sens. 2013, 5, 6026–6042. [Google Scholar] [CrossRef]
- Kennedy, D.; Bishop, M.C. Google earth and the archaeology of Saudi Arabia: A case study from the Jeddah area. J. Archaeol. Sci. 2011, 38, 1284–1293. [Google Scholar] [CrossRef]
- Thomas, D.; Kidd, F.; Nikolovski, S.; Zipfel, C. The archaeological sites of Afghanistan in Google Earth. AARGnews 2008, 37, 22–30. [Google Scholar]
- Hritz, C. A malarial-ridden swamp: Using Google Earth Pro and Corona to access the southern Balikh valley, Syria. J. Archaeol. Sci. 2013, 40, 1975–1987. [Google Scholar] [CrossRef]
- Sadr, K.; Rodier, X. Google Earth, GIS and stone-walled structures in southern Gauteng, South Africa. J. Archaeol. Sci. 2012, 39, 1034–1042. [Google Scholar] [CrossRef]
- Luo, L.; Wang, X.; Liu, J.; Guo, H. Ancient stone tidal weirs in Penghu archipelago: Distribution, category, structure and function, a Google Earth and GIS approach. ISPRS—Int. Arch. Photogramm. Remote Sens. Spat. Inf. Sci. 2015, XL-5/W7, 311–314. [Google Scholar] [CrossRef]
- Luo, L.; Wang, X.; Liu, J.; Guo, H. Google Earth for coastal archaeological investigation: Case study of ancient stone tidal weirs in Penghu Islands, China. 2018. under review. [Google Scholar]
- Stinson, P.T.; Naglak, M.C.; Mandel, R.D.; Hoopes, J.W. The remote-sensing assessment of a threatened ancient water technology in Afghanistan. J. Archaeol. Sci. Rep. 2016, 10, 441–453. [Google Scholar] [CrossRef]
- Kempe, S.; Al-Malabeh, A. Desert kites in Jordan and Saudi Arabia: Structure, statistics and function, a Google Earth study. Quat. Int. 2013, 297, 126–146. [Google Scholar] [CrossRef]
- Brown Vega, M.; Craig, N.; Asencios Lindo, G. Ground truthing of remotely identified fortifications on the central coast of Perú. J. Archaeol. Sci. 2013, 38, 1680–1689. [Google Scholar] [CrossRef]
- Globalkites. Available online: http://www.globalkites.fr/Interactive-Map (accessed on 3 May 2018).
- Traviglia, A.; Torsello, A. Landscape pattern detection in archaeological remote sensing. Geosciences 2017, 7, 128. [Google Scholar] [CrossRef]
- Figorito, B.; Tarantino, E. Semi-automatic extraction of linear archaeological traces from orthorectified aerial images. Int. J. Appl. Earth Obs. Geoinf. 2014, 26, 458–463. [Google Scholar] [CrossRef]
- Lasaponara, R.; Masini, N. Space-Based Identification of Archaeological Illegal Excavations and a New Automatic Method for Looting Feature Extraction in Desert Areas. Surv. Geophys. 2018. [Google Scholar] [CrossRef]
- Tripati, S.; Murali, R.M.; Seelam, J.K.; Pradhan, A.K.; Behera, R.P.; Choudhury, R. Khalkattapatna port: The lost archaeological heritage of Odisha, east coast of India. Curr. Sci. 2015, 109, 25–2015. [Google Scholar]
- Conesa, F.C.; Madella, M.; Galiatsatos, N.; Balbo, A.L.; Rajesh, S.V.; Ajithprasad, P. Corona photographs in monsoonal semi-arid environments: Addressing archaeological surveys and historic landscape dynamics over north Gujarat, India. Archaeol. Prospect. 2015, 22, 75–90. [Google Scholar] [CrossRef]
- Sadr, K. A comparison of accuracy and precision in remote sensing stone-walled structures with google earth, high resolution aerial photography and lidar; a case study from the South African Iron Age. Archaeol. Prospect. 2016, 23, 95–104. [Google Scholar] [CrossRef]
- Tapete, D.; Cigna, F. Appraisal of Opportunities and Perspectives for the Systematic Condition Assessment of Heritage Sites with Copernicus Sentinel-2 High-Resolution Multispectral Imagery. Remote Sens. 2018, 10, 561. [Google Scholar] [CrossRef]
- Danti, M.D.; Cuneo, A.; Penacho, S.; Al-Azm, A.; Rouhani, B.; Gabriel, M.; Kaercher, K. ASOR Cultural Heritage Initiatives Weekly Report 105–106 (August 3, 2016–August 18, 2016)—ASOR Cultural Heritage Initiatives. Available online: http://www.asor-syrianheritage.org/asor-cultural-heritage-initiatives-weekly-report-105-106-august-3-2016-august-18-2016/ (accessed on 31 January 2018).
- Chen, F.; Masini, N.; Liu, J.; You, J.; Lasaponara, R. Multi-frequency satellite radar imaging of cultural heritage: The case studies of the Yumen Frontier Pass and Niya ruins in the Western Regions of the Silk Road Corridor. Int. J. Digit. Earth 2016, 9, 1224–1241. [Google Scholar] [CrossRef]
- Mering, C.; Baro, J.; Upegui, E. Retrieving urban areas on google earth images: application to towns of West Africa. Int. J. Remote Sens. 2010, 31, 5867–5877. [Google Scholar] [CrossRef]
- Looted Heritage 2016. Looted Heritage Monitoring the Illicit Antiquities Trade. Available online: https://heritage.crowdmap.com/main (accessed on 6 March 2018).
- Casana, J. Satellite imagery-based analysis of archaeological looting in Syria. Near Eastern Archaeol. 2015, 78, 142–152. [Google Scholar] [CrossRef]
- Contreras, D.A.; Brodie, N. The utility of publicly-available satellite imagery for investigating looting of archaeological sites in Jordan. J. Field Archaeol. 2010, 35, 101–114. [Google Scholar] [CrossRef]
- Contreras, D.A. Huaqueros and remote sensing imagery: Assessing looting damage in the Viru Valley, Peru. Antiquity 2010, 84, 544–555. [Google Scholar] [CrossRef]
- Lasaponara, R.; Leucci, G.; Masini, N.; Persico, R. Investigating archaeological looting using satellite images and GEORADAR: The experience in Lambayeque in North Peru. J. Archaeol. Sci. 2014, 42, 216–230. [Google Scholar] [CrossRef]
- Parcak, S.; Gathings, D.; Childs, C.; Mumford, G.; Cline, E. Satellite evidence of archaeological site looting in Egypt: 2002–2013. Antiquity 2016, 90, 188–205. [Google Scholar] [CrossRef]
- Parcak, S. Archaeological looting in Egypt: A geospatial view (case studies from Saqqara, Lisht, and el Hibeh). Near Eastern Archaeol. 2015, 78, 196–203. [Google Scholar] [CrossRef]
- Trafficking Culture. 2012. Looting at Apamea Recorded via Google Earth. Available online: http://traffickingculture.org/data/looting-at-apamea-recorded-via-google-earth/ (accessed on 27 May 2018).
- Lawler, A. Satellites track heritage loss across Syria and Iraq. Science 2014, 346, 1162–1163. [Google Scholar] [CrossRef] [PubMed]
- Danti, M.; Branting, S.; Penacho, S. The American Schools of Oriental Research Cultural Heritage Initiatives: Monitoring Cultural Heritage in Syria and Northern Iraq by Geospatial Imagery. Geosciences 2017, 7, 95. [Google Scholar] [CrossRef]
- Hanson, K. Cultural heritage in crisis: An analysis of archaeological sites in Syria through Google Earth and Bing Map satellite imagery. J. Archaeol. Sci. 2016. in review. [Google Scholar]
- UNITAR 2014. “Satellite-based Damage Assessment to Cultural Heritage Sites in Syria”. Available online: http://unosat.web.cern.ch/unosat/unitar/downloads/chs/Dura_Europos.pdf (accessed on 6 March 2018).
- Casana, J.; Panahipour, M. Satellite-based monitoring of looting and damage to archaeological sites in syria. J. East. Mediterr. Archaeol. Herit. Stud. 2014, 2, 128–151. [Google Scholar] [CrossRef]
- Casana, J.; Laugier, E.J. Satellite imagery-based monitoring of archaeological site damage in the Syrian civil war. PLoS ONE 2017, 12, e0188589. [Google Scholar] [CrossRef] [PubMed]
- Exelis VIS. ENVI 5.3; Exelis VIS: Boulder, CO, USA, 2015. [Google Scholar]
- Safeguarding Syrian Cultural Heritage, 2014. Available online: http://www.unesco.org/new/en/safeguarding-syrian-cultural-heritage/ (accessed on 30 April 2018).
- Jedrzejas, T.; Przybilla, H.J. Generating historical urban 3D-scenarios for use in Google Earth representing the medieval city of Duisburg. Photogramm. Fernerkundung Geoinf. 2009, 3, 199–207. [Google Scholar] [CrossRef] [PubMed]
- Martinez-Grana, A.M.; Goy, J.L.; Cimarra, C.A. A virtual tour of geological heritage: Valourising geodiversity using Google Earth and QR code. Comput. Geosci. 2013, 61, 83–93. [Google Scholar] [CrossRef]
- Miguel Martinez-Grana, J.; Angel Gonzalez-Delgado, S.; Pallares, J.; Luis Goy, J. CivisLlovera, 3D virtual itinerary for education using Google Earth as a tool for the recovery of the geological heritage of natural areas: Application in the “Las Batuecas Valley” nature park (Salamanca, Spain). Sustainability 2014, 6, 8567–8591. [Google Scholar] [CrossRef]
- Gonzalez-Delgado, J.A.; Martinez-Grana, A.M.; Civis, J.; Sierro, F.J.; Goy, J.L.; Dabrio, C.J.; Ruiz, F.; Gonzalez-Regalado, M.L.; Abad, M. Virtual 3D tour of the Neogene palaeontological heritage of Huelva (Guadalquivir Basin, Spain). Environ. Earth Sci. 2015, 73, 4609–4618. [Google Scholar] [CrossRef]
- Guo, H.; Wang, L.; Chen, F.; Liang, D. Scientific big data and digital earth. Sci. Bull. 2014, 59, 5066–5073. [Google Scholar] [CrossRef]
- Ellis, S.; Wallrodt, J. Pompeii and the iPad: An update. In Proceedings of the 40th Annual Computer Applications and Quantitative Methods in Archaeology Conference, Southampton, UK, 27–29 March 2012. [Google Scholar]
- Monkkonen, P. Using online satellite imagery as a research tool—Mapping changing patterns of urbanization in Mexico. J. Plan. Educ. Res. 2008, 28, 225–236. [Google Scholar] [CrossRef]
- Kamadjeu, R. Tracking the polio virus down the Congo River: A case study on the use of Google Earth™ in public health planning and mapping. Int. J. Health Geogr. 2009, 8, 4. [Google Scholar] [CrossRef] [PubMed]
- Bar-Zeev, A.; Crampton, J. Keyhole, Google Earth, and 3D worlds: An interview with Avi Bar-Zeev. Cartographica 2008, 43, 85–93. [Google Scholar]
- Sheppard, S.R.J.; Cizek, P. The ethics of Google Earth: Crossing thresholds from spatial data to landscape visualization. J. Environ. Manag. 2009, 90, 2012–2117. [Google Scholar] [CrossRef] [PubMed]
- Ur, J.A. Corona satellite photography and ancient road networks: A northern Mesopotamian case study. Antiquity 2003, 77, 102–115. [Google Scholar] [CrossRef]
- Bewley, R. Understanding the past. Aerial survey, remote sensing, interpretation and management. Archeologia Aerea Studi di Aerotopografi a Archeologica 2004, 1, 37–45. [Google Scholar]
- Handwerk, B. Google Earth, Satellite Maps Boost Armchair Archaeology. National Geographic News. Available online: http://news.nationalgeographic.co.uk/news/2006/11/061107-archaeology.html (accessed on 23 March 2018).
- Hadjimitsis, D.; Agapiou, A.; Alexakis, D.; Sarris, A. Exploring natural and anthropogenic risk for cultural heritage in Cyprus using remote sensing and GIS. Int. J. Digit. Earth 2013, 6, 115–142. [Google Scholar] [CrossRef]
- Yu, L.; Zhang, Y.; Nie, Y.; Zhang, W.; Gao, H.; Bai, X.; Liu, F.; Hategekimana, Y.; Zhu, J. Improved detection of archaeological features using multi-source data in geographically diverse capital city sites. J. Cult. Herit. 2018, 33, 145–158. [Google Scholar] [CrossRef]
- Google Earth Engine Team, 2015. Google Earth Engine: A Planetary-scale Geospatial Analysis Platform. Available online: https://earthengine.google.com (accessed on 15 April 2018).
- Agapiou, A.; Hadjimitsis, D.G.; Alexakis, D.D. Evaluation of broadband and narrowband vegetation indices for the identification of archaeological crop marks. Remote Sens. 2012, 4, 3892–3919. [Google Scholar] [CrossRef]
- Open Geospatial Consortium. Available online: http://www.opengeospatial.org/ (accessed on 23 March 2018).
- Blower, J.; Gemmell, A.; Haines, K.; Kirsch, P.; Cunningham, N.; Fleming, A.; Lowry, R. Sharing and visualizing environmental data using Virtual Globes. In Proceedings of the UK e-Science All Hands Meeting, Nottingham, UK, 10–13 September 2007; pp. 102–109. [Google Scholar]
- Sazib, N.; Mladenova, I.; Bolten, J. Leveraging the Google Earth Engine for Drought Assessment Using Global Soil Moisture Data. Remote Sens. 2018, 10, 1265. [Google Scholar] [CrossRef]
- Hird, J.; DeLancey, E.; McDermid, G.; Kariyeva, J. Google Earth Engine, Open-Access Satellite Data, and Machine Learning in Support of Large-Area Probabilistic Wetland Mapping. Remote Sens. 2017, 9, 1315. [Google Scholar] [CrossRef]
- Liss, B.; Howland, M.D.; Levy, T.E. Testing Google Earth Engine for the automatic identification and vectorization of archaeological features: A case study from Faynan, Jordan. J. Archaeol. Sci. Rep. 2017, 5, 299–304. [Google Scholar] [CrossRef]
- List of Nuclear Test Sites. Available online: https://en.wikipedia.org/wiki/List_of_nuclear_test_sites (accessed on 23 March 2018).
- NASA Spies 8,000-Year-Old Mystery in Kazakhstan Desert. Available online: https://www.theweathernetwork.com/news/articles/nasa-spies-8000-year-old-mystery-in-kazakhstan-desert/59231/ (accessed on 3 May 2018).
- Mischke, S.; Liu, C.; Zhang, J.; Zhang, C.; Zhang, H.; Jiao, P. The world’s earliest Aral-Sea type disaster: The decline of the Loulan Kingdom in the Tarim Basin. Sci. Rep. 2017, 7, 43102. [Google Scholar] [CrossRef] [PubMed]
- Moshenska, G. Resonant materiality and violent remembering: Archaeology, memory and bombing. Int. J. Herit. Stud. 2009, 15, 44–56. [Google Scholar] [CrossRef]
- Saunders, N. Ulysses’ gaze: The panoptic premise in aerial photography and Great War archaeology. In Images of Conflict: Military Aerial Photography and Archaeology; Stichelbaut, B., Bourgeois, J., Saunders, N., Chielens, P., Eds.; Cambridge Scholars Publishing: Newcastle upon Tyne, UK, 2009; pp. 27–40. [Google Scholar]
- Gonzalez-Ruibal, A.; Hernando, A. Genealogies of destruction: An archaeology of the contemporary past in the Amazon forest. Archaeologies 2010, 6, 5–28. [Google Scholar] [CrossRef]
- McCoy, M.D.; Ladefoged, T.N. New developments in the use of spatial technology in archaeology. J. Archaeol. Res. 2009, 17, 263–295. [Google Scholar] [CrossRef]
- Un Adolescent Découvre Une Cité Maya. J. Montr. Available online: https://www.journaldemontreal.com/2016/05/07/un-ado-decouvre-une-cite-maya (accessed on 3 May 2018).
- Did a Teen Discover a Lost Maya City? Not Exactly. The Washington Post. Available online: https://www.washingtonpost.com/news/speaking-of-science/wp/2016/05/11/did-a-teen-discover-a-lost-mayan-city-not-exactly/?noredirect=on&utm_term=.013e67876847 (accessed on 3 May 2018).
- Opitz, R.; Herrmann, J. Recent Trends and Long-standing Problems in Archaeological Remote Sensing. J. Comput. Appl. Archaeol. 2018, 1, 19–41. [Google Scholar] [CrossRef]
- Agapiou, A.; Hadjimitsis, D.G. Vegetation indices and field spectro-radiometric measurements for validation of buried architectural remains: Verification under area surveyed with geophysical campaigns. J. Appl. Remote Sens. 2011, 5. [Google Scholar] [CrossRef]
- Matney, T.; Barrett, L.R.; Dawadi, M.B.; Maki, D.; Maxton, C.; Perry, D.S. In situ, shallow subsurface reflectance spectroscopy of archaeological soils and features: A case-study of two native American settlement sites in Kansas. J. Archaeol. Sci. 2014, 43, 315–324. [Google Scholar] [CrossRef]
- Agapiou, A.; Alexakis, D.D.; Sarris, A.; Hadjimitsis, D.G. Orthogonal Equations of Multi-Spectral Satellite Imagery for the Identification of Un-Excavated Archaeological Sites. Remote Sens. 2013, 5, 6560–6586. [Google Scholar] [CrossRef]
- Kadioglu, S.; Kadioglu, M.; Kadioglu, Y.K. Identifying of buried archaeological remains with ground penetrating radar, polarized microscope and confocal Raman spectroscopy methods in ancient city of Nysa, Aydin—Turkey. J. Archaeol. Sci. 2013, 40, 3569–3583. [Google Scholar] [CrossRef]
- Zong, X.; Wang, X.; Luo, L. Integration of VHR Satellite Imagery, GPR Survey and Boring for Archaeological Prospection at the Longcheng Site in Anhui Province, China. Archaeometry 2018, 60, 1088–1105. [Google Scholar] [CrossRef]


| Version | Date | Changes |
|---|---|---|
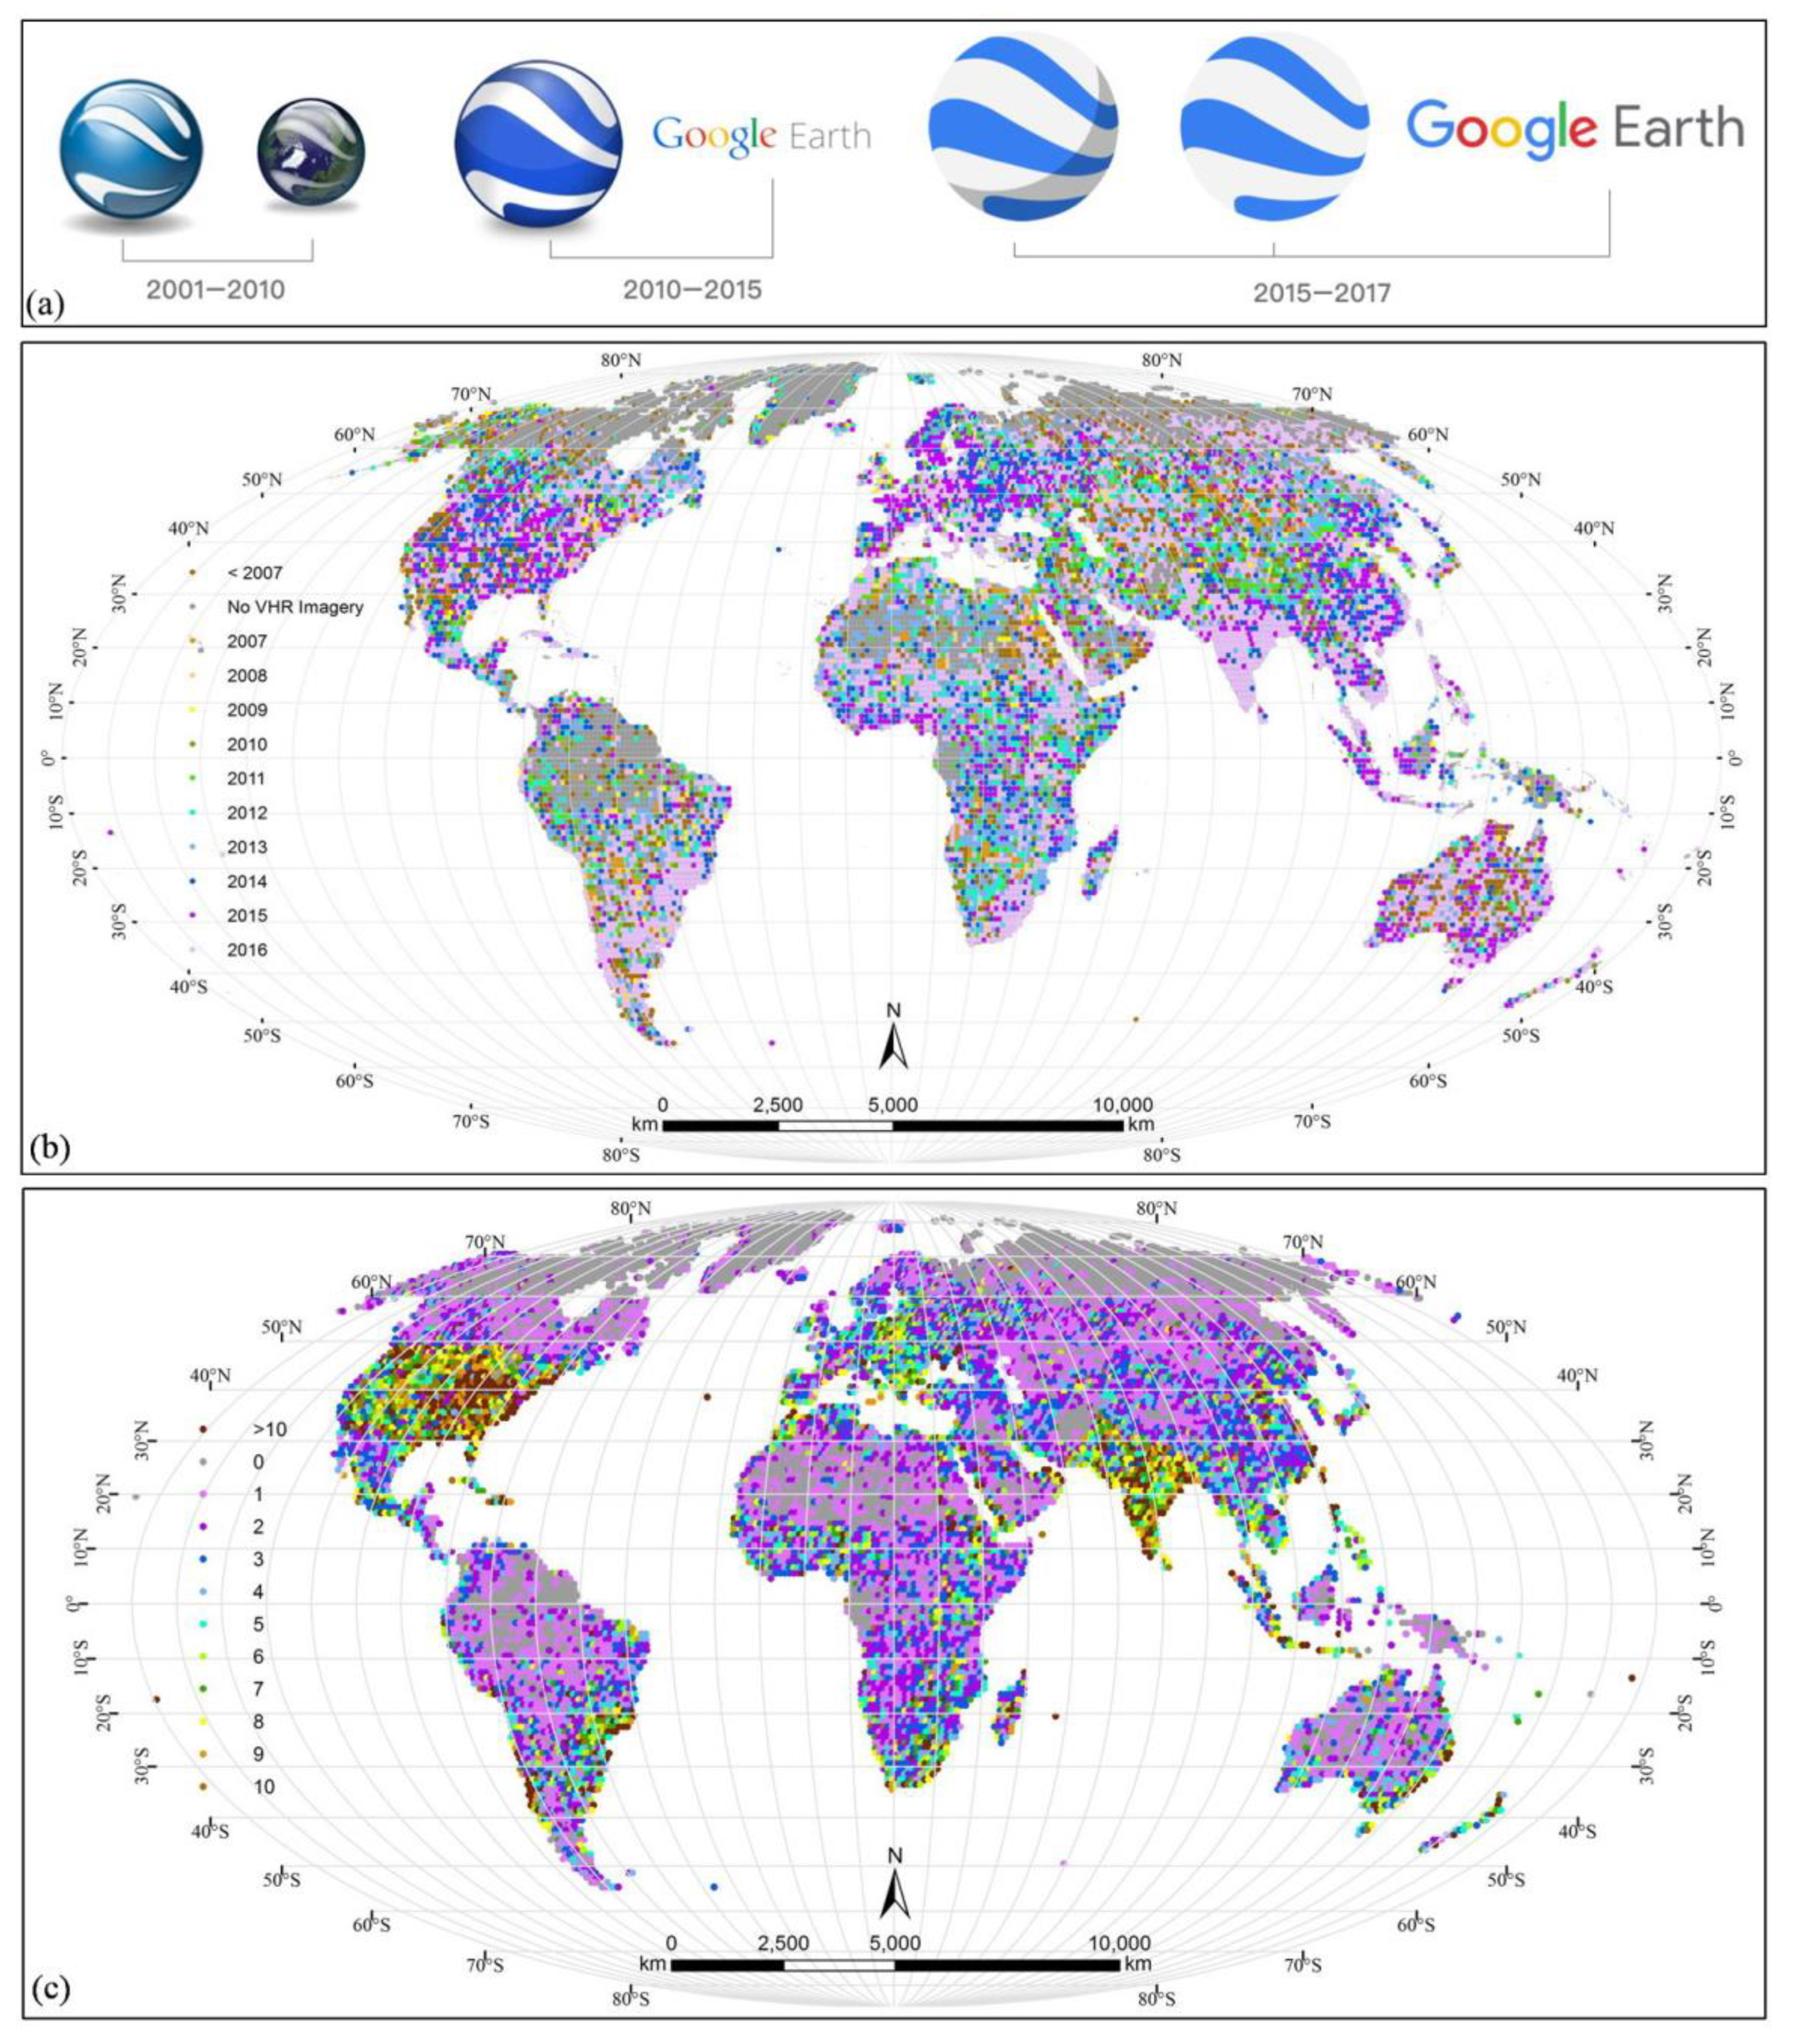
| 1.0 | July 2001 | The first version of EarthViewer 3D released by Keyhole, Inc. (Figure 1a) |
| 1.4 | January 2002 | |
| 1.6 | February 2003 | |
| 1.7 | October 2003 | |
| 2.2 | August 2004 | |
| 3.0 | June 2005 | The first version of GE released after Google acquired Keyhole, Inc. |
| 4.0 | June 2006 | |
| 4.1 | May 2007 | |
| 4.2 | August 2007 | Google Sky was introduced |
| A flight simulator was added | ||
| 4.3 | April 2008 | First release to implement KML version 2.2 |
| Google Street View was added | ||
| 5.0 | May 2009 | Google Ocean was introduced |
| Historical Imagery was introduced | ||
| 5.1 | November 2009 | |
| 5.2 | July 2010 | Last version to support Mac OS X 10.4 Tiger and 10.5 Leopard |
| 6.0 | March 2011 | 3D Trees were added |
| 6.1 | October 2011 | |
| 6.2 | April 2012 | Last version to support Mac OS X 10.5 Leopard |
| 7.0 | December 2012 | Support for 3D Imagery data was introduced |
| Tour Guide was introduced | ||
| 7.1 | April 2013 | Last version to support Mac OS X 10.6 Snow Leopard and Mac OS X 10.7 Lion |
| 7.3 | July 2017 | GE Pro became the standard version of the desktop program. |
| 9.0 | April 2017 | An entirely redesigned version of the program, currently only available for Google Chrome and Android. |
| Object | Description | GE Tools |
|---|---|---|
| Placemark | Indication of a specific geographical location |  |
| Points | Discrete points with coordinate and elevation (optional) |  |
| Line string | A list of two or more coordinate values |  |
| Linear ring | Series of coordinates in which the first and last pair of coordinates coincide; can be used to represent the outer or inner boundaries of polygons |  |
| Polygon | Comprises one or many outer boundaries and zero or more inner boundaries |  |
| Multi-geometry | A collection of discrete geometrical objects listed above |  |
| Ground overlay | A 2-D surface laid at a specific elevation or height relative to the ground |  |
© 2018 by the authors. Licensee MDPI, Basel, Switzerland. This article is an open access article distributed under the terms and conditions of the Creative Commons Attribution (CC BY) license (http://creativecommons.org/licenses/by/4.0/).
Share and Cite
Luo, L.; Wang, X.; Guo, H.; Lasaponara, R.; Shi, P.; Bachagha, N.; Li, L.; Yao, Y.; Masini, N.; Chen, F.; et al. Google Earth as a Powerful Tool for Archaeological and Cultural Heritage Applications: A Review. Remote Sens. 2018, 10, 1558. https://doi.org/10.3390/rs10101558
Luo L, Wang X, Guo H, Lasaponara R, Shi P, Bachagha N, Li L, Yao Y, Masini N, Chen F, et al. Google Earth as a Powerful Tool for Archaeological and Cultural Heritage Applications: A Review. Remote Sensing. 2018; 10(10):1558. https://doi.org/10.3390/rs10101558
Chicago/Turabian StyleLuo, Lei, Xinyuan Wang, Huadong Guo, Rosa Lasaponara, Pilong Shi, Nabil Bachagha, Li Li, Ya Yao, Nicola Masini, Fulong Chen, and et al. 2018. "Google Earth as a Powerful Tool for Archaeological and Cultural Heritage Applications: A Review" Remote Sensing 10, no. 10: 1558. https://doi.org/10.3390/rs10101558
APA StyleLuo, L., Wang, X., Guo, H., Lasaponara, R., Shi, P., Bachagha, N., Li, L., Yao, Y., Masini, N., Chen, F., Ji, W., Cao, H., Li, C., & Hu, N. (2018). Google Earth as a Powerful Tool for Archaeological and Cultural Heritage Applications: A Review. Remote Sensing, 10(10), 1558. https://doi.org/10.3390/rs10101558