The Total-Factor Energy Efficiency of Regions in China: Based on Three-Stage SBM Model

Abstract
:1. Introduction
2. Methodology of Models
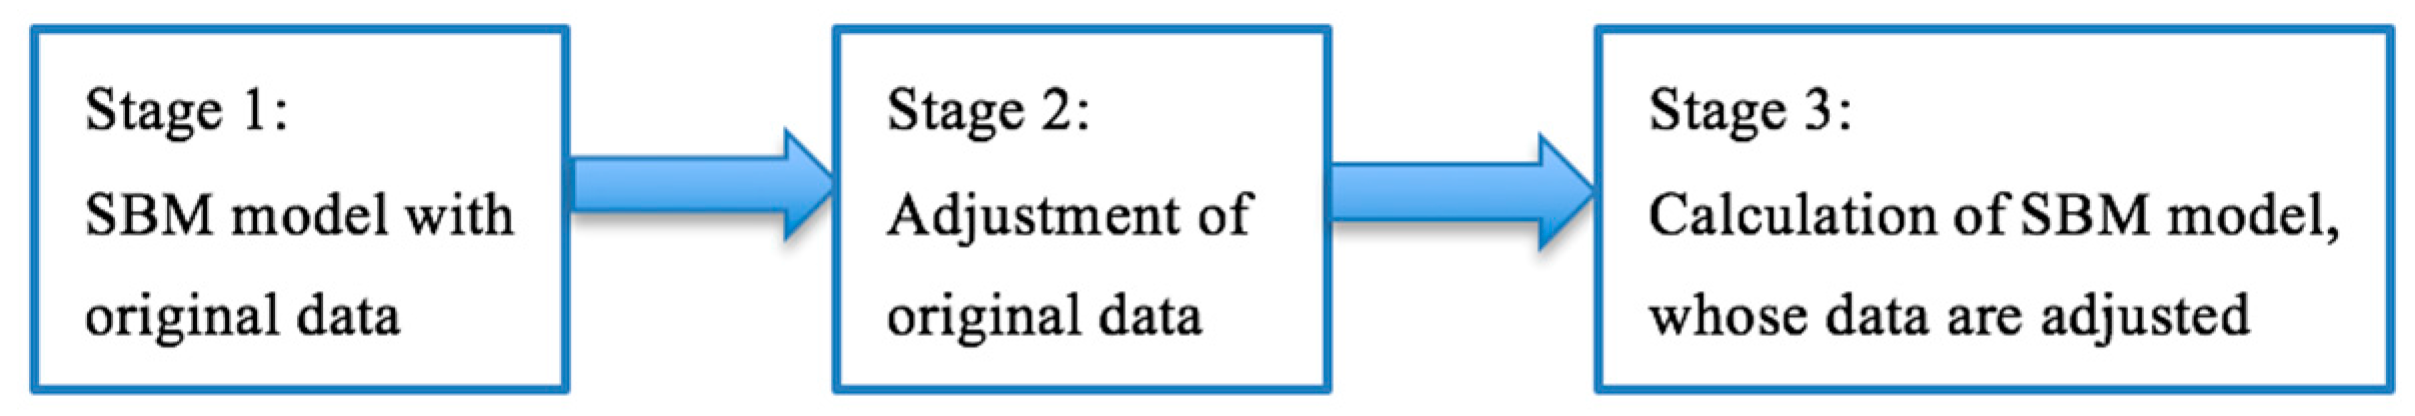
2.1. Three-Stage SBM Model
2.2. TFEE Evaluation and Deconstruction Model
3. Empirical Results
3.1. Variables
- Capital stock (K): Epitaxial expanding reproduction is the main growth mode of China’s city. This is mainly because capital input is a driving force for the economic growth of city. At present, most scholars selected capital stock as an indicator for measuring capital input (Hu and Wang, 2006 [6]; Honma and Hu, 2008 [7]). However, the methods to measure capital stock, for example the perpetual inventory method, may involve the utilization rate of capital or the depreciation rate of fixed assets, which are unavailable. Thus, we set physical capital stock as capital investment indicator and set fixed total investment as specific indicator. We estimate the capital stock of each city based on the “Perpetual Inventory law”. Firstly, according to the following formula, the based capital stock of each city in 2001 is estimated.where represents the capital stock of city i in 2001; represents the fixed total investment of city i in 2001; represents the average growth of the fixed total in-vestment of city i from 2001 to 2012; and is the depreciation rate (6%), which is proposed by Hall and Jones (1999) [40]. Then, we make the capital stock perpetual inventory.
- Labor (L): As the city is a labor-intensive place, the development level and the competitiveness of city depend largely on the quality and quantity of labor. According to some research achievement, such as Hu and Wang (2006) [6] and Honma and Hu (2008) [7], we use the total number of the employed population in the current period as labor input indicator.
- Energy investment (E): Because China has not comprehensively collected data of city energy consumption, we must get the data of energy investment another way. We choose annual electricity energy consumption as energy investment indicator, as electricity demand of GDP elasticity is very close to the total energy, and the power consumption data that computer readout are more accurate, electricity energy could more accurately represent the overall energy efficiency situation of China.
- Economy output (Y): Currently, most scholars consider the economic index to be energy-utilization outputs, where the economic index measures the services provided by energy utilization with market price. Based on the features of city and its energy consumption, we use the real GDP of cities as economy output indicator.
- Non-consensual output (SO2): For the same reason as above, the non-consensual indicator measures the services provided by energy utilization with physical units. We use sulfur dioxide emission of cities as a non-consensual output indicator.
- Environment variables: At present, there are many studies on the factors impacting TFEE. Based on these studies (Chen et al., 2015 [29]; Liu et al., 2014a [38]; 2014b [39]), we choose five external environment factors. Industry structure: In cities with a developed industry, the market is relatively standard and effective competition could be fully realized, thereby stimulating each enterprise to improve their own productivity. Technology level: Cohen and Levinthal (1989) [41] propose that technology investment could strength the ability to absorb information, promote the transfer of knowledge and improve innovation. Advanced technology also promotes the development of renewable energy, such as solar power and wind power, which has higher efficiency and less environmental side effect. Therefore, technology level is the key factor in increasing energy efficiency. Infrastructure: The city with well-developed infrastructure could make resource allocation more reasonable and the agglomeration and scale effects stronger. Government intervention: As Chinese government is now trying its best to reduce waste and low-efficiency energy, if in a city, the government is putting reducing energy waste as its main job, then usually the energy efficiency of this city will be higher. Energy endowment: The energy endowment has a significant influence on energy efficiency. At present, energy endowment in most Chinese cities depends on raw coal, petroleum, diesel and electrical power. However, there are some differences in the energy level of different cities. Compared with coal, electrical power is high-efficiency energy [29]. Special indicators are: (1) output value of the second industry/regional total product (IN/GDP); (2) foreign direct investment/fixed total investment (FDI/I); (3) cargo volume/(highway mileage+railway mileage) (T/H); (4) expenditure/regional total product (CZ/GDP); and (5) the number of employees in mining industry/the total number of employees (CJ/TW).
3.2. First Stage: Evaluation of TFEE and District Differences
3.3. Second Stage: The Environment Impact of TFEE and Reasons of Differences
3.4. Third Stage: Structure Decomposition of TFEE and Promotion Paths
4. Conclusions
Author Contributions
Conflicts of Interest
References
- Lu, B.; Wang, K.; Xu, Z. China’s Regional Energy Efficiency: Results based on three-stage DEA model. Int. J. Glob. Energy Issues 2015, 5, 652–667. [Google Scholar] [CrossRef]
- World Bank. China: Improving Energy Efficiency in Public Institutions; Energy Sector Management Assistance Program (ESMAP) Report; World Bank: Washington, DC, USA, 2015. [Google Scholar]
- Tonini, A. The EEC Commission and European Energy Policy: A Historical Appraisal; Springer: Cham, Switzerland, 2016. [Google Scholar]
- Bosseboeuf, D.; Chateau, B.; Lapillonne, B. Monitoring Energy Efficiency and CO2 Abatement Policies: What can we learn from indicators. In Proceedings of the Workshop on Best Practices in Policies and Measures, Copenhagen, Denmark, 11–13 April 2000. [Google Scholar]
- Barcelona, E. Sectoral Energy Indicators. In Presentation on the Joint EGEDA and EGEEC Workshops on APEC Energy Database and Energy Efficiency Indicators; National University of Singapore: Singapore, 2007. [Google Scholar]
- Hu, J.; Wang, S. TFEE of Regions in China. Energy Policy 2006, 7, 3206–3217. [Google Scholar] [CrossRef]
- Honma, S.; Hu, J.L. Total-Factor Productivity Growth of Regions in Japan. Energy Policy 2009, 37, 3941–3950. [Google Scholar] [CrossRef]
- Hu, J.L.; Kao, C.H. Efficient Energy Saving Targets for APEC Economies. Energy Policy 2007, 35, 373–382. [Google Scholar] [CrossRef]
- Zhou, P.; Poh, K.L.; Ang, B.W. A Non-Radial DEA Approach to Measuring Environmental Performance. Eur. J. Oper. Res. 2007, 178, 1–9. [Google Scholar] [CrossRef]
- Zhou, P.; Ang, B.W.; Poh, K.L. Measuring Environmental Performance under Different Environmental DEA Technologies. Energy Econ. 2008, 30, 1–14. [Google Scholar] [CrossRef]
- Bian, Y.W.; Yang, F. Resource and Environment Efficiency Analysis of Provinces in China: A DEA approach based on Shannon’s entropy. Energy Policy 2010, 38, 1909–1917. [Google Scholar] [CrossRef]
- Li, L.B.; Hu, J.L. Ecological total-factor energy efficiency of regions in China. Energy Policy 2012, 46, 216–224. [Google Scholar] [CrossRef]
- Sun, J.W.; Xiao, C.M. The Change of Total Factor Energy Efficiency in the Yangtze River Delta Region. China Popul. Resour. Environ. 2012, 12, 67–72. [Google Scholar]
- Qin, B.T. Chinese Regional Energy Efficiency–Perspective of City. World Econ. Pap. 2014, 1, 95–104. [Google Scholar]
- Lin, B.; Du, K. Energy and CO2 Emissions Performance in China’s Regional Economies: Do market-oriented reforms matter? Energy Policy 2015, 78, 113–124. [Google Scholar] [CrossRef]
- Fukuyama, H.; Weber, W. A Directional Slacks-based Measure of Technical Inefficiency. Socio-Econ. Plan. Sci. 2009, 4, 469–492. [Google Scholar] [CrossRef]
- Bian, Y.; Hu, M.; Wang, Y.; Xu, H. Energy Efficiency Analysis of the Economic System in China during 1986–2012: A parallel slacks-based measure approach. Renew. Sustain. Energy Rev. 2016, 55, 990–998. [Google Scholar] [CrossRef]
- Zhou, Y.; Xing, X.; Fang, K.; Liang, D.; Xu, C. Environmental Efficiency Analysis of Power Industry in China Based on an Entropy SBM Model. Energy Policy 2013, 57, 68–75. [Google Scholar] [CrossRef]
- Zhang, N.; Choi, Y. Environmental Energy Efficiency of China’s Regional Economies: A non-oriented slacks-based measure analysis. Soc. Sci. J. 2013, 50, 225–234. [Google Scholar] [CrossRef]
- Timmer, C. Using a Probabilistic Frontier Production Function to Measure Technical Efficiency Efficiency. J. Political Econ. 1997, 4, 776–794. [Google Scholar] [CrossRef]
- Pan, X.F. The Dynamic Evolution of Spatial Pattern of Chinese Regional Differences in Energy Efficiency. Manag. Rev. 2012, 11, 13–19. [Google Scholar]
- Lesage, J.; Pace, R. Introduction to Spatial Econometrics; CRC Press: New York, NY, USA, 2010. [Google Scholar]
- Mardani, A.; Zavadskas, E.K.; Streimikiene, D.; Jusoh, A.; Khoshnoudi, M. A Comprehensive Review of Data Envelopment Analysis Approach in Energy Efficiency. Renew. Sustain. Energy Rev. 2016, 3, 1178–1198. [Google Scholar] [CrossRef]
- Zhang, X.; Cheng, X.; Yuan, J. TFEE in Developing Countries. Energy Policy 2011, 2, 644–650. [Google Scholar] [CrossRef]
- Horta, I.M.; Camanho, A.S.; DaCosta, J.M. Performance Assessment of Construction Companies Integrating Key Performance Indicators and Data Envelopment Analysis. J. Constr. Eng. Manag. 2009, 136, 581–594. [Google Scholar] [CrossRef]
- Goldemberg, J.; Prado, L.T.S. The Decline of the World’s Energy Intensity. Energy Policy 2011, 39, 1802–1805. [Google Scholar] [CrossRef]
- Glaeser, E.; Kahn, M. The Greenness of Cities: Carbon Dioxide Emissions and Urban Development. J. Urban Econ. 2010, 3, 404–418. [Google Scholar] [CrossRef]
- Hallegatte, S.; Henriet, F.; Corfee, M. The Economics of Climate Change Impacts and Policy Benefits at City Scale: A Conceptual Framework. Clim. Chang. 2011, 104, 52–87. [Google Scholar] [CrossRef]
- Chen, Y.; Liu, B.; Shen, Y.; Wang, X. The Energy Efficiency of China’s Regional Construction Industry Based on the Three Stage DEA Model and the DEA-DA Model. KSCE J. Civ. Eng. 2016, 20, 34. [Google Scholar] [CrossRef]
- Nezinsky, E. Eco-Efficiency and Human Capital in Europe: Quantitative Assessment. In Proceedings of the Management, Knowledge and Learning Joint International Conference 2015, Bari, Italy, 27–29 May 2015. [Google Scholar]
- Fukuyama, H.; Weber, W.L. A Slacks-Based Inefficiency Measure for a Two-Stage System with Bad Outputs. Omega 2010, 5, 398–409. [Google Scholar] [CrossRef]
- Tone, K. A Slacks-Based Measure of Efficiency in Data Envelopment Analysis. Eur. J. Oper. Res. 2001, 3, 498–509. [Google Scholar] [CrossRef]
- Tone, K.; Tsutsui, M. Network DEA: A Slacks-based Measure Approach. Eur. J. Oper. Res. 2009, 197, 243–252. [Google Scholar] [CrossRef]
- Ashrafi, A.; Jaafar, A.B.; Lee, L.S.; Abu Bakar, M.R. A Slacks-Based Measure of Efficiency in Two-Stage Data Envelopment Analysis. Int. J. Math. Anal. 2011, 5, 1435–1444. [Google Scholar]
- Banker, R.D.; Charnes, A.; Cooper, W.W. Some Models for Estimating Technical and Scale Inefficiencies in Data Envelopment Analysis. Manag. Sci. 1984, 30, 1078–1092. [Google Scholar] [CrossRef]
- Coelli, T.; Rao, D.; Donnell, C. An Introduction to Efficiency and Productivity Analysis; Springer: New York, NY, USA, 2005. [Google Scholar]
- Rasche, R.H.; Tatom, J.A. Energy Resources and Potential GNP; Federal Reserve Bank of St. Louis: St. Louis, MO, USA, 1977; pp. 10–24. [Google Scholar]
- Liu, B.S.; Chen, X.H.; Wang, X.Q.; Chen, Y. Development Potential of Chinese Construction Industry in the New Century Based on Regional Difference and Spatial Convergence Analysis. KSCE J. Civ. Eng. 2014, 18, 11–18. [Google Scholar] [CrossRef]
- Liu, B.S.; Wang, X.Q.; Chen, C.L.; Ma, Z.J. Research into the Dynamic Development Trend of the Competitiveness of China’s Regional Construction Industry. KSCE J. Civ. Eng. 2014, 18, 1–10. [Google Scholar] [CrossRef]
- Hall, R.; Jones, C. Why do Some Countries Produce so Much More Output Per Worker than Others. Q. J. Econ. 1999, 114, 83–116. [Google Scholar] [CrossRef]
- Cohen, W.; Lebinthal, D. Innovation and Learning: The two faces of R&D. Econ. J. 1989, 397, 569–596. [Google Scholar]
- National Bureau of Statistics of China. China Statistics Yearbook 2001–2012; China Statistic Press: Beijing, China, 2013.
- National Bureau of Statistics of China. Chinese Town and City Statistics Yearbook 2001–2012; China Statistic Press: Beijing, China, 2013.
- National Bureau of Statistics of China. Chinese Regional Economic Statistics Yearbook 2001–2012; China Statistic Press: Beijing, China, 2013.
- Shi, G.M.; Bi, J.; Wang, J.N. Chinese Regional Industrial Energy Efficiency Evaluation Based on A DEA model of Fixing Non-Energy Inputs. Energy Policy 2010, 10, 6172–6179. [Google Scholar] [CrossRef]
- Wang, Q.W.; Zhao, Z.Y.; Zhou, P.; Zhou, D.Q. Energy Efficiency and Production Technology Heterogeneity in China: A Meta-frontier DEA Approach. Econ. Model. 2013, 35, 283–289. [Google Scholar] [CrossRef]
- Yao, X.; Zhou, H.C.; Zhang, A.Z.; Li, A.J. Regional Energy Efficiency, Carbon Emission Performance and Technology Gaps in China: A Meta-frontier Non-radial Directional Distance Function Analysis. Energy Policy 2015, 84, 142–154. [Google Scholar] [CrossRef]
- Lin, B.Q.; Zhao, H.L. Technology Gap and Regional Energy Efficiency in China’s Textile Industry: A Non-parametric Meta-frontier Approach. J. Clean. Prod. 2016, 137, 21–28. [Google Scholar] [CrossRef]
- Yao, S.J.; Luo, D.; Rooker, T. Energy Efficiency and Economic Development in China. Asian Econ. Pap. 2012, 2, 99–117. [Google Scholar] [CrossRef]


| National | Eastern | Central | Western | North-Eastern | |||||||||||
|---|---|---|---|---|---|---|---|---|---|---|---|---|---|---|---|
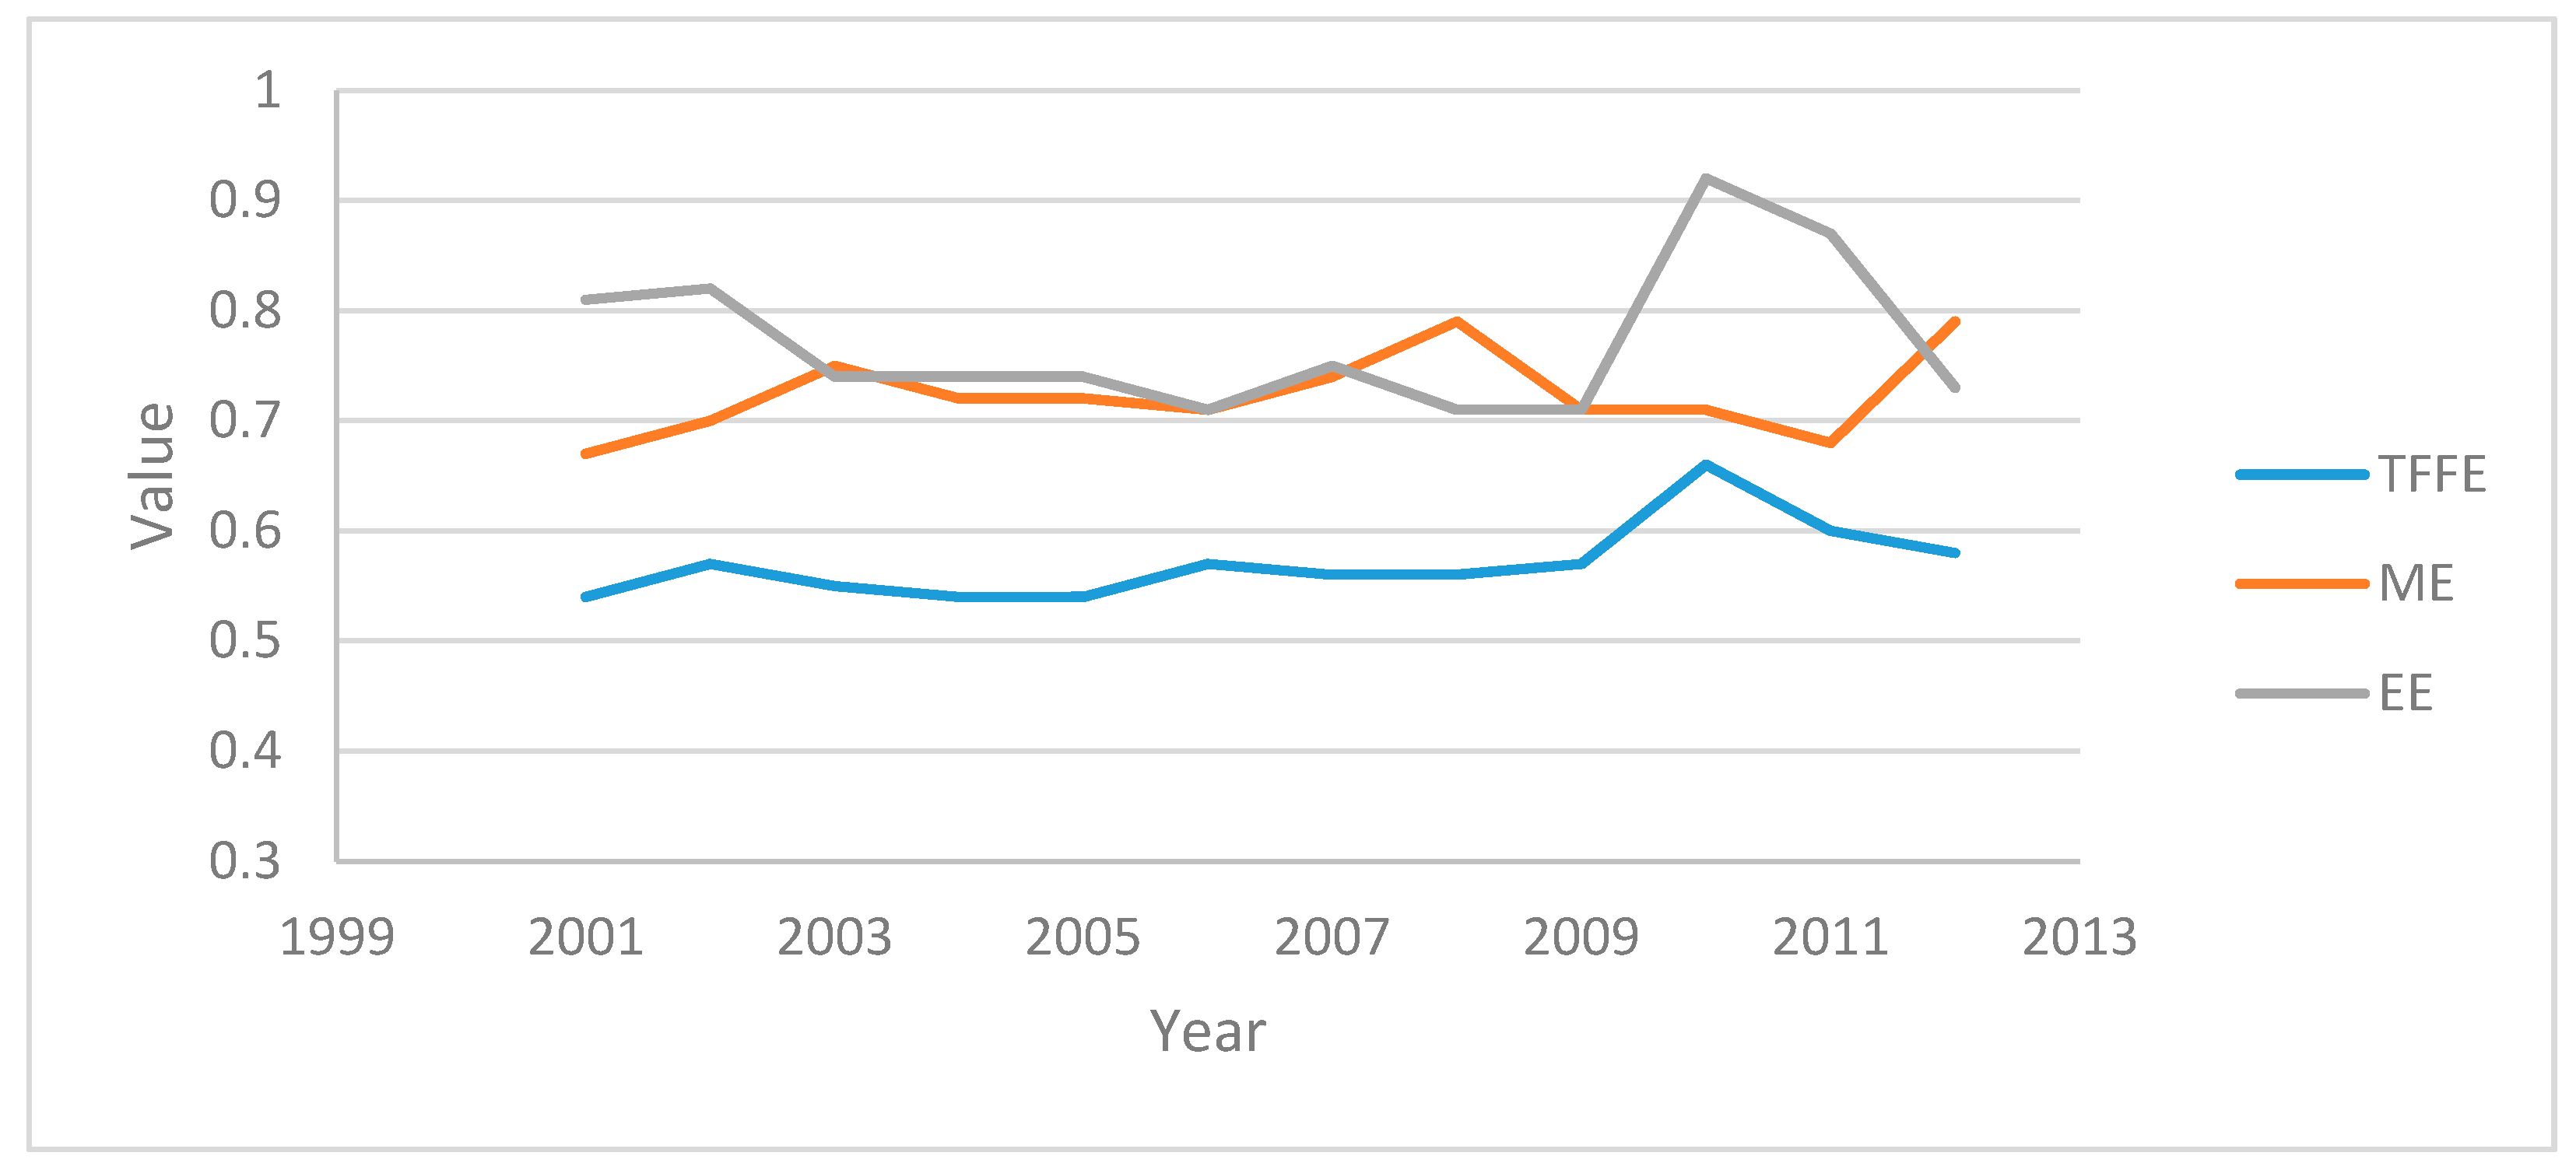
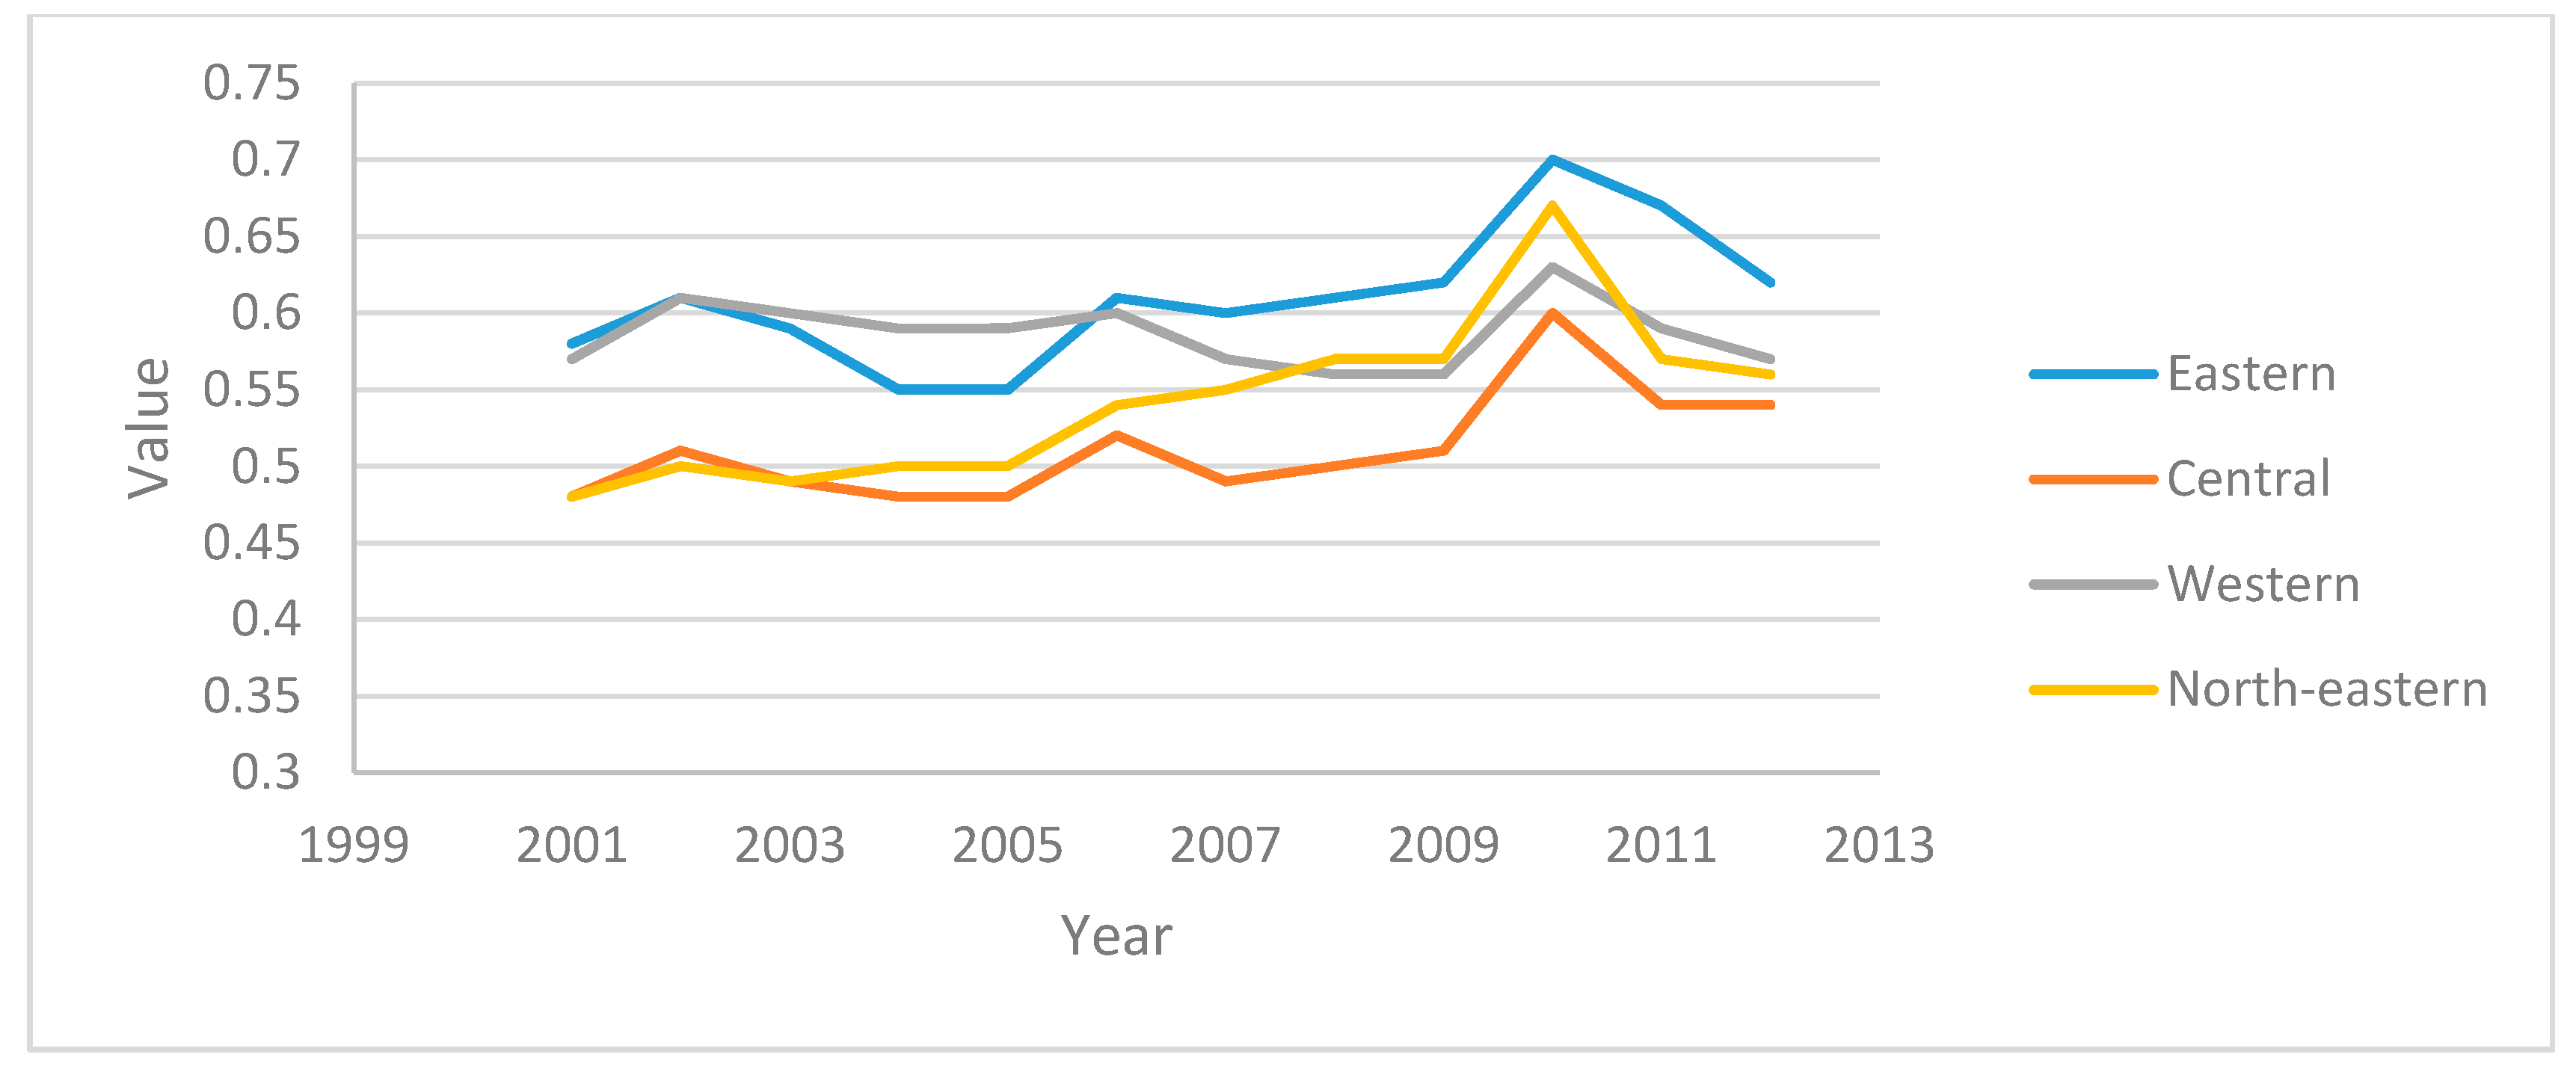
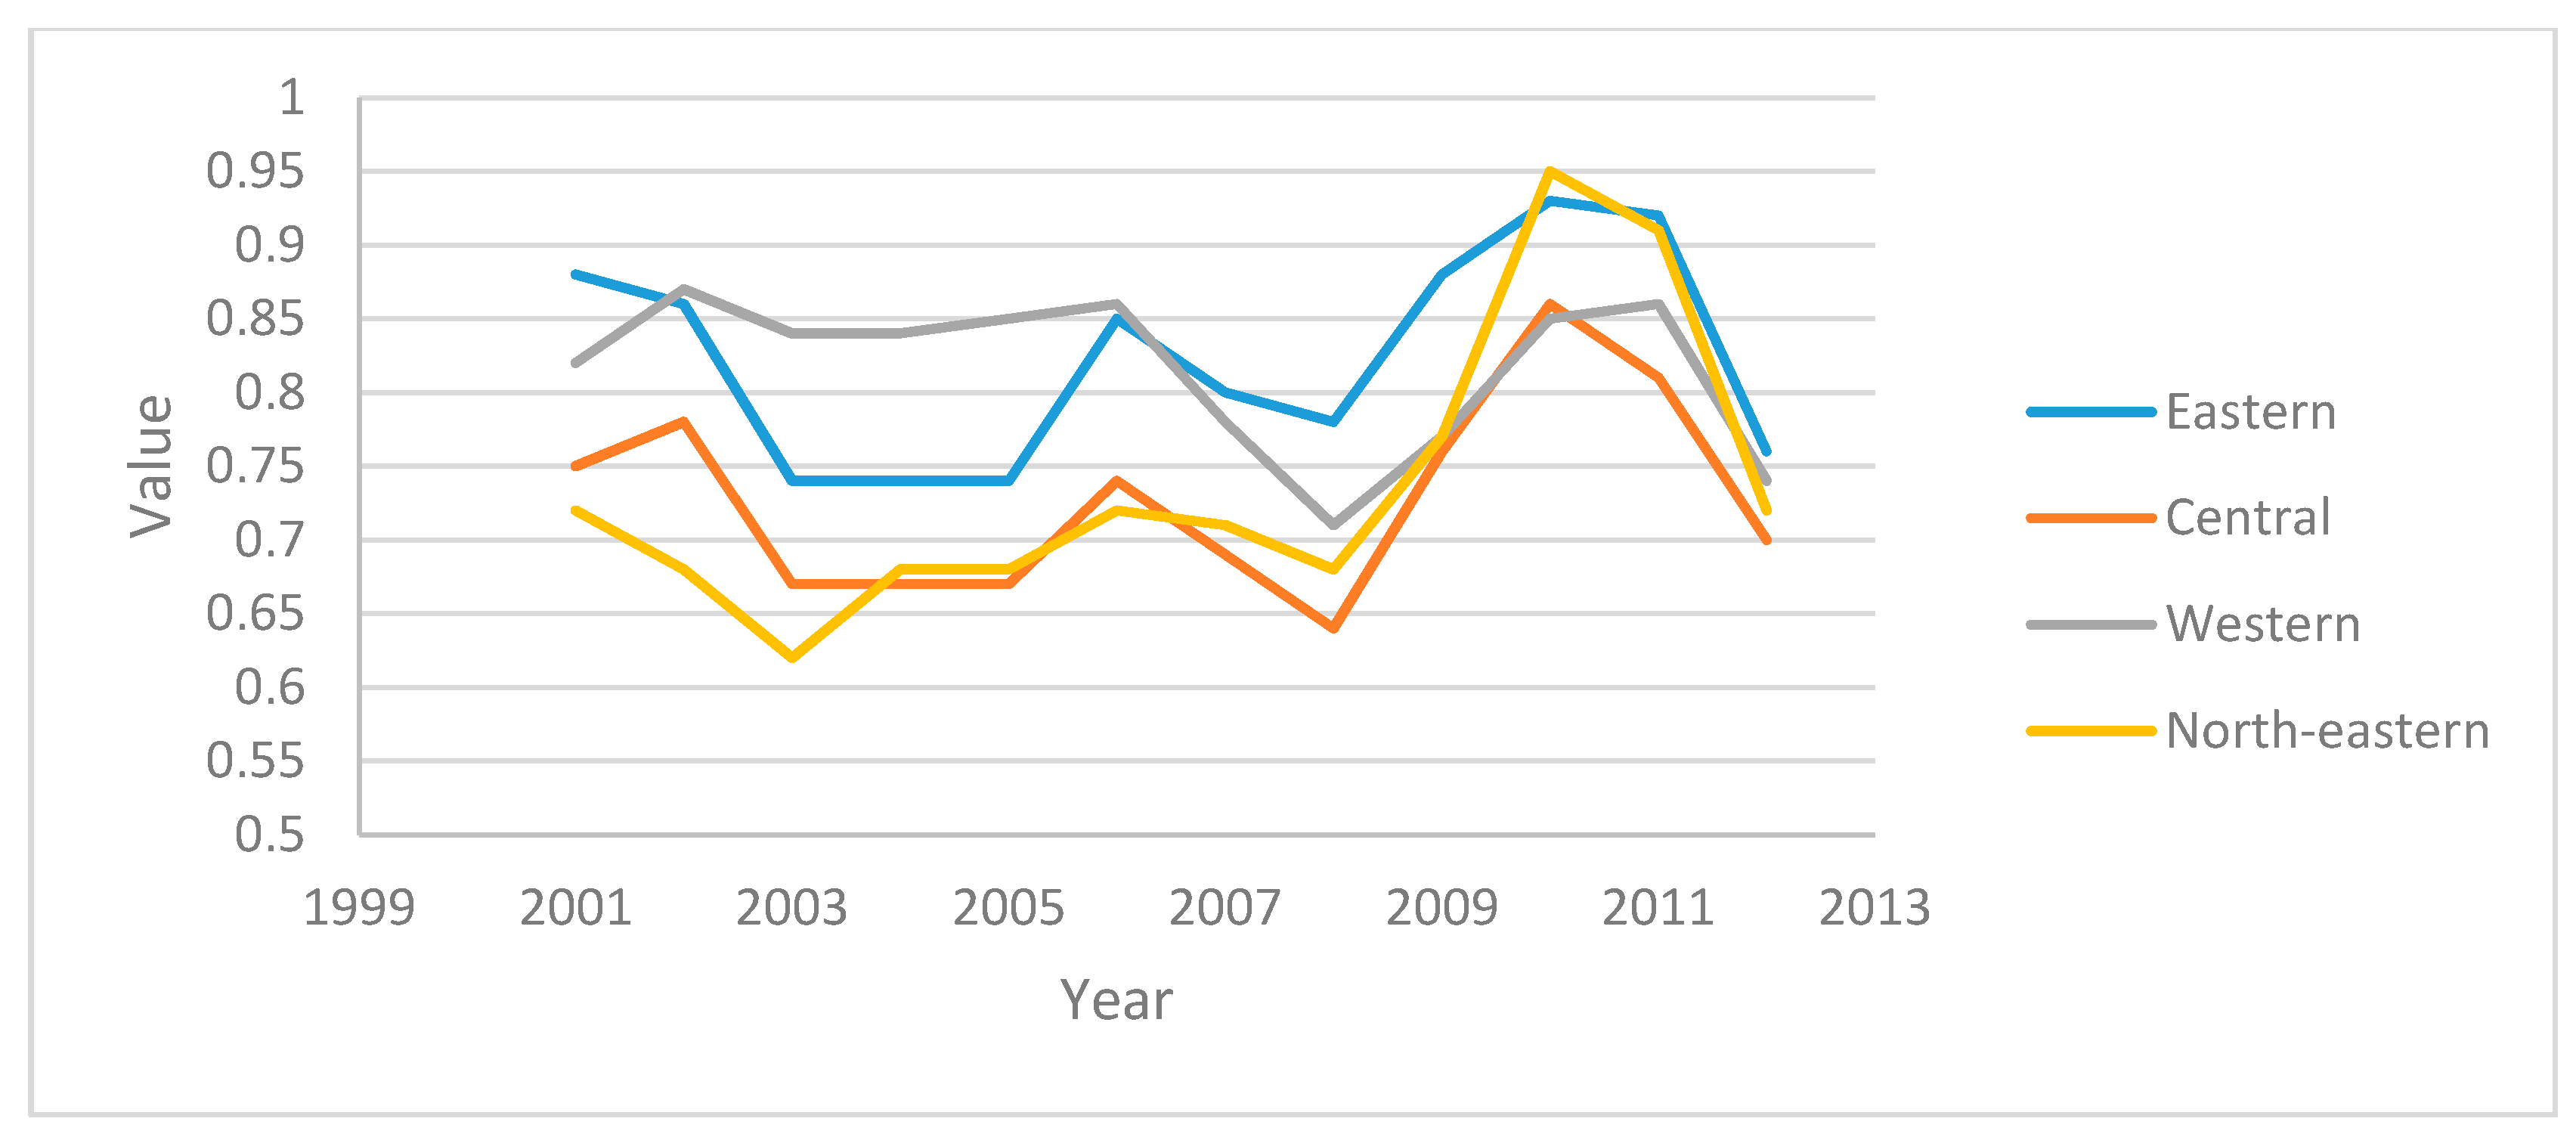
| TFFE | ME | EE | TFFE | ME | EE | TFFE | ME | EE | TFFE | ME | EE | TFFE | ME | EE | |
| 2001 | 0.54 | 0.67 | 0.81 | 0.58 | 0.66 | 0.88 | 0.48 | 0.64 | 0.75 | 0.57 | 0.69 | 0.82 | 0.48 | 0.66 | 0.72 |
| 2002 | 0.57 | 0.70 | 0.82 | 0.61 | 0.71 | 0.86 | 0.51 | 0.66 | 0.78 | 0.61 | 0.70 | 0.87 | 0.50 | 0.73 | 0.68 |
| 2003 | 0.55 | 0.75 | 0.74 | 0.59 | 0.79 | 0.74 | 0.49 | 0.73 | 0.67 | 0.60 | 0.71 | 0.84 | 0.49 | 0.79 | 0.62 |
| 2004 | 0.54 | 0.72 | 0.74 | 0.55 | 0.75 | 0.74 | 0.48 | 0.71 | 0.67 | 0.59 | 0.69 | 0.84 | 0.50 | 0.75 | 0.68 |
| 2005 | 0.54 | 0.72 | 0.74 | 0.55 | 0.75 | 0.74 | 0.48 | 0.71 | 0.67 | 0.59 | 0.69 | 0.85 | 0.50 | 0.75 | 0.68 |
| 2006 | 0.57 | 0.71 | 0.71 | 0.61 | 0.72 | 0.85 | 0.52 | 0.70 | 0.74 | 0.60 | 0.70 | 0.86 | 0.54 | 0.75 | 0.72 |
| 2007 | 0.56 | 0.74 | 0.75 | 0.60 | 0.75 | 0.80 | 0.49 | 0.71 | 0.69 | 0.57 | 0.73 | 0.78 | 0.55 | 0.77 | 0.71 |
| 2008 | 0.56 | 0.79 | 0.71 | 0.61 | 0.79 | 0.78 | 0.50 | 0.77 | 0.64 | 0.56 | 0.78 | 0.71 | 0.57 | 0.83 | 0.68 |
| 2009 | 0.57 | 0.71 | 0.71 | 0.62 | 0.71 | 0.88 | 0.51 | 0.68 | 0.76 | 0.56 | 0.73 | 0.77 | 0.57 | 0.74 | 0.77 |
| 2010 | 0.66 | 0.71 | 0.92 | 0.70 | 0.75 | 0.93 | 0.60 | 0.70 | 0.86 | 0.63 | 0.74 | 0.85 | 0.67 | 0.71 | 0.95 |
| 2011 | 0.60 | 0.68 | 0.87 | 0.67 | 0.73 | 0.92 | 0.54 | 0.66 | 0.81 | 0.59 | 0.68 | 0.86 | 0.57 | 0.63 | 0.91 |
| 2012 | 0.58 | 0.79 | 0.73 | 0.62 | 0.81 | 0.76 | 0.54 | 0.78 | 0.70 | 0.57 | 0.77 | 0.74 | 0.56 | 0.77 | 0.72 |
| mean | 0.57 | 0.72 | 0.77 | 0.61 | 0.74 | 0.82 | 0.51 | 0.70 | 0.73 | 0.59 | 0.72 | 0.82 | 0.54 | 0.74 | 0.74 |
| N | 276 | 87 | 79 | 76 | 34 | ||||||||||
| 2001 | 2005 | 2010 | 2012 | |
|---|---|---|---|---|
| Top 10 | Tianjin, Shenyang, Changchun, Shanghai, Wuxi, Hangzhou, Guangzhou, Shenzhen, Dongguan, Chengdu | Changchun, Shanghai, Wuxi, Suzhou, Hangzhou, Guangzhou, Shenzhen, Foshan, Chongqing, Dongguan | Beijing, Shenyang, Shanghai, Suzhou, Changsha, Guangzhou, Shenzhen, Foshan, Dongguan, Chongqing | Beijing, Tianjing, Shanghai, Suzhou, Qingdao, Changsha, Guangzhou, Shenzhen, Foshan, Chongqing |
| Bottom 10 | Cangzhou, Yingkou, Fuxin, Shizuishan, Yinchuan, Tongchuan, Xingtai, Xining, Puyang, Jiaozuo | Fuxin, Changzhi, Shangqiu, Tongchuan, Yingkou, Hegang, Puyang, Xining, Jiaozuo, Yinchuan | Puyang, Anyang, Xinxiang, Fuxin, Zhoukou, Jiaozuo, Nanyang, Guiyang, Yingkou, Shangqiu | Handan, Yingkou, Guangyuan, Anyang, Jiaxing, Puyang, Nanyang, Guiyang, Jiaozuo, Shangqiu |
| Frontier Cities | 33 | 27 | 33 | 36 |
| Year | 2001 | 2002 | 2003 | 2004 | 2005 | 2006 | 2007 | 2008 | 2009 | 2010 | 2011 | 2012 |
|---|---|---|---|---|---|---|---|---|---|---|---|---|
| Moran’s I | 0.112 | 0.148 | 0.14 | 0.104 | 0.086 | 0.101 | 0.089 | 0.081 | 0.088 | 0.177 | 0.135 | 0.114 |
| Z | 4.823 | 6.305 | 5.968 | 4.49 | 3.746 | 4.361 | 3.87 | 3.526 | 3.827 | 7.543 | 5.785 | 4.917 |
| Variable/Model | Capital Slack Variable | Labor Slack Variable | Energy Slack Variable | |||
|---|---|---|---|---|---|---|
| SAR | SEM | SAR | SEM | SAR | SEM | |
| IN/GDP | −1.7 | −1.7 | −0.07 | −0.05 | 2.92 | 2.17 |
| (5.05) *** | (5.03) *** | (0.566) *** | (0.42) | (10.61) *** | (5.46) *** | |
| FDI/I | −0.01 | −0.01 | −0.01 | −0.01 | −0.01 | −0.01 |
| (3.04) *** | (3.09) *** | (0.32) | (0.28) | (2.52)* | (2.28) * | |
| H/T | 0.47 | 0.55 *** | 0.02 | 0.09 | −0.27 | −0.46 |
| (5.15) *** | (6.07) *** | (0.65) | (3.11) *** | (3.72) *** | (4.90) *** | |
| CZ/GDP | 0.33 | 0.65 | 0.44 | 0.55 | 0.66 | 0.37 |
| (0.56) | (1.13) | (2.94) ** | (3.57) *** | (1.43) | (0.73) | |
| CJ/TW | 1.13 | 1.13 | 0.22 | 0.13 | 0.78 | 1.09 |
| (3.37) *** | (3.37) *** | (1.31) | (0.77) | (2.83) *** | (1.92) | |
| λ/ρ | 0.35 | 0.04 | 0.61 | 0.34 | 0.64 | 0.6 |
| (3.10) *** | (0.28) | (8.37) *** | (2.71) ** | (9.46) *** | (7.77) *** | |
| R2 | 0.52 | 0.5 | 0.52 | 0.51 | 0.59 | 0.58 |
| logL | −7355.14 | −7350.19 | −1277.15 | −1270.45 | −5112.59 | −5171.03 |
| Model | SAR | SEM | SAR | |||
| 2001 | 2005 | 2010 | 2012 | |
|---|---|---|---|---|
| Top 10 | Tianjin, Shenyang, Changchun, Shanghai, Wuxi, Hangzhou, Guangzhou, Shenzhen, Dongguan, Chengdu | Changchun, Shanghai, Wuxi, Suzhou, Hangzhou, Guangzhou, Shenzhen, Foshan, Chongqing, Dongguan | Beijing, Shenyang, Shanghai, Suzhou, Changsha, Guangzhou, Shenzhen, Foshan, Dongguan, Chongqing | Beijing, Tianjing, Shanghai, Suzhou, Qingdao, Changsha, Guangzhou, Shenzhen, Foshan, Chongqing |
| Bottom 10 | Cangzhou, Yingkou, Fuxin, Shizuishan, Yinchuan, Tongchuan, Xingtai, Xining, Puyang, Jiaozuo | Fuxin, Changzhi, Shangqiu, Tongchuan, Yingkou, Hegang, Puyang, Xining, Jiaozuo, Yinchuan | Puyang, Anyang, Xinxiang, Fuxin, Zhoukou, Jiaozuo, Nanyang, Guiyang, Yingkou, Shangqiu | Handan, Yingkou, Guangyuan, Anyang, Jiaxing, Puyang, Nanyang, Guiyang, Jiaozuo, Shangqiu |
| Frontier Cities | 33 | 27 | 33 | 36 |
© 2017 by the authors. Licensee MDPI, Basel, Switzerland. This article is an open access article distributed under the terms and conditions of the Creative Commons Attribution (CC BY) license (http://creativecommons.org/licenses/by/4.0/).
Share and Cite
Huang, H.; Wang, T. The Total-Factor Energy Efficiency of Regions in China: Based on Three-Stage SBM Model. Sustainability 2017, 9, 1664. https://doi.org/10.3390/su9091664
Huang H, Wang T. The Total-Factor Energy Efficiency of Regions in China: Based on Three-Stage SBM Model. Sustainability. 2017; 9(9):1664. https://doi.org/10.3390/su9091664
Chicago/Turabian StyleHuang, Haifeng, and Tao Wang. 2017. "The Total-Factor Energy Efficiency of Regions in China: Based on Three-Stage SBM Model" Sustainability 9, no. 9: 1664. https://doi.org/10.3390/su9091664
APA StyleHuang, H., & Wang, T. (2017). The Total-Factor Energy Efficiency of Regions in China: Based on Three-Stage SBM Model. Sustainability, 9(9), 1664. https://doi.org/10.3390/su9091664