Regional Difference and Evolution and Convergence of Innovation Capability in China: Research on Space and Factorial Levels

Abstract
:1. Introduction
2. Literature Review
2.1. Review of Regional Innovation Comparison
2.2. Literature on Regional Innovation Capacity Disparity
3. Methods and Data Summary
3.1. Regional Innovation Capability Difference Measurement Method and Decomposition
3.2. Index Selection and Data Source
3.2.1. Selection and Preprocessing of the Statistical Index
- (i)
- Smooth process of the new product value. To eliminate the influence of price on new product value, while considering that price fluctuations in China have certain regional differences, the consumer price index for each year in each district is selected as the smooth coefficient, and 1998 is chosen as the time point in constant prices.
- (ii)
- Dimensionless process of the index. To eliminate the dimension differences and preserve data information, the study, respectively, selects the proportion of invention patent authorization in the whole country and the proportion of new product value, instead of the initial index.
- (iii)
- Consider the weighted average of the two preprocessed indices as regional value Y.
3.2.2. Data Source
4. Regional Innovation Capability Difference, Evolution, and Decomposition
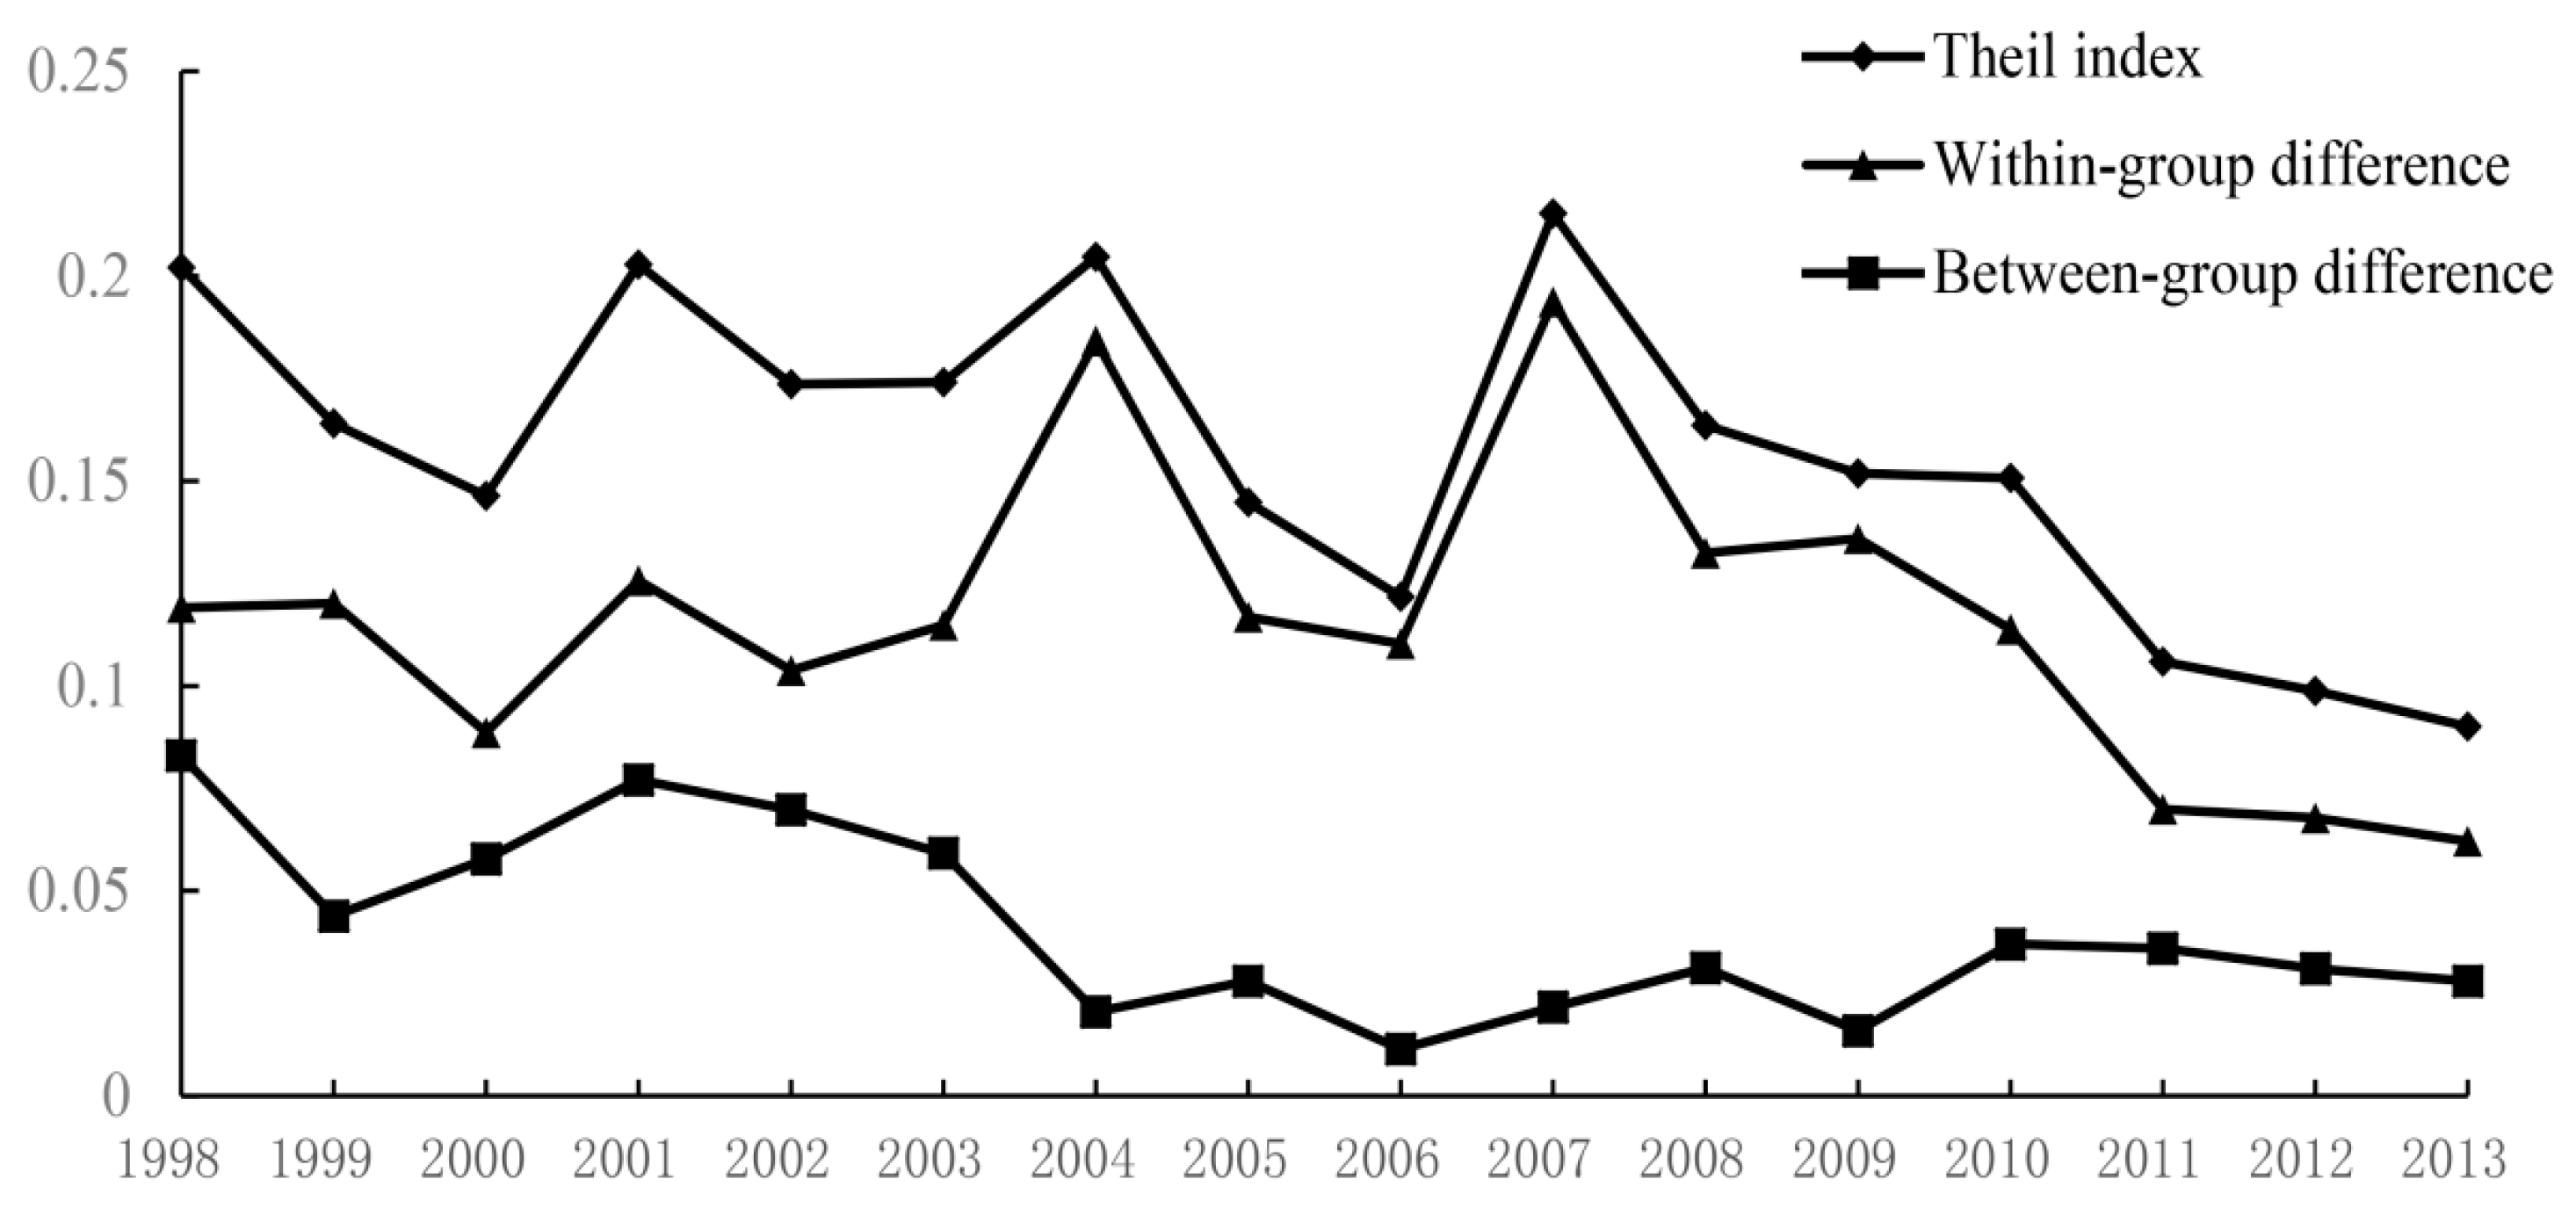
4.1. The Evolution Trend and Spatial Factor Decomposition of the Regional Innovation Capability Difference
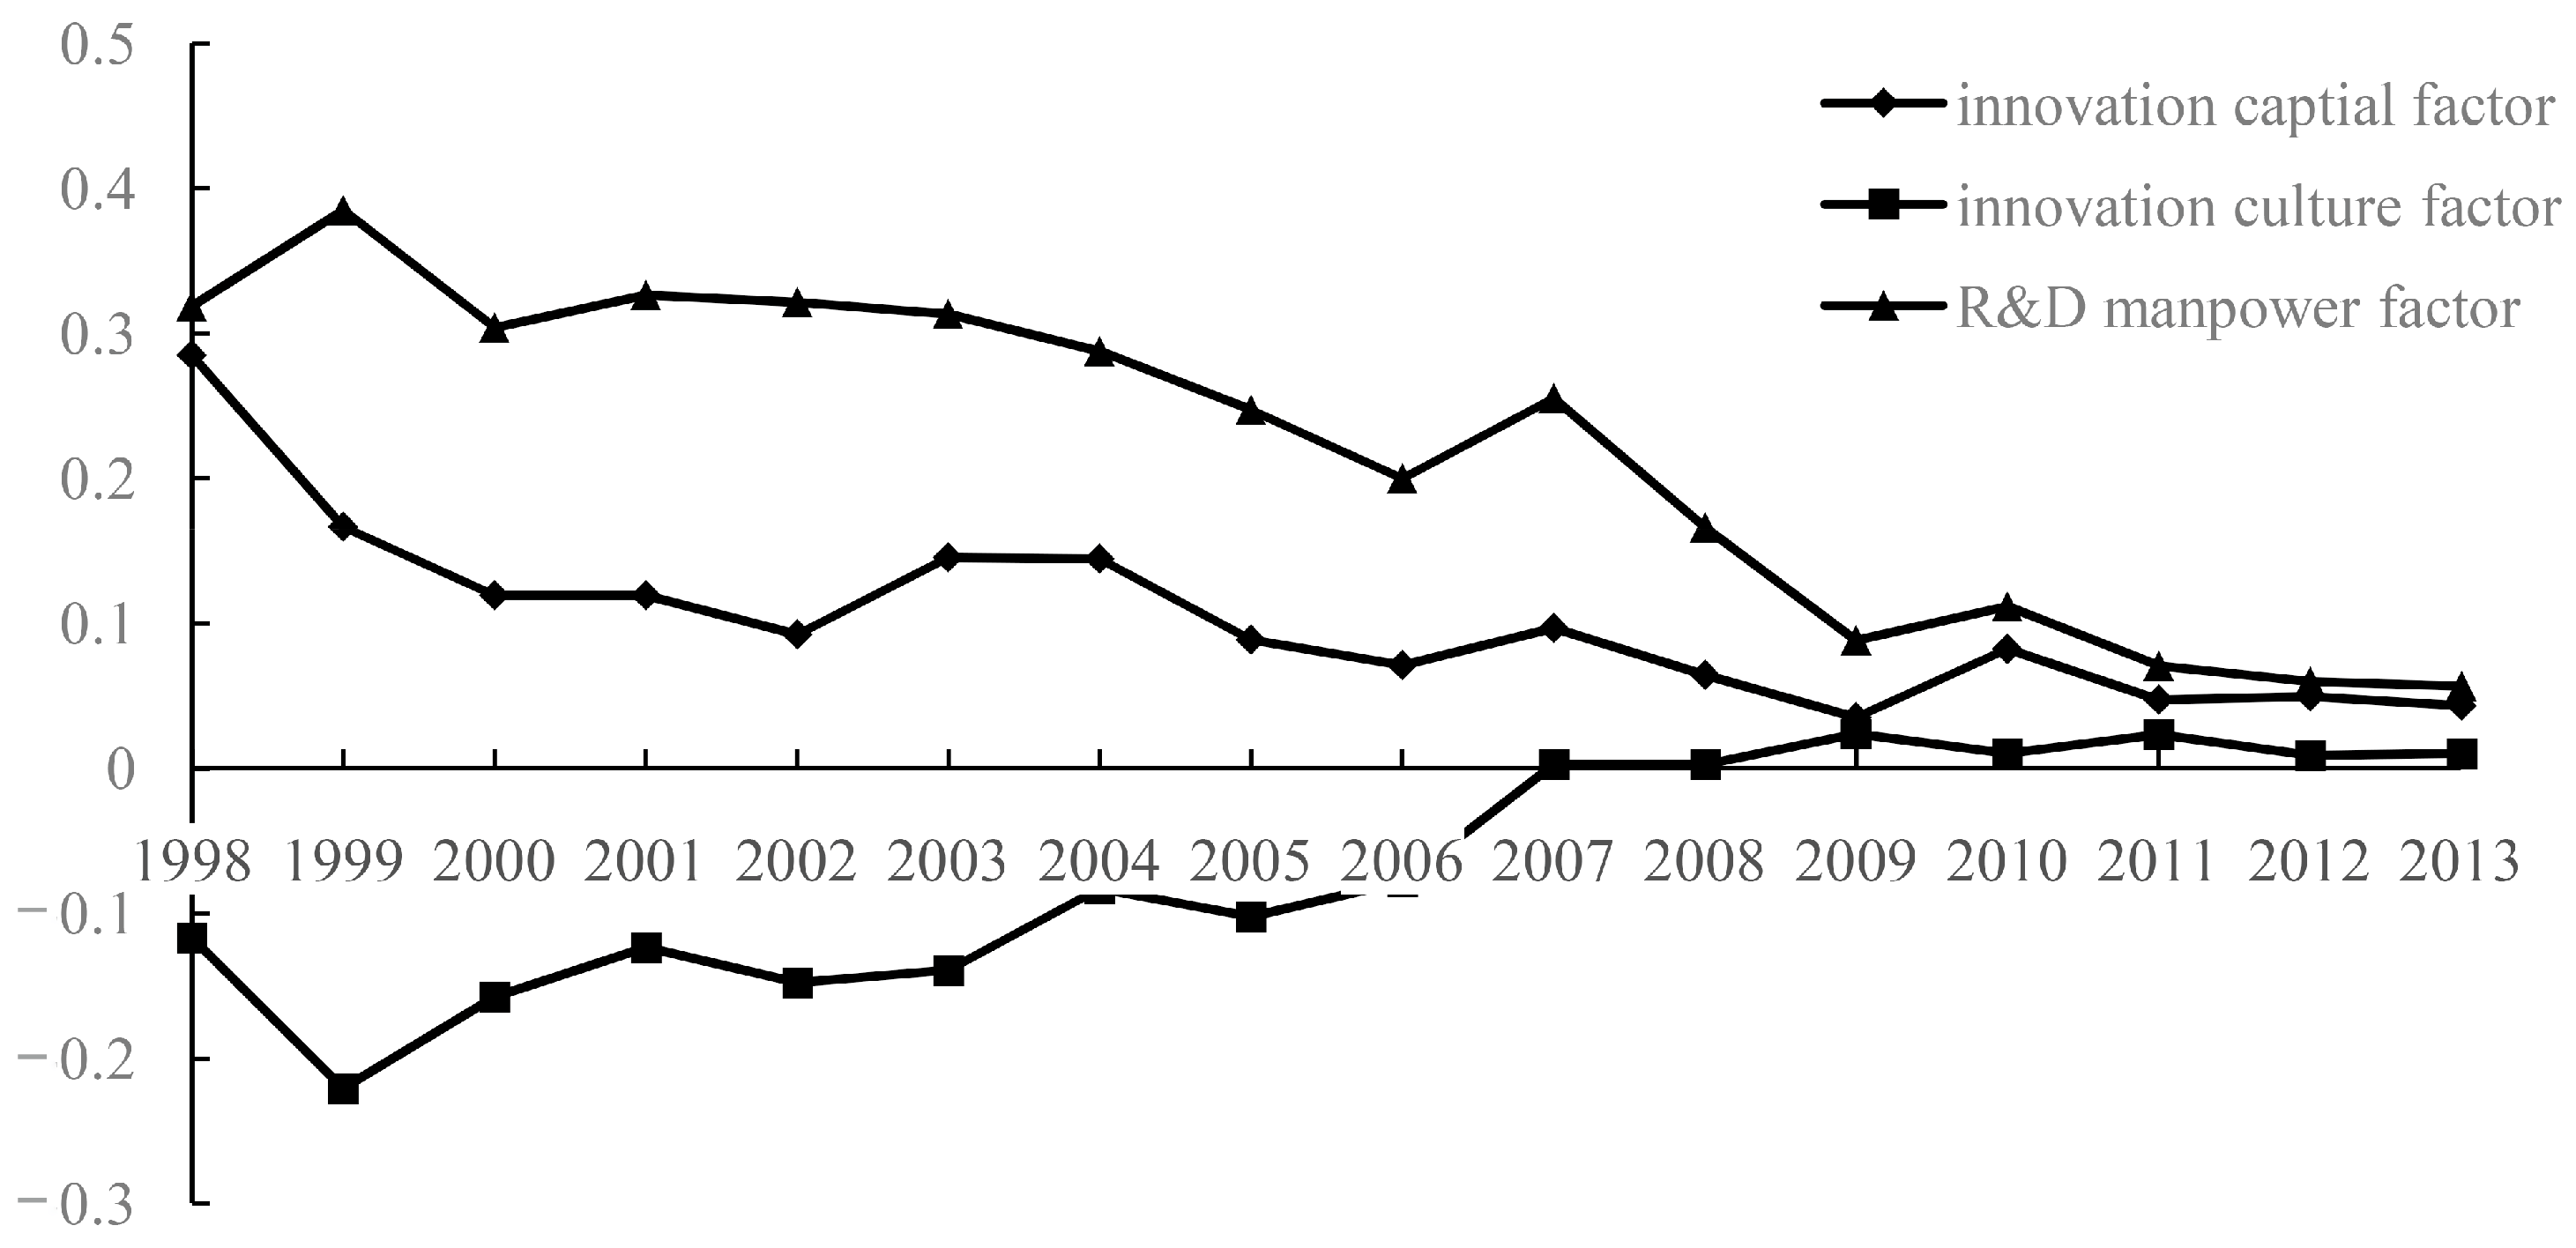
4.2. The Factors’ Decomposition Analysis of the Regional Innovation Capability Difference
5. Convergence Research on the Factor Decomposition of Regional Innovation Capability Variations
5.1. Construction of the Spatial Panel of the β Convergence Model
5.2. Analyses of Empirical Results
5.3. Further Analysis of the Results
6. Conclusions and Suggestions
- i.
- The operational idea of regional innovation system construction, that is, government leadership, enterprise participation, sci-tech innovation, and industry realization, should be insisted upon. The change in the convergence speed of China’s regional innovation capability difference shows that a lot has been achieved through the development idea, which is, through the central and local governments adopting the regional innovation policy and regional innovation layout to promote regional enterprise technology, achieve regional industrial upgrades, and realize inter-regional collaborative innovation. Thus, we should stick to the policy system of regional innovation system construction that has been implemented since China’s eleventh Five-Year Plan to drive enterprise technology upgrades and high-tech industrialization through government design and policy guidance. We should also strive to achieve the sci-tech progress-led multi-regional innovation development pattern.
- ii.
- System obstacles to knowledge factor mobility should be reduced, and the regional absorptive capacity should be strengthened to promote regional knowledge spillover. All the cities in the four regions should grasp the opportunities offered by the regional integration development strategies being implemented nationally: the Coordinated Development of Beijing-Tianjin-Hebei, Integration of the Yangtze River Delta, Silk Road Economic Belt, and the Yangtze River Economic Zone, among others. They should consider setting up specialized agencies to make plans for regional innovation development in order to guide each region in innovative economic construction, promote rational innovation factors such as mobility, and improve the efficiency of innovation resource allocation through innovation factor mobility driving inter-regional knowledge spillover.
- iii.
- The source channels of sci-tech input need to be broadened, and the sci-tech input system with its regional innovation chain needs to be improved accordingly. Since the capital factor plays a boosting role in regional innovation capability convergence, all the regions should still attach great importance to improving capital input and financing innovation capability through multiple channels. To support regional innovation capability construction, we may also consider reducing the risk of investors when investing in innovation. We may consider attracting more investors to join the investment in the innovation lifecycle through the leverage effect of magnifying fiscal sci-tech investments, including construction of institutions, investment diversification, designation of investment income-sharing mechanisms, and others.
- iv.
- The middle, western, and northeastern regions should tailor measures to suit local conditions and give overall consideration to the fundamental work construction of innovation talent, innovation culture, and innovation industry to lay a good foundation for narrowing the innovation difference with the eastern region. We can consider selecting cities in the middle, western, and northeastern regions, such as Wuhan, Chongqing, Chengdu, Xi’an, or Harbin, as regional innovation centers. We can strengthen the hatching efforts of the regions, especially their exploration of the economic value of innovation achievements and their construction of a regional provincial innovation fragmentation system with a clear division of labor and moderate competition, to foster an innovation cooperation system and improve the inter-regional innovation cooperation effect.
Acknowledgments
Author Contributions
Conflicts of Interest
References
- Li, G.P.; Wang, C.Y. The spatial characteristics and time-space evolution of China’s provincial innovation input—Based on empirical analysis of explorative spatial data. Geogr. Res. 2012, 31, 95–106. [Google Scholar]
- Chen, X.D.; Wang, L. Club convergence of regional innovation in China based on patent indicator. China Soft Sci. 2007, 10, 76–85. [Google Scholar]
- Liefner, I.; Hennemann, H. Structural holes and new dimensions of distance: The spatial configuration of the scientific knowledge network of China’s optical technology sector. Environ. Plan. A 2011, 4, 810–829. [Google Scholar] [CrossRef]
- Quatraro, F. Knowledge Structure and Regional Economic Growth: The French Case; Emerald Publishing: Cambridge, UK, 2011. [Google Scholar]
- Fagerberg, J. Technology and international differences in growth rates. J. Econ. Lit. 1994, 7, 1147–1175. [Google Scholar]
- Shorrocks, A.F. The class of additively decomposable inequality measures. Econometrica 1980, 48, 613–626. [Google Scholar] [CrossRef]
- Wu, H.C.; Liu, S.F. Evaluation on the R and D relative efficiency of different areas in China based on improved DEA model. R&D Manag. 2007, 19, 108–112. [Google Scholar]
- Bai, J.H. Human capital, R&D and productivity growth—Based on the panel data of Chinese provinces. J. Shanxi Financ. Econ. Univ. 2011, 12, 18–25. [Google Scholar]
- Bai, J.H.; Li, J. Governmental R and D financial aid—Based on empirical analysis from efficiency perspective. J. Financ. Res. 2011, 6, 181–193. [Google Scholar]
- Gilman, D. The New Geography of Global Innovation; Goldman Sachs: New York, NY, USA, 2010. [Google Scholar]
- Eberhardt, H. Untested Assumptions and Data Slicing: A Critical Review of Firm-Level Production Function Estimators; University of Oxford: London, UK, 2010. [Google Scholar]
- Cheng, L.W.; Sun, W.; Wang, J.Y. High-tech industry innovation efficiency of factor market from the incomplete perspective—Based on the comparison of the DEA-Windows’ domestic and foreign investment allocation efficiency and scale efficiency in three stages. Stud. Sci. Sci. 2011, 29, 930–938. [Google Scholar]
- See, K.F.; Li, F. Total factor productivity analysis of the UK airport industry: A Hick-Moorsteen index method. J. Air Transp. Manag. 2015, 43, 1–10. [Google Scholar] [CrossRef]
- Yang, R.D. Study on the total productivity of Chinese manufacturing enterprises. Econ. Res. J. 2015, 2, 61–74. [Google Scholar]
- Qiao, Y.B.; Wang, Y.Y. The evaluation of innovation efficiency in China based on three-stage DEA-windows. Sci. Sci. Manag. S T 2017, 38, 88–97. [Google Scholar]
- Cao, X.; Yu, J. Regional innovation efficiency in China from the green low—Carbon perspective. China Popul. Res. Environ. 2015, 25, 10–19. [Google Scholar]
- Wang, R.Q.; Peng, L.T.; Jiang, N. Analysis and test about efficiency of regional creativity basing on the SFA and malmquist method. Sci. Manag. S.T. 2010, 31, 121–128. [Google Scholar]
- Dovle, E.; O’Connor, F. Innovation capacities in advanced economies: Relative performance of small open economies. Res. Int. Bus. Financ. 2013, 1, 106–123. [Google Scholar]
- Chen, J. Spatial structure of regional innovation of china and contributing factors. Syst. Eng. 2011, 29, 41–48. [Google Scholar]
- Li, X.D.; Li, N.; Bai, J.H.; Xie, Z.Q. Study on the R and D innovation efficiency of high-tech industry in China. China Soft Sci. 2011, 2, 52–61. [Google Scholar]
- Ding, J.; Hunag, R.; Lv, L.C. Multiscale analysis of innovation difference in the Yangtze River economic belt based on the number of patents. Res. Environ. Yangtze Basin 2016, 25, 868–876. [Google Scholar]
- Cao, Y.; Qin, Y.X. Measurable analysis on the difference changes of regional innovation capability based on the dynamic performance in China. China Popul. Res. Env. 2012, 22, 164–169. [Google Scholar]
- Wang, X.Q.; Xu, W.X. China’s inter-provincial trade panel and interaction model analysis under multi-dimensional distance. China Ind. Econ. 2014, 3, 31–42. [Google Scholar]
- Liu, C.P.; Li, Q.B. Multi-indexes measurement on regional economic disparity based on provincial panel data. Stat. Decis. 2012, 8, 83–85. [Google Scholar]
- Huang, D.S.; Yang, C.F. Study on the convergence of regional innovation capacity based on spatial effect. Sci. Tech. Econ. 2017, 31, 44–48. [Google Scholar]
- Jiang, T.Y. Study on spatial and temporal evolution and factors of regional innovation in China. Econ. Geogr. 2013, 33, 22–29. [Google Scholar]
- Xiao, G.; Du, D.B.; Dai, Q.W. Chinese regional innovation differences in temporal and spatial evolution. Sci. Res. Manag. 2016, 37, 42–50. [Google Scholar]
- Lv, G.F.; Wu, C.; Li, X.W. Research on foreign direct investment’s role in regional innovation capacity. Macroeconomics 2013, 6, 104–111. [Google Scholar]
- Wei, S.H.; Wu, G.S.; Lv, X.L. The determinants of regional innovation capability—Comment on the regional gap of innovation capability in China. China Soft Sci. 2010, 9, 76–85. [Google Scholar]
- Griliches, S. Issues in assessing the contribution of R&D to productivity growth. Bell J. Econ. 1979, 10, 92–116. [Google Scholar]
- Jiang, M.H.; Jia, X.H. The mechanism on industrial clusters’ impact on regional innovation capacity based on C-D production function: An empirical study. China Soft Sci. 2013, 6, 154–162. [Google Scholar]
- Feldman, M.P. The geographic sources of innovation: Technological infrastructure and product innovation in the United States. Ann. Assoc. Am. Geogr. 1994, 84, 210–229. [Google Scholar] [CrossRef]
- Scott, A.J. New Industrial Space; Pion: London, UK, 1988. [Google Scholar]
- Storper, M. The Regional World: Territorial Development in a Global Economy; The Guilford Press: New York, NY, USA, 1997. [Google Scholar]
- Zhang, Z.R. Regional difference mechanism of innovation in China—A case study from the perspective of new economic geography. Soft Sci. 2013, 6, 64–68. [Google Scholar]
- Gao, H. Effects of the use of patent documents on China’s regional innovation. Tech. Manag. Res. 2017, 4, 48–51. [Google Scholar]
- Jin, Q.H.; Yan, T.H. International technology spillover and regional innovation ability—An Empirical analysis based on the perspective of intellectual property. J. Int. Trade 2017, 3, 14–25. [Google Scholar]
- Li, C.; Qin, C.L.; Ren, J.H. Spatial spillovers, proximity and regional innovation: Evidence from China. Forum Sci. Tech. China 2017, 1, 47–52. [Google Scholar]
- Shao, Y.F.; Fan, Q.L.; Tang, X.W. The influencing factors of regional innovation capacity based on the endogenous growth model. Sci. Res. Manag. 2011, 32, 28–33. [Google Scholar]
- Tan, J.T.; Zhang, P.Y.; Li, Y. Spatio-temporal characteristics of regional innovation performance and its influencing factors in China. Sci. Geogr. Sin. 2016, 36, 39–46. [Google Scholar]
- Zhang, P.; Wu, J.N. Government intervention, resource curse and regional innovation: An empirical research based on the provincial panel data from Mainland China. Sci. Res. Manag. 2017, 38, 62–69. [Google Scholar]
- Gao, F. Double factors decomposition of space and power in China’s regional economic gap. Econ. Sci. 2012, 5, 5–17. [Google Scholar]
- Romer, P.M. Endogenous technological change. J. Political Econ. 1990, 98, 71–102. [Google Scholar] [CrossRef]
- Guan, J.C.; He, Y. The international comparative study on connection of science—technology—economy and innovation performance. J. Manag. Sci. China 2009, 12, 61–77. [Google Scholar]
- Zhang, Q.H. Regional inequality in contemporary China. Ann. Econ. Financ. 2012, 13, 113–137. [Google Scholar]
- Li, C.; Gibson, J. Rising regional inequality in China: Fact or artifact? World Dev. 2013, 47, 16–29. [Google Scholar] [CrossRef]
- Su, Y.; Li, B.Z.; Yu, D.K. Measure and equity of regional innovation system’s knowledge stock. China Soft Sci. 2012, 5, 157–174. [Google Scholar]
- Wu, Y.B. Evaluating technical efficiency and technical progress. J. Quant. Tech. Econ. 2008, 25, 67–79. [Google Scholar]
- Xiao, Z.L.; Feng, S.X.; Han, S.F. Efficiency measurement and improved method analysis of China’s high-tech industry two stages—Based on improving SBM directional distance function empirical. Ind. Econ. Res. 2012, 4, 10–18. [Google Scholar]
- Pan, X.F.; Zhang, W.W. China’s regional innovation convergence analysis basing on the perspective of spatial effect. J. Ind. Eng. Eng. Manag. 2013, 27, 63–67. [Google Scholar]
- Boschma, R. Proximity and innovation: A critical assessment. Reg. Stud. 2005, 39, 61–74. [Google Scholar] [CrossRef]
- Millo, G.; Piras, P. Splm: Spatial panel data models in R. J. Stat. Softw. 2012, 47, 1–38. [Google Scholar] [CrossRef]
- Zhang, X.L. Regional economic convergence mechanism in the Yangtze River delta: 1993~2006. J. World Econ. 2010, 3, 126–141. [Google Scholar]
- Wang, C.F.; Xu, H.B.; Zhang, G.P. Research of the gap of city’s innovation capability—An empirical study based on patent quality. J. Shandong Univ. 2014, 1, 74–80. [Google Scholar]
- Elhorst, J.P. Spatial Econometrics—From Cross-Sectional Data to Spatial Panels; Springer: London, UK, 2014. [Google Scholar]

| Year | Absolute Value | Contribution Degree | |||||||
|---|---|---|---|---|---|---|---|---|---|
| Innovation Difference Value in Regions | |||||||||
| Eastern | Middle | Western | Northeastern | ||||||
| 1998 | 0.2021 | 0.1191 | 0.0830 | 0.0366 | 0.1798 | 0.3429 | 0.0762 | 58.93 | 41.07 |
| 1999 | 0.1641 | 0.1202 | 0.0439 | 0.0567 | 0.3439 | 0.3085 | 0.0473 | 73.25 | 26.75 |
| 2000 | 0.1464 | 0.0886 | 0.0578 | 0.0631 | 0.2421 | 0.1429 | 0.1417 | 60.52 | 39.48 |
| 2001 | 0.2028 | 0.1257 | 0.0771 | 0.1041 | 0.2571 | 0.2275 | 0.1277 | 61.98 | 38.02 |
| 2002 | 0.1736 | 0.1038 | 0.0698 | 0.0860 | 0.0956 | 0.3028 | 0.0855 | 51.18 | 48.82 |
| 2003 | 0.1741 | 0.1149 | 0.0592 | 0.1097 | 0.1512 | 0.1952 | 0.0590 | 66.00 | 34.00 |
| 2004 | 0.2047 | 0.1842 | 0.0205 | 0.1976 | 0.1915 | 0.0980 | 0.0460 | 89.99 | 10.01 |
| 2005 | 0.1448 | 0.1168 | 0.0280 | 0.1253 | 0.0768 | 0.0654 | 0.0427 | 90.63 | 9.37 |
| 2006 | 0.1217 | 0.1103 | 0.0114 | 0.1160 | 0.1655 | 0.0575 | 0.0128 | 90.63 | 9.37 |
| 2007 | 0.2153 | 0.1937 | 0.0216 | 0.2149 | 0.1067 | 0.0488 | 0.0061 | 89.97 | 10.03 |
| 2008 | 0.1636 | 0.1324 | 0.0312 | 0.1407 | 0.0874 | 0.0792 | 0.0108 | 80.93 | 19.07 |
| 2009 | 0.1519 | 0.1360 | 0.0159 | 0.0953 | 0.1777 | 0.0569 | 0.0199 | 89.53 | 10.47 |
| 2010 | 0.1508 | 0.1138 | 0.0370 | 0.1070 | 0.1638 | 0.0637 | 0.0410 | 75.46 | 24.54 |
| 2011 | 0.1059 | 0.0699 | 0.0360 | 0.0606 | 0.2288 | 0.0587 | 0.0547 | 66.01 | 33.99 |
| 2012 | 0.0988 | 0.0678 | 0.0310 | 0.0541 | 0.2816 | 0.0548 | 0.0594 | 68.62 | 31.38 |
| 2013 | 0.0901 | 0.0621 | 0.0280 | 0.0532 | 0.2810 | 0.0535 | 0.0580 | 68.92 | 31.08 |
| Year | Eastern Region | Middle Region | Western Region | Northeastern Region | ||||||||
|---|---|---|---|---|---|---|---|---|---|---|---|---|
| 1998 | 0.0971 | −0.0704 | 0.1070 | 0.2639 | −0.1752 | 0.3550 | 0.5862 | −0.0898 | 0.4328 | 0.6965 | −0.6466 | 0.7228 |
| 1999 | 0.0413 | −0.0097 | 0.0673 | 0.2317 | −0.1657 | 0.5097 | 0.7573 | −0.6262 | 0.9346 | 0.0439 | 0.0160 | 0.0313 |
| 2000 | 0.0328 | 0.0217 | 0.0414 | 0.3625 | −0.2245 | 0.4666 | 0.4897 | −0.5509 | 0.6939 | 0.0958 | 0.0858 | 0.0560 |
| 2001 | 0.0368 | 0.0395 | 0.0651 | 0.3158 | 0.0266 | 0.2306 | 0.5516 | −0.5230 | 0.7505 | 0.0512 | 0.0379 | 0.0898 |
| 2002 | 0.0366 | −0.0021 | 0.0882 | 0.0754 | 0.0552 | 0.0404 | 0.5458 | −0.2805 | 0.5834 | 0.0018 | 0.0792 | 0.0063 |
| 2003 | 0.1039 | −0.0403 | 0.1500 | 0.2180 | −0.0120 | 0.1633 | 0.3532 | −0.1436 | 0.3388 | 0.0132 | −0.0095 | 0.0684 |
| 2004 | 0.1098 | 0.0327 | 0.1652 | 0.0842 | −0.0533 | 0.2448 | 0.3559 | −0.2150 | 0.3130 | 0.0962 | −0.0421 | 0.0880 |
| 2005 | 0.0612 | −0.0024 | 0.1277 | 0.0562 | −0.0066 | 0.0834 | 0.2085 | −0.0928 | 0.1581 | 0.0003 | 0.0142 | 0.0286 |
| 2006 | 0.0514 | 0.0008 | 0.1153 | 0.0387 | 0.0743 | 0.0912 | 0.2159 | −0.2169 | 0.2745 | 0.1304 | −0.1980 | 0.2108 |
| 2007 | 0.0791 | 0.0168 | 0.1981 | 0.0933 | −0.0277 | 0.1344 | 0.1396 | −0.1016 | 0.1504 | 0.1267 | −0.1978 | 0.2040 |
| 2008 | 0.0403 | 0.0179 | 0.1229 | 0.0612 | 0.0243 | 0.0631 | 0.1336 | 0.0046 | 0.0745 | 0.0904 | −0.0942 | 0.1160 |
| 2009 | 0.0119 | 0.0309 | 0.0641 | 0.0445 | 0.0983 | 0.0794 | 0.1475 | −0.0132 | 0.0701 | 0.0904 | −0.1552 | 0.1160 |
| 2010 | 0.0409 | 0.0384 | 0.0687 | 0.0398 | 0.1077 | 0.0561 | 0.2363 | −0.0505 | 0.1132 | 0.0685 | −0.1476 | 0.1886 |
| 2011 | 0.0237 | 0.0266 | 0.0340 | 0.0301 | 0.1748 | 0.0540 | 0.1523 | −0.2136 | 0.2723 | 0.0517 | −0.0444 | 0.1210 |
| 2012 | 0.0252 | 0.0218 | 0.0321 | 0.0455 | 0.2219 | 0.0597 | 0.1077 | −0.0382 | 0.0930 | 0.0846 | 0.0174 | 0.0419 |
| 2013 | 0.0248 | 0.0210 | 0.0301 | 0.0441 | 0.2107 | 0.0503 | 0.1032 | −0.0357 | 0.1210 | 0.0789 | 0.0201 | 0.0628 |
| Region | Period | 1998–2013 (KKP Model) | 1998–2013 (Other Models) | |||||||||
|---|---|---|---|---|---|---|---|---|---|---|---|---|
| Model | Adjusted-R2 | Hausman | ||||||||||
| Country | Y | −0.148 | −0.023 | 0.579 *** | −0.999 *** | 0.061 * | ||||||
| (0.20) | (0.29) | (0.00) | (0.00) | (0.09) | ||||||||
| C | −0.055 | −0.002 | 0.588 *** | −0.999 *** | 0.054 | −0.04 | 0.386 *** | −1.247 *** | 0.571 | |||
| (0.63) | (0.93) | (0.00) | (0.00) | (0.11) | (0.84) | (0.01) | (0.00) | |||||
| H | −0.178 | 0.016 | −0.999 *** | 0.583 *** | 0.070 * | |||||||
| (0.49) | (0.53) | (0.00) | (0.00) | (0.07) | ||||||||
| N | 0.073 | 0.021 | 0.030 *** | −0.025 | 0.006 | 0.023 | −0.315 ** | −0.308 | 0.663 | |||
| (0.45) | (0.21) | (0.00) | (0.45) | (0.78) | (0.16) | (0.06) | 0.272 | |||||
| Eastern region | Y | −0.093 | −0.028 | 0.000 | 0.000 | 0.007 | −0.032 * | 0.575 | 23.4 *** | |||
| (0.36) | (0.22) | (0.90) | (0.73) | (0.85) | (0.10) | (0.00) | ||||||
| C | −0.101 | −0.024 | 0.000 | 0.000 | 0.000 | −0.376 *** | 0.641 | 17.1 *** | ||||
| (0.24) | (0.27) | (0.74) | (0.94) | (0.95) | (0.00) | (0.00) | ||||||
| H | −0.117 | −0.022 | 0.000 | 0.000 | 0.000 | −0.335 *** | 0.711 | 2.54 * | ||||
| (0.31) | (0.42) | (0.96) | (0.94) | (0.71) | (0.00) | (0.09) | ||||||
| N | −0.025 | −0.016 | 0.000 | 0.000 | 0.001 | −0.023 | −0.016 | 0.255 | 0.271 | |||
| (0.70) | (0.27) | (0.94) | (0.76) | (0.79) | (0.72) | (0.28) | (0.60) | |||||
| Middle region | Y | −0.310 | −0.026 | 0.000 | 0.000 | 0.000 | −0.165 | −0.001 | 0.553 | 1.53 | ||
| (0.48) | (0.70) | (0.88) | (0.68) | (0.98) | (0.69) | (0.98) | (0.22) | |||||
| C | −0.038 | 0.025 | 0.000 | 0.000 | 0.000 | 0.053 | 0.042 | 0.478 | 1.64 | |||
| (0.93) | (0.70) | (0.76) | (0.85) | (0.97) | (0.90) | (0.51) | (0.20) | |||||
| H | −0.095 | 0.016 | 0.000 | 0.000 | 0.000 | 0.054 | 0.041 | 0.487 | 0.903 | |||
| (0.83) | (0.82) | (0.77) | (0.55) | (0.64) | (0.90) | (0.52) | (0.34) | |||||
| N | 0.009 | 0.001 | 0.000 | 0.000 | 0.037 | 0.052 * | 0.417 | 3.69 ** | ||||
| (0.93) | (0.97) | (0.86) | (0.90) | (0.55) | (0.07) | (0.05) | ||||||
| Western region | Y | −0.935 *** | −0.104 ** | 0.000 | 0.000 | 0.056 | −0.725 ** | −0.082 * | 0.781 | 1.72 | ||
| (0.01) | (0.04) | (0.36) | (0.23) | (0.38) | (0.04) | (0.10) | (0.19) | |||||
| C | −0.671 ** | −0.064 | 0.000 | 0.000 | 0.000 | −0.309 *** | 0.523 | 22.43 *** | ||||
| (0.04) | (0.21) | (0.95) | (0.96) | (0.97) | (0.00) | (0.00) | ||||||
| H | −0.462 | −0.011 | 0.000 | 0.000 | 0.000 | −0.397 *** | 0.717 | 32.33 *** | ||||
| (0.32) | (0.87) | (0.89) | (0.78) | (0.22) | (0.00) | (0.00) | ||||||
| N | 0.171 | 0.053 | 0.000 | 0.000 | 0.000 | −0.049 | 0.32 | 2.84 * | ||||
| (0.63) | (0.32) | (0.25) | (0.17) | (0.34) | (0.56) | (0.09) | ||||||
| Northeastern region | Y | −0.942 ** | −0.194 ** | 0.000 | 0.000 | 0.000 | −0.684 *** | 0.414 | 13.56 *** | |||
| (0.04) | (0.04) | (0.85) | (0.58) | (0.99) | (0.00) | (0.00) | ||||||
| C | −0.847 * | −0.173 * | 0.000 | 0.000 | 0.000 | −0.668 *** | 0.401 | 11.72 *** | ||||
| (0.06) | (0.06) | (0.97) | (0.12) | (0.49) | (0.00) | (0.00) | ||||||
| H | −0.777 ** | −0.167 ** | 0.001 | −0.001 | 0.000 | −0.721 *** | 0.362 | 13.44 *** | ||||
| (0.04) | (0.04) | (0.20) | (0.18) | (0.31) | (0.00) | (0.00) | ||||||
| N | 0.201 | 0.040 | 0.001 | −0.161 *** | 0.000 | 0.057 | 0.378 | 3.77 ** | ||||
| (0.40) | (0.42) | (0.12) | (0.00) | (0.99) | (0.55) | (0.49) | ||||||
| Region | Model | Adjusted-R2 | Hausman | |||||
|---|---|---|---|---|---|---|---|---|
| Country | Y | −0.501 *** | −0.097 *** | −0.282 | 0.148 | 0.191 * | ||
| (0.006) | (0.000) | (0.749) | (0.818) | (0.090) | ||||
| C | −0.419 ** | −0.067 ** | −0.403 | 0.240 | 0.182 * | |||
| (0.019) | (0.015) | (0.607) | (0.628) | (0.100) | ||||
| H | 0.102 | 0.033 | 0.565 *** | −0.999 * | 0.166 | |||
| (0.568) | (0.333) | (0.005) | (0.070) | (0.127) | ||||
| N | −0.267 *** | −0.062 *** | 0.089 | −0.822 | 0.000 | |||
| (0.006) | (0.000) | (0.800) | (0.830) | (0.984) | ||||
| Eastern region | Y | −0.559 *** | −0.182 *** | 0.461 | 0.504 | |||
| (0.000) | (0.000) | (0.478) | ||||||
| C | −0.409 *** | 0.624 | 29.414 *** | |||||
| (0.000) | (0.000) | |||||||
| H | −0.236 ** | −0.064 ** | 0.709 | 0.009 | ||||
| (0.047) | (0.019) | (0.923) | ||||||
| N | −0.395 *** | 0.603 | 24.212 *** | |||||
| (0.000) | (0.000) | |||||||
| Middle region | Y | −0.560 *** | 0.572 | 12.373 *** | ||||
| (0.000) | (0.000) | |||||||
| C | −0.745 | −0.133 * | 0.814 | 1.698 | ||||
| (0.130) | (0.097) | (0.193) | ||||||
| H | −0.228 | 0.471 | 11.574 *** | |||||
| (0.316) | (0.000) | |||||||
| N | 0.205 | 0.393 | 7.545 *** | |||||
| (0.127) | (0.005) | |||||||
| Western region | Y | −0.739 *** | 0.607 | 71.55 *** | ||||
| (0.000) | (0.000) | |||||||
| C | −1.077 *** | 0.670 | 95.41 *** | |||||
| (0.000) | (0.000) | |||||||
| H | −0.959 *** | 0.572 | 64.12 *** | |||||
| (0.000) | (0.000) | |||||||
| N | −0.106 ** | 0.105 | 60.11 *** | |||||
| (0.020) | (0.000) | |||||||
| Northeastern region | Y | −0.764 *** | 0.667 | 25.318 *** | ||||
| (0.001) | (0.000) | |||||||
| C | −0.960 *** | 0.584 | 15.23 *** | |||||
| (0.002) | (0.000) | |||||||
| H | −0.593 ** | 0.423 | 13.17 *** | |||||
| (0.017) | (0.000) | |||||||
| N | −0.463 * | 0.551 | 21.27 *** | |||||
| (0.080) | (0.000) |
© 2017 by the authors. Licensee MDPI, Basel, Switzerland. This article is an open access article distributed under the terms and conditions of the Creative Commons Attribution (CC BY) license (http://creativecommons.org/licenses/by/4.0/).
Share and Cite
Xiao, Z.; Du, X.; Wu, C. Regional Difference and Evolution and Convergence of Innovation Capability in China: Research on Space and Factorial Levels. Sustainability 2017, 9, 1644. https://doi.org/10.3390/su9091644
Xiao Z, Du X, Wu C. Regional Difference and Evolution and Convergence of Innovation Capability in China: Research on Space and Factorial Levels. Sustainability. 2017; 9(9):1644. https://doi.org/10.3390/su9091644
Chicago/Turabian StyleXiao, Zelei, Xinya Du, and Chuanqing Wu. 2017. "Regional Difference and Evolution and Convergence of Innovation Capability in China: Research on Space and Factorial Levels" Sustainability 9, no. 9: 1644. https://doi.org/10.3390/su9091644
APA StyleXiao, Z., Du, X., & Wu, C. (2017). Regional Difference and Evolution and Convergence of Innovation Capability in China: Research on Space and Factorial Levels. Sustainability, 9(9), 1644. https://doi.org/10.3390/su9091644