1. Introduction
Energy is a fundamental aspect of global economic development. Our social model is based on the use of energy in its different modalities: renewable and non-renewable. The technical and economic maturity of technologies based on renewable energies varies from one to another. However, all of them have something in common; their ‘fuel’ are natural sources.
Photovoltaic systems have special characteristics that provide them benefits as electricity energy production system; in particular, standing out among them is modularity. In addition, energy solar photovoltaic has enough capacity to be an important part of the electric mix due to its vertiginous decrease in costs. According to a report from the International Renewable Energy Agency (IRENA), the total costs reduction of large-scale installation between 2010 and 2014 was among 29%–65%, depending on the region and the cost of the photovoltaic modules in 2014 fell around 75% compared to 2009 [
1].
On the other hand, photovoltaic solar energy has demonstrated the simplicity and reliability of its generation technology. This reliability has made it possible that, in 2014, investments in renewables exceed $300 billion USD in the world, 16% more than in 2013. Solar energy accounted for almost half of these investments, with 40 new GW, being the largest increase in its history [
2].
The evolution of the installed power has supposed a great technological advance in the photovoltaic systems. Although R&D&I (Research, Development, and Innovation) efforts are still needed to solve the new energy situation and the European requirements for electricity production using renewable energies.
Nowadays, most governments advocate to generating of electricity using renewable energy. In addition, it is increasingly committed to energy saving, for a more efficient use of energy. In this sense, there is currently a growing interest in the study of the use of electricity in buildings [
3,
4]. Therefore, the importance in education is evident from universities in our case [
5,
6], on sustainability and the environment [
7].
The electrical energy generated by a photovoltaic system is directly proportional to the solar irradiation received in the generator plane and to the installed nominal power [
8]. Therefore, for the correct estimation, it is necessary to forecast the meteorological data (radiation and temperature, among others) of the place where a photovoltaic system is going to be installed.
In order to carry out the design of a photovoltaic system; firstly, it is necessary to have the most accurate information possible about the solar resource at the installation site. Nowadays, there are databases where it is possible to find information on solar radiation but only for horizontal surfaces. However, usually, photovoltaic systems have their collecting surfaces not in a horizontal position but in a tilt position (orientation and inclination different from horizontal). Therefore, it is necessary to transform the horizontal solar radiation data to tilt solar radiation data. This transformation is not easy, and the application of complex mathematical equations and expressions and difficult algorithms must be done [
5].
This topic is a matter that is being very much pursued in the research on solar energy. There are different studies performed, where some keys are given to obtain the optimal angle [
9]. Many of this research gives recommendations based on the latitude of the place, depending on the area of study. In this regard, studies have been carried out around the world [
9,
10,
11,
12,
13,
14,
15,
16].
Next sections are organized as follows: in second section, the databases most commonly used in the field of renewable energies are described. The third section shows the software developed, describing its main features; and the fourth one shows two case studies for two Spanish cities, where the energy that could be generated from a photovoltaic system is quantified depending on its inclination. The results and a discussion are shown in fifth section. Finally, in the final section, the conclusions are proposed.
2. Databases to Obtain the Design Parameters of Photovoltaic Systems
The generation of meteorological data using different numerical techniques was very habitual not so long ago [
16,
17]. The use of meteorological data will be used in order to analyse the behaviour of the photovoltaic devices before and afterwards its installation. This data will be used before the installation is sited, if the behaviour of the systems in particular conditions is simulated [
18], otherwise the data will be used afterwards if some aspects are approached, such as the degradation suffered by the photovoltaic devices with the passing of time [
19], or the behaviour of different technologies in different meteorological conditions [
20,
21,
22].
As discussed above, the user can easily obtain values of solar radiation on a horizontal surface from numerous databases. However, it is not so easy that these databases provide solar radiation data on a surface located at whatever position (orientation and inclination different from horizontal).
The databases most commonly used in the field of renewable energies include: AEMET (“Agencia Estatal de Meteorología”), SiAR (“Sistema de Información Agroclimática para el Regadío”), CM-SAF (Satellite Application Facility on Climate Monitoring), SoDa (Solar Radiation Data), PVGIS (Photovoltaic Geographical Information System), Meteonorm, and Surface Meteorology and Solar Energy from NASA’s Earth Science Enterprise Program.
Table 1 shows a comparison between some relevant characteristics, such as the geographical area in which they operate the meteorological parameters they provide, as well as if the optimum tilt angle is provided. This data is analysed for each of the databases under study.
In general, they are open access platforms. In some cases, pre-registration is necessary to be able to access the data, and in some other cases, it is required the purchase of a license, for example in the case of Meteonorm.
The data provided by these applications are very similar. Most of them provide general weather meteorological data, such as temperature, wind speed, and direction or humidity. In particular, for the solar resources of all of the databases have values on global solar radiation on a horizontal plane, although not all with the same temporality.
In contrast, the data of solar radiation on inclined planes is not available for all databases. It is possible to obtain them from CM-SAF, SoDa-Helioclim 3, and PVGIS, although it is not possible for all components that integrate solar radiation (direct, diffuse, and albedo). The values commonly used in the databases consulted are global solar radiation and its direct component. On the other hand, only PVGIS allows the calculation of the optimum inclination at which the photovoltaic modules are disposed.
The monthly average global radiation in two Spanish cities, Madrid (Latitude: 40.42°) and Jaén (Latitude: 37.77°), are shown in
Table 2 for optimal inclination obtained with PVGIS and with the software developed (OrientSol 3, Jaén, Spain).
The optimum angle calculated by PVGIS for the city of Madrid and Jaén is 33°, while the estimate by OrientSol is slightly lower; 29° in both cases. On the other hand, the monthly average solar radiation obtained at this inclination are very similar to each other. The average error does not exceed 5% (3.55% and 3.82%, respectively).
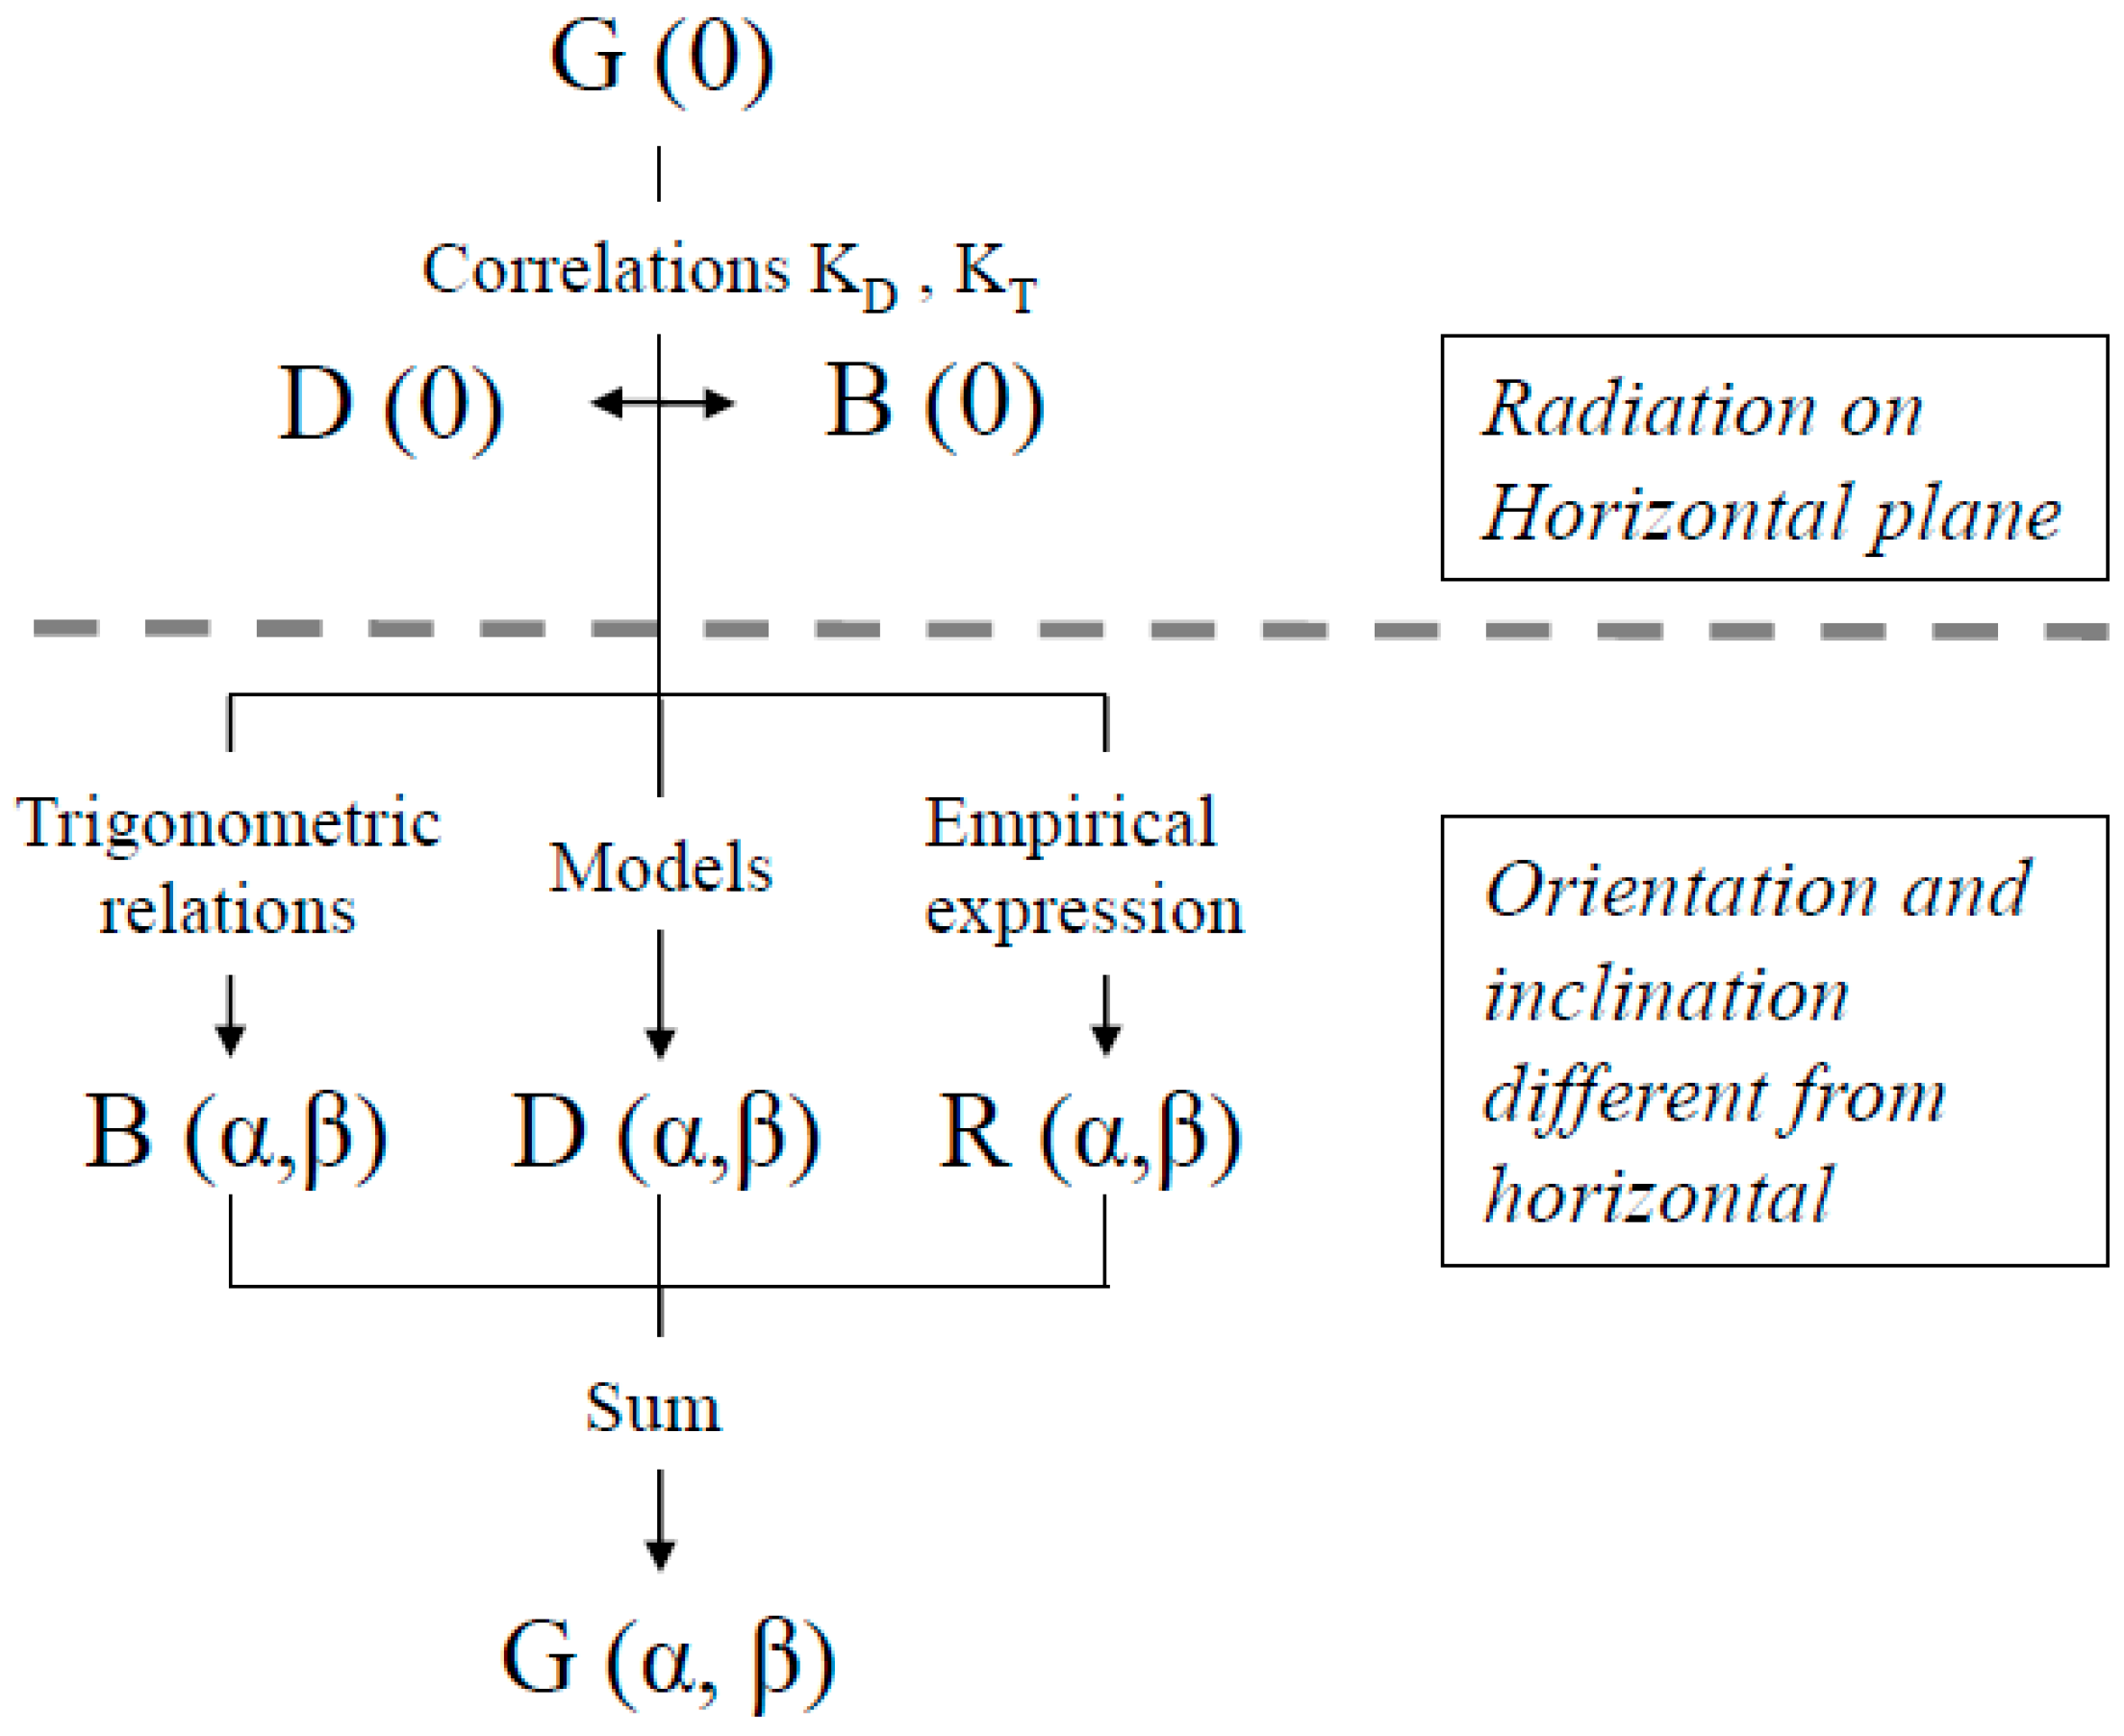
Once this data is collected, it is necessary to use complex mathematical equations and algorithms to obtain solar radiation values for any tilt and orientation of the modules. A mathematical procedure based on the values of global solar radiation on horizontal surfaces is carried out, as briefly shown in
Figure 1.
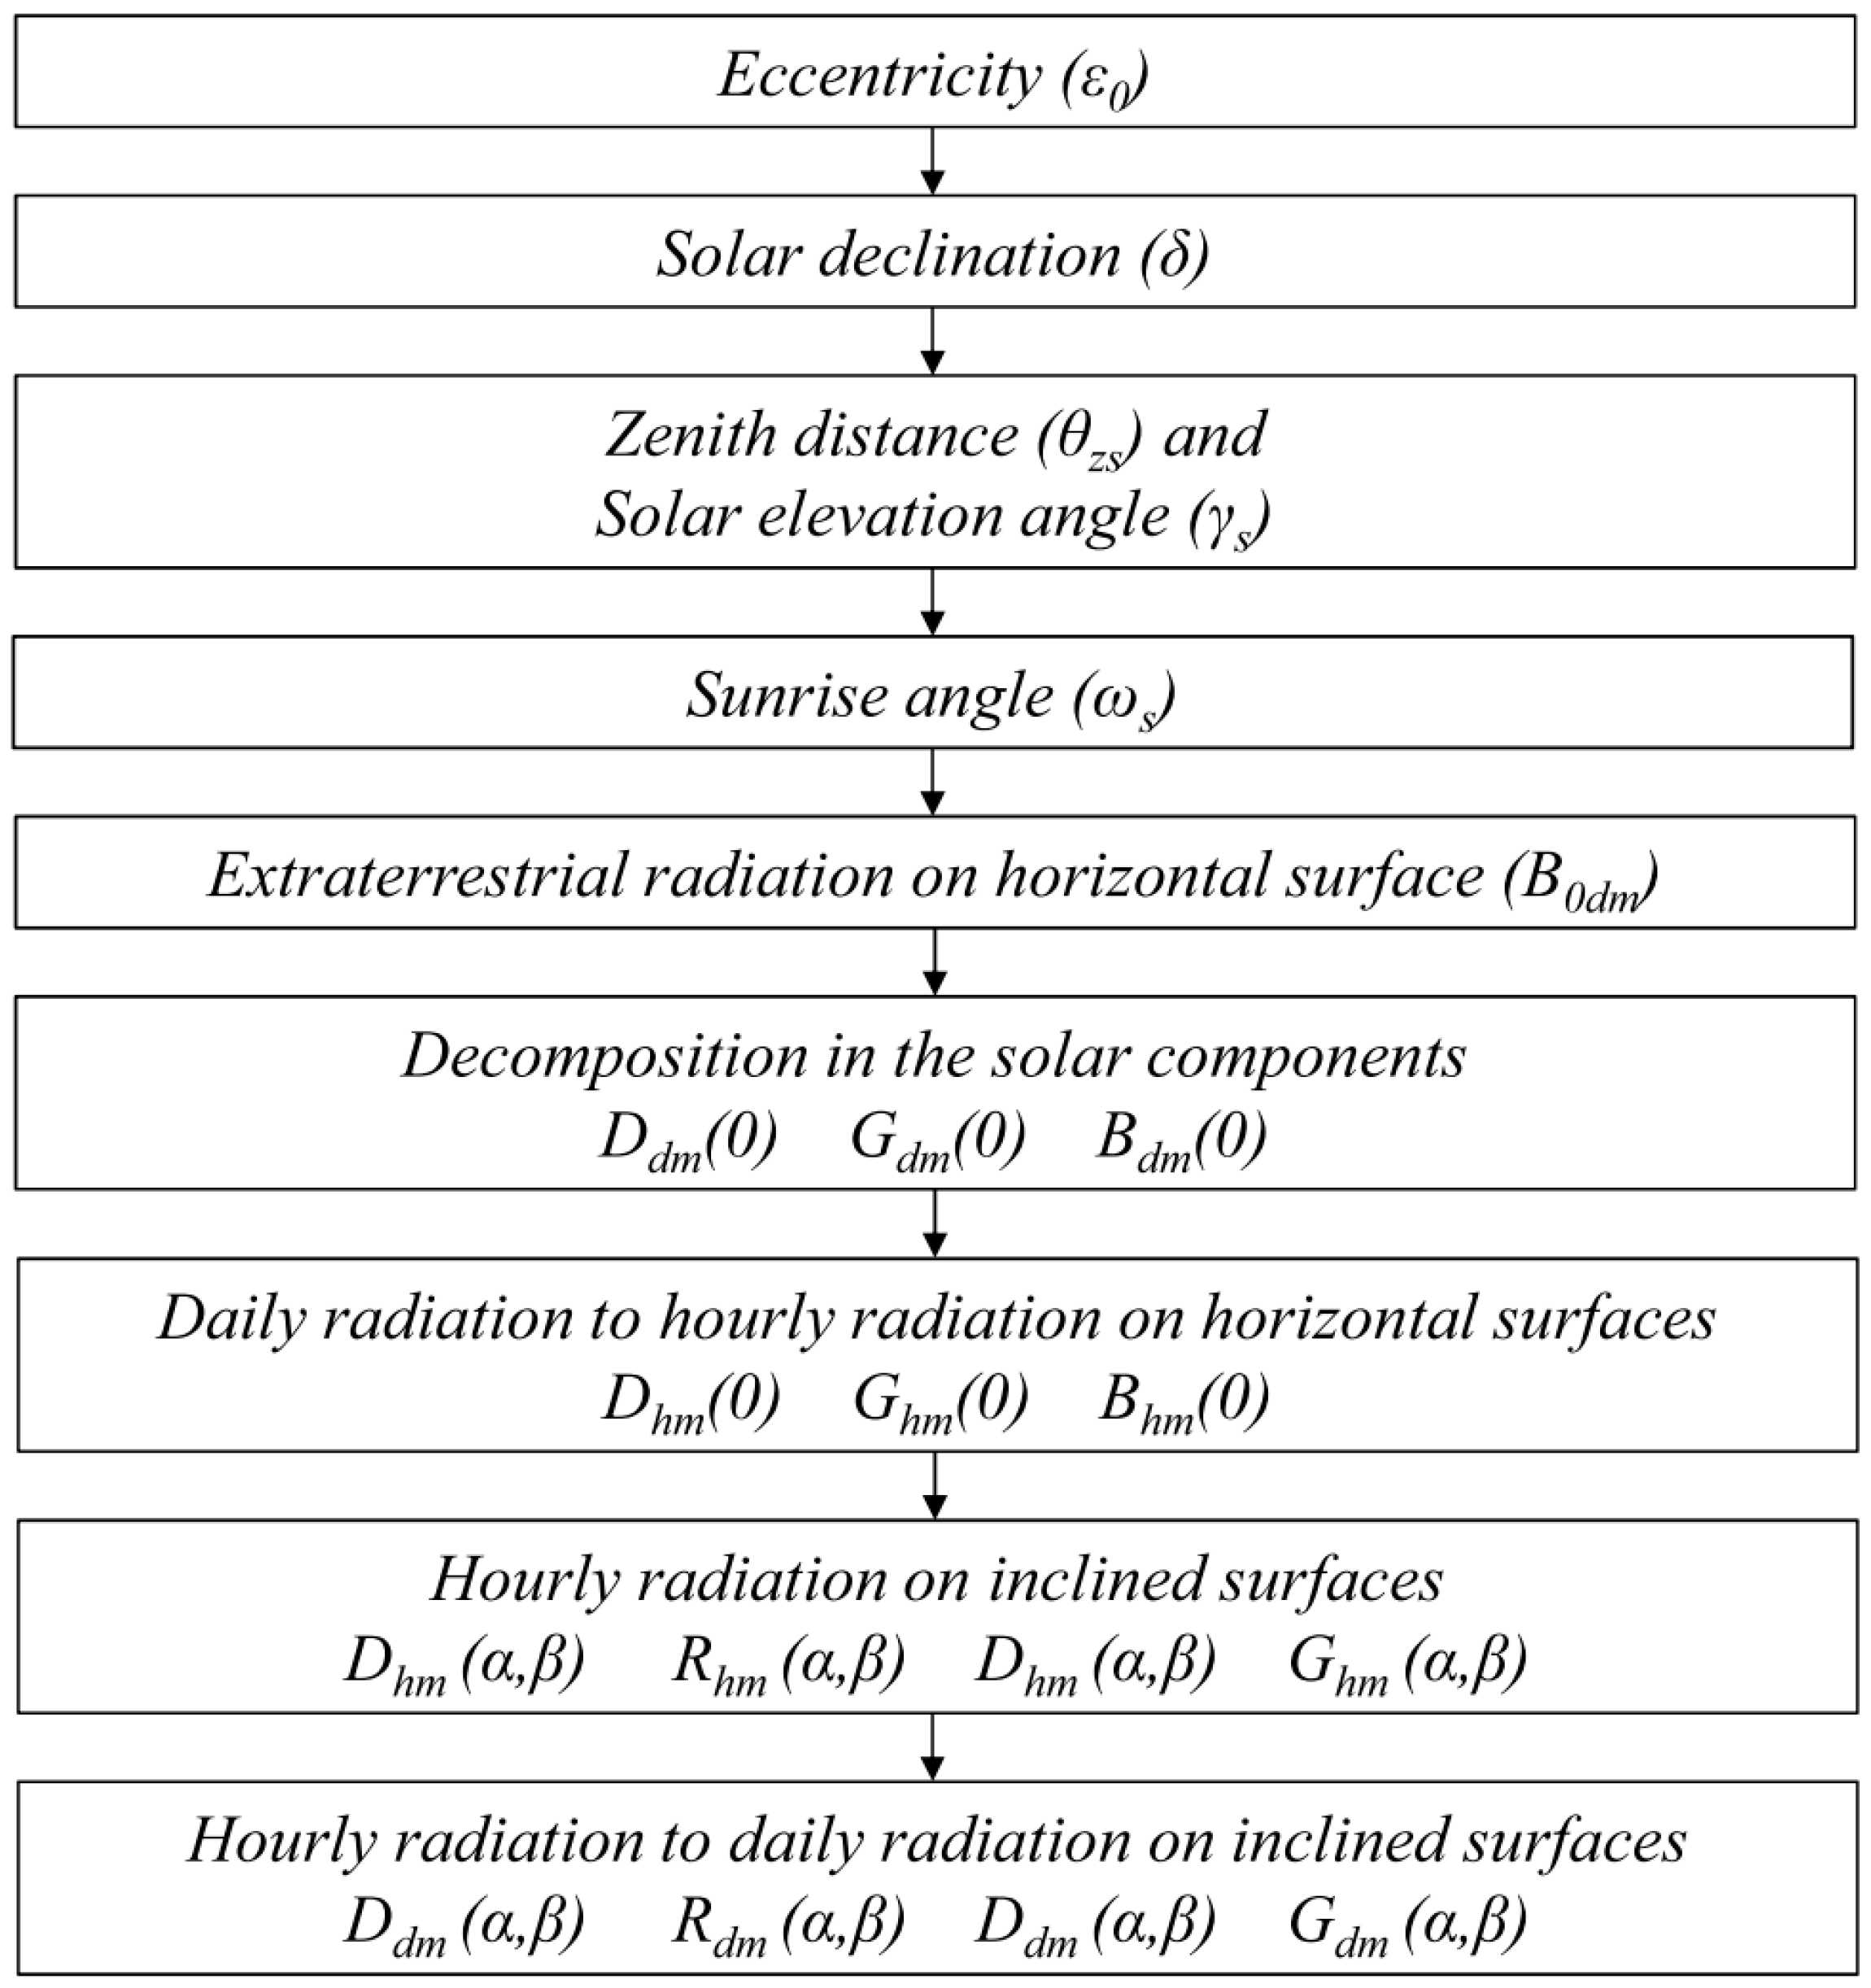
The development of these calculations becomes a complex task, because the mathematical process is quite tedious. The general calculation procedure is shown in
Figure 2.
The procedure starts from a value of global radiation on the horizontal plane for the latitude of the place where the installation is desired and the software developed applies this procedure for different orientations and inclinations as well as any day of the year.
Table 3 shows the mathematical expressions used to implement the procedure.
In this paper, we present OrientSol 3.0, a complete and updated application [
5] in which the user, through the virtual laboratory, can know beforehand the design of the photovoltaic system, as well as all necessary information about the available solar resource at the location of the photovoltaic installation. In next section, the software is presented and the main features of the programme and its usefulness are briefly described.
3. Virtual Laboratory Developed (OrientSol 3.0)
OrientSol 3.0 is a software package that is able to perform the study of the orientation and optimum inclination of the modules that integrate a photovoltaic system and it allows the user to calculate the generated energy for different inclinations. In this way, it gives the user an accurate idea of the design, making possible the estimation of electric power generation for each configuration, taking into account certain parameters.
This software has been developed under the MATLAB® (Natick, MA, USA) environment. MATLAB is a programming tool capable of implementing numerical calculations with vectors and matrices, representing, with great quality, the data in graphs. In addition, it allows the implementation of algorithms as well as the creation of interactive graphical user interfaces for the management of information.
OrientSol 3.0 has two different parts. On the one hand, there is a theoretical module, which contains some basic notions about the solar resource and on the other hand, the module where calculations and representations of results are made.
It has a database of solar radiation of 114 cities worldwide in both hemispheres. In addition, it offers the possibility to include new locations manually by entering some input data (latitude and daily global radiations per month in the horizontal plane).
In order to achieve maximum energy harvested, in OrientSol 3.0, different scenarios for the receiving surface are proposed: fixed inclined surfaces and one or two-axis tracking. With respect to the fixed tilt, the optimum inclination at which the modules are arranged is calculated to maximize the incident radiation, either for the whole year or according to the seasons. On the other hand, there are four types of solar tracking allowed: polar axis tracking, azimuth axis tracking, horizontal axis tracking, and two-axis tracking. These positions are the most typical of the modules for the optimum situation of a photovoltaic system. In addition, all types of studies can be compared to verify the differences among them.
Table 4 shows the mathematical expressions to implement these studies, according to the orientation and inclination.
Furthermore, it is possible to select a value for reflectivity coefficient (ρ) for the calculation of albedo radiation, depending on the surface where the photovoltaic modules are installed [
23,
24,
25]. In this way, it is possible to adapt to the needs of each specific application. If this value is unknown, the software provides standard reference values that can be used.
In the case of the study of the fixed annual tilt, the software represents the values of radiation for different inclinations, from 0° up to 90° with an increase of 15°. The following table (
Table 5) shows some of these values as an example: Madrid (the capital city of Spain).
With data provided by the software it is possible to check the difference between solar radiation at different inclinations of the receiving surface. For the city of Madrid, it is observed that the annual average radiation on the horizontal plane is 4.50 kWh/m2/day, while for a 30° inclination is 4.95 kWh/m2/day. It is also evident that increasing the angle of inclination from the optimum value, decreases the value of incident solar radiation, obtaining only 3.04 kWh/m2/day on the vertical plane.
Additionally, in this study, the selection of the tilt for which it is desired to know the value of the solar radiation can be done. This could be very useful for applications of building-integrated photovoltaic (BIPV). In this case, the angle of inclination is imposed in the building construction.
On the other hand, OrientSol 3.0 calculates the gains or losses that would be obtained among different position of the receiving surface. From the previous example, for Madrid, it is possible to observe the difference between the placements of the modules in a horizontal position or for the optimal angle, in this case is 29°. With this configuration the system would obtain 17.99% annual average gain, reaching 40% in some months. So, it would point out the convenience in each case of the most suitable configuration.
Another interesting utility of the software is the possibility of exporting the results to a spreadsheet, specifically to Microsoft’s commercial programme, Microsoft Excel. It exports all of the results calculated, not only those graphically represented. In addition, it is possible to generate a report in PDF format. This report contains the main results according to the study carried out, perfectly organized, and with all of the necessary information.
Finally, another interesting aspect of the application can be highlighted: the implementation of an energy calculation method, taking into account the radiation obtained for different studies. The energy calculation method implemented is Osterwald’s method [
26]. This is one of the methods widely used for its simplicity and its utility in the analysis of the behaviour of a real system [
27]. For that purpose the average monthly temperatures values for each of the locations are incorporated. Additionally, it is a meteorological parameter of large relevance in the design of a photovoltaic system.
In summary,
Table 6 shows the main characteristics of the developed application. It includes the geographical area that is available in the database implemented, the studies that it is able to carry out, the possible format to export the values, and the additional calculations it performs.
Currently, this application is being used in various university subjects taught at the University of Jaén because it is a useful tool for the comprehension of certain parameters related to the solar resource. OrientSol 3.0 is being used in a degree program in industrial electronic engineering and the Master’s degree in renewable energies.
One of the main objectives is that this software is easily distributed, guaranteeing free access. For this reason, it is currently possible to request a copy at the email address: orientsol@ujaen.es.
In next section, two case studies in two Spanish cities are presented. Using this software different comparisons are made to quantitatively evaluate the amount of generated energy depending on the position of the photovoltaic modules.
4. Case Studies of Two Spanish Cities
To carry out this study, the cities of Barcelona and Jaén have been selected. Barcelona is a city located in the northeast of Spain, at a latitude of 41.39°, while Jaén is a city located to the south, with a latitude of 37.77°.
The calculations are performed for these two cities for a fixed annual tilt, keeping its optimal orientation, towards the south, of 0° (because both cities are located in the northern hemisphere).
The application calculates the energy generated in the locations cited for a photovoltaic installation composed of monocrystalline silicon modules with 3 kWp of peak power installed. The comparison is made with two configurations: a system with the modules in a horizontal position and an installation with a tilt fixed annually at the optimal angle. In this way, it can quantitatively verify the differences and the gains that could be obtained if it takes into account the optimal position of the photovoltaic modules.
In first place, the software obtains the values of monthly average global radiation for the selected city. The following tables show the radiation that would be obtained on the horizontal plane and for the optimal angle in Barcelona (
Table 7) and Jaén (
Table 8).
As it can be seen, the maximum radiation values are reached for an inclination of 0°, reaching 6.58 kWh/m2/day in July, while for the optimum angle it is 6.30 kWh/m2/day. In addition, in this position is where the minimums are located, reaching 1.68 kWh/m2/day for the month of December, compared to 2.57 kWh/m2/day for the optimum inclination. However, the calculation of the annual optimum inclination will be the one that maximizes the annual average. In this case, for the city of Barcelona, the radiation for the optimal angle (31°) is 4.56 kWh/m2/day, while on a horizontal plane is 4.12 kWh/m2/day. This represents an annual gain of 19.43%.
For the second case study, in Jaén the results are practically the same. The maximum and minimum values are also reached for the horizontal plane, with 7.18 kWh/m2/day and 2.10 kWh/m2/day in the months of June and December respectively. In contrast, 5.59 kWh/m2/day and 3.04 kWh/m2/day for optimal tilt, which in this case is 29°. Finally, the average annual global solar radiation is 5.11 kWh/m2/day for the optimum angle and 4.68 kWh/m2/day for a horizontal surface, representing annual gains of 16.12%.
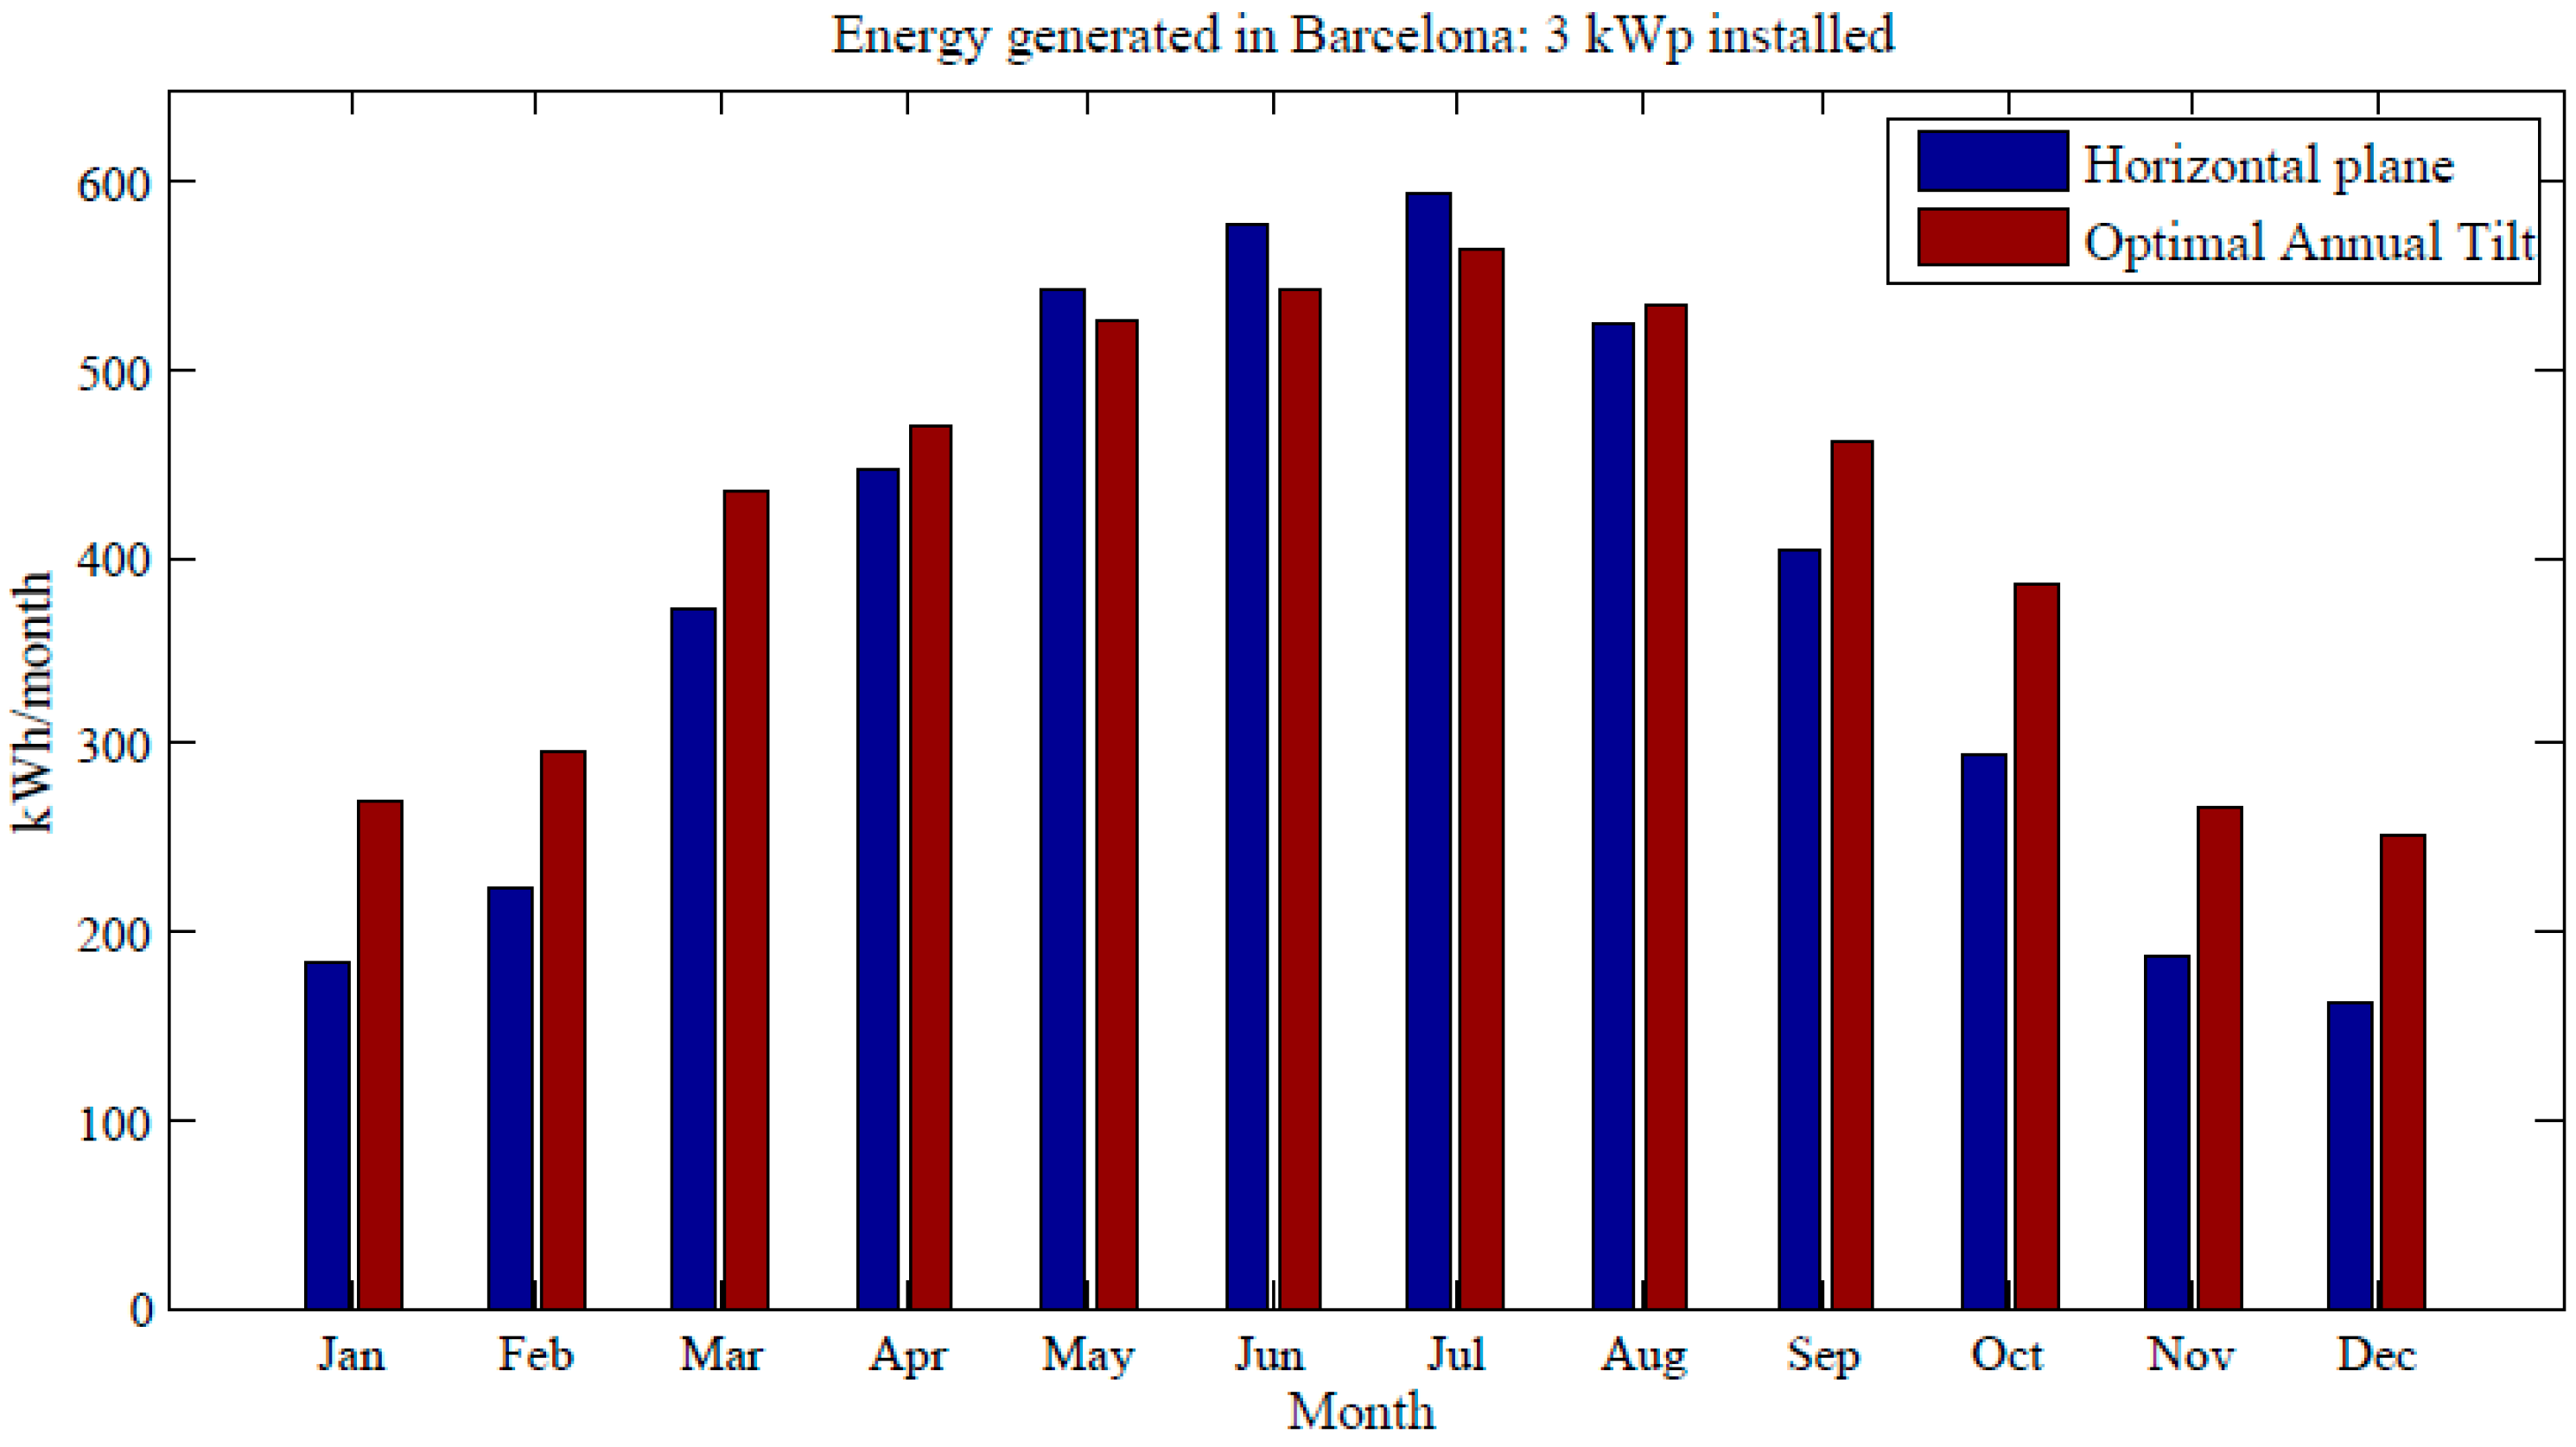
Once the optimal configuration of the photovoltaic modules and the available radiation in this position has been calculated, the energy that could be generate by a given system can be calculated. As mentioned above, the energy is calculated by the program using the Osterwald’s method. For a photovoltaic system with an installed peak power of 3 kWp in Barcelona, the following monthly values would be obtained (
Figure 3).
As shown, the energy generated is higher in the summer months than in winter, being proportional to the radiation. In the central months of the year, the generated energy is greater for a system with modules in horizontal position than for the optimum angle, reaching 542.91 kWh, 578.96 kWh, and 595.33 kWh, in the months of May, June, and July, respectively. While for the optimum inclination to be obtained 526.20 kWh, 541.41 kWh, and 565.26 kWh. However, with optimal inclination 5004.02 kWh can be obtained annually as opposed to 4518.19 kWh on a horizontal plane, which represent a gain of 485.83 kW per year.
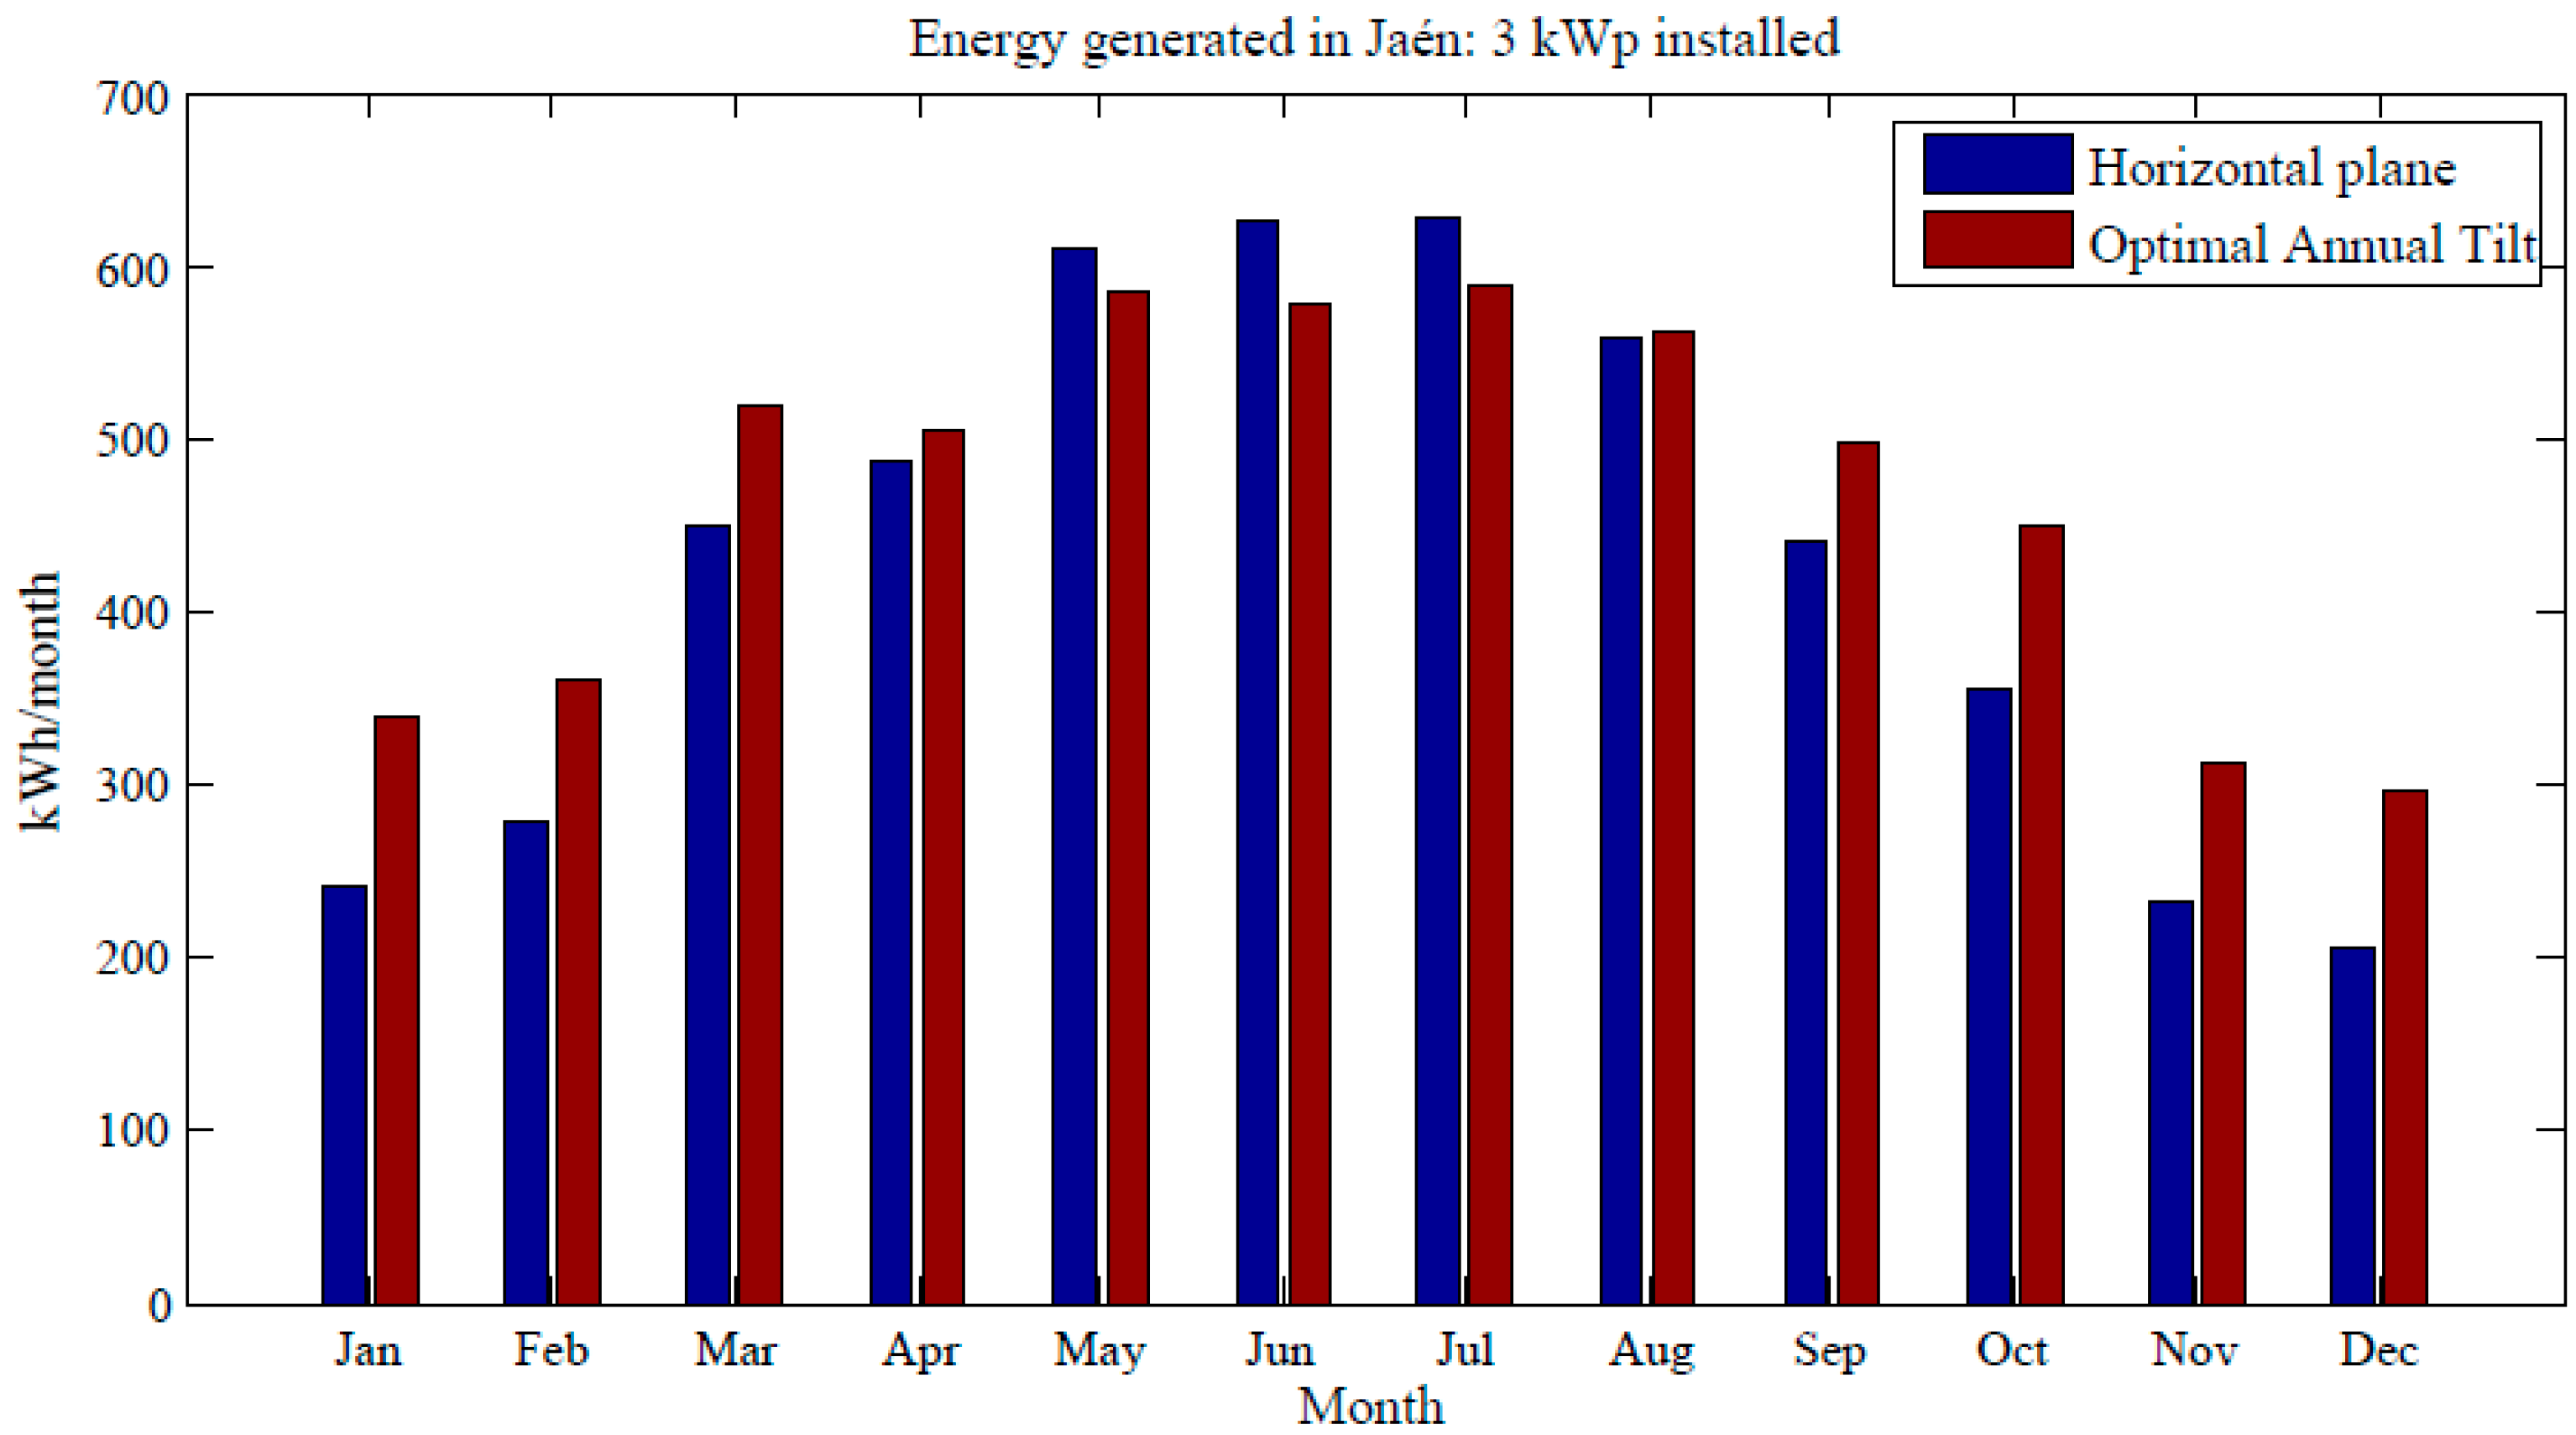
The energy generated in the other case study, Jaén, is represented in
Figure 4.
In this case the situation is quite similar; it has the same behaviour. In Jaén, an installation composed of photovoltaic modules in the horizontal position would generate in 610.47 kWh, 626.30 kWh, and 627.91 kWh in May, June, and July, respectively. However, the total amount of energy generated annually is 5111.34 kWh. On the other hand, taking into account the optimum inclination can be obtained 5592.23 kWh per year, reaching 584.48 kWh, 578.30, and 588.79 kWh in the months of May, June, and July. Therefore, the gains would be 480.89 kWh per year.
5. Results and Discussion
In this section, the results obtained are discussed, comparing the two previous case studies. The following table (
Table 9) shows the monthly energy values for the two cities, including the annual sum, as well as the latitude of their location and the estimated optimal angle.
In first place, it can be verified the influence of latitude at the optimum tilt angle. For Jaén, at a latitude of 37.77° the optimum tilt angle, which allows the collection of the maximum annual energy, is 29°. However, for Barcelona, at a latitude of 41.38°, the optimum angle is 31°. As it can be appreciated, the greater the latitude, the greater the angle.
Moreover, it can be observed how the energy that could be obtained in a photovoltaic installation located at Barcelona is less than could that one that be obtained in Jaén for a system with the same installed power. In Barcelona, 4518.19 kWh and 5004.02 kWh could be obtained annually with a system consisting of modules placed horizontally and positioned to the optimal tilt, respectively. In Jaén the results would be 5111.34 kWh and 5592.23 kWh. This is due to the greater amount of radiation in the city located in the south of Spain. As mentioned in previous sections, the energy generated by a system is directly proportional to the energy reached at the system.
In general, in the period of the central months of the year (May, June, and July) more energy is produced from a system placed in a horizontal position than for the optimum angle. While in the rest of months the energy production takes into account that the optimum angle is greater than for a horizontal system. This occurs in the same way in the two locations, since both are found in the northern hemisphere. All of this is due to the position of the Earth relative to the Sun, taking into account the relative movement between them and the variability of the inclination of the rays of the Sun throughout the year.
This study seeks to maximize the annual energy of the system, and in this case, the annual sum corresponding to the optimum angle for Barcelona is 5004.02 kWh. This represents a gain of 10.75% with respect to a system with modules in a horizontal position. On the other hand, for Jaén, 5592.23 kWh are obtained annually for a surface at the optimum angle. This would correspond to 9.41% more than a system with horizontal modules. All of this supports the importance of previous studies in the design of solar photovoltaic systems.
6. Conclusions
As mentioned above, renewable energies have gained weight in the energy system, being a good alternative to conventional energy sources. On the other hand, photovoltaic solar energy is a renewable energy with great potential. Knowledge of the available solar resource in a particular location on surfaces in any position (inclination and orientation) is essential. In this way, the energy received in the most accurate way possible can be estimated in advance of the design of an installation. Depending on the position of the modules that integrate a photovoltaic system will depend, largely, on the energy generated by the system. In this sense, knowing the inclination and orientation of the modules is fundamental for an energy efficient configuration and should be taken into account for the design of photovoltaic systems.
If one seeks to maximize energy collection, it is necessary to know the best possible position of the modules to achieve it. In this paper, an application developed in MATLAB for the calculation of the optimum position of the photovoltaic system are presented. This application calculates the solar radiation for different positions of the photovoltaic modules, in both inclination and orientation. In this paper we have shown different examples of the results that can be obtained. In addition, examples are presented comparing the results obtained by commercial software, PVGIS. In order to prove the goodness of our developed software the monthly average global radiation in two Spanish cities, Madrid (Latitude: 40.42°) and Jaén (Latitude: 37.77°), are shown in the table (
Table 2) for optimal inclination obtained with PVGIS and with the software developed (OrientSol 3). The relative error among the results have been calculated. The results show that a relative error of no more than 5% is committed. This application also calculates the energy that could be produced according to its configuration. Applications of this type are very useful, given the great variability of the parameters and the complexity of the mathematical expressions that define it. On the other hand, the variability of the incident solar radiation on different inclinations in the different months of the year has become visible. In addition, the impact that it has in the generation of energy as well as the gains obtained. Gains of 10.75% and 9.41% would be produced in the two case studies (Barcelona and Jaén) if the optimum angle is taken into account.
However, for each particular case, it is necessary to consider other possible factors, such as the temporality in the use of an installation. In this case, the inclination would be more convenient to adjust for certain months of use. This is especially important in the design of self-consumption systems, in which it is necessary to adapt generation to consumption. Therefore, to study the arrangement of the photovoltaic system is essential to obtain an energy-efficient configuration and, thus, to plan the energy that is obtained from it.


 ,
, 


