Article

Rice Cultivation Methods and Their Sustainability Aspects: Organic and Conventional Rice Production in Industrialized Tropical Monsoon Asia with a Dual Cropping System

by
Hung-Chun Lin
1,* and
Yasuhiro Fukushima
2
1
Lehrstuhl für Ökologischen Landbau und Pflanzenbausysteme, Technische Universität München, Liesel-Beckmann-Straße 2, Freising 85354, Germany
2
Department of Chemical Engineering, Tohoku University, 6-6-07 Aramakiaza-Aoba, Aoba-Ku, Sendai 980-8579, Japan
*
Author to whom correspondence should be addressed.
Sustainability 2016, 8(6), 529; https://doi.org/10.3390/su8060529
Submission received: 21 October 2015 / Revised: 23 May 2016 / Accepted: 25 May 2016 / Published: 3 June 2016

Abstract

:
Options to tackle the sustainability challenges faced in the production of rice, including global and local environmental perspectives, need to be discussed. Here, the global warming potential, water consumption and cumulative energy demand were analyzed using a life-cycle assessment to highlight the sustainability aspects of rice production in Taiwan, where a mixed organic and conventional rice production with a dual cropping system is practiced. The results show that the conventional farming method practiced in Houbi district contributes less to global warming and annual water consumption and consumes less energy than the organic method practiced in Luoshan village on a grain weight basis. It is also more lucrative for farmers because of the higher rice yield. Considering the yield ratio based on the data from two districts, the regional characteristics are more responsible for these differences. Giving up dual cropping to avail water to other sectors by fallowing during the second cropping season is preferable from the GHG emission and productivity perspectives. However, because water shortages usually occur in the first cropping season, it is more realistic to fallow during the first cropping season when domestic and other industrial users have the higher priority. The results presented here can serve as the foundation for exploring the possibilities of options, such as new biorefinery technologies and water allocation policies, in relation to influences on GHG emissions and the national self-sufficiency of rice.

1. Introduction

Rice (Oryza sativa) is an important crop worldwide. In 2013, the total world production was 741 million tons, with 91% from Asia [1]. Many of the leading rice-producing countries are in tropical monsoon Asia, such as Thailand, Indonesia and India. Unlike Japan, where there is only one cropping season (CS) in a year [2], some of the countries in tropical monsoon Asia grow rice two or three times a year [3,4], owing to high temperatures, sufficient solar irradiation and abundant water. Taiwan is located on the Tropic of Cancer: the northern part of the island has a subtropical monsoon climate, while the southern part has a tropical monsoon climate. Similar to the other tropical monsoon countries, it is a suitable place for cultivating rice, and there are two CSs in a year.
The rice industry is also known to be a major source of greenhouse gas (GHG) emissions and a consumer of fresh water [5,6,7]. GHG emissions have been considered a cause of climate change [8], and fresh water is a natural resource that humans need for cooking, drinking and washing, as well as for industrial manufacturing. In tropical monsoon Asia, industrialization is increasing. The industrial demand for water competes with the agricultural demand, especially for rice because of the huge water consumption of rice paddies.
The dilemma between economic growth and protection of agricultural sectors caused by water resource scarcity has recently been apparent in Taiwan. To ensure that an adequate water supply exists for the industrial area where optoelectronics and semiconductor industries are concentrated, the government asked farmers to keep their farms fallow when water in the area is limited [9]. The other resource used widely in the rice industry is energy. Energy use itself may not directly affect the environment; however, the construction and operation of power plants, by means of local land use, influence biodiversity and degrade air quality. Considering energy therefore serves as a proxy for many environmental impacts other than global warming and water consumption.
The other challenge for the rice industry, as for other agricultural industries, is the ageing of farmers. In Taiwan, for example, the average age of farmers was 58.6 years in 2000 and 61.2 years in 2005 [10], while the average retirement age is 56.6 [11]. The average age of rice farmers is almost 70 [12]. This shows the reluctance of the Taiwanese working-age population to take up farming as a career. Tsai [13] pointed out that the lack of willingness is mainly due to the low and unstable income of farmers. This is a threat to the sustainability of agriculture and the food security of Taiwan, which is ~34% self-sufficient. However, the domestic sufficiency for rice was around 107% in Taiwan in 2011 [14]. Therefore, there is an opportunity for the industry to shift to added value, environmentally-friendly production methods that can attract young workers.
Organic agriculture has been considered as one of the potential ways to address these challenges. It may reduce the energy consumption and environmental impacts, such as GHG emissions [15,16,17,18]. Organic products also tend to command higher prices than conventional ones. In addition, there are policies in Taiwan to subsidize organic farmers [19]. However, it is not yet clear to what extent the higher cost of organic rice farming will lead to environmental and economic sustainability or whether it is able to provide a sufficient amount of rice to consumers. The introduction of new technologies or production systems in combination with rice production may be other options that can attract young generations. The production of biofuels, or the rotation of the farm with other crops, such as sugarcane, or microalgae for the production of high added-value chemicals may be candidates. In considering such options, benchmark information for current rice production practices on economic and environmental aspects is necessary.
Here, the environmental and economic aspects of organic and conventional rice production in tropical monsoon Asia with a dual cropping system are assessed based on case studies in Taiwan. No judgement is made about whether organic or conventional rice production is better, because assessing only some of the impacts might not reflect the overall sustainability of the systems [20]. Instead, the reasons for the differences exhibited by these two farming methods are discussed via life-cycle assessment (LCA) and the interviews conducted.

2. Materials and Methods

2.1. Study Area

The assessment of conventional rice production was based on farms in Houbi District, Tainan City, in southwestern Taiwan, with 3500 hectares of rice paddies. Houbi is known as one of the largest granaries in Taiwan [21]. The organic farms assessed in this study were located in Luoshan, Fuli Township, Hualien County, eastern Taiwan. We chose different regions for our assessment because 65% of the organic rice paddies are in eastern Taiwan (38% located in Hualien County), but only 13% of the organic rice paddies are in southern Taiwan (0.9% located in Tainan City) [22]; the organic rice farms in eastern Taiwan would be more representative of the organic rice industry in Taiwan. The reasons for this distribution may be, for example, the policy of the region and the willingness of the farmers [23,24].
The organic and conventional farms were in different regions of Taiwan, but share many characteristics. The latitude of the two locations was similar. In addition, both of the soils in Houbi and Luoshan have mostly a loamy texture [25,26]. The quality of the rice from these regions is regarded as very high in Taiwan [27,28]. Further information to characterize the farms in Houbi and Luoshan is shown in Table 1.

2.2. Methods and Data

The environmental impacts of the conventional and organic rice produced in a dual cropping system were studied using LCA, a method that has been applied widely in the agricultural field. Meisterling et al. [17] used LCA case studies to discuss decisions to reduce GHGs from organic and conventional wheat. Brentrup et al. [29] reported how to adapt the LCA methodology to assess agricultural systems. Fukushima and Chen [30] assessed GHG emissions from sugarcane farming in Taiwan. Roy et al. [31] reviewed LCA studies on different food products. According to ISO 14040 (ISO 2006), there are four main stages in LCA: (1) goal and scope definition; (2) inventory analysis; (3) impact assessment; and (4) interpretation. There were two system boundaries: rice cultivation included only on-farm activities, while rice production also included the post-harvest processes (milling and refinery). The results were discussed on both an area basis (per fen) and a dried mass basis (per kg-dry grain and per kg-dried rice).

2.2.1. Goal and Scope Definition

The scope of the study (Figure 1) includes the agricultural processes (i.e., ploughing, watering, seedling transplanting, farm management activities, such as fertilizing and pesticide spraying, and harvesting) and post-harvest processes (i.e., drying and refining). The farm management activities were not shown as an individual process, but were included in cultivation (C) boxes. I boxes show the inputs of the system. P boxes represent the processes involved. B, C, A and R boxes represent the status of the paddies, where B means before cultivation, C means cultivation, A means after cultivation and R means with residues (rice straw) as green manure. Transportation of fertilizer, pesticide and machinery from stores or suppliers to farms was included, but the transportation of fertilizer and pesticide from factory to stores, grains from farms to mill factory and rice from mill factory to consumers was excluded from the scope of the study.
Fresh water consumption (m3), cumulative energy demand (energy consumption, MJ) and GHG emissions (kg-CO2 equiv.) were analyzed. Open burning of rice straw was one of the major sources of air pollution until the prohibition of open burning [36]; however, this is not the case any longer. Therefore, the impacts brought by open burning were not included in this study.
GHG emissions included the emissions of carbon dioxide (CO2), methane (CH4) and nitrous oxide (N2O). They were converted into CO2-equiv. using global warming potential (GWP) with a timeframe of 100 years, where the GWPs of CO2, CH4 and N2O were 1, 25 and 298, respectively [37]. Both the direct (e.g., from the burning of diesel and from rice paddies) and indirect emissions (e.g., from producing diesel, fertilizer and pesticide) were considered. However, GHG emissions from rice paddies (boxes B, C, A and R) include only CH4 and N2O. Miyata et al. [38] and Yao and Chen [39] found that when paddies are flooded, the CO2 fluxes are very low. Because during the cropping seasons, rice paddies are mostly flooded, Yao and Chen [39] suggested that it is not necessary to discuss the CO2 emission from soil when analyzing the CO2 fluxes of rice, but the photosynthesis and respiration. Gathorne-Hardy [40] also claimed that even though methanogenesis produces equal amounts of CO2 and CH4, from the climate perspective, it is the quantity of CH4 that reaches the atmosphere that matters. Regarding the CO2 fluxes from photosynthesis and respiration, we used the assumption that they are balanced when the crops are consumed and that the same quantity is released into the atmosphere [41,42], so CO2 was excluded from the calculation of GHG emissions from rice paddies.
Water consumption was calculated for boxes P1, C1, P5, C2 and I3 according to the farming activities [33,34]. Water used for the irrigation and production of seedlings (seed immersing, soil preparation and the growth of seedlings) was included.
The calculation of energy consumption considered both direct (energy used on the farm, e.g., diesel and electricity) and indirect (energy used outside of the farm, e.g., energy used in producing fertilizer and pesticide) energy input [43]. However, only fossil energy was considered in this study, but the inputs of solar radiation and labor were excluded [43], because the use of fossil energy becomes very insignificant in the total energy flow when solar energy is included [44], and human labor and fossil energy are too different to be expressed in the same units [45]. In our case studies, the conventional farms were located on the plains of southwestern Taiwan, but the organic farms were in eastern Taiwan and surrounded by mountains. In eastern Taiwan, there is no clear dry season [32]; therefore, the demand for the irrigation of farms should be less than that of farms in southwestern Taiwan, where the dry season occurs around November–April [32] and covers almost the entire first CS. The different geographic conditions may also result in different irrigation methods and distance of goods transportation. Nevertheless, the GHG emissions from rice paddies could also be influenced by the different locations because of their different temperatures and soil conditions [46].
To explore potentials for a lower GHG, more profitable and less water consuming transition to organic farming from conventional farming, a sensitivity analysis on yield scenarios was performed. Data for a virtual organic farm located in the same area as the conventional farms was developed. Namely, the distance of goods transportation, demand for irrigation water, irrigation method and subsequent energy consumption, GHG emissions and costs were assumed to be the same as those for conventional farms. The corresponding GHG emission factors from rice paddies to the new setting were also used; these emission factors are described in the following section. The yield of the virtual farm was assumed to take a range of yield (−10%–+30% of the yield of the organic farm in eastern Taiwan).
Another sensitivity analysis was performed to assess the consequences of leaving the rice fields fallow in each CS for conventional and organic farms, on GHG emission and water saving.

2.2.2. Life Cycle Inventory Analysis

Inventory data were collected from three sources: interviews (two conventional rice farmers, one organic rice farmer, one seedling farmer, one mill factory and one from the Farmers’ Association of Houbi District), the literature and databases. The data used and their sources are summarized in Table 2. The details of each data category are described in the following section. Of these, the power consumption of machinery, the type and amount of synthetic chemical and organic compounds used, seedling preparation and the drying and refining of rice grain were individual farm (P1–8 in Figure 1) or individual factory (P9) data, while the other data were regionally averaged. The interviewed farms, farmers and factory were recommended by the local farmers’ associations to represent the regional situation.

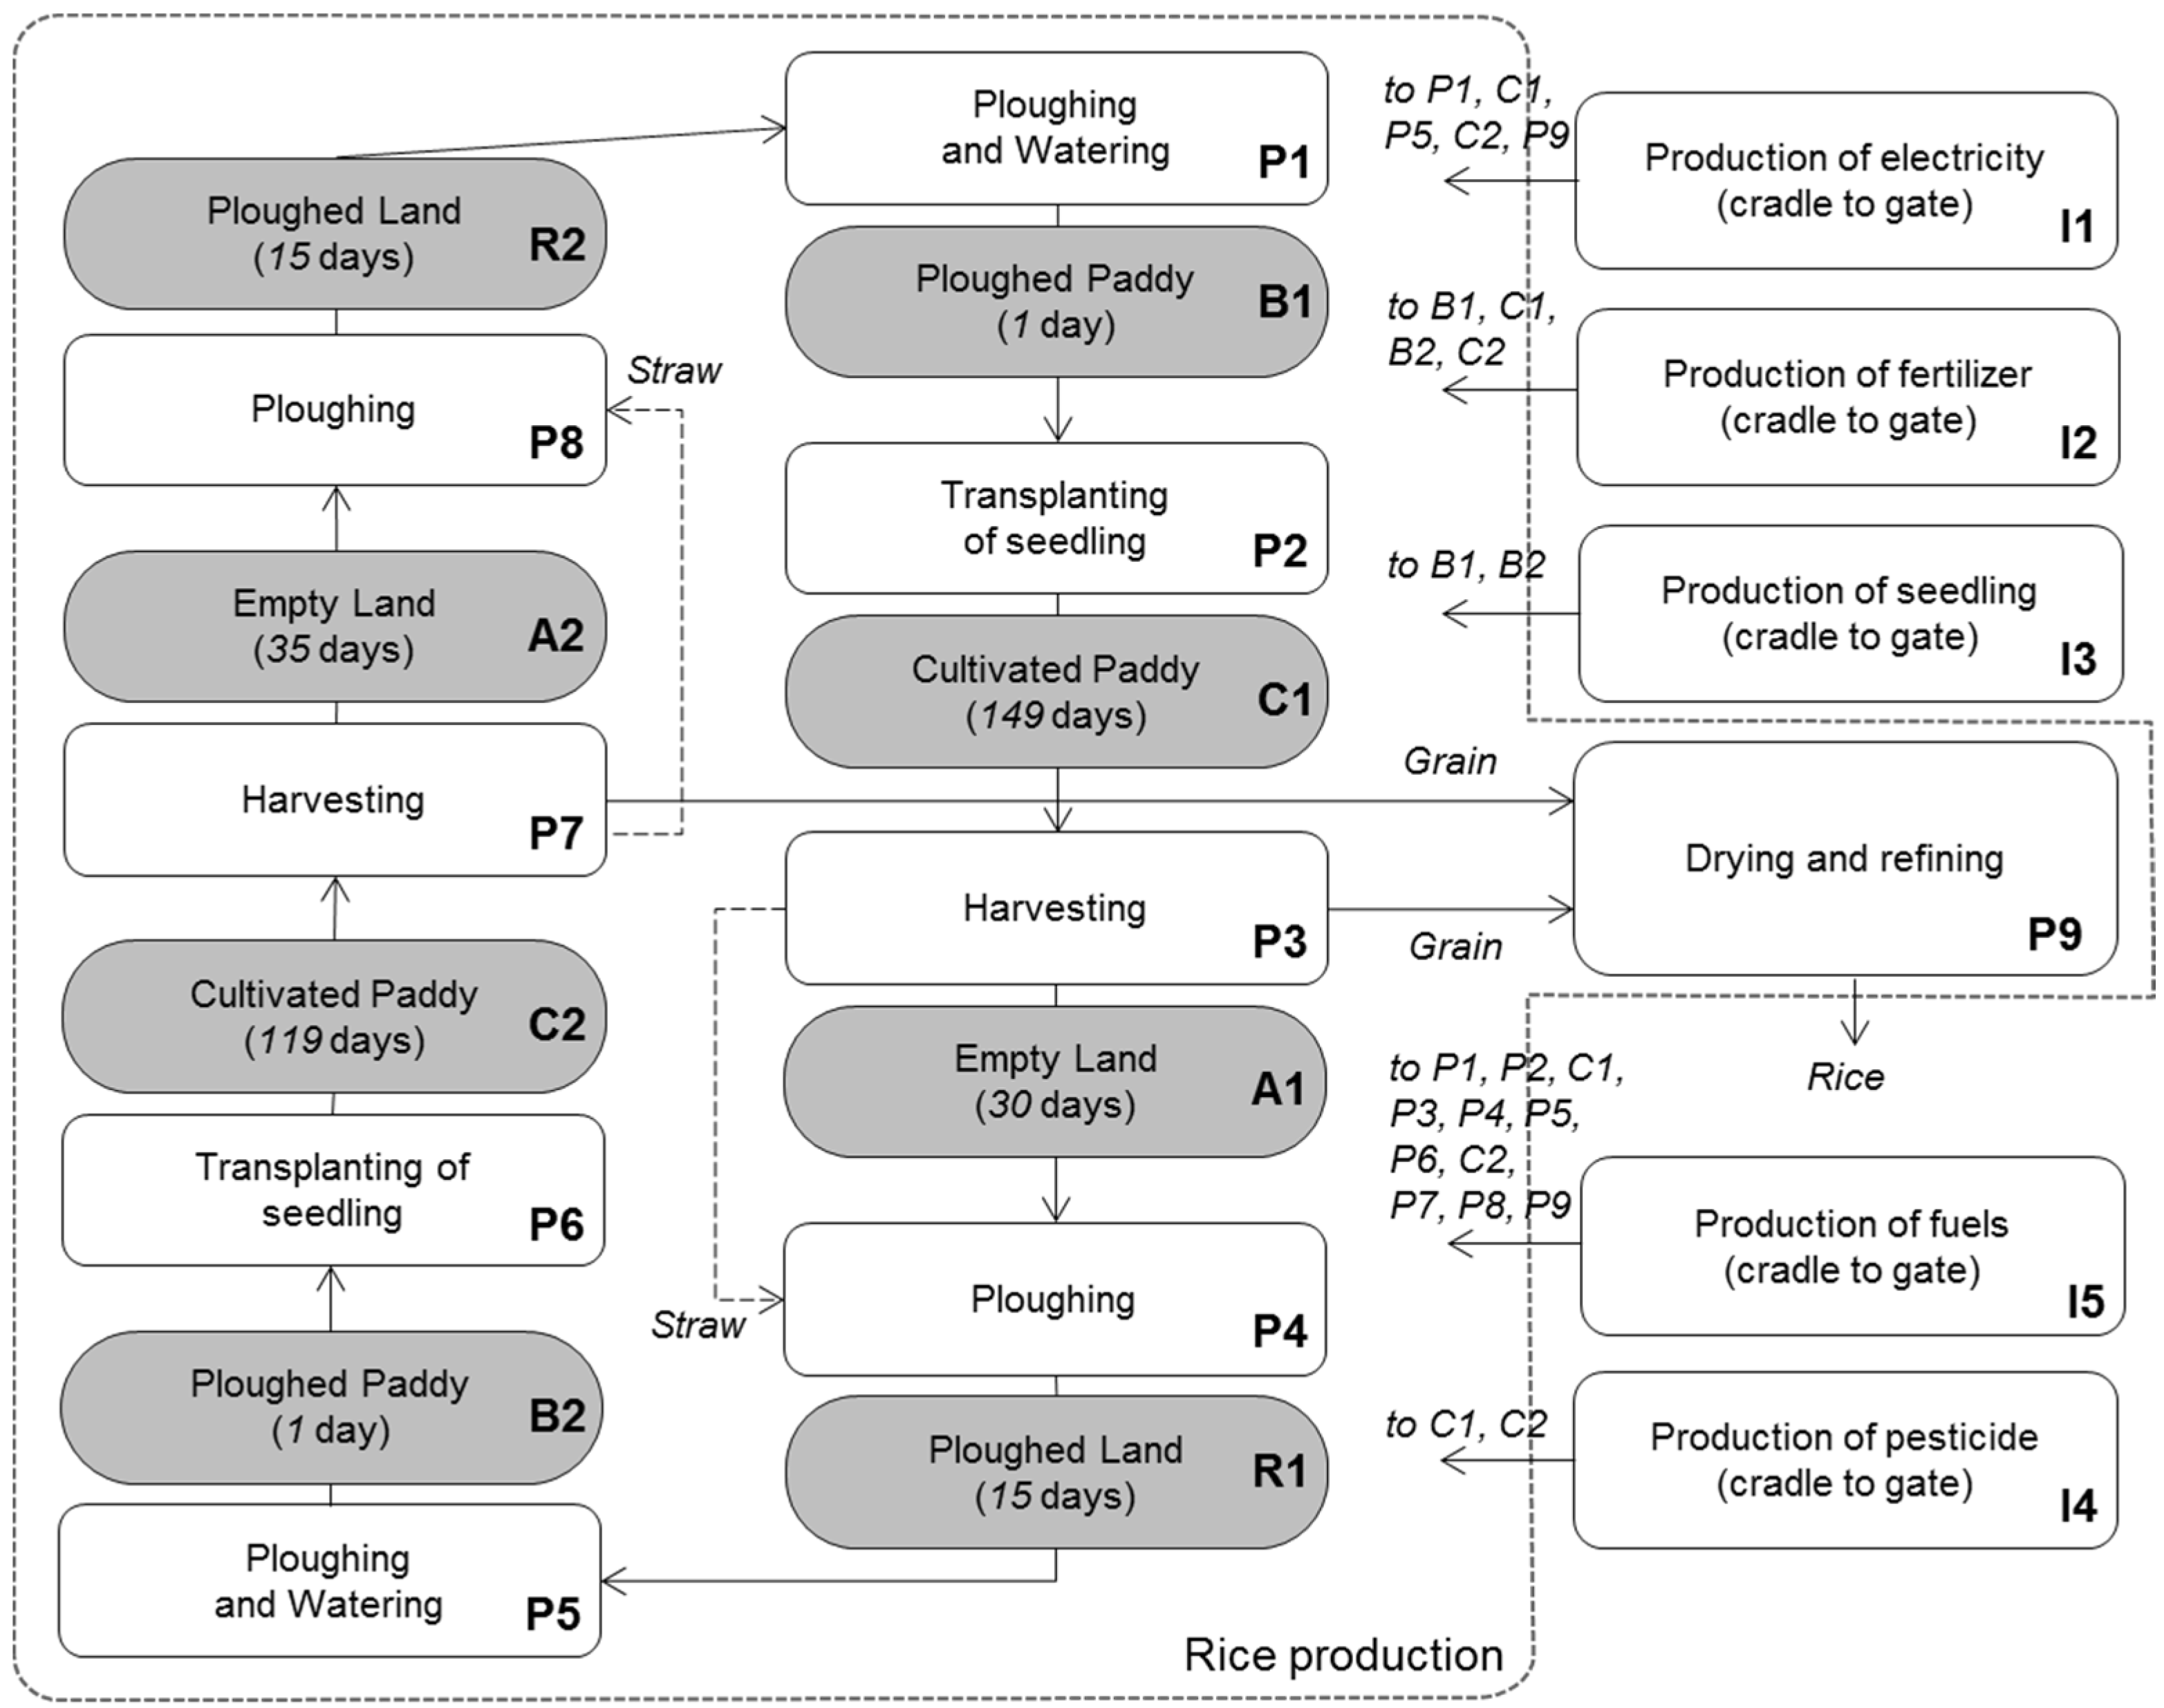
(1) Field Operations

Farm owners usually hire workers who own machines to conduct the farming activities, such as ploughing and harvesting, because they can pay wages for the intensive workload and avoid the investment cost of the machines. The inventory data needed for field operations included the type of agricultural machinery (Table 3), the efficiency of the engine (45% [53]), the distance between the suppliers of machinery and the farms (the distance traveled by truck, to transport agricultural machinery from the suppliers to the farms; 4 km and 8 km per working day in Houbi District and Luoshan Village, respectively), the time the machinery worked on the field (15 min·fen−1) and the times the truck was used in one CS.
The equation to calculate the direct energy consumption of the ploughing machine, transplanting machine, spraying machine and harvester can be expressed as:
E m a c h i n e = P × 0.736   k W × T × 3.6   M J ÷ E f f
where:
  • Emachine = direct energy consumption of using the machine (MJ·fen−1);
  • P = power of the machine (hp);
  • T = the time the machine worked on the field (h·fen−1);
  • Eff = efficiency of the engine of the machine (%).
The direct energy consumption of machinery was then multiplied by the cumulative energy demand from diesel production, becoming the indirect energy consumption of machinery.
The equation to calculate the energy consumption of the truck (direct + indirect) can be expressed as:
E t r u c k = E c u m × D × t × L ÷ S
where:
  • Etruck = energy consumption of the truck (MJ·fen−1);
  • Ecum = cumulative energy demand of using the truck (MJ·ton-km−1);
  • D = distance traveled of the truck (km·time−1);
  • t = times the truck was used in one CS (time);
  • L = load of the truck (ton);
  • S = size of the paddy on which the machines worked (fen).

(2) Chemicals and Organic Compounds

Fertilizers and pesticides are the chemicals and organic compounds used in the rice industry. Associated emissions and energy consumption (Table 4 and Table 5) were calculated based on their active ingredients. If the type of active ingredient was not in the database, another chemical or organic compound from the same class was used, as recommended in the literature [42]. The GHG emission and energy consumption were assumed to be zero for one of the organic pesticides, chili water, because the used chili was cultivated by the farmers themselves without using fertilizer and pesticide. Water consumption for diluting pesticide was calculated based on the instructions on the bottle.

(3) Seedlings

In Taiwan, machines are used to put together soil mixed with fertilizer, seeds and spraying pesticide to prepare the seedlings. The machine is 4 hp and is capable of dealing with 1500 boxes per hour [35]. Thirty boxes of seedlings (320 g·seed·box−1) are used per conventional fen paddy, and 25 boxes are used per organic fen paddy (220 g·seed·box−1). Pesticides were not used when preparing organic seedlings. Because the name of the organic fertilizer used in seedling preparation was unknown, Hao Le Te #2 compound organic fertilizer, which was used in CS by farmers, was assumed to be the one applied.

(4) Irrigation

Houbi farmers usually pump water into the rice paddy and pay 1000 New Taiwan Dollars (TWD) per fen per CS for electricity [33]. The energy consumption of irrigation could be calculated using the Taiwan Power Company’s price of electricity [59] (see the Appendix). Because electricity in Taiwan has summer (June–September, 2.1–6.71 TWD·kWh−1) and non-summer (October–May) prices (2.1–5.28 TWD·kWh−1), even though for both the first and second CS, farmers pay 1000 TWD, the actual electricity consumption in these two CSs was different. Both groundwater and water from reservoirs were used directly without any treatment, so no GHG emissions were considered to be associated with it. Farmers in Luoshan transport water from nearby rivers with irrigation ditches; therefore, no energy consumption or GHG emissions were associated with irrigation in this region. The amount of irrigation water was obtained from the database of the Water Resources Agency, Taiwan [60] (averaged from 2001–2009). Water from reservoirs, other sources of surface water and groundwater were included in the calculation of irrigation water [61]. This database recorded the irrigation water used in the whole area, but did not separate the amount used for organic and conventional farms.

(5) Rice Paddies

Paddy status was categorized into four periods: before cultivation (B), cultivation (C), after cultivation (A) and ploughed with rice straw (R). Numbers were added after the name of the period to distinguish between different CSs. For example, B1 and B2 represent the B period in the first CS and in the second CS, respectively. The relationship between those periods is shown in Figure 1. Because both B and C periods were flooded, B lasted for only one day and the difference caused by seedlings may be small, the GHG emission factors used for these two periods were the same. Because both periods A and R were dry, the factors used for GHG emissions were also the same. To adapt those numbers into this study, the length of the first CS was assumed to be 150 days, and the second CS was assumed to be 120 days according to the Taiwan Agriculture and Food Traceability System [54].
Emission factors of CH4 measured in southwestern Taiwan were used to calculate the emissions of conventional farms. The factors were determined by Huang et al. [62] based on measurements during the first and second CS (periods B and C) at 6 a.m. and 12 p.m. and were computed using the summation of CH4 emission in the different sampling stages of rice plants [62]. There was no data available for the A and R periods. Therefore, we used the factors determined during the first and second CS when they were left fallow (no rice cultivated) [62] and modified with the length of the period (see the footnotes of Table 6), because both the A and R periods and the fallowed B and C periods were not flooded with water. The measured N2O emission factors in southwestern Taiwan are also only available during the first and second CS [63], but not the A and R periods. The N2O emission rates were determined by Yang et al. [63] at a 0.5-h interval for 1.0 h by measuring the changes of N2O concentrations (the net change between N2O emission and sink) in the acrylic chamber. The emission factors for the A and R periods were from the measurement in western Taiwan [64] instead. This measurement was made during A2 and R2, but could represent the emission from A1 and R1, as well, because the soil nitrogen content is relatively low in all of these periods [65].
Qin et al. [66] measured the emission of CH4 and N2O of the organic and conventional rice paddy with intermittent irrigation per unit area during the whole rice-growing season in southeastern China. The ratios of CH4 and N2O emission of the organic to the conventional rice paddy were 1.23 and 0.34, respectively. These are the only published comparative data of CH4 and N2O emission on organic and conventional rice paddies up to date. These values were used to adjust the emission factors of CH4 and N2O emission in periods B and C of organic farms in Luoshan (see the footnotes of Table 6), because only measurements on conventional farms in eastern Taiwan [63,67] are available. Emission factors for periods A and R were taken from conventional farms in southwestern Taiwan, but also adjusted with the ratio of organic to conventional paddies [66] because of the lack of more appropriate data. For the virtual organic farm in Houbi, the emission factors of both CH4 and N2O were taken from conventional farms in Houbi, but were also adjusted with the ratio of organic to conventional paddies measured by Qin et al. [66], so they could represent the emission of organic farms in Houbi.
The CH4 emission factors of fallow seasons were only available for the conventional farms in southwestern Taiwan during the B and C periods [62]. Therefore, the ratio of CH4 emission of the organic to the conventional rice paddy derived from Qin et al. [66] was used to calculate the CH4 emission factors of the B and C periods in fallow seasons of organic farms in Houbi. The CH4 emission factors of the B and C periods in fallow seasons of organic farms in Luoshan were assumed to be the same as the one of organic farms in Houbi. The CH4 emission factors of the A and R period of the fallow season were assumed to be the same as the ones of the A and R period of the normal cropping season.
The N2O emission factors of fallow seasons were not available, so they are assumed to be the same as the ones of the A and R periods of the normal cropping season, because in these periods, the paddies were not flooded.
All of the emission factors are shown in Table 6.

(6) Drying and Refining

Interviews were conducted at a mill factory in Houbi that dealt with 6100 tons of grain per year. The cost of electricity in this factory was around 1,350,000 TWD per year [52]. The price of industrial electricity in Taiwan was around 2.52 TWD·kWh−1 [68]. In other words, around 535,714 kWh per year were consumed. Grains harvested in the first CS are dried during the plum rain season (May–June). Because of the humid weather, 48 hours to dry one batch of grains harvested in the first CS were needed, but only 36 h for the grains from the second CS, which were dried in a less humid season. The drying machine was 19.5 hp, and each batch was 20 tons of grain. The efficiency of the drying machine is assumed to be the same as the other agricultural machinery (45%). The residue to product ratio (RPR) of rice was 0.267 [69].
The equation used to calculate the energy consumption from diesel used by the drying machine can be expressed as:
E d r y i n g = P d r y i n g × 0.736   k W × T d r y i n g × 3.6   M J ÷ E f f ÷ G
where:
  • Edrying = direct energy consumption of the drying machine (MJ·fen−1);
  • Pdrying = power of the drying machine (hp);
  • Tdrying = the time that the drying process takes (h·batch−1);
  • Eff = efficiency of the engine of the drying machine (%);
  • G = amount of grain for 1 batch (kg·batch−1).

(7) Economic Aspects

The expenditure and income of rice farmers were taken from personal communications with farmers [33,34,70] and previous studies [59,71,72]. Data used for conventional and organic farms are shown in Table 7. The different costs of wages between conventional and organic farms may be a result of the different average wages and the accessibility of labor in the regions. Conventional seedling and organic seedling have the same price per box, but less seeds were used in one box of the organic farms [34,35]. In organic farming, the cost of chili water (which acts as pesticide) was zero because it was cultivated and prepared by the farmers. Because the chili water was spread by farmers themselves, no extra wages were needed. Some of the wages differed between conventional and organic farming. Possible reasons were that the labor cost was different between the interviewed areas (southwestern and eastern Taiwan) and the share price of machinery was different in conventional and organic farming because of the number of farmers working on it. The cost of fuel for operating machinery was included in the wages. The rice yields were 810, 585 and 420 kg·fen−1 for the first CS for conventional farms, the second CS for conventional farms and both CSs for organic farms, respectively (lower range values from the interviews; Table 1).

3. Results and Discussion

3.1. Sustainability Aspects

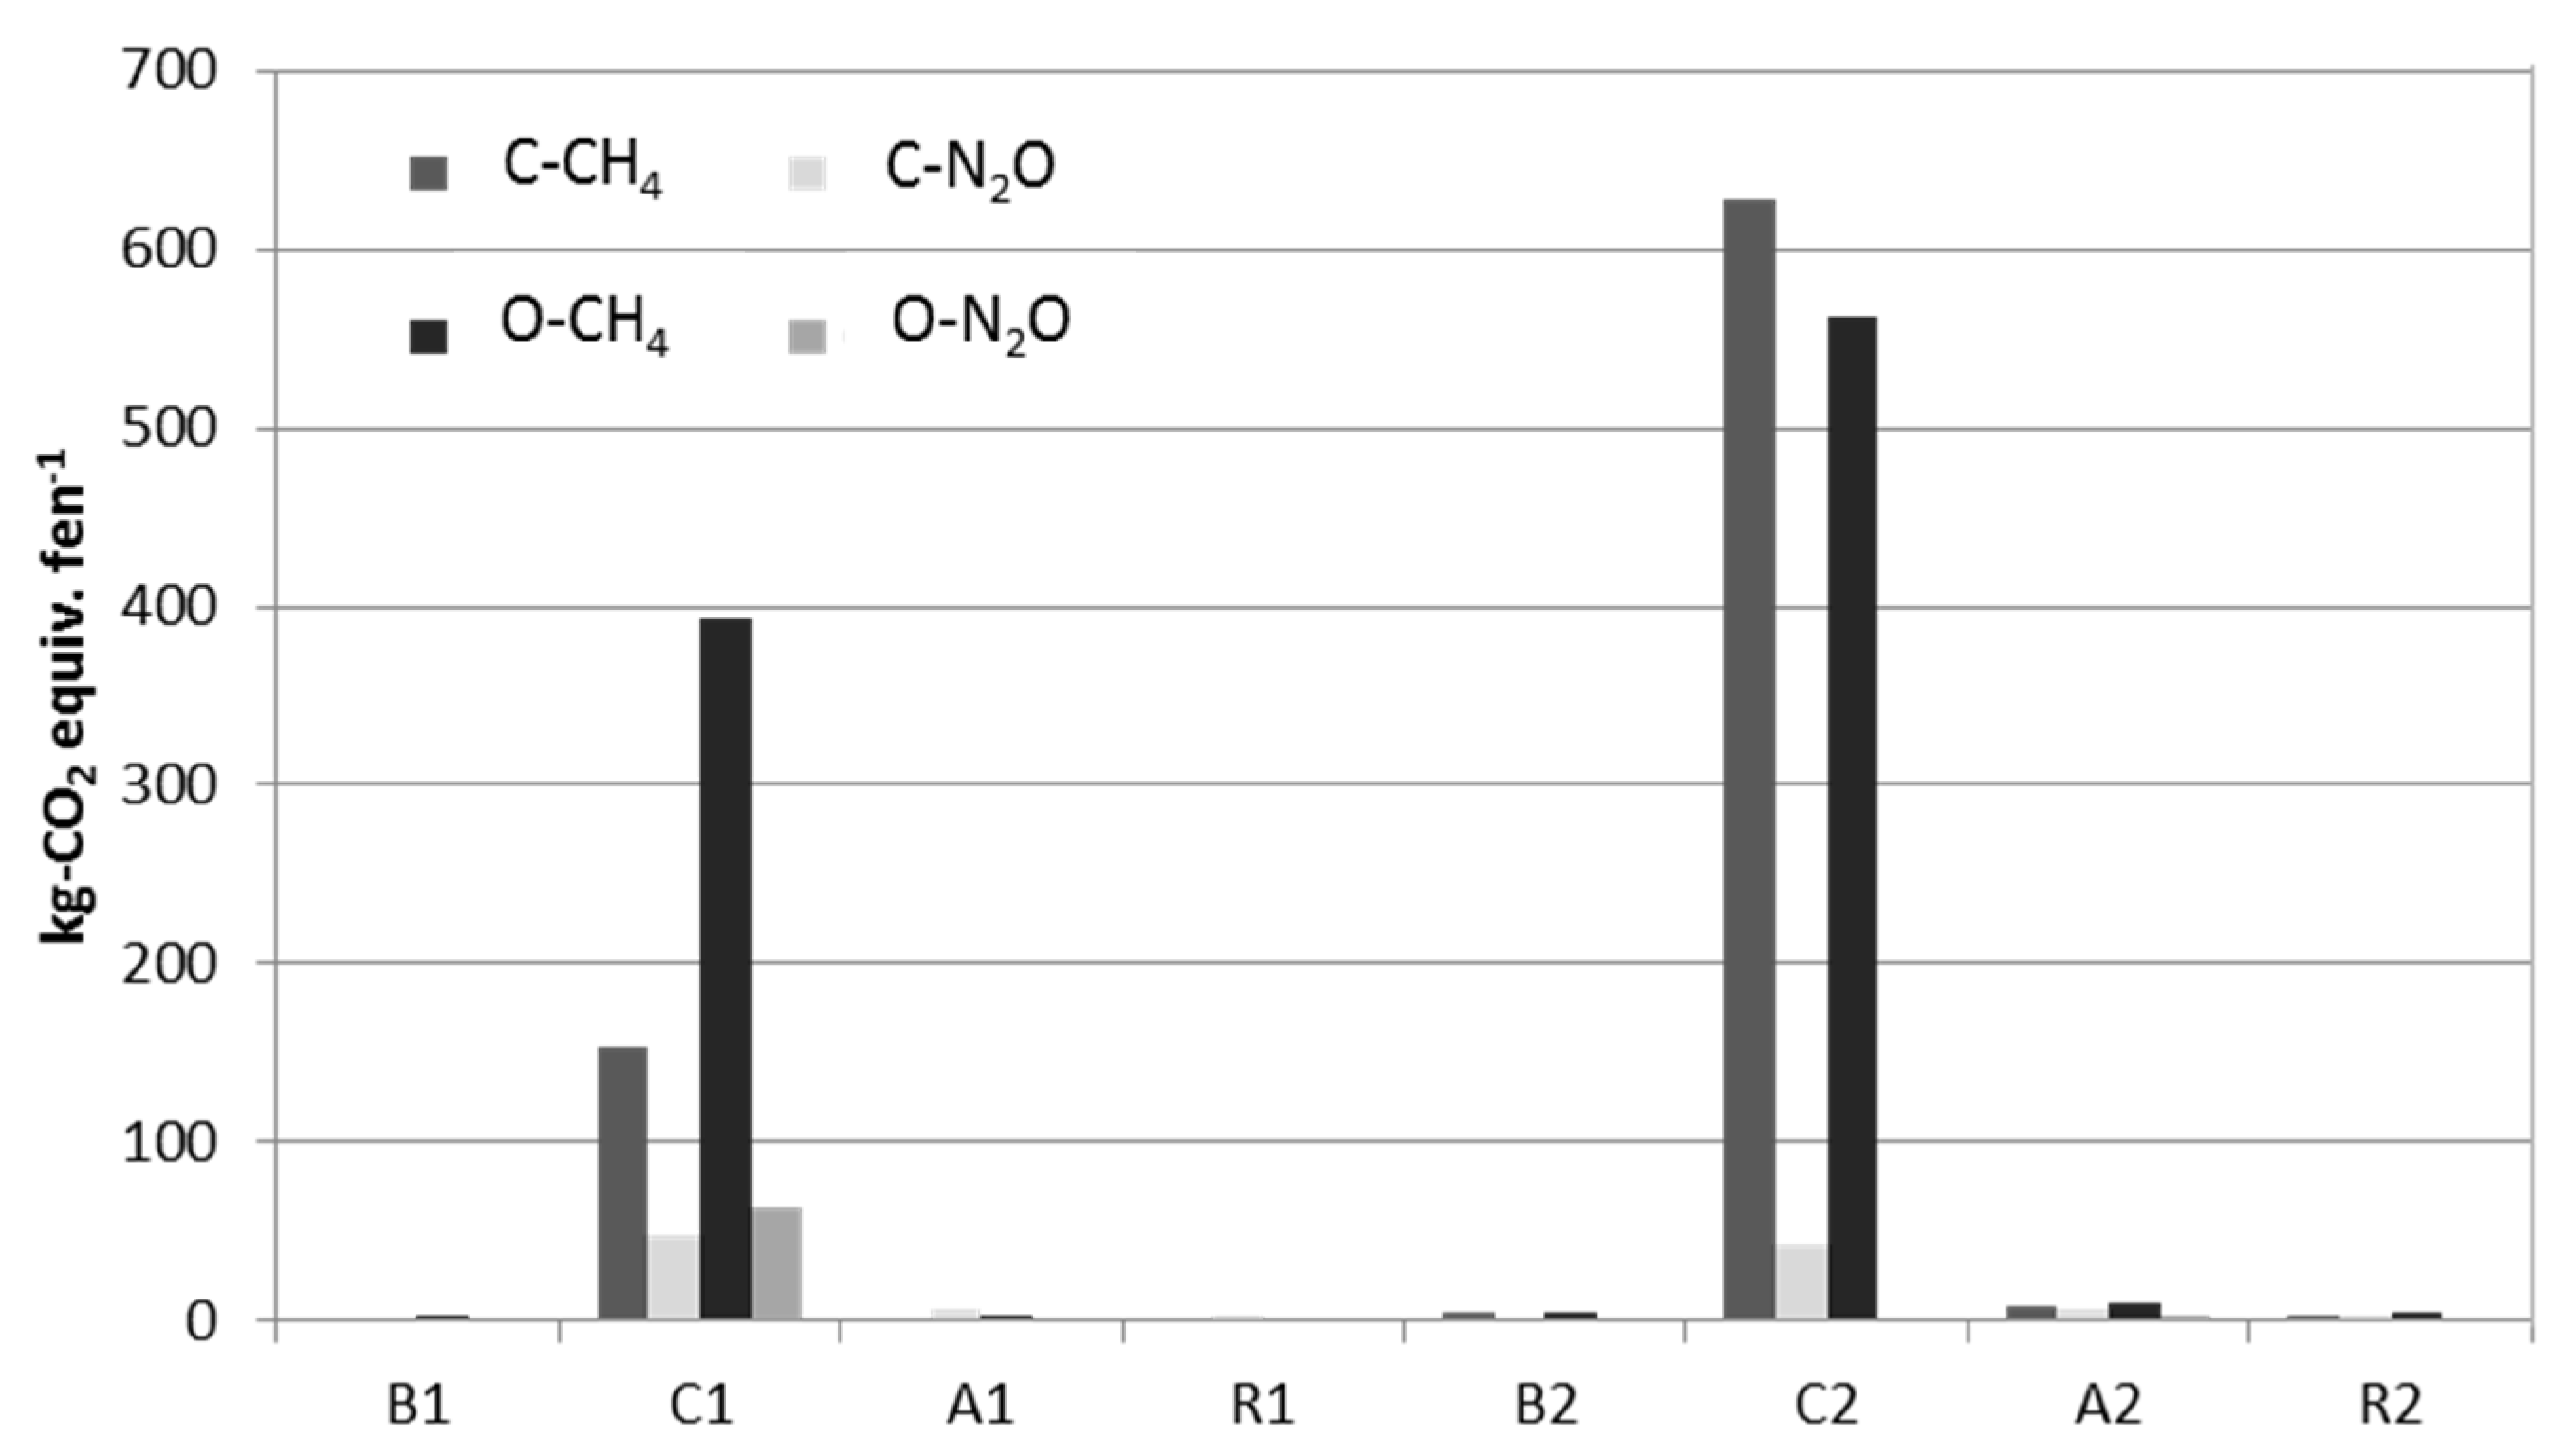
3.1.1. GHG Emissions

The GHG emissions of rice cultivation in the second CS were higher than in the first CS for both Houbi (conventional) and Luoshan (organic) farms (Table 8). The main difference between these two CSs was the emissions from the rice paddies. Yang et al. [63] reported that in Taiwan, CH4 emission in the second CS was higher than in the first CS because of high organic matter degradation with high temperature at the flooding, transplanting and active tilling stages in the second CS. Yang et al. [63] also claimed that N2O emission was higher in the first CS because of intermittent irrigation and high temperature at the later growth stage. The main contributors of GHG emissions in these two CSs were different: power generation caused most of the GHG emissions in the first CS, and rice paddies released most of the GHGs in the second CS. On an annual basis, rice paddies contributed the highest amount of GHG emissions, with CH4 having the strongest effect.
It is expected that organic farms have less GHG emissions by avoiding synthetic fertilizer and pesticide, but this was countered by the extra emissions from rice paddies. This may be due to: (1) the higher amount of organic matter from the organic fertilizers offered the predominant source of methanogenic substrates; and (2) the pesticide applied in conventional farms inhibited the activity of CH4-producing microorganisms as a side effect [66].
Dubey [73] listed some of the chemicals proved to inhibit CH4 production. Carbofuran, the chemical used in the study done by Qin et al. [66] (the literature we used as the reference for adjusting the CH4 emission from conventional farms to organic farms), was included on the list [73]. Therefore, it is possible that in a conventional farm that does not use this type of chemical, the CH4 emissions can be more. The adjusting factor (conventional to organic) may be overestimated for Houbi, because we did not find use of these chemicals. Therefore, the actual CH4 emission of organic farms in this study could be less. While a review done by Linquist et al. [74] showed that with the same N application rate, the CH4 emission is higher when organic fertilizer is used, Niggli et al. [75] stated that methane emissions of organic rice production equal those of conventional ones. Considering these findings from the literature, to understand the effect of less CH4 emission from the organic rice paddy on our results, we assumed different levels; 5%, 10%, 15% and 20% less than the reference value. The 20% less scenario equals the CH4 emission from the conventional rice paddy in eastern Taiwan.
We found that when the CH4 emission from the organic rice paddy decreased by every 5%, the overall yearly GHG emissions decreased by 4% accordingly. The overall yearly GHG emissions were 1204, 1155, 1106 and 1057 kg-CO2 equiv.·fen−1 when the CH4 emission from the organic rice paddy were 5%, 10%, 15% and 20% less, respectively. To draw a more solid conclusion on CH4 emission, further investigation (e.g., the measurement of the CH4 emission of organic rice farms in eastern Taiwan or studies about the different CH4 emission between the organic and the conventional rice paddy) is needed to see which emission scenario is closer to reality.
The difference in electricity-related emissions between organic and conventional farms was because of the different geographic conditions of the case farms: the conventional farms were located on plains, with no rivers or springs nearby, but the organic farms were surrounded by mountains, with good access to the river. Therefore, the conventional farms had extra electricity demands for pumping water into the paddies.
Figure 2 shows the GHG emissions from rice paddies under different farming methods and periods. For both conventional and organic farms, most of the GHGs were released in the C period because it was also the longest period. The CH4 emissions were lower in C1 than C2 because of the lower temperature and higher redox potential in C1 [76]. The N2O emission was higher in the first CS because of the higher temperature in its later growth stage [63].
The CH4 emission of the C period for conventional farms in Houbi and organic farms in Luoshan was calculated based on data reported by Huang et al. [62] and Peng et al. [67], respectively. Peng et al. [67] reported that CH4 emission becomes higher when the amount of N application is higher. However, during the first CS, the N application from Huang et al. [62] was higher (140 kg·N·ha−1·CS−1) than from Peng et al. (120 and 90 kg·N·ha−1 for the first and second CS, respectively). Therefore, we assumed that the difference was probably due to the different climate conditions, soil properties and the growth of rice.
In conventional farms, the GHG emissions per kg dry grain were 0.8, 1.9 and 1.3 kg-CO2·equiv., for the first CS, the second CS and annual production, respectively. The emission per kg dry grain in organic farms was higher than in conventional farms (1.3, 1.6 and 1.5 kg-CO2·equiv., for the first CS, the second CS and annual production, respectively) due to the lower grain yield. However, when the CH4 emission from organic rice paddy are 20% less, the GHG emissions per kg dry grain in organic farms in Luoshan are lower than those of conventional farms in Houbi (1.25 kg-CO2·equiv.). The GHG emissions per kg of rice were higher than those of per kg dry grain (Table 9) because grains need to go through the post-harvest processes to become rice (final product). These post-harvest processes (1) remove husks from the grain, so that the total weight of the rice is less than the total weight of grains, and (2) need energy to do the drying and refining and, hence, increase the total amount of GHG emission.

3.1.2. Water Consumption

Water consumption discussed in this study refers to the water from reservoirs, other sources of surface water and groundwater introduced to the production system. The water consumption of the second CS was lower than the first CS in both conventional and organic farms (Table 8). Of the total water consumption, most water was used for irrigation. Less irrigation water was demanded in the second CS because of the higher precipitation in the second CS [32]. However, because the average temperature and the rate of water evaporation in the bud greening period (July) in the second CS were higher, a greater amount of water was used for seedling preparation in the second CS.
Water consumption was 1.6, 1.8 and 1.6 m3·dry·grain−1 for conventional farms and 8.4, 7.8 and 8.1 m3·dry·grain−1 for organic farms, for the first CS, second CS and the annual consumption, respectively. There was no water used in the post-harvest process (P9). Organic rice from Luoshan required more water than conventional rice on the area and weight basis. However, this result was mainly due to the regional difference. The amount of irrigation water was obtained from the Water Resources Agency, Taiwan [60], which was the best source we found. Unfortunately, this database does not describe the methods they used to calculate the amount of irrigation water, so the reason for such a huge regional difference is unknown.

3.1.3. Energy Consumption

The differences in the regional conditions and farming methods resulted in varied major contributors in rice production. For conventional farms in Houbi, energy consumption was higher in the first CS (Table 8) because the electricity consumption for pumping irrigation water is higher. Among all of the categories, electricity for pumping irrigation water also contributed the most to energy consumption. On the other hand, for organic farms in Luoshan, the second CS consumed more energy than the first CS because of the application of organic pesticide (camellia meal) in the second CS.
The energy consumption per kg of conventional grain was 7.6, 9.5 and 8.4 MJ and per kg organic grain was 2.2, 2.4 and 2.3 MJ, for the first CS, the second CS and the annual consumption, respectively. The main reason for this huge difference is the use of electricity in the conventional farms in Houbi, which is a function of the geographic conditions of farms rather than the farming method itself.
Table 9 shows the energy consumption per kg of rice. The total energy consumption of drying and refining in the first CS was higher than in the second CS because of the more humid weather in the grain-drying period of the first CS.
We calculated the energy consumption of agricultural machinery and the drying machine with their maximum power. However, the most used power of the machines is normally not the maximum power. This means that the energy consumption of agricultural machinery and the drying machine reported in this study may be an overestimation.

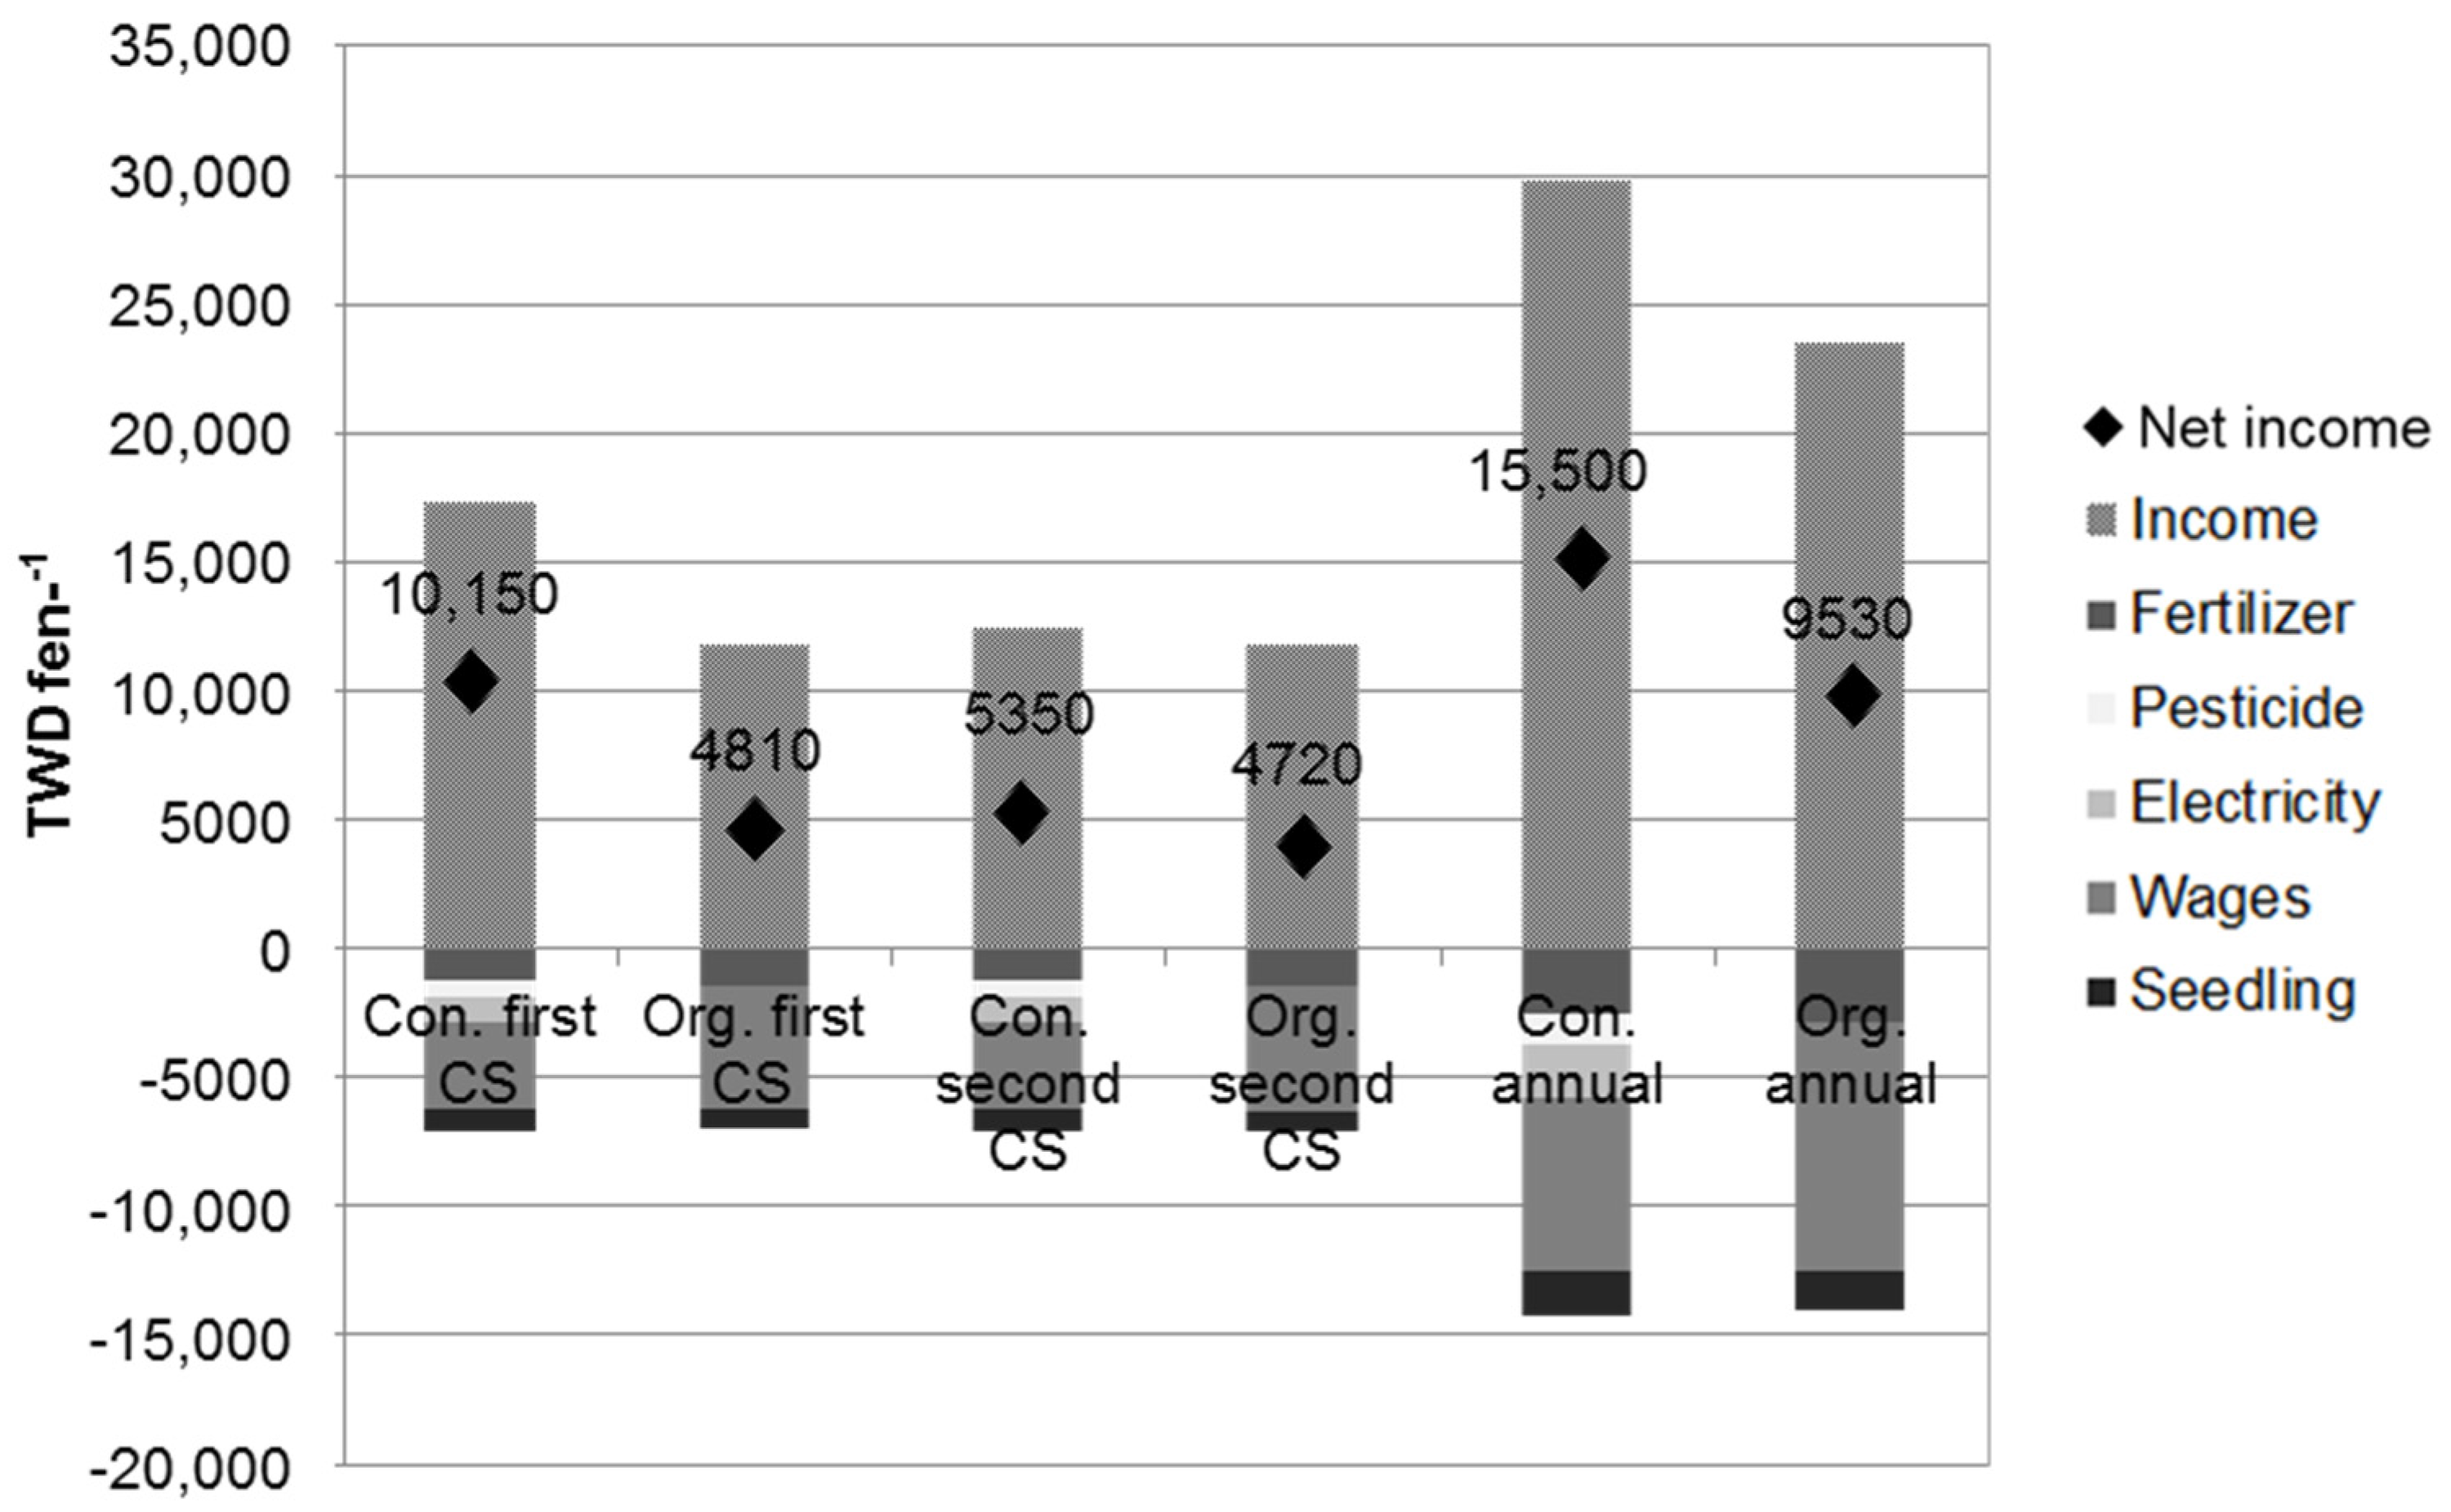
3.1.4. Economic Aspects

The economic aspects are discussed on an area basis. For conventional rice production in Houbi, the total expenditure of cultivation was the same in the first and the second CSs (Figure 3), because all of the farming processes and the use of chemicals and seedlings were the same. Wages made up the greatest proportion of the entire expenditure, followed by chemicals, power and then seedlings. Farmers’ income was higher in the first CS because of the higher rice yield in the first CS.
On the other hand, for organic rice cultivation in Luoshan, the total expenditure was higher in the second CS than the first CS because of the use of organic pesticide in the second CS. Wages were also the main expenditure in organic farming. There was no expenditure for electricity because farmers in this region used no electricity for irrigation. The income of the two CSs was the same.
Organic farming in Luoshan had less expenditure on pesticide, while conventional farming spent less on the payment of wages. The difference in wages between conventional and organic farms was greater than the difference in pesticide cost. The conventional farms in this study had to pay for electricity because of the geographic condition. The total expenditure of organic farms was slightly less than that of conventional farms. In addition, the price of organic rice was higher than the conventional rice. Even so, the income from the same area of rice paddy for conventional farmers was greater than that for organic farmers due to the difference in rice yield. The difference in income between conventional and organic rice was greater than the difference of total expenditure, which resulted in a higher net income for conventional farms (Figure 3).

3.2. Potentials of Organic Farming in Houbi District

Many of the differences between conventional and organic farms in this study were from factors such as climatic and geographic conditions, rather than the farming method itself. In this section, we address the potentials of organic farming in Houbi district from the sustainability perspectives using sensitivity analysis. To eliminate the peripheral factors, an organic farm with the local conditions of the conventional farms was assumed. Then, we have assessed five levels of yield for the virtual organic rice in Houbi, which are 10% less, the same, 10% more, 20% more and 30% more than the yield of organic rice in Luoshan. This means that the analysis is based on the assumption that the yield is mainly dependent on the farming method. The 30% more scenario is about the upper range of the yield of organic rice in Luoshan (Table 1).
The results of these five scenarios are shown in Table 10. Compared to the organic farms in Luoshan, the environmental impacts of this virtual farm in Houbi were higher for all five scenarios on weight (per kg) and on area (per fen) bases, except for water consumption. The net income was higher when the yield of the virtual farm was 10%, 20% and 30% higher than the organic farm in Luoshan. The environmental impacts were also higher than the ones brought by conventional farms in Houbi for all five scenarios on the weight basis, but were slightly lower on the area basis. The net income was lower for all five scenarios. With the assessed range, the potential of organic farming in Houbi seems to have a small opportunity to bring environmental and economic benefits. If we want to produce organic rice in Houbi with GHG emissions, water consumption, energy consumption and net income equivalent to those in Luoshan, according to the previous settings, the yields of organic dry grain in Houbi per year need to be 1.28-, 0.30-, 2.8-, and 1.09-times the organic rice yield in Luoshan per year, respectively (Table 11).
However, if we change the basic assumption on the sensitivity analysis, the opportunity looks different. If we want to produce organic rice in Houbi with GHG emissions, water consumption, energy consumption and net income equivalent to those of conventional rice in Houbi, according to the previous settings, the yields of organic dry grain in Houbi per year need to be 0.89-, 0.82-, 0.70- and 0.81-times the conventional rice yield in Houbi per year, respectively (Table 11). The yield ratio of organic to conventional grain was 0.60 for Houbi and Luoshan (0.60–0.67 according to the interview; Table 1). Seufert et al. [77] presented the average organic-to-conventional yield ratio at 0.75 for agricultural products in general and 0.74 for cereals. De Ponti et al. [78] found an even higher ratio for rice (86%–105%, on average 94%). The yield ratios required by the organic rice in virtual Houbi to compete with conventional rice in Houbi are 0.70–0.89 in this study. If so, there is a potential to switch to organic farming in Houbi that is sustainable for the region.

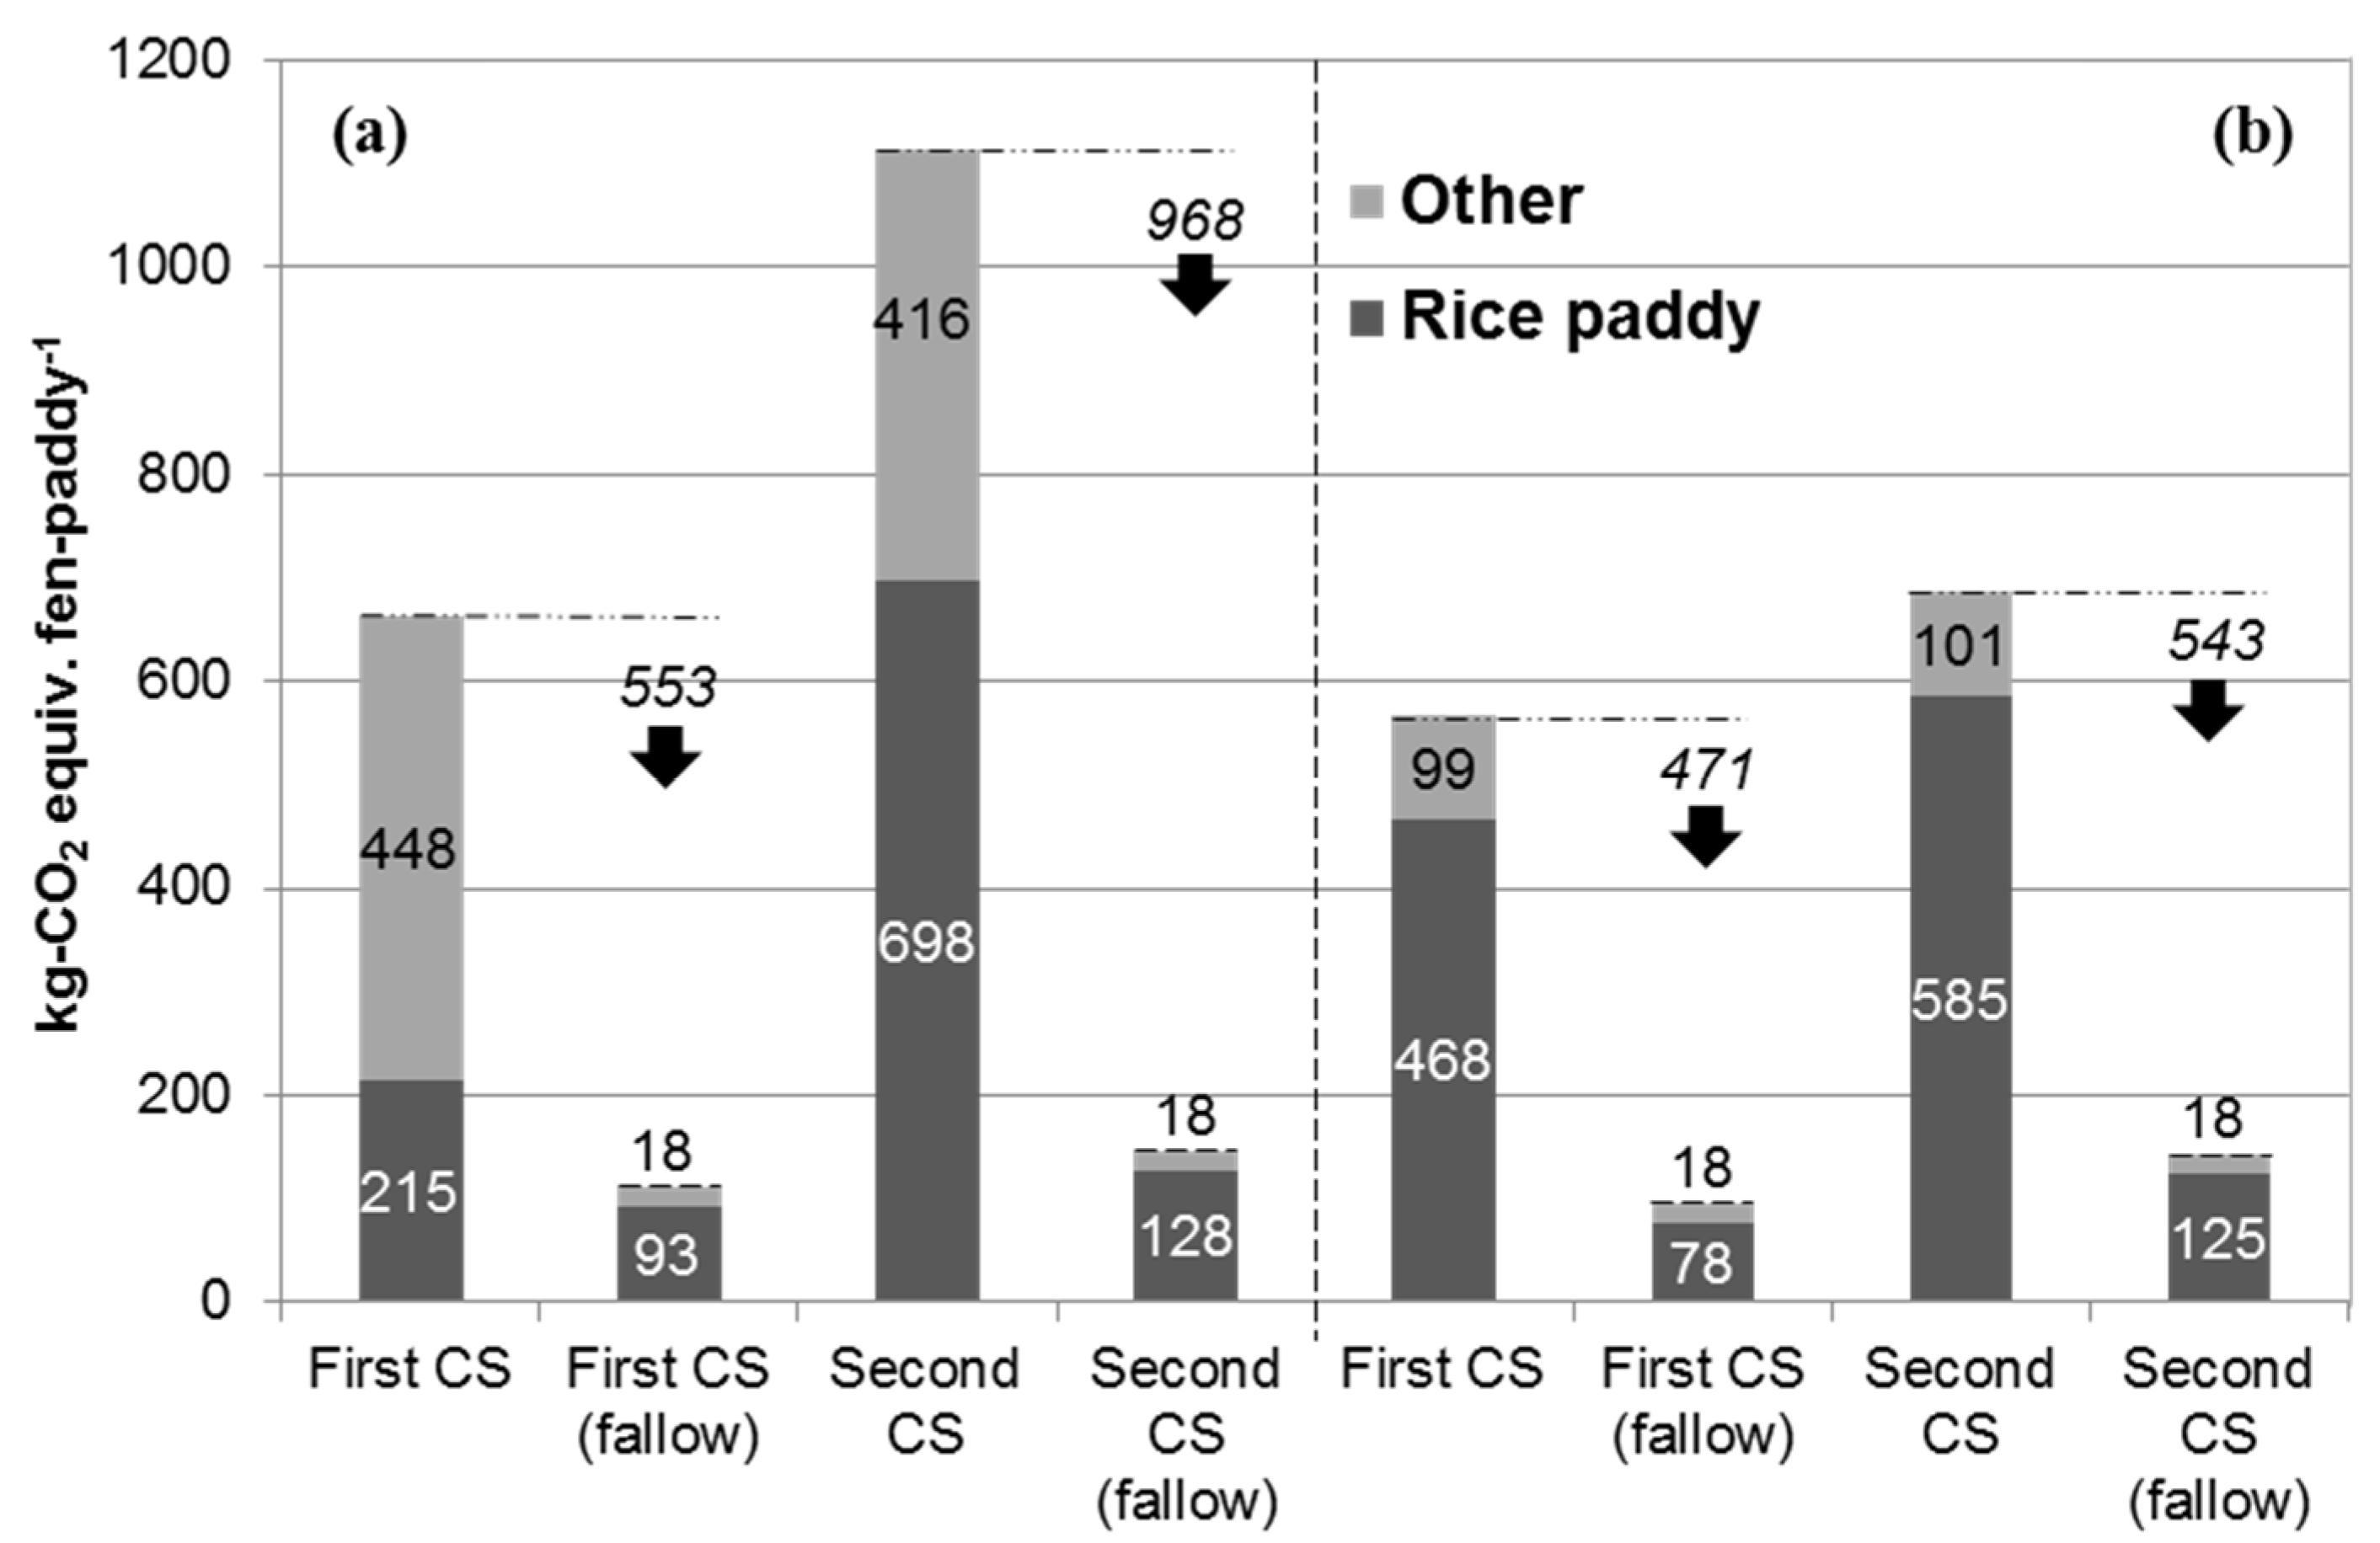
3.3. Fallow and Non-Fallow Period

In southwestern Taiwan (where Houbi is located), the government asks farmers to suspend their rice cultivation in order to ensure a sufficient industrial water supply during water shortages [9,79]. Figure 4 shows the GHG emissions during normal cropping and fallow (with green manure cultivated) periods. Emissions from farming activities in the fallow period were very small, although there were some activities related to green manure cultivation. The fallowed first CS had lower emissions than the fallowed second CS in both conventional and organic farms. However, fallowing during the second CS led to a higher reduction of GHG emissions than fallowing during the first CS. Therefore, if one of the CS needed to be fallow because of a water shortage, from the GHG emissions reduction point of view, the second CS should be the fallowed one. Nevertheless, in reality, water shortages in southwestern Taiwan usually happen in winter and spring, which meets the first CS, but not the second CS. Consequently, it is usually requested that the first CS be fallowed. GHG emissions and water shortage problems are difficult to investigate at the same time.
This issue could also be discussed in another way. Table 12 shows the effect of saving water in each CS from the viewpoints of GHG emissions and rice production. Under both conventional and organic farming methods, saving water in the second CS reduces GHG emissions more than in the first CS. The reduction in rice production was smaller when water in the second CS was saved for conventional farms and was about the same for organic farms. Therefore, from both the GHG and productivity perspectives, fallowing the second CS is recommended.

4. Conclusions

Production of one kg of rice grain on conventional farms in Houbi generated less GHG emissions and consumed less water and energy than on organic farms in Luoshan. The conventional farms brought more income for farmers. These results are highly dependent on the higher yield of the conventional farming method in Houbi district compared to Luoshan village.
The results of this study contradicted those in the literature that claim organic farming brings fewer environmental impacts than conventional farming. However, this may be attributed to differences in locations. Although located on the same island, differences in regions can bring significant differences in the yield of rice and management practices. The water and energy consumption of rice production is influenced more strongly by site conditions than by farming methods. According to the results of sensitivity analysis and the literature, the required magnitude of improvement in rice yield of organic farming for Houbi District, which could improve its sustainability aspects of rice production, is potentially possible. It is recommended that pilot experiments on organic farming be performed in Houbi and in other rice-producing areas to draw more solid conclusions, because there seems to be potentials in improving the environmental and economic aspects of rice production in areas practicing conventional rice production.
Water is saved by fallowing in one of the seasons. Saving water entails lower GHG emissions (0.1–1.0 kg·CO2·equiv.) and lower rice production (0.1–0.7 kg·dry·grain) on a cubic meter basis. This study also suggested that it is better for both GHG emission reduction and productivity to fallow the second CS, when there is a water shortage and one of the CSs needs to be fallowed. However, a water shortage is more likely to occur in the first CS than the second CS. The GHG emissions, food supply and water shortage issues must be traded off when making a decision about which season should be fallowed.

Acknowledgments

We would like to thank Te-Chih Wang of Farmers’ Association of Houbi District for contacting farmers and the mill factory and arranging the interviews; Yung-Ching Lai, Ming-Tsang Lee, Yun-Zhi Lin, Ching-Song Lai, Chun-Yao Lin and Tsai-Yun Lin-Lee for sharing their experience and knowledge. Preliminary results of this study were presented at the sixth annual meeting of the Institute of Life Cycle Assessment, Japan, in March 2011, and the ISIE 2011 Conference in June 2011. Comments from participants in the conferences are deeply appreciated.

Author Contributions

Hung-Chun Lin and Yasuhiro Fukushima conceived of and designed the research. Hung-Chun Lin interviewed the farmers and factory, collected data and analyzed the data, Hung-Chun Lin wrote the paper, Yasuhiro Fukushima reviewed and commented on the paper.

Conflicts of Interest

The authors declare no conflict of interest.

Appendix: Calculation of the Electricity Consumption

In Taiwan, electricity has summer (June–September) and non-summer (October–May) prices (Table A1). Depending on the amount of electricity used per month (recorded by electricity meters), the price for 1 kWh could also be different. In this study, we assumed that the electricity consumption for every month during the CS was the same. The cost of electricity in both the first and second CS was 1000 TWD·fen−1. The average size of farm owned by farmers in Taiwan is 10 fen [80]. Therefore, we assumed that one electricity meter recorded the electricity consumption for 10 fen.
  • For the first CS (B and C periods last for around five months, January–May)
1000 TWD·fen−1 × 10 fen = (2.10 TWD·kWh−1 × 120 kWh·month−1 + 2.68 TWD·kWh−1 × 210 kWh·month−1 + 3.61 TWD·kWh−1 × 170 kWh·month−1 + 4.48 TWD·kWh−1 × 127.6 kWh·month−1) × 5 month
(120 kWh·month−1 + 210 kWh·month−1 + 170 kWh·month−1 + 127.6 kWh·month−1) × 5 month = 3138 kWh
The electricity consumption for the first CS was 313.8 kWh·fen−1.
  • For the second CS (B and C periods last for around four months, July–October)
1000 TWD·fen−1 × 10 fen = (2.10 TWD·kWh−1 × 120 kWh·month−1 + 3.02 TWD·kWh−1 × 210 kWh·month−1 + 4.39 TWD·kWh−1 × 170 kWh·month−1 + 5.44 TWD·kWh−1 × 176.6 kWh·month−1) × 3 month + (2.10 TWD·kWh−1 × 120 kWh·month−1 + 2.68 TWD·kWh−1 × 210 kWh·month−1 + 3.61 TWD·kWh−1 × 170 kWh·month−1 + 4.48 TWD·kWh−1 × 176.6 kWh·month−1) × 1 month
(120 kWh·month−1 + 210 kWh·month−1 + 170 kWh·month−1 + 176.6 kWh·month−1) × 4 month = 2706 kWh
The electricity consumption for the second CS was 270.6 kWh·fen−1.
Table A1. Price of electricity in Taiwan [59].
Electricity Consumption (kWh Month−1)Price of Electricity
June to September (TWD·kWh−1)October to May (TWD·kWh−1)
< 1202.102.10
121–3303.022.68
331–5004.393.61
501–7005.444.48
701–10006.165.03
> 10016.715.28

References and Notes

  1. FAOSTAT. Available online: http://faostat.fao.org/ (accessed on 21 October 2015).
  2. Maruyama, K.; Gocho, N.; Moriya, T.; Hayashi, K. Life cycle assessment of super high-yield and conventional rice production systems: A comparison based on global warming potential and energy consumption. J. Life Cycle Assess. Jpn. 2009, 5, 432–438. [Google Scholar] [CrossRef]
  3. Husin, Y.A.; Murdiyarso, D.; Khalil, M.; Rasmussen, R.; Shearer, M.; Sabiham, S.; Sunar, A.; Adijuwana, H. Methane flux from Indonesian wetland rice: The effects of water management and rice variety. Chemosphere 1995, 31, 3153–3180. [Google Scholar] [CrossRef]
  4. Saleh, A.; Bhuiyan, S. Crop and rain water management strategies for increasing productivity of rainfed lowland rice systems. Agric. Syst. 1995, 49, 259–276. [Google Scholar] [CrossRef]
  5. Scheehle, E.A.; Kruger, D. Global anthropogenic methane and nitrous oxide emissions. Energy J. 2006, 27, 33–44. [Google Scholar] [CrossRef]
  6. Jiang, W.; Fang, X.; Haung, Z.; Chen, Z.; Xiang, W.; Chen, M.; Yang, S.; Du, X. Greenhouse gas emissions and agronomic performances were affected by different irrigation methods in rice field. J. Food Agric. Environ. 2014, 12, 559–565. [Google Scholar]
  7. Omar, M.H.; Berahim, Z.; Ariffin, N.; Ismail, M.R.; Saud, H.M.; Amalina, N.; Habib, S.H.; Kausar, H. Improved water use efficiency in rice under limited water environment through microbial inoculation. J. Food Agric. Environ. 2014, 12, 149–154. [Google Scholar]
  8. United Nations Environment Programme. Global Environment Outlook 4: Environment for Development; United Nations Environment Programme: Naiobi, Kenya, 2007. [Google Scholar]
  9. Chung, L.H. How to Improve Food Self-Sufficiency If Farmers Are Always Sacrificed First When We Are Short of Water? The Liberty Times: Taipei, Taiwan, 2011. [Google Scholar]
  10. Statistical Bureau, Taiwan. Census of Agriculture, Forestry, Fishery, and Animal Husbandry. 2006. Available online: http://eng.stat.gov.tw/public/Data/81716573671.pdf (accessed on 9 May 2016). [Google Scholar]
  11. Ministry of Labor, Taiwan. Labor Statistics. Available online: http://www.mol.gov.tw/statistics/2452/2455/ (accessed on 20 October 2015).
  12. Liang, J.W. By Adopting Paddy, Farmers Become Farm Operators; Economic Daily News: Taipei, Taiwan, 2009. [Google Scholar]
  13. Tsai, J.Y. Analysis of the Change of Agricultural Labor in Taiwan before and after Joining WTO. 2007. Available online: http://www.coa.gov.tw/view.php?catid=12427 (accessed on 20 October 2015). [Google Scholar]
  14. Council of Agriculture, Taiwan. Agricultural Statistics Database. Available online: http://agrstat.coa.gov.tw/sdweb/public/indicator/Indicator.aspx (accessed on 20 October 2015).
  15. Haas, G.; Wetterich, F.; Köpke, U. Comparing intensive, extensified and organic grassland farming in southern Germany by process life cycle assessment. Agric. Ecosyst. Environ. 2001, 83, 43–53. [Google Scholar] [CrossRef]
  16. Küstermann, B.; Kainz, M.; Hülsbergen, K.-J. Modeling carbon cycles and estimation of greenhouse gas emissions from organic and conventional farming systems. Renew. Agric. Food Syst. 2008, 23, 38–52. [Google Scholar] [CrossRef]
  17. Meisterling, K.; Samaras, C.; Schweizer, V. Decisions to reduce greenhouse gases from agriculture and product transport: LCA case study of organic and conventional wheat. J. Clean. Prod. 2009, 17, 222–230. [Google Scholar] [CrossRef]
  18. Alonso, A.M.; Guzmán, G.J. Comparison of the efficiency and use of energy in organic and conventional farming in Spanish agricultural systems. J. Sustain. Agric. 2010, 34, 312–338. [Google Scholar] [CrossRef]
  19. Taiwan Organic Information Portal. Current Policies. Available online: http://info.organic.org.tw/supergood/front/bin/ptlist.phtml?Category=103373 (accessed on 21 October 2015).
  20. Wheeler, S. Review of organic farming policy in Australia: Time to wipe the slate clean? J. Sustain. Agric. 2011, 35, 885–913. [Google Scholar] [CrossRef]
  21. Houbi District Office. About Houbi Distict. Available online: http://www.tainan.gov.tw/houbi/page.asp?nsub=A00000 (accessed on 21 October 2015).
  22. Taiwan Organic Information Portal. Organic Agricultural Land and Farm in Taiwan. 2014. Available online: http://info.organic.org.tw/supergood/front/bin/ptlist.phtml?Category=105937 (accessed on 21 October 2015).
  23. Lee, C.Y. The Influences of Organic Rice Cultivation on Soil and Rice Quality; Taichung District Agricultural Research and Extension Station: New Taipei, Taiwan, 2000. [Google Scholar]
  24. Hsu, S.H.; Liu, H.K.; Liu, W.Y. A study on rice farmers’ opinions on organic rice in houbi township of tainan county. Crop Environ. Bioinform. 2010, 7, 21–36. [Google Scholar]
  25. Chiang, J.K.; Lin, K.C.; Huang, S.N. Production and marketing model of rice variety “yumeibejing”. Crop Environ. Bioinform. 2008, 5, 138–145. [Google Scholar]
  26. Shen, T.M.; Liu, W.T.; Hou, F.F. The development of Luoshan Organic Village. In Proceedings of the Conference of the Development of Organic Ecological Environment and Recreation, Hualien, Taiwan, 29 May 2008.
  27. Council of Agriculture, Taiwan. The Winner of the FOURTH The Best Rice in Taiwan—“Let It Be” Kun-Bin Huang! 2006. Available online: http://www.coa.gov.tw/show_news.php?cat=show_news&serial=9_diamond_20060918161623 (accessed on 21 October 2015). [Google Scholar]
  28. Fuli Township Office. Rice of Fuli. Available online: http://www.fuli.gov.tw/files/11-1029-2177-1.php (accessed on 21 October 2015).
  29. Brentrup, F.; Küsters, J.; Kuhlmann, H.; Lammel, J. Environmental impact assessment of agricultural production systems using the life cycle assessment methodology: I. Theoretical concept of a LCA method tailored to crop production. Eur. J. Agron. 2004, 20, 247–264. [Google Scholar] [CrossRef]
  30. Fukushima, Y.; Chen, S.P. A decision support tool for modifications in crop cultivation method based on life cycle assessment: A case study on greenhouse gas emission reduction in Taiwanese sugarcane cultivation. Int. J. Life Cycle Assess. 2009, 14, 639–655. [Google Scholar] [CrossRef]
  31. Roy, P.; Nei, D.; Orikasa, T.; Xu, Q.; Okadome, H.; Nakamura, N.; Shiina, T. A review of life cycle assessment (LCA) on some food products. J. Food Eng. 2009, 90, 1–10. [Google Scholar] [CrossRef]
  32. Central Weather Bureau, Taiwan. Climate Statistics. Available online: http://www.cwb.gov.tw/V7/index.htm (accessed on 3 May 2016).
  33. Lai, Y.C. Personal communication with conventional farmer in Houbi, 2010.
  34. Lin, Y.Z. Personal communication with conventional farmer in Houbi, 2010.
  35. Lee, M.T. Personal communication with organic farmer in Luoshan, 2010.
  36. Wang, T.C.; Farmers’ Association of Houbi District, Tainan City, Taiwan. Personal communication, 2010.
  37. Intergovernmental Panel on Climate Change. IPCC Fourth Assessment Report: Climate Change 2007; IPCC: Geneva, Switzerland, 2007. [Google Scholar]
  38. Miyata, A.; Leuning, R.; Denmead, O.T.; Kim, J.; Harazono, Y. Carbon dioxide and methane fluxes from an intermittently flooded paddy field. Agric. For. Meteorol. 2000, 102, 287–303. [Google Scholar] [CrossRef]
  39. Yao, M.H.; Chen, S.H. Study on carbon dioxide fluxes from rice paddy. J. Taiwan Agric. Res. 2005, 54, 150–161. [Google Scholar]
  40. Gathorne-Hardy, A. Greenhouse Gas Emissions from Rice. RGTW Working Paper No. 3. 2013. Available online: http://www.southasia.ox.ac.uk/sites/sias/files/documents/GHG%20emissions%20from%20rice%20-%20%20working%20paper_0.pdf (accessed on 21 October 2015).
  41. Williams, A.G.; Audsley, E.; Sandars, D.L. Final Report to Defra on Project IS0205: Determining the Environmental Burdens and Resource Use in the Production of Agricultural and Horticultural Commodities; Department of Environment, Food, and Rural Affairs (Defra): London, UK, 2005. [Google Scholar]
  42. Blengini, G.A.; Busto, M. The life cycle of rice: LCA of alternative agri-food chain management systems in Vercelli (Italy). J. Environ. Manag. 2009, 90, 1512–1522. [Google Scholar] [CrossRef] [PubMed]
  43. Hülsbergen, K.-J.; Feil, B.; Biermann, S.; Rathke, G.-W.; Kalk, W.-D.; Diepenbrock, W. A method of energy balancing in crop production and its application in a long-term fertilizer trial. Agric. Ecosyst. Environ. 2001, 86, 303–321. [Google Scholar] [CrossRef]
  44. Jones, M. Analysis of the use of energy in agriculture—Approaches and problems. Agric. Syst. 1989, 29, 339–355. [Google Scholar] [CrossRef]
  45. Refsgaard, K.; Halberg, N.; Kristensen, E.S. Energy utilization in crop and dairy production in organic and conventional livestock production systems. Agric. Syst. 1998, 57, 599–630. [Google Scholar] [CrossRef]
  46. Le Mer, J.; Roger, P. Production, oxidation, emission and consumption of methane by soils: A review. Eur. J. Soil Biol. 2001, 37, 25–50. [Google Scholar] [CrossRef]
  47. Ecoinvent Centre. Ecoinvent data v.2.2. Swiss Centre for Life Cycle Inventories. 2010. Available online: http://www.ecoinvent.ch/ (accessed on 21 October 2015).
  48. National Renewable Energy Laboratory. U.S. Life-Cycle Inventory Database. 2008. Available online: https://www.lcacommons.gov/nrel/search (accessed on 21 October 2015). [Google Scholar]
  49. Institute for Environment and Sustainability, Joint Research Centre of European Commission. European Reference Life Cycle Database. 2010. Available online: http://eplca.jrc.ec.europa.eu/ELCD3/index.xhtml (accessed on 21 October 2015).
  50. Nielsen, P.H.; Nielsen, A.M.; Weidema, B.P.; Dalgaard, R.; Halberg, N. LCA Food Database. 2003. Available online: http://www.lcafood.dk/ (accessed on 21 October 2015).
  51. Bureau of Energy, Taiwan. The Energy Supply and Demand Situation of Taiwan. Available online: http://web3.moeaboe.gov.tw/ECW/populace/web_book/WebReports.aspx?book=B_CH&menu_id=145 (accessed on 21 October 2015).
  52. Lin, C.Y. Personal communication in mill factory in Houbi, 2011.
  53. Volkswagen Newsletter. TDI Engine. 2009. Available online: http://act.udn.com/vw/e-News02/technology.html (accessed on 21 October 2015).
  54. Taiwan Agriculture and Food Traceability System. Available online http://taft.coa.gov.tw/ (accessed on 21 October 2015).
  55. Fei, W.C.; Chou, T.M.; Chen, M.L. Handbook of Pesticides' Name; Taiwan Agricultural Chemicals and Toxic Substances Research Institute, Council of Agriculture: Taichung, Taiwan, 2008. [Google Scholar]
  56. FAO. FAO Specifications and Evauations for Plant Protection Products: Bensulfuron-Methyl. 2002. Available online: http://www.fao.org/fileadmin/templates/agphome/documents/Pests_Pesticides/Specs/bensul_m.pdf (accessed on 21 October 2015).
  57. Lee, M.L. Introduction to the Usage of Fungicides and Pesticides. 2008. Available online: http://www.tactri.gov.tw/wSite/public/Attachment/f1380533768161.pdf (accessed on 21 October 2015). [Google Scholar]
  58. U.S. Environmental Protection Agency. Pyrethroids and Pyrethrins. Available online: http://www.epa.gov/oppsrrd1/reevaluation/pyrethroids-pyrethrins.html (accessed on 11 June 2015).
  59. Taiwan Power Company. Price of Electricity and Calculation Examples. Available online: http://www.taipower.com.tw/content/new_info/new_info-d13.aspx?LinkID=14 (accessed on 27 April 2016).
  60. Water Resources Agency, Taiwan. Consuming Water Statistics Database. Available online: http://wuss.wra.gov.tw/agriculture.aspx (accessed on 3 May 2016).
  61. Library of Water Resources Agency, Taiwan. The Agricultural Water Consumption in Taiwan for 2008. 2009. Available online: http://lib.wra.gov.tw/libebookFlip/2008/1009703867b/index.html#p=1 (accessed on 3 May 2016). [Google Scholar]
  62. Huang, S.N.; Liu, R.M.; Lin, C.W.; Chen, S.H.; Chen, W.S. Emission and mitigation strategies of mathane from paddy soils in southern Taiwan. In Measurement of Greenhouse Gases and Reduction Strategies (ii); Yang, S.S., Ed.; Global Change Research Center in NTU: Taipei, Taiwan, 2003; pp. 135–150. [Google Scholar]
  63. Yang, S.S.; Liu, C.M.; Lai, C.M.; Liu, Y.L. Estimation of methane and nitrous oxide emission from paddy fields and uplands during 1990–2000 in Taiwan. Chemosphere 2003, 52, 1295–1305. [Google Scholar] [CrossRef]
  64. Lai, C.M.; Chien, Y.H.; Yang, S.S. Estimation and mitigation strategies of nitrous oxide emission from rice paddy, upland field, and wetland soils. In Measurement of Greenhouse Gases and Reduction Strategies (iii); Yang, S.S., Ed.; Department of Agricultural Chemistry, National Taiwan University: Taipei, Taiwan, 2003; pp. 73–88. [Google Scholar]
  65. Lai, C.M.; Department of Agricultural Chemistry, National Taiwan University, Taiwan. Personal communication, 2015.
  66. Qin, Y.; Liu, S.; Guo, Y.; Liu, Q.; Zou, J. Methane and nitrous oxide emissions from organic and conventional rice cropping systems in Southeast China. Biol. Fertil. Soils 2010, 46, 825–834. [Google Scholar] [CrossRef]
  67. Peng, D.C.; Huang, S.N. Emission of methane from paddy soils and the factors in eastern Taiwan. Res. Rep. Hualien Area 1998, 16, 35–45. [Google Scholar]
  68. Taiwan Power Company. The Average Price of Electricity in Different Countries, 2012. 2013. Available online: http://www.taipower.com.tw/UpFile/_userfiles/file/2012%E5%B9%B4%E5%90%84%E5%9C%8B%E9%9B%BB%E5%83%B9%E6%AF%94.pdf (accessed on 27 April 2016).
  69. Bhattacharya, S.; Pham, H.; Shrestha, R.; Vu, Q. CO2 Emissions Due to Fossil and Traditional Fuels, Residues and Wastes in Asia; Workshop on Global Warming Issues in Asia, Asian Institute of Technology: Bangkok, Thailand, 1993. [Google Scholar]
  70. Lin-Lee, T.Y. Personal communication about farmers’ expenditure, 2010.
  71. Schumacher, A.L.G.; Borgelt, S.C.; Russell, M.D.; Hires, W.G. Fueling 5.9 l and 7.3 l navistar engines with biodiesel-20. In Proceedings of the 1995 ASAE Summer Meeting, Chicago, IL, USA, 18–23 June 1995.
  72. Chinese Petroleum Corporation. Price of Fuel. Available online: http://www.cpc.com.tw/big5_BD/tmtd/ListPrice/ShowHisToryPrice.asp?pno=53 (accessed on 15 June 2015).
  73. Dubey, S. Microbial ecology of methane emission in rice agroecosystem: A review. Appl. Ecol. Environ. Res. 2005, 3, 1–27. [Google Scholar] [CrossRef]
  74. Linquist, B.A.; Adviento-Borbe, M.A.; Pittelkow, C.M.; van Kessel, C.; van Groenigen, K.J. Fertilizer management practices and greenhouse gas emissions from rice systems: A quantitative review and analysis. Field Crop. Res. 2012, 135, 10–21. [Google Scholar] [CrossRef]
  75. Niggli, U.; Earley, J.; Ogorzalek, K. Organic agriculture and the environmental stability of food supply. In Proceedings of the International Conference on Organic Agriculture and Food Security, Rome, Italy, 3–5 May 2007; Available online: http://orgprints.org/10752/1/niggli-et-al-2007-environmental-stability.pdf (accessed on 19 October 2015).
  76. Yang, S.S.; Lai, C.M.; Chang, H.L.; Chang, E.H.; Wei, C.B. Estimation of methane and nitrous oxide emissions from paddy fields in Taiwan. Renew. Energy 2009, 34, 1916–1922. [Google Scholar] [CrossRef]
  77. Seufert, V.; Ramankutty, N.; Foley, J.A. Comparing the yields of organic and conventional agriculture. Nature 2012, 485, 229–232. [Google Scholar] [CrossRef] [PubMed]
  78. De Ponti, T.; Rijk, B.; van Ittersum, M.K. The crop yield gap between organic and conventional agriculture. Agric. Syst. 2012, 108, 1–9. [Google Scholar] [CrossRef]
  79. Council of Agriculture, Taiwan. In Response to the Drought, Irrigation Association Launched an Emergency Measure. 2011. Available online: http://www.coa.gov.tw/show_news.php?cat=show_news&serial=coa_diamond_20110512202933 (accessed on 21 October 2015). [Google Scholar]
  80. Statistical Bureau, Taiwan. Census of Agriculture, Forestry, Fishery, and animal Husbandry. 2011. Available online: http://eng.stat.gov.tw/public/Data/332910175471.pdf (accessed on 9 May 2016). [Google Scholar]
Figure 1. Scope of the analysis for rice production in Taiwan. I: inputs; P: processes. B, C, A, and R are the condition of the rice paddy with its duration in a year, which are before cultivation, cultivation, after cultivation and with residues, respectively. P1–8 take place on farm, while P9 is operated in a factory.
Sustainability 08 00529 g001
Figure 2. GHG emissions from rice paddies under different farming methods and periods. C represents conventional; O represents organic.
Sustainability 08 00529 g002
Figure 3. Financial balance of conventional and organic rice cultivation. The diamonds and numbers above represent the net income of each CS.
Sustainability 08 00529 g003
Figure 4. Rice cultivation-related GHG emissions in fallow and non-fallow periods in Taiwan. The arrows and the numbers above depict the reductions in GHG by fallowing in the different seasons. Rice paddy: GHG emissions from the rice paddy; other: GHG emissions from the associated rice cultivation processes (see Figure 1). (a) Conventional farms in Houbi; (b) organic farms in Luoshan.
Sustainability 08 00529 g004
Table 1. Climatic- and rice cultivation-related information for conventional and organic farms of this study. The commonly-used local unit for area is fen, which is 0.1 hectares.
Conventional FarmOrganic Farm *
LocationHoubi District, Tainan City (southwestern Taiwan)Luoshan, Fuli Township, Hualien County (eastern Taiwan)
Temperature [32]Average (30 years): 24.3 °CAverage (30 years): 23.4 °C
Lowest: 17.6 (January)Lowest: 18.0 °C (January)
Highest: 29.2 °C (July)Highest: 28.5 °C (July)
Precipitation [32]Annual: 1698.2 mmAnnual: 2176.8 m
Lowest: 14.4 mm (December)Lowest: 62.2 mm (January)
Highest: 395.1 mm (August)Highest: 399.2 mm (September)
Crop season (CS) [33,34]First: January–MayFirst: January–May
Second: July–October or early NovemberSecond: July–October or early November
Yield of rice [33,34]First CS: 810–990 kg·dry·grain·fen−1First and second CS:
420–540 kg·dry·grain·fen−1
Second CS: 585–630 kg·dry·grain·fen−1
Rice breed [33,34]Taigeng No. 9Kaohsiung No. 139
Seeding density [33,34,35]9.6 kg·seed·fen−1·CS−15.5 kg·seed·fen−1·CS−1
Farming activities [33,34]Ploughing (twice), transplanting (once), applying fertilizer and pesticide (4 times), and harvesting (once)Ploughing (2–3 times), transplanting (once), organic fertilizer and organic pesticide applying (2–3 times), weeding (2–4 times), harvesting (once)
* Sometimes, organic farms need more farming activities (e.g., ploughing and weeding) because they depend more on the annual conditions and farm dynamics.
Table 2. Data sources of rice production process. Lai, Lin and Lee are farmers in the study area.
Data CategorySource
Field operation
-
Type of machinery, distance between machinery suppliers and farms, time for working on fields
-
Efficiency of engine, size of paddy
-
GHG emissions and cumulative energy demand of the machinery
-
Lai [33] and Lin [34]
-
Literature review
-
Database: Ecoinvent Centre [47], National Renewable Energy Laboratory [48] and Institute for Environment and Sustainability [49]
Chemicals and Organic compounds
-
Type, amount and active ingredients
-
GHG emissions and cumulative energy demand
-
Lai [33], Lin [34] and literature review
-
Database: Ecoinvent Centre [47] and Nielsen et al. [50]
Seedling
-
Type and power of machinery, the amount of chemicals and organic compounds, amount of water and amount of seed
-
Active ingredients of chemicals and organic compounds
-
GHG emissions and cumulative energy demand of the use of chemicals, organic compounds and machinery
-
Lee [35]
-
Literature review
-
Database: Ecoinvent Centre [47]
Irrigation
-
Ways to conduct water into paddy, electricity bill
-
Regional irrigation water used, price of electricity
-
GHG emissions and cumulative energy demand
-
Lai [33] and Lin [34]
-
Literature review
-
Database: Ecoinvent Centre [47] and Bureau of Energy, Taiwan [51]
Rice paddies
-
GHG emissions from rice paddy
-
Literature review
Drying and refining
-
Type of machinery, cost of electricity, work hours
-
GHG emissions and cumulative energy demand of the machinery
-
Lin [52]
-
Database: Ecoinvent Centre [47] and Bureau of Energy, Taiwan [51]
Table 3. Data sources of rice production process.
MachinerySpecification (hp: Horsepower)
Ploughing machine135 hp
Transplanting machine21 hp
Spraying machine6 hp
Harvester105 hp
Truck80 hp, 4-ton load
Table 4. Data entries for fertilizer. CS, cropping season.
FertilizerActive Ingredients (%)Amount (kg·fen−1·CS−1)
NNH4NO3P2O5K2OOrganic Matter
Conventional
Ammonium sulfate2121------40
TaiFer * #1 Compound fertilizer2010851040
TaiFer * #39 Compound fertilizer126--181280
Organic
Hao Le Te #2 Compound organic fertilizer52284140
* Taiwan Fertilizer Co., Ltd.
Table 5. Data entries for pesticide.
PesticideActive Ingredient (Chemical Class)EcoinventAmount (kg·fen−1·CS−1)
Conventional
Chuan Chi Chu [54]Mefenacet + bensulfuron-methyl [55] (sulfonylurea [56])(Sulfonyl)
urea compounds
0.091 [54]
Hsi To Sheng [54]Edifenphos [55] (phosphorothioate [57])Fungicide0.100 [54]
Wen Sha Ning [54]Pencycuron [55] (Phenylurea [57])Diuron0.046 [54]
Chung Ching Ching [54]Alpha-cypermethrin [55] (pyrethroid [58])Pyrethroid compounds0.006 [54]
Hsing Nung Sheng [54]Mancozeb [55] (dithiocarbamate [57])Mancozeb0.043 [54]
Organic
Camellia meal [34]Camellia meal [34]Rape meal6 [34]
Chili water [34]Chili [32]--350 [34]
Table 6. Emission factors of rice paddies for conventional and organic farms.
FarmConventionalOrganic (Luoshan)Organic (Houbi)
GHGCH4 aN2O bCH4 aN2O bCH4 aN2O b
Normal cropping season
B1, C1 (first CS)6.15 c0.045 d15.83 e0.060 f7.59 g0.016 h
B2, C2 (second CS)25.3 c0.051 d22.69 i0.0003 j31.20 k0.018 l
A1, R1 (summer fallow)0.47 m0.030 n0.59 o0.010 p0.59 o0.010 p
A2, R2 (winter fallow)1.08 q0.030 n1.33 r0.010 p1.33 r0.010 p
Fallow season (no rice cultivated)
B1, C11.58 c0.030 n1.95 s0.010 p1.95 s0.010 p
B2, C22.58 c0.030 n3.19 t0.010 p3.19 t0.010 p
A1, R10.47 m0.030 n0.59 o0.010 p0.59 o0.010 p
A2, R21.08 q0.030 n1.33 r0.010 p1.33 r0.010 p
a kg·fen−1; b g·fen−1·h−1; c original data from Huang et al. [62]; d original data from Yang et al. [63]; e 3.56 × 10⁻³ kg·fen−1·h−1 [67] × 1.2 × 24 h × 150 day × 1.23 [66]; f 1.74 × 10⁻⁴ kg·fen−1·h−1 [63] × 0.34 [66]; g 6.15 kg·fen−1 [62] × 1.23 [66].; h 0.045 g·fen−1·h−1 [63] × 0.34 [66]; i 6.38 × 10⁻³ kg·fen−1·h−1 [67] × 1.2 × 24 h × 120 day × 1.23 [66]; j 1.00 × 10⁻⁶ kg·fen−1·h−1 [63] × 0.34 [66]; k 25.3 kg·fen−1 [62] × 1.23 [66]; l 0.051 g·fen−1·h−1 [63] × 0.34 [66]; m 1.58 kg·fen−1 [62] ÷ 150 day (length of the first CS) × 45 day (length of summer fallow); n Lai et al. [64]; ranges from 0.002–0.059 g·N2O·fen−1·h−1; o 0.47 kg·fen−1 [62] × 1.23 [66]; p 0.03 g·fen−1·h−1 [64] × 0.34 [66]; q 2.58 kg·fen−1 [62] ÷ 120 day (length of the second CS) × 50 day (length of winter fallow); r 1.08 kg·fen−1 [62] × 1.23 [66]; s 1.58 × 1.23 [66]; t 2.58 × 1.23 [66].
Table 7. Entries for the financial flow of conventional (Houbi) and organic (Luoshan) rice farms, one CS.
Conventional (Houbi)Organic (Luoshan)
CategoryPrice (TWD·unit−1)Amount (unit·fen−1)UnitCategoryPrice (TWD·unit−1)Amount (unit·fen−1)Unit
Expenditure
ChemicalsOrganic compounds
Ammonium sulfate2501packHao Le Te #210140kg
TaiFer a #13101packCamellia meal156 dkg
TaiFer a #393502pack
Chuan Chi Chu1751pack
Hsi To Sheng5800.2bottle
Wen Sha Ning2900.2bottle
Chung Ching Ching3200.1bottle
Hsing Nung Sheng2500.066bottle
Power
Electricity1000--fenElectricity1000--fen
Wages
Ploughing5502timePloughing5503time
Transplanting5501timeTransplanting6001time
Pesticide spraying2004timeHarvesting11001time
Harvesting9001timeWeeding5004time
Seedling3030boxSeedling3030box
Income
Dry grain21.3810 b, 585 ckgDry grain28420 ekg
a Taiwan Fertilizer Co., Ltd.; b in the first CS; c in the second CS; d only used in the second CS; e in both the first and the second CS.
Table 8. GHG emissions and resource consumption of conventional (Houbi) and organic (Luoshan) rice cultivation (i.e., P1–8 in Figure 1) on a farm area basis. For conversion to a kg-dry grain basis, use 810 kg-dry·grain·fen−1, 585 kg-dry·grain·fen−1 and 420 kg-dry·grain·fen−1 for the first CS (conventional), second CS (conventional) and both CSs (organic), respectively.
ImpactConventional (Houbi)Organic (Luoshan)
First CSSecond CSAnnualFirst CSSecond CSAnnual
Unit *Unit *Unit *Unit *Unit *Unit *
GHG emissions715120619205777061282
Chemical/Organic compound149149298464995
Fertilizer146146292464693
Pesticide336022
Power282249531404080
Fuel424285404080
Electricity239207446------
Rice paddy2156989134685851053
Methane157644801400581981
Nitrous oxide585411268472
Seedling181835121224
Water consumption125710302287353732576794
Irrigation125310252278353432526786
Pesticide112111
Seedling357357
Seed disinfection0.020.020.03------
Washing/immersing0.060.060.130.020.020.03
Soil preparation0.010.010.020.010.010.02
Bud greening357357
Energy consumption6120553011,65094310251968
Fuel96296219249429421885
Electricity428936997988------
Fertilizer8128121625111
Pesticide575711308282
* Unit: kg-CO2 equiv.·fen−1, m3-water·fen−1 and MJ·fen−1, for GHG emissions, water and energy consumption, respectively.
Table 9. GHG emission and energy consumption of conventional and organic rice on a kg-dried rice basis. For conversion to fen basis, use 810 kg-dry·grain·fen−1, 585 kg-dry·grain·fen−1 and 420·kg-dry·grain·fen−1 for first CS (conventional), second CS (conventional) and both CSs (organic), respectively.
ImpactConventional (Houbi)Organic (Luoshan)
First CSSecond CSAnnualFirst CSSecond CSAnnual
GHG emissions *1.12.51.71.82.22.0
Cultivation1.02.41.61.72.11.9
Drying and refining0.10.10.10.10.10.1
Energy consumption *11.613.812.54.94.94.9
Cultivation9.612.010.62.83.13.0
Drying and refining2.01.92.02.11.92.0
* Unit: kg-CO2 equiv.·kg-dried·rice−1 and MJ·kg-dried·rice−1, for GHG emissions and energy consumption, respectively.
Table 10. Impacts and annual net income associated with the organic rice produced in the virtual farm in Houbi. The yield of the virtual farm was subject to the analysis based on the yield of the organic farm in Luoshan.
Impacts and Annual Net Income (Unit)Yield Scenarios (on Luoshan Basis)
−10%+0%+10%+20%+30%
GHG (kg-CO2·equiv. ·kg-dried·rice−1)2.92.62.42.22.0
Water consumption (m3·kg-dried·rice−1)3.43.12.82.62.4
Energy consumption (MJ·kg-dried·rice−1)19.017.315.914.813.8
Annual net income (TWD·fen−1)5178753098821223414586
Table 11. Rice yield needed for the virtual organic farm, Houbi, to have equivalent impact and income as other farms (unit: kg-dry·grain·fen−1·y−1).
FarmsEquivalent
GHG EmissionsWater ConsumptionEnergy ConsumptionNet Income
Organic farm, Luoshan10732542405912
Conventional farm, Houbi124611429801125
Table 12. Effect of saving 1 m3 water on GHG emissions and rice production. Assessments made based on conventional farms in Houbi and organic farms in Luoshan.
Fallow CSkg-CO2·equiv.kg-dry·grain
First CS, conventional–0.44–0.64
Second CS, conventional–0.94–0.57
First CS, organic–0.13–0.12
Second CS, organic–0.17–0.13

