Abstract
Small and medium enterprises (SMES) play an important role in Taiwan’s economy. The reduction of energy costs and carbon dioxide (CO2) emissions are critical to preserving the environment. This paper uses the experimental results from 65 sites, gathered over two years since 2012, to determine how the integration of Internet communication, cloud computing technologies and a cloud energy management service (cloud EMS) can reduce energy consumption by cost-effective means. The EMS has three levels: infrastructure as a service (IaaS), platform as a service (PaaS) and software as a service (SaaS). Working jointly with ChungHwa Telecom, Taiwan’s leading telecom service provider, data from detection devices, control devices, air-conditioning and lighting systems are all uploaded to a cloud EMS platform, to give a so called intelligent energy management network application service platform (IEN-ASP). Various energy saving management functions are developed using this platform: (1) air conditioning optimization; (2) lighting system optimization; (3) scheduling control; (4) power billing control and (5) occupancy detection and timing control. Using the international performance measurement and verification protocol (IPMVP), the energy used at the test sites, before and after the use of the IEN-ASP, are compared to calculate the energy saved. The experimental results show that there is an average energy saving of 5724 kWh per year, which represents a saving ratio of 5.84%. This translates to a total reduction in CO2 emissions of 9,926,829 kg per year. Using the data collected, a regression model is used to demonstrate the correlation between the power that is consumed, the energy that is saved and the area of the sites. Another interesting result is that, if the experimental sites are maintained by experienced electricians or other personnel and EMS protocols are followed, the energy saving can be as great as 6.59%.
1. Introduction
According to Taiwan's Ministry of Economic Affairs (MoEA), in 2014, the total number of small and medium enterprises (SMEs) was 1,353,049, which was 1.64% more than the number for 2013 [1]. Significantly, these SMEs accounted for 97.61% of all Taiwanese enterprises. By the MoEA’s definition, a SME is an enterprise that has a paid-in capital of NT$80 million (US$2.4 million) or less, or which has an annual revenue of NT$100 million (US$3.0 million) or less [1]. In terms of production activity, electricity consumption is an important ratio of cost. The price of oil influences the price of electricity and the oil price was US$55 per barrel in 2014. This figure will increase to US$79 by 2019, which represents a predicted 43% increase in the price of oil [2]. Therefore, many SMEs operate on thin margins, which renders them vulnerable to cost increases. The predicted increase in electricity over the next few years means that with limited capital to spend on upgrading facilities or equipment to improve energy efficiency, Taiwanese SMEs must become more efficient in their use of energy.
EMS provides an ideal methodology for the efficient use of energy. EMS began using a central control unit and line communications, but in 1982, a microcomputer-based EMS was introduced [3]. By 1986, computerized EMS enabled better energy consumption control by allowing communication with other computers [4]. This greater computing power allowed the development of an industrial energy accounting and control system that provided an information-based saving tool [5] Using this powerful tool, energy intensive industries, such as the petrochemical and steel industries, realized savings in energy consumption of 10%~20%. A de-centralized EMS was presented in 1989 [6]. In 1995, an Ethernet based EMS was proposed, to manage a distributed area. This system allowed real-time data acquisition [7]. After 1995, EMS involved using computers to analyze energy information and to communicate via the Ethernet, which is a standard international structure for linking data. The widespread adoption of Ethernet communication also paved the way for future cloud computing technologies, and there were many reported instances of significant energy savings. By 2000, the joint management of energy and the environment became necessary [8] and the management fields expanded. EMS was an energy saving tool that also allowed a reduction in the amount of raw materials that were necessary for production.
When energy prices rose, the use of EMS became more common in the industrial sector. Using a visualization technique, plant could operate more efficiently. The architecture of EMS became subject to standardization when ISO 50001 was introduced in 2012 [9]. The ISO standard 50001:2011 enabled companies and other institutions to achieve a sustainable reduction in energy consumption by systematically controlling consumption, introducing documentation and increasing the awareness of relevant personnel [10]. Long-term energy savings of more than 20% became possible for many enterprises. For energy-intensive industries, a 13% energy saving was possible if energy management were placed on a strategic agenda [11]. Using ISO standards, an EMS-based approach to produce energy efficient factories was reported in 2013 [12]. In 2014, a review paper demonstrated an optimal energy management system that combined cooling, heating and a power micro-grid [13]. A computer-based EMS with Ethernet communication that was connected to the Internet could collect all energy related data and analyze it using data mining and optimization tools.
Until the early 1990s, EMS systems commonly used proprietary hardware and operating systems. As these proprietary systems become costly and uneconomical, cloud-computing technology began to replace traditional EMS and it became possible to provide a wider range of energy management services. In 2011, a more advanced energy saving system, IEN-ASP was presented. This study uses this IEN-ASP to give greater power efficiency and cost savings and better management in an all-in-one solution and provided a pragmatic and low-cost way for SMEs to save energy. Using a cloud EMS platform from Chunghwa Telecom, the IEN-ASP allows real-time monitoring of energy consumption, which allows SMEs to take timely actions to reduce energy consumption. In this study, 65 sites used the IEN-ASP. The energy savings realized were analyzed using a linear regression method for modeling. The results demonstrate that the IEN-ASP realizes a reduction in energy consumption.
2. The Cloud Energy Management Service (Cloud EMS)
A cloud EMS has three types of service: Infrastructure as a Service (IaaS), Platform as a Service (PaaS) and Software as a Service (SaaS). IaaS is a provision model that manages the equipment that is used for services. PaaS allows applications or services to be used without the complexity of buying and managing the underlying hardware and software. SaaS is a development platform that allows the continuous improvement of the cloud service. This system optimizes a system to allow greater energy savings. Using IPMVP, the M&V system was combined with the iEN to create a new business model. Over 70% of the sites and facilities that were managed by iEN experienced an immediate payback, whereby the monthly service fee was covered by the savings in energy costs. The major benefit of a cloud EMS is that it provides an innovative business model that reduces the cost of the service and can produce an immediate payback, so its use as an energy saving management service should become more widespread [14].
The infrastructure of an IEN-ASP is shown in Figure 1. It includes IaaS, PaaS, SaaS. The IaaS comprises a sensor platform that measures energy use and environmental information. This platform uses distributed sensors, digital power meters and information systems, such as occupancy information and electricity billing systems [15]. The equipment has various sensors for collecting environmental data at the loading end and these measure temperature, humidity and CO2. The collected data and the status of the equipment are then sent back to the PaaS, which is the IEN-ASP management platform for the Internet. Enterprises can configure power consumption settings and manage power dynamically using the Internet browser. The SaaS function of the IEN-ASP provides recommendations that allow enterprises to optimize their energy conservation plans, ramp up their operational environments and enforce corporate energy management policies.
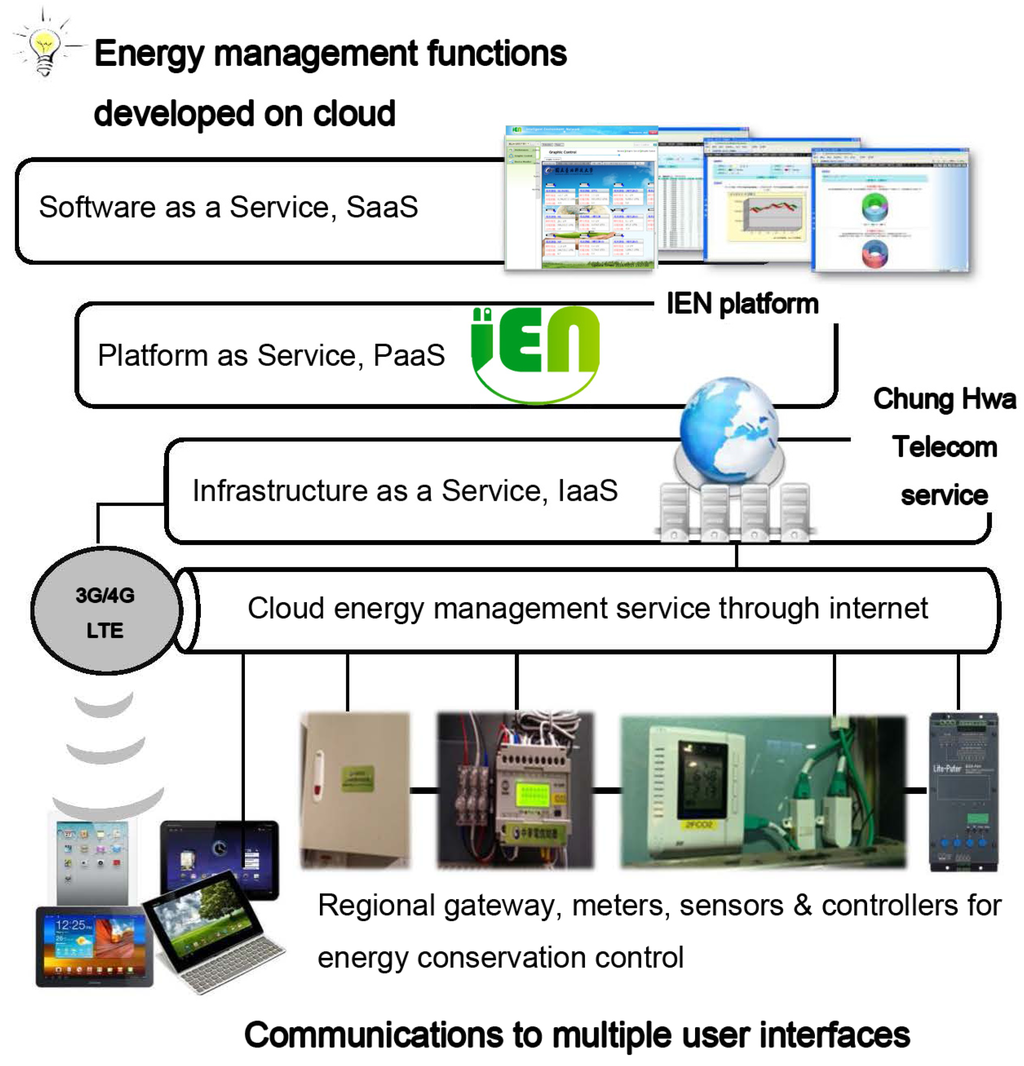
Figure 1.
The infrastructure of a intelligent energy management network application service platform (IEN-ASP) (energy management functions developed on cloud).
In Figure 1, it is seen that the most vital element in the cloud EMS is the SaaS, which is software that starts to function immediately when massive quantities of data are transmitted from the sensors to the platform. Using the software functions, the optimal use of energy is ensured. Backstage platform software services include optimization of the air conditioning (AC) system optimization and the lighting system, control of scheduling and the power facility, occupancy detection and control of timing switches.
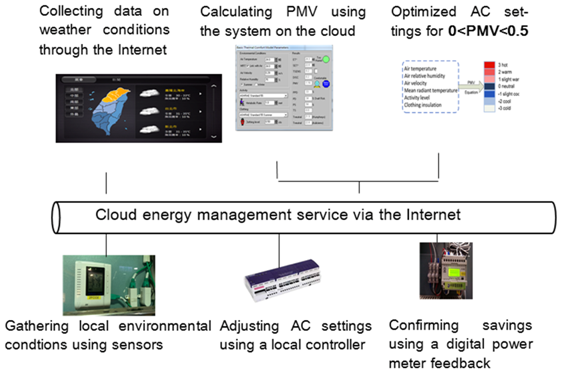
The primary function of a cloud EMS is the optimization of the air conditioning (AC) system. A digital meter monitors the energy consumption for the site and the environment and this information is sent to a cloud energy management service system. The server in the cloud analyzes the status of the outdoor environment, the indoor environment and the energy that is being used. It also calculates the energy consumption according to the IPMVP and ensure the optimal use of the AC equipment using the cloud.
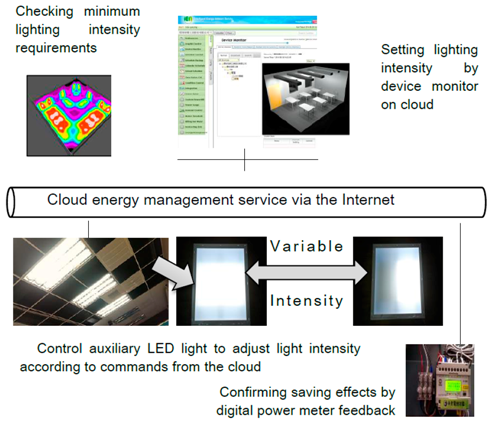
The second function is the optimization of the lighting system. Illumination sensors and digital meters control LED lights and upload the energy consumption data to the cloud system. The server in the cloud adjusts the light intensity via the Internet to ensure the minimum energy consumption.
The third function is the control of scheduling. A task schedule is uploaded to the cloud system and the server controls the operation of the local device via the Internet. The scheduling control function optimizes the scheduling between each system group while allowing all groups to operate simultaneously and independently, in a programmed schedule that avoids excessive waste of energy.
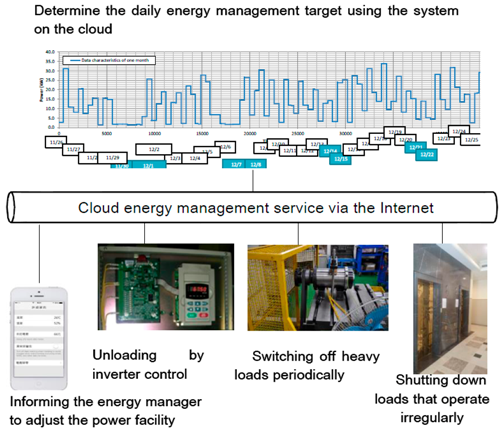
The fourth function is the control of the power facility. The power facility control maintains normal operation of the equipment to avoid the waste of energy due to insufficient power output or other causes of power leakage. The system in the cloud records and analyzes the daily energy used. The system also adjusts the power facilities in line with the daily pattern or the demand response (DR) from the power center. Adjustment is performed using energy managers, an inverter control and periodic switching off and shutting down when an operation is irregularly performed. However, careful monitoring is also required to avoid the concurrent activation of equipment, which results in excessive power consumption. Excessive power consumption during peak hours increases the electricity costs and skilled personnel can reduce this cost.
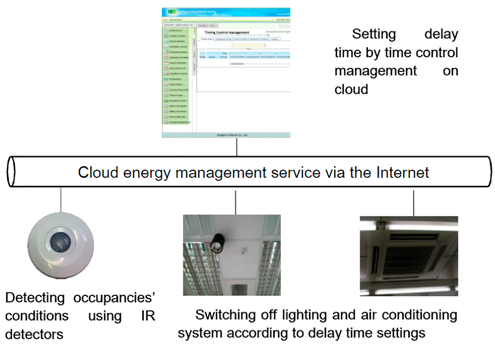
The fifth function is occupancy detection and timing of on/off switches. Infrared detectors detect the occupancy of an indoor space. If the indoor space is unoccupied for a certain period, the cloud system switches off the lighting and air conditioning systems using the delay time settings. This function prevents the waste of energy over long periods, as shown in Table 1.

Table 1.
Energy management functions developed on the cloud.
The five functions that are defined in Table 1 are the key procedures for energy conservation. This study used 65 different categories and sizes of testing sites, and fully implemented the five functions of SaaS in the experiment. The information for each experimental site is described in the following section.
3. The Calculation of Energy Efficiency
The IPMVP recommended four options (A, B, C and D) to measure energy savings, depending on the system configuration and data availability [16]. For systems which allow direct of measurement of energy consumption affected by the installed ECM without considering the remaining facilities, options A and B should be applied. For systems which does not allow direct measurement of energy consumption, the IPMVP suggest using the remaining two options to determine the indirect energy saving performance at facility level. Option C accesses the performance of the ECM by means of comparing the utility bills before and after the implementation. For system with insufficient or unreliable energy consumption data, the final option D is recommended to perform assessment through simulation of equipment or facilities [15].
This research spanned two years, with the first year acting as the baseline. In the second year, the IEN-ASP was implemented at the sites. The data for the two years were compared to determine the amount of energy saved (kWh). The calculation for energy savings that is described below uses the IPMVP’s method to calculate energy savings.
The energy used before and after the implementation of the IEN-ASP is compared on a consistent basis, as shown in the following general Equation (1):
Adjustments are made to factor in the physical changes or changes to equipment at the test sites. For example, in a manufacturing plant, obsolete machines might be replaced by newer models, which consume different amounts of energy. The authors use two types of adjustments: routine and non- routine conditions (such as, various occupancy capacity, or producing amount of factory) for this research. Therefore, Equation (1) could be modified as:
According to Equation (2), the percentage of energy saved is calculated as:
Saved Energy (%) = (Normalized Energy Savings ÷ Baseline Energy Consumption) × 100%
The savings in electrical energy savings are translated into a reduction in carbon emissions using Equation (3):
where the electricity emission factor for CO2 is 0.521 kg CO2e/kWh, as defined in 2015 by the Bureau of Energy of the Ministry of Economic Affairs.
4. The Experimental Sites
This study collected data from sites with a variety of purposes, such as stores, restaurants, office buildings, schools, transportation stations, libraries, multi-purpose buildings and manufacturing plants. The information includes the category and the details (such as energy consumption or the number of people using power).
For each test site, the area, the annual energy consumption, the main energy consuming equipment and the number of pedestrians are shown. The areas of the 65 testing sites range from 18.2 m2 to 1,188,004 m2 and the annual energy consumption ranges from 61,773 kWh to 8,553,600 kWh. The main energy consuming equipment includes air conditioning systems, lighting systems and other equipment. The number of pedestrians ranges from 50 to 10,500 per hour during peak hours. This study determines the energy savings that are realized by using a cloud EMS and the feasibility of economically expanding this service. The energy savings for each site are also compared to determine the best means of reducing energy consumption. Sites 36 to 65 had experienced electricians or related personnel who could make timely adjustments in accordance with the suggestions and protocols of the IEN-ASP.
The IEN-ASP has several significant properties. Firstly, by alerting subscribers via email or text messages, the IEN-ASP provides power management and environment surveillance. It also provides recommendations and analytical data that allow enterprises to optimize their energy conservation plans. Secondly, the system provides occupancy data and automated timing for on/off switches. The IEN-ASP also provides enough flexibility for subscribers to make adjustments manually. For example, a rush order for a manufacturing plant might mean that all of the machines are operated at full utilization rates, even when electricity rates are at a peak. Excessive power consumption during peak hours results in higher electricity bills. For retail or department stores, store managers can adjust the room temperature in accordance with the number of customers in the store. Therefore, experienced managers or technicians can make timely adjustments in accordance with the suggestions and protocols of the IEN-ASP to improving the energy savings ratio. Thirdly, a fully automated energy savings system is significantly more costly for SMEs. Depending on the number of sensors that are installed, the total installation cost might be NT$5000–20,000 (US$164–655). However, the users of IEN-ASP do not need to purchase the sensors; they only pay a monthly fee for the IEN-ASP of NT$400 (US$13) per sensor, which is an acceptable cost for most Taiwanese SMEs.
In Taiwan, the price of each kWh is based on a basic generation fee and a delivery service charge [17]. In addition to tiered rates, seasonal rates are also charged for electricity, so electricity costs are greater in the summer. The electricity price also depends on the time of the week and the day. Weekdays and early mornings and late nights have the most expensive rates.
5. Results and Discussion
5.1. Energy Consumption and the Savings Ratio
To monitor the energy consumption for the 65 testing sites, various sensors were installed. In stores, sensors were installed to monitor the energy consumption and the power consumed for air conditioning and illumination. In manufacturing sites, power meters were installed on the assembly lines to monitor the equipment’s power consumption. When the power consumption reached the scheduled loading, the energy savings system immediately sent an email or phone message to alert a technician or other personnel about unnecessary waste of energy. The results for energy consumption and the energy saved over two years are shown in Table 2:

Table 2.
A comparison of energy consumption and the energy saved.
The energy savings for Table 2 are shown in Figure 2. Figure 2 shows that the energy savings for test sites 1 to 35 are less than those for test sites 36 to 65. The average savings ratio for test sites 1 to 35 is 2.93% and sites 36 to 65 recorded an average savings ratio of 9.23%. The average energy saving for the 65 sites is 293,089 kWh, which is equivalent to a reduction in CO2 emissions of 9,926,829 kg. Figure 3 shows that the median of saved energy amount for the 65 sites is 5724 kWh per year. The average energy savings for sites 1 to 35 is 11,774 kWh per year, which equates to a reduction in CO2 emissions of 214,697 kg per year, and the average energy savings for sites 36 to 65 is 621,290 kWh per year, which is equivalent to a reduction in CO2 emissions of 9,712,132 kg per year. Therefore, the CO2 savings for sites 36 to 65 are more than those of test sites 1 to 35. The amount of CO2 saving is 9,497,435 kg per year. The difference in these average figures may be due to the physical properties of the test sites or the type of business. This is discussed further in the following section.
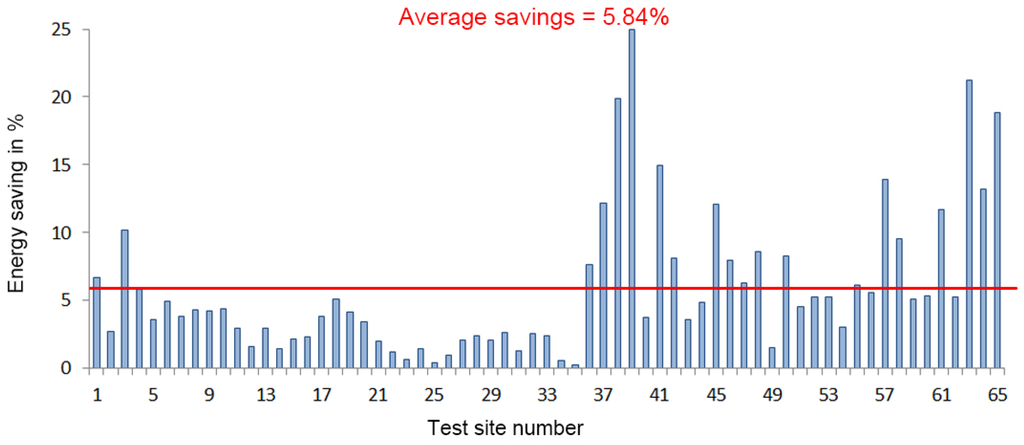
Figure 2.
Energy savings for 65 testing sites.
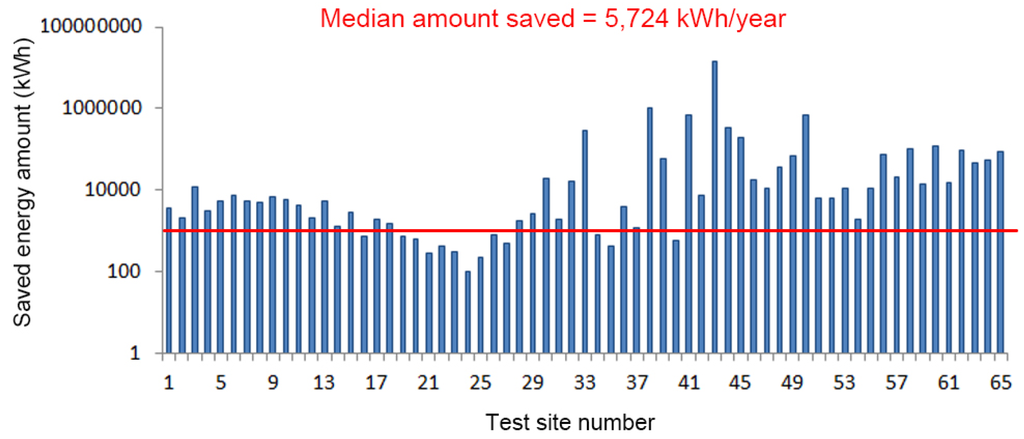
Figure 3.
Amount of saved energy for 65 testing sites.
5.2. Regression analysis
A regression analysis is used to derive any correlation with energy savings, in order to determine any pattern in the energy savings. The relationships between the amounts of energy saved and the baseline energy consumption and the areas of the 65 testing sites are shown in Figure 4. Two test sites, numbers 4 and 43, are either undersize or oversize, so the data for these two test sites is omitted from the regression analysis model. The results of the regression analysis for the 63 sites are shown in Figure 5.
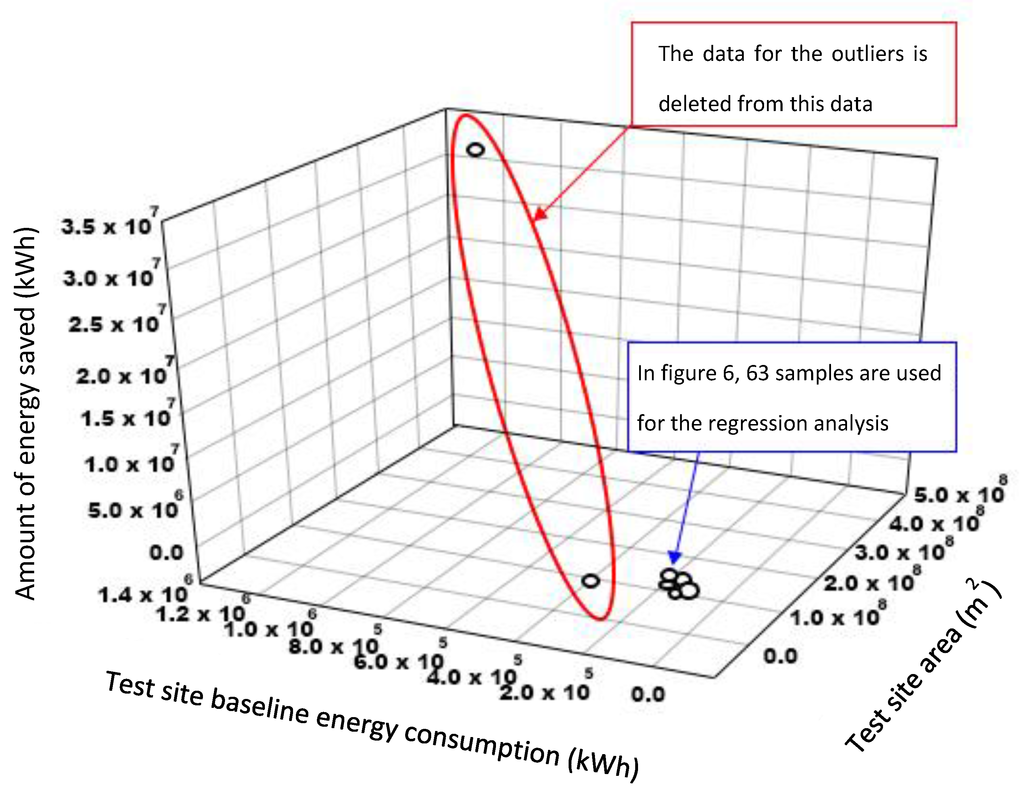
Figure 4.
The distribution of the 65 test sites, with regard to the amount of energy saved, the baseline energy consumption and the area of the site.
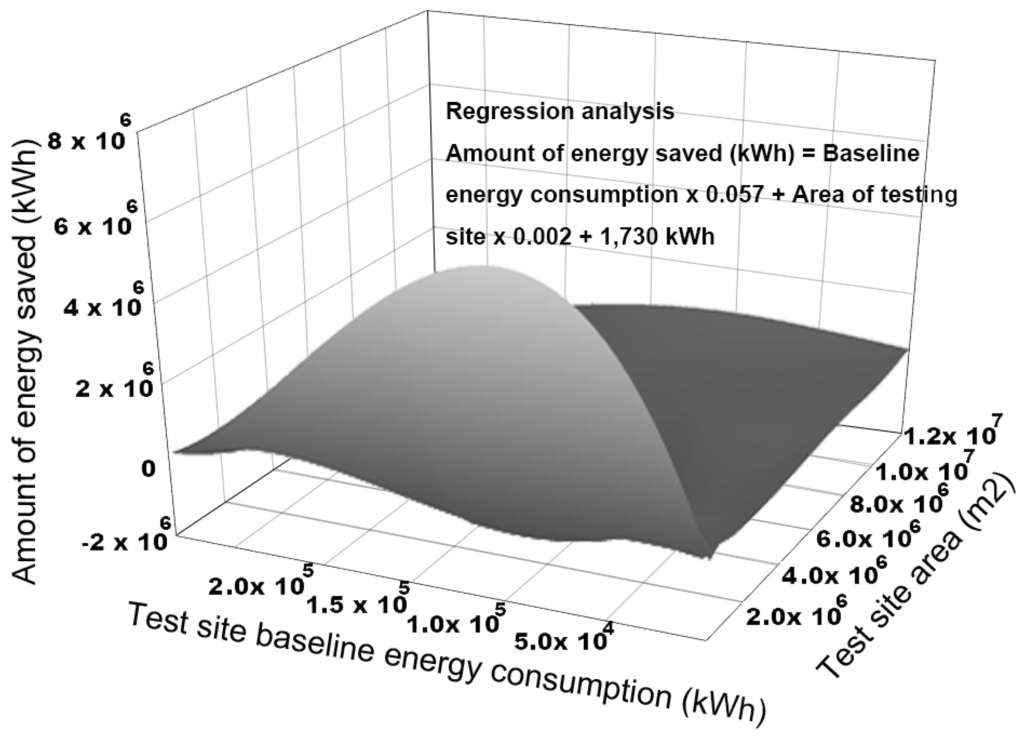
Figure 5.
The regression analysis for the 63 test sites, based on the amount of energy saved, the baseline energy consumption and the area of the site.
In Figure 6, the regression model for the 63 testing sites is expressed using the following Equation (5).
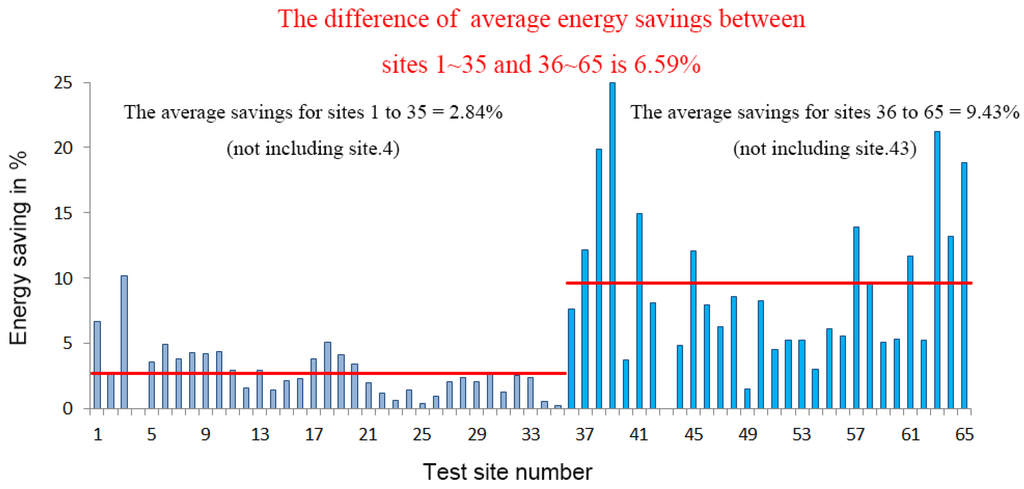
Figure 6.
Experienced electricians or related personnel can make timely adjustment to the energy saving equipment, which produces better results.
In Equation (5), the regression model shows that the amount of energy saved increases linearly with the baseline energy consumption and the gradient is 0.057. There is also a linear relationship between the amount of energy saved and the test site area and the gradient is 0.002 kWh/M2. The R2 between the amount of energy saved and the baseline energy consumption is 0.8944. A coefficient of 0.057 is similar to the average energy saved for the 63 test sites, or 5.87%. This indicates that the results from the regression model are in good agreement with the practical situation.
5.3. The Effect of Experienced Electricians or Related Personnel on the Test Sites
To determine the difference in the average amount of energy that is saved for test sites 1 to 35 (not including site 4) and for sites 36 to 65 (not including site 43), Figure 6 shows a review of the details for the 63 test sites. The results demonstrate that test sites 36 to 65, which have experienced electricians or related personnel, save more energy than test sites 1 to 35, which do not have trained personnel. Experienced managers or electricians can make timely adjustments in line with the suggestions and protocols of IEN-ASP, which results in an improvement in the energy savings ratio as excessive power usage during peak hours. In this paper, the term, “trained electricians”, refers to any IEN-ASP user who has attended two hours of classes on IEN-ASP energy-saving methods and interpretation.
These personnel understand the IEN-ASP system and can use it to realize energy savings. A surge in use during the middle of the night and outside normal business hours is seen. Trained users can monitor the results and can easily identify abnormal electricity consumption outside normal business hours and make the necessary improvements. This avoids excessive use of electricity, reduces costs and maintains the equipment in good operating condition. Therefore, the energy savings for test sites 1 to 35 (not including site 4) are less than those of test sites 36 to 65 (not including site 43), as shown in Figure 6. The average savings for test sites 1 to 35 (not including site 4) are 2.84% and those for test sites 36 to 65 (not including site 43) are 9.43%. There is a 6.59% difference in the energy savings, the presence of trained electricians increases energy savings when IEN-ASP is used.
6. Conclusions
In 2012, a cloud energy management system IEN-ASP, was proposed by the authors and ChungHwa Telecom. The structure of the IEN-ASP includes IaaS, PaaS and SaaS. Using this structure, five main functions, the optimization of the air conditioning (AC) system and the lighting system, scheduling control, power facility control, occupancy detection, and the on/off control for timing switches, are developed. For two years, from 2012, the IEN-ASP service was tested at 65 sites of various uses and sizes, such as stores, offices, hotels, schools and factories.
Based on the results for the use of IEN-ASP at the test sites, the median amount of energy saved is 5724 kWh and the average savings ratio is 5.84%, which translates to a total reduction in CO2 of 9,926,829 kg per year. The main variable factors are site area and the annual energy consumption. The regression model for the data shows a coefficient of correlation between the amount of energy saved and the baseline energy consumption of 0.057. The coefficient of correlation between the amount of energy saved and the test site area is 0.002. The R2 value is 0.8944. The experiment also shows that the cloud EMS service, namely the IEN-ASP, produces greater energy savings if the equipment and systems are managed by experienced electricians or related personnel, with incremental savings of 6.59%. The total CO2 savings of test sites between with and without experienced electricians or related personnel is 9,497,435 kg of CO2 per year. Currently IEN-ASP is still in the early stages of promotion and there is a limited number of subscribers, so the installation cost is greater, there is a higher monthly subscription and the payback period for SMEs is longer. Using the data and experimental results of this study, telecommunication providers continue to promote the IEN-ASP. An increase in the number of subscribers will result in a lower monthly subscription and a smaller installation cost per unit, which will make IEN-ASP more accessible to the greater public.
Acknowledgments
This study is supported by the Ministry of Science and Technology of the Republic of China, National Taipei University of Technology’s Energy Technology Research Center, Graduate Institute of Environmental Engineering of National Taiwan University, Chunghwa Telecom, and the Ministry of Economic Affairs of the Republic of China. The authors deeply appreciate the institutes and agencies mentioned above for their support.
Author Contributions
Yen-Chieh Tseng, DaSheng Lee, Cheng-Fang Lin conceived and designed the experiments; Yen-Chieh Tseng and DaSheng Lee performed the experiments; Yen-Chieh Tseng and DaSheng Lee analyzed the data; DaSheng Lee and Cheng-Fang Lin contributed equipment/materials/analysis tools; Cheng-Fang Lin and Ching-Yuan Chang contributed discussion and suggestions; Yen-Chieh Tseng wrote the paper.
Conflicts of Interest
The authors declare no conflict of interest.
References
- Ministry of Economic Affairs (MoEA) Website. Available online: https://www.moea.gov.tw/Mns/dos/content/ContentLink.aspx?menu_id=6852 (accessed on 20 May 2015).
- Arezki, R.; Blanchard, O. The 2014 Oil Price Slump: Seven Key Questions. Available online: http://voxeu.org/article/2014-oil-price-slump-seven-key-questions (accessed on 11 May 2016).
- Capehart, B.L.; Muth, E.J.; Storin, M.O. Minimizing residential electrical energy costs using microcomputer energy management systems. Comput. Ind. Eng. 1982, 6, 261–269. [Google Scholar] [CrossRef]
- NHO Website. Available online: http://www.nho.no (accessed on 19 December 2014).
- Consonni, A.; Lesourd, J.B. Industrial energy accounting and control systems: A survey. Energy Conv. Manag. 1986, 26, 357–361. [Google Scholar] [CrossRef]
- Chapman, D.J.; Palmer, A.H.; Leuer, J.F. A case study in change from a centralized energy management system to a decentralized one. IEEE Trans. Power Syst. 2002, 5, 1517–1523. [Google Scholar] [CrossRef]
- Pillai, M.K.G.; Ramakrishna, V.; Agrawai, V.K. Real time data acquisition and energy management system using distributed computer architecture. In Proceedings of the IEEE/IAS International Conference on Industrial Automation and Control, Hyderabad, India, 5–7 January 1995; pp. 427–434.
- Amundsen, A. Joint management of energy and environment. J. Clean. Prod. 2000, 8, 483–494. [Google Scholar] [CrossRef]
- Fiedler, T.; Mircea, P.M. Energy Management Systems according to the ISO 50001 Standard—Challenges and Benefits. In Proceedings of the 2012 International Conference on Applied and Theoretical Electricity (ICATE), Craiova, Romania, 25–27 October 2012.
- OHP Automation Systems GmbH. GreenControl—Energiemanagement nach ISO50001, EMS-Lösungen aus Einer Hand. Available online: http://www.ohp.de/de/prospekte/GreenControl.pdf (accessed on 28 December 2014).
- Rudberg, M.; Waldemarsson, M.; Lidestam, H. Strategic perspectives on energy management: A case study in the process industry. Appl. Energy 2013, 104, 487–496. [Google Scholar] [CrossRef]
- Muller, E.; Poller, R.; Hopf, H.; Krones, M. Enabling Energy Management for Planning Energy-Efficient Factories. Procedia CIRP 2013, 7, 622–627. [Google Scholar] [CrossRef]
- Gu, W.; Wu, Z.; Bo, R.; Liu, W.; Zhou, G.; Chen, W.; Wu, Z. Modeling, planning and optimal energy management of combined cooling, heating and power microgrid: A review. Electr. Power Energy Syst. 2014, 54, 26–37. [Google Scholar] [CrossRef]
- Cheng, C.C.; Lee, D.S.; Wang, C.H.; Lin, S.F.; Chang, H.P.; Fang, S.T. The Development of Cloud Energy Management. Energies 2015, 8, 4357–4377. [Google Scholar] [CrossRef]
- Tseng, Y.C.; Lee, D.S.; Lin, C.F.; Chang, C.Y. A novel sensor platform matching the improved version of IPMVP option C for measuring energy savings. Sensors 2013, 13, 6811–6831. [Google Scholar] [CrossRef] [PubMed]
- U.S. Department of Energy. International Performance Measurement and Verification Protocol: Concepts and Options for Determining Energy and Water Savings; U.S. Department of Energy: Oak Ridge, TN, USA, 2007; Volume 1, pp. 16–19.
- Taiwan Power Company. Taiwan Power Company Rate Schedules. Available online: http://info.taipower.com.tw/TaipowerWeb/upload/files/4/RateSchedules.pdf (accessed on 28 June 2015).
© 2016 by the authors; licensee MDPI, Basel, Switzerland. This article is an open access article distributed under the terms and conditions of the Creative Commons Attribution (CC-BY) license (http://creativecommons.org/licenses/by/4.0/).
