Article

Influence of Tillage Practices and Crop Type on Soil CO2 Emissions

Department of General Agronomy, Faculty of Agriculture, University of Zagreb, Svetošimunska cesta 25, Zagreb 10-000, Republic of Croatia
*
Author to whom correspondence should be addressed.
Sustainability 2016, 8(1), 90; https://doi.org/10.3390/su8010090
Submission received: 11 December 2015 / Revised: 11 January 2016 / Accepted: 11 January 2016 / Published: 19 January 2016
(This article belongs to the Section Environmental Sustainability and Applications)

Abstract

:
Nonsustainable agricultural practices often lead to soil carbon loss and increased soil carbon dioxide (CO2) emissions into the atmosphere. A research study was conducted on arable fields in central lowland Croatia to measure soil respiration, its seasonal variability, and its response to agricultural practices. Soil C-CO2 emissions were measured with the in situ static chamber method during corn (Zea mays L.) and winter wheat (Triticum aestivum L.) growing seasons (2012 and 2013, n = 288) in a field experiment with six different tillage treatments. During corn and winter wheat growing season, average monthly soil C-CO2 emissions ranged, respectively, from 6.2–33.6 and 22.1–36.2 kg ha−1 day−1, and were decreasing, respectively, from summer > spring > autumn and summer > autumn > spring. The same tillage treatments except for black fallow differed significantly between studied years (crops) regarding soil CO2 emissions. Significant differences in soil C-CO2 emissions between different tillage treatments with crop presence were recorded during corn but not during winter wheat growing season. In these studied agroecological conditions, optimal tillage treatment regarding emitted C-CO2 is plowing to 25 cm along the slope, but it should be noted that CO2 emissions involve a complex interaction of several factors; thus, focusing on one factor, i.e., tillage, may result in a lack of consistency across studies.

1. Introduction

Of many greenhouse gases, carbon dioxide is an important compound that affects the processes of global warming and is considered as an initiator of global climate change. In view of the heavy demands for agricultural production to meet the needs of the growing population, the role of agricultural practices and their impact on soil, climate, gaseous emission, water resources, biodiversity and others must be considered more now than in the past [1]. The soil as a potential sink for carbon can be a key factor in addressing climate change; it is the second- largest carbon reservoir, and contains twice as much carbon in relation to the atmosphere [2,3], three times more carbon compared to vegetation [4] and is also an important sink of atmospheric CO2 [5]. The reduction of CO2 emissions by soil carbon sequestration is of primary importance, as agricultural and forestry practices could remove atmospheric carbon by sequestration and thus mitigate climate change by maintaining and/or increasing the amount of carbon stored in the soil and plant material [6].
Soil respiration is estimated to be about 98 Pg C per year, making it the largest contributor to C fluxes from terrestrial ecosystems to the atmosphere [7]. Soil respiration is the result of complex interactions between biotic and abiotic factors [8]. Excessive tillage, burning of crop residues, application of large amounts of fertilizers or changes in soil-air-water relation lead to higher CO2 emissions into the atmosphere and reduction of soil carbon content [9]. Studies have shown that factors such as agrotechnical measures, agroclimatic factors, physical, chemical and biological properties of the soil, presence and type of vegetation and many other factors have great influence on soil CO2 emissions [2,8,10,11,12].
Tillage has a very important impact on soil CO2 emissions [13]. Tillage causes a loss of organic carbon content of about 50% due to the stimulation of aerobic processes of microbial respiration [14]. Studies have shown contrasting results where CO2 emissions have been both decreased and increased by no-till compared with conventional tillage. Implementation of conventional tillage leads to changes in the soil profile and creates favorable conditions for the organic matter oxidation and mineralization processes, i.e., microbial degradation of plant and animal residues [15,16,17,18]. The intensity of tillage should be reduced in order to reduce the soil carbon loss. Many authors have determined higher soil CO2 emissions under conventional tillage compared to no-tillage [19,20,21,22], an increase in soil organic carbon content and lower soil CO2 emissions on no-tilled soils compared to conventional tilled soils [23] as no-tillage reduces the diffusion and content of air-filled pores in the soil, by which soil CO2 emissions are very low or non-existing [24]. On the other hand, implementation of no-tillage can increase soil CO2 emissions due to the maintenance of higher water content in the soil surface layer, which can result in greater soil biological activity. Higher soil CO2 emissions have been determined under no-tillage compared to conventional tillage [25,26,27].
The presence of vegetation also affects soil CO2 emissions, which can be 20% [28] or even 200%–300% times higher [10] in the soils with crop presence compared to black fallow. Soil CO2 emissions are also very dependent on the type and phenophases of crops which, by photosynthesis, absorb CO2 from the atmosphere [29,30,31]. Seasonal variability of soil CO2 emissions is determined in almost all types of ecosystems. Soil respiration is usually the highest in summer, decreases in the colder months and is the lowest in winter. The main factors affecting the seasonal variability may depend on the type of ecosystem and climate of the area. Largest impacts on seasonal variability mostly cause changes in the soil and air temperatures, the soil water content, photosynthesis and/or their interactions. In the spring, the temperature and soil water content are not limiting factors, which results in better crop growth and higher soil respiration. However, in summer, the soil water content is a limiting factor and, in winter, the soil temperature is a limiting factor which results in reduced crop growth and soil respiration. Higher soil CO2 emissions were determined in the warmer months compared to the colder months [22,32,33,34].
The aim of our study was to determine soil CO2 emissions and their seasonal patterns due to the lack of national data which could be used as input data for scientific predictions and impact assessments in the future. Furthermore, the aim was to determine the impact of six different tillage methods and vegetation types on soil CO2 emissions.

2. Materials and Methods

2.1. Field Experiment

The research was conducted on the experimental field that is located on the arable land near Daruvar (ϕ = 45°33′54.22″N, λ = 17°01′45.07″E; 133 m.a.s.l.) and was initiated in 1994, with the aim of determining soil degradation by water erosion. In 2012 the research was extended to the measurement of soil carbon dioxide emissions. The experimental field is located on a slope of 9%, and tillage treatments differ according to the type, depth and direction of tillage. All tillage treatments were applied for corn in 2011–2012 and wheat in 2012–2013. Tillage treatments are:
  • BF25-black fallow, plowing (25 cm) along the slope every year.
  • P25-sowing and plowing (25 cm) along the slope every year
  • NT-no-tillage, sowing directly to the mulch along the slope.
  • P25-sowing and plowing (25 cm) across the slope every year
  • P50-plowing (25 cm) every year + very deep plowing (50 cm) every three to four years across the slope (deep plowing was implemented in 2011).
  • PS50-plowing (25 cm) every year + subsoiling (50 cm) every three to four years across the slope (subsoiling was implemented in 2011).

2.2. Soil Type

Before the beginning of research, soil sampling (0–25 cm) was conducted in order to determine physical and chemical soil properties. Soil belongs to referent soil group of Stagnosol [35], containing 2% coarse sand, 59% fine sand, 24% silt, 15% clay. Soil pHKCl ranged depending treatments 3.8–4.2, humus 0.5%–1.2%, total nitrogen content 0.05%–0.08%, water holding capacity 37.0%–38.8%, soil porosity 38.9%–44.7% and bulk density 1.51–1.58 g cm−3.

2.3. Climate

Climate of the studied area is temperate continental [36]. According to the recent 30-year climate period 1981–2010, average annual air temperature in Daruvar is 11 °C, average annual precipitation is 902 mm, snow cover can be expected from November to April, average annual air pressure is 999 hPa, average monthly relative humidity ranged from 71% to 85%, evapotranspiration is 664 mm per year: water deficit occurs in August and surplus from November to April.

2.4. Studied Cultures

Studied cultures were corn (Zea mays L.) in 2012 and winter wheat (Triticum aestivum L.) in 2013. Tillage practices, fertilization of the fields, planting/harvesting dates, weed and pest control were done according to the traditional agricultural practices in the study area and are shown in Table 1.
Table 1. Field operations in production of studied cultures.
Corn (Zea mays L.)
DateField OperationApplication
16 November 2011FertilizationUrea 46% (200 kg ha1); NPK 7:20:30 (400 kg ha1)
18 November 2011Primary tillage *Ploughing to 25 cm depth
2 March 2012FertilizationKAN 27% N (250 kg ha−1)
29 April 2012Secondary tillage *Disk plow; seedbed preparation
30 April 2012Sowing65,000 plants ha−1
1 May 2012Herbicide applicationRadazin TZ 50 (2.5 L ha−1); Herbotrof (2.5 L ha−1)
1 October 2012Harvest
Winter wheat (Triticum aestivum L.)
DateField OperationApplication
25 October 2012Primary tillage *Ploughing to 25 cm depth
26 October 2012Secondary tillage *Disk plow; seedbed preparation
26 October 2012Sowing7,300,000 plants ha−1
6; 8; 25 March 2013FertilizationKAN 27% N (150; 200; 200 kg ha−1)
21 April 2013Herbicide and fungicide applicationGrandus (24 g ha1); Starane (0.6 L ha1); Axial (0.7 L ha1); Amistar extra (0.8 L ha1)
14 May 2013Fungicide and pesticide applicationPorto (1.5 L ha1); Lambda (0.2 L ha1)
18 July 2013Harvest
* Tillage was conducted at all treatments except no-tillage treatment.

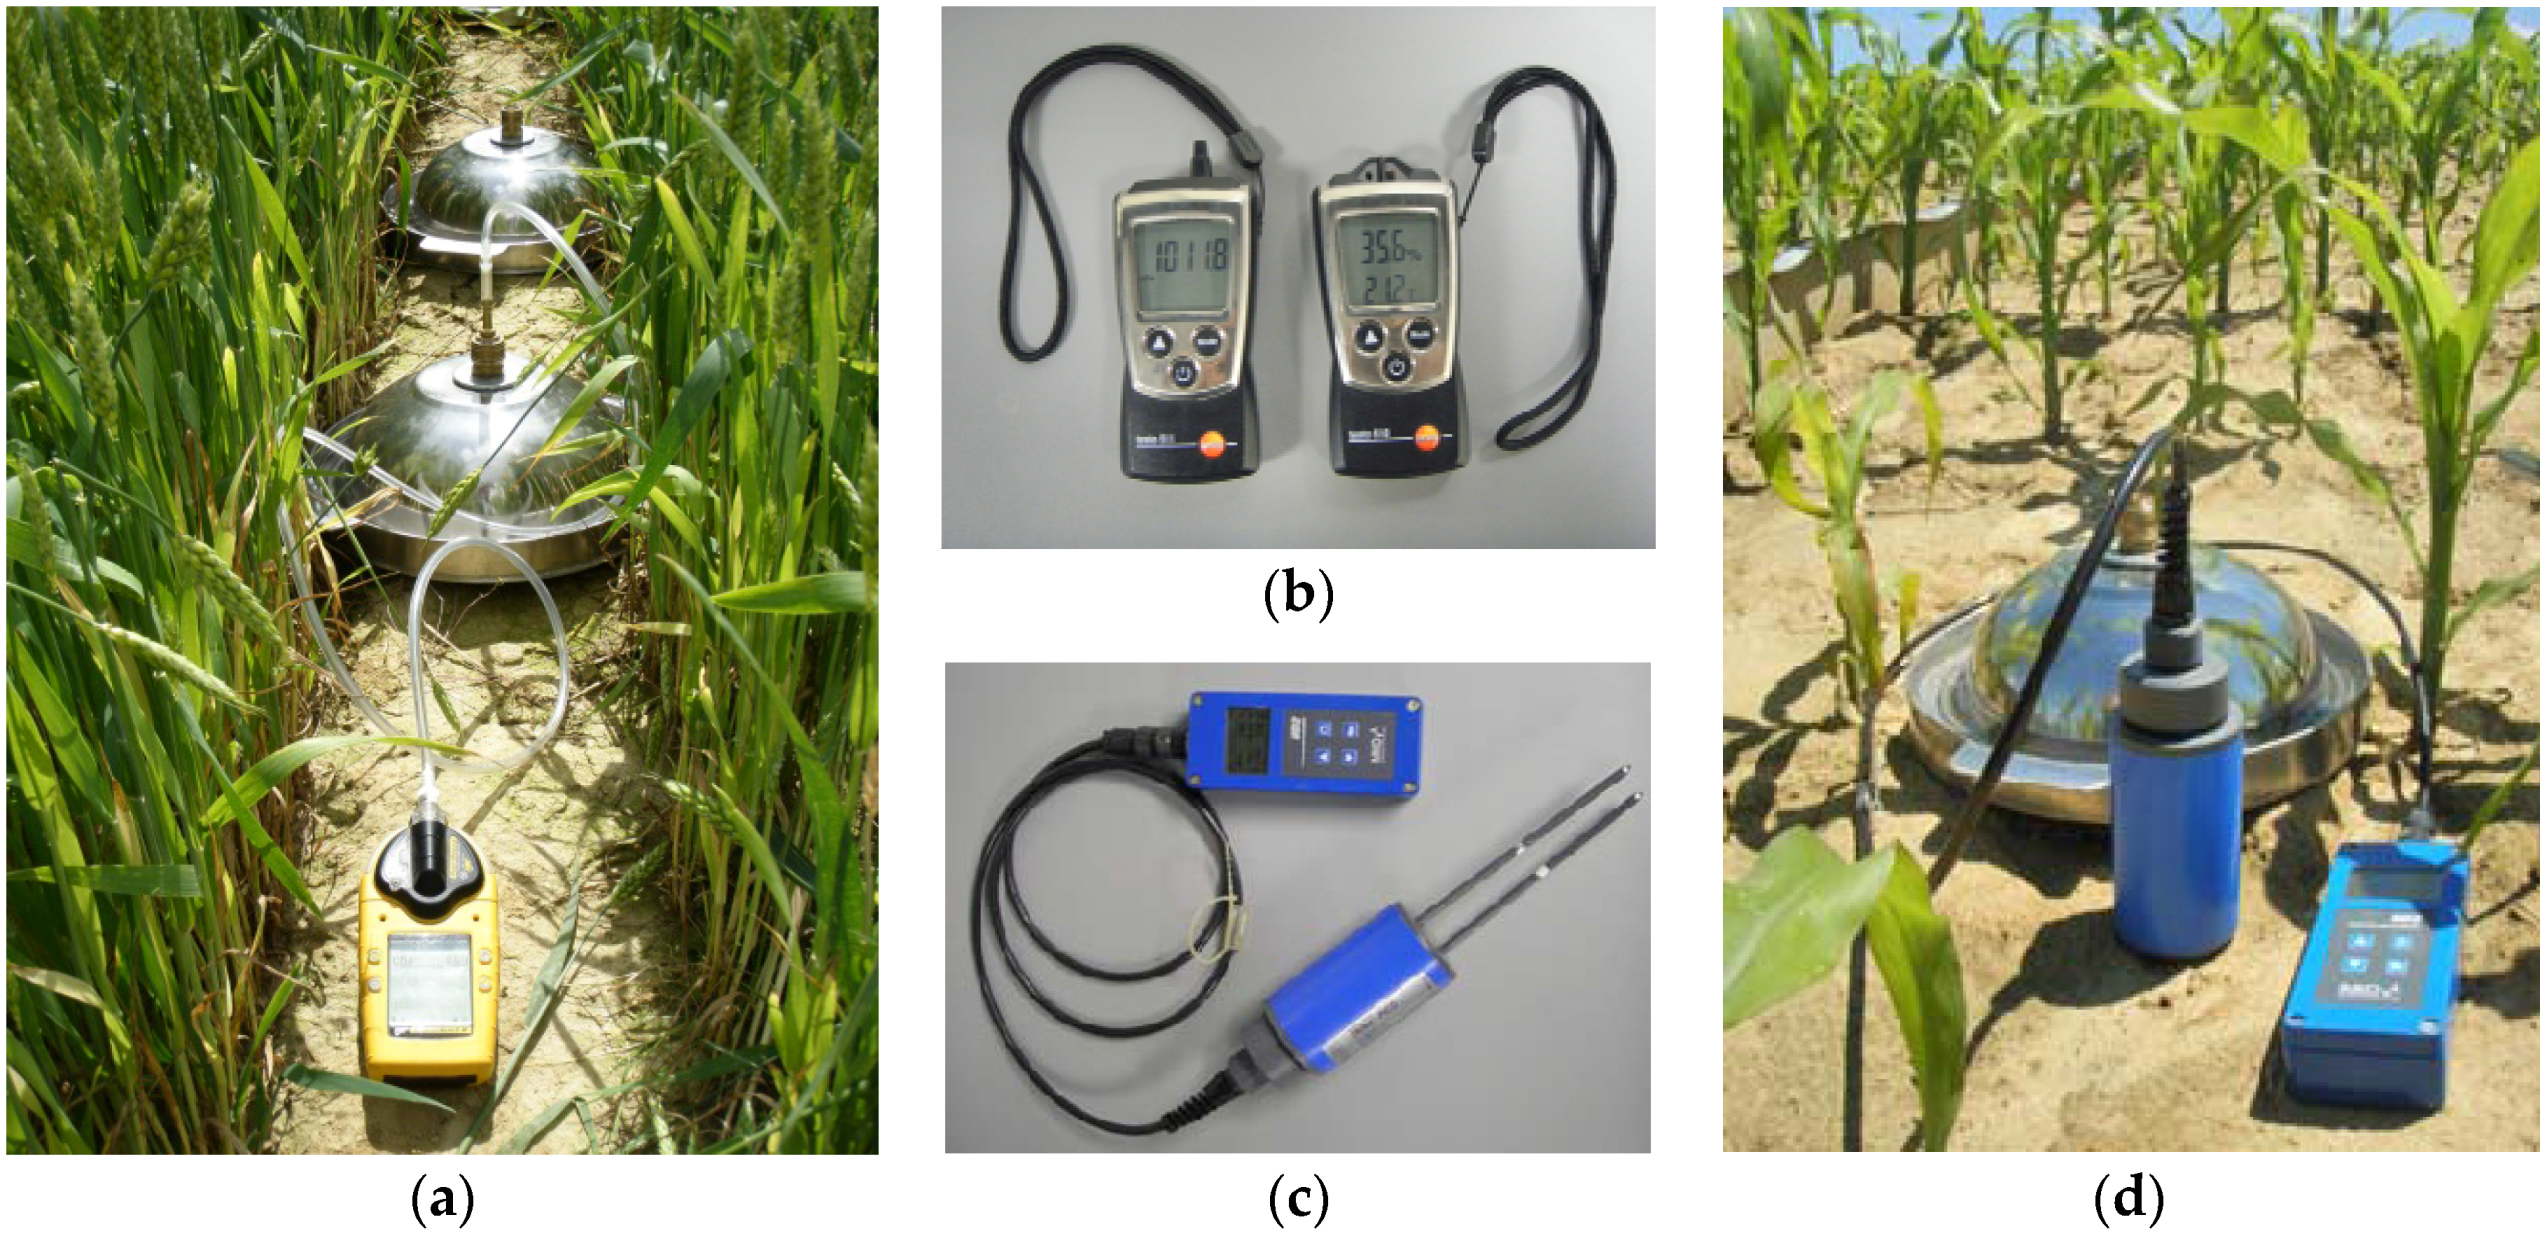
2.5. Measurement of Agroecological Factors and Soil CO2 Concentrations

Field measurements of agroecological factors and CO2 concentrations (Figure 1) were conducted once per month, during two growing seasons in three repetitions at each tillage treatment. Total measurement number of soil CO2 concentrations and agroecological factors was 16 (nine from March to November 2012; seven from April to October 2013). Interpreted seasons of the year imply: spring (March–May), summer (June–August) and autumn (September–November).
Measurements of soil CO2 concentrations were taken in early morning, time was consistent at all samplings and length of total measurement period was about 3 h. Soil CO2 concentrations were measured by in situ static chamber method. Chambers were custom-made (Z. Zgorelec, Faculty of Agriculture University of Zagreb and Tukač company, 2011). They consists of two parts; a circular frame of the chamber and chambers cap (radius 25 cm, height 9 cm). At the beginning of measurement, circular frames were inserted 5 cm in the soil between the plants and the initial CO2 concentration at the soil surface was measured. Afterwards, the chambers were closed with caps and the incubation time was 30 minutes whereupon the accumulated CO2 in the closed chambers was measured. The soil CO2 concentrations were measured with portable infrared detector of carbon dioxide (GasAlerMicro5 IR, 2011). CO2 efflux (kg ha−1 day−1) was afterwards calculated according to Bilandžija et al. [27] as:
FCO2 = [M × P × V × (c2 − c1)]/[R × T × A × (t2 − t1)]
where: FCO2–soil CO2 efflux (kg ha−1 day−1); M–molar mass of the CO2 (kg mol−1); P–air pressure (Pa); V–chamber volume (m3); c1–initial concentration of CO2 (µmol mol−1); c2–concentration of CO2 after incubation time (µmol mol−1); R–gas constant (J mol1 K1); T–air temperature (K); A–chamber surface (m2); t2-t1–incubation period (day).
Air temperature and relative air humidity were measured with Testo 610 (2011), and air pressure with Testo 511 (2011) at height of 0.5 m above soil surface. Soil temperature and soil water content in the soil surface layer (10 cm depth) were measured with IMKO HD2 (2011), in the vicinity of each chamber.
Figure 1. Measurement of agroecological factors and CO2 concentrations: (a) Field measurement of CO2 concentration; (b) Instruments for measurement of air parameters; (c) Instrument for measurement of soil parameters; (d) Field measurement of soil parameters.
Sustainability 08 00090 g001

2.6. Statistical Analysis, Quality Management and Quality Control

All data were analyzed using statistical Software SAS [37]. Variability between treatments were evaluated with analysis of variance (ANOVA) and tested, if it were necessary, with adequate post-hoc (Bonferroni) t-tests. In all statistical tests significance level was 5%. Quality management (QM) system is in line with good laboratory practice and Internal and External (proficiency testing) quality control (QC) were included.

3. Results and Discussion

Analysis of variance (Table 2) showed that all of the studied factors have a significant impact on soil C-CO2 emissions where the greatest impacts were found for: vegetation (F = 169.3; p < 0.0001), tillage (F = 34.7; p < 0.0001), time of measurement (F = 21.6; p < 0.0001), interaction tillage × vegetation (F = 4.9; p = 0.0003).
Table 2. Analysis of variance for soil C-CO2 emissions.
SourceDFSum of SquaresMean SquareF ValuePr > F
Total Model
Model2537,429.31497.226.5<0.0001
Error26214,798.156.5
Corrected Total28752,227.4
Components of Model
Tillage 59791.11958.234.7<0.0001
Time of measurement1417,079.612,120.021.6<0.0001
Vegetation19563.49563.4169.3<0.0001
Tillage × vegetation51389.5277.94.90.0003

3.1. Influence of Vegetation on Soil C-CO2 Emissions

During the corn (n = 162) growing season, the average annual agroecological factors were: soil temperature 25.0 °C, soil water content 23.3%, air temperature 26.7 °C, relative air humidity 40%. During the winter wheat (n = 126) growing season, the average annual agroecological factors were: soil temperature 25.4 °C, soil water content 26.6%, air temperature 28.9 °C, relative air humidity 42%.
Average annual soil C-CO2 emissions were significantly different between studied years and were 40.5% lower during corn compared to winter wheat cultivation, which is probably a result of higher soil temperatures and soil water content, and, as such, led to greater biological activity during wheat cultivation. Also, the higher planting crop density in wheat resulted in higher and denser root biomass near the soil surface with wheat versus corn thus increasing microbial activity near the soil surface. Emissions amounted to 17.1 kg ha−1 day−1 during corn cultivation, which is in accordance with the value (19.4 kg ha−1 day−1) obtained by Ussiri and Lal [22] during corn cultivation in Ohio. During winter wheat growing season, soil C-CO2 emissions amounted to 28.7 kg ha−1 day−1 which is higher than results obtained by Kessavalou et al. [15], who determined that mean annual CO2 emissions from wheat-fallow at Sidney, NE, ranged from 6.9 to 20.1 kg C ha−1 day−1.

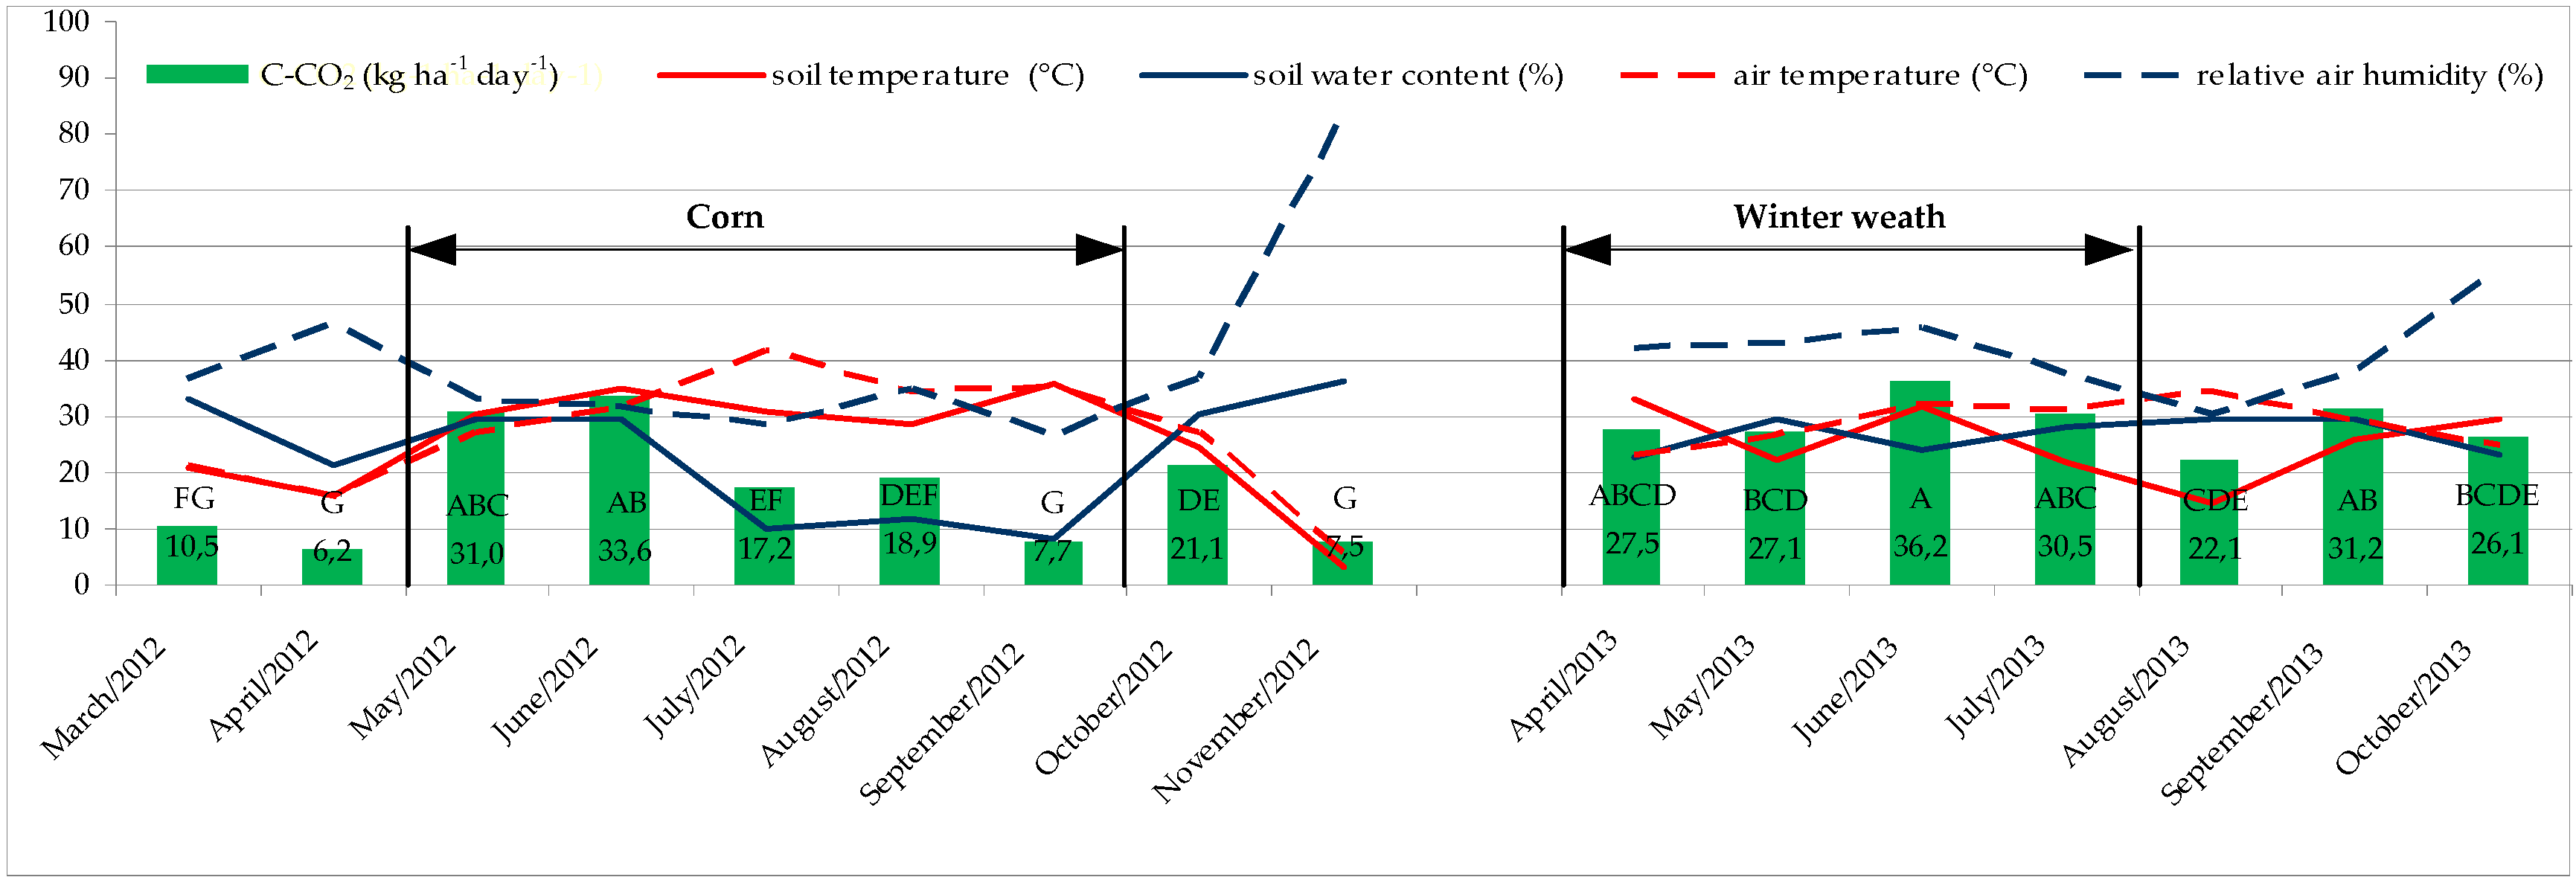
3.2. Seasonal Pattern of Soil C-CO2 Emissions

Ranges of average monthly agroecological factors and soil C-CO2 emissions in 2012 and 2013 (Figure 2) were, respectively: soil temperatures 3.3–36.6 °C and 14.6–33.0 °C; soil water content 8.3%–36.2% and 22.6%–29.6%; air temperatures 5.7–41.9 °C and 23.2–34.5 °C; relative air humidity 27%–84% and 30%–56%; soil C-CO2 emissions 6.2–33.6 kg ha−1 day−1 and 22.1–36.2 kg ha−1 day−1.
Figure 2. Average monthly soil C-CO2 emissions and agroecological factors in 2012 and 2013 (n = 18). (Means followed by the same letter are not significantly different at the p ≤ 0.05 level.)
Sustainability 08 00090 g002
In 2012, average seasonal emissions decreased, respectively, summer > spring > autumn (23.2 > 15.9 > 12.1 kg ha−1 day−1) and were significantly higher in the period with crop presence (May–September) compared to the period with crop absence (March, April, October, November). In 2013, average seasonal emissions decreased, respectively, summer > autumn > spring (29.6 > 28.7 > 27.3 kg ha−1 day−1) and were not significantly higher in the period with crop presence (April–July) compared to the period with its absence (August–October). According to literature data, soil CO2 emissions are changing with the exchange of seasons and are dependent on climatological conditions, crop type, soil type and many other factors and they have no clear pattern. Kessavalou et al. [15] measured the highest soil CO2 emissions in spring and the lowest in winter during wheat cultivation in Nebraska; Jacinthe et al. [33] determined with black fallow that soil CO2 emissions decreased winter > summer > autumn in Ohio; Lou et al. [38] recorded, in China, a gradual decrease of soil CO2 emissions from August to January and an increase from January to July, and Ussiri and Lal [22] determined that daily CO2 fluxes were the highest in summer and the lowest in winter, while Bauer et al. [21] determined that CO2 flux rates decreased, respectively, summer > spring > fall.

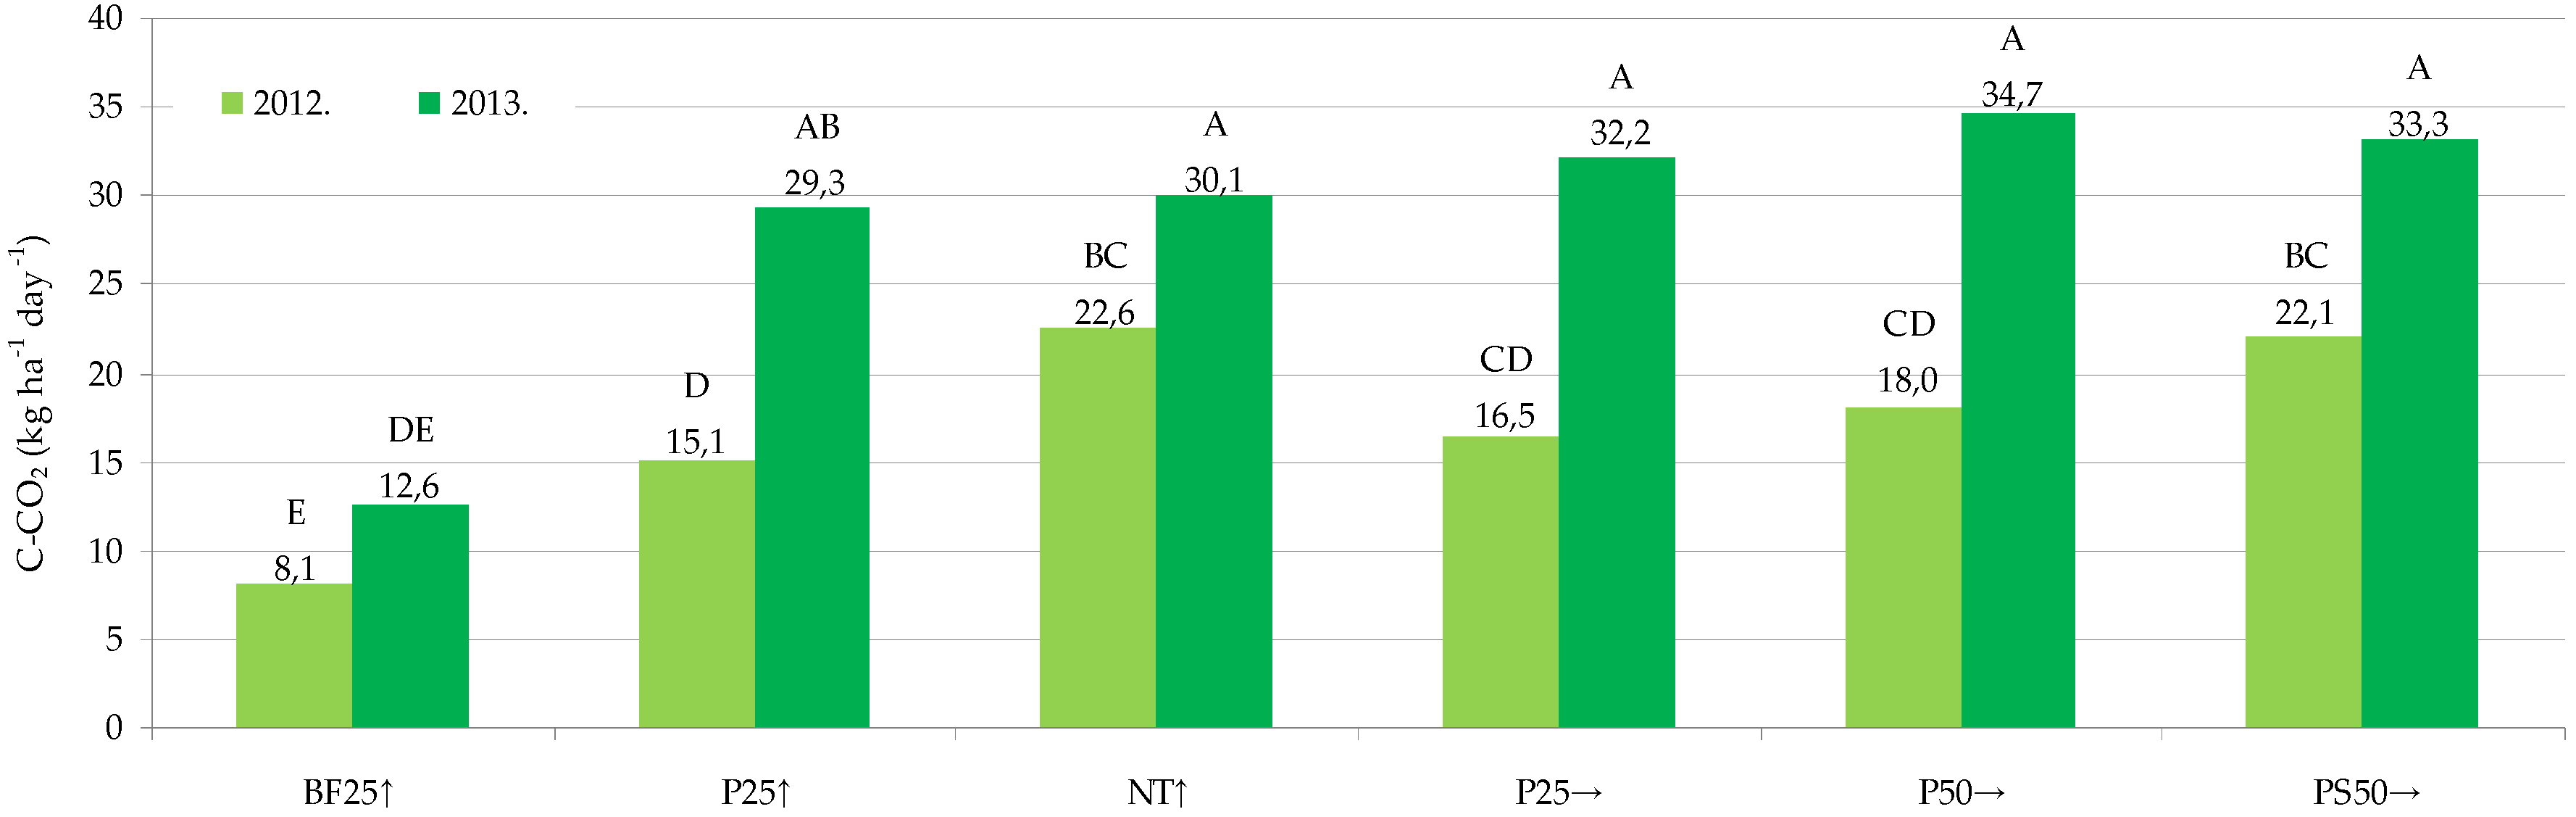
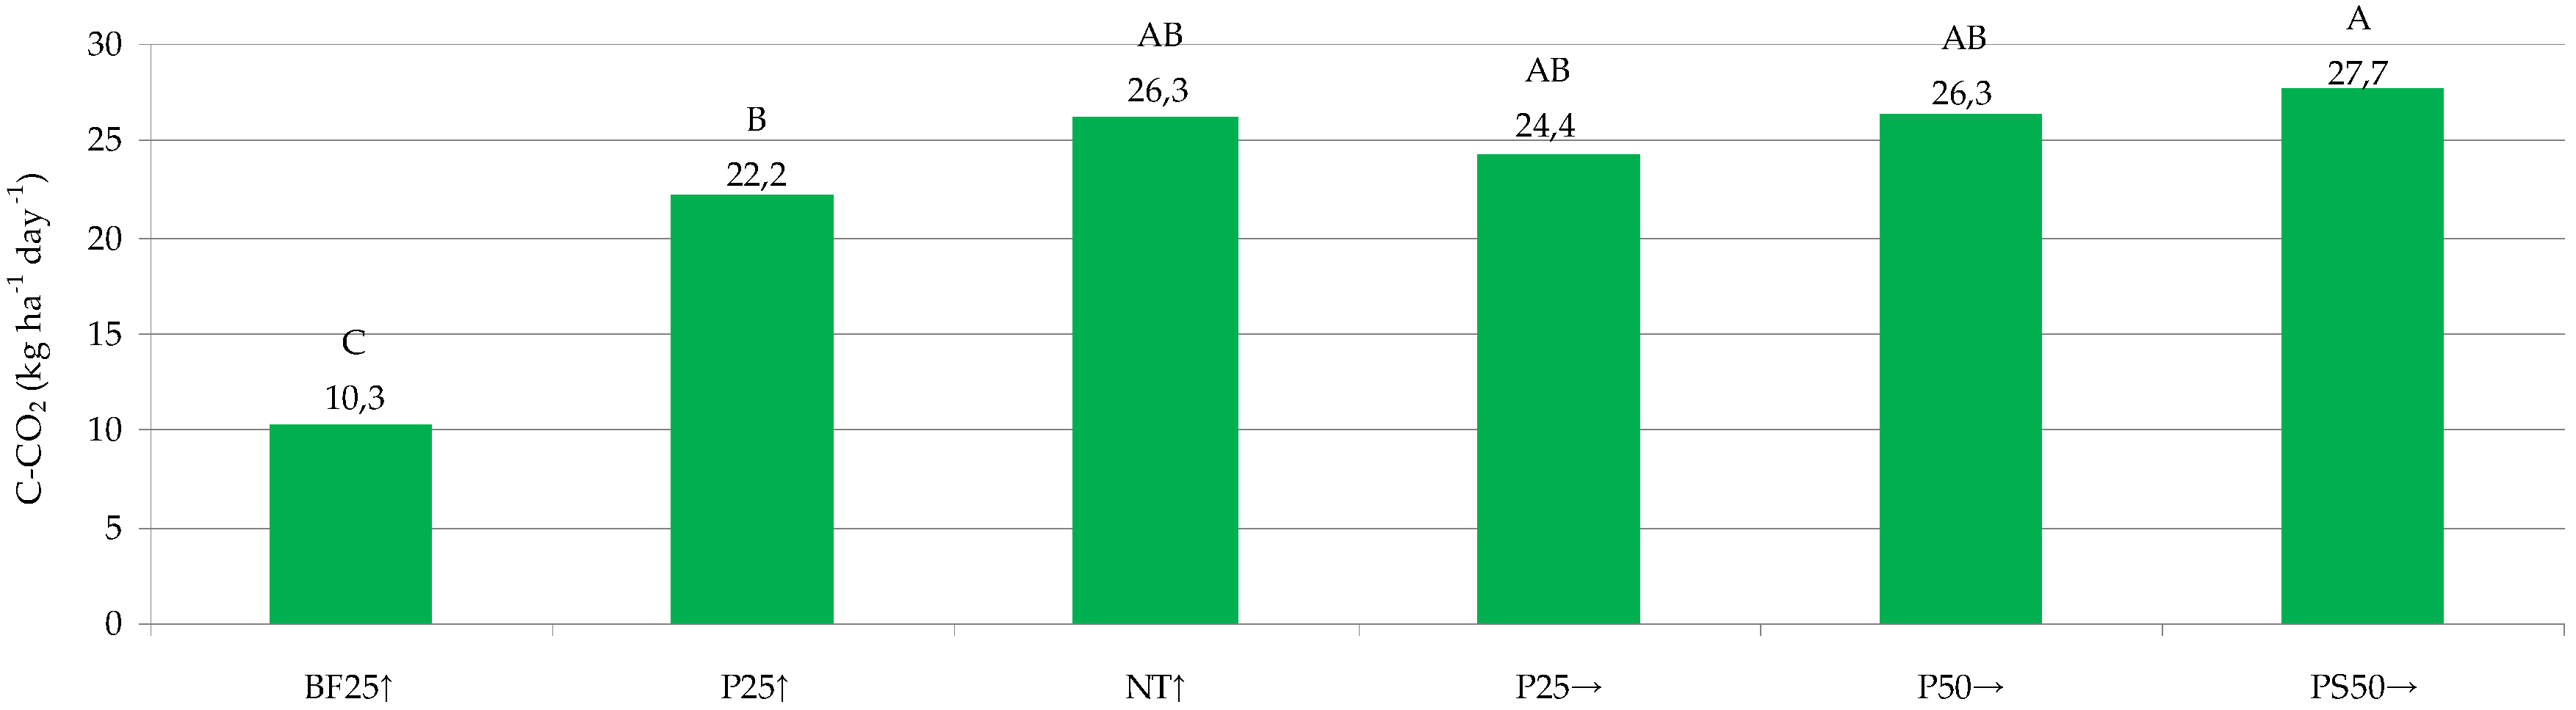
3.3. Influence of Tillage Treatment on Soil C-CO2 Emissions

Our study showed that tillage treatments affect soil CO2 emissions, which agrees with several other studies [15,39], where CO2 release varied with agricultural practices. Figure 3 presents two-year average soil C-CO2 emissions (n = 48) considering tillage treatments.
Figure 3. Two-year average soil C-CO2 emissions considering tillage treatment. (Means followed by the same letter are not significantly different at the p ≤ 0.05 level.)
Sustainability 08 00090 g003
Significantly lower two-year average soil C-CO2 emission was determined at the BF25 treatment, which was 2.5 times lower compared to the average soil CO2 emission of treatments with crops. This is in accordance with literature data where CO2 emissions on soils with crop presence were 0.2–3 times higher compared to bare soil [10,15,28]. Comparing treatments with a growing crop, CO2 emissions were lowest with the P25 treatment, averaged across two years. In a two-year average, soil C-CO2 emissions determined at P25 and PS50 treatments differed significantly while emissions measured at other studied treatments did not differ significantly. Intensity of soil CO2 release depends on tillage intensity; greater tillage intensity leads to higher emissions [40].
Figure 4 shows the average annual soil C-CO2 emissions considering tillage treatments in 2012 (n = 27) and 2013 (n = 21). Statistical analyses determine that the same tillage treatments significantly differed between studied years except for the BF25 treatment. Soil C-CO2 emissions were lower during corn compared to winter wheat growing season due to crop type, i.e., greater crop canopy has an influence on microbiological and root system activity, and thereby soil CO2 release intensity. Soil C-CO2 emissions with crop presence varied among tillage treatments when corn was grown, but not when winter wheat was grown (Figure 4).
Figure 4. Average annual soil C-CO2 emissions in 2012 and 2013 considering tillage treatments. (Means followed by the same letter are not significantly different at the p ≤ 0.05 level.)
Sustainability 08 00090 g004
Considering the treatments with crop presence, in 2012, during the corn growing season, a significant difference in soil C-CO2 emissions was only determined between the P25 and NT treatments. The average annual soil C-CO2 emission at NT treatment was 20.6% higher compared to the average of conventionally tilled treatments. Implementation of no-tillage can increase soil CO2 emissions due to the higher water content maintenance in the soil surface layer which results in greater soil biological activity. Other authors have also determined higher CO2 emissions at no-tillage compared to conventional tillage [25,41].
In 2013, during the winter wheat growing season, soil C-CO2 emissions did not differ significantly between different tillage treatments with crops. However, the average annual soil C-CO2 emission at NT treatment was 7.2% lower compared to the average of conventionally tilled treatments. Conventional tillage has influence on soil aggregate turnover, improves soil aeration, infiltration, water holding capacity, and increases the contact between soil and crop residues, which results in increased soil CO2 emissions compared to no-tillage. Lower soil C-CO2 emissions at no-tillage compared to conventional tillage have also been determined by many other authors [15,18,19,20,21].
Similar results were reported by Franzluebbers et al. [26], who found that CO2 emissions in some years were higher in no-tillage than in conventional tillage, but in other years, the tillage effect was not observed. Vinten et al. [42] determined, in one year of research, higher, and in the other year of research, lower soil C-CO2 emissions at no-tillage compared to conventional tillage. On the other hand, many other authors did not determine any significant differences in soil C-CO2 emissions between mentioned tillage treatments [43,44,45]. Based on the contrasting results reported in the literature compared to our study, it is apparent that multiple factors must be involved in CO2 emissions. The study of this complex interaction among factors will be helpful in understanding the agricultural impact on CO2 emissions.

4. Conclusions

In the research on soil C-CO2 emissions at Stagnosols in central lowland Croatia, it was found that the moment of the measurement and crop type have significant influence on soil C-CO2 emissions. During both studied years, soil C-CO2 emissions were higher in warmer periods of the year compared to the colder ones. The average annual soil C-CO2 emission was 40.5% lower during corn compared to winter wheat growing season. According to the results, a significant effect of tillage practices on soil CO2 emissions has been determined during corn but not during winter wheat growing season, so further research is needed to establish such a difference as two years is a short period due to the strong impact of weather. With regard to the soil CO2 emissions, the same tillage methods differed significantly between the studied years. Soil C-CO2 emissions were 20.6% higher during the corn growing season and 7.2% lower during the winter wheat growing season at no-till compared to the average of conventionally tilled treatments. In these agroecological conditions, the optimal tillage method with regard to emitted C-CO2 into the atmosphere is plowing to 25 cm along the slope; however, we would like to highlight that the formation and release of carbon dioxide from the soil does not depend only on one factor, but is a result of very complex interactions between all biotic and abiotic factors of the agroecosystem. It is very important to utilize natural resources in a sustainable way to have satisfactory agricultural production, minimal soil CO2 emissions into the atmosphere and maximal soil carbon sequestration by which climate change could be mitigated.

Acknowledgments

The research was financially supported by Croatian Environmental protection and energy efficiency Fund and Ministry of Science, Education and Sports of the Republic of Croatia. We have received a part of funds from Croatian Environmental protection and energy efficiency Fund for covering the costs to publish in open access.

Author Contributions

Ivica Kisić and Željka Zgorelec conceived and designed the experiment; Željka Zgorelec contributed reagents/materials/analysis tools; Darija Bilandžija performed the experiments, analyzed the data and wrote the paper.

Conflicts of Interest

The authors declare no conflict of interest. The founding sponsors had no role in the design of the study; in the collection, analyses, or interpretation of data; in the writing of the manuscript, and in the decision to publish the results.

References

  1. Lal, R. Restoring Soil Quality to Mitigate Soil Degradation. Sustainability 2015, 7, 5875–5895. [Google Scholar] [CrossRef]
  2. Mielnick, P.C.; Dugas, W.A. Soil CO2 flux in a tallgrass prairie. Soil Biol. Biochem. 1999, 32, 221–228. [Google Scholar] [CrossRef]
  3. Maier, C.A.; Kress, L.W. Soil CO2 evolution and root respiration in 11 year-old loblolly pine (Pinus taeda) plantations as affected by moisture and nutrient availability. Can. J. For. Res. 2000, 30, 347–359. [Google Scholar] [CrossRef]
  4. Mesić, M.; Birkas, M.; Zgorelec, Ž.; Kisić, I.; Jurišić, A.; Šestak, I. Carbon content and C/N ratio in Pannonian and Mediterranean soils. In Impact of Tillage and Fertilization on Probable Climate Threats in Hungary and Croatia, Soil Vulnerability and Protection; Birkas, M., Mesić, M., Eds.; Szent Istvan University Press: Godollo, Hungary, 2012; pp. 45–53. [Google Scholar]
  5. Jensen, L.S.; Mueller, T.; Tate, R.K.; Riss, D.J.; Magid, J.; Nelson, N.E. Soil surface CO2 flux as an index of soil respiration in situ: A comparison of two chamber methods. Soil Biol. Biochem. 1996, 28, 1297–1306. [Google Scholar] [CrossRef]
  6. Caldeira, K.; Morgan, M.G.; Baldocchi, D.; Brewer, P.G.; Chen, C.T.A.; Nabuurs, G.J.; Nakicenovic, N.; Robertson, G.P. A portfolio of carbon management options. In The Global Carbon Cycle; Field, C.B., Raupach, M.R., Eds.; Island Press: Washington, DC, USA, 2004; pp. 103–109. [Google Scholar]
  7. Almagro, M.; Querejeta, J.I.; Boix-Fayos, C.; Martínez-Mena, M. Links between vegetation patterns, soil C and N pools and respiration rate under three different land uses in a dry Mediterranean ecosystem. J. Soils Sediments 2013, 13, 641–653. [Google Scholar] [CrossRef]
  8. Oorts, K.; Merckx, R.; Grehan, E.; Labreuche, J.; Nicolardot, B. Determinants of annual fluxes of CO2 and N2O in long-term no-tillage and conventional tillage systems in northern France. Soil Till. Res. 2007, 95, 133–148. [Google Scholar] [CrossRef]
  9. Duxbury, J.M. The significance of agricultural sources of greenhouse gases. Fert. Res. 1994, 38, 151–163. [Google Scholar] [CrossRef]
  10. Rastogi, M.; Singh, S.; Pathak, H. Emission of carbon dioxide from soil. Curr. Sci. 2002, 82, 510–517. [Google Scholar]
  11. Lal, R. Global potential of soil carbon sequestration to mitigate the greenhouse effect. Plant Sci. 2003, 22, 151–184. [Google Scholar] [CrossRef]
  12. Luo, Y.; Zhou, X. Soil Respiration and the Environment; Elsevier: London, UK, 2006; p. 316. [Google Scholar]
  13. Jarecki, M.K.; Lal, R. Compost and mulch effects on gaseous flux from an alfisol in Ohio. Soil Sci. 2006, 171, 249–260. [Google Scholar] [CrossRef]
  14. Birkás, M. Environmentally-Sound Adaptable Tillage–Solutions from Hungary; Akademiai Kiado: Budapest, Hungary, 2008; pp. 191–194. [Google Scholar]
  15. Kessavalou, A.; Mosier, A.R.; Doran, J.W.; Drijber, R.A.; Lyon, D.J.; Heinemeyer, O. Fluxes of Carbon Dioxide, Nitrous Oxide, and Methane in Grass Sod and Winter Wheat-Fallow Tillage Management. J. Environ. Qual. 1998, 27, 1094–1104. [Google Scholar] [CrossRef]
  16. Rochette, P.; Angers, D.A. Soil surface carbon dioxide fluxes induced by spring, summer, and fall moldboard plowing in a sandy loam. Soil Sci. Soc. Am. J. 1999, 63, 621–628. [Google Scholar] [CrossRef]
  17. La Scala, A.; Lopes, K.; Bolonhezi, D.; Archer, D.W.; Reicosky, D.C. Short-temporal changes of soil carbon losses after tillage described by a first-order decay model. Soil Till. Res. 2008, 99, 108–118. [Google Scholar]
  18. Jabro, J.D.; Sainju, U.; Stevens, W.B.; Evans, R.G. Carbon dioxide flux as affected by tillage and irrigation in soil converted from perennial forages to annual crops. J. Environ. Manag. 2008, 88, 1478–1484. [Google Scholar] [CrossRef] [PubMed]
  19. Curtin, D.; Wang, H.; Selles, F.; Mcconkey, B.G.; Campbell, C.A. Tillage Effects on Carbon Fluxes in Continuous Wheat and Fallow–Wheat Rotations. Soil Sci. Soc. Am. J. 2000, 64, 2080–2086. [Google Scholar] [CrossRef]
  20. Al-Kaisi, M.M.; Yin, X. Tillage and Crop Residue Effects on Soil Carbon and Carbon Dioxide Emission in Corn–Soybean Rotations. J. Environ. Qual. 2005, 34, 437–445. [Google Scholar] [CrossRef] [PubMed]
  21. Bauer, P.J.; Frederick, J.R.; Novak, J.M.; Hunt, P.G. Soil CO2 flux from a Norfolk loamy sand after 25 years of conventional and conservation tillage. Soil Till. Res. 2006, 90, 205–211. [Google Scholar] [CrossRef]
  22. Ussiri, D.A.N.; Lal, R. Long-term tillage effects on soil carbon storage and carbon dioxide emissions in continuous corn cropping system from an alfisol in Ohio. Soil Till. Res. 2009, 104, 39–47. [Google Scholar] [CrossRef]
  23. Paustian, K. Agricultural soils as a sink to mitigate CO2 emissions. Soil Use Manag. 1997, 13, 230–244. [Google Scholar] [CrossRef]
  24. Ball, B.C.; Scott, A.; Parker, J.P. Field N2O, CO2 and CH4 fluxes in relation to tillage, compaction and soil quality in Scotland. Soil Till. Res. 1999, 53, 29–39. [Google Scholar] [CrossRef]
  25. Hendrix, P.F.; Han, C.R.; Groffman, P.M. Soil respiration in conventional and no-tillage agroecosystems under different winter cover crop rotations. Soil Till. Res. 1988, 12, 135–148. [Google Scholar] [CrossRef]
  26. Franzluebbers, A.J.; Hons, F.M.; Zuberer, D.A. Tillage induced seasonal changes in soil physical properties affecting soil CO2 evolution under intensive cropping. Soil Till. Res. 1995, 34, 41–60. [Google Scholar] [CrossRef]
  27. Bilandžija, D.; Zgorelec, Ž.; Kisić, I. The Influence of Agroclimatic Factors on Soil CO2 Emissions. Collegium Antropol. 2014, 38, 77–83. [Google Scholar]
  28. Raich, J.W.; Tufekcioglu, A. Vegetation and soil respiration: Correlations and controls. Biogeochemistry 2000, 48, 71–90. [Google Scholar] [CrossRef]
  29. Schlesinger, W.H.; Andrews, J.A. Soil respiration and the global carbon cycle. Biogeochemistry 2000, 48, 7–20. [Google Scholar] [CrossRef]
  30. Amos, B.; Arkebauer, T.J.; Doran, J.W. Soil surface fluxes of greenhouse gases in an irrigated maize-based agroecosystem. Soil Sci. Soc. Am. J. 2005, 69, 387–395. [Google Scholar] [CrossRef]
  31. Johnson, J.M.; Franzluebbers, A.J.; Lachnicht-Weyers, S.; Reicosky, D.C. Agricultural opportunities to mitigate greenhouse gas emissions. Environ. Pollut. 2007, 150, 107–124. [Google Scholar] [CrossRef] [PubMed]
  32. Bajracharya, R.M.; Lal, R.; Kimble, J.M. Diurnal and seasonal CO2-C flux from soil as reflected to erosion phases in central Ohio. Soil Sci. Soc. Am. J. 2000, 64, 286–293. [Google Scholar] [CrossRef]
  33. Jacinthe, P.A.; Lal, R.; Kimble, J.M. Carbon budget and seasonal carbon dioxide emission from a central Ohio Luvisol as influenced by wheat residue amendment. Soil Till. Res. 2002, 67, 147–157. [Google Scholar] [CrossRef]
  34. Wan, S.; Hui, D.; Wallace, L.L.; Luo, Y. Direct and indirect warming effects on ecosystem carbon processes in a tallgrass prairie. Glob. Biogeochem. Cycles 2005, 19. [Google Scholar] [CrossRef]
  35. IUSS Working Group WRB. World Reference Base for Soil Resources 2006; World Soil Resources Report; FAO: Rome, Italy, 2010. [Google Scholar]
  36. Gajić-Čapka, M.; Zaninović, K. Climate. In Climate Atlas of Croatia 1961–1990, 1971–2000; Zaninović, K., Ed.; Meteorological and Hydrological Service: Zagreb, Croatia, 2008; pp. 11–15. [Google Scholar]
  37. SAS Institute. SAS 9.1.3; Help and Documentation: Cary, NC, USA, 2002–2004. [Google Scholar]
  38. Lou, Y.; Li, Z.; Zhang, T. Carbon Dioxide Flux in a Subtropical Agricultural Soil of China. Water Air Soil Poll. 2003, 149, 281–293. [Google Scholar] [CrossRef]
  39. Syp, A.; Faber, A.; Pikula, D. Assessing the impact of management practices on gas emissions and N losses calculated with denitrification-decomposition model. Plant Soil Environ. 2015, 61, 433–437. [Google Scholar] [CrossRef]
  40. Bilen, S.; Celik, A.; Altikat, S. Effects of strip and full-width tillage on soil carbon IV oxide-carbon (CO2-C) fluxes and on bacterial and fungal populations in sunflower. Afr. J. Biotechnol. 2010, 9, 6312–6319. [Google Scholar]
  41. Liu, X.J.; Mosier, A.R.; Halvorson, A.D.; Zhang, F.S. The impact of nitrogen placement and tillage on NO, N2O, CH4 and CO2 fluxes from a clay loam soil. Plant Soil 2006, 280, 177–188. [Google Scholar] [CrossRef]
  42. Vinten, A.J.A.; Ball, B.C.; O’Sullivan, M.F.; Henshall, J.K.; Howard, R.; Wright, F.; Ritchie, R. The effects of cultivation method and timing, previous sward and fertilizer level on subsequent crop yields and nitrate leaching following cultivation of long-term grazed grass and grass-clover swards. J. Agric. Sci. 2002, 139, 245–256. [Google Scholar] [CrossRef]
  43. Aslam, T.; Choudhary, M.; Saggar, S. Influence of land-use management on CO2 emissions from a silt loam soil in New Zealand. Agric. Ecosyst. Environ. 2000, 77, 257–262. [Google Scholar] [CrossRef]
  44. Omonode, R.A.; Vyn, T.J.; Smith, D.R.; Hegymegi, P.; Gal, A. Soil carbon dioxide and methane fluxes from long-term tillage systems in continuous corn and corn–soybean rotations. Soil Till. Res. 2007, 95, 182–195. [Google Scholar] [CrossRef]
  45. Elder, J.W.; Lal, R. Tillage effects on gaseous emissions from an intensively farmed organic soil in North Central Ohio. Soil Till. Res. 2008, 98, 45–55. [Google Scholar] [CrossRef]

