Article

Habitat Mapping of the Leopard Cat (Prionailurus bengalensis) in South Korea Using GIS

1
Korea Adaptation Center for Climate Change, Korea Environment Institute (KEI), 370 Sicheong-daero, Sejong-si 339-007, Korea
2
Department of Landscape Architecture, Dankook University, 119 Dandae-ro, Dongnam-gu, Cheonan-si, Chungnam 330-714, Korea
3
Geological Research Division, Korea Institute of Geoscience and Mineral Resources (KIGAM), 124 Gwahang-no, Yuseong-gu, Daejeon 305-350, Korea
4
Korea University of Science and Technology, 217 Gajeong-ro, Yuseong-gu, Daejeon 305-350, Korea
*
Author to whom correspondence should be addressed.
These authors contributed equally to this work.
Sustainability 2015, 7(4), 4668-4688; https://doi.org/10.3390/su7044668
Submission received: 22 January 2015 / Revised: 9 April 2015 / Accepted: 9 April 2015 / Published: 21 April 2015
(This article belongs to the Section Environmental Sustainability and Applications)

Abstract

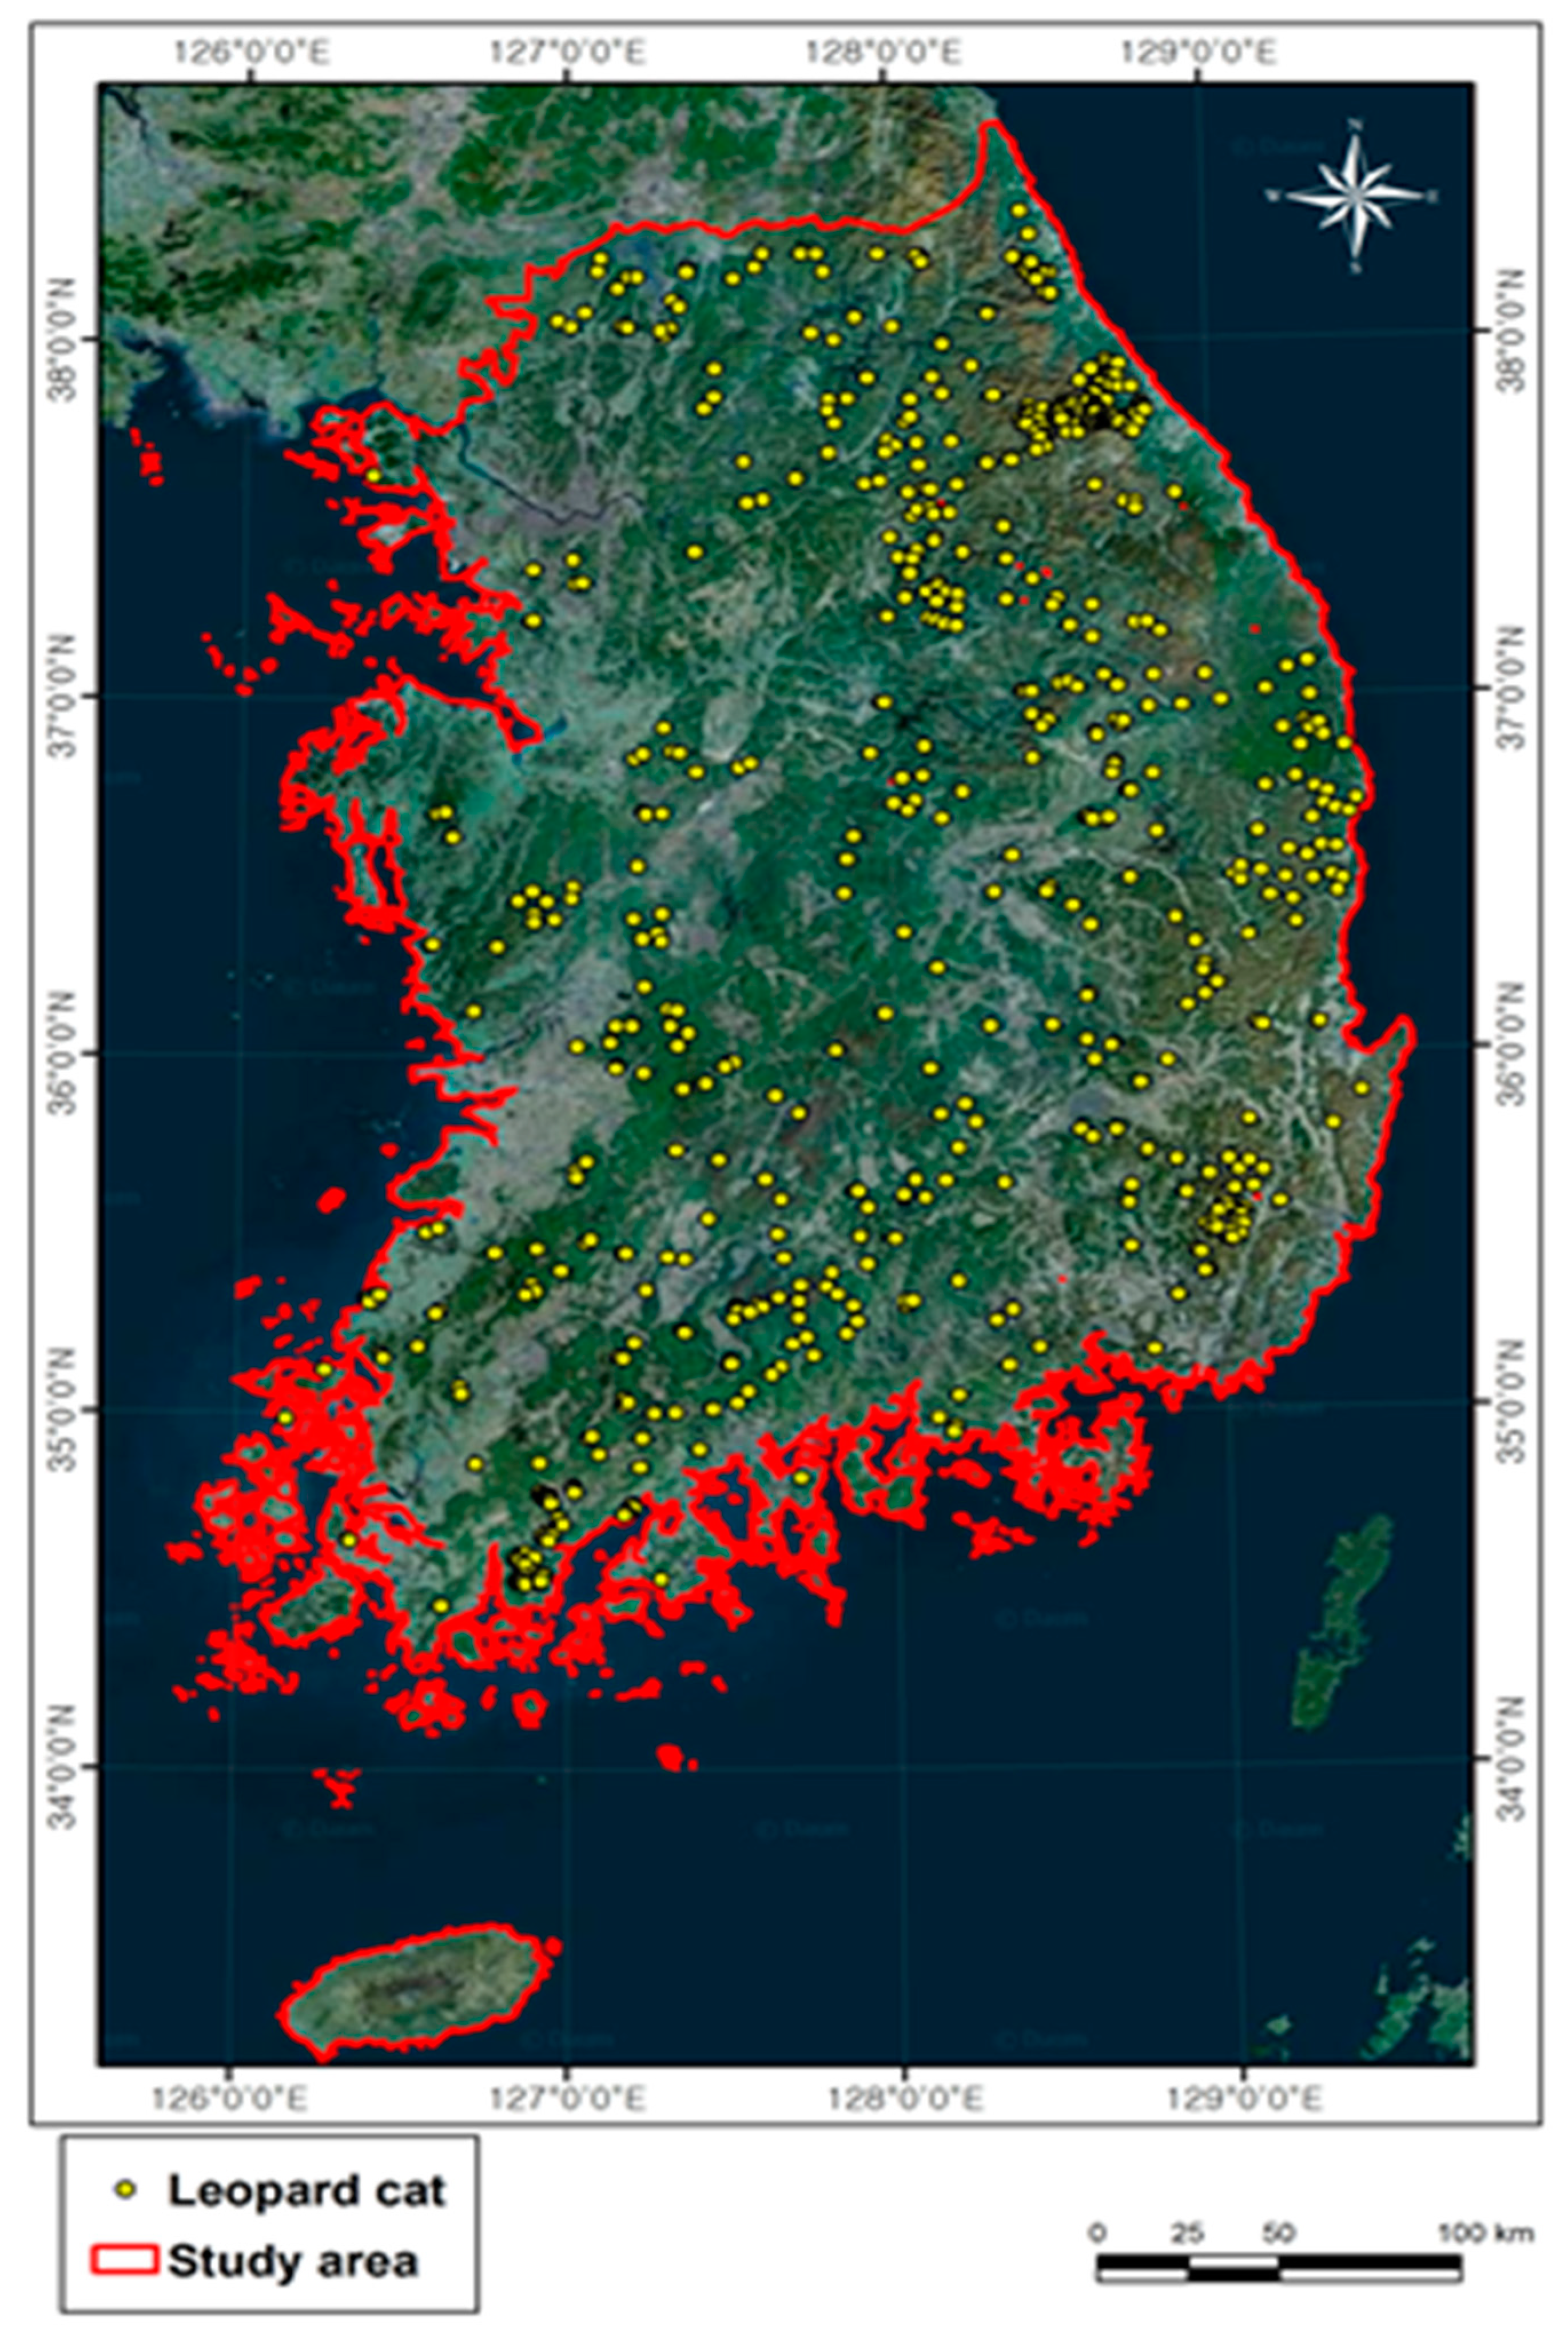
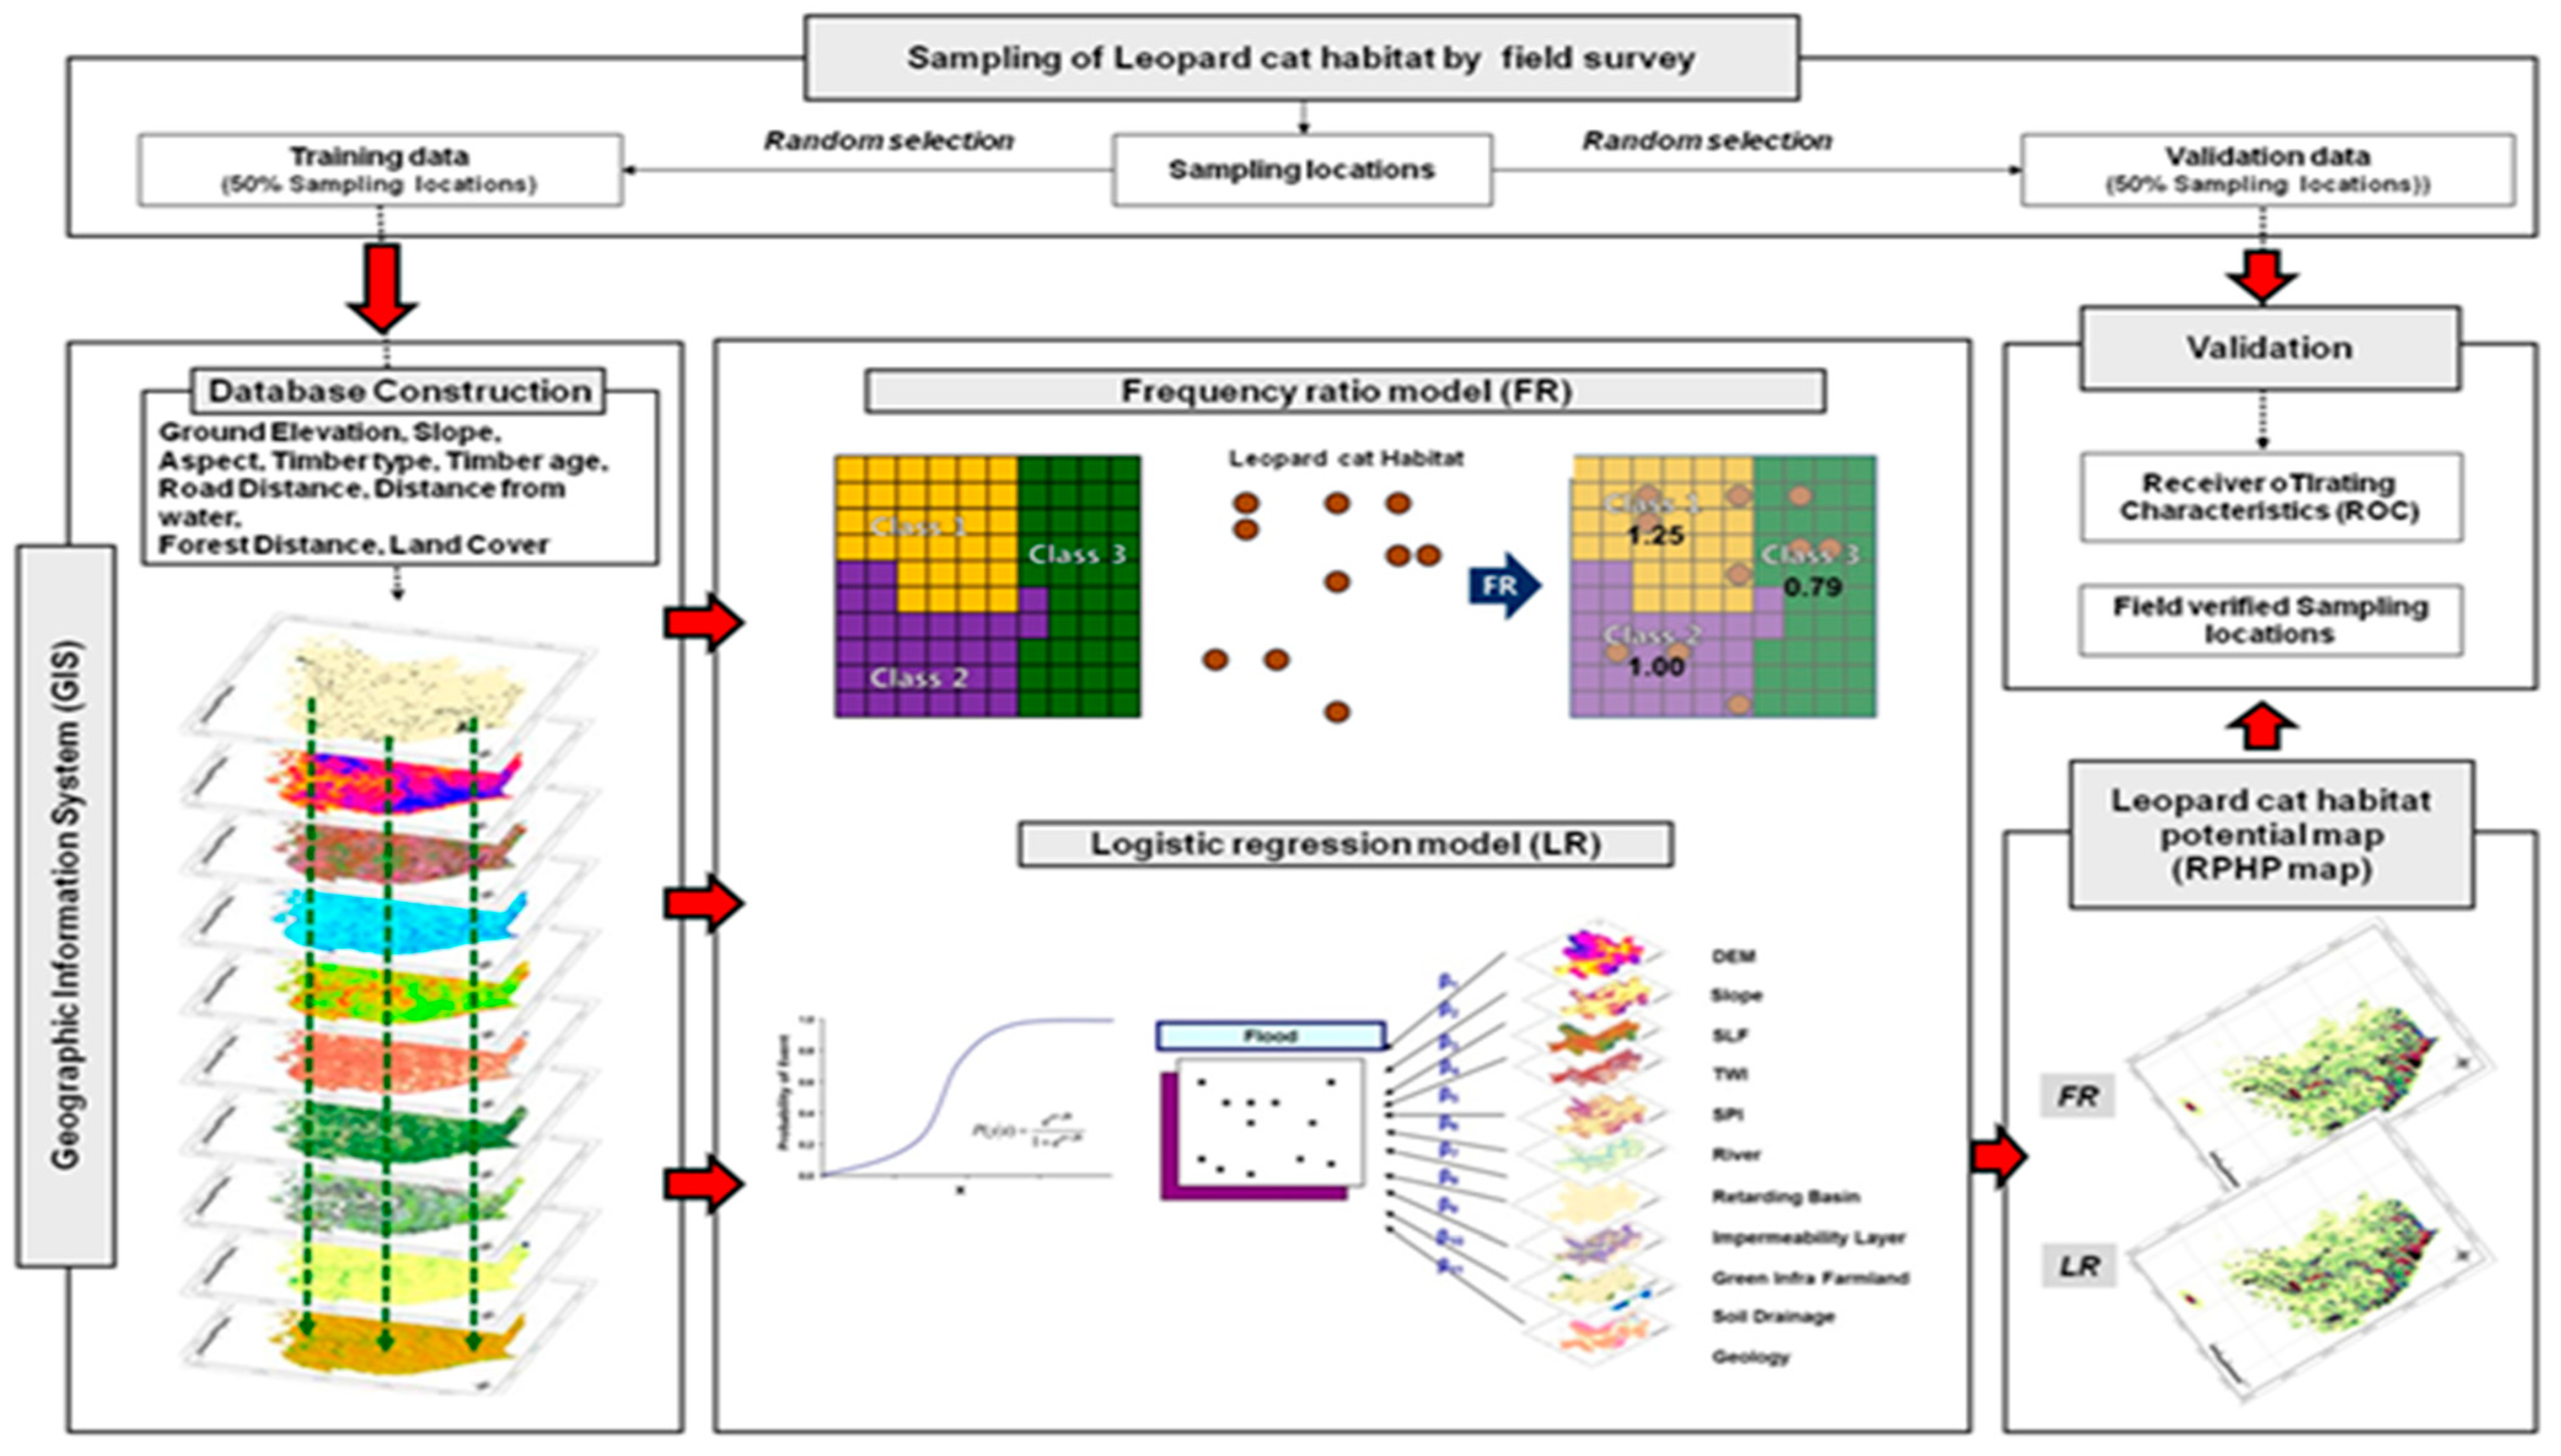
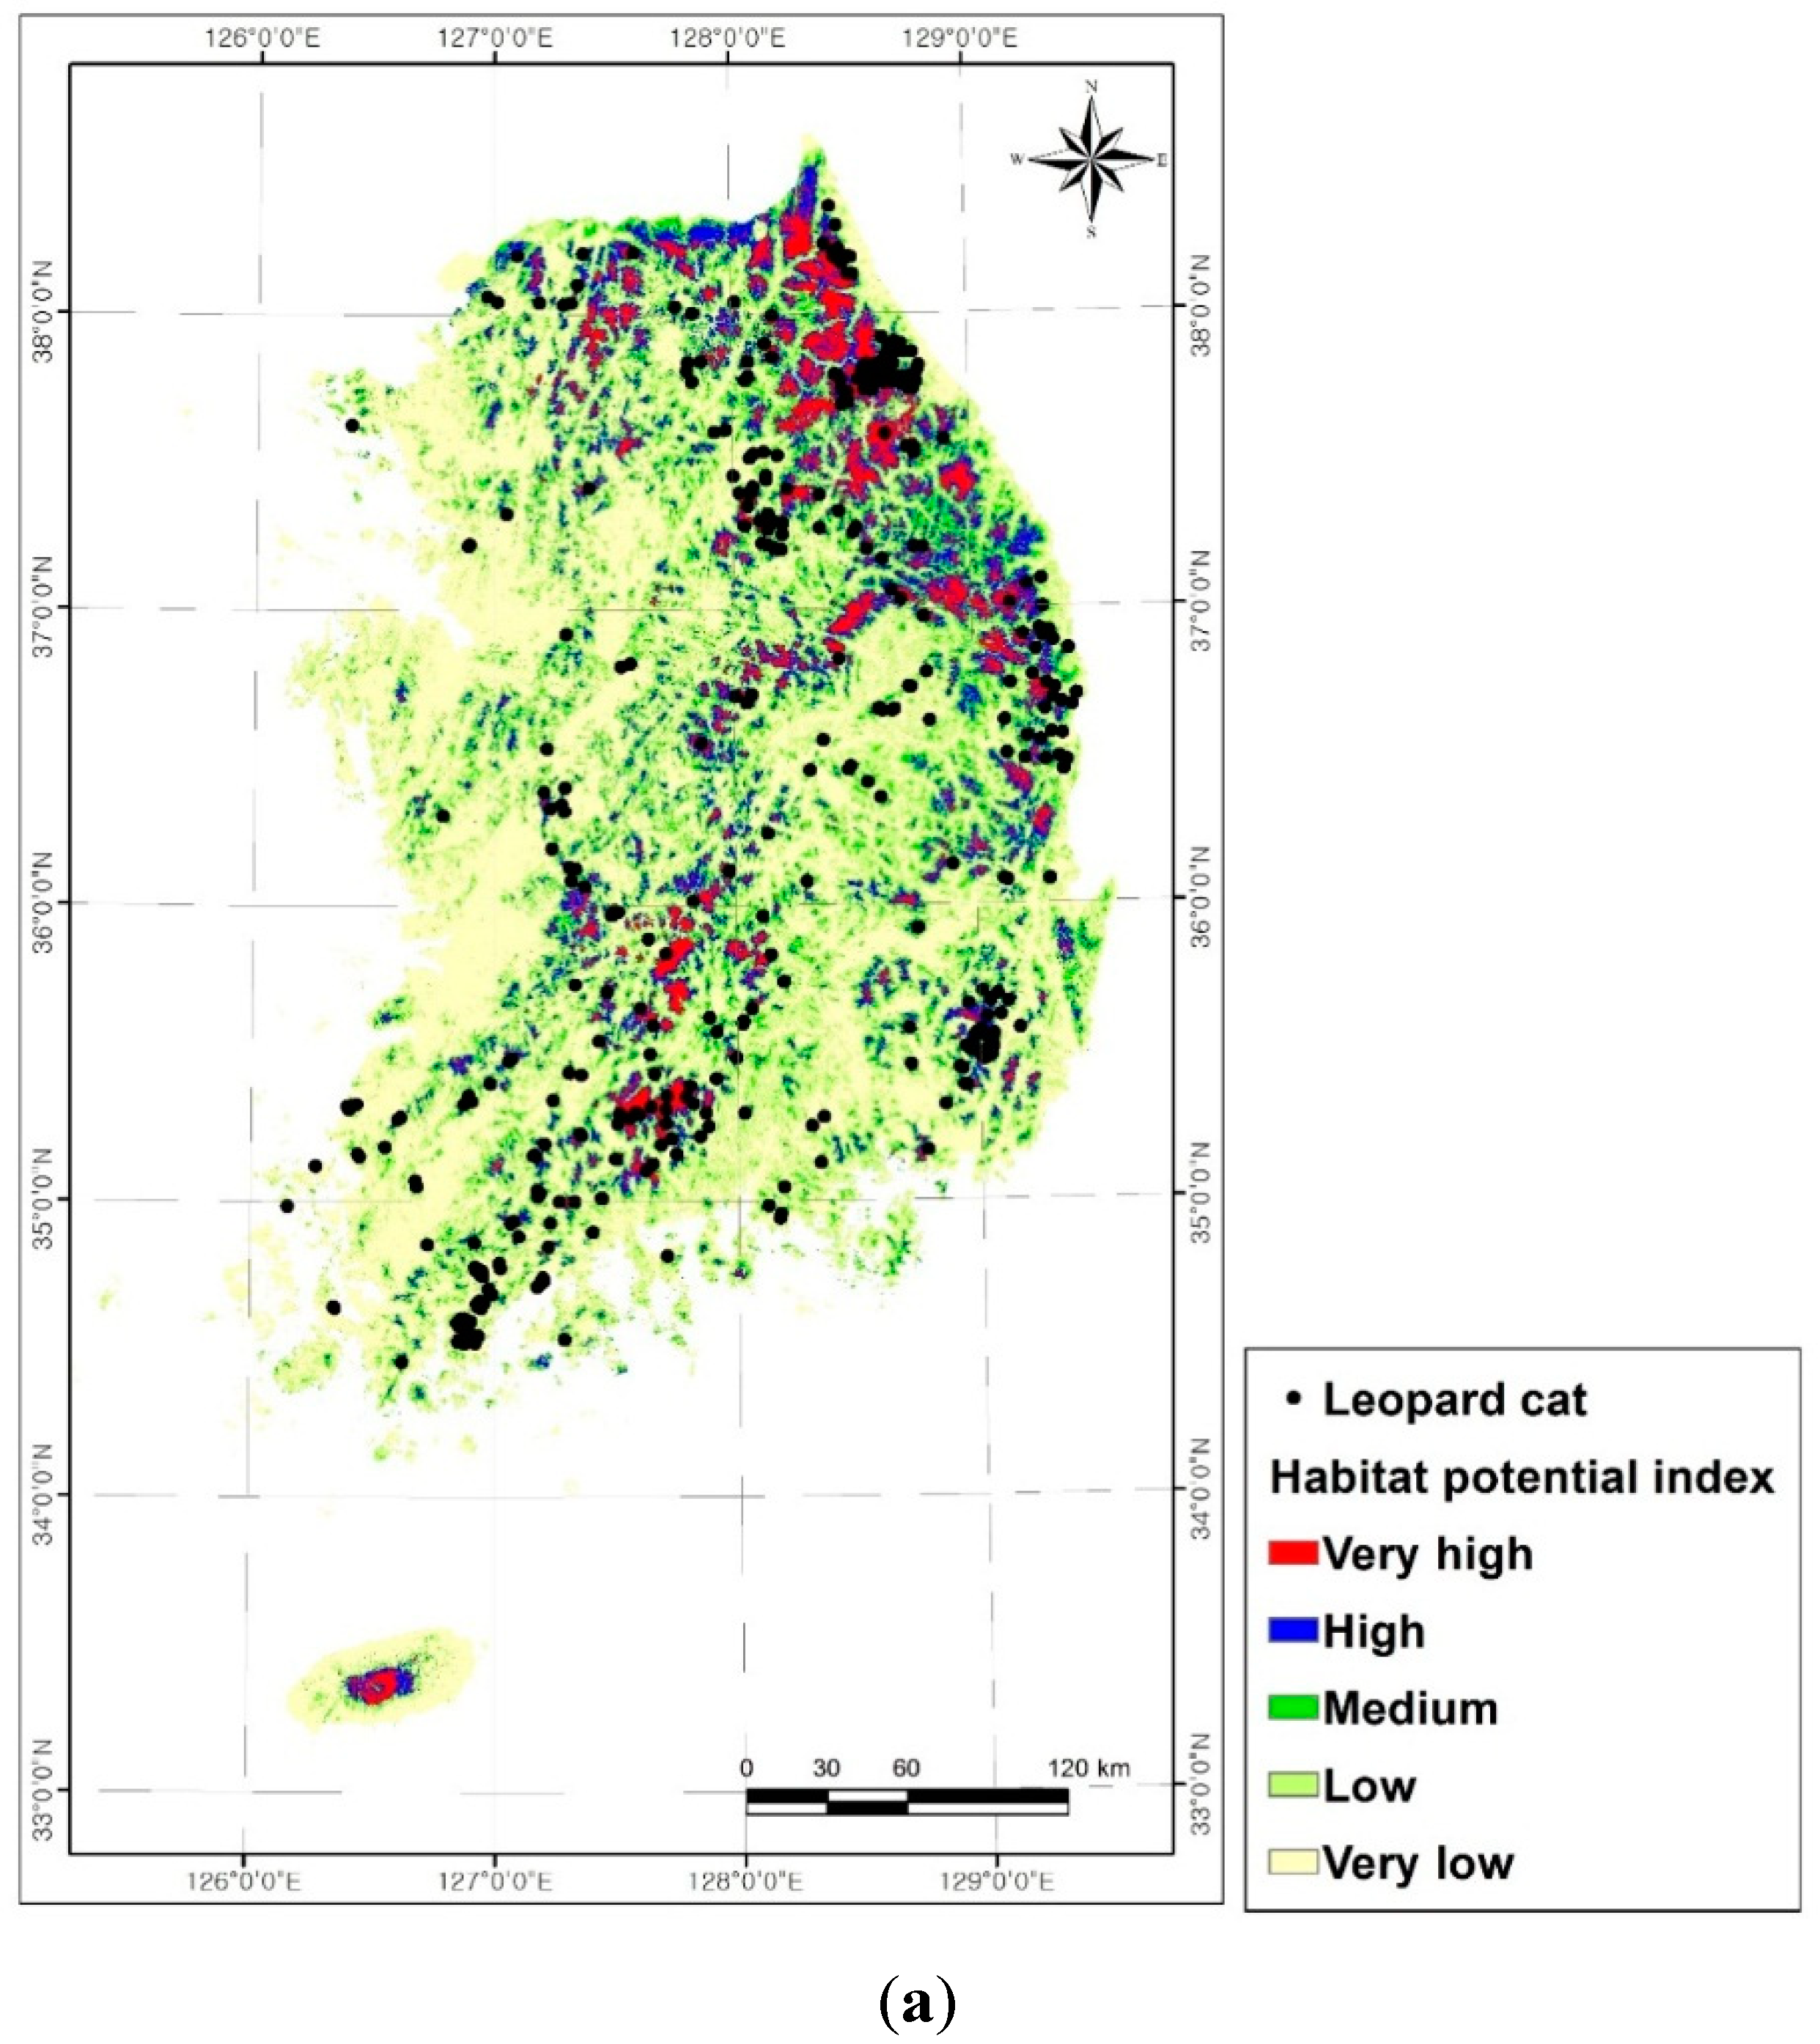
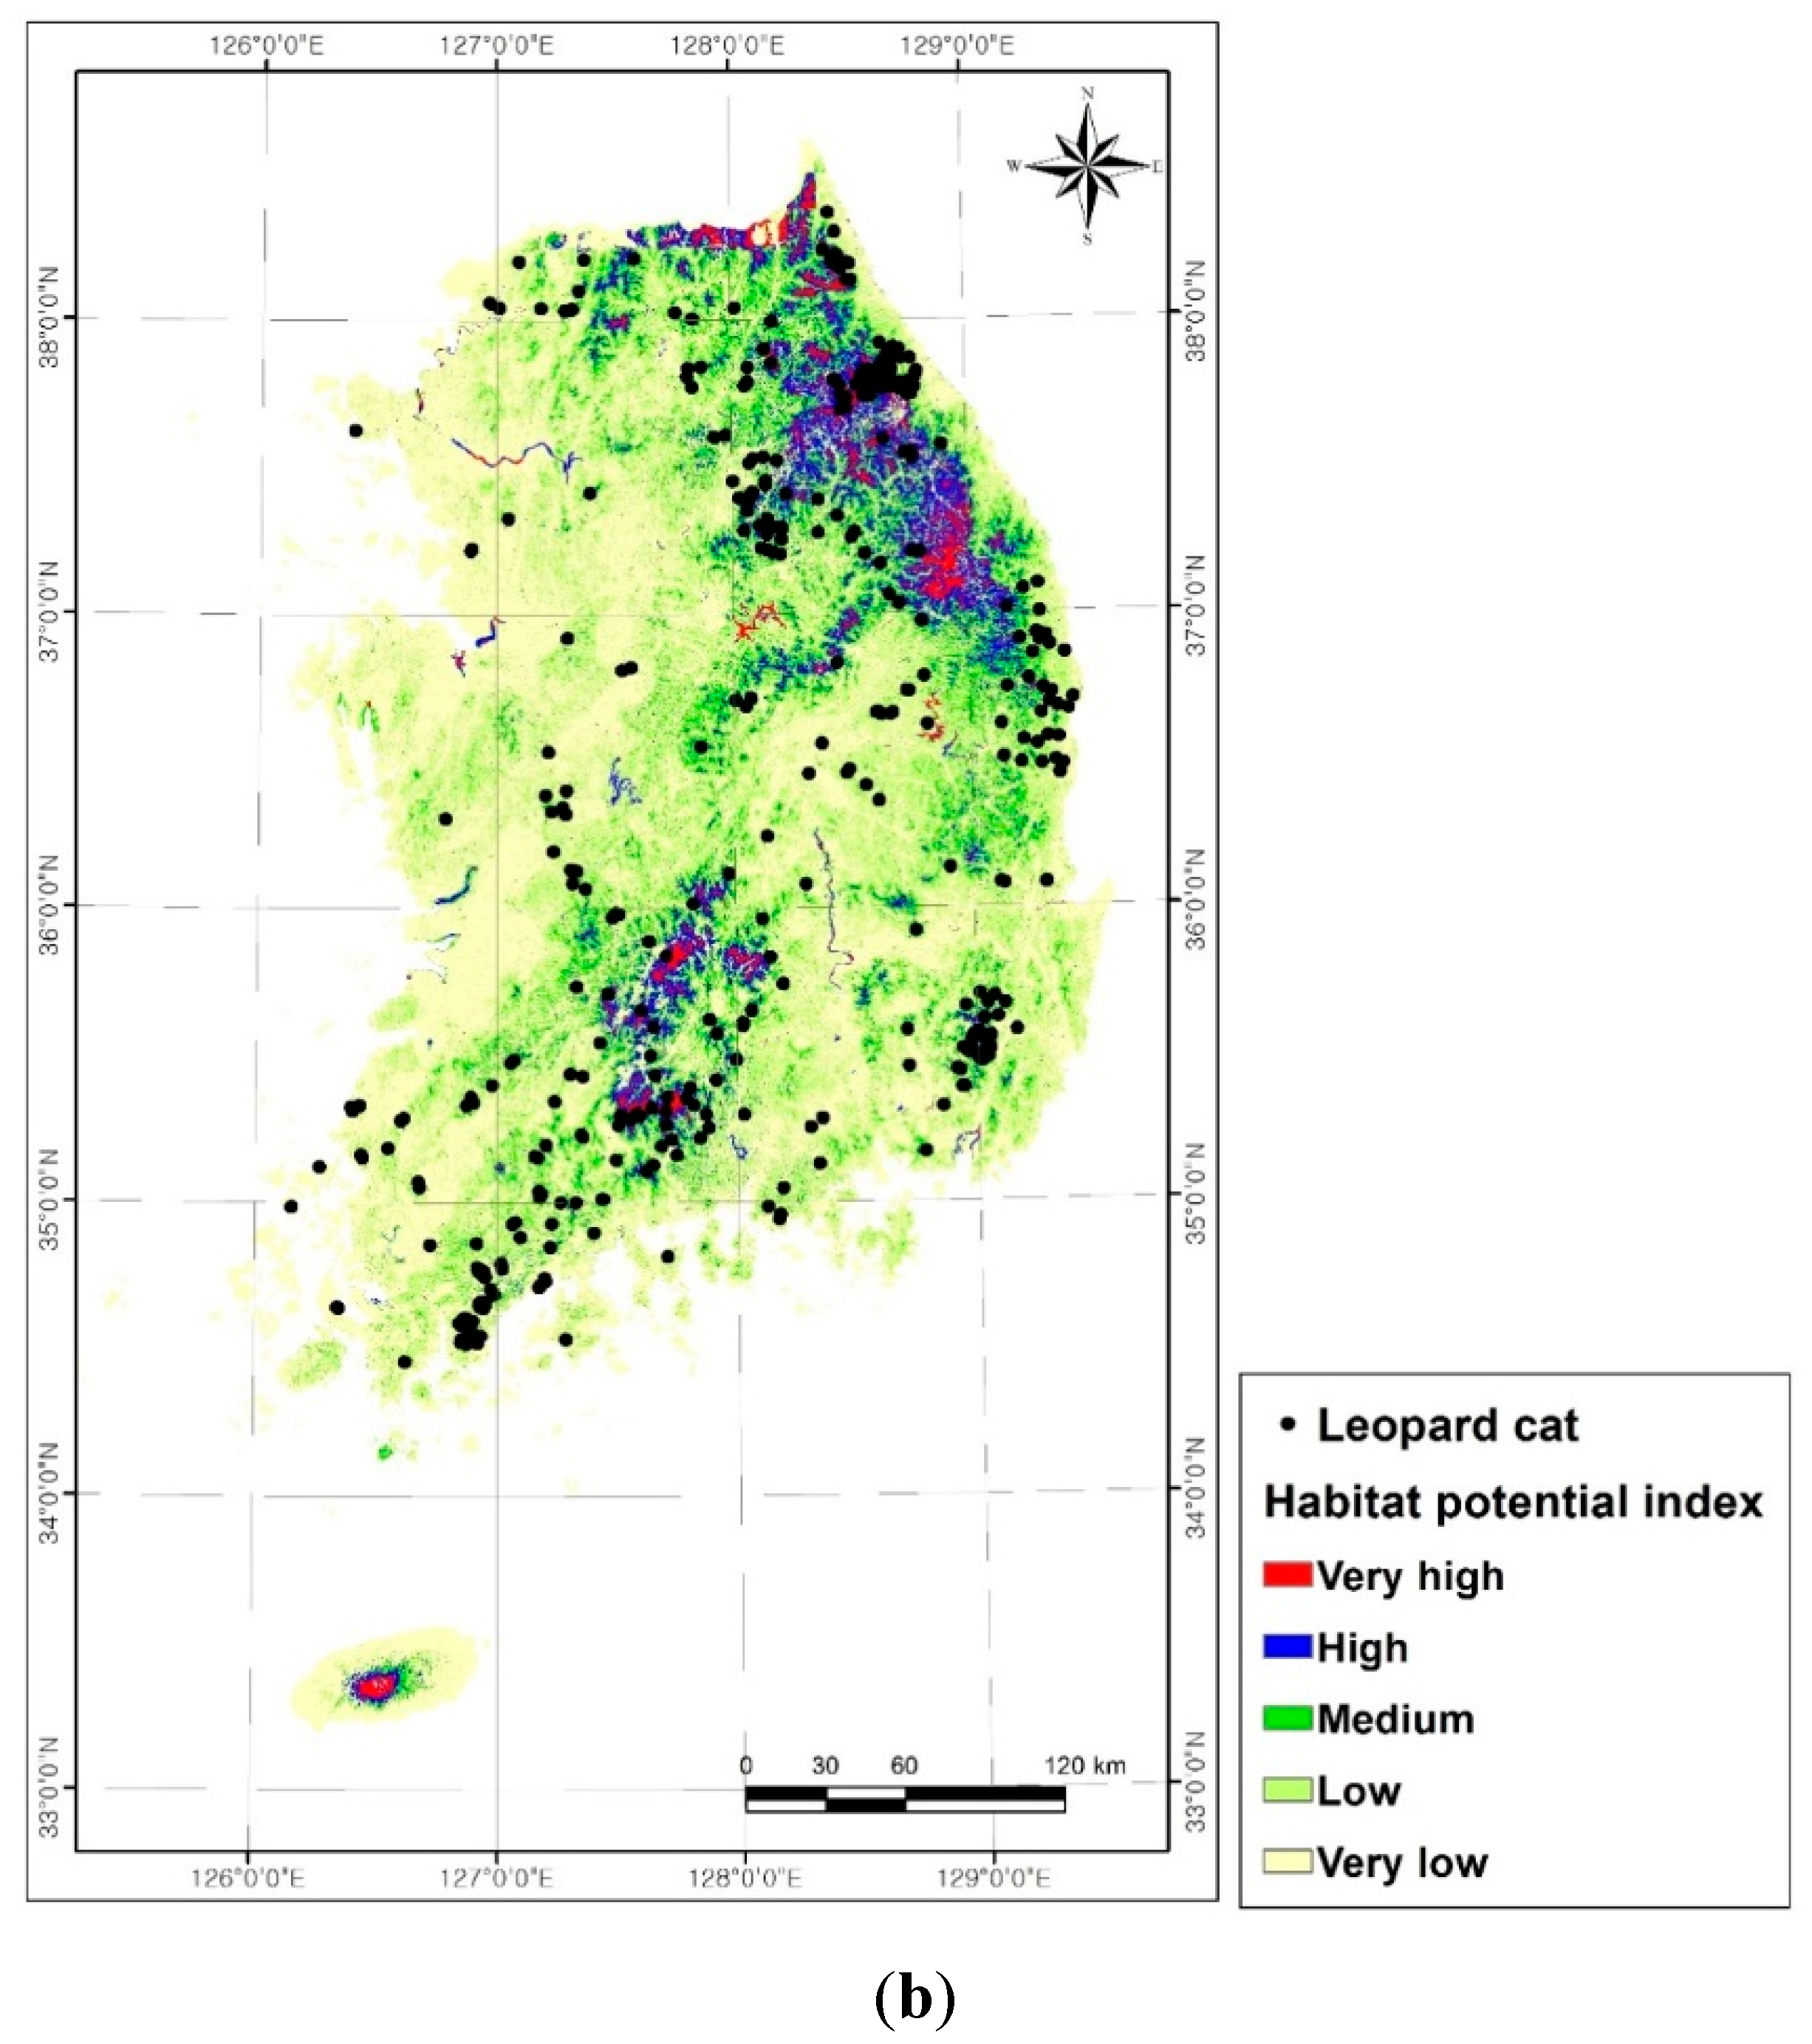
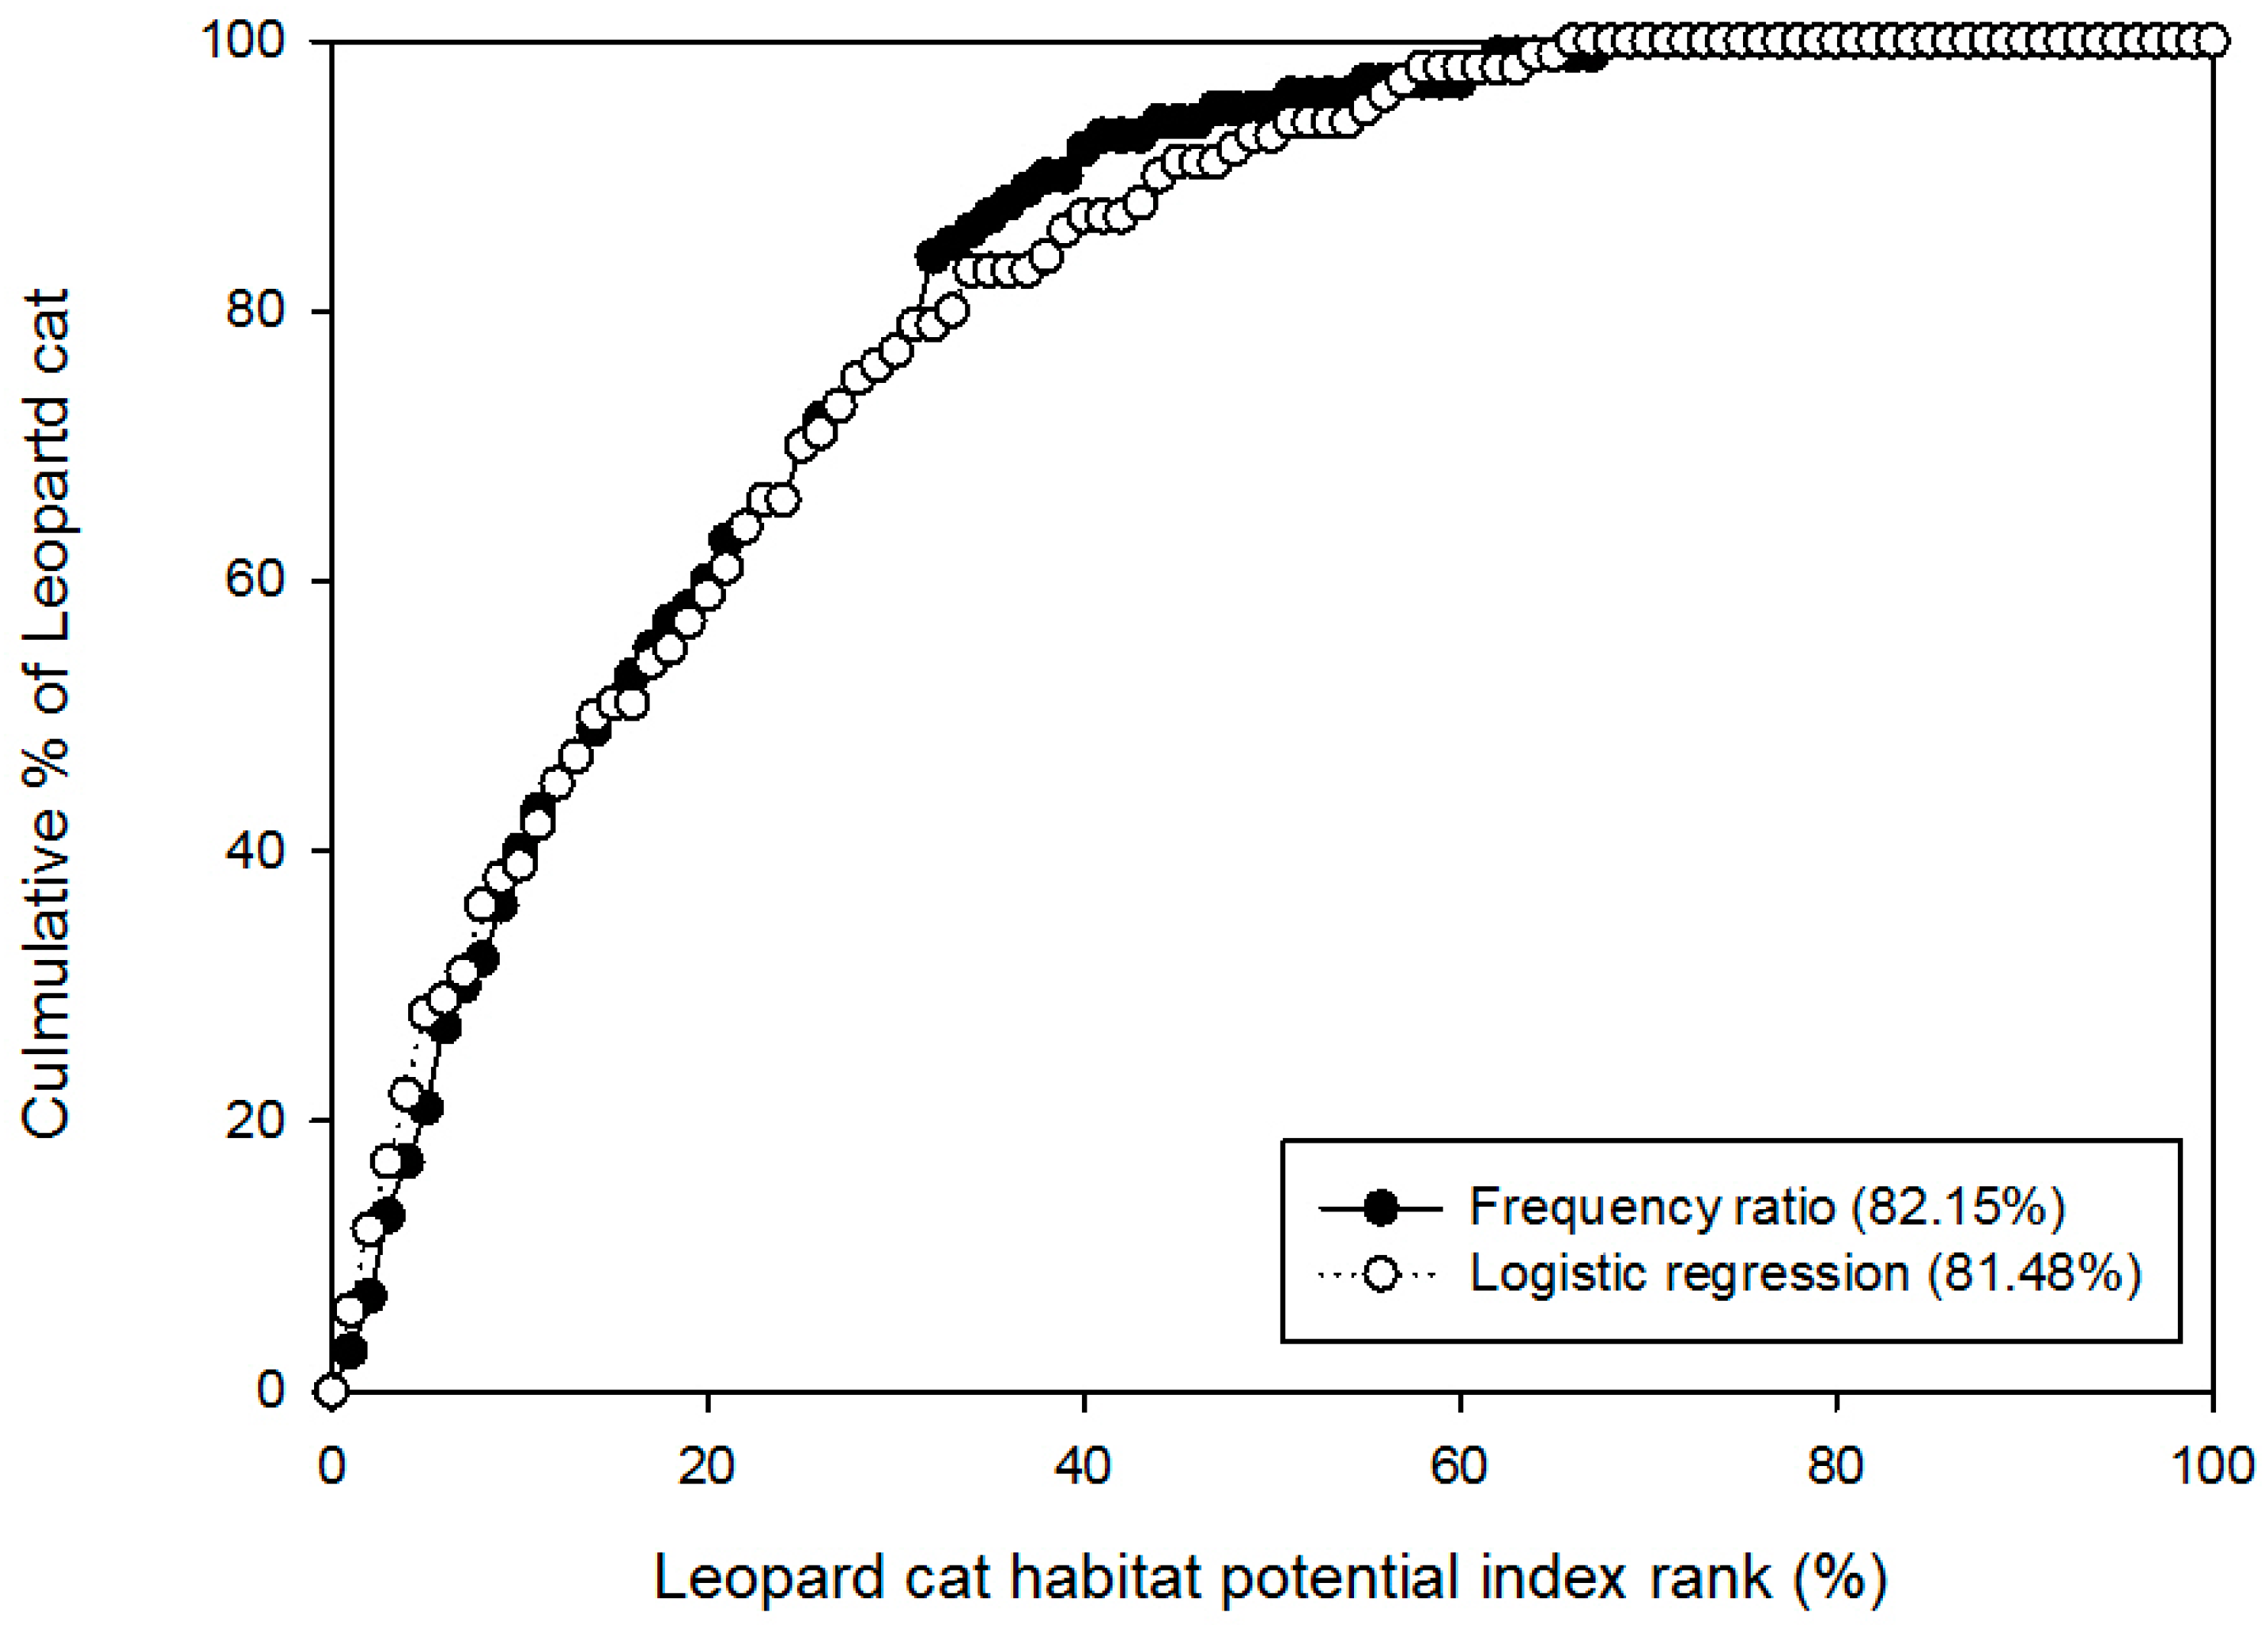
The purpose of this study was to create maps of potentially sustainable leopard cat (Prionailurus bengalensis) habitats for all of South Korea. The leopard cat, which is on the International Union for Conservation of Nature (IUCN) Red List, is the only member of the Felidae family in Korea. To create habitat potential maps, we selected various environmental factors potentially affecting the species’ distribution from a spatial database derived from geographic information system (GIS) data: elevation, slope, distance from a forest stand, road, or drainage, timber type, age, and land cover. We analyzed the spatial relationships between the distribution of the leopard cat and the environmental factors using a frequency ratio model and a logistic regression model. We then overlaid these relationships to produce a habitat potential map with a species potential index (SPI) value. Of the total number of known leopard cat locations, we used 50% for mapping and the remaining 50% for model validation. Our models were relatively successful and showed a high level of accuracy during model validation with existing locations (frequency ratio model 82.15%; logistic regression model 81.48%). The maps can be used to manage and monitor the habitat of mammal species and top predators.
Keywords: leopard cat; Prionailurus bengalensis; frequency ratio; logistic regression; geographic information system; South Korea leopard cat; Prionailurus bengalensis; frequency ratio; logistic regression; geographic information system; South Korea