Article

Insights into the Regional Greenhouse Gas (GHG) Emission of Industrial Processes: A Case Study of Shenyang, China

1
Key Lab of Pollution Ecology and Environmental Engineering, Institute of Applied Ecology, Chinese Academy of Sciences, Shenyang 10016, China
2
University of Chinese Academy of Sciences, Beijing 100049, China
*
Author to whom correspondence should be addressed.
Sustainability 2014, 6(6), 3669-3685; https://doi.org/10.3390/su6063669
Submission received: 29 March 2014 / Revised: 23 May 2014 / Accepted: 23 May 2014 / Published: 6 June 2014
(This article belongs to the Special Issue Sustainability in China: Bridging Global Knowledge with Local Action)

Abstract

:
This paper examines the GHG emission of industrial process in Shenyang city, in the Liaoning province of China, using the 2006 IPCC greenhouse gas inventory guideline. Results show that the total GHG emissions of industrial process has increased, from 1.48 Mt in 2004 to 4.06 Mt in 2009, except for a little decrease in 2008. The cement industry, and iron and steel industries, are the main emission sources, accounting for more than 90% of the total carbon emissions. GHG emissions in 2020 are estimated based on scenario analysis. The research indicates that the cement industry, and iron and steel industries, will still be the largest emission sources, and the total carbon emissions under the business as usual (BAU) scenario will be doubled in 2020 compared with that of 2009. However, when countermeasures are taken, the GHG emission will reduce significantly. Using more clinker substitutes for blended cement, and increasing direct reduction iron process and recycled steel scraps are efficient measures in reducing GHG emission. Scenario 4, which has the highest ratio of 30/70 blended cement and the highest ratio of steel with recycled steel-EAF process, is the best one. In this scenario, the industrial process GHG emission in 2020 can almost stay the same as that of 2009. From the perspective of regions, cement industry and iron and steel industry accounted for the vast majority of GHG emission in all industries. Meanwhile, these two industries become the most potential industries for reduction of GHG emission. This study provides an insight for GHG emission of different industries at the scale of cities in China.

1. Introduction

Along with the rapid industrialization and urbanization, China’s high greenhouse gas emissions have become an important issue both domestically and internationally [1,2]. China’s total CO2 emissions by fossil fuel consumption were estimated to be 2.63 billion tons in 2012, which ranked China first in the world [3]. Hence, China faces increasing international pressure to curb its CO2 emissions. The government has made the commitment of reducing CO2 emissions per unit of GDP by 40%–45% in 2020 compared with 2005 [4], and the industries sector especially the heavy industries such as steel, cement, and chemicals production, contribute most of the GHG emissions [5].
Till now, by employing various approaches, few studies have examined sources and reduction potentials of industrial GHG emissions. For example, Liaskas et al., used the algebraic disaggregation method to identify the factors influencing CO2 emissions generated in the industrial sector of European Union countries [6], Zhou et al., estimated the carbon footprint of China’s Ammonia production and analyzed the potential for carbon mitigation in the industry [7], Sheinbaum et al., analyzed Energy and CO2 emission trends of Mexico’s iron and steel industry during the period 1970–2006, examining CO2 emissions related to energy use and production process [8]. Kim and Worrell [9], and Kirschen et al. [10] present the analysis on energy-related carbon footprint in the iron and steel industrial sector of seven countries and electric arc furnace, respectively. With regard to the energy efficiency sector, Lee et al., decomposed the changes of CO2 emissions into eight factors from Taiwan’s petrochemical industries during 1984 and 1994 [11], Lin et al., identified the key factors which affecting CO2 emission changes of industrial sectors in Taiwan by using the divisia index approach [12], Hendriks et al. [13] and Van Puyvelde et al. [14] produced papers investigating emissions and reductions from the cement sector. However, most of the studies related to industrial GHG emission mainly focuses on GHG emissions from energy consumption. Put forward by the Intergovernmental Panel on Climate Change (IPCC), GHG emission of industrial process is usually discussed as one of the main components in the greenhouse gas emission inventory of different countries or regions, but seldom has intensive studies on its reduction potentials and relative countermeasures. A comprehensive study on industrial process GHG emission is necessary and is a new point of view that can contribute in a certain degree to the climate change.
Industrial process GHG emission refers to the greenhouse gas emissions from industrial processes that chemically or physically transform materials [15]. According to the report of the National Development and Reform Commission (NDRC) of China, industrial process emissions contributed about 9% of total CO2 emissions in 1994 [16]. Though relatively small at the total level, GHG emission of industrial process, characterized by its important, un-negligible and fast growth in emissions, has naturally become the research focus in this field. Ever since 1996, iron and steel output has firmly held the first place [17]. China’s steel industry has grown rapidly on the back of a huge growth in domestic demand. Crude steel production in China reached 273 million tons in 2004, about three times the figure for 1994, and accounted for around 25.8% of global steel production [18]. In addition, China was the biggest cement producing and consumption country in this world [19]. Cement output increased from 209.7 to 1868 million tonnes of cement between 1990 and 2010 in China, and now represents over half of the world’s total cement production [20].These dramatic increases in steel and cement production are consistent with the trends in energy consumption and CO2 emission. It should be mentioned that the amount of GHG emission from process-related accounted for growing larger portion in total GHG emission in China. In the year 2009, the process-related GHG emission from cement industry accounted for 54.1% of total cement industry in China [21]. The GHG emission of industrial process from iron and steel industry contributed more than 60% of the total GHG emissions in steel industry [22]. Therefore, it is crucial for researchers to focus on the study of GHG emission of the industrial process, including cement, steel and other industries.
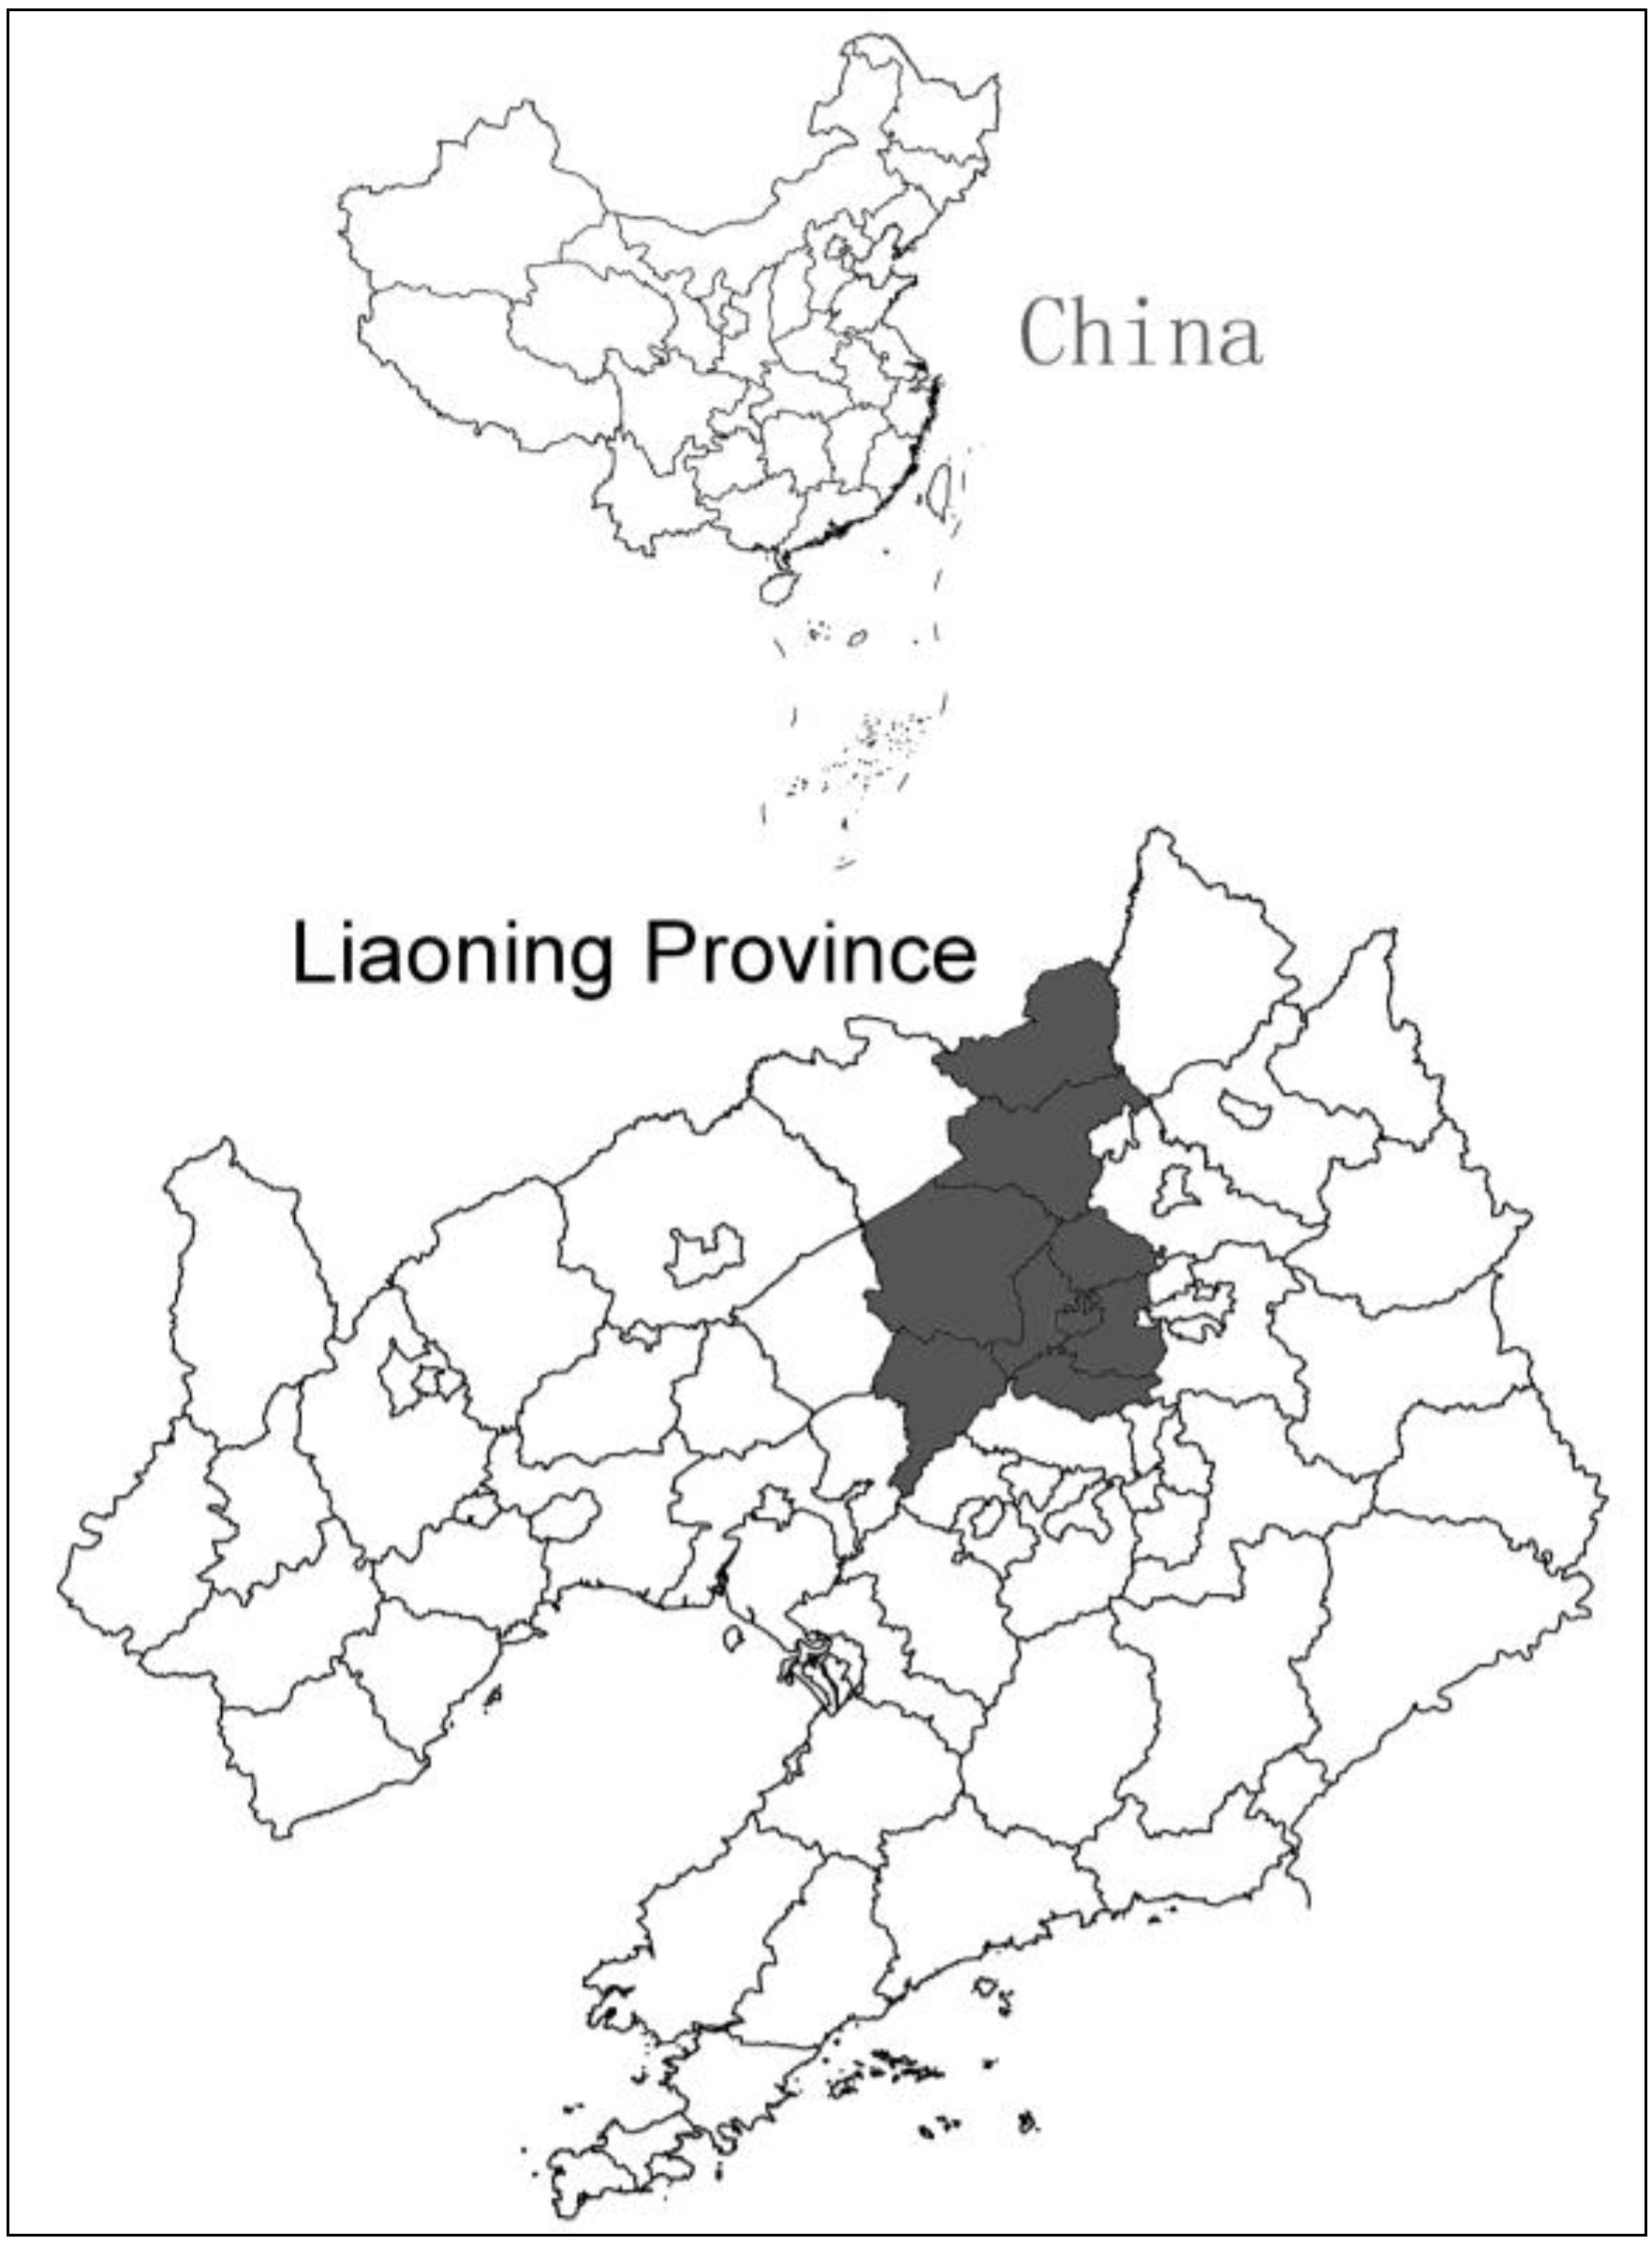
The purpose of this study is to estimate the GHG emission of the industrial process and predict its reduction potentials with scenario analysis, so as to give some policy implications to local government. Thus, this study selects a city scale as a case study to study the GHG emission of industrial process, which is more accessible and representative to make scenario analysis. The paper is structured as follows: first, we give a brief description of the background information of Shenyang city and the industrial process GHG emission; then, we present the method used to assess the GHG emission of the industrial process; third, we introduce results for the case study of Shenyang city and make a general understanding of current state of industrial process GHG emission from year 2004 to 2009; fourth, we present scenario analysis based on business as usual(BAU) scenario and scenario with countermeasures to predict future industrial process GHG emission of 2020, so that proper scenarios and feasible GHG abating measures could be obtained; and finally, conclusions are drawn.

2. Background

2.1. Study Area

Shenyang, the capital city of Liaoning Province, located in the south of northeastern China and the central of Liaoning, with an administrative area of 12,881 km2 (Figure 1). Shenyang is the biggest international metropolis of the Northeastern area of China and is known as one of the most important heavy industrial bases of China [23]. Since 2003, the central government has implemented the strategy of “revitalizing the old industrial bases in Northeastern China”, and Shenyang was selected as the first city to demonstrate the strategy. It aimed to shift the industrial structure by improving resources efficiency and reducing the environmental pressure, thus later Shenyang was identified as the core of the new-industrialization zone for national demonstration [24]. The new-industrialization zone is mainly composed of equipment manufacturing industry, metallurgical industry, and petrochemical industry, which is taken as typical and representative case in blazing a trail to new industrialization and new urbanization, and expected to offer a demonstration for China’s change in industrial development mode and economic development transformation. Under such circumstances, Shenyang’s economy and urbanization will definitely continue to increase rapidly, and industrial sectors of cement, steel and relative material requirement will take an important role.
Figure 1. Location of Shenyang City.
Sustainability 06 03669 g001

2.2. Definition of Industrial Process GHG Emission

Generally, the total GHG emission of industrial production is mainly composed of two parts: energy related emissions and process related emissions. Energy related emissions are mainly from energy consumption, such as direct emissions from combustion of fossil fuel, and indirect emissions from consumption of electricity and heat. And almost all industrial sectors cause energy related emissions. While only some industrial sectors cause process related emissions, including [25]:
  • Metal production—e.g., carbon dioxide and perfluorocarbon emissions from aluminum smelting; and carbon dioxide, methane and nitrous oxide emissions from iron and steel production.
  • Chemical industry—nitrous oxide emissions from the production of nitric acid (largely used in production of ammonium nitrate); carbon dioxide emissions from ammonia production; and methane emissions from the production of organic polymers and other chemicals.
  • Mineral products—carbon dioxide emissions from cement clinker and lime production, the use of limestone and dolomite in industrial smelting processes, soda ash use and production, magnesia production, and the use of other carbonates (sodium bicarbonate, potassium carbonate, barium carbonate, lithium carbonate and strontium carbonate).
  • Food and drink production—carbon dioxide emissions from ammonia production, carbon dioxide wells, ethylene oxide production and sodium bicarbonate use.
Consumption and production of halocarbons and sulfur hexafluoride is also covered by the industrial processes sector but are not considered in this paper for lack of data.
Industrial process GHG emission means the process related emissions discussed above. And the industrial sectors selected in this paper are determined according to the 2006 IPCC Guidelines for National Greenhouse Gas Inventories [15] and the industrial condition of Shenyang. Twelve major industrial sectors are examined including cement production, glass production, refractory production, ammonia production, methanol production; graphite and carbon black, coke production, pig iron production; raw steel production, primary aluminum production, and Lead production are focused on.

3. Methodology

3.1. GHG Emission Calculation

Estimating GHG emission resulting from the industrial process is by no means straightforward. In some industrial processes, the GHG is produced by chemical reaction (e.g., the cement production, glass production et al.); in some industrial processes, the GHG is produced by oxidization of fossil fuels used as reducing agent to smelt metals (e.g., the metallurgy industry), whereas in some other processes, the GHG is produced by the chemical reaction during the production of certain chemicals (e.g., ammonia). The estimation of GHG emissions related to industrial process was part of the IPCC 2006, which provide internationally agreed methodologies intended for use by countries to estimate greenhouse gas inventories to report to the United Nations Framework Convention on Climate Change. The estimation of GHG emissions was mainly based on the IPCC 2006 tier 1 method.
Ei,CO2 = ADi,CO2 × EFi,CO2
Sustainability 06 03669 i001
Ei,CH4 = ADi,CH4 × EFi,CH4
Sustainability 06 03669 i002
Ei = Ei,CO2 + Ei,CH4 × 21
Sustainability 06 03669 i003
where: E[tons-(t)] represents the emission amount of CO2 or CH4 from the industrial process. The final GHG emission for each industrial process is changed to CO2e after multiplying the Global warming potential 21 [26]; AD represents the activity data that is the physical production of industrial products; EF[t CO2 or CH4/t product] represents the emission factor of CO2 or CH4; i represent the index number of industrial sector.

3.2. Data Sources

We derive (i) production data from the Shenyang Statistic Yearbook (2005–2010), and (ii) process- and product-specific emission factors from IPCC 2006 and other sources [19]. Production data of the twelve industrial sectors of Shenyang City in the year 2004–2009 is shown in Table 1.
Table 1. Production data of the industrial processes in Shenyang in the year 2004–2009.
Industrial sectorProduction (t)
200420052006200720082009
Cement1,747,0921,792,4002,310,0002,854,0002,740,3933,975,319
clinker484,276553,600280,000246,000272,6103,048,451
Glass506,513413,916339,065281,815528,134477,723
Refractory products125,67143,38975,34371,372132,417200,275
Ammonia11,761304836772774/1382
Methanol87454861////
Graphite and carbon black/60262511173914021654
Coke335,075670,400763,453909,560833,739908,417
Pig iron32,93210,01632881986//
Raw steel130,223205,707201,737409,495425,883217,398
Primary aluminum58018,27010,8248980700/
Lead382352227356877124622139
Emission factors of carbon dioxide and methane for each industrial process are summarized in Table 2. It is difficult to get industrial process emission factors specified for China or Shenyang, so the emission factors are mainly from the default values of IPCC 2006. According to IPCC 2006, all the industrial sectors selected in this paper cause CO2 emissions. However, most of the industrial sectors do not cause CH4 emissions, except for methanol, carbon black, coke, pig iron, and raw steel production.
Table 2. Emission factors of the industrial process.
Industrial sectorEmission factor of CO2 (t CO2/t product)Emission factor of CH4 (10–3t CH4/t product)
Cement0.41 a/
Clinker0.52/
Glass0.12 b/
Refractory products0.20 c/
Ammonia3.27/
Methanol0.672.30
Graphite and carbon black2.620.06
Coke0.560.0001
Pig iron1.3514.50
Raw steel1.060.03
Primary aluminum1.65/
Lead0.52/
a The value is the average emission factors of China and is obtained from reference [15]. b The emission factor that does not consider cullet ratio is 0.2. The cullet ratio of glass in this paper is 0.4, hence the final emission factor for glass is 0.12. c IPCC 2006 has mentioned the refractory products, but has not given the emission factor. So the emission factor refers to that of the glass.

4. Current Industrial Process GHG Emission for Shenyang

4.1. Total GHG Emission during 2004–2009

The GHG emissions (CO2e) of industrial process from 2004 to 2009 are given in Figure 2. The total GHG footprint emission of industrial process for Shenyang is increasing year by year from 1.48 Mt in 2004 to 4.06 Mt in 2009, while decreases a little in 2008, about 2.28 Mt. It is obvious that the main component of carbon GHG footprint emission of industrial process is carbon dioxide, and methane takes up only a very small proportion. In 2004–2009, carbon dioxide accounts for 99.30%, 99.80%, 99.94%, 99.96%, 99.99%, and 99.99%, respectively, and the ratio is increasing year by year. Hence, the impact of methane can almost be neglected.
Figure 2. CarbonGHG footprintemission of industrial process from 2004 to 2009.
Sustainability 06 03669 g002

4.2. GHG Footprint Emissions of Twelve Industrial Sectors during 2004–2009

As shown in Figure 3, Cement, coke, raw steel, clinker, and glass production are the top five sectors that have the largest GHG emissions of industrial process in the years 2004–2009. GHG emissions of the five sectors add up accounting for about 91.41%, 95.01%, 96.69%, 97.83%, 98.57% and 98.77%, respectively from year 2004 to 2009. Among the top five emission sectors, cement production has the largest GHG emissions, accounting for about 40–50 percent from year 2004 to 2009, and is the most important sector that should be paid attention to. Coke production and raw steel production are two second important sectors that contribute to the total GHG emissions. Besides, the three major industrial sectors show the same emission trend with the total GHG emissions of industrial process, which is increasing year by year, although slightly decreases in 2008. It demonstrated that the variation of total GHG emission was mainly determined by the three sectors.
It can be seen from Figure 4 that the top five major emission sectors in 2004 are cement production, clinker production, coke production, raw steel production, and glass production orderly. In addition, the emission percentage is 46.43%, 16.73%, 12.47%, 9.18% and 6.73%, respectively. The total percentage of the five industrial sectors is 91.54%. In addition, the GHG emissions of the other six industrial processes account for only 8.46%. While GHG emission from coke production and raw steel production increased obviously in 2005. In addition, emissions from cement and clinker process begin to shrink. So the top five major sectors in 2005 are cement production, coke production, clinker production, raw steel production, and glass production orderly. Furthermore, the emission percentage is 40.54%, 21.23%, 16.28%, 12.34% and 4.68%, respectively. The sum of the five industrial sectors comes to about 95%. Emission percentage of cement, coke and raw steel production keeps increasing on the whole in year 2006–2008. However, emission percentage of clinker production keeps decreasing. The top five major emission sectors in 2006–2008 are cement production, coke production, raw steel production, clinker production, and glass production orderly. In addition, the sum of the five sectors in year 2006, 2007 and 2008 are 96.7%, 97.8% and 98.6% respectively. The percentage of other sectors becomes less and less, from 8.46% in 2004 to 1.42% in 2008. However, in 2009, the ratio of clinker increased significantly because a very large cement enterprises in Shenyang enlarged the production scale in 2009 so that the GHG emission of clinker industry was sharply increased.
Figure 3. Comparison of GHG emissions of twelve industrial processes from 2004 to 2009.
Sustainability 06 03669 g003
Figure 4. GHG emission profiles of major industrial processes in year 2004–2009.
Sustainability 06 03669 g004

4.3. Comparison of GHG Emission of Three Categories during 2004–2009

To compare the industrial process GHG emission from a more specific scale, the twelve industrial processes can be classified into three categories that are the cement industry, the iron and steel industries, and others. The cement industry consists of cement production and clinker production. The iron and steel industry consists of coke production, pig iron production, and raw steel production. Others mean the sum of the rest industrial processes. Analysis from Figure 5 demonstrated that GHG emission of industrial process is mainly from the cement industry, and iron and steel industry. From year 2004 to 2009, total GHG emissions of the two categories are 1.35 Mt, 1.63 Mt, 1.74 Mt, 2.25 Mt, 2.19 Mt and 3.96 Mt, respectively. And account for about 91%, 93%, 95%, 97%, 95%, and 97%, respectively. It is obvious that the total share of the two categories increases year by year from 2004 to 2009.
Analysis above shows that the cement industry, and iron and steel industry, contribute most of the industrial process GHG emission. It is mainly caused by the high consumption requirement of cement and steel with the quick urbanization and industrialization. To reduce GHG emission of industrial process, solutions can be taken from reducing the production of cement and steel by controlling consumption or lowering the emission factors by improving the industrial technique. However, China is undergoing transformation of economy development, and it is unpractical for Shenyang to reduce the production of cement and iron & steel.
Figure 5. Comparison of GHG emission of three main industrial categories in 2004–2009.
Sustainability 06 03669 g005

5. Scenario Analysis

A scenario may be defined as a “hypothetical sequence of logical and plausible (but not necessarily probable) events, constructed in order to focus attention on causal processes and decision points” [27]. Scenario analysis has been applied to diverse efforts ranging from literary descriptions to model-based projections, from visionary thinking to minor adjustments to BAU projections [28]. Scenario analysis here is to predict the GHG reduction potentials and find out feasible countermeasures. The cement industry, and iron and steel industry are the main sources of industrial process GHG emission (accounting for more than 97%), so countermeasures are only focus on the two industries. However, steel and cement industry has grown rapidly due to a huge growth on economy [29]. And the growth is expected to continue over the next few years. Hence, it is more feasible to reduce the emission factors than reduce the production of both the cement, iron and steel industries. Solutions for less GHG emissions may be from the improvement of production technique, adoption of new technologies, implementation of incentive measures or other policies that can reduce GHG emission factors.

5.1. Countermeasures Introduction

For cement industry, the industrial process GHG emission accounts for about 52% of the total cement production emissions [30], and it is mainly caused by the chemical process of making clinker, so measures can be taken from the aspects of using clinker substitute, which can reduce the amount of limestone that needs to be reacted at the cement plant while maintaining the amount of cement produced [14]. The cement industry is a typical example of “scavenger” in industrial ecology [31]. The practices of utilizing different wastes in cement production process has been known for quite a long time, which is now recognized as one opportunity for reducing CO2 emissions [32].
Mineral components (MC), including pozzolana, blast furnace slag, fly ash, and waste materials from other production processes such as steel and coal-fired power production, can be used as clinker substitute to produce blended cement [33]. The clinker fraction of different cement types can range from a high of 95%–97% for a straight Portland cement, to 25% or less for cement (Table 3) [15]. And scenarios for cement was designed based on the percentage of different blended cement types.
Table 3. Percent clinker in the cement production mix (Source: IPCC 2006).
Country production Mix (PC/blend) aPercent additives (pozzolana + slag) in the blended cement b
10%20%30%40%75%
0/1008576665724
15/858779716326
25/758881746642
30/708882756845
40/608984787252
50/509085817660
60/409187848066
70/309289868474
75/259390888577
85/159492918984
100/0Straight Portland cement having 95% clinker fraction
a Country production mix refers to the range of products of a country, e.g., “75/25” means 75% of total production is Portland cement (PC) and the rest is blended cement. b The inclusion of slag allows for a base to the blend of Portland or Portland blast furnace slag cement or both. All Portland in blended cement is assumed to be 95% clinker.
For the iron and steel industry, the industrial process GHG emission is complicated. Steel production can occur at integrated facilities from iron ore, or at secondary facilities that produce steel mainly from recycled steel scrap. Integrated facilities typically include coke production, pig iron production by blast furnaces (BF), and raw steel production by basic oxygen furnaces (BOFs), or open hearth furnaces (OHFs) some times. Raw steel is more often produced by using BOFs than by using OHFs from pig iron produced by the BFs, and secondary steelmaking usually, however, occurs in electric arc furnaces (EAFs).The iron and steel industrial process emissions come from three major processes: coke production, BF, and BOF (OHF or EAF). However, most emissions are from BF/OHF and coke production, and emissions from EAF are relatively small. Besides, direct reduced iron (DRI) process, in which coke is not needed, is a high quality, low energy consumption and low pollution process. DRI is normally used as a replacement for scrap metal in the electric arc furnace steelmaking route or used as coolant in the BOFs to improve the production of raw steel, and is encouraged by the government. It is a good substitute for BF and should be encouraged. Emission factors for separate processes are shown in Table 4. So measures can be taken from the aspect of steel production types. If steel were produced directly from recycled scrape steel, process of BF and coke will be omitted and GHG emission can be reduced significantly. It is inevitably to make steel from iron ore. In this case, GHG reduction can be achieved by using the DRI process to instead the traditional BF process.
Table 4. Emission factors of separate iron and steel production processes (Source: [15]).
Steel production processcokeBFDRIOHFBOFEAF
Emission factor (t CO2e/ t product)0.561.350.700.370.110.08

5.2. Scenario Building

Five scenarios are supposed, business as usual (BAU) scenario and four with countermeasures. BAU scenario, with no countermeasures, assumes that the production of industrial process increase with linear growth, and emission factors keep the same as current emission factors. Scenarios with countermeasures assume that the productions of industrial sectors are the same as BAU, but the values of emission factors are reduced through various countermeasures. Scenarios for cement industry and iron and steel industry are supposed in Table 5. The cement type is a little different from that in Table 3. It is not the ratio of PC and blended cement, but the ratio of PC and MC. For instance, “70/30” means the blended cement with 70% of PC and 30% of MC additives. BAU scenario shows that the situation of China’s current cement production mix is 63% Portland cement and 37% 50/50 blended cement. From scenario 1 to scenario 4, the ratio of Portland cement becomes less and less, and ratio of high MC content blended cement increases. The BAU scenario for raw steel production is based on the default composition of steel production in IPCC 2006. For scenario 1, 50% of the steel in Shenyang is produced by the iron ore-BF-BOF production process, 20% is produced by the iron ore-DRI-BOF production process, and 30% is made from recycled steel-EAF process. The ratio of steel produced by recycled steel-EAF production process increased, and ratio of steel produced by iron ore-DRI-BOF process decreases from scenario 1 to scenario 4.
Table 5. Scenarios for cement industry, and iron and steel industry.
SectorBAUScenario 1Scenario 2Scenario 3Scenario 4
Blended cement type100/063%55%40%20%10%
70/30010%20%20%10%
50/5037%25%20%30%40%
30/70010%20%30%40%
Steel production typeIron ore-BF-BOF65%50%30%10%0%
Iron ore-DRI-BOF5% a20%30%40%30%
Recycled steel-EAF30%30%40%50%70%
a In BAU scenario, 5% does not means the ratio of iron ore-DRI-BOF (EAF) production type but that of iron ore-BF-OHF type. That is to say raw steel is produced using OHFs from pig iron produced by the BFs.
Emission factors for different cement type are calculated based on the clinker content. Portland cement is assumed to be 95% clinker. Values calculated for cement type are: % PC*95%*0.52. While for different steel production type, the emission factors are the sum of emission factors of corresponding separate processes in Table 4. The final results are demonstrated in Table 6.
Table 6. Emission factors of different cement and steel types.
Blended cement type (PC/MC)Emission factor (t CO2e/t cement)Steel production typeEmission factor (t CO2e/t steel)
100/00.49Iron ore-BF-BOF1.46
70/300.35Iron ore-DRI-BOF0.81
50/500.25Recycled steel-EAF0.08
30/700.15Coke0.56

5.3. Results and Discussions

The forecast of GHG emission of BAU scenario is shown in Table 7. Results show that GHG emission of industrial sectors such as ammonia, methanol, carbon black, pig iron, primary aluminum and lead disappeared by linear regression in 2020. Only six major industrial sectors exist, of which cement, clinker, raw steel, and coke are still the largest emission sectors, accounting for about 98% of the total GHG emissions. Cement, iron and steel industries are still the largest emission sources. However, the total GHG emissions under this forecast will increase obviously, reaching to about 8.28 Mt that is about two times of 4.06 Mt in year 2009.
GHG emissions of the four scenarios with countermeasures are shown in Table 8. It demonstrates that all the four scenarios have impact on reducing industrial process GHG emission compared with BAU scenario. The total GHG emissions of cement, iron and steel industries for scenario 1 to 4 are 85%, 74%, 60% and 49% of the BAU scenario, respectively. Scenario 4 is the best one, and its total GHG emissions can almost keep the same with that of 2009.Comparing cement, iron and steel industries, it is more sensitive for the iron and steel industry than for the cement industry to keep the GHG emissions. Take scenario 4 for an example, the GHG emission of cement and clinker is predicted to be 1.98 Mt and 1.70 Mt respectively, which are still larger than 1.63 Mt and 1.59 Mt in year 2009 (or are larger than half that of the BAU scenario). While for raw steel and coke production process, the GHG emissions are to be controlled at 0.23 Mt and 0.1 Mt respectively, which are smaller than 0.23 Mt and 0.51 Mt in year 2009 (or are far smaller than that of the BAU scenario). However, because of the big difference of base numbers, the absolute values for cement industry are bigger than that for the iron and steel industry.
Table 7. Estimated industrial production and GHG emissions in 2020.
Industrial sectorsProduction (t)GHG emission (t CO2e)
Cement8,173,9543,351,321.21
Clinker5,421,0912,818,967.30
Glass479,08857,490.58
Refractory353,44370,688.68
Ammonia//
Methanol//
Graphite and carbon black//
Coke2,087,8671,169,209.97
Pig iron//
Raw steel768,107814,677.71
Primary aluminum//
Lead//
Total/8,282,355.45
Table 8. Estimated GHG emissions of different scenarios in 2020 (t CO2e).
SectorBAUScenario 1Scenario 2Scenario 3Scenario 4
Cement industry100/0 2,220,863.301,615,173.31807,586.66403,793.33
70/30 282,818.81565,637.62565,637.62282,818.81
50/50 504,741.66403,793.33605,689.99807,586.66
30/70 120,974.52241,949.04362,923.56483,898.08
Sum3,351,321.213,129,398.292,826,553.292,341,837.821,978,096.87
Clinker a2,818,967.302,695,408.692,434,562.692,017,209.081,704,193.88
Iron and steel industryIron ore-BF-BOF 560,718.11336,430.87112,143.620.00
Iron ore-DRI-BOF 124,433.33186,650.00248,866.67186,650.00
Recycled steel-EAF 18,434.5724,579.4230,724.2843,013.99
Sum814,677.71703,586.01547,660.29391,734.57229,663.99
Coke b1,169,209.97376,485.59265,176.81153,868.0298,213.63
Total8,154,176.196,904,878.586,073,953.084,904,649.494,010,168.37
a The content of clinker in different types of cements is different. So consumption of clinker and emissions from clinker will change with different scenarios. GHG emission of clinker in different scenarios is calculated according to the ratio of different scenario to BAU scenario. b Coke are used only in the iron ore-BF-BOF production type, so for different steel production type, the consumption of coke varied accordingly. However, not all the coke obtained from the Statistic Yearbook is used for iron and steel sector. It can also be used for other uses. Here 85 percent of the coke production is assumed for iron and steel production and 15 percent is for other uses.
This study discussed GHG reduction measures from the aspect of technology. For cement industry, scenarios focus mainly on clinker substitute. It is one of the four technological measures summarized by the World Business Council for Sustainable Development [34], and shows larger potentials than the other three measures [35]. The efficiency of clinker substitute in GHG reduction is manifested in this paper. It is also useful for energy related emission reduction and can benefit relative industries that produce MIC wastes. Average ratio of PC/S is 85/15 in China, and large potential for blended cement can be expected [36]. However, MIC resources are in decline and most of the world production of suitable blast furnace slag and fly ash are already destined for use in the cement industry [37]. As for the iron and steel industry, DRI process is a promising technique for GHG reduction in industrial process. GHG emission was reduced not only during the process itself, but also in the coke production process for less coke needed. Besides, production type of recycled steel-EAF is effective in reducing the GHG emission, due to the high proportion of recycled scrap and the use of electrical energy [10]. Increasing the ratio of DRI and recycled iron and steel will be efficient measures in reducing GHG emission, only if corresponding technique is available [38].
For the rapidly developing regions, industrial CO2 emission is affected by both industrial production changes and process technology [39]. Hence, there is more GHG reduction potential if industrial activity/production were considered. Such measures may include new additives that can reduce the amount of cement requirement, other low carbon building materials that can replace cement, adjustment measures that can control the population and construction, etc. However, industrial activity/production is not discussed in this study for two reasons. Firstly, it is complicate to consider the influencing factors and difficult to quantify the factors for building prediction model. Secondly, the final result of the measures is the reduction of industrial production, and this can be easily figured out based on the results obtained in this paper.

6. Conclusions

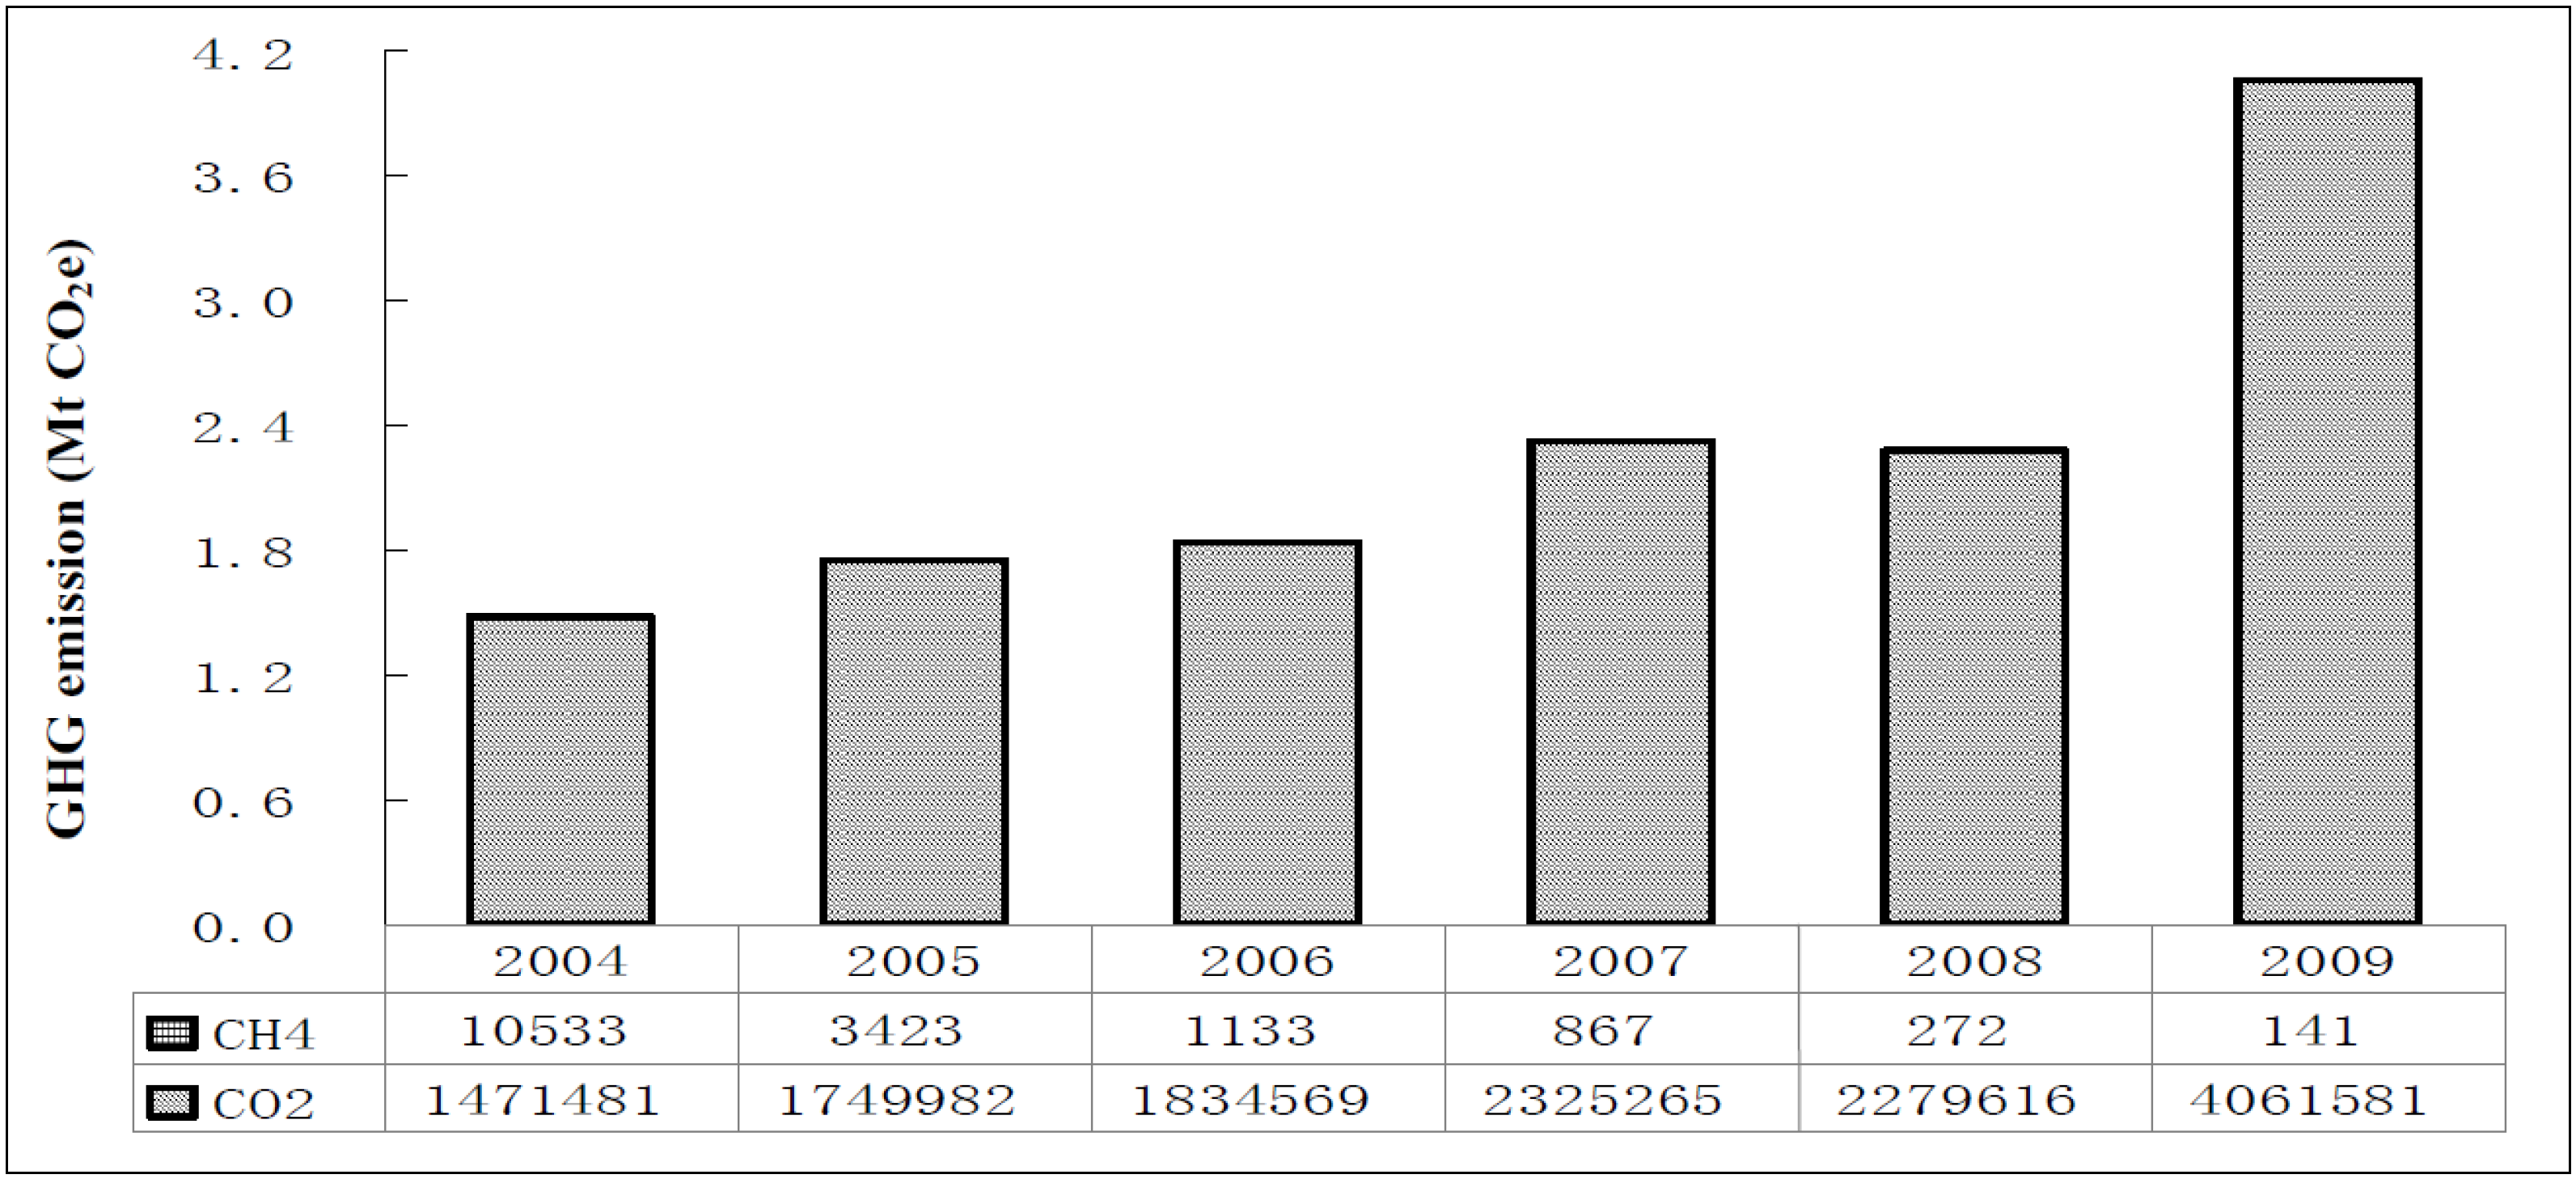
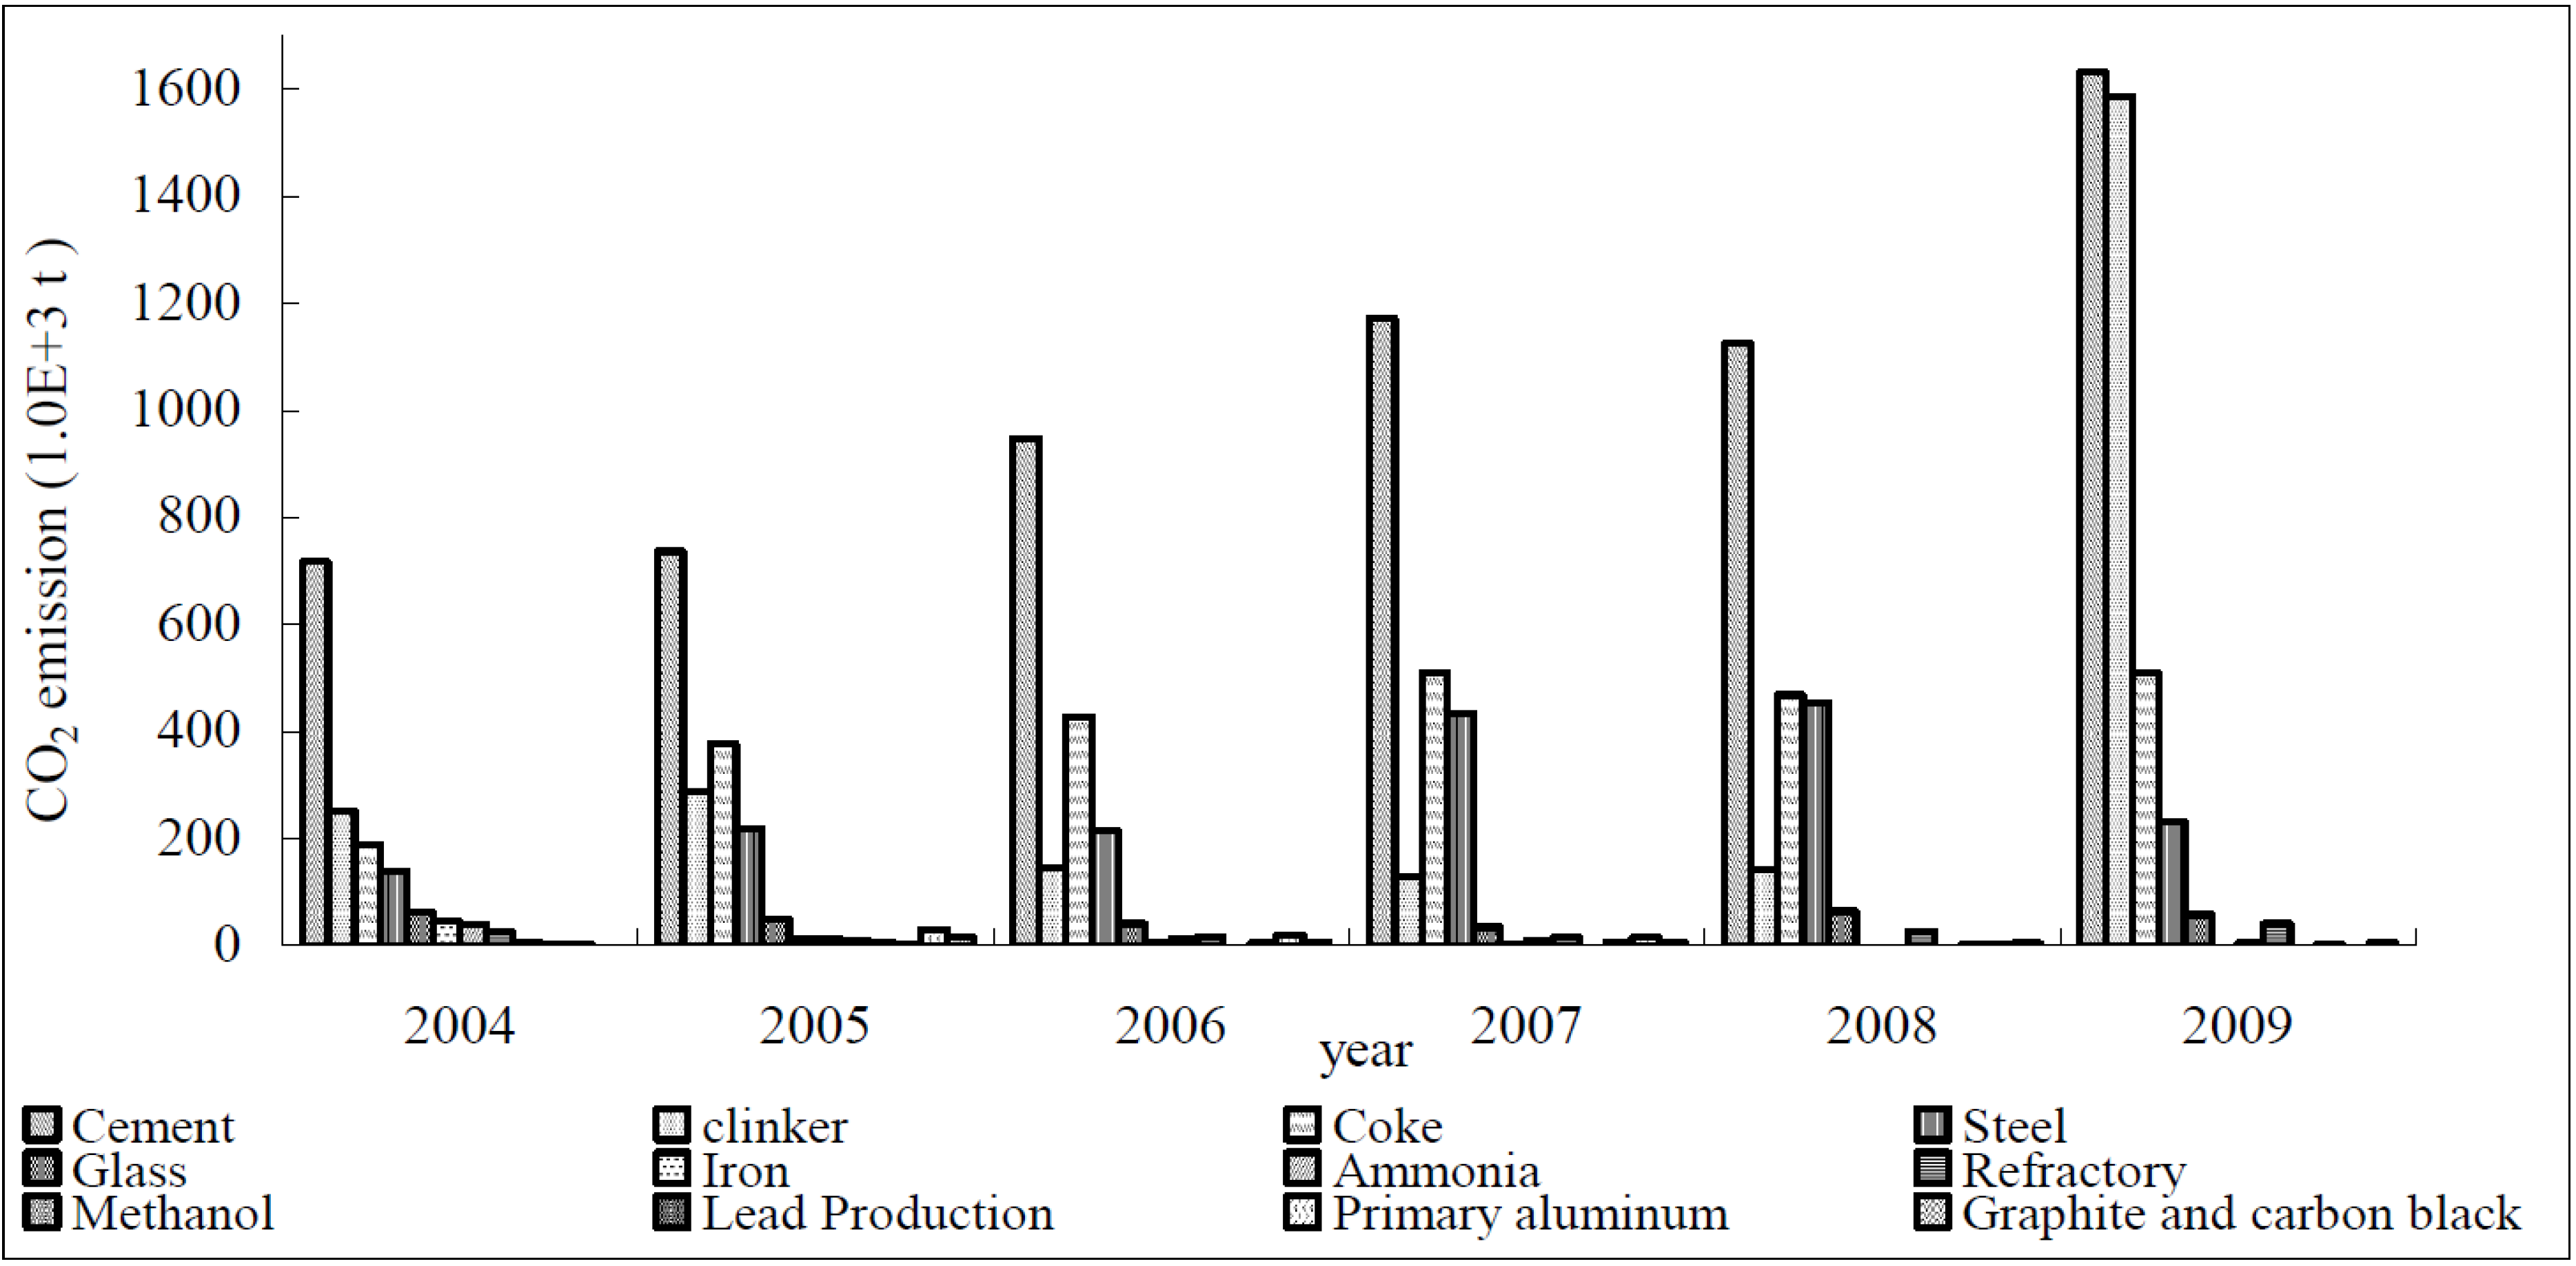
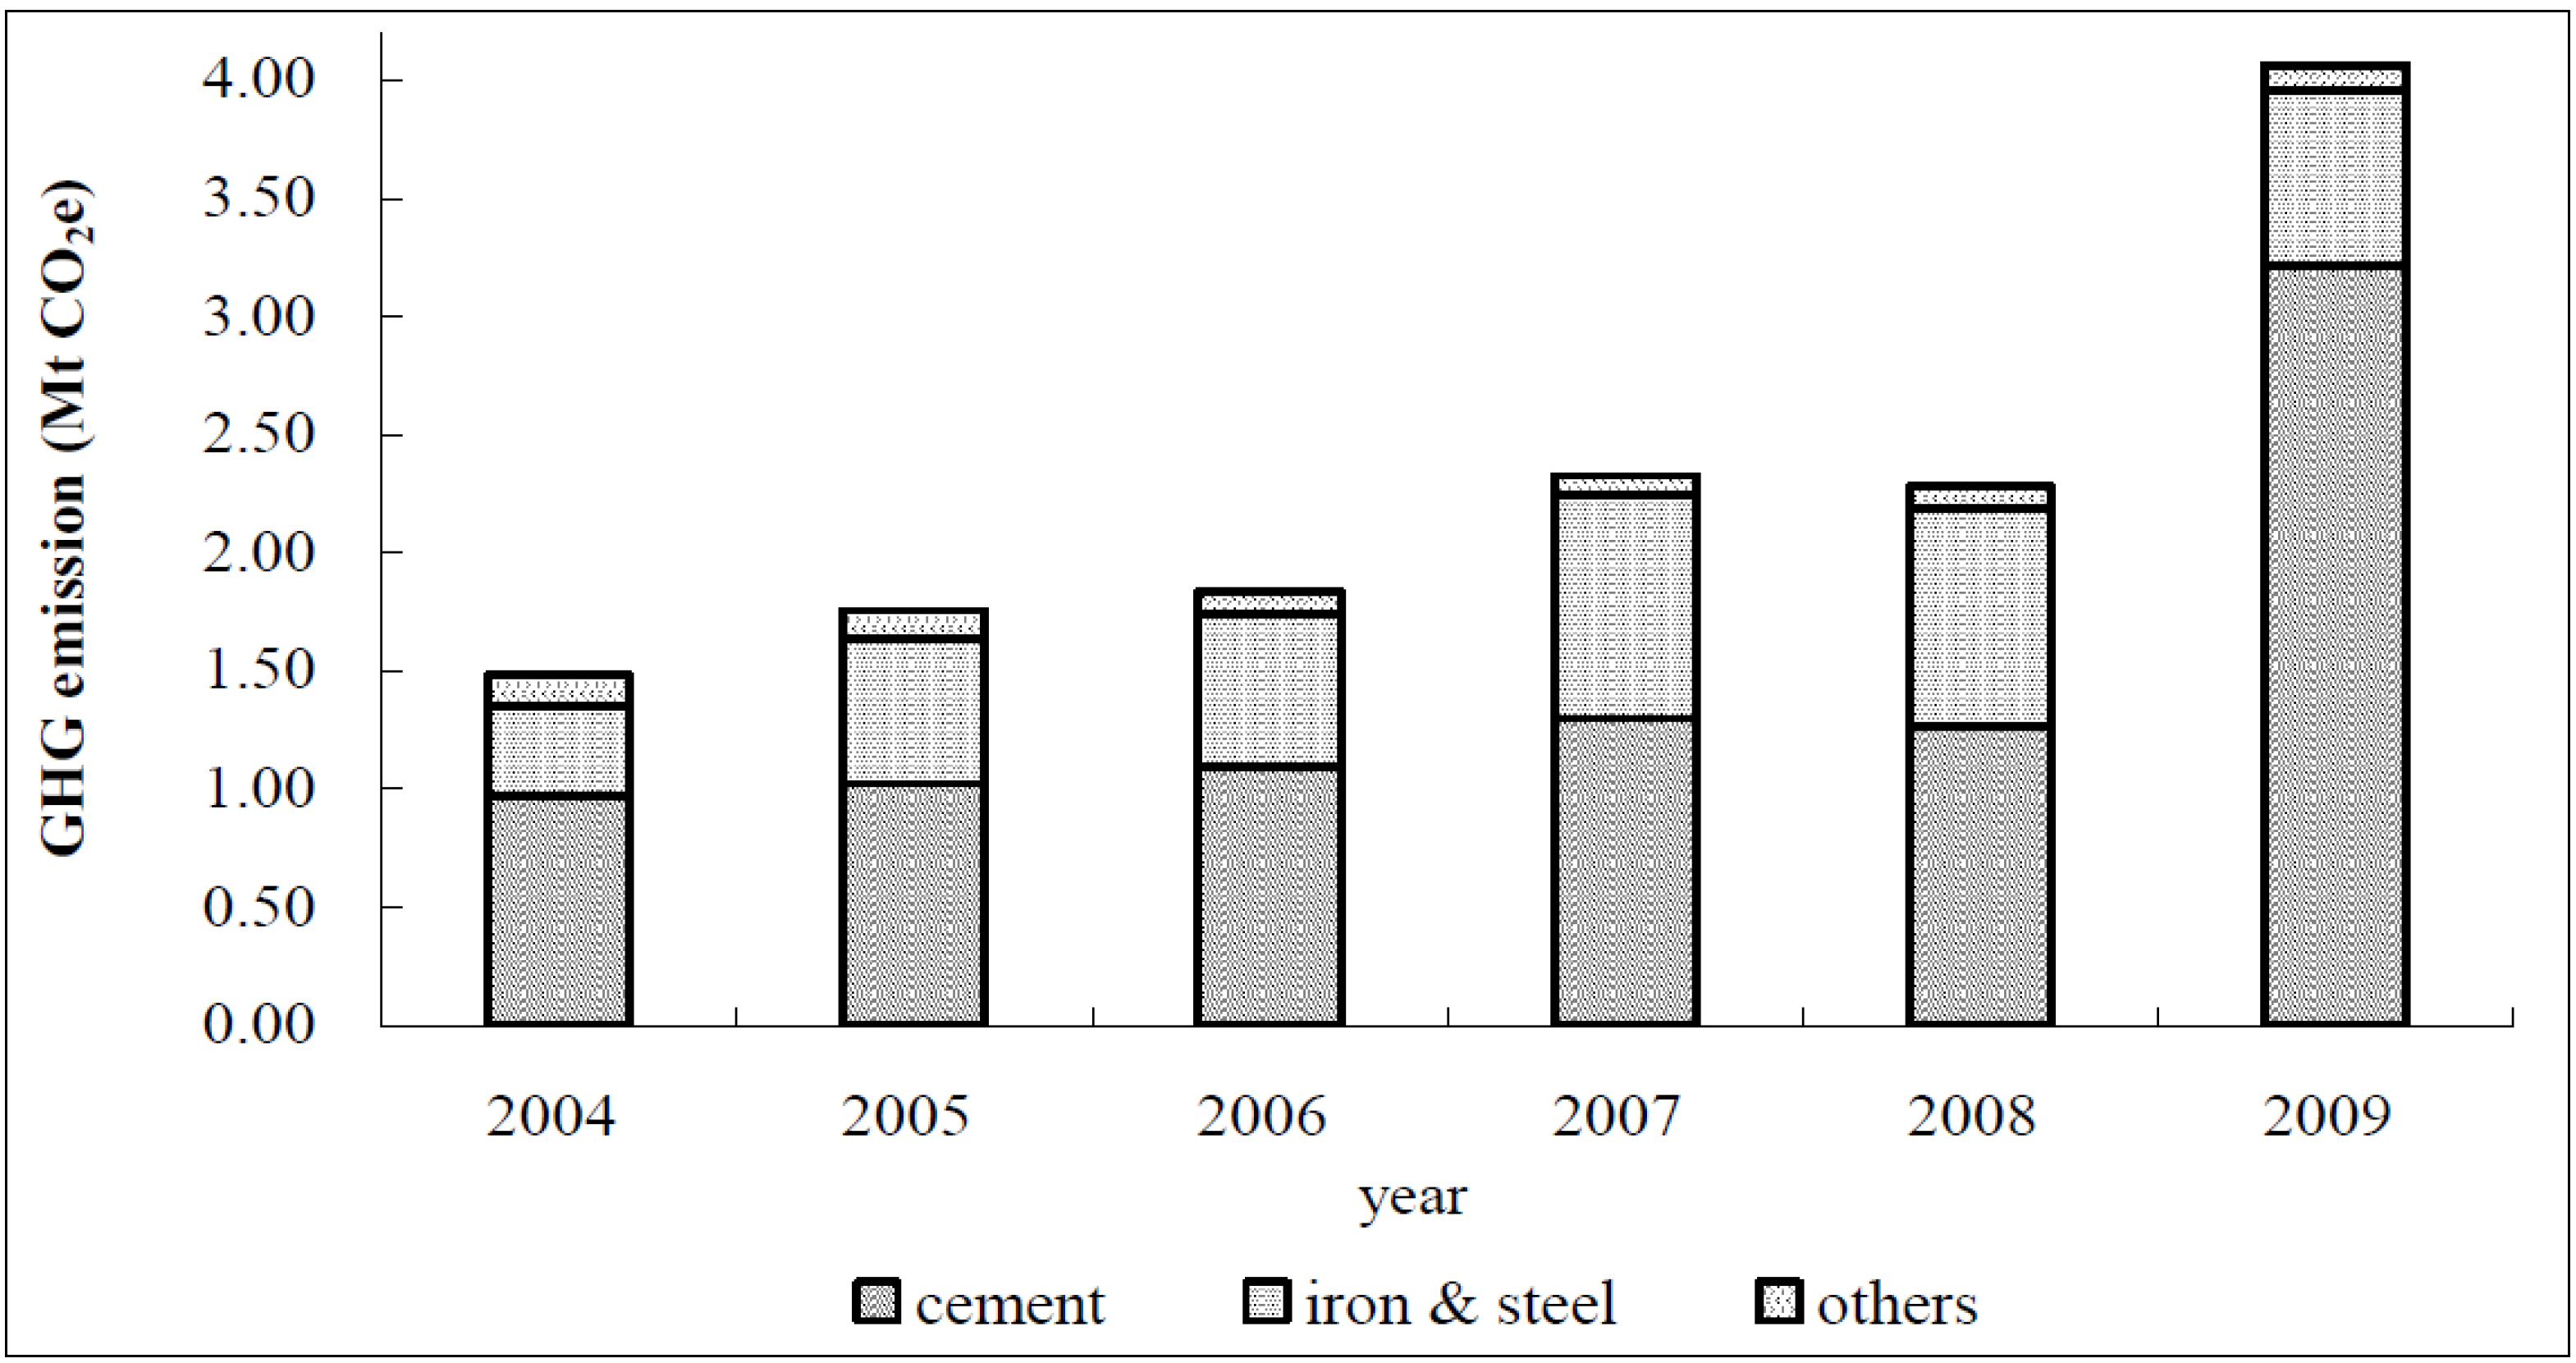
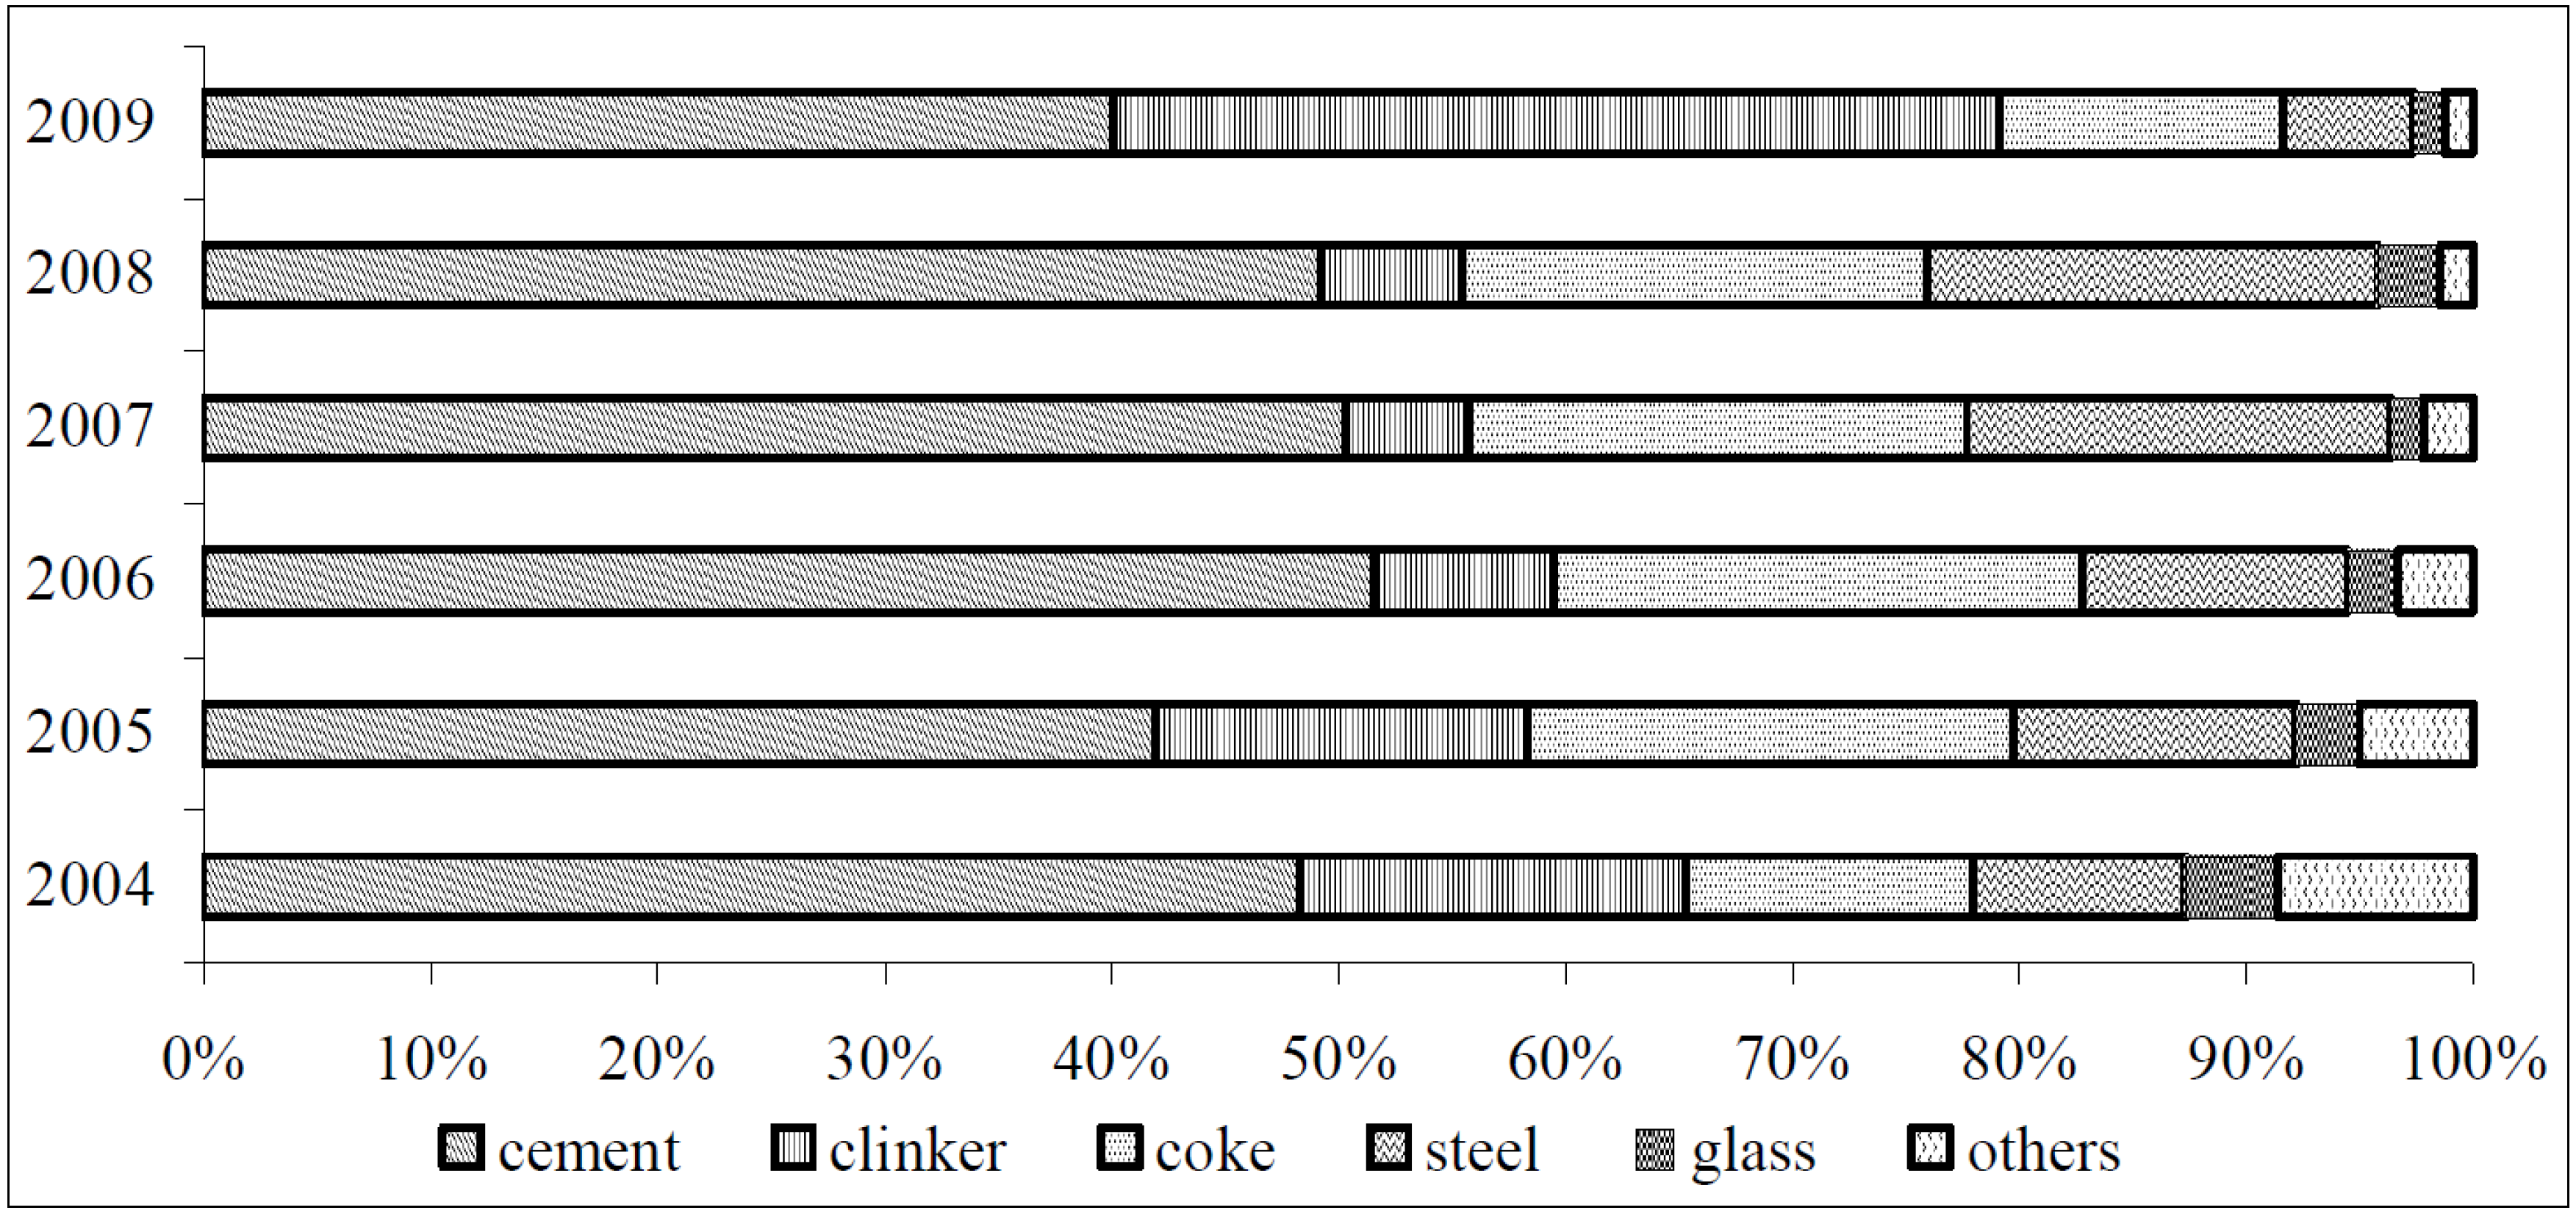
Industrial process GHG emissions increase quickly with fast urbanization and industrialization. Intensive study of the industrial process GHG emission should be investigated to respond to climate change. This paper simulates industrial process GHG emission and its reduction potentials by taking feasible technological measures, taking Shenyang as a case. Twelve industrial sectors that cause industrial process emissions are selected for study. Results indicate that industrial process GHG emission shows an increasing trend from year 2004 to 2009, although decreasing a little in 2008. The cement, iron the steel sectors are the main sources of industrial process GHG emission, occupying more than 90 percent.
Based on scenario analysis, one BAU and four with different countermeasures, the industrial process GHG emission of Shenyang in 2020 is predicted. The results show that if the industrial sectors go under current trend (BAU scenario), the total GHG emissions will reach 8.28 Mt in 2020, about two times of that of 2009. However, the four other scenarios with countermeasures prove to be effective in reducing industrial process GHG emission. And scenario 4 is the best one. It can almost keep the GHG emission at the same level as that of 2009. It can be demonstrated from scenario analysis that using clinker substitute for blended cement and increasing the ratio of DRI process and recycled steel will be efficient measures for Shenyang.

Acknowledgments

This work is supported by Natural Science Foundation of China (71325006, 41101126, 71033004 and 71303230), 100 Talents Program of the Chinese Academy of Sciences (2008-318), Ministry of Science and Technology of China (2011BAJ06B01; 2011DFA91810).

Author Contributions

Liu and Dong drafted the paper and contributed to data collection and calculation; Dong, Geng, Lu and Ren contributed to data analysis.

Conflicts of Interest

The authors declare no conflict of interest.

References

  1. Guan, D.; Liu, Z.; Geng, Y.; Lindner, S.; Hubacek, K. The gigatonne gap in China’s CO2 inventories. Nat. Clim. Change 2012, 2, 672–675. [Google Scholar]
  2. Xue, B.; Ren, W. China’s uncertain CO2 emissions. Nat. Clim. Change 2012, 2. Article 762. [Google Scholar]
  3. Boden, T.; Andres, J.; Marland, G. Global, Regional, and National Fossil-Fuel CO2 Emissions; Carbon Dioxide Information Analysis Center: Oak Ridge, TN, USA, 2013. [Google Scholar]
  4. Ma, Z.; Xue, B.; Geng, Y.; Ren, W.; Fujita, T.; Zhang, Z.; de Oliveira, J.P.; Jacques, D.A.; Xi, F. Co-benefits analysis on climate change and environmental effects of wind-power: A case study from Xinjiang, China. Renew. Energ. 2013, 57, 35–42. [Google Scholar] [CrossRef]
  5. Geng, Y.; Zhao, H.; Liu, Z.; Xue, B.; Fujita, T.; Xi, F. Exploring driving factors of energy-related CO2 emissions in Chinese provinces: A case of Liaoning. Energ. Pol. 2013, 60, 820–826. [Google Scholar] [CrossRef]
  6. Liaskas, K.; Mavrotas, G.; Mandaraka, M.; Diakoulaki, D. Decomposition of industrial CO2 emissions: The case of European Union. Energ. Econ. 2000, 22, 383–394. [Google Scholar] [CrossRef]
  7. Zhou, W.; Zhu, B.; Li, Q.; Ma, T.; Hu, S.; Griffy-Brown, C. CO2 emissions and mitigation potential in China’s ammonia industry. Energ. Pol. 2010, 38, 3701–3709. [Google Scholar] [CrossRef]
  8. Sheinbaum, C.; Ozawa, L.; Castillo, D. Using logarithmic mean divisia index to analyze changes in energy use and carbon dioxide emissions in Mexico’s iron and steel industry. Energ. Econ. 2010, 32, 1337–1344. [Google Scholar] [CrossRef]
  9. Kim, Y.; Worrell, E. International comparison of CO2 emission trends in the iron and steel industry. Energ. Pol. 2002, 30, 827–838. [Google Scholar] [CrossRef]
  10. Kirschen, M.; Risonarta, V.; Pfeifer, H. Energy efficiency and the influence of gas burners to the energy related carbon dioxide emissions of electric arc furnaces in steel industry. Energy 2009, 34, 1065–1072. [Google Scholar] [CrossRef]
  11. Lee, C.; Lin, S. Structural decomposition of CO2 emissions from Taiwan’s petrochemical industries. Energ. Pol. 2001, 29, 237–244. [Google Scholar] [CrossRef]
  12. Lin, S.; Lu, I.; Lewis, C. Identifying key factors and strategies for reducing industrial CO2 emissions from a non-Kyoto protocol member’s (Taiwan) perspective. Energ. Pol. 2006, 34, 1499–1507. [Google Scholar] [CrossRef]
  13. Hendriks, C.; Worrell, E.; de Jager, D.; Blok, K.; Riemer, P. Emission reduction of greenhouse gases from the cement industry. In Proceedings of the Fourth International Conference on Greenhouse Gas Control Technologies, Interlaken, Switzerland, 1998; pp. 939–944.
  14. Van Puyvelde, D. CCS opportunities in the Australian Industrial Processes sector. Energ. Procedia 2009, 1, 109–116. [Google Scholar] [CrossRef]
  15. Intergovernmental Panel on Climate Change (IPCC). Guidelines for National Greenhouse Gas Inventories; IPCC: Hayama, Japan, 2006. [Google Scholar]
  16. Chen, H.M. Analysis on Embodied CO2 Emissions Including Industrial Process Emission. China Popul. Resour. Environ. 2009, 19, 25–30. [Google Scholar]
  17. Hu, X.; Ping, H.; Xie, C.; Hu, X. Globalization and China’s iron and steel industry: Modeling China’s demand for steel importation. J. Chin. Econ. Foreign Trade Stud. 2008, 1, 62–74. [Google Scholar] [CrossRef]
  18. IISI. Steel Statistical Year Book; International Iron and Steel Institute: Brussels, Belgium, 2004. [Google Scholar]
  19. Cai, W.; Wang, C.; Wang, K.; Zhang, Y.; Chen, J. Scenario analysis on CO2 emissions reduction potential in China’s electricity sector. Energ. Pol. 2007, 35, 6445–6456. [Google Scholar] [CrossRef]
  20. MIIT. Cement industry 12th Five-Year Development Plan. Ministry of Industry and Information Technology of the People’s Republic of China: Beijing, China, 2011. [Google Scholar]
  21. Wang, Y.; Zhu, Q.; Geng, Y. Trajectory and driving factors for GHG emissions in the Chinese cement industry. J. Cleaner Production 2013, 53, 252–260. [Google Scholar] [CrossRef]
  22. Tian, Y.; Zhu, Q.; Geng, Y. An analysis of energy-related greenhouse gas emissions in the Chinese iron and steel industry. Energ. Pol. 2013, 56, 352–361. [Google Scholar] [CrossRef]
  23. Ren, W.; Xue, B.; Geng, Y.; Sun, L.; Ma, Z.; Zhang, Y.; Mitchell, B.; Zhang, L. Inventorying heavy metal pollution in redeveloped brownfield and its policy contribution: Case study from Tiexi district, China. Land Use Pol. 2014, 38, 138–146. [Google Scholar] [CrossRef]
  24. Ren, W.; Geng, Y.; Xue, B.; Fujita, T.; Ma, Z.; Jiang, P. Pursuing co-benefits in China’s old industrial base: A case of Shenyang. Urban Clim. 2012, 1, 55–64. [Google Scholar] [CrossRef]
  25. Department of Climate Change and Energy Efficiency (DCCEE). Industrial Process Emissions Projections 2010; DCCEE: Caberra, Australian, 2010. [Google Scholar]
  26. Revised 1996 IPCC Guidelines for National Greenhouse Gas Inventories; Intergovernmental Panel on Climate Change: Brussels, Belgium, 1997.
  27. Shiftan, Y.; Kaplan, S.; Hakkert, S. Scenario building as a tool for planning a sustainable transportation system. Transp. Res. Part D 2003, 8, 323–342. [Google Scholar]
  28. Swart, R.; Raskin, P.; Robinson, J. The problem of the future: sustainability science and scenario analysis. Global Environ. Change 2007, 14, 137–146. [Google Scholar] [CrossRef]
  29. Wang, K.; Wang, C.; Lu, X.; Chen, J. Scenario analysis on CO2 emissions reduction potential in China’s iron and steel industry. Energ. Pol. 2007, 35, 2320–2335. [Google Scholar] [CrossRef]
  30. Baumert, K.; Herzog, T.; Pershing, J. Navigating the Numbers: Greenhouse Gas Data and International Climate Policy; The World Resources Institute: Washington, DC, USA, 2005. [Google Scholar]
  31. Reijnders, L. The cement industry as a scavenger in industrial ecology and the management of hazardous substances. J. Ind. Ecol. 2008, 11, 15–25. [Google Scholar] [CrossRef]
  32. Hashimoto, S.; Fujita, T.; Geng, Y.; Nagasawa, E. Realizing CO2 emission reduction through industrial symbiosis: A cement production case study for Kawasaki. Resour. Conservat. Recycl. 2010, 54, 704–710. [Google Scholar] [CrossRef] [Green Version]
  33. World Business Council for Sustainable Development (WBCSD). CO2 Accounting and Reporting Standard for the Cement Industry; WBCSD: Geneva, Switzerland, 2005. [Google Scholar]
  34. WBCSD/IEA. Cement Technology Roadmap 2009: Carbon Emissions Reductions up to 2050; International Energy Agency: Paris, France, 2009. [Google Scholar]
  35. Lei, Y.; Zhang, Q.; Nielsen, C.; He, K. An inventory of primary air pollutants and CO2 emissions from cement production in China, 1990–2020. Atmos. Environ. 2011, 45, 147–154. [Google Scholar] [CrossRef]
  36. Worrell, E.; Price, L.; Martin, N.; Hendriks, C.; Meida, L. Carbon dioxide emissions from the global cement industry energy environment. Annu. Rev. Energy Environ. 2001, 26, 303–329. [Google Scholar] [CrossRef]
  37. Tyrer, M.; Cheeseman, C.; Greaves, R.; Claisse, P.; Ganjian, E.; Kay, M.; Churchman-Davies, J. Potential for carbon dioxide reduction from cement industry through increased use of industrial pozzolans. Adv. Appl. Ceram. 2010, 109, 275–279. [Google Scholar]
  38. Zeng, S.; Lan, Y.; Huang, J. Mitigation paths for Chinese iron and steel industry to tackle global climate change. Int. J. Greenh. Gas Control. 2009, 3, 675–682. [Google Scholar] [CrossRef]
  39. Akashi, O.; Hanaoka, T.; Matsuoka, Y.; Kainuma, M. A projection for global CO2 emissions from the industrial sector through 2030 based on activity level and technology changes. Energy 2011, 36, 1855–1867. [Google Scholar] [CrossRef]

