A Systematical Framework of Schedule Risk Management for Power Grid Engineering Projects’ Sustainable Development

 ,
,
Abstract
:1. Introduction
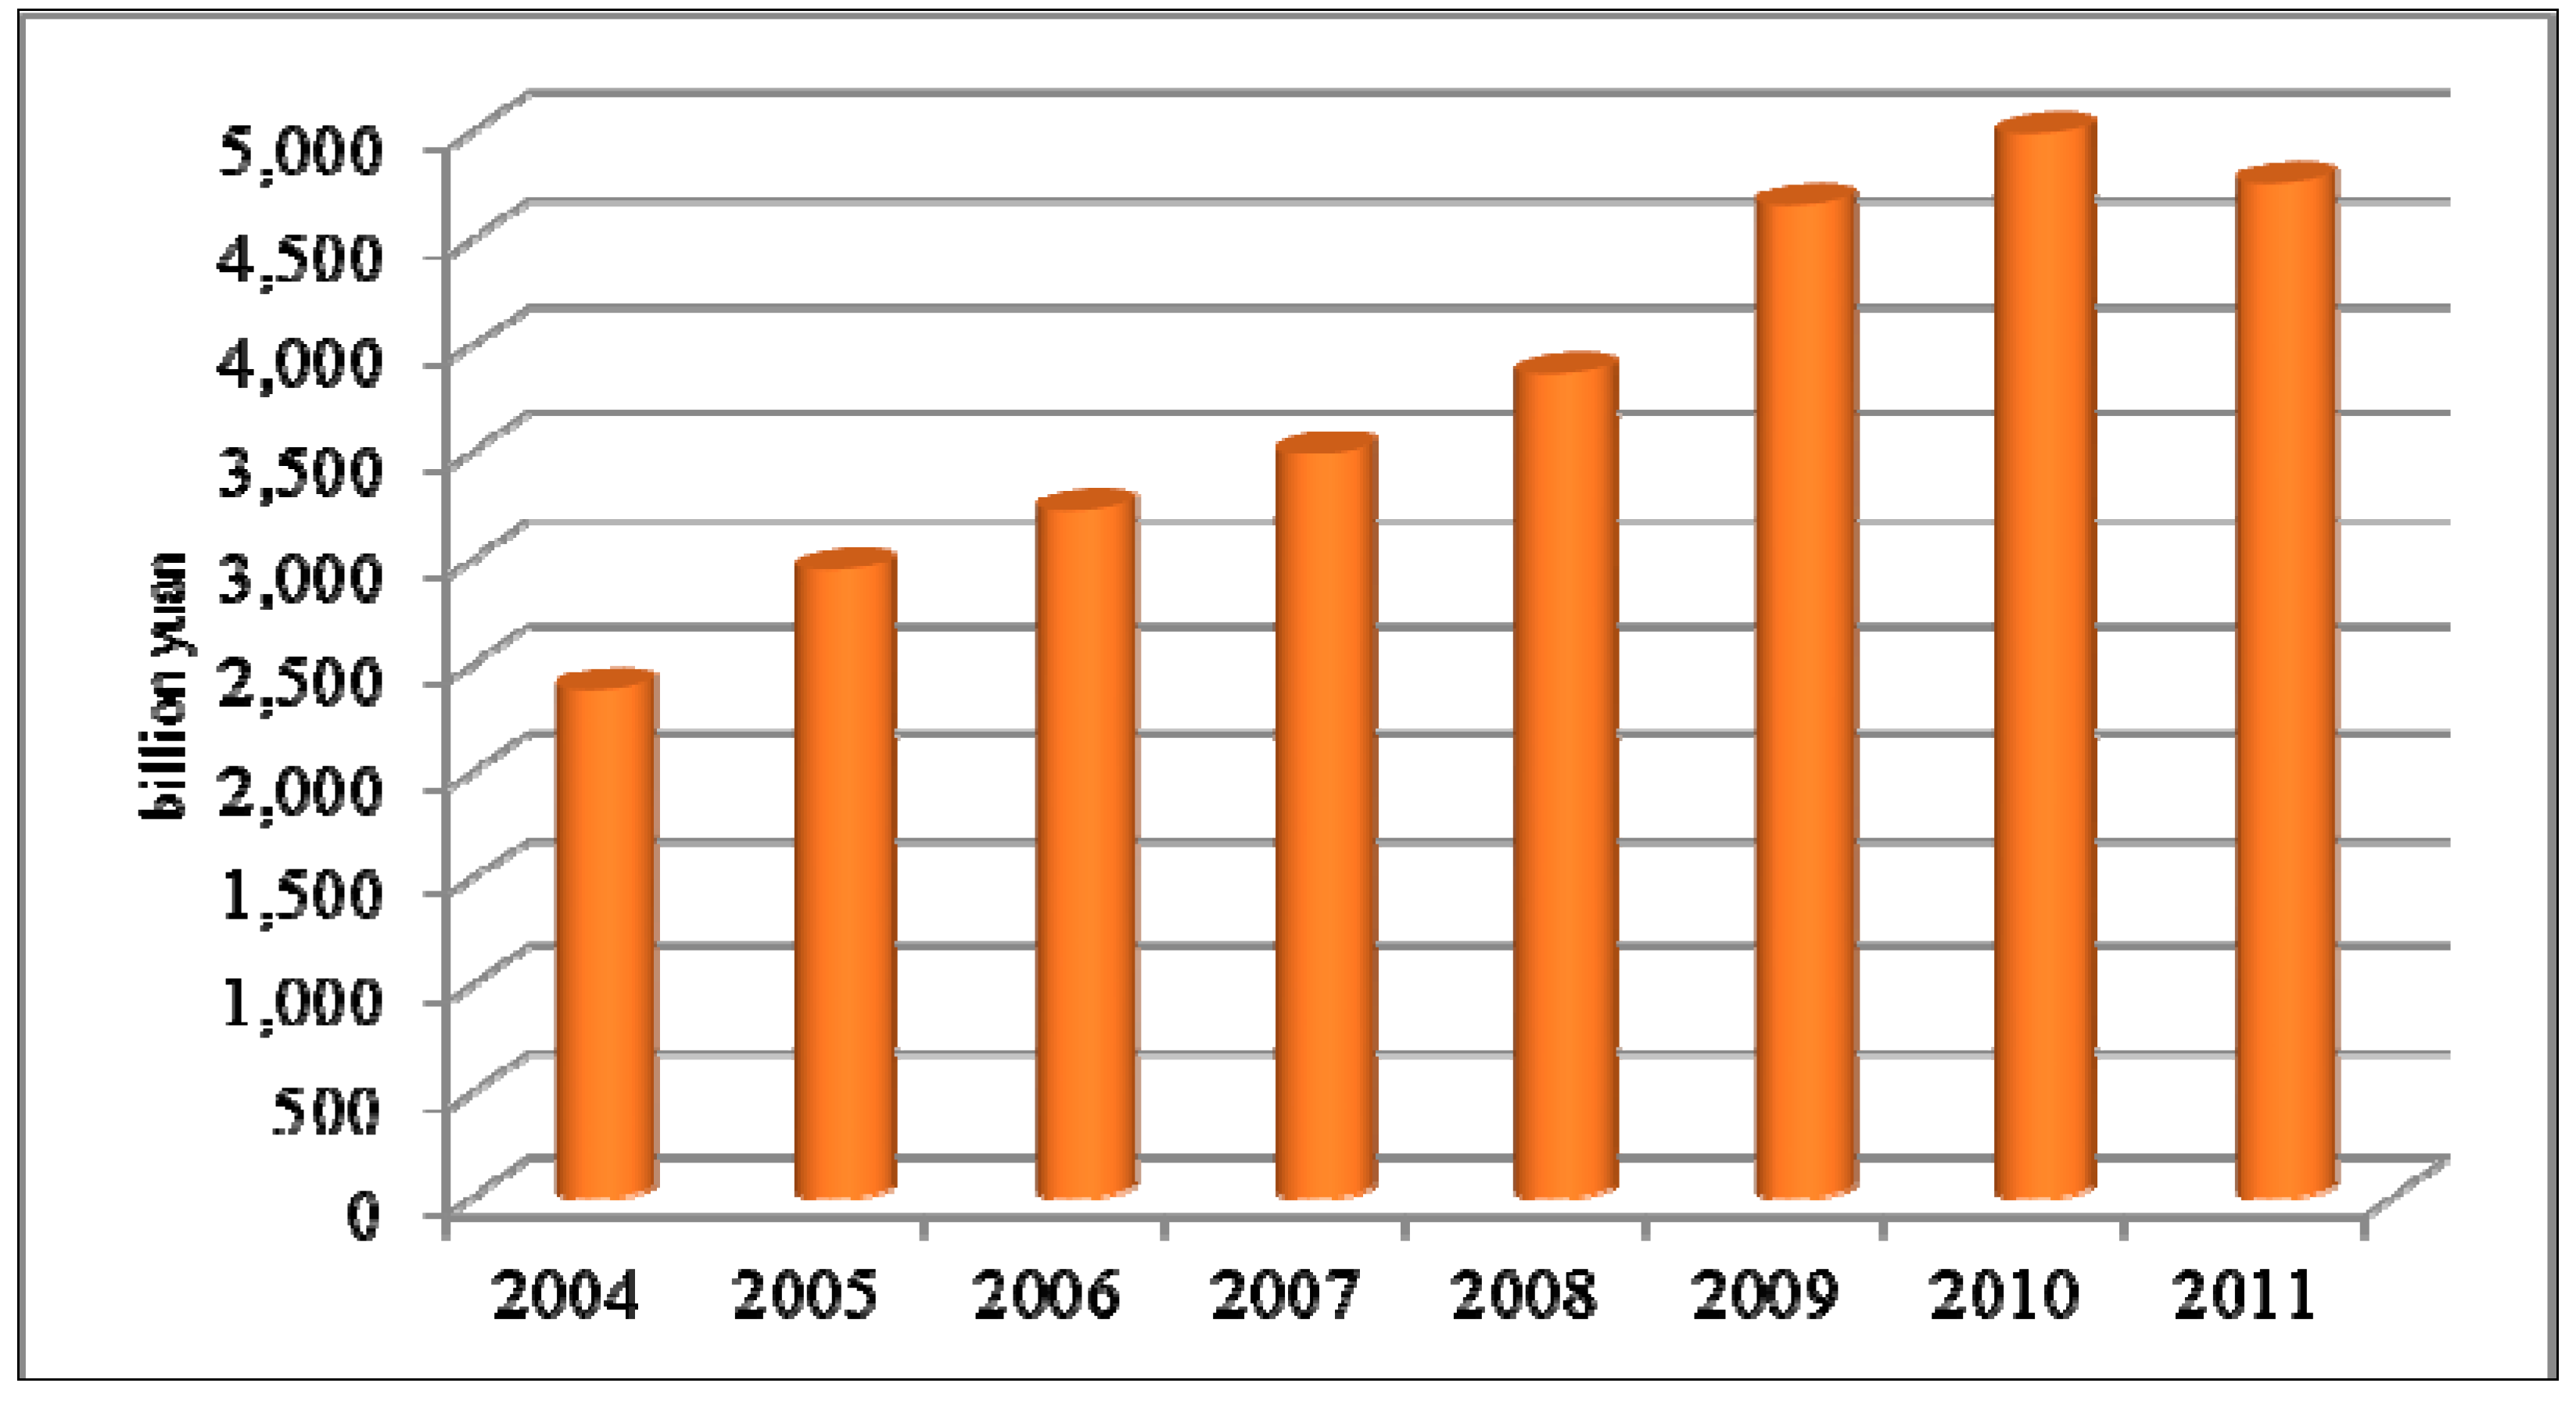
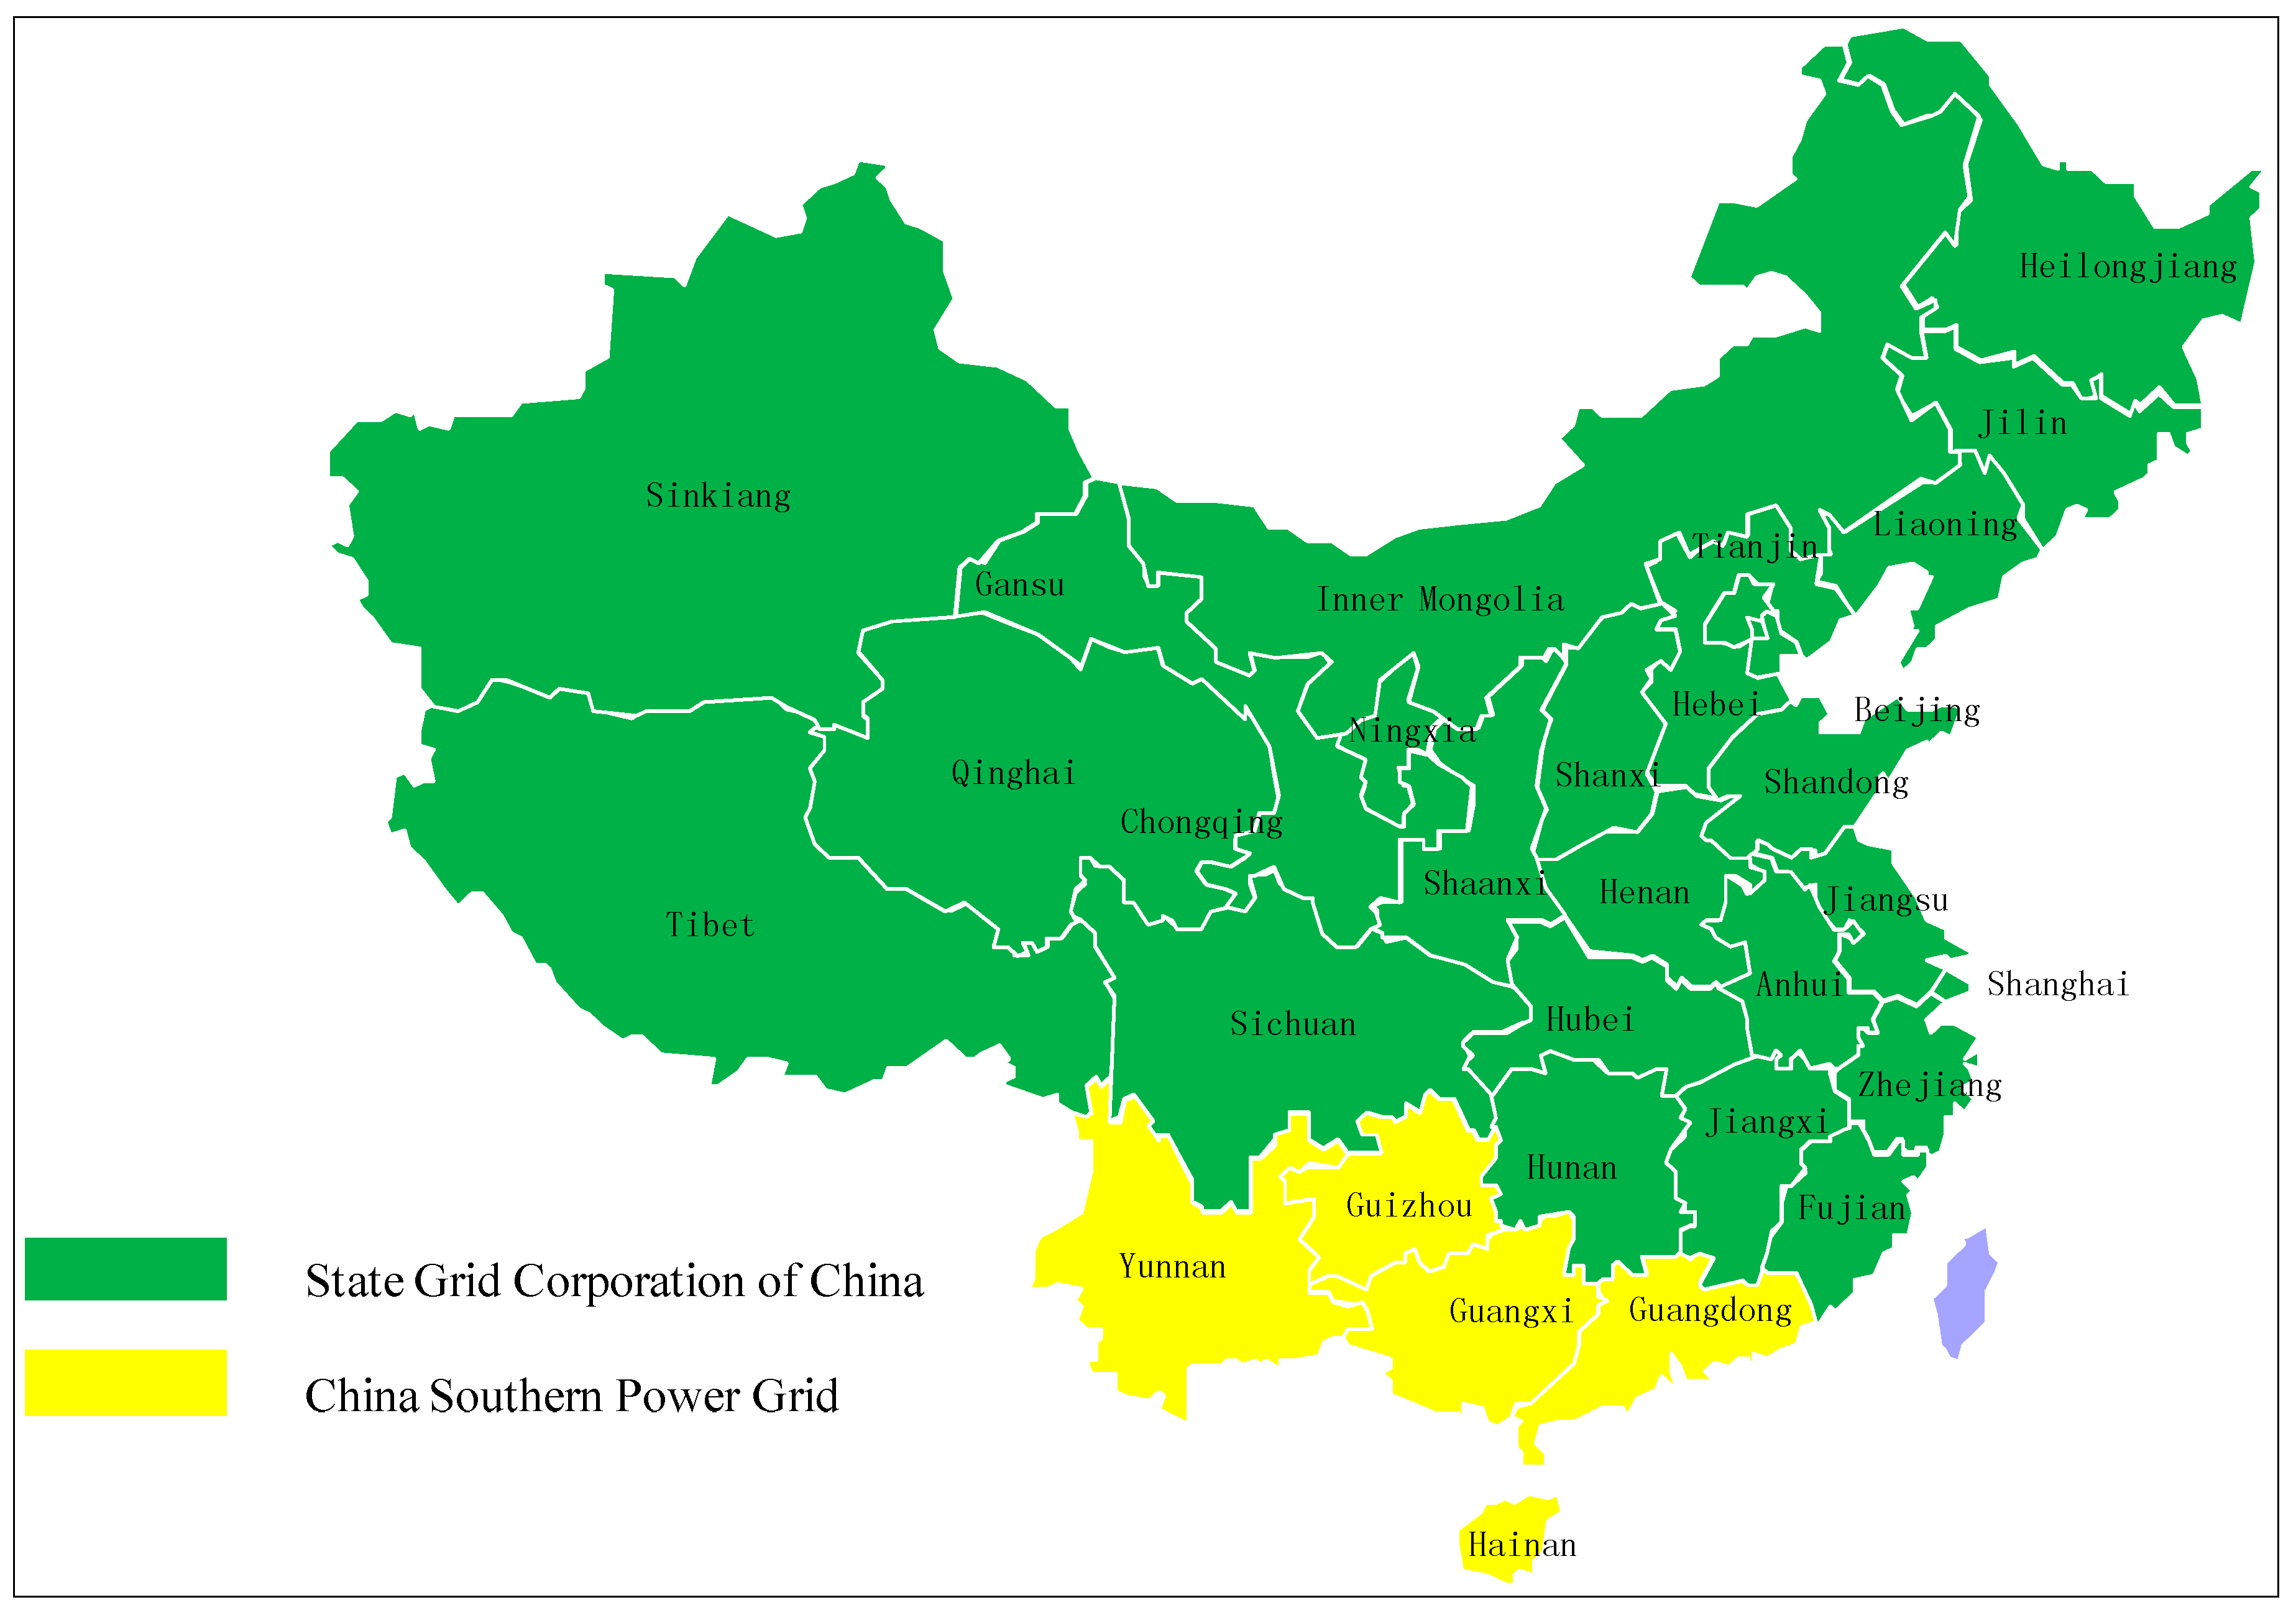
1.1. Research Background

1.2. Literature Review
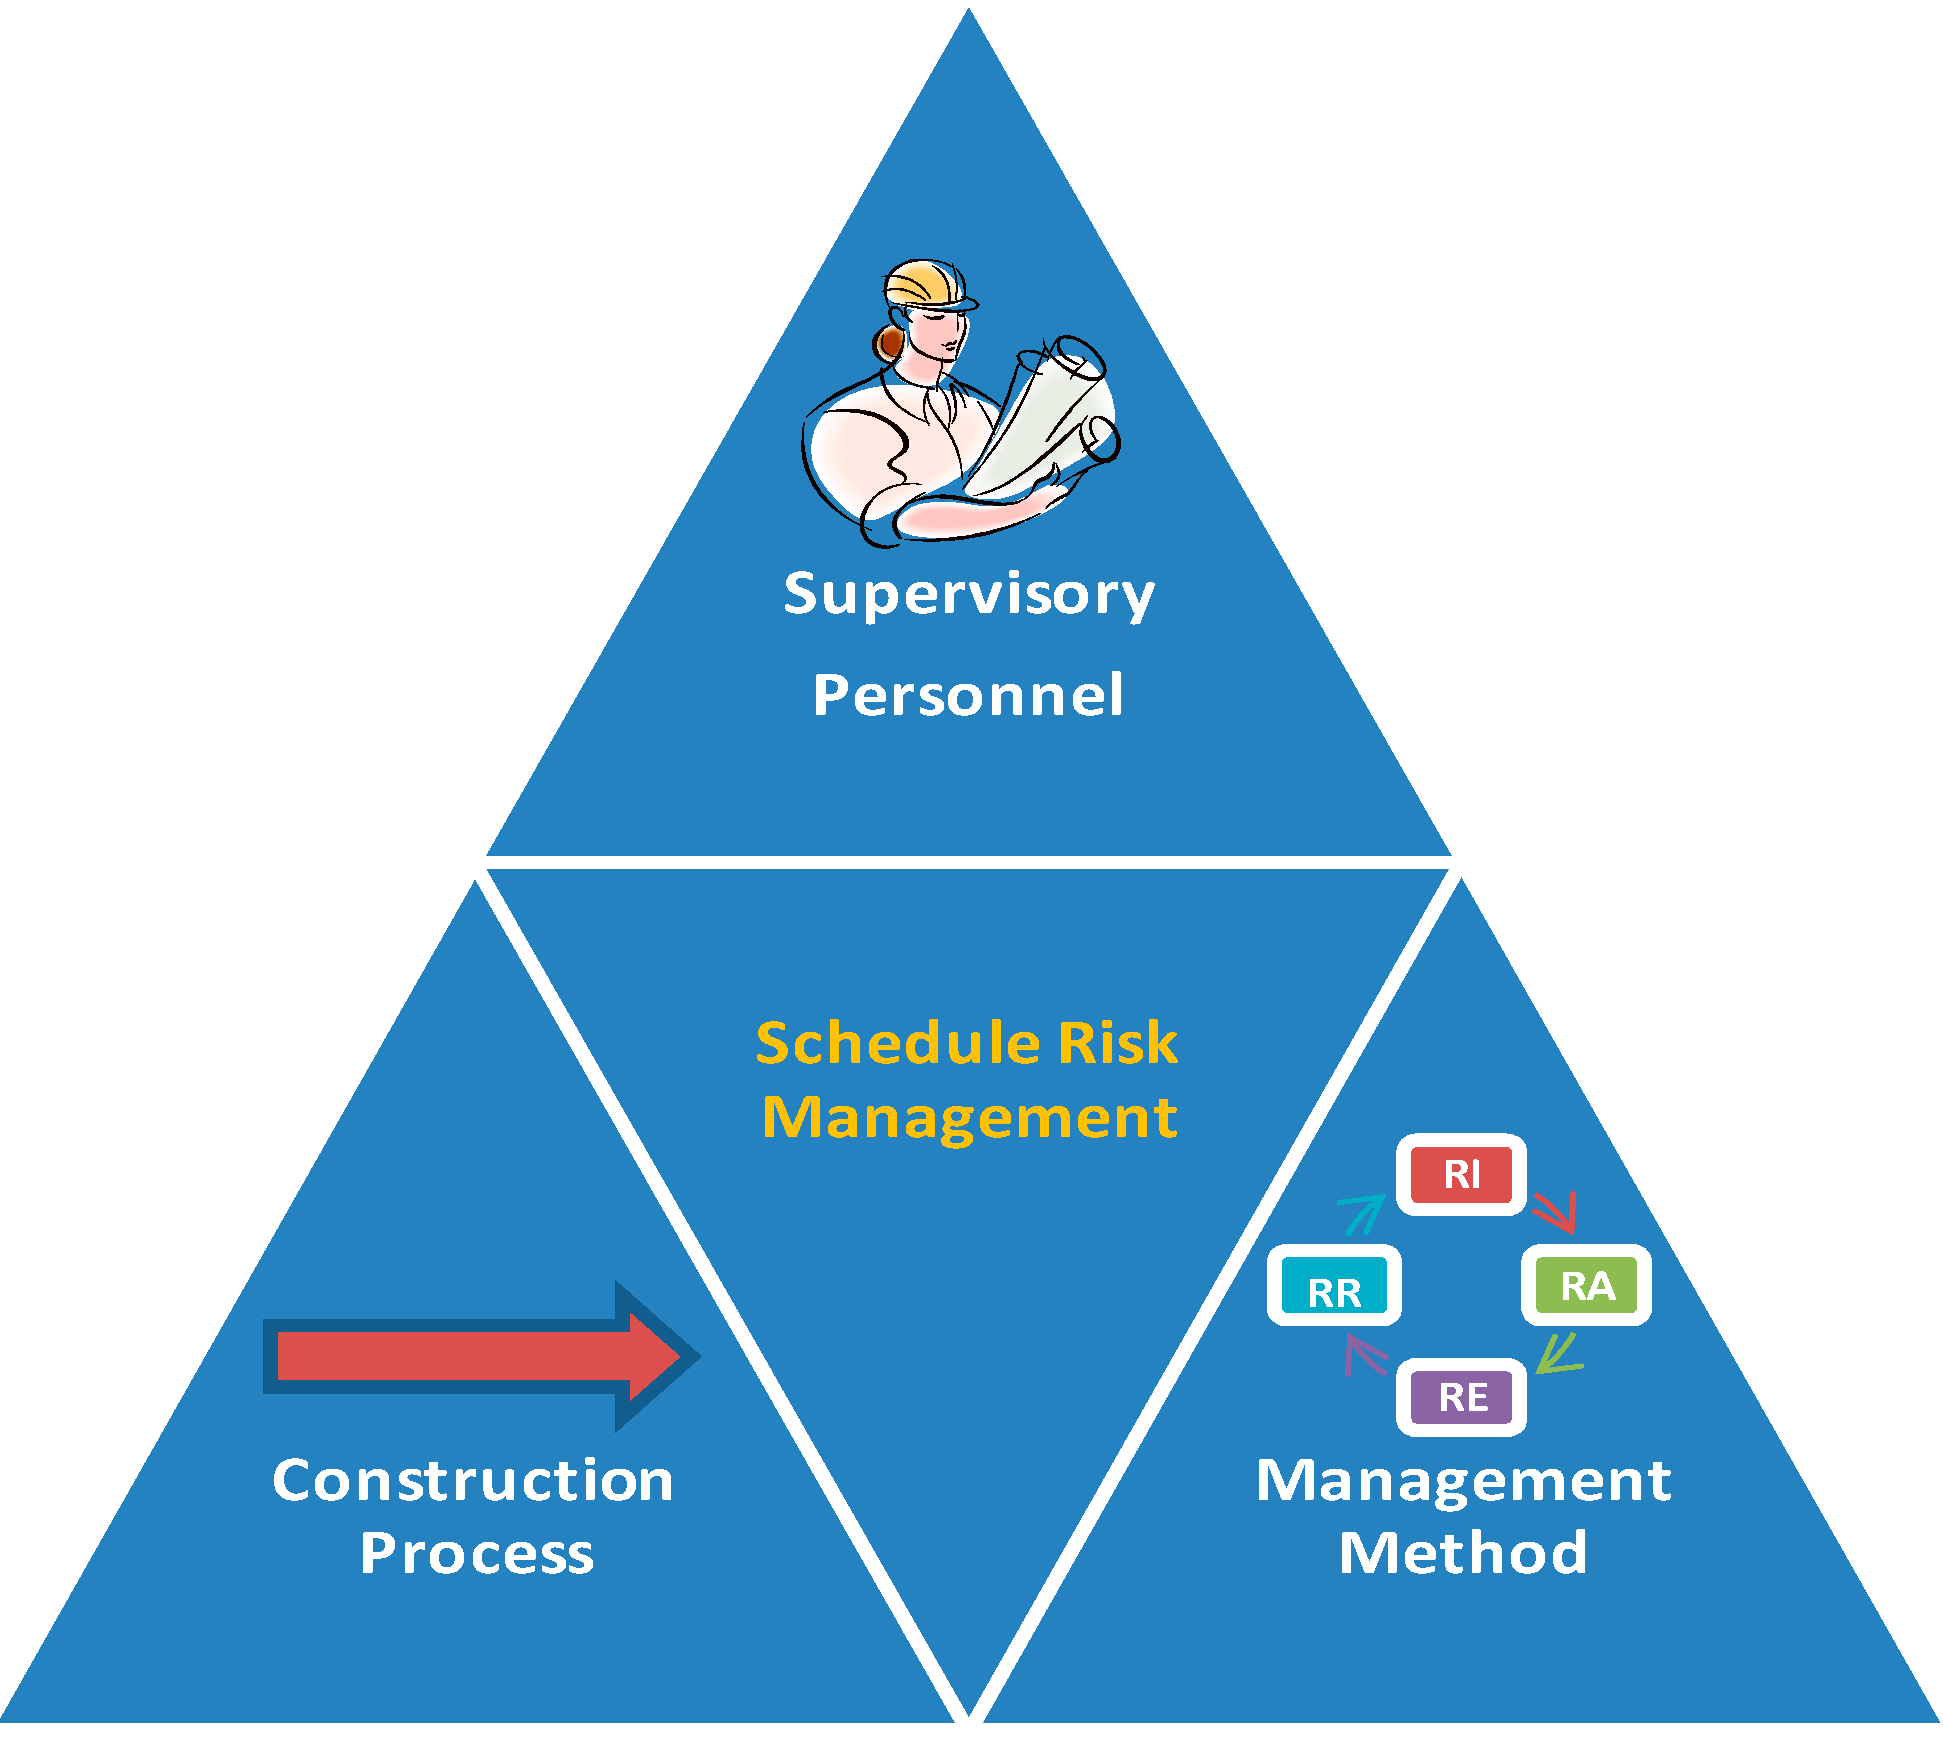
2. The Framework of Schedule Risk Management

2.1. Supervisory Personnel
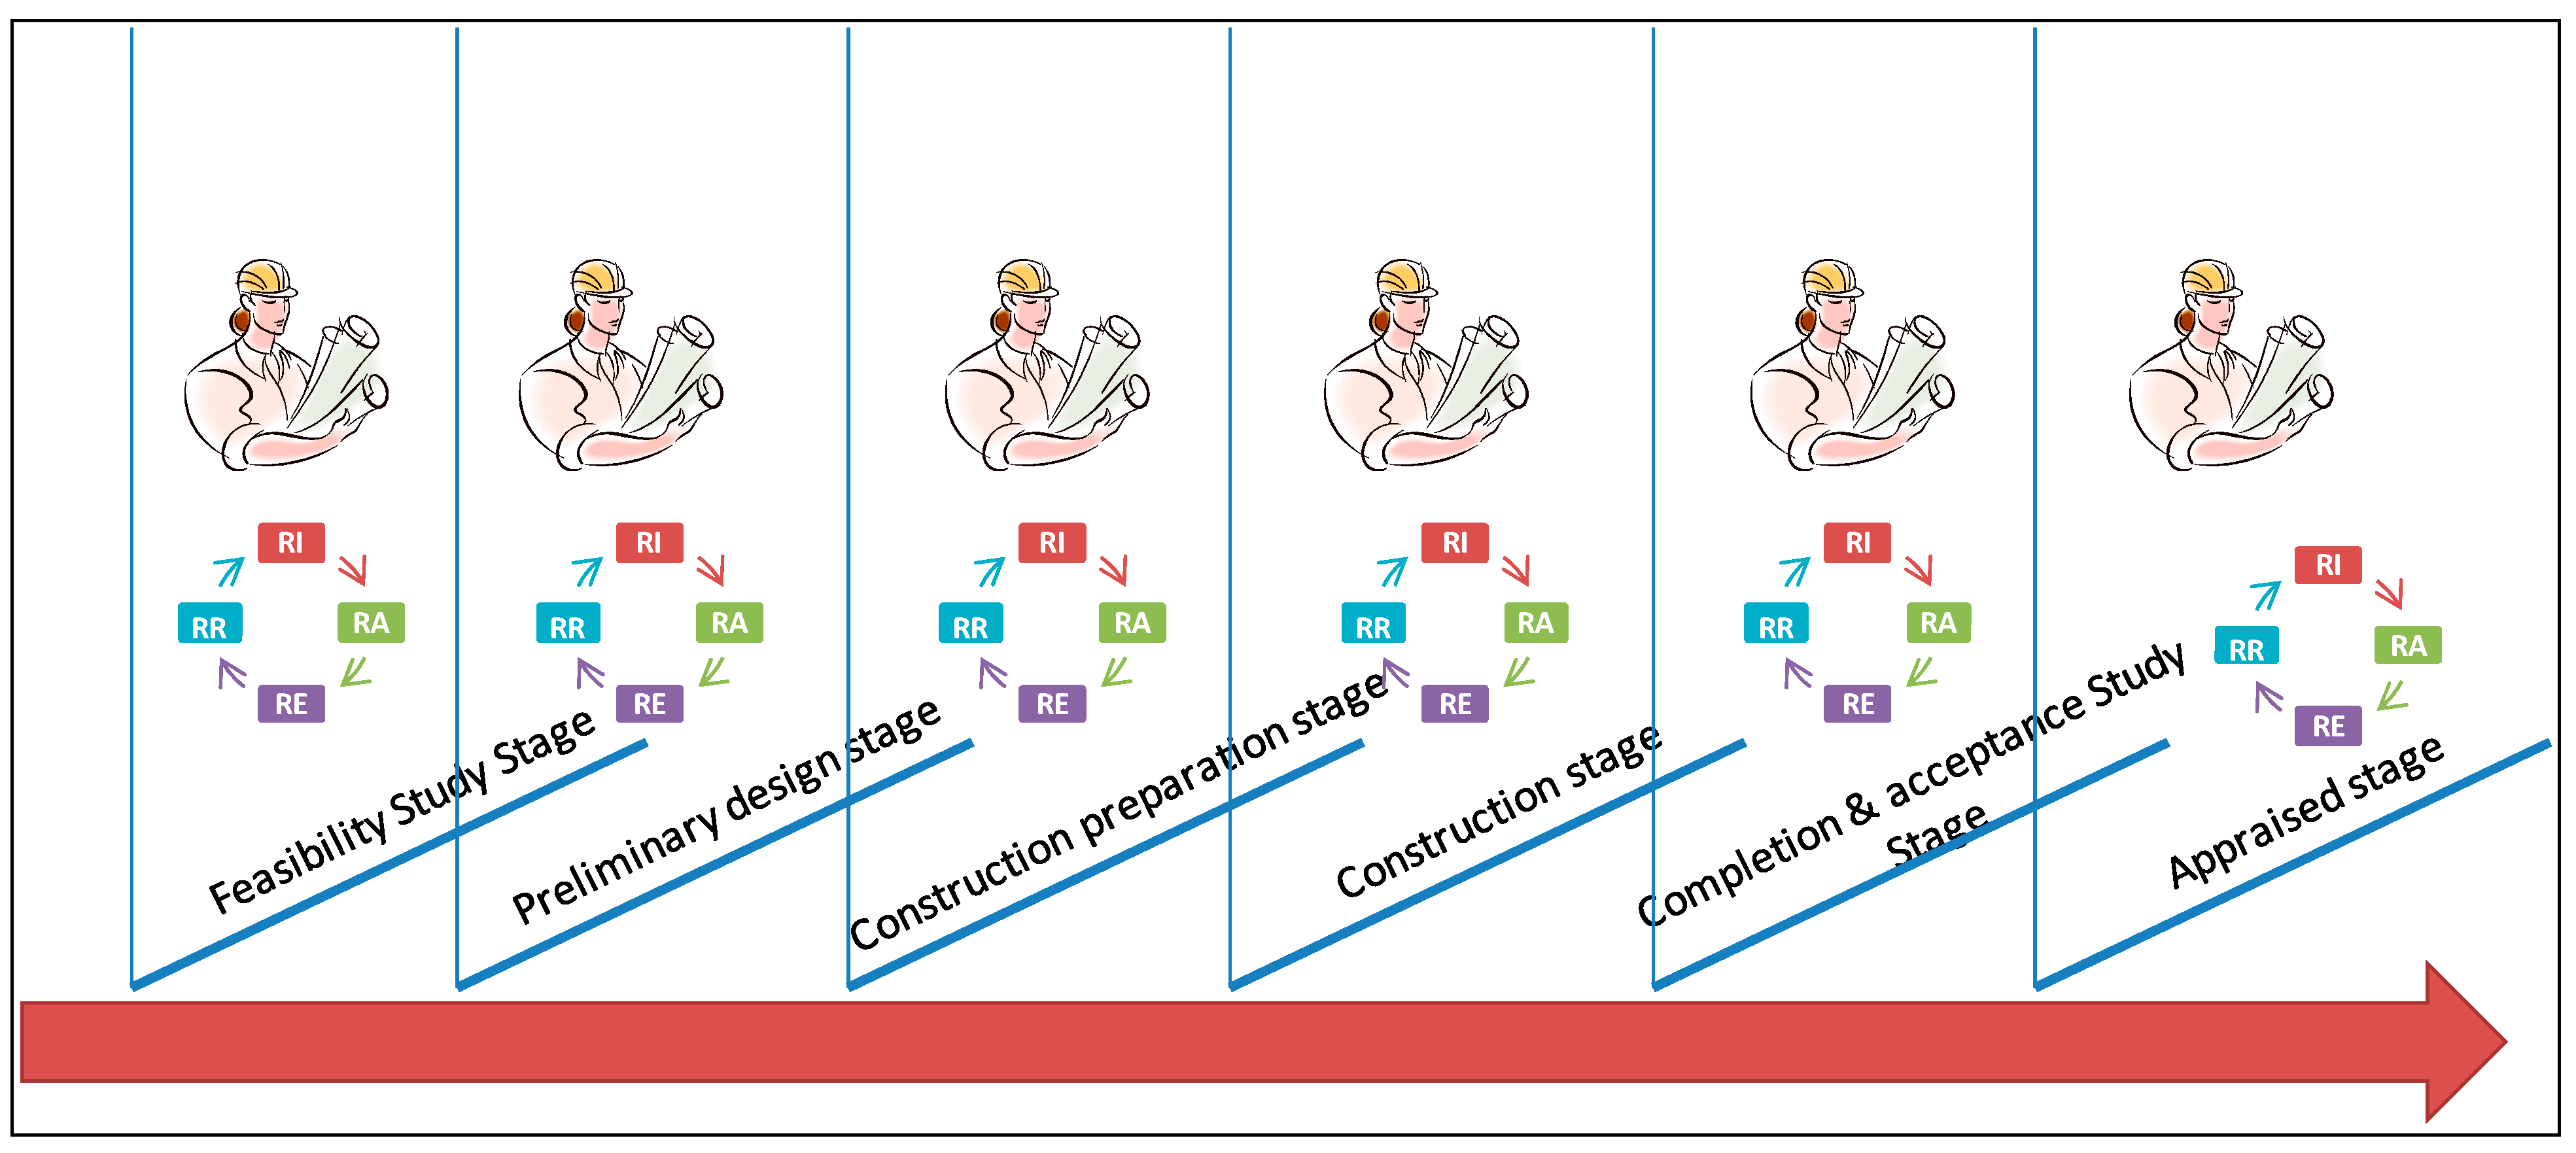
2.2. Construction Process

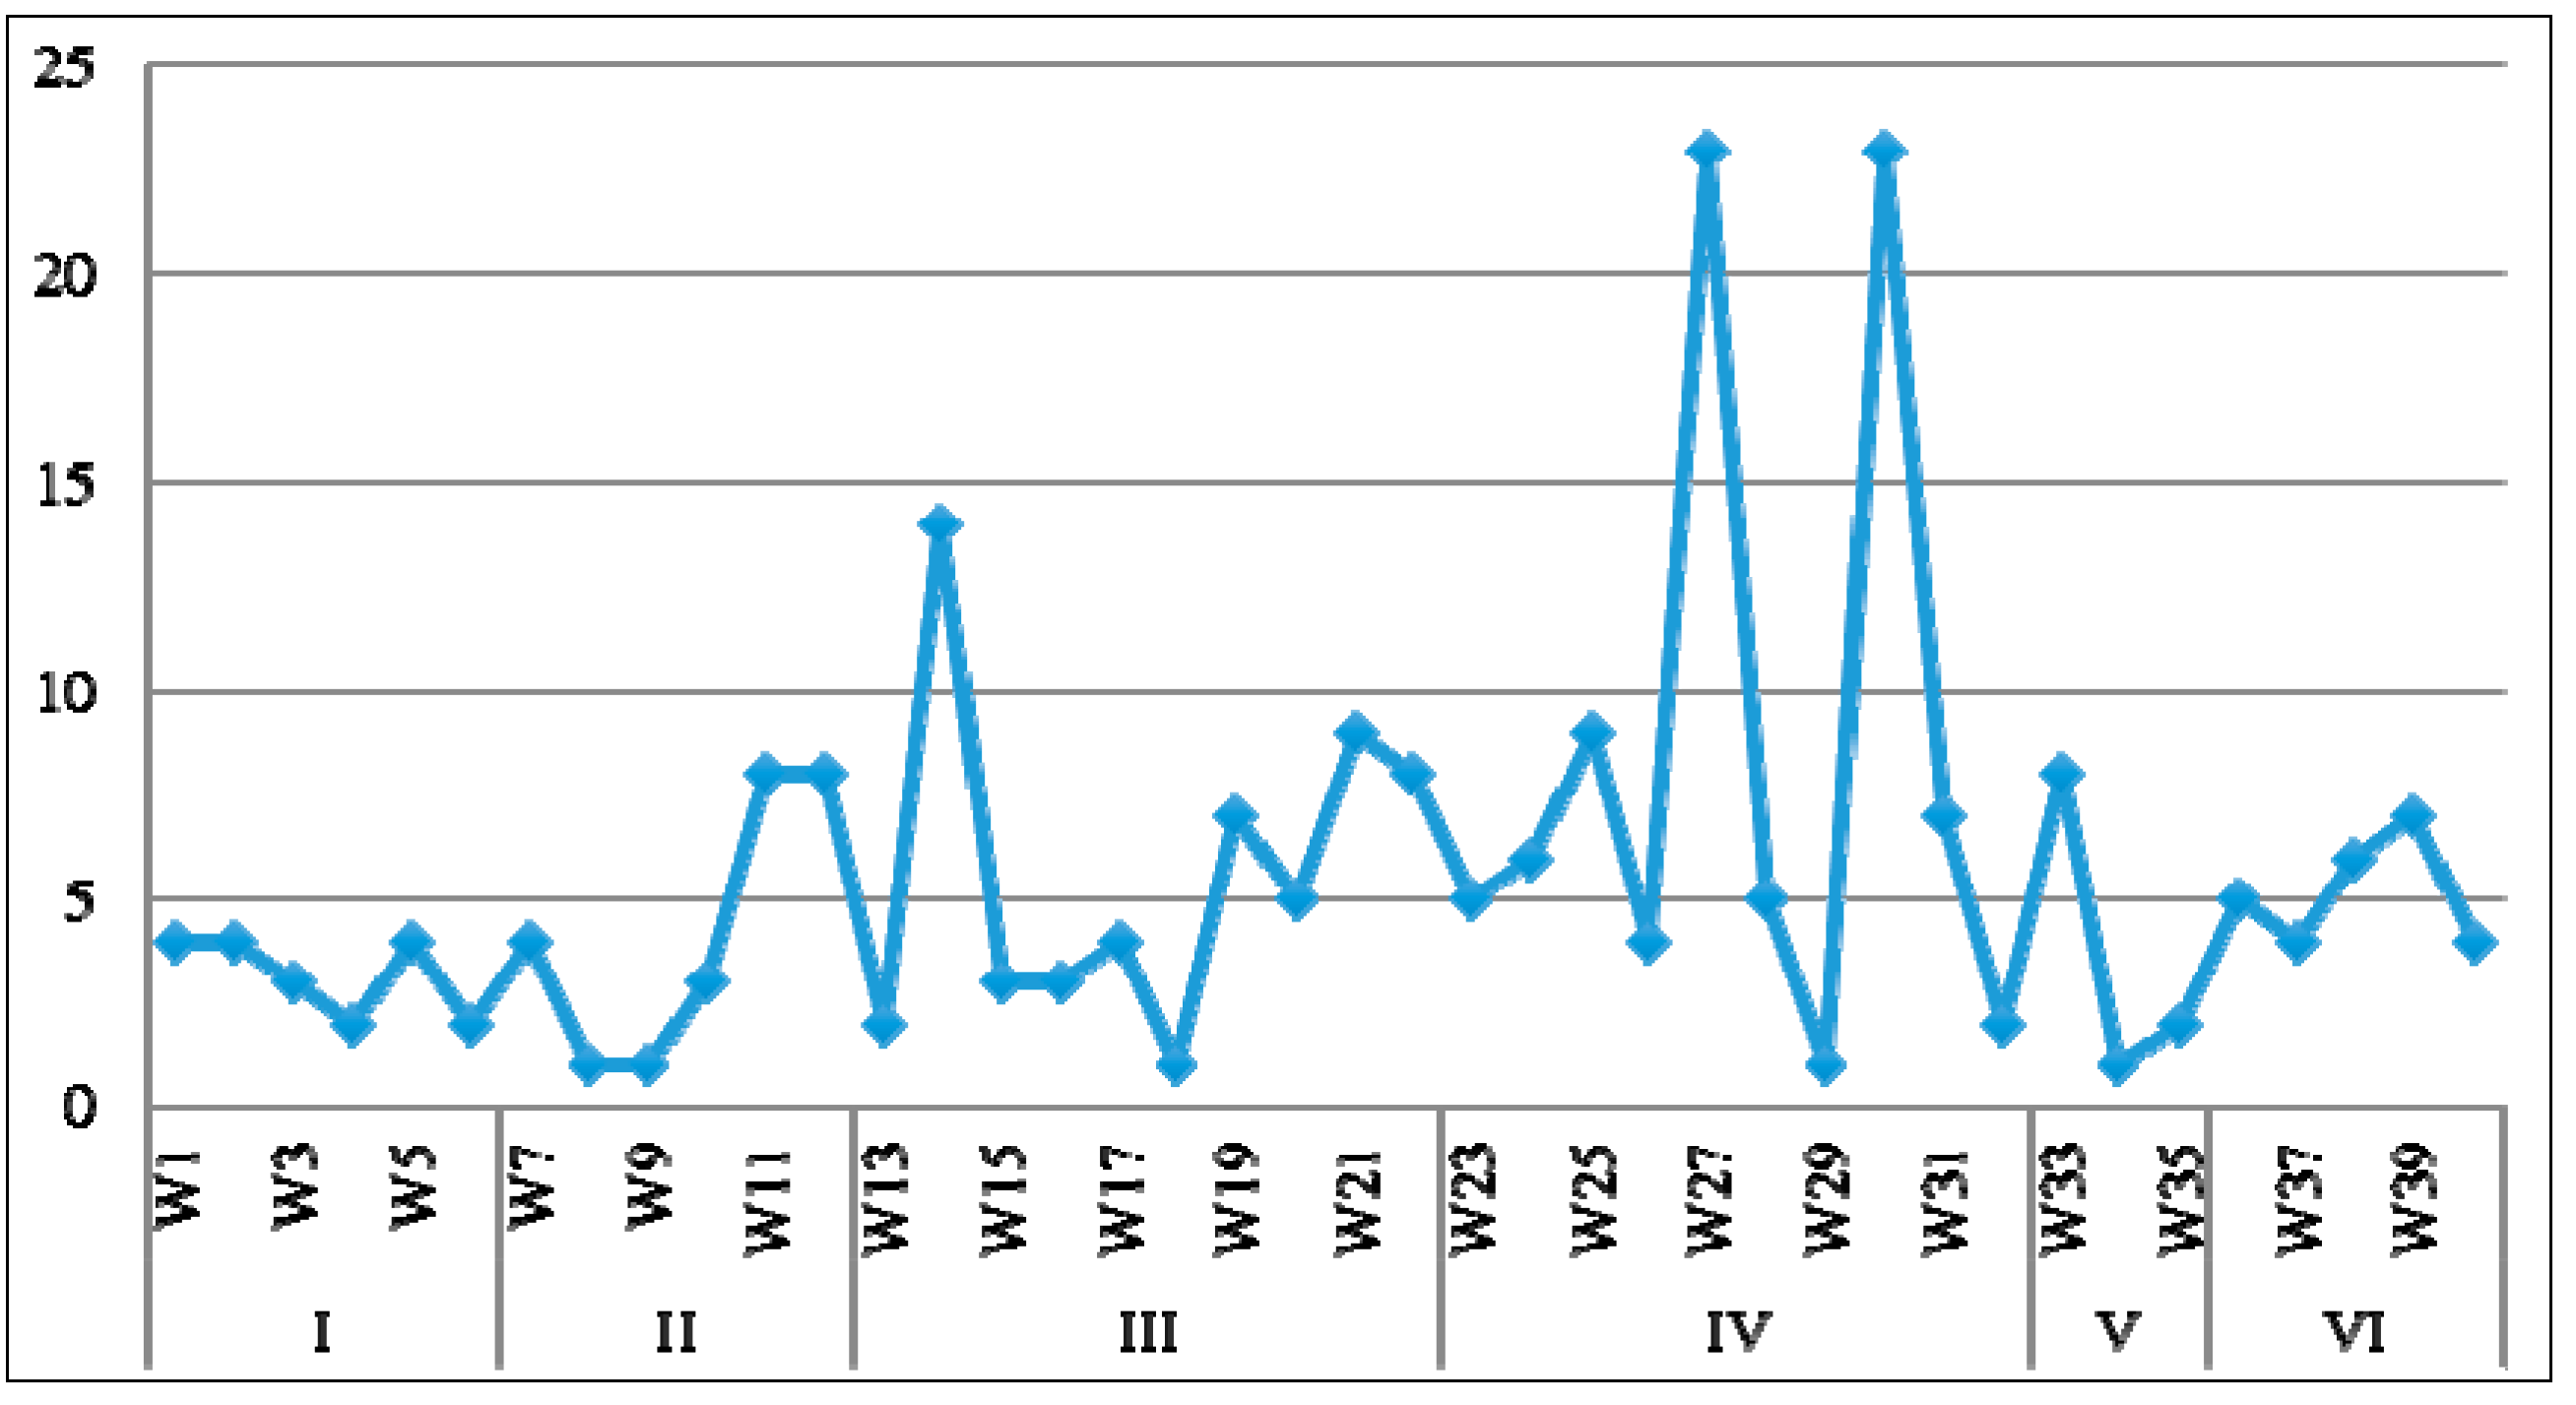
| Stage | Key works | Stage | Key works |
|---|---|---|---|
| A Feasibility study stage | W1 Preparation of project proposals W2 Project feasibility study W3 Preparation of project feasibility study report W4 Project feasibility assessment W5 Project Approval W6 Feasibility study approved | B Preliminary design stage | W7 Design tender W8 Construction units commissioned W9 Establishment of owner project department W10 Completion of pre-planning documents W11 Preliminary Design W12 Review of preliminary Design |
| C Construction preparation stage | W13 Issued annual plan W14 Material and non-material bidding W15 Contact signed W16 Approval of preliminary design W17 Funds demand planning and disbursement W18 Completion of construction permits W19 Construction drawing design W20 Review of construction drawings and design handover W21 Land expropriation W22 Connected waterways, circuits, roads and other | D Constructionstage | W23 Starting Report application W24 Start W25 Safety and quality supervision of the production process W26 Project meetings W27 Construction (foundation construction) W28 Foundation construction acceptance and handover W29 Process Conversion W30 Installation project W31 System Debug W32 Supervision Acceptance |
| E Completion and acceptance stage | W33 Completion of the project pre-acceptance W34 Debugging and test running W35 Project data compilation and archiving | F Appraised stage | W36 Financial completion of settlement W37 Financial completion of final accounts W38 Standard production acceptance W39 Project Auditing W40 Project appraised |
2.3. Management Method
2.3.1. Risk Identification
2.3.1.1. Risk Property Identification
2.3.1.2. Risk Responsibility Identification
2.3.2. Risk Analysis
2.3.3. Risk Evaluation
2.3.4. Risk Prevention
3. Actual Practice of Schedule Risk Management Framework
3.1. Risk Identification
3.2. Risk Analysis
3.2.1. Classification of Risk Category
| Key Work | Risk | Serial Number | Risk Category | Responsible Party |
|---|---|---|---|---|
| W1 | Infeasible economic and technical indicators | r1 | TR | P(proprietor) |
| Uncertain trends of objective things and forecast deviation | r2 | TR | P | |
| Mistakes existed in preparation of project proposals | r3 | TR | P | |
| Project content is inconsistent with the actual | r4 | TR | P | |
| W2 | Preliminary geological exploration is blocked | r5 | SR | P |
| Missing or delay in obtaining of relevant departments’ professional assessment report, reviewing comments and relevant agreements | r6 | MR | P | |
| Changes of national policy, company operating conditions and other conditions | r7 | PLR | P | |
| Incorrect or imperfect project proposal, conflicts against the organization’s strategic | r8 | TR | P | |
| W3 | Survey data and information is not complete, untrue or incorrect | r9 | TR | P |
| Infrastructure sites and the path information is not detailed, project site and planning, engineering geology is wrong. | r10 | TR | P | |
| Power planning changes | r11 | ER | P | |
| W4 | Project evaluation and audit is incorrect | r12 | MR | P |
| Experts or consultants are assessed unqualified | r13 | MR | P | |
| W5 | Project approval application report prepared is imperfect, and not timely submitted to the National Development and Reform Commission(NDRC) | r14 | TR | P |
| Planning advice, land pretrial opinion and other approved data are incomplete | r15 | TR | P | |
| Projects are not approved or delay | r16 | MR | P | |
| Comments of provincial feasibility review are missing or delayed | r17 | MR | P | |
| W6 | Deviation of feasibility size and scale approved is too large | r18 | TR | P |
| Documents of approved feasibility study of State Grid Corporation and other documents are not issued or delay | r19 | MR | P |
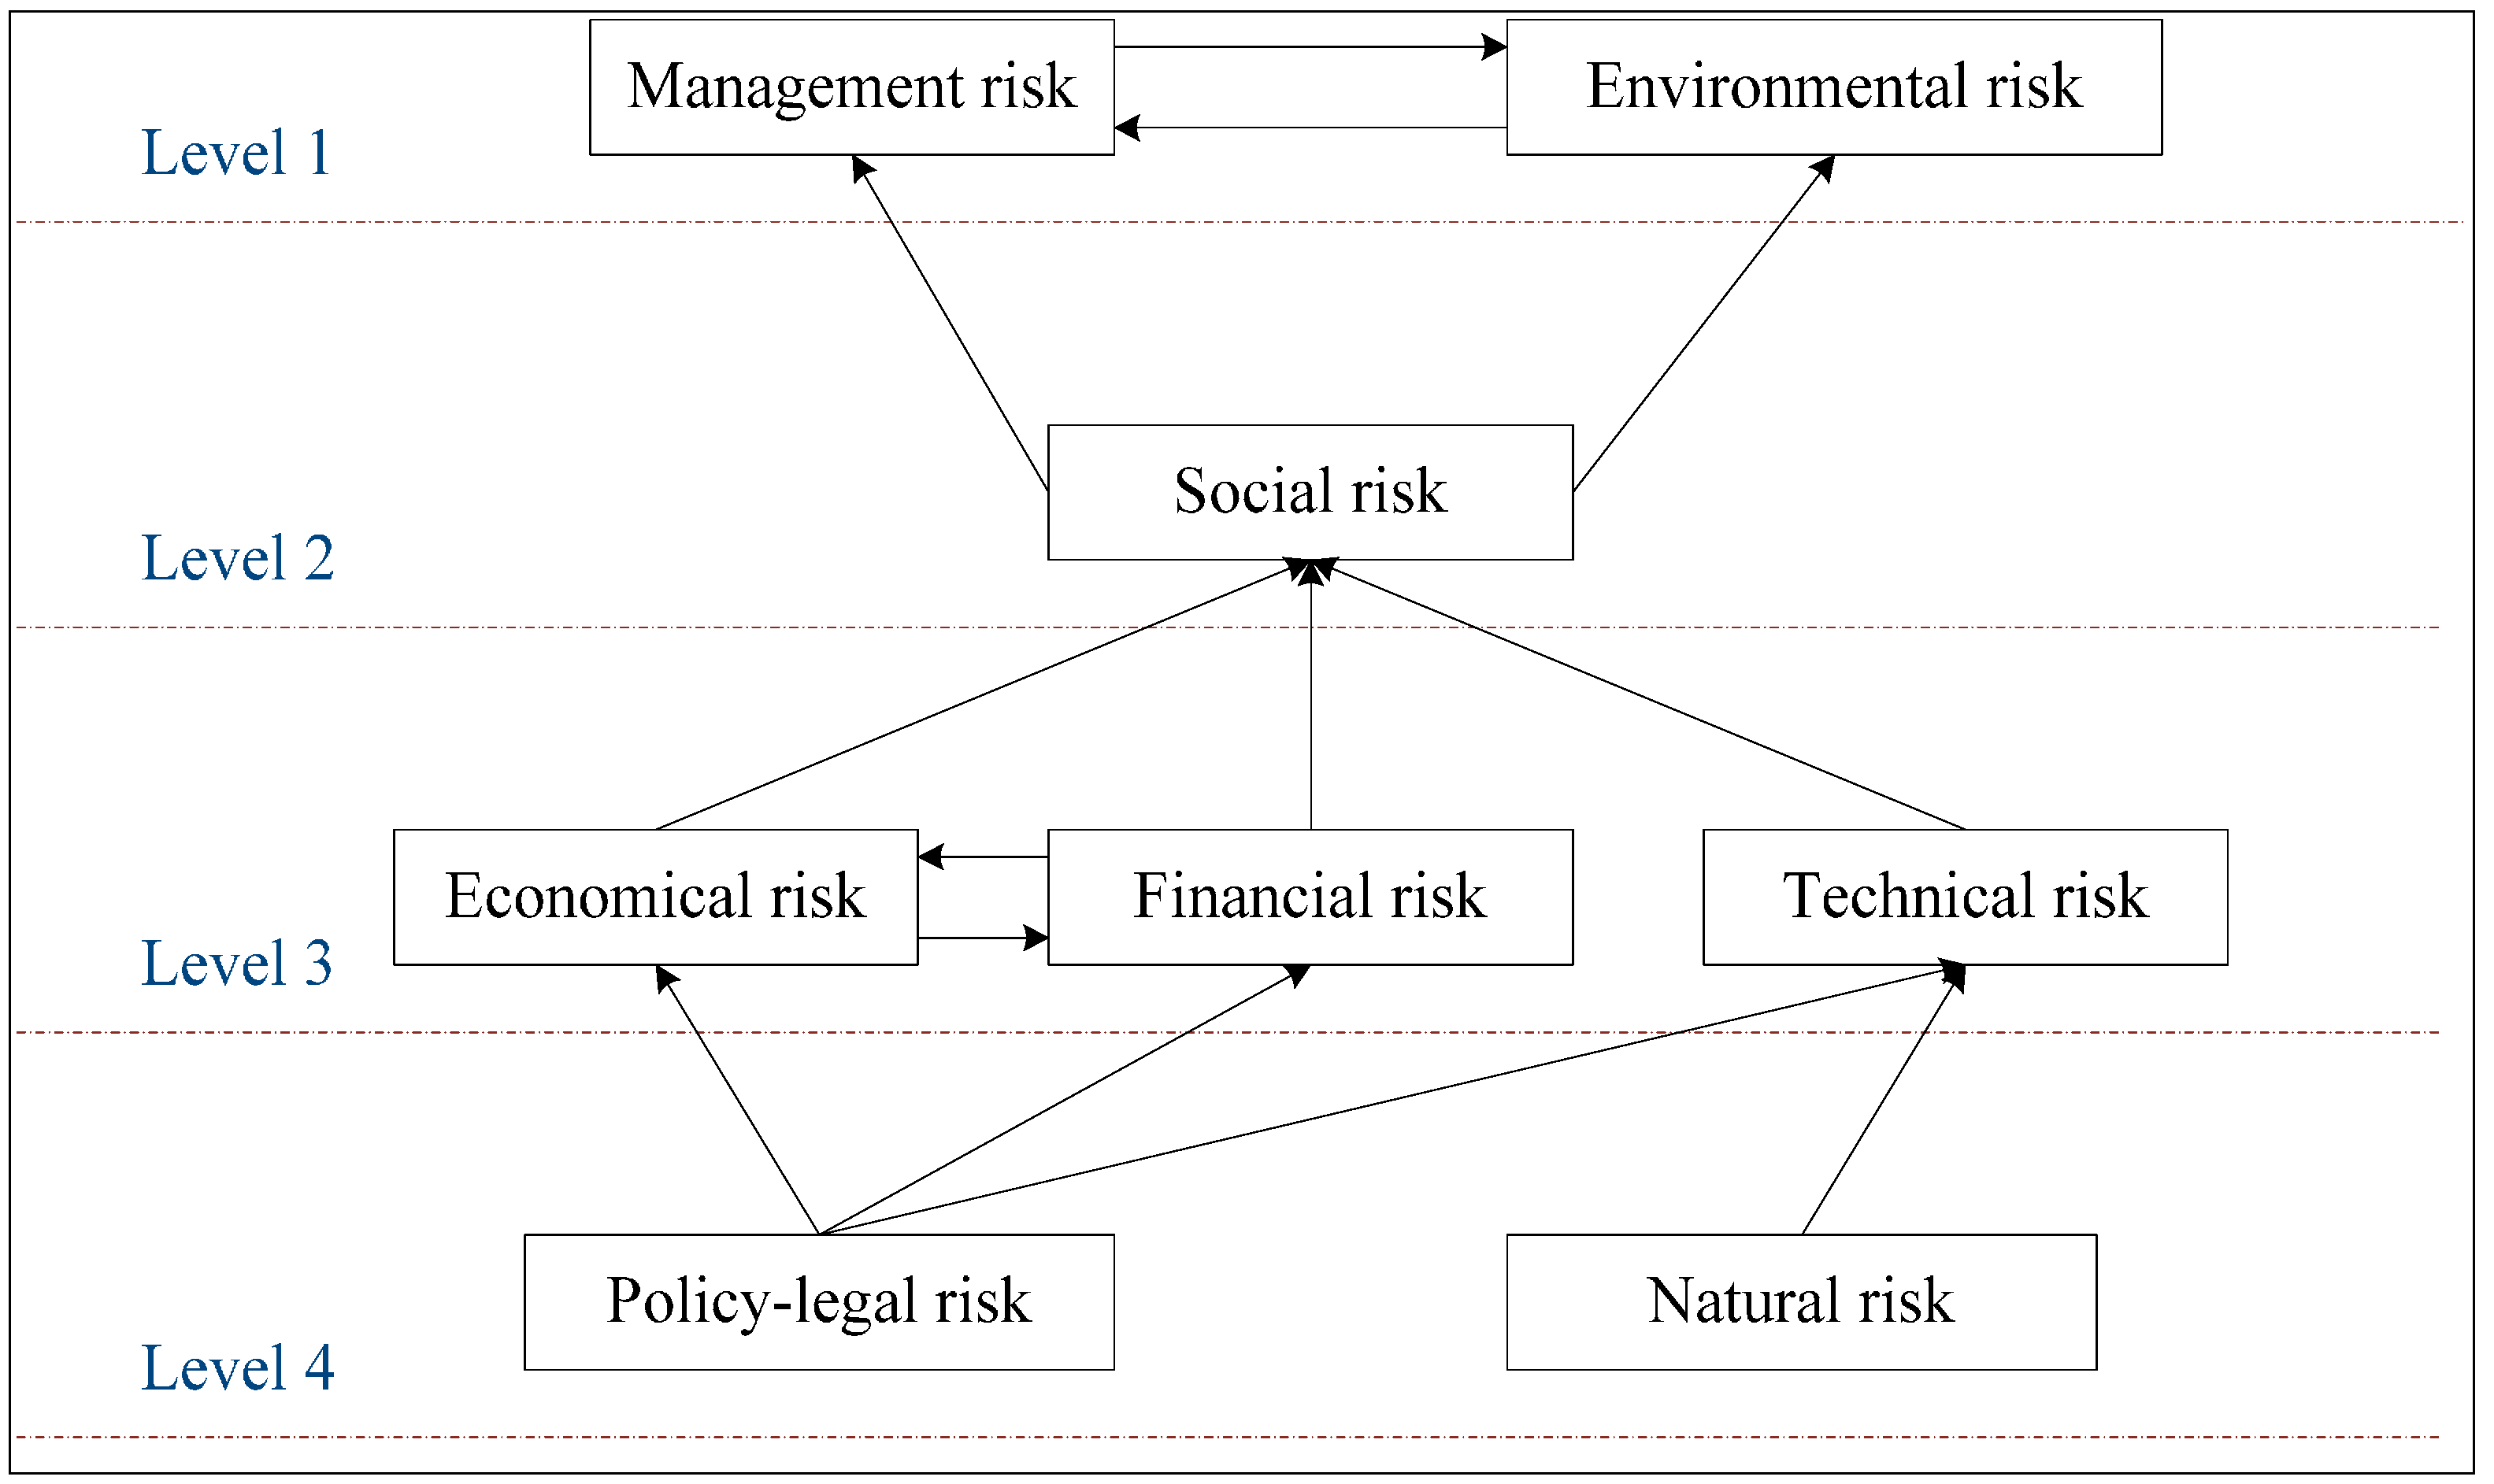
3.2.2. Judgment of Risk Relevance
| Rj | R1 | R2 | R3 | R4 | R5 | R6 | R7 | R8 | |
|---|---|---|---|---|---|---|---|---|---|
| Ri | |||||||||
| R1 | 1 | 0 | 0 | 0 | 0 | 0 | 1 | 1 | |
| R2 | 0 | 1 | 1 | 1 | 0 | 0 | 1 | 1 | |
| R3 | 0 | 0 | 1 | 0 | 0 | 0 | 0 | 1 | |
| R4 | 0 | 1 | 1 | 1 | 0 | 0 | 1 | 1 | |
| R5 | 0 | 1 | 1 | 1 | 1 | 0 | 1 | 1 | |
| R6 | 0 | 0 | 1 | 0 | 0 | 1 | 1 | 1 | |
| R7 | 0 | 0 | 0 | 0 | 0 | 0 | 1 | 1 | |
| R8 | 0 | 0 | 0 | 0 | 0 | 0 | 0 | 1 | |
3.2.3. Establishment of Reachability Matrix
3.2.4. Domain Decomposition
| i | L(Ri) | D(Ri) | L(Ri)∩D(Ri) |
|---|---|---|---|
| 1 | 1,3,6,7,8 | 1 | 1 |
| 2 | 2,3,4,7,8 | 2,4,5 | 2,4 |
| 3 | 3,7,8 | 1,2,3,4,5,6 | 3 |
| 4 | 2,3,4,7,8 | 2,4,5 | 2,4 |
| 5 | 2,3,4,5,6,7,8 | 5 | 5 |
| 6 | 3,6,7,8 | 1,5,6 | 6 |
| 7 | 7,8 | 1,2,3,4,5,6,7,8 | 7,8 |
| 8 | 7,8 | 1,2,3,4,5,6,7,8 | 7,8 |
3.2.5. Classification of Elements in the Same Domain
- ;
- ;
- ;
3.3. Risk Evaluation
3.3.1. Establishment of the Evaluation Index System
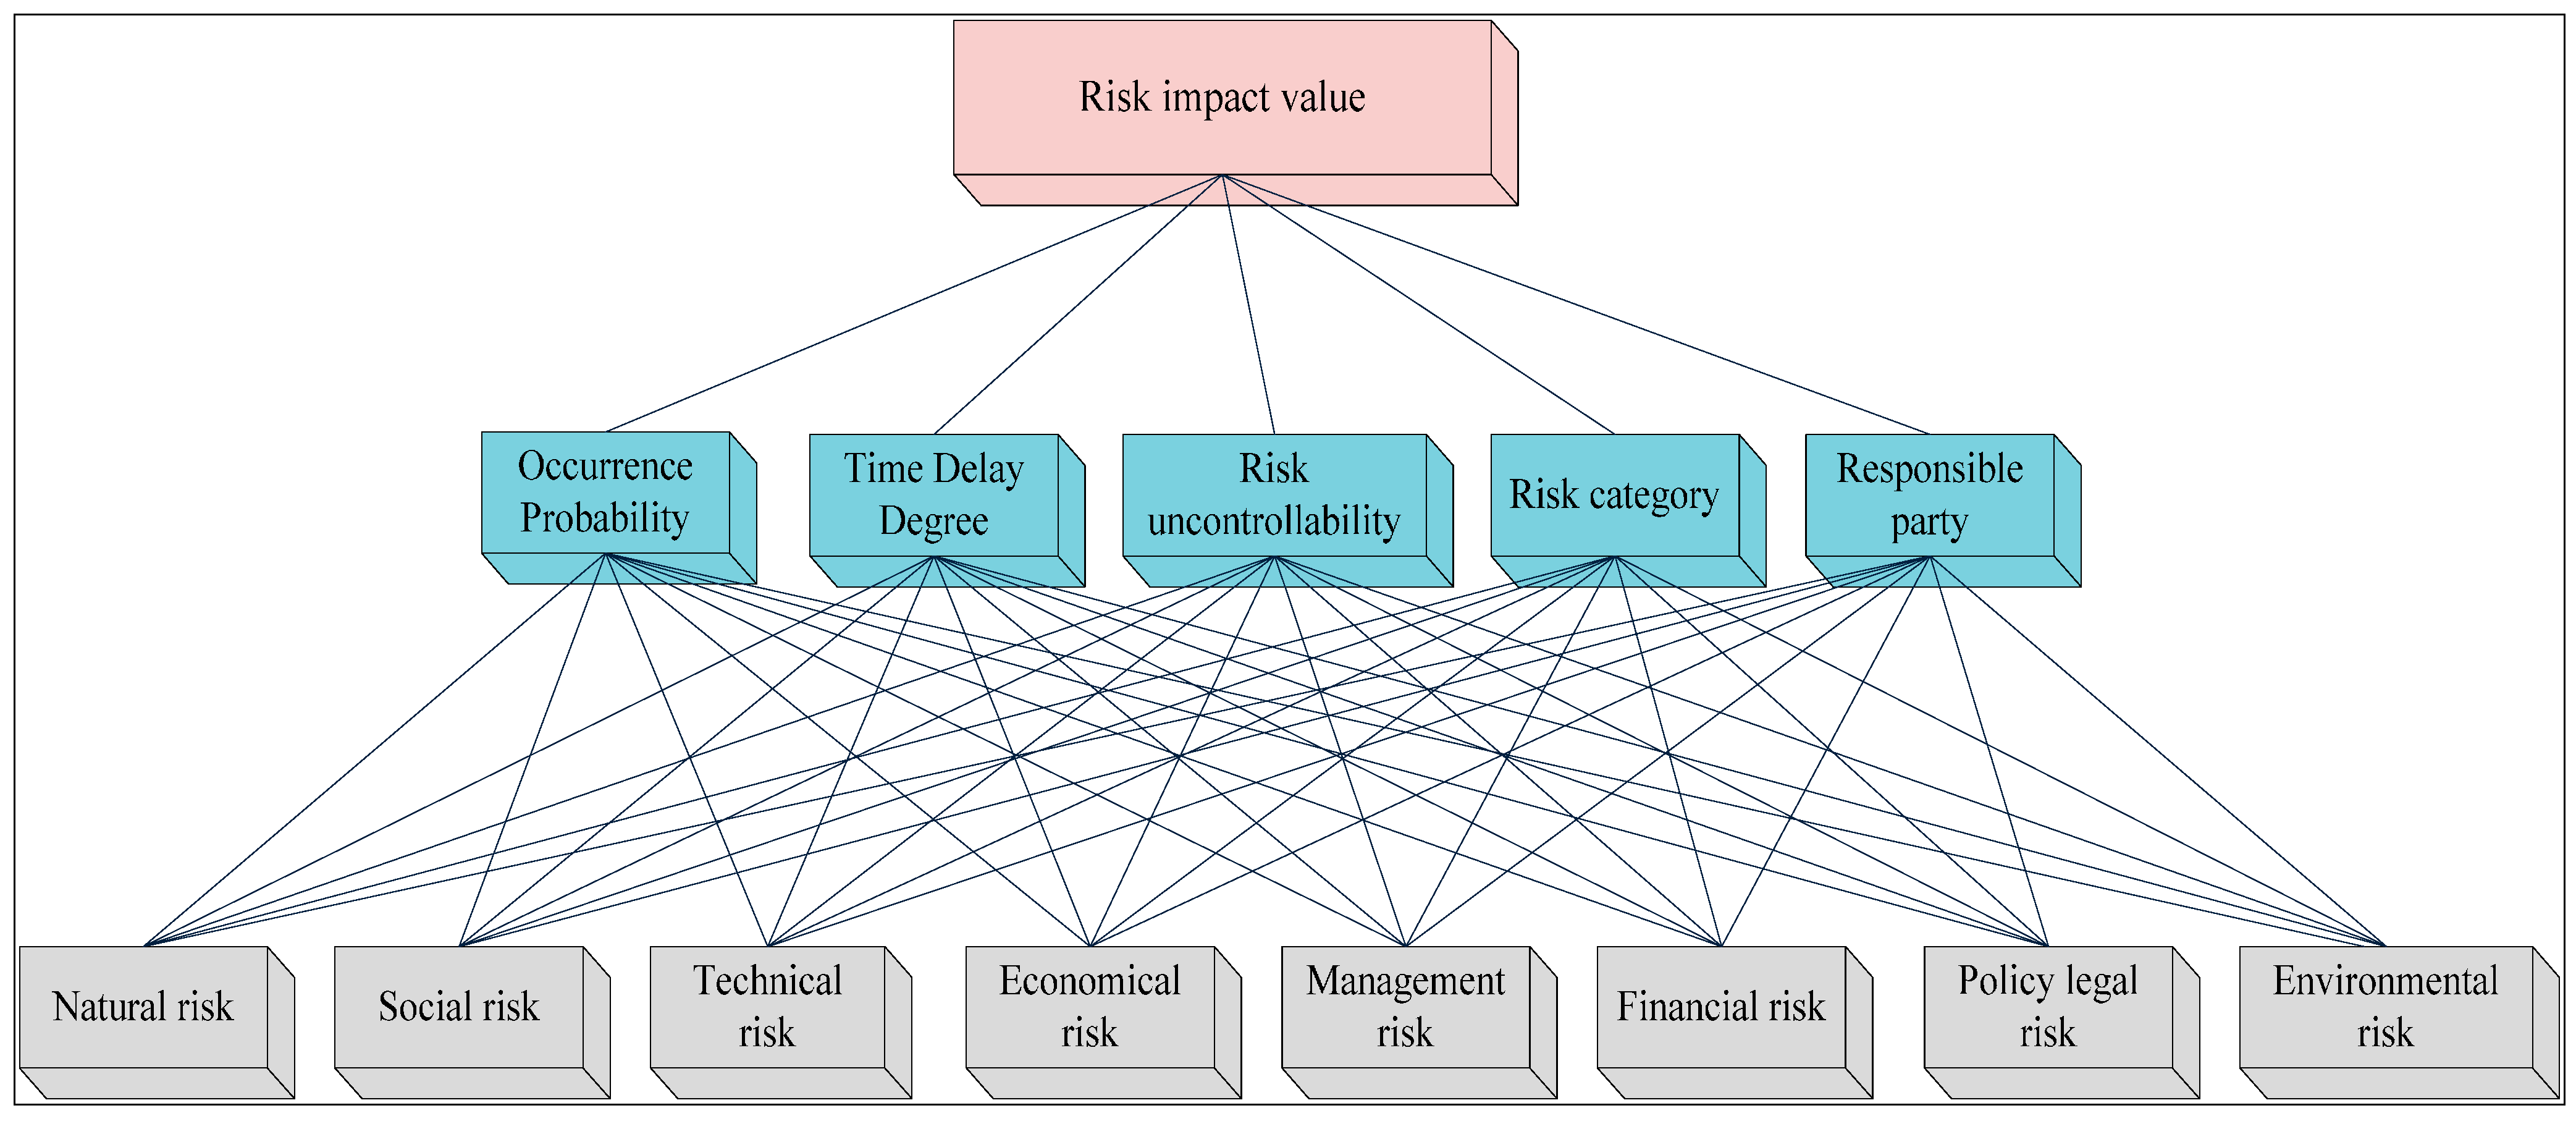
3.3.2. Determination of Risk Impact Value Model
3.3.3. Determination of Indicator Scoring Criteria
| Score | 10 | 8 | 6 | 4 | 2 | 0 | |
|---|---|---|---|---|---|---|---|
| Occurrence probability | Occur in all projects | Occur in 80% projects | Occur in 60% projects | Occur in 40% projects | Occur in 20% projects | Never occur | |
| Time delay degree | Schedule delays 15 weeks or more | Schedule delays 12 weeks | Schedule delays 8 weeks | Schedule delays 4 weeks | Schedule delays 2 weeks | No delays | |
| Risk uncontrollability | Completely uncontrollable | Uncontrollable in many cases | Uncontrollable in 50% cases | Uncontrollable in some cases | Uncontrollable in rare cases | Fully controllable | |
| Remark | When the case is located between the two standards‚ score 1˴3˴5˴7˴9. | ||||||
| Score | 1 | 2 | 3 | 4 | |
|---|---|---|---|---|---|
| Indicator | |||||
| Risk category | MR, EnR | SR | ER,FR,TR | PLR,NR | |
| Risk responsibility party | designer, contractor, supervisor | proprietor | |||
3.3.4. Determination of index weights
| p | t | u | c | r | |
|---|---|---|---|---|---|
| p | 1 | 0.33 | 3 | 4 | 4 |
| t | 3 | 1 | 7 | 8 | 8 |
| u | 0.33 | 0.14 | 1 | 5 | 5 |
| c | 0.25 | 0.125 | 0.2 | 1 | 1 |
| r | 0.25 | 0.125 | 0.2 | 1 | 1 |
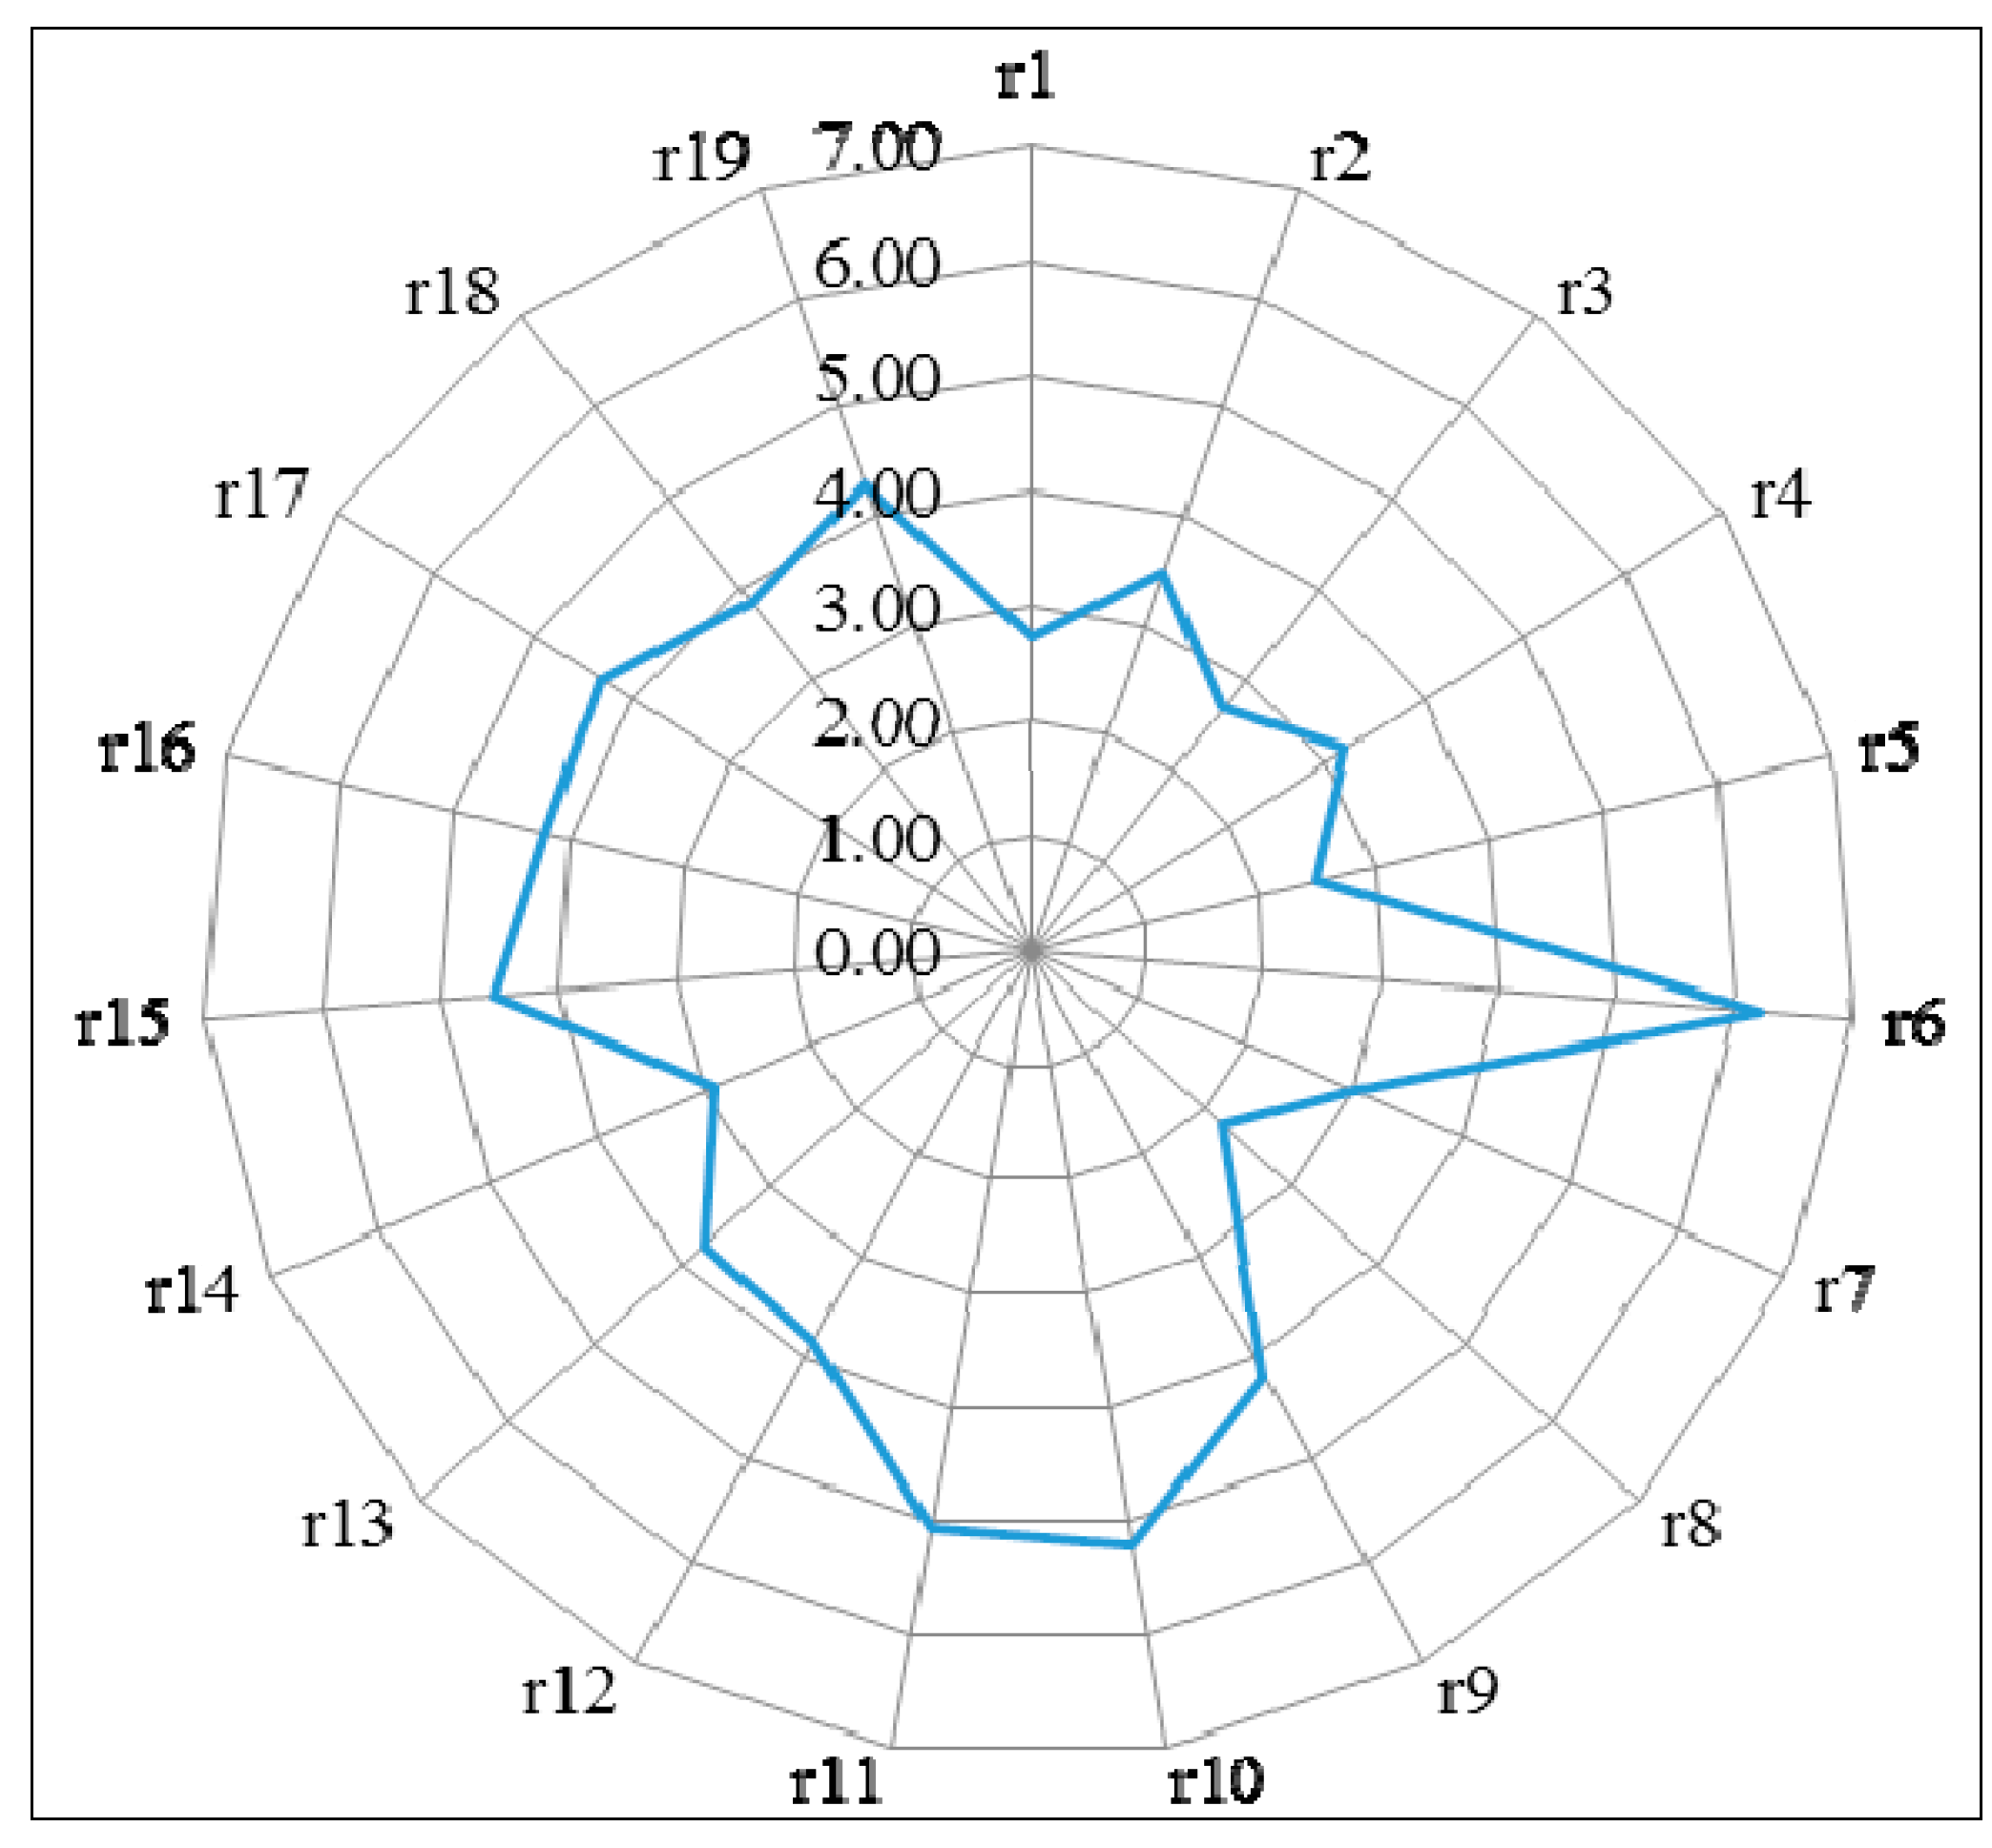
3.3.5. Original Data of the Value of Each Index
| Serial Number | Occurrence Probability | Time Delay Degree | Risk Uncontrollability | Risk Categories | Responsible Party |
|---|---|---|---|---|---|
| r1 | 1.24 | 3.75 | 1.03 | 3 | 3 |
| r2 | 2.25 | 3.99 | 3.75 | 3 | 3 |
| r3 | 1.24 | 3.49 | 1.52 | 3 | 3 |
| r4 | 2.48 | 3.75 | 2.51 | 3 | 3 |
| r5 | 2.99 | 2.25 | 2.75 | 2 | 3 |
| r6 | 4.35 | 7.25 | 8.24 | 1 | 3 |
| r7 | 1.48 | 3.50 | 3.11 | 4 | 3 |
| r8 | 0.90 | 2.75 | 1.75 | 3 | 3 |
| r9 | 4.52 | 4.49 | 3.25 | 3 | 3 |
| r10 | 4.79 | 5.75 | 5.12 | 3 | 3 |
| r11 | 3.47 | 6.25 | 4.24 | 3 | 3 |
| r12 | 3.39 | 4.49 | 3.24 | 1 | 3 |
| r13 | 4.02 | 3.99 | 3.52 | 1 | 3 |
| r14 | 1.25 | 3.90 | 1.57 | 3 | 3 |
| r15 | 2.99 | 5.50 | 4.51 | 3 | 3 |
| r16 | 1.50 | 5.97 | 3.25 | 1 | 3 |
| r17 | 2.01 | 5.69 | 4.23 | 1 | 3 |
| r18 | 1.75 | 4.88 | 3.75 | 3 | 3 |
| r19 | 1.25 | 6.46 | 2.12 | 1 | 3 |
3.3.6. Results of the Impact Value of Each Risk
| Property | TR | SR | MR | PLR | ER | Total |
|---|---|---|---|---|---|---|
| (2,3) | 4 | 1 | 0 | 1 | 0 | 6 |
| (3,4) | 3 | 0 | 2 | 0 | 0 | 5 |
| (4,5) | 2 | 0 | 3 | 0 | 0 | 5 |
| (5,6) | 1 | 0 | 0 | 0 | 1 | 2 |
| (6,7) | 0 | 0 | 1 | 0 | 0 | 1 |
3.4. Risk Prevention
| Key Work Node | Risk Node | Prevention Measures |
|---|---|---|
| W1 | r1 | Selecting scientific and reasonable economic and technical indicators |
| r2 | Using scientific methods to improve the accuracy of the forecasts | |
| r3 | Collecting data of similar projects, comparing and analyzing the actual situation of the proposed project, and advisable decision-making | |
| r4 | Qualifying the preliminary survey | |
| W2 | r5 | An appropriate increase of compensation standards |
| r6 | Coordination of the relevant departments under the provincial subsidiary company; Planning and design units enhancing communication with other industries | |
| r7 | Adjusting the range of capital-using plan | |
| r8 | Improving the level of program design | |
| W3 | r9 | Qualifying preliminary investigation, strengthening geological prospecting ensuring the information accurate and practical |
| r10 | Enhancing the assessment to the survey and design entities | |
| r11 | Formulating a rational plan of funds’ using | |
| W4 | r12 | Improving the assessment accuracy and quantifying the judgment |
| r13 | Enhancing the assessment to consulting entity | |
| W5 | r14 | Improving the efficiency of work |
| r15 | Strengthen the communication with relevant departments, timely prepare the whole material | |
| r16 | Strengthening the communication with relevant departments | |
| r17 | Strengthening the communication with the provincial subsidiary company | |
| W6 | r18 | Reducing subjective factors and improving the depth and accuracy feasibility study |
| r19 | Strengthening the communication with the State Grid Corporation |
4. Conclusions
Acknowledgments
Author Contributions
Appendix
| Key Work Node | Risk Node | Serial Number | Key Work Node | Risk Node | Serial Number | Key Work Node | Risk Node | Serial Number |
|---|---|---|---|---|---|---|---|---|
| W1 | Infeasible economic and technical indicators | r1 | W19 | Design drawings of equipment and materials fail to be recognized on time by relating units. | r75 | W28 | Acceptance file is not complete. | r149 |
| Uncertain trends of objective things & forecast deviation | r2 | Poor design quality, incomplete design content and design conflict among different profession, which lead increase in design changes. | r76 | Civil engineering is not done on time. | r150 | |||
| Mistakes existed in preparation of project proposals | r3 | Design not considers or ill-considers the possibility of the construction. | r77 | Pile foundation of line is lost. | r151 | |||
| Project content is inconsistent with the actual | r4 | Construction drawing fails to be reviewed, signed and published on time. | r78 | Acceptance work delays. | r152 | |||
| W2 | Preliminary geological exploration is blocked | r5 | W20 | Not timely provide the required construction drawings. | r79 | W29 | The existence of quality defects. | r153 |
| Relevant departments’ professional assessment report, reviewing comments and relevant agreements are missing or delay in obtaining | r6 | A full set of construction drawings’ missing, which leads to failure ofcarrying out the review. | r80 | W30 | Equipment has quality problems or does not conform to the requirements of relevant standards. | r154 | ||
| National policy, company operating conditions and other conditions change. | r7 | The owner project department doesn’t send information to the contractors in advance. | r81 | The drawings provided by the equipment suppliers do not tally with the equipment. | r155 | |||
| Project proposal is incorrect or imperfect, a conflict existed against the organization's strategic | r8 | Design and construction drawings are checked as a mere formality, cannot effectively find design errors or omissions. | r82 | Equipment material record is wrong. | r156 | |||
| W3 | Survey data and information is not complete, untrue or incorrect | r9 | Construction drawings’ review and design handover delays. | r83 | Owners project department managers cannot handle engineering problems, resulting in the conflict between construction units and suppliers of materials and equipment. | r157 | ||
| Infrastructure sites and the path information is not detailed, project siting and planning , engineering geology is wrong. | r10 | W21 | Low efficiency of the relevant government departments | r84 | Design field personnel cannot timely, solve design problems in construction process. | r158 | ||
| Power planning changes | r11 | Reply of land expropriation supportive information delays or expires. | r85 | Supervisors’ professional quality is poor, or quantity is small, and fails to guarantee the engineering construction. | r159 | |||
| W4 | Project evaluation and audit is incorrect | r12 | Planning of city, county (district), township’s planning departments is not completely consistent, resulting in delay in boundary survey and planning permission. | r86 | The quality of construction workers cannot meet the construction needs, which leads to rework. | r160 | ||
| Experts or consultants are assessed unqualified | r13 | The nature of the substation land changes. | r87 | Equipment and material’s procurement cycle is long, and the supply is not timely; materials quality cannot meet the construction requirements | r161 | |||
| W5 | Project approval application report prepared is imperfect, and not timely submitted to the NDRC | r14 | Station site environment, topography and geological conditions change | r88 | Less labor contractor or inadequate supply of construction machinery. | r162 | ||
| Planning advice, land pretrial opinion, the EIA and other approved data are incomplete | r15 | Construction site overlies mineral resources and cultural relics, which leads to the change in site. | r89 | Appearing slowdown phenomenon, which results in construction disputes. | r163 | |||
| Projects are not approved through the approval or delay | r16 | Land acquisition costs cannot be timely disbursement and compensation does not reach the designated position | r90 | Existence of various safety and quality risks, providing risks to the progress of the project. | r164 | |||
| Comments of Provincial feasibility review are missing or delayed | r17 | Local residents blocked and other external environmental factors lead to land expropriation obstacles. | r91 | Line channels’ changes caused by external environmental factors. | r165 | |||
| W6 | Deviation of feasibility size and scale approved is too large | r18 | Land use formalities delay. | r92 | Major changes in engineering design. | r166 | ||
| Approved feasibility study of State Grid Corporation and other documents are not issued or delay | r19 | W22 | Environment and weather effects | r93 | Construction workers reduce due to the busy seasons or national holidays, | r167 | ||
| W7 | Approved document of NDRC is not approved and feasibility review comments are not released. | r20 | Path planning adjustment | r94 | Rainy, winter , high temperatures and other weather factors. | r168 | ||
| Tender documents is not rigorous | r21 | Uncertainty of government projects or emergency project of large users causes engineering changes or abnormal duration. | r95 | Construction units have insufficient funds, or unreasonable arrangement. | r169 | |||
| Evaluation methods is not clear | r22 | The compensation does not reach the designated position. | r96 | Equipment and materials’ inventory is wrong, which leads to omissions or insufficient number of procurement. | r170 | |||
| Design tender fails | r23 | Power, water supply and others do not pass, resulting in construction obstacles. | r97 | Project Management Unit cannot timely pay for work according to the contract. | r171 | |||
| W8 | Not entrusted construction management unit | r24 | Slow implementation of municipal roads block station road. | r98 | Water supply, electricity supply facilities and construction machinery equipment for construction always fails. | r172 | ||
| Field leveling progress lags behind. | r99 | Key materials, equipment, machines and tools are theft or damaged. | r173 | |||||
| W9 | Owner project department’s establishment is delayed and staffing does not meet engineering requirements | r25 | Project department and other temporary facilities’ construction lags behind. | r100 | Rework due to substandard construction process.. | r174 | ||
| W10 | Project management framework, safe and civilized construction planning and other pre-planning documentation is not timely issued and of poor feasibility. | r26 | W23 | Contractors and construction supervision is not prepared to timely approach. | r101 | Rework due to the error of construction drawing and other design reasons. | r175 | |
| Collection of market and environmental information concerning substation sites and line channels is not complete. | r27 | Not timely supply adequate materials. | r102 | The management of construction project department cannot meet the needs of the construction, which appears contradictions between each type of work and process.. | r176 | |||
| Progress untimely or incomplete planning. | r28 | Operating conditions are not qualified, so the project manager cannot approve commencement report. | r103 | W31 | Power grid blackout.during the period of national (or local) important festival or activities, and special summer peaks. | r177 | ||
| Information about sites, paths and other is not detailed and incomplete | r29 | Supporting information about the construction permit cannot be approved. | r104 | Line channels’ changes and clearing difficulties caused by external environmental factors. | r178 | |||
| Incomplete external conditions agreement | r30 | Work-start reports attachment is not complete or lack of standardization. | r105 | Equipment manufacturer is not in place, so technical support is not enough. | r179 | |||
| Flow calculation, short circuit current calculation is imperfect, equipment selection does not match. | r31 | W24 | Construction organization design, construction scheme’s analysis is incorrect. | r106 | Design field personnel cannot timely, solve design problems in construction process. | r180 | ||
| Design technology program comparison and other is imperfect. | r32 | Construction progress plan is short of timeliness or operability. | r107 | The overall project is not completed, which leads to normal joint commissioning failure. | r181 | |||
| Poor design feasibility. | r33 | Project land acquisition procedures are not complete. | r108 | Equipment damages or requirements are not uniform, etc., affecting the normal debugging. | r182 | |||
| Equipment prices change; policy-based charge changes; budget estimate is wrong. | r34 | Construction personnel’s qualifications, experience, level and number cannot meet the construction needs. | r109 | Improper arrangement of Scheduling Communication Departments. | r183 | |||
| Municipal planning changes. | r35 | Related procedures and implementation of temporary power supply and water supply projects are not timely. | r110 | W32 | Inspector doesn’t find the quality problems. | r184 | ||
| A grater change exists between sites or line channels’ external environment and the feasibility study stage. | r36 | Works on the table for examination is not completed. | r111 | Self-test problem is not timely rectified. | r185 | |||
| W12 | Designing unit fails to report preliminary design information timely. | r37 | W25 | Disputes caused by poor communication. | r112 | W33 | Difficult to set up kick-off meeting because of inappropriate or incomplete staff. | r186 |
| Construction unit audit is not timely and not seriously; OIA comments fails being submitted timely; preliminary design review of the plan is not submitted in advance. | r38 | Loopholes in safety management. | r113 | Construction unit self test is not serious. | r187 | |||
| Adjustment in municipal planning causes changes in sites, resulting in the need to supplement preliminary information. | r39 | Construction workers do not understand the safety and security of operational knowledge. | r114 | Acceptance department does not fulfill the corresponding duties. | r188 | |||
| Walking trails change and needs to supplement channel protocol. | r40 | No technical measures for safety and quality. | r115 | Production acceptance does not pass. | r189 | |||
| Engineering budgetary estimate exceeds cost estimation. | r41 | Safety and quality technical measure is not perfect. | r116 | The defect in the process of production acceptance is not timely eliminated. | r190 | |||
| Preliminary design scale does not match that of feasibility studies and project approved. | r42 | Disciplinary and violation jobs occur. | r117 | Technical information reported to the dispatch department does not meet all the requirements. | r191 | |||
| Examination is not passed, and a long time needed for modifying. | r43 | Staff does not meet the requirements. | r118 | Commissioning plan is not submitted timely and accurate. | r192 | |||
| Consultant or expert’s assessment is wrong. | r44 | High-risk project is not equipped with safe construction work ticket, and on-site supervision does not reach the designated position. | r119 | Text information is missing. | r193 | |||
| W13 | Projects are not included in the investment plan. | r45 | Special construction work does not have special safety and quality plan; special plan review delays or is not strict. | r120 | W34 | Work which needs to be implemented is unfinished. | r194 | |
| Projects are not included in the provincial annual milestone plan | r46 | W26 | Meeting not being prepared adequately leading to inefficient information transmission. | r121 | ||||
| W14 | Preliminary design review is not in time. | r47 | The errors and omissions in conference, lead to fail reflecting and solving problems in a timely manner. | r122 | W35 | Data transfer exceeds the predetermined time. | r195 | |
| ERP, bidding platform system is not timely established. | r48 | The owner, supervision and construction project department personnel cannot reach the designated position. | r123 | Information transferred is incomplete or non-standard. | r196 | |||
| Design department does not timely reportmaterial and non-material goods tender information. | r49 | Project meetings become a mere formality. | r124 | W36 | Engineering Change Certificate is incomplete or non-standard. | r197 | ||
| Construction management unit’s plans for applying tender is not complete | r50 | W27 | Construction project department management cannot meet the needs of the construction, construction organization and schedule is unreasonable, which appears contradictions between each type of work and process, then affecting the schedule. | r125 | Drawing examination summary is not standardized. | r198 | ||
| Actual bidding is not in accordance with the milestone plan. | r51 | Design field personnel cannot timely, according to the requirement, solve design problems in construction process. | r126 | Construction budget preparation delays and has omissions. | r199 | |||
| Review of tender documents delays. | r52 | Compensation standard along the channel is not consistent. | r127 | BOQ preparation is inaccurate. | r200 | |||
| Bidding content appears missing. | r53 | Appearing slowdown phenomenon, results in construction disputes. | r128 | Controversy existed between construction management unit and construction unit. | r201 | |||
| Quote explain and price adjustment is not clear; BOQ appears big error. | r54 | The owner project department managers cannot handle engineering problems in a timely manner. | r129 | W37 | Incomplete accounts information | r202 | ||
| The tender documents is not rigorous. | r55 | Existence of various safety and quality risks, providing risks to the progress of the project. | r130 | Account transfer risk. | r203 | |||
| The evaluation method is not clear. | r56 | Project Management Unit cannot timely pay for work according to the contract. | r131 | Engineering financial management and control’s specification risk. | r204 | |||
| The bid opening and bid assessment process is not legal. | r57 | Water supply, electricity supply facilities and construction machinery equipment for construction always fails. | r132 | Cash flow problems and other fund management risk. | r205 | |||
| The bidding does not meet standard. | r58 | Experiencing excessive groundwater, quicksand, geological faults, caverns; discovering buried underground cultural relics; discovering remnants of war ammunition in the construction. | r133 | W38 | Engineering archived data’s quality has defects. | r206 | ||
| Project pre-tender estimate leaks. | r59 | Earthquakes, floods and other force majeure risks to the progress of the project. | r134 | Quality accident happens after putting into operation. | r207 | |||
| The bidding documents issued lag behind. | r60 | Major political events, social activities, and changes in the economic situation. | r135 | Substandard project post-maintenance work. | r208 | |||
| W15 | Dispute exists against principal terms, resulting in signing delay. | r61 | Line channels’ changes caused by external environmental factors. | r136 | The time of engineering final accounts and approval is long. | r209 | ||
| Differences exist in technical parameters of equipment and materials, resulting in supplies contract delay. | r62 | Major changes in engineering design. | r137 | Project is poorly operated after putting into operation. | r210 | |||
| The contract is not signed within the required time, bringing engineering specifications management risk. | r63 | Construction workers reduce during the busy seasons or national holidays. | r138 | Environmental protection, water conservation and other special inspection does not pass. | r211 | |||
| W16 | The approval from the feasibility study delays, and no approval basis for preliminary design. | r64 | Rainy, winter, high temperatures and other weather factors. | r139 | W39 | The contract check is not serious. | r212 | |
| Provincial companies, consulting organizations fails to issue the preliminary design review comments file on time. | r65 | Construction units have insufficient funds, or arrange unreasonable. | r140 | Inspection records of concealed works are incomplete. | r213 | |||
| State Grid Corporation fails to issue the preliminary design review comments file on time. | r66 | Less labor contractor or inadequate supply of construction machinery. | r141 | Design Change Certificate is not standardized. | r214 | |||
| W17 | Capital budget request delays. | r67 | Construction materials’ high market price, long procurement cycle and substandard quality. | r142 | Engineering quantity’s check is not accurate. | r215 | ||
| Cost estimate is incorrect. | r68 | Equipment and materials’ inventory is wrong, lead to omissions or insufficient number of procurement. | r143 | Pricing not accords with the contract terms. | r216 | |||
| Improper arrangement of operating expense budget. | r69 | The level of construction workers cannot meet the construction needs, which leads to rework. | r144 | Fee calculation errors. | r217 | |||
| Application review and disbursement of project funds delays. | r70 | Standard construction process fails, resulting in rework. | r145 | The auditor is not in conformity with the quality standard. | r218 | |||
| W18 | Procedures dealing with construction permits more than enough time. | r71 | Rework due to the error of construction drawing and other design reasons. | r146 | W40 | Project image data does not meet the requirements. | r219 | |
| W19 | Technical obstacles caused by inaccurate infrastructure sites, detailed geological exploration path information and others. | r72 | Supervisors’ professional quality is poorer, or quantity is small, who fail to take effective measures to guarantee the engineering construction. | r147 | Quality accident happens after putting into operation. | r220 | ||
| Construction design changes caused by geological conditions and channel environment change. | r73 | W28 | Civil engineering’s quality does not meet the requirements. | r148 | Environmental protection, water conservation and other special inspection does not pass. | r221 | ||
| Equipment manufacturers cannot timely deliver drawings, so design units do not timely receive information. | r74 | Standard work preview and review work does not meet the standard. | r222 |
Conflicts of Interest
References
- Gu, Y.G.; Luo, Z.; Shan, B.G. Outlook 2013 of Power Supply and Demand in China and Related Suggestions. Electr. Power 2013, 46, 7–10. [Google Scholar]
- Lin, W.B.; Chen, B.; Yu, Y.S. Research on Rorecasting Electricity Demand oR the12th Rive-year and 2020. China Popul. Resour. Environ. 2011, 21, 1–6. [Google Scholar]
- Merna, T.; Al-Thani, F.F. Corporate Risk Management; John Wiley & Sons Inc.: Hoboken, NJ, USA, 2008. [Google Scholar]
- Chapman, C. Project risk analysis and management-the PRAM generic process. Int. J. Proj. Manag. 1997, 15, 273–281. [Google Scholar]
- Institute of Risk Management. A Risk Management; Standard Institute of Risk Management: London, UK, 2002. [Google Scholar]
- Project Management Institute. A Guide to the Project Management Body of Knowledge; Project Management Institute Standards Committee: Philadelphia, PA, USA, 2008. [Google Scholar]
- Edwards, P.J.; Bowen, P.A. Risk and risk management in construction: A review and future directions for research. Eng. Constr. Archit. Manag. 1998, 5, 339–349. [Google Scholar] [CrossRef]
- Zhou, L.; Vasconcelos, A.; Numes, M. Supporting decision making in risk management through an evidence-based information systems project risk checklist. Inf. Manag. Comput. Secur. 2008, 16, 166–186. [Google Scholar]
- Tah, J.H.M.; Thorpe, A.; McCaffer, R. Contactor project risks contingency allocation using linguistic approximation. Comput. Syst. Eng. 1993, 4, 281–293. [Google Scholar] [CrossRef]
- Wirba, E.N.; Tah, J.H.M.; Howes, R. Risk interdependencies and natural language computations. J. Eng. Constr. Archit. Manag. 1996, 3, 251–269. [Google Scholar] [CrossRef]
- Liu, J.Y.; Wang, Z.F. Non-additivity analysis on scheduling risks based on Bayesain networks. Syst. Eng.-Theory Pract. 2011, 31, 1517–1523. [Google Scholar]
- Liu, J.Y. Correlation analysis of scheduling risks based on BN-CPM. J. Hydroelectr. Eng. 2011, 30, 199–203. [Google Scholar]
- Li, C.B.; Lu, G.S.; Li, P.; Zhang, C.S. Grid Construction Project Schedule Risk Analysis Based on Rough Set Theory. East China Electr. Power 2012, 40, 1325–1327. [Google Scholar]
- Jiang, Z.L.; Wang, D.Y.; Liu, X.J. Study on the risk analysis and benefit sharing in BT construction project. J. Hunan Univ. (Nat. Sci.) 2012, 39, 89–92. [Google Scholar]
- Wang, Z.Q.; Liu, Y.J.; Yu, J.R. Applying research of SCERT on risk analysis and management of large project. China Soft Sci. 2002, 7, 105–108. [Google Scholar]
- Ahmed, A.; Kayis, B.; Amornsawadwatana, S. A review of techniques for risk management in projects. Benchmarking 2007, 14, 22–36. [Google Scholar] [CrossRef]
- Nieto-Morote, A.; Ruz-Vila, F. A fuzzy approach to construction project risk assessment. Int. J. Project Manag. 2011, 29, 220–231. [Google Scholar] [CrossRef]
- Zhao, H.; Li, Y.J.; Song, T. Study on engineering project risk management based on Bayesian network. J. Shenyang Univ. Technol.: Soc. Sci. Ed. 2008, 1, 239–244. [Google Scholar]
- Liu, J.Y. Bayesian network inference on risks of construction schedule cost[C]. In Proceedings of the 2010 International Conference of Information Science and Management Engineering, Xi’an, China, 7–8 August 2010; Volume 2, pp. 15–18.
- Taroun, A. Towards a better modeling and assessment of construction risk: Insights from a literature review. Int. J. Project Manag. 2014, 32, 101–115. [Google Scholar] [CrossRef]
- Williams, T. The two-dimensionality of project risk. Int. J. Proj. Manag. 1996, 14, 185–186. [Google Scholar]
- Jannadi, O.A.; Almishari, S. Risk assessment in construction. J. Constr. Eng. Manag. 2003, 129, 492. [Google Scholar]
- Aven, T.; Vinnem, J.; Wiencke, H. A decision framework for risk management, with application to the offshore oil and gas industry. Reliab. Eng. Syst. Saf. 2007, 92, 433–448. [Google Scholar] [CrossRef]
- Cagno, E.; Caron, F.; Mancini, M. A multi-dimensional analysis of major risks in complex projects. Risk Manag. 2007, 9, 1–18. [Google Scholar] [CrossRef]
- Cioffi, D.F.; Khamooshi, H. A practical method of determining project risk contingency budgets. J. Oper. Res. Soc. 2009, 60, 565–571. [Google Scholar] [CrossRef]
- Fan, C.F.; Yu, Y.C. BBN-based software project risk management. J. Syst. Softw. 2004, 73, 193–203. [Google Scholar]
- Molenaar, K.R. Programmatic cost risk analysis for highway megaprojects. J. Constr. Eng. Manag. 2005, 131, 343. [Google Scholar] [CrossRef]
- Saaty, T.L. Analytic hierarchy process. In Encyclopedia of Biostatistics; John Wiley & Sons Inc.: Hoboken, NJ, USA, 1980. [Google Scholar]
- Tah, J.; Carr, V. A proposal for construction project risk assessment using fuzzy logic. Constr. Manag. Econ. 2000, 18, 491–500. [Google Scholar] [CrossRef]
- Duan, B.Q. Comprehensive risk assessment model of complex product systems innovation based on Fuzzy AHP. J. Tongji Univ. (Nat. Sci.) 2008, 36, 23–26. [Google Scholar]
- Xiao, L.; Qi, Y.; Li, Q.M. Information security risk assessment based on AHP and fuzzy comprehensive evaluation. Comput. Eng. Appl. 2009, 45, 89–91. [Google Scholar]
- Zhang, X.S.; Wang, S.F.; Guo, X.L. Research on evaluation risk of power market based on Monte Carlo simulation. Relay 2007, 35, 66–73. [Google Scholar]
- Wang, T.H.; Song, Y.X.; Song, CH.Q. Risk evaluation of wartime equipment supply chain based on TOPSIS method with fuzzy ameliorated Entropy Weight. Comput. Digit. Eng. 2012, 40, 101–106. [Google Scholar]
- Guan, S.X.; Zhang, Y. Credit risk evaluation in commercial bands using TOPSIS model based on Entropy Weights. J. Inf. 2008, 27, 59–65. [Google Scholar]
- Liu, H.L.; Zhou, Y.N.; Zheng, L. The process variance analysis model distinguishing the critical and non-critical path. Constr. Manag. Modern. 2009, 23, 502–504. [Google Scholar]
- Tian, Z.X.; Ye, J.; Zhang, X. Project object cost and time control research. J. Beijing Univ. Aeronaut. 2001, 14, 37–41. [Google Scholar]
- Zou, P.X.W.; Zhang, G.M.; Wang, J.Y. Understanding the key risks in construction projects in China. Int. J. Proj. Manag. 2007, 25, 601–614. [Google Scholar] [CrossRef]
- Sara, M.S.; Amaya, P.E.; Angel, M.E.L.; Pedro, V. Project risk management methodology for small firms. Int. J. Proj. Manag. 2013, 32, 327–340. [Google Scholar]
- Flanagan, R.; Norman, G. Risk Management and Construction; Blackwell Science Pty Ltd.: Victoria, Australia, 1993. [Google Scholar]
- Wang, S.Q.; Tiong, R.L.K.; Ting, S.K.; Ashley, D. Evaluation and management of foreign exchange andrevenue risks in China’s BOT projects. Constr. Manag. Econ. 2008, 18, 197–207. [Google Scholar]
- Baker, W.; Reid, H. Identifying and Managing Risk; Pearson Education: French Forest, Australia, 2005. [Google Scholar]
- Shen, L.Y.; Wu, G.W.C.; Ng, C.S.K. Risk assessment for construction joint ventures in China. J. Constr. Eng. Manag. 2001, 127, 76–81. [Google Scholar] [CrossRef]
© 2014 by the authors; licensee MDPI, Basel, Switzerland. This article is an open access article distributed under the terms and conditions of the Creative Commons Attribution license (http://creativecommons.org/licenses/by/4.0/).
Share and Cite
Rao, R.; Zhang, X.; Shi, Z.; Luo, K.; Tan, Z.; Feng, Y. A Systematical Framework of Schedule Risk Management for Power Grid Engineering Projects’ Sustainable Development. Sustainability 2014, 6, 6872-6901. https://doi.org/10.3390/su6106872
Rao R, Zhang X, Shi Z, Luo K, Tan Z, Feng Y. A Systematical Framework of Schedule Risk Management for Power Grid Engineering Projects’ Sustainable Development. Sustainability. 2014; 6(10):6872-6901. https://doi.org/10.3390/su6106872
Chicago/Turabian StyleRao, Rao, Xingping Zhang, Zhiping Shi, Kaiyan Luo, Zhongfu Tan, and Yifan Feng. 2014. "A Systematical Framework of Schedule Risk Management for Power Grid Engineering Projects’ Sustainable Development" Sustainability 6, no. 10: 6872-6901. https://doi.org/10.3390/su6106872
APA StyleRao, R., Zhang, X., Shi, Z., Luo, K., Tan, Z., & Feng, Y. (2014). A Systematical Framework of Schedule Risk Management for Power Grid Engineering Projects’ Sustainable Development. Sustainability, 6(10), 6872-6901. https://doi.org/10.3390/su6106872