Article

Renewables or Fossils: How Economic Growth and Financial Development Shape Egypt’s Energy Demand Under Globalization and Ecological Constraints

by
Ahmed Aboubakr Mohamed Alkasih
1,* and
Wagdi Khalifa
2
1
Institute of Social Sciences, University of Mediterranean Karpasia, Northern Cyprus, Mersin 10, Turkey
2
Department of Business Administration, University of Mediterranean Karpasia, Northern Cyprus, Mersin 10, Turkey
*
Author to whom correspondence should be addressed.
Sustainability 2026, 18(9), 4605; https://doi.org/10.3390/su18094605
Submission received: 11 February 2026 / Revised: 2 April 2026 / Accepted: 7 April 2026 / Published: 6 May 2026
(This article belongs to the Section Energy Sustainability)

Abstract

Energy remains fundamental to economic growth and national development, yet Egypt faces a persistent challenge in expanding energy supply without deepening dependence on conventional sources. Although earlier studies examined the determinants of energy use, limited evidence exists on whether macroeconomic and environmental factors differently affect renewable energy consumption (REC) and non-renewable energy consumption (NREC) in the Egyptian context. This study addresses this problem by examining the roles of economic growth, financial development, the ecological footprint, and economic globalization in shaping REC and NREC in Egypt over the period 1970 to 2024. To achieve this objective, the study employs the Autoregressive Distributed Lag (ARDL) approach, which is suitable for estimating short-run dynamics and long-run relationships among variables with mixed orders of integration. The results indicate that across the REC models, economic growth increases renewable consumption, while the ecological footprint reduces it, indicating that environmental pressure has not translated into stronger REC. Financial development exhibits as a negative in the long run, suggesting finance has not been consistently directed toward renewables. Although economic globalization is insignificant, trade and financial globalization reduce REC in the long run. For the NREC models in the long run, GDP, financial development, and ecological footprint increase NREC. Economic, trade, and financial globalization effects are mostly insignificant for NREC, implying that domestic fundamentals drive conventional energy use. Thus, the findings suggest that Egypt’s energy structure is still driven more by domestic growth and financial conditions than by external integration. However, these results should be interpreted as evidence of association within the ARDL framework rather than proof of causality. The study therefore highlights the need for policies that align economic growth with renewable energy expansion, improve the direction of finance toward green investment, and strengthen the institutional conditions necessary to support a more sustainable energy transition

1. Introduction

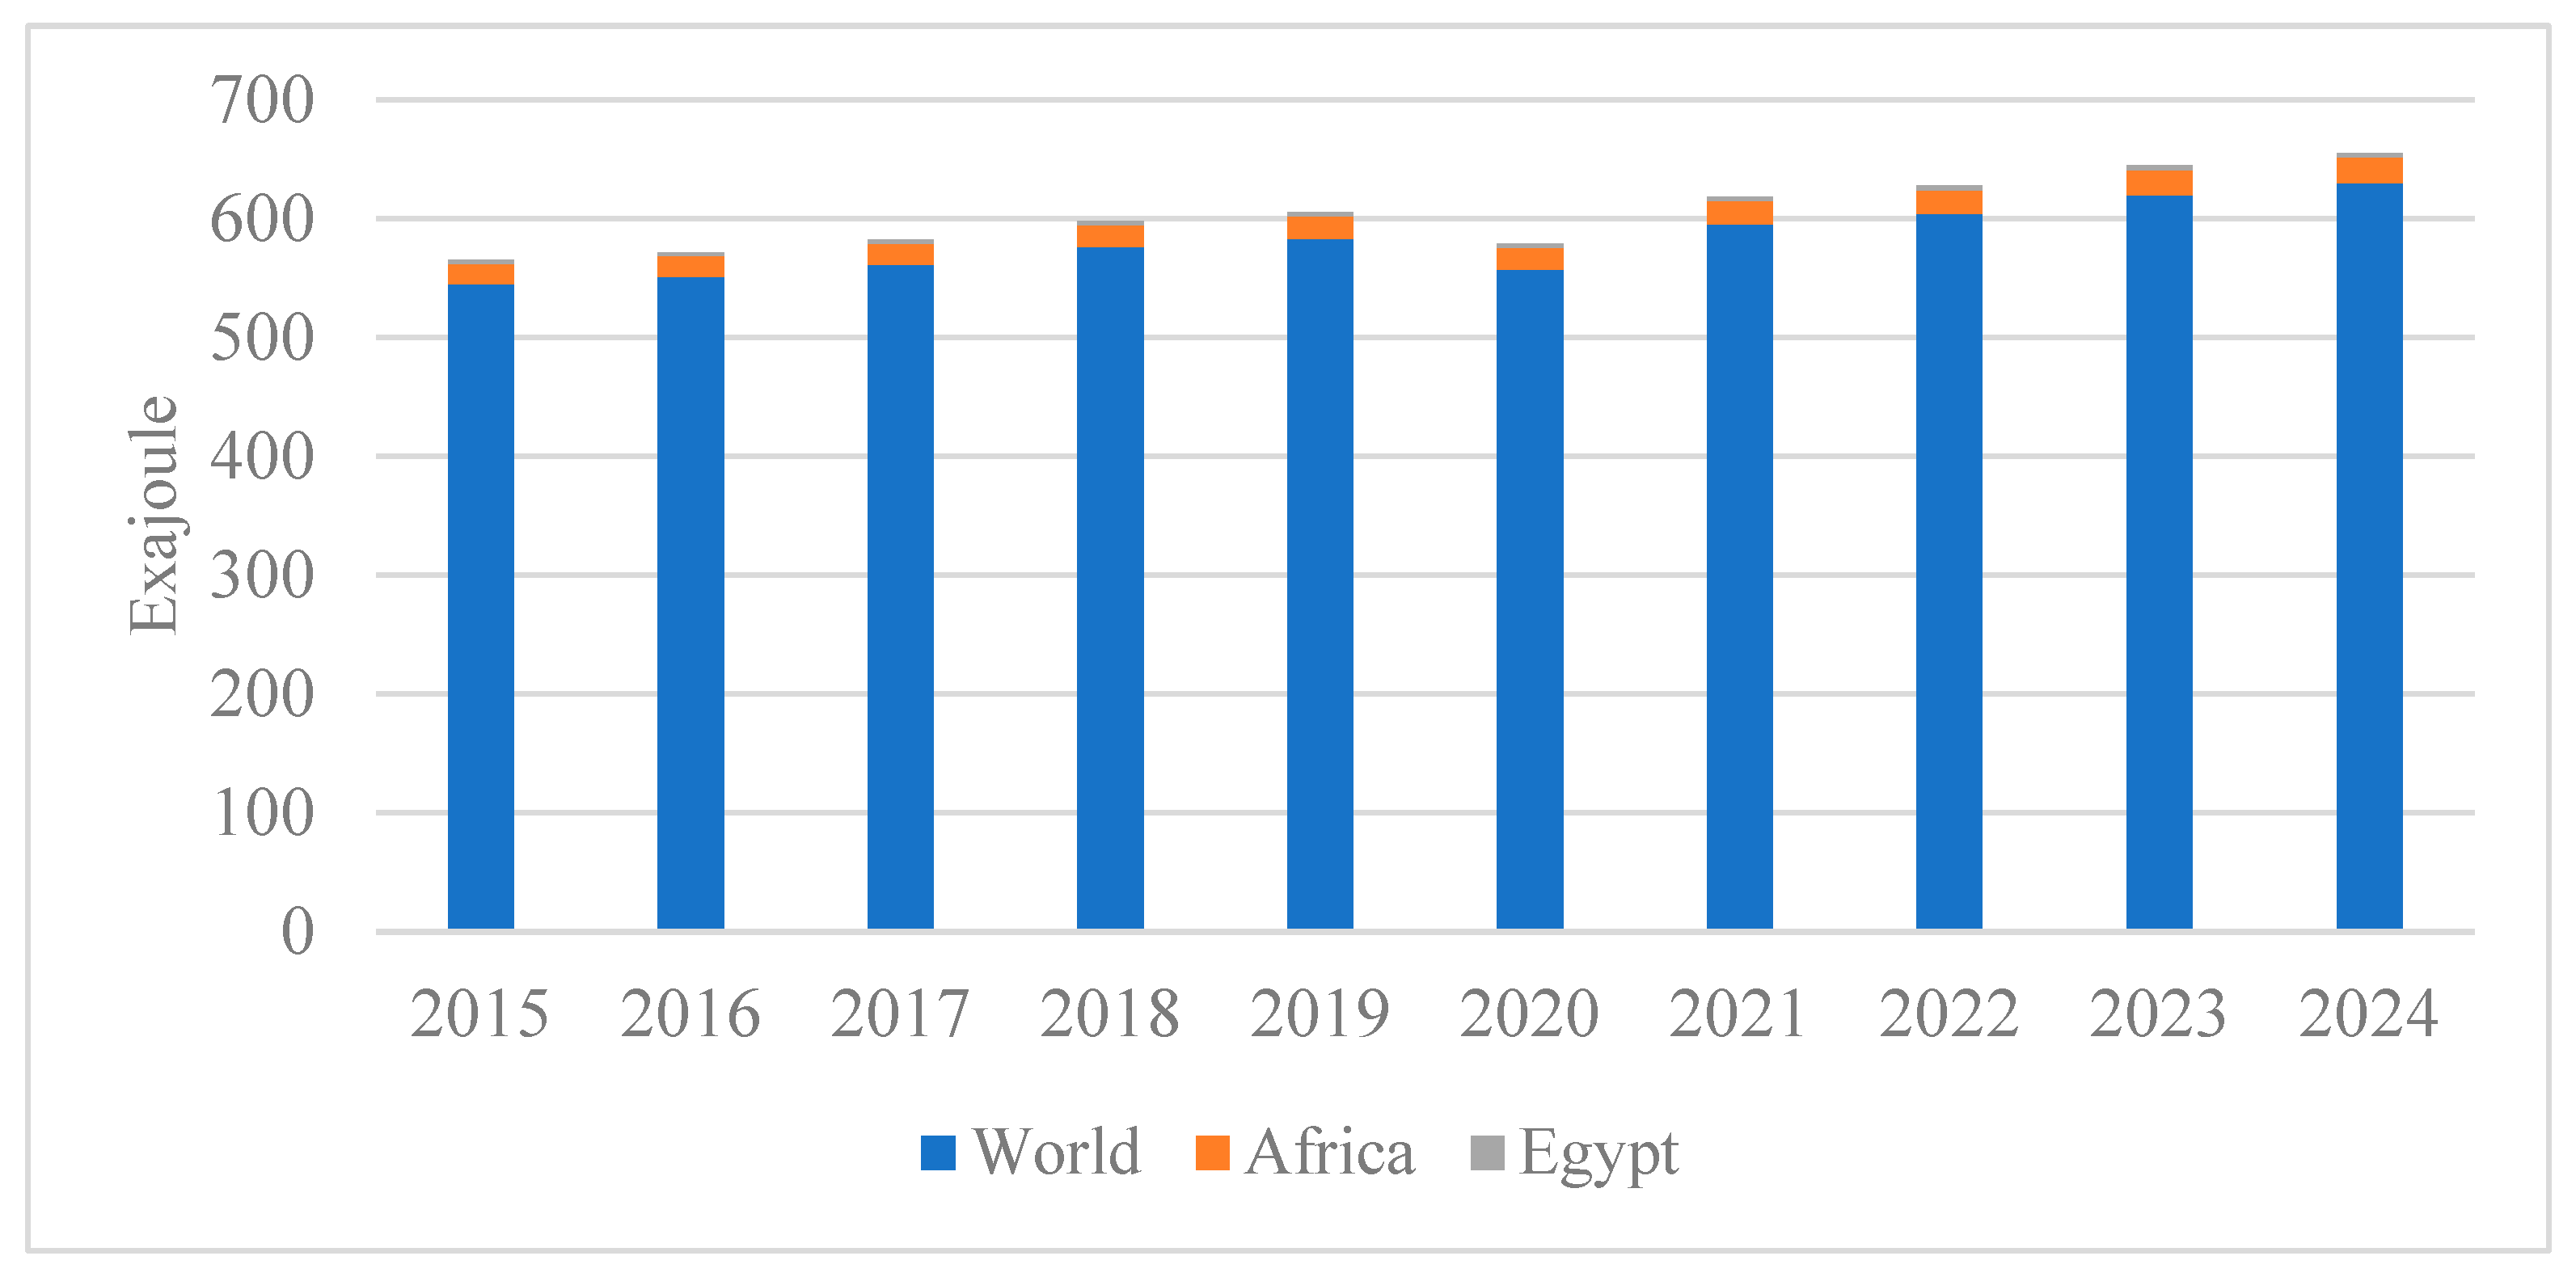
Egypt’s energy demand has expanded steadily over the past two decades, driven by population growth, urbanization, industrialization, and rising electricity needs [1]. Egypt’s primary energy consumption remains relatively small compared with global and African levels (See Figure 1). According to the U.S. Energy Information Administration, Egypt’s primary energy consumption increased from 1.912 quadrillion Btu in 2000 to 4.331 quadrillion Btu in 2024, reflecting an average annual growth rate of about 3.5% [2]. This pace exceeds the average growth recorded for Africa over the same period, underscoring the growing scale of Egypt’s domestic energy requirements [3]. Although Egypt’s total primary energy consumption remains below the global level, its sustained increase has made the country one of Africa’s major energy consumers and a notable contributor to the continent’s greenhouse gas emissions [4]. As economic activity, income levels, and urban development continue to rise, the country’s long-term energy needs are expected to increase further. This trend raises an important policy concern, because if future demand continues to be met predominantly through conventional sources, Egypt may face deeper fossil-fuel dependence, greater environmental pressure, and heightened vulnerability to supply and price instability.
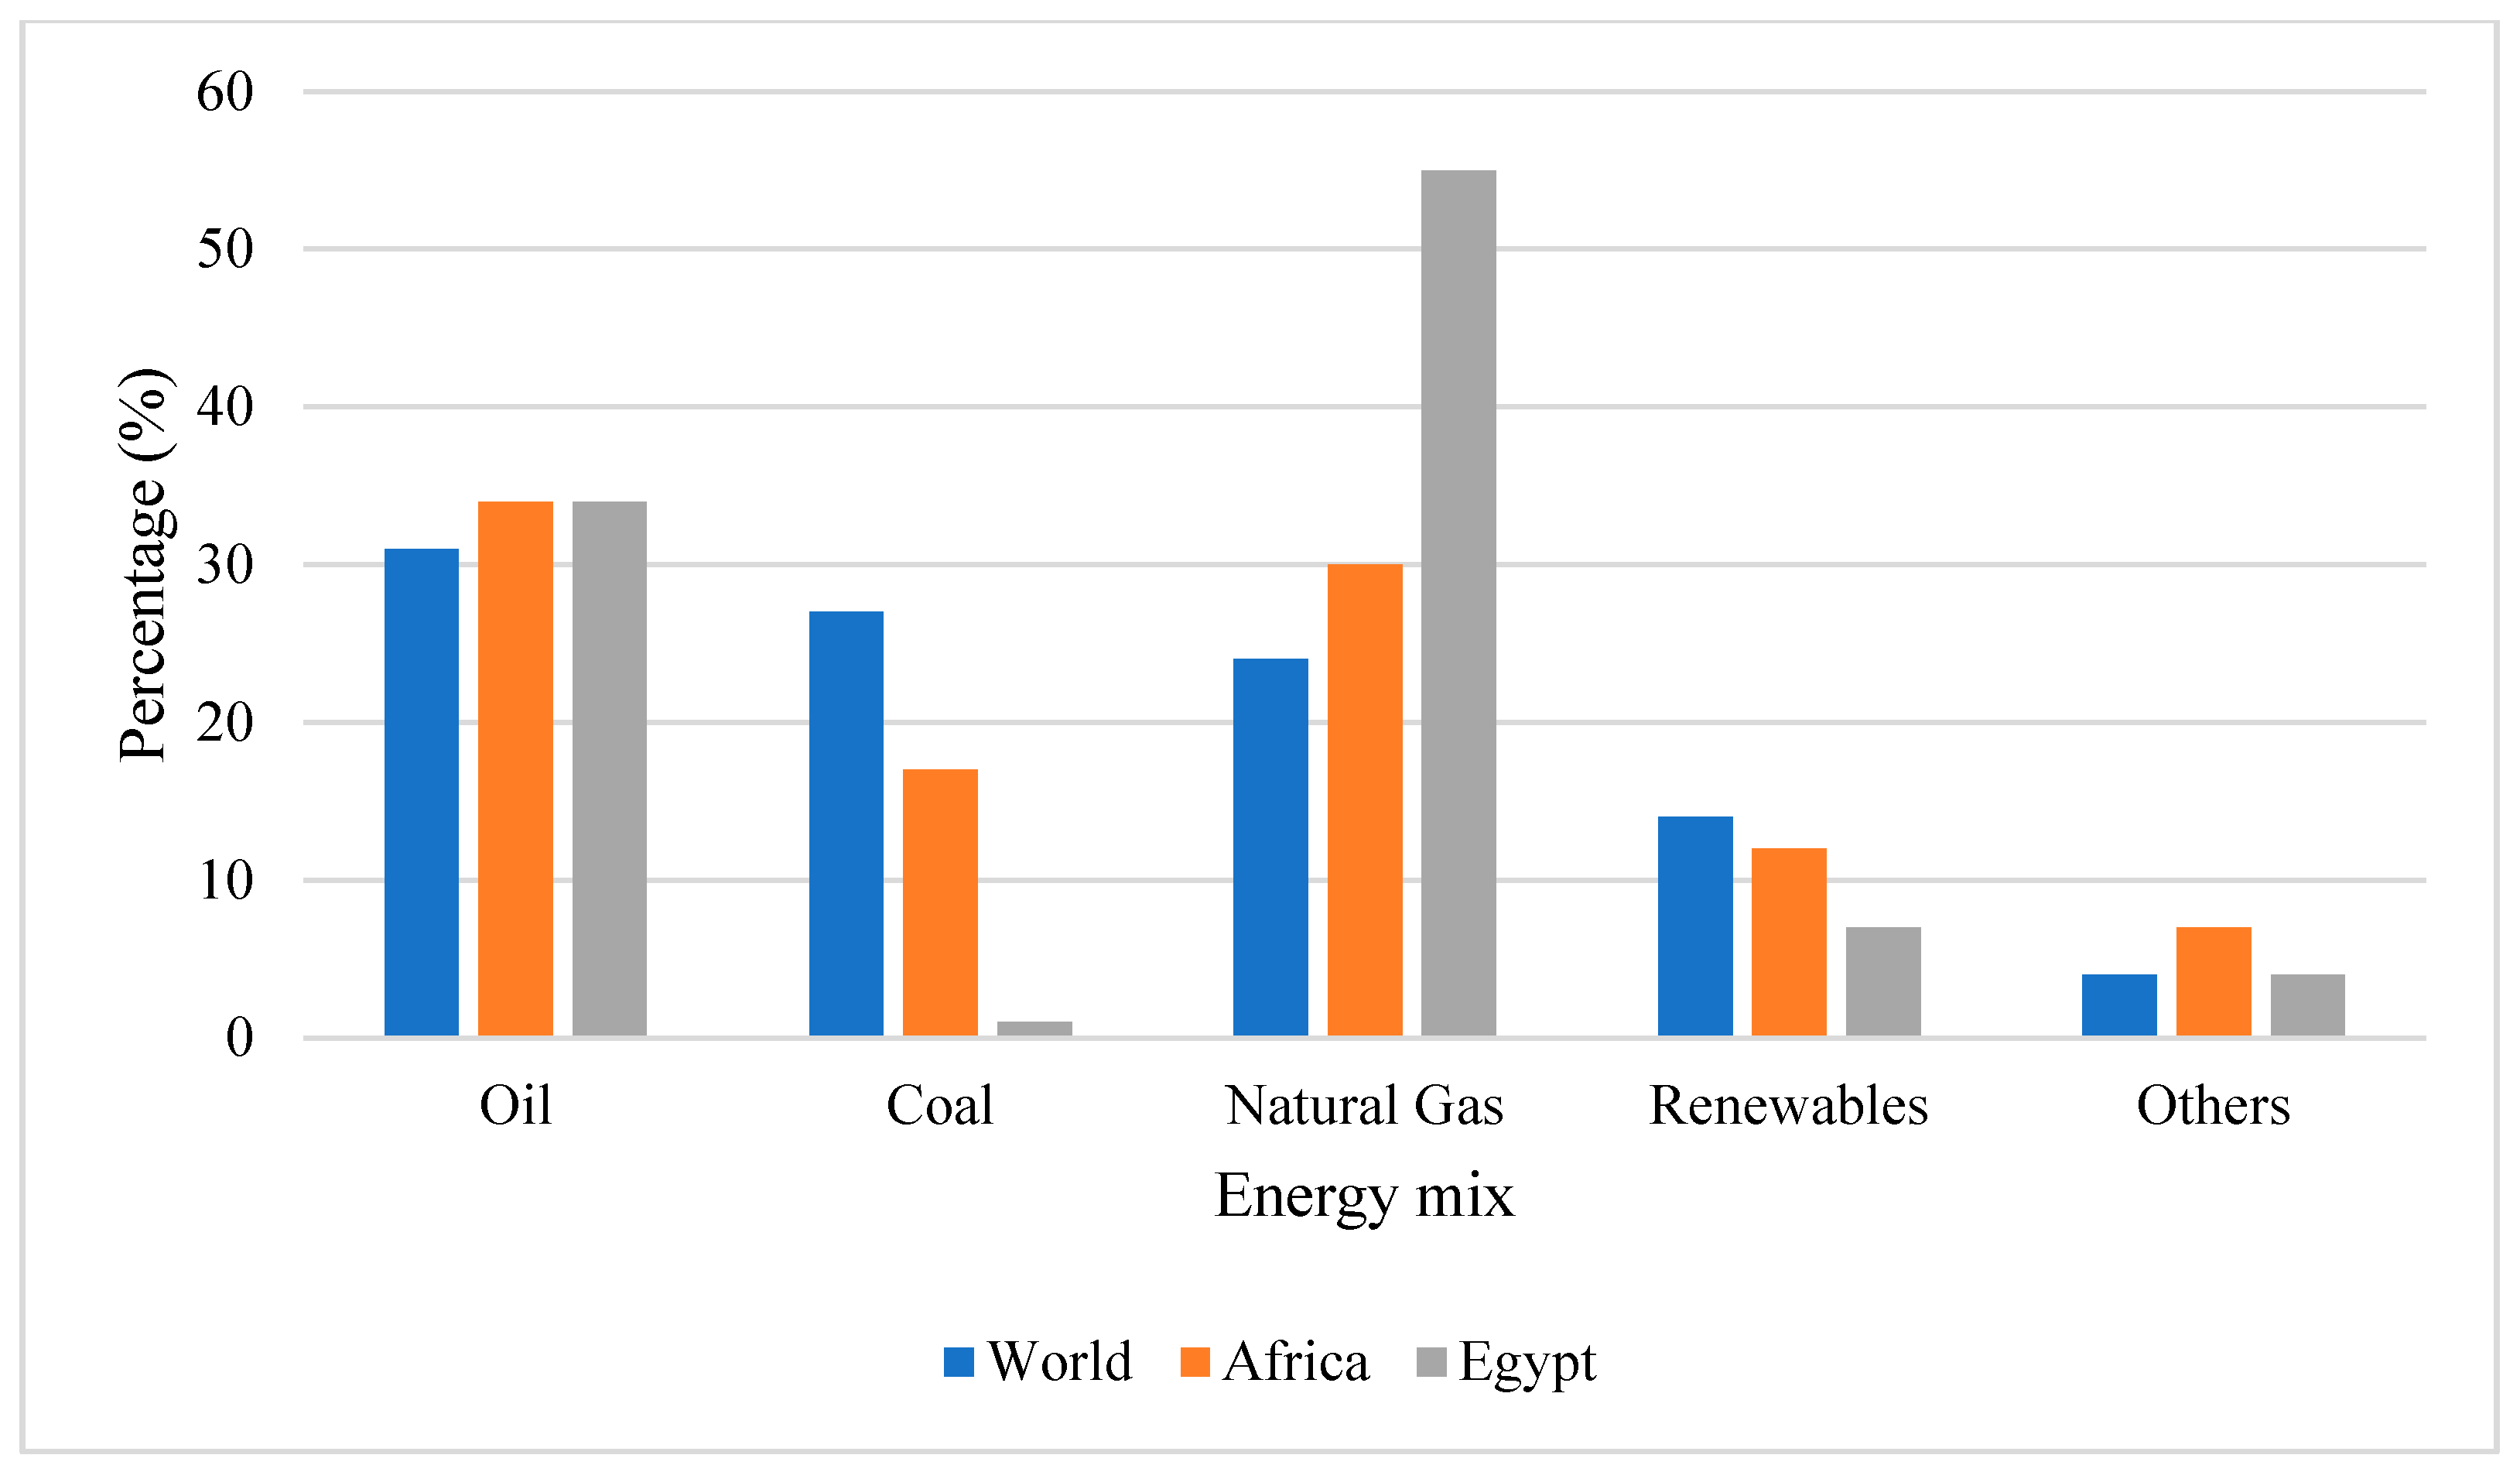
This concern is particularly important because the structure of Egypt’s energy system remains overwhelmingly fossil-fuel based. Globally, primary energy consumption increased from about 545 EJ in 2015 to more than 630 EJ in 2024 (See Figure 1), yet fossil fuels still account for nearly three-quarters of total energy use. In Egypt, this dependence is even more pronounced. The country’s energy profile continues to be anchored in oil and natural gas, supported by considerable hydrocarbon reserves. By the end of 2024, proven reserves were estimated at 3.3 billion barrels of oil and 78 trillion cubic feet of natural gas [5]. In line with this energy structure (see Figure 2), natural gas and oil accounted for about 55% and 34% of total energy supply in 2024, while renewables contributed only about 7%, and coal played a minor role [6]. At the same time, Egypt’s installed energy capacity stood at approximately 59.7 GW by 2024 to 2025, with much of the recent expansion driven by natural gas combined-cycle and dual-fuel plants [7]. While this conventional supply structure has supported electricity provision, it has also intensified environmental costs, especially in heavily populated urban areas. For instance, the Global Burden of Disease assessment reported 111,300 deaths in 2023 linked to ambient PM2.5 air pollution in Egypt [8], while the cost of ambient PM2.5 pollution in Greater Cairo alone has been estimated at LE 47 billion, equivalent to about 1.35% of GDP [9]. These trends suggest that the challenge facing Egypt is not merely how to expand energy supply, but how to alter the composition of that supply in a way that is compatible with environmental sustainability.
In response, Egypt has increasingly prioritized the expansion of renewable energy as part of a broader strategy to improve environmental quality [10]. The Integrated Sustainable Energy Strategy sets out a target of raising the share of renewables in the electricity mix to 42% by 2035 [11]. The country has also implemented major renewable projects, including the 1650 MW Benban Solar Park, alongside additional solar and wind investments intended to improve energy security and reduce environmental pressure [12]. Nevertheless, the structure of electricity generation remains overwhelmingly fossil based. In 2023, fossil fuels still accounted for 87.4% of total electricity generation, while renewable sources contributed only 12.8% [11]. This contrast reveals a central policy tension in Egypt’s energy transition. On the one hand, renewable energy is increasingly recognized as essential for sustainable development. On the other hand, non-renewable energy continues to dominate the energy mix and satisfy the bulk of the rising demand. Thus, understanding the factors that drive both renewable and non-renewable energy consumption has become an important empirical and policy concern.
Although previous studies [13,14,15,16,17] examined energy consumption, economic growth, financial development, globalization, and environmental quality, some limitations persist in the literature. Many studies examined energy consumption in aggregate form without separating renewable from non-renewable energy use, despite their potentially different determinants. Egypt has also received limited attention as a distinct case, even though it is a major African energy consumer undergoing energy transition. Moreover, ecological footprint, financial development, economic growth, and globalization are rarely analyzed together in explaining the composition of energy demand. Furthermore, globalization is often treated as a single aggregate process, even though trade globalization and financial globalization may influence energy consumption differently through technology transfer, capital flows, production expansion, and import dependence. As a result, it remains unclear whether these factors support renewable energy substitution or reinforce fossil-based energy dependence.
Against this background, the present study addresses the following questions: How do ecological footprint, economic growth, financial development, and economic globalization influence renewable energy consumption in Egypt? Do these factors exert similar or different effects on nonrenewable energy consumption? Does decomposing economic globalization into trade globalization and financial globalization provide additional insight into the channels through which external integration affects the energy mix? By formulating the inquiry in this way, the study moves beyond a general discussion of energy transition and directly examines the determinants of energy composition in Egypt. Hence, the objective of this study is to examine how ecological footprint, economic growth, financial development, and economic globalization influence renewable and non-renewable energy consumption in Egypt.
This study contributes to the literature in several ways. First, it distinguishes between renewable and non-renewable energy consumption rather than treating total energy use as a homogeneous aggregate. This allows a clearer assessment of whether the same macroeconomic and institutional forces promote clean energy expansion or instead reinforce fossil-fuel dependence. Second, it incorporates the ecological footprint alongside growth, financial development, and globalization, thereby capturing the broader environmental and structural conditions within which energy demand evolves. Third, it decomposes economic globalization into trade and financial dimensions in order to identify whether external integration affects energy consumption through different transmission mechanisms. These contributions help sharpen the empirical basis for understanding Egypt’s transition challenge and provide more policy relevant evidence on the drivers of its energy mix.
Methodologically, the study employs the Autoregressive Distributed Lag (ARDL) approach. This method is appropriate because it permits the estimation of both long-run and short-run relationships when variables are integrated at I(0) or I(1), making it particularly suitable for mixed orders of integration and relatively small samples. In contrast to techniques such as the Vector Error Correction Model, Fully Modified Ordinary Least Squares, and Dynamic Ordinary Least Squares, which are more restrictive in their integration requirements, ARDL offers greater flexibility and enables the simultaneous estimation of equilibrium relationships and adjustment dynamics within a unified framework. On this basis, the study provides empirical evidence that is useful for guiding the design of energy policies by clarifying the macroeconomic and institutional factors associated with renewable and non-renewable energy use. In particular, they inform policymakers about how financial development, income growth, and trade integration shape energy demand and the composition of the energy mix. Beyond policy relevance, the study adds to practice by offering insights that support a more targeted transition from fossil-based consumption toward renewables. It also contributes to the empirical literature by identifying the determinants of renewable and non-renewable energy demand.
The remainder of the paper is structured as follows. Section 2 reviews the empirical literature on the determinants of energy demand. Section 3 describes the data and outlines the econometric methods used. Section 4 reports the empirical findings, while Section 5 concludes with the main takeaways and the associated policy implications.

2. Literature Review

2.1. Globalization and Energy Consumption

Globalization operates through multiple channels that may either encourage renewable energy adoption or reinforce dependence on conventional energy sources. On the one hand, deeper global integration can promote renewable energy consumption by facilitating technology transfer, expanding access to foreign capital, improving market efficiency, and accelerating the diffusion of cleaner production methods [18]. On the other hand, globalization can also intensify industrial expansion, trade-related production, and energy demand growth [19], which may continue to be satisfied largely through fossil fuels where structural transformation is weak. This possibility helps explain why the existing literature reports conflicting results across countries and regions. However, existing studies show that these channels do not operate in the same way across countries. For instance, evidence from the Organization for Economic Co-operation and Development (OECD) countries presents mixed conclusions. In the OECD nation, Gozgor et al. [20], using Panel Corrected Standard Errors (PCSEs) and Fully Modified Ordinary Least Squares (FMOLS), reported that economic globalization (EGLO) increases renewable energy consumption (REC), suggesting that integration into global markets can support cleaner energy transition through innovation spillovers and investment flows. However, Padhan et al. [18], applied the panel quantile regression to the same group of countries and found that EGLO reduces REC. This contrast suggests that the impact of globalization is not uniform across the distribution of countries and that average effects may conceal substantial heterogeneity. In some economies, the technological and investment benefits of globalization appear to support renewable deployment, whereas in others the expansionary effect of globalization may strengthen existing fossil-based production structures.
A similar pattern emerges in the case of trade globalization. Trade openness may improve access to renewable energy technologies and diversify energy supply, but it may also stimulate energy-intensive manufacturing and transport activities that raise reliance on non-renewable sources. For Nigeria, Somoye et al. [21] showed that trade openness increases REC, implying that international trade can create pathways for cleaner energy adoption. In contrast, Tiwari et al. [22] reported that trade openness reduces REC in Asian economies, indicating that the scale effect of trade expansion may dominate the technology effect where clean energy systems remain underdeveloped. These divergent findings imply that the energy effect of trade globalization depends on country-specific conditions such as productive structure, technological absorptive capacity, regulatory commitment, and the maturity of the renewable energy sector.
Meanwhile, the role of financial globalization (FGLO) is equally complex. In principle, greater financial integration can mobilize external resources for renewable infrastructure, lower financing constraints, and support the transfer of green technologies. This expectation is supported by Murshed et al. [23] for Bangladesh, Samour et al. [24] for the United Arab Emirates, and Tiwari et al. [22] for Asian economies, which reported that foreign direct investment promotes REC. These findings suggest that cross-border capital flows can contribute positively to energy transition when investment is channeled toward cleaner technologies. However, the effect of financial globalization is not inherently green. Danish and Ulucak [13] showed for Pakistan that globalization increases energy consumption, indicating that integration may enlarge aggregate energy demand without necessarily improving the composition of the energy mix. Likewise, Alam et al. [25] found that FGLO increases non-renewable energy consumption (NREC) in India while reducing REC, implying that capital openness may favor established fossil-based sectors in the absence of targeted environmental and financial policies. This suggests that financial globalization can either support renewable transition or deepen fossil dependence depending on the institutional setting within which it operates.
Further complexity is introduced by evidence of nonlinear and asymmetric effects. Using a nonlinear ARDL framework for G7 countries, Urom et al. [26] showed that globalization shocks exert asymmetric effects on REC, with both the direction and intensity of the response differing across countries. Similarly, Huang et al. [14] used the panel data for 98 countries, identifying an inverted U-shaped relationship between globalization and energy consumption, implying that globalization may initially raise energy demand through industrialization and scale expansion, but at later stages may encourage efficiency improvement and cleaner energy restructuring. These findings indicate that the globalization and energy nexus cannot be understood through a single linear expectation. Its effect is conditioned by the stage of development, the composition of production, institutional quality, environmental regulation, and the extent to which global integration is aligned with domestic transition objectives. In contrast, Yi et al. [27] found that EGLO increases renewable energy consumption among top renewable energy consumer countries, indicating that economies already advanced in renewable deployment are better positioned to convert globalization into clean energy gains.

2.2. Economic Growth and Energy Consumption

Economic growth is a central determinant of energy consumption because it affects not only the volume of energy demand but also the structure through which that demand is met. From a theoretical standpoint, economic growth can affect energy consumption through competing channels. One important mechanism is the scale effect, whereby rising output, industrial activity, urban expansion, infrastructure development, and household consumption increase total energy use [28,29]. In economies where conventional energy remains cheaper, more accessible, and more deeply embedded in production systems, this expansion is likely to intensify dependence on non-renewable energy [30,31]. Another mechanism operates through structural transformation and technological upgrading. As income levels rise, economies may develop stronger institutions, greater fiscal capacity, improved infrastructure, and higher investment in cleaner technologies, thereby supporting renewable energy deployment [32,33]. Therefore, economic growth may either reinforce fossil-fuel dependence or promote cleaner energy transition, depending on the country’s level of development, energy policy orientation, technological readiness, and capacity for structural change [34,35,36]. This implies that growth should not be expected to exert a uniform effect across the different forms of energy consumption.
The empirical literature reflects this theoretical ambiguity. A number of studies show that economic growth promotes renewable energy consumption, particularly in settings where development is accompanied by diversification strategies and environmental policy commitment. For example, Ref. [23] finds that GDP positively affects renewable energy consumption in South Asian countries, while Ref. [37] reported similar evidence for GCC economies. Comparable results are also documented for 27 economies [38], for India [39], for OECD countries [40], and for BRICS economies [41]. These findings suggest that as income rises, countries may acquire greater capacity to finance renewable infrastructure, adopt cleaner technologies, and align energy policy with environmental objectives. By contrast, another body of evidence shows that growth primarily increases energy consumption, with demand continuing to be met largely by conventional sources. This pattern is reported by Ref. [13] for Pakistan, Ref. [16] for Next-11 countries, Ref. [19] for Saudi Arabia, Ref. [42] for China, and Ref. [43] across 58 countries. In such cases, the scale effect of growth appears to dominate, indicating that economic expansion deepens fossil-fuel dependence when renewable capacity, regulatory support, and structural transformation remain limited. Using a Cross-Sectionally Augmented Autoregressive Distributed Lag (CS-ARDL) approach for top REC countries, Ref. [27] finds that GDP increases REC, highlighting the importance of accounting for cross-sectional dependence and global shocks in multi-country analyses. This result supports the argument that the GDP–REC nexus is conditional on structural readiness, including technological capability, institutional quality, and long-term energy policy orientation.

2.3. Financial Development and Energy Consumption

Financial development is an important determinant of energy consumption given that it influences how capital is mobilized, allocated, and transformed into productive and household activities [44,45]. Its effect on energy demand, however, is theoretically ambiguous and can operate through two competing channels. On the one hand, financial development may stimulate energy consumption through an investment expansion effect, as improved access to credit, broader financial inclusion, and more developed capital markets support industrial expansion, infrastructure development, household consumption, and urbanization [46,47]. In economies where conventional energy remains dominant, this process is likely to increase non-renewable energy consumption because financial resources often flow toward established fossil-fuel industries and energy-intensive sectors [48]. On the other hand, financial development may also operate through a modernization effect by easing access to long-term capital, reducing financing constraints, supporting technological upgrading, and facilitating investment in renewable energy infrastructure [49,50]. From this perspective, financial development (FD) can contribute to energy transition by promoting cleaner technologies and strengthening the capacity of the economy to shift away from fossil-based energy systems [51,52]. Therefore, its effect depends on whether the financial system primarily supports conventional expansion or encourages green structural transformation within the economy.
This theoretical distinction helps explain why the empirical literature reports mixed findings. A large body of evidence shows that FD increases aggregate energy consumption. Using panel ARDL for 98 countries, Huang et al. [14] found that FD increases energy consumption, while Chiu and Lee [17] report similar evidence for 79 countries. This pattern is consistent with the view that deeper financial systems expand credit availability and stimulate production and consumption activities that require more energy. Country-specific evidence points in the same direction. For Pakistan, Danish and Ulucak [13] showed that FD increases energy consumption, suggesting that in fossil-dominated systems, finance amplifies scale effects rather than encouraging energy substitution. Similar results are reported by Ref. [14] for the Next-11 countries, Ref. [53] for Tunisia, and Ref. [19] for Saudi Arabia. Taken together, these studies indicate that in many developing and resource-dependent economies, financial development tends to reinforce energy demand by funding consumption growth, industrial activity, and conventional infrastructure.
A more nuanced understanding emerges when REC and NREC are considered separately. In nations with stronger renewable capacity and more mature financial markets, financial development can support renewable energy consumption by mobilizing large-scale capital, spreading risk, and improving access to financing for clean-energy projects. This is evident in Ref. [27], who found that FD increases REC among top renewable energy consumer countries. Such findings suggest that where supportive institutions, green investment channels, and renewable infrastructure are already in place, financial development can strengthen the transition toward cleaner energy systems. By contrast, Ref. [25] showed that FD increases NREC while exerting no significant effect on REC in India. This implies that FD does not automatically translate into green finance. Where fossil fuels remain cheaper, more reliable, and more deeply embedded in the production structure, financial resources are more likely to be directed toward conventional energy use and carbon-intensive growth. Nonlinear evidence further supports this argument. For example, Ref. [54] suggest that the effect of FD on energy consumption varies across regimes in 21 transitional countries, while Ref. [55] found no significant effect in emerging economies. These results indicate that the finance–energy relationship is conditional on structural characteristics such as institutional quality, energy market design, financial sophistication, and the readiness of the economy for renewable transition.
The connection between financial development and energy transition therefore lies in the direction of capital allocation. Financial theory suggests that more developed financial systems reduce information asymmetry, improve intermediation efficiency, and facilitate long-term investment [56,57]. Energy transition theory, however, implies that these financial advantages will support renewables only when the institutional and policy environment encourages capital to move into cleaner energy technologies rather than conventional energy systems [45,49]. In the absence of such conditions, FD may simply accelerate aggregate energy demand and reinforce NREC dependence [46]. For a country such as Egypt, where renewable expansion is progressing within a historically fossil-dominated energy structure, the effect of FD is unlikely to be neutral. It may support renewable deployment by easing investment constraints, but it may also strengthen NREC if financial resources continue to favor conventional sectors. On this basis, the present study expects financial development to exert a significant influence on energy consumption, although the direction of its effect is expected to differ between REC and NREC depending on how financial resources are channeled within the economy. For a country such as Egypt, where renewable expansion is occurring within a historically fossil-dominated energy structure, the impact of FD is therefore unlikely to be neutral. It may support renewable deployment by easing investment constraints, but it may also strengthen non-renewable energy consumption if financial resources continue to favor conventional sectors. On this basis, the present study expects FD to exert a significant influence on energy consumption, although the direction of its effect may differ between REC and NREC use, depending on how financial resources are allocated within the economy.

2.4. Environmental Degradation and Energy Consumption

Environmental pressure is closely linked to energy consumption because the production, distribution, and use of energy are major drivers of ecological degradation. However, the relationship between environmental indicators and energy use is complex and potentially endogenous, since energy consumption contributes to environmental pressure, while environmental conditions can simultaneously influence energy policy, technology adoption, and consumption patterns. From a theoretical perspective, environmental pressure can influence energy consumption through several channels. One mechanism operates through the growth–energy–environment nexus, where expanding economic activity increases energy demand and environmental degradation simultaneously [58]. In this framework, environmental indicators may rise alongside energy consumption as part of the broader scale effect of economic growth. This pattern is supported by Ref. [43], who use a Generalized Method of Moments (GMM) framework for 58 countries and show that CO2 emissions increase energy consumption, suggesting that environmental degradation often accompanies rising energy demand during periods of economic expansion. At the same time, environmental pressure may also trigger corrective responses through regulatory intervention, technological innovation, or behavioral adjustments that reduce reliance on environmentally damaging energy sources. These responses may include stricter environmental policies, efficiency improvements, or incentives for renewable energy deployment, all of which can alter the composition of energy consumption over time.
Empirical evidence reflects these competing mechanisms. Country-level studies sometimes show that environmental pressure constrains energy use or encourages substitution away from fossil fuels. For example, Ref. [59] for Australia and Ref. [60] for Vietnam reported CO2 emissions reduce renewable energy consumption, suggesting that environmental pressure may coincide with structural adjustments that dampen energy demand or reflect transitional dynamics in the energy system. More nuanced insights emerge when the energy mix is examined rather than the total energy consumption. For OECD countries, Ref. [20] showed using PCSEs and FMOLS that CO2 emissions increase renewable energy consumption, indicating that environmental pressure can stimulate clean-energy investment and policy support for energy transition. However, such pressure does not necessarily translate into renewable expansion in all contexts. Evidence from India by Ref. [25] showed that environmental pressure constrains non-renewable energy consumption but has no significant effect on renewable energy use, implying that environmental stress alone may not be sufficient to accelerate renewable deployment where institutional capacity or investment conditions remain limited.
The ecological footprint (ECF) provides a broader measure of environmental pressure than traditional indicators such as CO2 emissions because it captures multiple dimensions of human demand on ecological systems, including carbon absorption capacity, land use, and resource consumption [61]. Unlike carbon emissions, which measure only atmospheric pollution, the ecological footprint reflects the aggregate ecological load generated by economic activity and energy use [62]. For this reason, it has increasingly been used in energy–environment studies to capture the broader environmental consequences of economic and energy systems. Studies using ECF provide additional insight because the indicator captures broader environmental stress rather than a single pollutant. Evidence generally suggests that REC and NREC have contrasting effects on ecological sustainability. For instance, Ref. [63] found that NREC increases ECF in India, while REC reduces it. Similar conclusions are reported by [64] for Turkey using a Quantile ARDL approach, reinforcing the view that fossil energy intensifies ecological pressure whereas REC contributes to environmental improvement. Nevertheless, exceptions exist. For the United Kingdom, Ref. [65] reported a negative relationship between NREC and ECF using a Fourier-based framework, a result that may reflect structural breaks and regime shifts in advanced economies where technological progress, regulatory policies, and energy efficiency improvements weaken the traditional fossil–environment linkage.
Despite a growing body of research on energy demand and environmental sustainability, several gaps remain in the literature. First, many existing studies do not estimate separate models for renewable and non-renewable energy consumption, thereby overlooking important differences in their drivers and dynamics. Second, the role of environmental pressure measured beyond carbon emissions, such as ecological footprint, remains underexplored, particularly in country-specific contexts. Third, the roles of financial development and globalization are frequently examined in aggregate terms, obscuring their potentially distinct short- and long-run effects on different energy types. Finally, empirical evidence for emerging economies in North Africa, especially Egypt, is relatively scarce compared to Asia and OECD countries.

3. Data and Methods

3.1. Data

This study investigates the impacts of the ecological footprint, economic growth, and financial development on renewable and non-renewable energy consumption within the context of economic globalization in Egypt. The period of this study covers annual data between 1970 and 2024. Furthermore, this study considers two dimensions of economic globalization, which are financial globalization and trade globalization. Moreover, the core dependent variables of this study are REC and NREC, reflecting the evolution of Egypt’s energy transition. Data for both energy categories are sourced from Our world in data database (https://ourworldindata.org/grapher/energy-consumption-by-source-and-country?overlay=download-data accessed on 23 January 2026). The ecological footprint (ECF) is employed as a comprehensive measure of environmental pressure, capturing the extent of resource use and ecological demand. Data on the ecological footprint are obtained from the Global Footprint Network database (https://data.footprintnetwork.org/ accessed on 23 January 2026). To capture how the aggregate economic activities affect Egypt’s energy transition, this study used economic growth. Economic growth is proxied by gross domestic product per capita (constant 2015 USD), which is obtained from the World Bank database (https://data.worldbank.org/country/egypt-arab-rep accessed on 23 January 2026). Financial development is proxied by domestic credit to the private sector as a percentage of GDP, obtained from the World Bank database. This indicator reflects the ability of the financial system to mobilize and allocate credit to productive sectors, which may influence energy demand through investment expansion and capital allocation. However, it primarily captures banking-sector development and may not fully reflect other dimensions of financial markets such as stock market activity or financial inclusion. To capture Egypt’s integration into the global economy and its potential influence on energy transition, the study employs economic globalization, trade globalization, and financial globalization obtained from the KOF Swiss Economic Institute database (https://kof.ethz.ch/en/forecasts-and-indicators/indicators/kof-globalisation-index.html#par_textimage_1585395273 accessed on 23 January 2026). While these indices provide a comprehensive measure of global economic integration, their composite nature implies that the estimated effects represent the combined influence of multiple globalization channels rather than a single transmission mechanism. All variables are transformed into natural logarithms to stabilize variance and facilitate elasticity-based interpretation.

3.2. Theoretical Framework and Model Specification

The income hypothesis posits that higher income levels expand fiscal and investment capacity, thereby facilitating greater energy usage. This study used GDP as a core explanatory variable, which is consistent with prior studies [18,59]. Furthermore, GDP captures the scale of economic activity, which influences the level and composition of energy demand.
Consistent with previous studies [66,67], this study included financial development, which reflects the depth and efficiency of the financial system in mobilizing resources for energy investment. A more developed financial sector can lower financing costs, improve risk diversification, and enhance access to long-term capital, which are critical for energy projects that are typically capital-intensive [45]. By easing financial constraints, financial development is expected to influence the structure of energy consumption.
Given the environmental pressure arising from resource use and energy-intensive activities, this study included the ecological footprint. ECF is a comprehensive indicator of environmental degradation. Moreover, higher ECF reflects increased environmental stress, which can trigger policy responses, regulatory tightening, and shifts in investment priorities toward cleaner energy sources [60]. Thus, ECF covers the demand-side of energy transition, capturing the extent to which environmental constraints influence the substitution between renewable and non-renewable energy.
Finally, consistent with prior studies such as [20,68], economic globalization (EGLO) is introduced to capture the degree of integration with international markets through trade and cross-border financial flows. Greater globalization can influence energy consumption by facilitating technology transfer, easing access to external finance, and exposing domestic producers to international environmental standards [47]. Through these channels, globalization may support the diffusion of energy technologies [20], which also expand energy demand.
Thus, to examine how environmental pressure and macroeconomic forces shape Egypt’s energy usage, the baseline functional relationships are specified as follows:
E N E t = f E C F t , G D P t , F D t , E G L O t
Here, ENE denotes energy usage; ECF denotes ecological footprint; GDP, FD, and EGLO denote economic growth, financial development and economic globalization, while subscript t denotes period of study.
Equation (1) is further divided into two, in which ENE is further categorized into renewable energy (REC) and non- renewable energy (NREC), which is presented as follows:
R E C t = f E C F t , G D P t , F D t , E G L O t
N R E C t = f E C F t , G D P t , F D t , E G L O t
To capture the multi-dimensional nature of economic globalization, we decompose EGLO into trade globalization and financial globalization. Thus, the REC and NREC functions are specified in three complementary forms: a baseline model incorporating the aggregate EGLO, and two alternative specifications in which EGLO is decomposed into its financial and trade globalization components.
Thus, the REC model:
Model 1:
R E C t = f E C F t , G D P t , F D t , E G L O t
Model 2:
R E C t = f E C F t , G D P t , F D t , F G L O t
Model 3:
R E C t = f E G F t , G D P t , F D t , T G L O t
Here: ECF denotes ecological footprint; GDP, FD, and EGLO denote economic growth, financial development and economic globalization; TGLO denotes trade globalization; FGLO denotes financial globalization, while subscript t denotes period of study.
Thus, the NREC model:
Model 1:
N R E C t = f E C F t , G D P t , F D t , E G L O t
Model 2:
N R E C t = f E C F t , G D P t , F D t , F G L O t
Model 3:
N R E C t = f E C F t , G D P t , F D t , T G L O t
Here: ECF denotes ecological footprint; GDP, FD, and EGLO denote economic growth, financial development and economic globalization; TGLO denotes trade globalization; FGLO denotes financial globalization, while subscript t denotes period of study.

3.3. Econometric Strategy

To examine both the short-run and long-run relationships among the variables, this study employs the Autoregressive Distributed Lag (ARDL) modelling framework. The choice of ARDL was motivated by three main considerations. First, the technique is appropriate when the variables are integrated of mixed order; that is, I(0) and I(1), provided that none is integrated of order two. Second, ARDL performs efficiently in relatively small samples. Third, it allows the simultaneous estimation of long-run equilibrium relationships and short-run dynamic adjustments within a single framework, making it particularly suitable for analyzing the determinants of renewable and non-renewable energy consumption in Egypt.
This study’s empirical analysis begins with descriptive statistics to summarize the main distributional characteristics of the variables. Thereafter, the stationarity properties of the series are examined using the Augmented Dickey Fuller (ADF) and Phillips Perron (PP) unit root tests proposed by Dickey and Fuller [69] and Phillips and Perron [70], respectively. These tests are employed to determine the order of integration of each variable and to ensure that none of the series is integrated beyond first difference, since the ARDL bounds testing approach is not valid in the presence of I(2) variables.
Thus, Equation (1) is converted into estimable linear long-run model, which is presented as follows:
E C t = α 0 + α 1 E C F t + α 2 G D P t + α 3 F D t + α 4 G L O t + μ t
where α 0 is the intercept, α 1 α 4 are the long-run slope coefficients, and μ t is the error term.
To test for cointegration, the ARDL bounds testing framework of [71] is employed in conjunction with the critical values provided by [72], which are more suitable for small-sample time-series analysis. The unrestricted error-correction version of the ARDL model is specified as follows:
Δ E C t = β 0 + i = 1 p β 1 Δ E C t i + i = 0 q β 2 Δ E C F t i + i = 0 r β 3 Δ G D P t i + i = 0 s β 4 Δ F D t i + i = 0 v β 5 Δ G L O t i + λ 1 E C t 1 + λ 2 E C F t 1 + λ 3 G D P t 1 + λ 4 F D t 1 + λ 5 G L O t 1 + ε t
where Δ denotes the first-difference operator, p , q , r , s , and v represent the optimal lag lengths, and ε t is the white-noise error term. The null hypothesis of no long-run relationship is tested as follows:
H 0 : λ 1 = λ 2 = λ 3 = λ 4 = λ 5 = 0
against the alternative hypothesis
H 1 : λ 1 0 , λ 2 0 , λ 3 0 , λ 4 0 , λ 5 0
If the computed F-statistic exceeds the upper critical bound, the null hypothesis of no cointegration is rejected, indicating the existence of a long-run equilibrium relationship among the variables.
Once cointegration is confirmed, the short-run dynamics are estimated through the error-correction representation of the ARDL model:
Δ E C t = γ 0 + i = 1 p γ 1 Δ E C t i + i = 0 q γ 2 Δ E C F t i + i = 0 r γ 3 Δ G D P t i + i = 0 s γ 4 Δ F D t i + i = 0 v γ 5 Δ G L O t i + ϕ E C M t 1 + ν t
where E C M t 1 is the lagged error-correction term derived from the estimated long-run relationship, and ϕ measures the speed at which short-run deviations from long-run equilibrium are corrected. The coefficient of the error-correction term is expected to be negative and statistically significant, indicating convergence toward equilibrium after short-run shocks. The ARDL model is then estimated with an optimal lag structure selected using an information criterion such as the Akaike Information Criterion, which is considered appropriate in time-series models of this nature because it balances model fit and parsimony. Selecting an appropriate lag length is essential in ARDL modelling, as insufficient lags may lead to model misspecification, while excessive lags may reduce estimation efficiency. The chosen lag structure is applied consistently in both the bounds testing procedure and the estimation of the long-run and short-run models.
Once cointegration is established, a series of diagnostic tests are conducted to ensure the validity and reliability of the results. These include the Breusch–Godfrey–Lagrange Multiplier test for serial correlation, the Breusch–Pagan–Godfrey test for heteroskedasticity, and the Jarque–Bera test for normality of the residuals. These diagnostic procedures help confirm that the residuals of the model satisfy the classical regression assumptions, thereby ensuring that the estimated coefficients are statistically reliable. Furthermore, the parameter stability is also examined to ensure that the estimated relationships remain consistent over time. For this purpose, the cumulative sum (CUSUM) and cumulative sum of squares (CUSUMSQ) tests proposed by [73] are employed. These tests evaluate whether the estimated coefficients remain stable throughout the sample period. If the CUSUM and CUSUMSQ statistics remain within the critical bounds at the 5% significance level, the null hypothesis of parameter stability cannot be rejected, indicating that the estimated ARDL model is structurally stable over the sample period.

4. Results and Discussions

Table 1 reports descriptive statistics for the variables used. REC exhibits a moderate mean value with relatively low dispersion, indicating gradual and more stable growth over the sample period. NREC records a higher average level and greater volatility, reflecting Egypt’s continued reliance on fossil-based energy and its sensitivity to economic activity. GDP shows a steady distribution with limited variability, suggesting relatively stable income dynamics over time. FD also displays moderate dispersion, implying a gradual evolution of the financial system without abrupt fluctuations. ECF presents noticeable variation and negative skewness, highlighting changing environmental pressure associated with energy use and production patterns. Meanwhile, FGLO, EGLO, and TGLO exhibit relatively low volatility, with TGLO exhibiting as more symmetric, which reflects a steady and incremental integration of Egypt into the global economy.
Table 2 reports the results of the ADF and PP unit root tests for each variable. At the level, the results indicate that all variables are non-stationary under both the two-unit root tests, as the null hypothesis of a unit root cannot be rejected at conventional significance levels. However, after first differencing, each variable becomes stationary, with the null hypothesis of a unit root rejected at least at the 5% level in both testing frameworks. This confirms that all variables are integrated at order one, I(1). The consistency of results across the ADF and PP tests enhances confidence in the stationarity findings. Thus, the absence of I(2) variables satisfies the key prerequisite for applying the ARDL bounds testing approach.
The ARDL bounds cointegration results for each model are presented in Table 3 and Table 4. Table 3 reports the ARDL bounds cointegration results for the REC model. The reported F-statistics values for Model 1, 2, and 3 are 6.1884, 7.3079, and 7.2890, respectively. Moreover, the T-statistics values for Model 1, 2, and 3 are −5.9000, −6.4114, and −6.4031, respectively. Given the reported computed statistics are greater than the upper-bound critical values at the 1% significance level, we reject the null hypothesis of no cointegration. This indicates a long-run cointegrating relationship between REC and its explanatory variables in Egypt.
Table 4 reports the ARDL cointegration results for the NREC model. The bounds test results show that the T-statistics for Models 1–3 are −7.1958, −8.4704, and −6.6823, respectively, while the corresponding F-statistics are 9.4745, 13.2460, and 8.2302. Since these computed values exceed the upper-bound critical values at the 1% significance level, the null hypothesis of no cointegration is rejected. Therefore, NREC and its explanatory variables exhibit a cointegrating interrelationship in Egypt. Consequently, estimating long-run and short-run dynamics within an ARDL error-correction framework is econometrically justified.
Table 5 presents the ARDL long-run and short-run estimates for renewable energy consumption in Egypt under three alternative globalization specifications. The error-correction term, ECT(−1), is negative and statistically significant across all three models, with coefficients of −0.2682 for Model 1, −0.3516 for Model 2, and −0.3071 for Model 3. This provides evidence of a stable long-run relationship among the variables within the estimated framework. The size of these coefficients suggests that deviations from the long-run equilibrium are corrected gradually, with approximately 26.82%, 35.16%, and 30.71% of disequilibrium adjusted in each period in Models 1, 2, and 3, respectively. This indicates that renewable energy consumption responds to short-run disturbances but tends to return to its long-run path over time.
GDP is positively and significantly associated with REC in both the long run and short run across the three models. In the long run, a 1% increase in GDP is associated with increases of 1.4988% (Model 1), 0.9447% (Model 2), and 1.2106% (Model 3). This pattern suggests that economic expansion may coincide with higher renewable energy consumption in Egypt, possibly because rising income improves investment capacity, supports infrastructure development, and creates wider fiscal and institutional space for energy diversification. In the Egyptian context, this positive association may also reflect the fact that periods of economic growth can strengthen the ability of the state and private sector to support renewable energy projects. Nevertheless, the result should be interpreted with caution, since the estimated coefficient reflects association within the ARDL framework rather than unambiguous causation. The finding is broadly in line with earlier evidence reported for for Sub-Sahara Africa [74] for China [75], for EU countries [76], although differences across countries may still depend on variations in policy support, market maturity, and the stage of energy transition. These studies collectively suggest that higher income levels play a critical role in promoting renewable energy adoption across diverse economic contexts. Thus, the results provide support for the income hypothesis.
FD shows a negative and statistically significant long-run association with REC in Models 1 and 2, while remaining insignificant in Model 3. More specifically, a 1% increase in financial development is associated with reductions of 0.1469% and 0.1207% in REC in Models 1 and 2, respectively. This result suggests that FD in Egypt may not have been sufficiently aligned with renewable energy financing over the period considered. One possible explanation is that domestic credit expansion may have been directed more toward sectors with established returns, stronger collateral structures, or greater reliance on conventional energy. In such a setting, financial development may expand overall economic activity without necessarily supporting renewable investment. This interpretation is particularly relevant in an economy where green finance instruments, long-term risk-sharing mechanisms, and supportive regulatory arrangements may still be evolving. In the short run, however, the coefficient on financial development is positive and significant in Models 1 and 2 but negative and significant in Model 3, indicating that the short-run relationship is less stable across specifications. This variation suggests that the effect of financial development may depend on the way globalization is specified in the model and may reflect temporary credit-cycle effects or shifts in sectoral allocation. Accordingly, the results imply that financial development alone may be insufficient to promote renewable energy expansion unless the composition of finance is deliberately directed toward clean energy investment. This finding differs from evidence reported for Ref. [50] for EU nations, Ref. [39] in India, and Ref. [67] in Nigeria, which may reflect differences in financial structure, institutional quality, and the maturity of renewable financing channels.
ECF is consistently negative and statistically significant in the long run across all three models, with estimated coefficients of −0.2035, −0.4092, and −0.2512, respectively. This indicates that higher ecological pressure is associated with lower renewable energy consumption in Egypt over the long run. A possible interpretation is that rising ecological degradation in Egypt may still be occurring within a predominantly fossil-fuel-based energy system, where growing environmental stress accompanies higher industrial activity and conventional energy use rather than an accelerated transition toward renewables. In such circumstances, ecological deterioration may reflect the persistence of existing production and energy structures rather than an immediate policy or market shift in favor of cleaner energy. It is also possible that periods of heightened environmental pressure coincide with fiscal and policy priorities focused on short-term stabilization rather than long-term renewable investment. Moreover, infrastructure constraints, financing limitations, and implementation bottlenecks may prevent environmental stress from translating into stronger renewable deployment. In the short run, ecological footprint is statistically insignificant, suggesting that its relationship with renewable energy consumption is more visible over longer horizons than in immediate adjustment periods. The result is consistent with evidence reported for newly industrialized countries [77], ten selected nations [78]; G-11 nations [79]; energy transition nations [80], and India [15], although opposing evidence from China [81] suggested that this relationship remains sensitive to country-specific institutional and structural conditions.
With respect to EGLO, the results indicate that the aggregate measure of EGLO in Model 1 is statistically insignificant in the long run, suggesting that, when treated as a composite index, globalization does not display a clear direct association with REC in Egypt. However, a more nuanced picture emerges once globalization is decomposed into its trade and financial dimensions. In Model 2, FGLO is negative and statistically significant in the long run, with a 1% increase associated with a 0.1867% decline in REC. Similarly, in Model 3, TGLO is negative and statistically significant, with a 1% increase associated with a 0.2070% reduction in REC. These findings suggest that greater external integration may not automatically support renewable energy expansion in Egypt. Instead, deeper trade and financial integration may coincide with higher economic activity and energy demand that continue to be met largely through existing non-renewable infrastructure. Financial integration may also direct capital toward sectors with lower perceived risk and more established returns, while trade integration may increase energy-intensive production and import dependence in ways that do not immediately strengthen domestic renewable capacity. These results are broadly consistent with findings of Ref. [18] in OECD nations; Ref. [22] in Asian economies and Ref. [25] in India. At the same time, the insignificance of the EGLO alongside the significance of its decomposed components suggests that aggregation may conceal important transmission differences. This further implies that the relationship between EGLO and REC is not uniform and may depend on domestic absorptive capacity, regulatory quality, and the ability of the energy system to translate external integration into renewable investment.
The short-run results for FGLO and TGLO also indicate statistically significant effects, although these should be interpreted carefully within the dynamic structure of the model. Rather than implying immediate and uniform transmission, they suggest that globalization-related shocks may influence REC through transitional channels, including technology imports, investment responses, and changing production patterns. However, these short-run effects may not persist in the same form over the long run, especially where structural constraints limit the capacity of the economy to convert global integration into sustained renewable expansion.
Finally, the diagnostic and stability tests reported in Table 5 (normality, serial correlation, heteroskedasticity, RESET, and CUSUM/CUSUMSQ) indicate no major econometric violations and confirm parameter stability at conventional levels, supporting the reliability of the estimated relationships.
Table 6 presents the ARDL long-run and short-run estimates for NREC in Egypt under three alternative model specifications. The error-correction term, ECT(−1), is negative and statistically significant across all models, with coefficients of −0.5007, −0.3483, and −0.3282, respectively. This provides evidence of a stable long-run relationship among the variables within the estimated framework. The magnitude of the coefficients suggests that approximately 50.07% of short-run disequilibrium is corrected within one period in Model 1, compared with 34.83% in Model 2 and 32.82% in Model 3. These adjustment speeds indicate that non-renewable energy consumption tends to return to its long-run equilibrium path following temporary shocks, with the adjustment occurring more rapidly in Model 1.
GDP is positively and statistically significantly associated with NREC in the long run across all three models. Specifically, a 1% increase in GDP is associated with increases of 0.5486% in Model 1, 0.4300% in Model 2, and 0.4223% in Model 3. This pattern suggests that economic expansion in Egypt has continued to coincide with greater reliance on conventional energy sources. A plausible explanation is that increases in output, industrial activity, transport demand, and household consumption raise total energy demand, while the existing fossil-based energy structure remains better positioned to satisfy such demand in the short to medium term. In this sense, the results appear consistent with the scale effect, whereby economic growth expands energy use more rapidly than structural transition can redirect it toward cleaner sources. The positive short-run coefficient on GDP in Model 1 further indicates that changes in economic activity may also be reflected in immediate movements in non-renewable energy use. These findings are broadly in line with earlier evidence by Ref. [82] for Brazil, Ref. [83] for China, and Ref. [84] for Bangladesh.
FD also shows a positive and statistically significant long-run association with NREC across all models. A 1% increase in FD is associated with increases of 0.0470% in Model 1, 0.0453% in Model 2, and 0.0467% in Model 3. This suggests that FD in Egypt may have been more closely linked to the expansion of conventional energy use than to a transition toward cleaner energy sources. One possible explanation is that greater access to credit and liquidity may have supported energy-intensive activities, conventional infrastructure, and sectors already embedded in fossil-based production systems. Where renewable projects involve higher upfront costs, longer payback periods, and greater regulatory or market uncertainty, financial development may not automatically translate into renewable investment. Instead, it may reinforce existing energy structures if financial resources continue to flow toward sectors with lower perceived risk and more established returns. This interpretation is consistent with prior findings reported by Ref. [77] and Ref. [24] for India. Furthermore, the work by Ref. [74] also validated the evidence that FD exerts a positive effect on NREC in China. The result also suggests that financial development, in the absence of targeted green finance mechanisms, may strengthen fossil-based energy dependence rather than facilitate substitution toward renewables.
ECF exhibits a positive and statistically significant long-run coefficient in all three models, indicating that higher environmental pressure is associated with higher NREC in Egypt. More specifically, a 1% increase in ECF is associated with increases of 0.3608% in Model 1, 0.2789% in Model 2, and 0.3371% in Model 3. This pattern suggests that ecological pressure in Egypt remains closely tied to the continued use of fossil-based energy. Rather than signaling a transition toward cleaner alternatives, worsening environmental conditions appear to accompany a production and energy structure in which conventional fuels still play the dominant role. This may reflect the persistence of carbon-intensive sectors, infrastructure lock-in, and the relatively slower pace of renewable energy expansion compared with the growth of overall energy demand. In the short run, ecological footprint is positive and significant in Model 3, suggesting that environmental pressure may also be reflected in more immediate changes in non-renewable energy use under certain specifications. These findings are consistent with earlier evidence by Ref. [60] in Vietnam, Ref. [18] in OECD nations, Ref. [85] in Malaysia. At the same time, the result may also point to a deeper structural challenge in Egypt, where ecological degradation and NREC continue to evolve together over the long term.
With respect to globalization, the estimates do not show a statistically significant association with NREC. EGLO is positive but insignificant in Model 1, while FGLO in Model 2 and TGLO in Model 3 are likewise statistically insignificant. These findings suggest that, once domestic factors such as growth, financial development, and ecological pressure are taken into account, globalization does not appear to exert a distinct direct effect on non-renewable energy consumption in Egypt within the estimated models. One possible interpretation is that the influence of globalization may be transmitted indirectly through broader changes in economic activity, investment allocation, industrial structure, or technology adoption rather than through a direct channel affecting conventional energy demand. The insignificance of the globalization variables may also reflect the fact that external integration does not necessarily alter the energy mix unless it is accompanied by domestic absorptive capacity, supportive institutions, and clear transition policies. This result differs from prior evidence reported by Belt and Road nations [86] and in India [25], where EGLO was found to increase NREC. Such differences may reflect variations in trade structure, financial openness, institutional conditions, and the extent to which external integration is linked to fossil-intensive growth patterns.
Finally, the post-estimation diagnostic results suggest that the estimated models are econometrically well behaved. The Jarque–Bera normality test, LM serial correlation test, ARCH heteroskedasticity test, and Ramsey RESET test do not indicate major specification problems, while the CUSUM and CUSUMSQ tests support parameter stability at the 5% significance level. These outcomes strengthen confidence in the internal consistency of the estimated coefficients.
For the comparative analysis, the empirical results reveal notable differences in how the selected variables relate to REC and NREC in Egypt, highlighting the incomplete nature of the country’s energy transition. GDP is positively associated with both REC and NREC, suggesting that expansion in economic activity increases overall energy demand rather than generating a strong substitution toward cleaner sources. Although higher income may support renewable deployment through improved investment capacity and infrastructure development, the existing fossil-based energy structure appears to absorb much of the additional demand.
The contrast becomes more pronounced when FD and ECF are considered. FD is negatively associated with REC but positively associated with NREC. This pattern suggests that FD in Egypt may have historically supported conventional and energy-intensive sectors more strongly than renewable investment, possibly because these activities offer more predictable returns and established financing structures. A similar result appears in the relationship with ECF, which is negatively linked to REC but positively related to NREC. This indicates that environmental pressure continues to evolve alongside fossil-fuel dependence rather than inducing a substantial shift toward cleaner energy sources.
The globalization results are more nuanced. While the EGLO does not show a clear association with REC, its disaggregated components, particularly trade and financial globalization, display negative relationships in some specifications. At the same time, EGLO does not appear to exert a statistically significant influence on NREC. These outcomes suggest that external integration has not yet translated into a structural advantage for REC, and that domestic economic conditions and energy infrastructure remain more decisive in shaping Egypt’s energy mix. Overall, the findings indicate that renewable energy expansion is occurring within a broader macroeconomic and institutional framework that continues to sustain non-renewable energy use.

5. Conclusions and Policy Implications

Conclusions

Energy availability and consumption remain central to sustaining growth and accelerating national development. In pursuit of stronger and more resilient energy systems, policymakers increasingly rely on domestic and external macroeconomic and environmental drivers to strengthen production capacity, attract investment, and improve overall economic performance. Against this backdrop, the present study empirically investigated how economic growth, financial development, ecological footprint and economic globalization shape Egypt’s demand for renewable and non-renewable energy using annual data between 1970 and 2024. To achieve this objective, the study employed the Autoregressive Distributed Lag (ARDL) approach, which allows for robust estimation of both short- and long-run relationships. This study contributes to the literature by distinguishing between renewable and non-renewable energy consumption, by providing long-run country-specific evidence for Egypt, and by showing that growth, finance, ecological pressure, and globalization do not affect both energy forms in the same way. The results show that GDP is positively associated with both REC and NREC, while FD and ECF exert contrasting relationships across the two energy types, being negatively associated with REC but positively associated with NREC. The EGLO results are mixed, with the aggregate measure showing limited significance, while trade and financial globalization display adverse long-run associations with renewable energy consumption in some specifications
Building on these empirical results, the study outlines key practical and policy implications for Egypt. The findings indicate that GDP raises both REC and NREC, implying that Egypt’s expansion remains structurally energy-intensive, and that incremental demand is still partly absorbed by conventional supply. A central policy implication is that the energy transition cannot be treated as a stand-alone environmental agenda; it must be embedded in national growth planning. This requires ensuring that new electricity demand associated with industrialization, urban development, and services expansion is met predominantly through renewable capacity additions. Egypt should strengthen least-cost generation planning, scale predictable competitive procurement with bankable contracts, and prioritize transmission and grid flexibility investments that allow renewables to reliably meet incremental demand, thereby limiting fossil lock-in as the economy grows.
The results further show that FD reduces REC but increases NREC in the long run, suggesting that financial deepening has not been neutral and has not systematically supported renewable deployment. This points to a credit allocation challenge rather than a credit availability challenge. Policy should therefore shift from expanding finance in aggregate to directing finance toward green investment. Priority measures include establishing a clear national green taxonomy, expanding de-risking instruments for renewables (partial risk guarantees, credit enhancements, and blended-finance windows), and incentivizing banks and institutional investors to increase renewable project finance and long-tenor lending. Without such mechanisms, FD may continue to reinforce incumbent fossil-dependent sectors that offer faster returns, established collateral, and lower perceived policy risk.
The ecological footprint results also carry important implications. ECF increases NREC but reduces REC, indicating that rising environmental pressure has coincided with higher conventional energy use rather than triggering substitution toward renewables. This suggests that environmental stress alone does not automatically induce transition. It must be transmitted through credible policy signals and enforceable standards. Egypt should therefore strengthen the policy bridge between environmental objectives and energy outcomes through binding efficiency standards for energy-intensive sectors, more effective enforcement of environmental regulations, and complementary transition-support instruments such as streamlined permitting, transparent grid-access rules, and clearer long-term renewable targets. These measures help convert environmental pressure into concrete investment incentives and behavioral change.
The results of EGLO imply that domestic fundamentals dominate NREC dynamics, while disaggregated trade and financial globalization are associated with lower REC in the long run despite short-run positive responses. This pattern suggests that international integration can provide short-term benefits through technology inflows and equipment access, but these gains cannot be sustained without sufficient domestic absorptive capacity. Egypt can convert EGLO into durable renewable gains by reducing trade frictions for renewable and grid technologies, strengthening contract enforcement and regulatory predictability, and building local capabilities that support deployment (skills, maintenance capacity, and supply-chain readiness). The evidence implies that Egypt’s transition outcomes will depend on three coordinated reforms, which involve aligning growth with renewable-led capacity expansion, redirecting finance toward green investment, and strengthening institutional and infrastructure conditions that allow economic globalization to translate into sustained renewable penetration rather than reinforcing conventional energy dependence.
This study has some limitations that should be considered when interpreting the findings. First, the analysis relies on annual time-series data, which may mask short-term dynamics and seasonal adjustments that could be captured with higher-frequency data. Second, although the ARDL framework is robust for mixed integration orders, the results remain sensitive to variable measurement choices and the selected lag structure. Furthermore, this study has methodological limitations, especially in that the ARDL approach identifies long-run associations and short-run adjustments within the specified model, but does not permit unambiguous causal inference
Third, the model focuses on a limited set of drivers, so other relevant factors such as energy prices, policy incentives, technological progress, and institutional quality are not explicitly accounted for. Fourth, potential structural breaks from major reforms, crises, or energy-policy shifts may influence the estimated long-run relationships if not fully captured by break controls. Fifth, using aggregate national data may conceal regional heterogeneity in renewable deployment and fossil-fuel dependence across provinces. Finally, the findings should be interpreted as evidence of association within the specified model, as establishing strong causal mechanisms would require additional identification strategies and complementary methods.
In the light of these limitations, future research can build on this study in several meaningful ways. Studies using higher-frequency data may provide deeper insight into short-term adjustments and more immediate responses of renewable energy to changes in economic and policy conditions. Future work may also incorporate additional determinants such as energy prices, policy support mechanisms, technological innovation, and institutional quality in order to develop a more comprehensive explanation of renewable energy dynamics. In addition, regional or subnational analyses could reveal important geographical differences that are concealed by aggregate national data. Further research may also account more explicitly for structural breaks associated with major reforms, economic shocks, and shifts in energy policy, while the application of alternative empirical techniques and stronger identification strategies would help to provide more robust evidence on causal relationships within the renewable energy transition process.

Author Contributions

A.A.M.A.: Conceptualization, Methodology, Software, Validation, Formal analysis, writing—original draft preparation; W.K.: writing—original draft preparation, writing—review and editing, visualization, supervision, project administration. All authors have read and agreed to the published version of the manuscript.

Funding

This research received no external funding.

Institutional Review Board Statement

Not Applicable.

Informed Consent Statement

Not Applicable.

Data Availability Statement

Data is available upon request from corresponding author.

Conflicts of Interest

The authors declare no conflict of interest.

References

  1. El-Sayed, A.H.A.; Khalil, A.; Yehia, M. Modeling alternative scenarios for Egypt 2050 energy mix based on LEAP analysis. Energy 2023, 266, 126615. [Google Scholar] [CrossRef]
  2. U.S. Energy Information Administration. Egypt. Available online: https://www.eia.gov/international/overview/country/EGY (accessed on 4 April 2026).
  3. IEA. Overview and Key Findings—World Energy Investment 2024—Analysis. Available online: https://www.iea.org/reports/world-energy-investment-2024/overview-and-key-findings (accessed on 3 December 2024).
  4. World Bank. World Bank Open Data. Available online: https://data.worldbank.org (accessed on 30 January 2025).
  5. OPEC. Annual Statistical Bulletin. Available online: https://www.opec.org/annual-statistical-bulletin.html (accessed on 12 March 2026).
  6. IRENA. Socio-Economic Footprint of the Energy Transition: Egypt; IRENA: Abu Dhabi, United Arab Emirates, 2023. [Google Scholar]
  7. BloombergNEF. Climatescope 2025|Egypt. 2026. Available online: https://www.global-climatescope.org (accessed on 13 March 2026).
  8. Health Effects Institute. State of Global Air 2025. Available online: https://www.stateofglobalair.org (accessed on 13 March 2026).
  9. Larsen. Arab Republic of Egypt—Cost of Environmental Degradation: Air and Water Pollution. 2019. Available online: https://openknowledge.worldbank.org/entities/publication/0f982bee-6368-5895-a501-75f8dabfefcf (accessed on 2 February 2026).
  10. Hassaan, M.A.; Abdrabo, M.A.K.A.; Hussein, H.A.; Ghanem, A.A.A.; Abdel-Latif, H. Potential impacts of climate change on renewable energy in Egypt. Environ. Monit. Assess. 2024, 196, 268. [Google Scholar] [CrossRef] [PubMed]
  11. IEA. Egypt—Countries & Regions. Available online: https://www.iea.org/countries/egypt (accessed on 2 February 2026).
  12. World Economic Forum. Egypt is Building One of the World’s Largest Solar Parks. Available online: https://www.weforum.org/stories/2019/01/egypt-is-building-one-of-the-worlds-largest-solar-parks/ (accessed on 2 February 2026).
  13. Danish; Ulucak, R. A revisit to the relationship between financial development and energy consumption: Is globalization paramount? Energy 2021, 227, 120337. [Google Scholar] [CrossRef]
  14. Huang, Z.; Zhang, H.; Duan, H. How will globalization contribute to reduce energy consumption? Energy 2020, 213, 118825. [Google Scholar] [CrossRef]
  15. Adebayo, T.S.; Akadiri, S.S.; Altuntaş, M.; Awosusi, A.A. Environmental effects of structural change, hydro and coal energy consumption on ecological footprint in India: Insights from the novel dynamic ARDL simulation. Environ. Dev. Sustain. 2023, 25, 14309–14332. [Google Scholar] [CrossRef]
  16. Danish; Saud, S.; Baloch, M.A.; Lodhi, R.N. The nexus between energy consumption and financial development: Estimating the role of globalization in Next-11 countries. Environ. Sci. Pollut. Res. 2018, 25, 18651–18661. [Google Scholar] [CrossRef] [PubMed]
  17. Chiu, Y.-B.; Lee, C.-C. Effects of financial development on energy consumption: The role of country risks. Energy Econ. 2020, 90, 104833. [Google Scholar] [CrossRef]
  18. Padhan, H.; Padhang, P.C.; Tiwari, A.K.; Ahmed, R.; Hammoudeh, S. Renewable energy consumption and robust globalization(s) in OECD countries: Do oil, carbon emissions and economic activity matter? Energy Strategy Rev. 2020, 32, 100535. [Google Scholar] [CrossRef]
  19. Rafindadi, A.; Isah, A.B.; Usman, O. Economic development and energy consumption in Saudi Arabian economy: Do globalization, financial development and capital accumulation matter? Int. J. Energy Sect. Manag. 2023, 18, 1423–1443. [Google Scholar] [CrossRef]
  20. Gozgor, G.; Mahalik, M.K.; Demir, E.; Padhan, H. The impact of economic globalization on renewable energy in the OECD countries. Energy Policy 2020, 139, 111365. [Google Scholar] [CrossRef]
  21. Somoye, A.; Ozdeser, H.; Seraj, M. Modeling the determinants of renewable energy consumption in Nigeria: Evidence from Autoregressive Distributed Lagged in error correction approach. Renew. Energy 2022, 190, 606–616. [Google Scholar] [CrossRef]
  22. Tiwari, K.; Nasreen, S.; Anwar, M.A. Impact of equity market development on renewable energy consumption: Do the role of FDI, trade openness and economic growth matter in Asian economies? J. Clean. Prod. 2022, 334, 130244. [Google Scholar] [CrossRef]
  23. Murshed, M. Can regional trade integration facilitate renewable energy transition to ensure energy sustainability in South Asia? Energy Rep. 2021, 7, 808–821. [Google Scholar] [CrossRef]
  24. Samour, A.; Baskaya, M.M.; Tursoy, T. The Impact of Financial Development and FDI on Renewable Energy in the UAE: A Path towards Sustainable Development. Sustainability 2022, 14, 1208. [Google Scholar] [CrossRef]
  25. Alam, M.M.; Murshed, M.; Ozturk, I.; Khudoykulov, K. Macroeconomic determinants of non-renewable and renewable energy consumption in India: The roles of international trade, innovative technologies, financial globalization, carbon emissions, financial development, and urbanization. Energy 2024, 308, 132939. [Google Scholar] [CrossRef]
  26. Urom, C.; Abid, I.; Guesmi, K.; Ndubuisi, G. Renewable energy consumption, globalization, and economic growth shocks: Evidence from G7 countries. J. Int. Trade Econ. Dev. 2022, 31, 204–232. [Google Scholar] [CrossRef]
  27. Yi, S.; Raghutla, C.; Chittedi, K.R.; Fareed, Z. How economic policy uncertainty and financial development contribute to renewable energy consumption? The importance of economic globalization. Renew. Energy 2023, 202, 1357–1367. [Google Scholar] [CrossRef]
  28. Stern, I. The Rise and Fall of the Environmental Kuznets Curve. World Dev. 2004, 32, 1419–1439. [Google Scholar] [CrossRef]
  29. Awosusi, A.; Taiwo, T.S.; Uzun, B. Consolidating sustainable development in G7 economies: The role of green production process, energy transition, environmental policy stringency, and economic globalization. Int. J. Sustain. Dev. World Ecol. 2026, 33, 9–28. [Google Scholar] [CrossRef]
  30. Sadorsky, P. Renewable energy consumption and income in emerging economies. Energy Policy 2009, 37, 4021–4028. [Google Scholar] [CrossRef]
  31. Apergis, N.; Payne, J.E. Renewable energy consumption and economic growth: Evidence from a panel of OECD countries. Energy Policy 2010, 38, 656–660. [Google Scholar] [CrossRef]
  32. Grossman, G.M.; Krueger, A.B. Economic Growth and the Environment. Q. J. Econ. 1995, 110, 353–377. [Google Scholar] [CrossRef]
  33. Popp, D. Induced Innovation and Energy Prices. Am. Econ. Rev. 2002, 92, 160–180. [Google Scholar] [CrossRef]
  34. Stern, D.I. The role of energy in economic growth. Ann. N. Y. Acad. Sci. 2011, 1219, 26–51. [Google Scholar] [CrossRef]
  35. Dogan, E.; Seker, F. The influence of real output, renewable and non-renewable energy, trade and financial development on carbon emissions in the top renewable energy countries. Renew. Sustain. Energy Rev. 2016, 60, 1074–1085. [Google Scholar] [CrossRef]
  36. Awosusi, A.A.; Ozsahin, D.U. Assessing the role of renewable-based energy innovation, economic growth, and political risk in shaping Japan’s load capacity factor: A wavelet-based quantile analysis. Renew. Energy 2026, 262, 125400. [Google Scholar] [CrossRef]
  37. Fatima, T.; Mentel, G.; Doğan, B.; Hashim, Z.; Shahzad, U. Investigating the role of export product diversification for renewable, and non-renewable energy consumption in GCC (gulf cooperation council) countries: Does the Kuznets hypothesis exist? Environ. Dev. Sustain. 2022, 24, 8397–8417. [Google Scholar] [CrossRef]
  38. Przychodzen, W.; Przychodzen, J. Determinants of renewable energy production in transition economies: A panel data approach. Energy 2020, 191, 116583. [Google Scholar] [CrossRef]
  39. Eren, B.M.; Taspinar, N.; Gokmenoglu, K.K. The impact of financial development and economic growth on renewable energy consumption: Empirical analysis of India. Sci. Total Environ. 2019, 663, 189–197. [Google Scholar] [CrossRef]
  40. Alam, M.; Murad, W. The impacts of economic growth, trade openness and technological progress on renewable energy use in organization for economic co-operation and development countries. Renew. Energy 2020, 145, 382–390. [Google Scholar] [CrossRef]
  41. Bano, S.; Liu, L.; Khan, A. Dynamic influence of aging, industrial innovations, and ICT on tourism development and renewable energy consumption in BRICS economies. Renew. Energy 2022, 192, 431–442. [Google Scholar] [CrossRef]
  42. Shahbaz, M.; Song, M.; Ahmad, S.; Vo, X.V. Does economic growth stimulate energy consumption? The role of human capital and R&D expenditures in China. Energy Econ. 2022, 105, 105662. [Google Scholar] [CrossRef]
  43. Saidi, K.; Hammami, S. The impact of CO2 emissions and economic growth on energy consumption in 58 countries. Energy Rep. 2015, 1, 62–70. [Google Scholar] [CrossRef]
  44. Levine, R. Finance and Growth: Theory and Evidence; National Bureau of Economic Research: Cambridge, MA, USA, 2004; p. w10766. [Google Scholar] [CrossRef]
  45. Sadorsky, P. The impact of financial development on energy consumption in emerging economies. Energy Policy 2010, 38, 2528–2535. [Google Scholar] [CrossRef]
  46. Sadorsky, P. Financial development and energy consumption in Central and Eastern European frontier economies. Energy Policy 2011, 39, 999–1006. [Google Scholar] [CrossRef]
  47. He, C.; Awosusi, A.A.; Eweade, B.S.; Alofaysan, H.; Li, X. Do renewable energy, economic globalization, and financial development foster green growth in France? Evidence from a wavelet-quantile approach. Int. J. Sustain. Dev. World Ecol. 2025, 32, 574–588. [Google Scholar] [CrossRef]
  48. Acheampong, A.O. Modelling for insight: Does financial development improve environmental quality? Energy Econ. 2019, 83, 156–179. [Google Scholar] [CrossRef]
  49. Paramati, S.R.; Ummalla, M.; Apergis, N. The effect of foreign direct investment and stock market growth on clean energy use across a panel of emerging market economies. Energy Econ. 2016, 56, 29–41. [Google Scholar] [CrossRef]
  50. Anton, S.G.; Nucu, A.E.A. The effect of financial development on renewable energy consumption. A panel data approach. Renew. Energy 2020, 147, 330–338. [Google Scholar] [CrossRef]
  51. Tamazian, A.; Chousa, J.P.; Vadlamannati, K.C. Does higher economic and financial development lead to environmental degradation: Evidence from BRIC countries. Energy Policy 2009, 37, 246–253. [Google Scholar] [CrossRef]
  52. Adebayo, T.S.; Awosusi, A.A.; Bekun, F.V.; Altuntaş, M. Coal energy consumption beat renewable energy consumption in South Africa: Developing policy framework for sustainable development. Renew. Energy 2021, 175, 1012–1024. [Google Scholar] [CrossRef]
  53. Shahbaz, M.; Lean, H.H. Does financial development increase energy consumption? The role of industrialization and urbanization in Tunisia. Energy Policy 2012, 40, 473–479. [Google Scholar] [CrossRef]
  54. Yue, S.; Lu, R.; Shen, Y.; Chen, H. How does financial development affect energy consumption? Evidence from 21 transitional countries. Energy Policy 2019, 130, 253–262. [Google Scholar] [CrossRef]
  55. Destek, M.A. Financial development and energy consumption nexus in emerging economies. Energy Sources Part B Econ. Plan. Policy 2018, 13, 76–81. [Google Scholar] [CrossRef]
  56. Beck, T. Finance, growth, and stability: Lessons from the crisis. J. Financ. Stab. 2014, 10, 1–6. [Google Scholar] [CrossRef]
  57. Levine, R. Chapter 12 Finance and Growth: Theory; Evidence. In Handbook of Economic Growth; Elsevier: Amsterdam, The Netherlands, 2005; Volume 1, pp. 865–934. [Google Scholar] [CrossRef]
  58. Awosusi, A.A.; Ozdeser, H.; Seraj, M.; Uzun, B. Are oil efficiency, hydro energy and environmental related technology solution for attaining carbon neutrality: Insight on top energy transition economies? Environ. Dev. Sustain. 2025, 1–29. [Google Scholar] [CrossRef]
  59. Awosusi, A.A.; Rjoub, H.; Ağa, M.; Onyenegecha, I.P. An insight into the asymmetric effect of economic globalization on renewable energy in Australia: Evidence from the nonlinear ARDL approach and wavelet coherence. Energy Environ. 2024, 35, 3600–3624. [Google Scholar] [CrossRef]
  60. Awosusi, A.A.; Rjoub, H.; Dördüncü, H.; Kirikkaleli, D. Does the potency of economic globalization and political instability reshape renewable energy usage in the face of environmental degradation? Environ. Sci. Pollut. Res. 2023, 30, 22686–22701. [Google Scholar] [CrossRef]
  61. Akinsola, G.D.; Awosusi, A.A.; Kirikkaleli, D.; Umarbeyli, S.; Adeshola, I.; Adebayo, T.S. Ecological footprint, public-private partnership investment in energy, and financial development in Brazil: A gradual shift causality approach. Environ. Sci. Pollut. Res. 2022, 29, 10077–10090. [Google Scholar] [CrossRef]
  62. Wackernagel, M.; Rees, W.E. Perceptual and structural barriers to investing in natural capital: Economics from an ecological footprint perspective. Ecol. Econ. 1997, 20, 3–24. [Google Scholar] [CrossRef]
  63. Roy, A. The impact of foreign direct investment, renewable and non-renewable energy consumption, and natural resources on ecological footprint: An Indian perspective. Int. J. Energy Sect. Manag. 2023, 18, 141–161. [Google Scholar] [CrossRef]
  64. Sharif, A.; Baris-Tuzemen, O.; Uzuner, G.; Ozturk, I.; Sinha, A. Revisiting the role of renewable and non-renewable energy consumption on Turkey’s ecological footprint: Evidence from Quantile ARDL approach. Sustain. Cities Soc. 2020, 57, 102138. [Google Scholar] [CrossRef]
  65. Özbek, S.; Naimoğlu, M. The effectiveness of renewable energy technology under the EKC hypothesis and the impact of fossil and nuclear energy investments on the UK’s Ecological Footprint. Energy 2025, 322, 135351. [Google Scholar] [CrossRef]
  66. Brunnschweiler, C.N. Finance for renewable energy: An empirical analysis of developing and transition economies. Environ. Dev. Econ. 2010, 15, 241–274. [Google Scholar] [CrossRef]
  67. Ozdeser, H.; Somoye, O.A.; Seraj, M. The impact of financial development on energy consumption in Nigeria. OPEC Energy Rev. 2021, 45, 240–256. [Google Scholar] [CrossRef]
  68. Shahbaz, M.; Shahzad, S.J.H.; Mahalik, M.K.; Sadorsky, P. How strong is the causal relationship between globalization and energy consumption in developed economies? A country-specific time-series and panel analysis. Appl. Econ. 2018, 50, 1479–1494. [Google Scholar] [CrossRef]
  69. Dickey, D.A.; Fuller, W.A. Distribution of the Estimators for Autoregressive Time Series with a Unit Root. J. Am. Stat. Assoc. 1979, 74, 427–431. [Google Scholar] [CrossRef]
  70. Phillips, P.C.B.; Perron, P. Testing for a unit root in time series regression. Biometrika 1988, 75, 335–346. [Google Scholar] [CrossRef]
  71. Pesaran, M.H.; Shin, Y.; Smith, R.J. Bounds testing approaches to the analysis of level relationships. J. Appl. Econom. 2001, 16, 289–326. [Google Scholar] [CrossRef]
  72. Kripfganz, S.; Schneider, D.C. ARDL: Stata Module to Perform Autoregressive Distributed Lag Model Estimation. 2018. Available online: https://econpapers.repec.org/software/bocbocode/s458528.htm (accessed on 26 October 2021).
  73. Brown, R.L.; Durbin, J.; Evans, J.M. Techniques for Testing the Constancy of Regression Relationships Over Time. J. R. Stat. Soc. Ser. B Methodol. 1975, 37, 149–163. [Google Scholar] [CrossRef]
  74. Nyiwul, L. Economic performance, environmental concerns, and renewable energy consumption: Drivers of renewable energy development in Sub-Sahara Africa. Clean Technol. Environ. Policy 2017, 19, 437–450. [Google Scholar] [CrossRef]
  75. Zhao, P.; Lu, Z.; Fang, J.; Paramati, S.R.; Jiang, K. Determinants of renewable and non-renewable energy demand in China. Struct. Change Econ. Dyn. 2020, 54, 202–209. [Google Scholar] [CrossRef]
  76. Papież, M.; Śmiech, S.; Frodyma, K. Determinants of renewable energy development in the EU countries. A 20-year perspective. Renew. Sustain. Energy Rev. 2018, 91, 918–934. [Google Scholar] [CrossRef]
  77. Miao, Y.; Razzaq, A.; Adebayo, T.S.; Awosusi, A.A. Do renewable energy consumption and financial globalisation contribute to ecological sustainability in newly industrialized countries? Renew. Energy 2022, 187, 688–697. [Google Scholar] [CrossRef]
  78. Xin, Y.; Li, H.; Sunday Adebayo, T.; Ayobamiji Awosusi, A. Asymmetric linkage between biomass energy consumption and ecological footprints in top ten biomass-consuming nations. Econ. Res.-Ekon. Istraživanja 2023, 36, 2147567. [Google Scholar] [CrossRef]
  79. Sun, Y.; Guan, W.; Mehmood, U.; Yang, X. Asymmetric impacts of natural resources on ecological footprints: Exploring the role of economic growth, FDI and renewable energy in G-11 countries. Resour. Policy 2022, 79, 103026. [Google Scholar] [CrossRef]
  80. He, K.; Ramzan, M.; Awosusi, A.A.; Ahmed, Z.; Ahmad, M.; Altuntaş, M. Does Globalization Moderate the Effect of Economic Complexity on CO2 Emissions? Evidence From the Top 10 Energy Transition Economies. Front. Environ. Sci. 2021, 9, 778088. [Google Scholar] [CrossRef]
  81. Wang, X.; Chen, G.; Afshan, S.; Awosusi, A.A.; Abbas, S. Transition towards sustainable energy: The role of economic complexity, financial liberalization and natural resources management in China. Resour. Policy 2023, 83, 103631. [Google Scholar] [CrossRef]
  82. Adebayo, T.S.; Awosusi, A.A.; Odugbesan, J.A.; Akinsola, G.D.; Wong, W.K.; Rjoub, H. Sustainability of energy-induced growth nexus in Brazil: Do carbon emissions and urbanization matter? Sustainability 2021, 13, 4371. [Google Scholar] [CrossRef]
  83. Han, J.H.; Zeeshan, M.; Ullah, I.; Rehman, A.; Afridi, F.E.A. Trade openness and urbanization impact on renewable and non-renewable energy consumption in China. Environ. Sci. Pollut. Res. 2022, 29, 41653–41668. [Google Scholar] [CrossRef]
  84. Islam, M.M.; Irfan, M.; Shahbaz, M.; Vo, X.V. Renewable and non-renewable energy consumption in Bangladesh: The relative influencing profiles of economic factors, urbanization, physical infrastructure and institutional quality. Renew. Energy 2022, 184, 1130–1149. [Google Scholar] [CrossRef]
  85. Kalmaz, B.; Awosusi, A.A. Investigation of the driving factors of ecological footprint in Malaysia. Environ. Sci. Pollut. Res. 2022, 29, 56814–56827. [Google Scholar] [CrossRef] [PubMed]
  86. Zhao, L.; Qamruzzaman, M. Do Urbanization, Remittances, and Globalization Matter for Energy Consumption in Belt and Road Countries: Evidence From Renewable and Non-Renewable Energy Consumption. Front. Environ. Sci. 2022, 10, 930728. [Google Scholar] [CrossRef]
Figure 1. Primary energy consumption trends between 2015 and 2024.
Sustainability 18 04605 g001
Figure 2. Energy mix comparison for 2024.
Sustainability 18 04605 g002
Table 1. Descriptive statistics.
RECNRECGDPFDECFFGLOEGLOTGLO
Mean1.50072.61193.33541.44010.08981.69511.68781.6760
Median1.51452.64903.34331.43450.10541.71961.69721.6724
Maximum1.81173.02413.61671.73980.22931.82561.79531.7850
Minimum1.11471.88962.98181.0114−0.17491.46381.52211.5689
Std. Dev.0.15970.34850.18590.18420.10830.09950.06520.0508
Skewness−0.3604−0.6347−0.3795−0.2841−0.7174−0.8779−0.84200.0599
Kurtosis3.35882.30432.14992.74822.79162.96083.28512.8290
Table 2. Conventional unit root tests.
VariablesADFPP
I(0)I(1)I(0)I(1)
REC−3.1586−4.2200 *−2.5441−3.9201 **
NREC−1.3975−6.1846 *−0.8078−6.1784 *
GDP−2.8274−4.3202 *−1.6604−4.5341 *
FD−1.4570−7.8750 *−1.4089−7.8735 *
ECF−0.9522−6.7957 *−0.9522−6.7837 *
EGLO−2.3186−6.8902 *−2.2394−6.9839 *
FGLO−1.9937−7.2585 *−1.9747−7.2623 *
TGLO−2.7526−6.6065 *−2.6985−7.4438 *
Note: *, and **, denotes <p-value of 1%, and 5%, respectively.
Table 3. ARDL cointegration test for REC model.
Model 1Model 2Model 3
T-Statistics−5.9000 *−6.4114 *−6.4031 *
F-Statistics6.1884 *7.3079 *7.2890 *
Note: * denotes <p-value of 1%.
Table 4. ARDL cointegration test for NREC model.
Model 1Model 2Model 3
T-Statistics−7.1958 *−8.4704 *−6.6823 *
F-Statistics9.4745 *13.2460 *8.2302 *
Note: * denotes <p-value of 1%.
Table 5. ARDL estimator for REC model.
Model 1Model 2Model 3
Long Term
RegressorsCoefficientStrd. ErrorCoefficientStrd. ErrorCoefficientStrd. Error
GDP1.4988 *0.36780.9447 **0.39381.2106 *0.3735
FD−0.1469 *0.0492−0.1207 ***0.0662−0.10490.0705
ECF−0.2035 **0.0871−0.4092 *0.1488−0.2512 **0.1226
EGLO0.09820.0691----
FGLO--−0.1867 ***0.0999--
TGLO----−0.2070 **0.0987
C−0.85250.2337−0.99390.2459−0.59710.3574
Short Term
ΔGDP1.4988 *0.31730.9447 *0.33401.2106 *0.3093
ΔFD0.1108 **0.04310.1452 *0.0437−0.1581 *0.0401
ΔECF--−0.11890.1240−0.05120.1223
ΔEGLO------
ΔFGLO--0.2202 *0.0634--
ΔTGLO----0.2917 *0.0765
ECT(−1)−0.2682 *0.0508−0.3516 *0.0548−0.3071 *0.0479
Post-Estimation of the Diagnostic Test
Jarque-Bera Test2.7530 (0.2524)4.2380 (0.1201)2.6875 (0.2608)
BGSC LM Test0.5401 (0.5867)0.0671 (0.9352)0.2880 (0.7517)
BPG HET0.7438 (0.6527)0.3395 (0.9908)0.2729 (0.9974)
Ramsey RT0.4281 (0.6707)0.4238 (0.6746)1.6535 (0.1083)
CUMSUMRemains stable at the 5%Remains stable at the 5%Remains stable at the 5%
CUMSUMSQRemains stable at the 5%Remains stable at the 5%Remains stable at the 5%
Note: *, ** and *** denote <p-value of 1%, 5% and 10%, respectively; Probability values are in parenthesis.
Table 6. ARDL estimator for NREC model.
Model 1Model 2Model 3
Long Term
RegressorsCoefficientStrd. ErrorCoefficientStrd. ErrorCoefficientStrd. Error
GDP0.5486 **0.23320.4300 *0.10020.4223 *0.1042
FD0.0470 **0.01920.0453 **0.02070.0467 *0.0165
ECF0.3608 *0.07720.2789 *0.06380.3371 *0.0990
EGLO0.06600.0540----
FGLO--0.01390.0309--
TGLO----0.02490.0495
C−1.08560.3030−0.62470.2028−0.66770.2391
Short Term
ΔGDP0.5486 **0.2167----
ΔFD------
ΔECF----0.3371 *0.0817
ΔEGLO------
ΔFGLO------
ΔTGLO------
ECT(−1)−0.5007 *0.0695−0.3483 *0.0411−0.3282 *0.0491
Post-Estimation of the Diagnostic Test
Jarque-Bera Test0.2398 (0.8870)1.6634 (0.4352)1.0818 (0.5822)
BGSC LM Test0.4594 (0.6349)0.0461 (0.9550)0.3804 (0.6857)
ARCH HET0.1846 (0.6693)0.7892 (0.3785)0.8763 (0.3536)
Ramsey RT1.8092 (0.0776)1.1730 (0.2467)1.3053 (0.1983)
CUMSUMRemains stable at the 5%Remains stable at the 5%Remains stable at the 5%
CUMSUMSQRemains stable at the 5%Remains stable at the 5%Remains stable at the 5%
Note: * and ** denotes <p-value of 1% and 5%, respectively; Probability values are in parenthesis.
Disclaimer/Publisher’s Note: The statements, opinions and data contained in all publications are solely those of the individual author(s) and contributor(s) and not of MDPI and/or the editor(s). MDPI and/or the editor(s) disclaim responsibility for any injury to people or property resulting from any ideas, methods, instructions or products referred to in the content.