1. Introduction
Landslides are among the most destructive natural hazards worldwide. They are often triggered by strong earthquakes, especially in mountainous regions, where they occur frequently and affect large areas. Southwest China lies within the southeastern tectonic deformation zone of the Tibetan Plateau and is strongly influenced by the far-field effects of the India–Eurasia plate collision. The region is characterized by active fault systems, such as the Xianshuihe and Longmenshan fault zones, rugged topography, and frequent strong earthquakes [
1]. Together, these conditions create a highly favorable setting for the occurrence of coseismic landslides, making earthquake-induced landslide hazards particularly widespread and destructive in this region [
2,
3,
4,
5]. Recent major earthquakes clearly illustrate this pattern. The 2008 Wenchuan Mw 7.9 earthquake triggered more than 100,000 landslides. The landslide inventory for the 2013 Lushan Mw 6.6 earthquake documented approximately 22,500 landslides. The updated inventory for the 2022 Luding Ms 6.8 earthquake indicates that more than 16,000 landslides were triggered, and their distribution is closely related to the seismogenic fault and the local topographic and geological conditions [
6,
7,
8]. For these reasons, the mountainous areas of Southwest China can be regarded as one of the most representative regions in China for earthquake-induced landslide hazards. They are also a priority area for regional-scale hazard assessment and model validation.
Against this background, several approaches have been developed for regional coseismic landslide hazard assessment, including expert-based qualitative or semi-quantitative methods, data-driven statistical or machine-learning methods, and physically based methods represented by the Newmark model [
9,
10,
11]. Expert-based approaches are useful when regional geological and geomorphological knowledge is available, but they often depend strongly on subjective judgment and are difficult to standardize for broader application. Statistical and machine-learning methods can integrate multiple conditioning factors and are effective for regional susceptibility mapping, but they usually rely heavily on landslide inventory quality and may provide limited physical insight into slope failure processes. By comparison, physically based methods have clearer mechanical meaning and are therefore more suitable for interpreting slope response under seismic loading. Among them, the Newmark method [
12] has been widely used in rapid regional assessments because it has a clear physical basis, is relatively easy to apply, and requires limited input data [
13,
14,
15].
The Newmark method is based on a simple physical concept. A potential landslide mass is treated as a rigid block resting on a slope. Sliding begins when the earthquake-induced acceleration exceeds the critical acceleration of the block. The Newmark displacement (Dn) is then calculated by double integration and accumulation of the portions of the strong-motion record that exceed the critical acceleration ac. When the analysis is extended from a single landslide to a regional scale, it becomes difficult to obtain strong-motion records for every slope unit. Strong-motion stations are usually sparse and unevenly distributed, whereas the number of slope units within a study area is often very large. As a result, regional coseismic landslide hazard assessment commonly relies on empirical regression equations that relate Newmark displacement to ground-motion and slope-related parameters. In these models, strong-motion parameters such as PGA and Ia, together with critical acceleration, are used as independent variables to estimate Newmark displacement statistically. This provides a practical and simplified tool for rapid hazard assessment at the regional scale.
Ambraseys and Menu [
16] were the first to develop a Newmark displacement prediction model from strong-motion records, using the critical acceleration ratio (
ac/
PGA) as a predictor. Jibson [
17] later argued that Arias intensity (
Ia) is more suitable than peak ground acceleration for predicting coseismic slope displacement and accordingly proposed a Newmark displacement model based on Arias intensity and critical acceleration. In subsequent studies, Jibson further recalibrated existing models using larger and more comprehensive strong-motion datasets and proposed several new formulations based on different combinations of ground-motion parameters [
18,
19,
20]. Building on this work, other researchers also used different strong-motion datasets to revise existing models and derive empirical Newmark equations with various predictor combinations [
21,
22].
Despite these efforts, an important issue remains. The acceleration time histories used to calculate Newmark displacement are derived from station-recorded strong-motion data. Such records are influenced by many local factors, including wave propagation path, propagation medium, site geological conditions, and topographic effects. Therefore, Newmark displacement prediction models developed from strong-motion records show clear regional dependence [
23,
24]. However, many empirical models currently in use were developed from limited or regionally different strong-motion datasets. Consequently, they may produce significant prediction biases when directly applied to the unique seismotectonic and topographic conditions of Southwest China. While regional assessments in China have gained attention [
25], a systematic evaluation, recalibration, and physics-informed improvement of these models using a comprehensive, region-specific strong-motion database from Southwest China has been lacking.
To address this gap, this study (1) compiles 591 horizontal ground-motion records from nine significant earthquakes in Southwest China (2007–2022) to systematically recalibrate and evaluate seven widely used prediction models; (2) develops a new, improved model by identifying and incorporating a key regional predictive parameter (Peak Ground Velocity); and (3) evaluates the new model’s performance by applying it to assess coseismic landslides triggered by the 2022 Luding Ms 6.8 earthquake. The results are expected to provide a more accurate and regionally-adapted tool for coseismic landslide hazard assessment, offering a critical reference for seismic risk mitigation in Southwest China. Beyond its methodological contribution, this study also aims to support more sustainable hazard management in mountainous regions by improving the scientific basis for regional hazard assessment, post-earthquake emergency screening, and risk-informed land-use planning.
2. Study Area and Data Processing
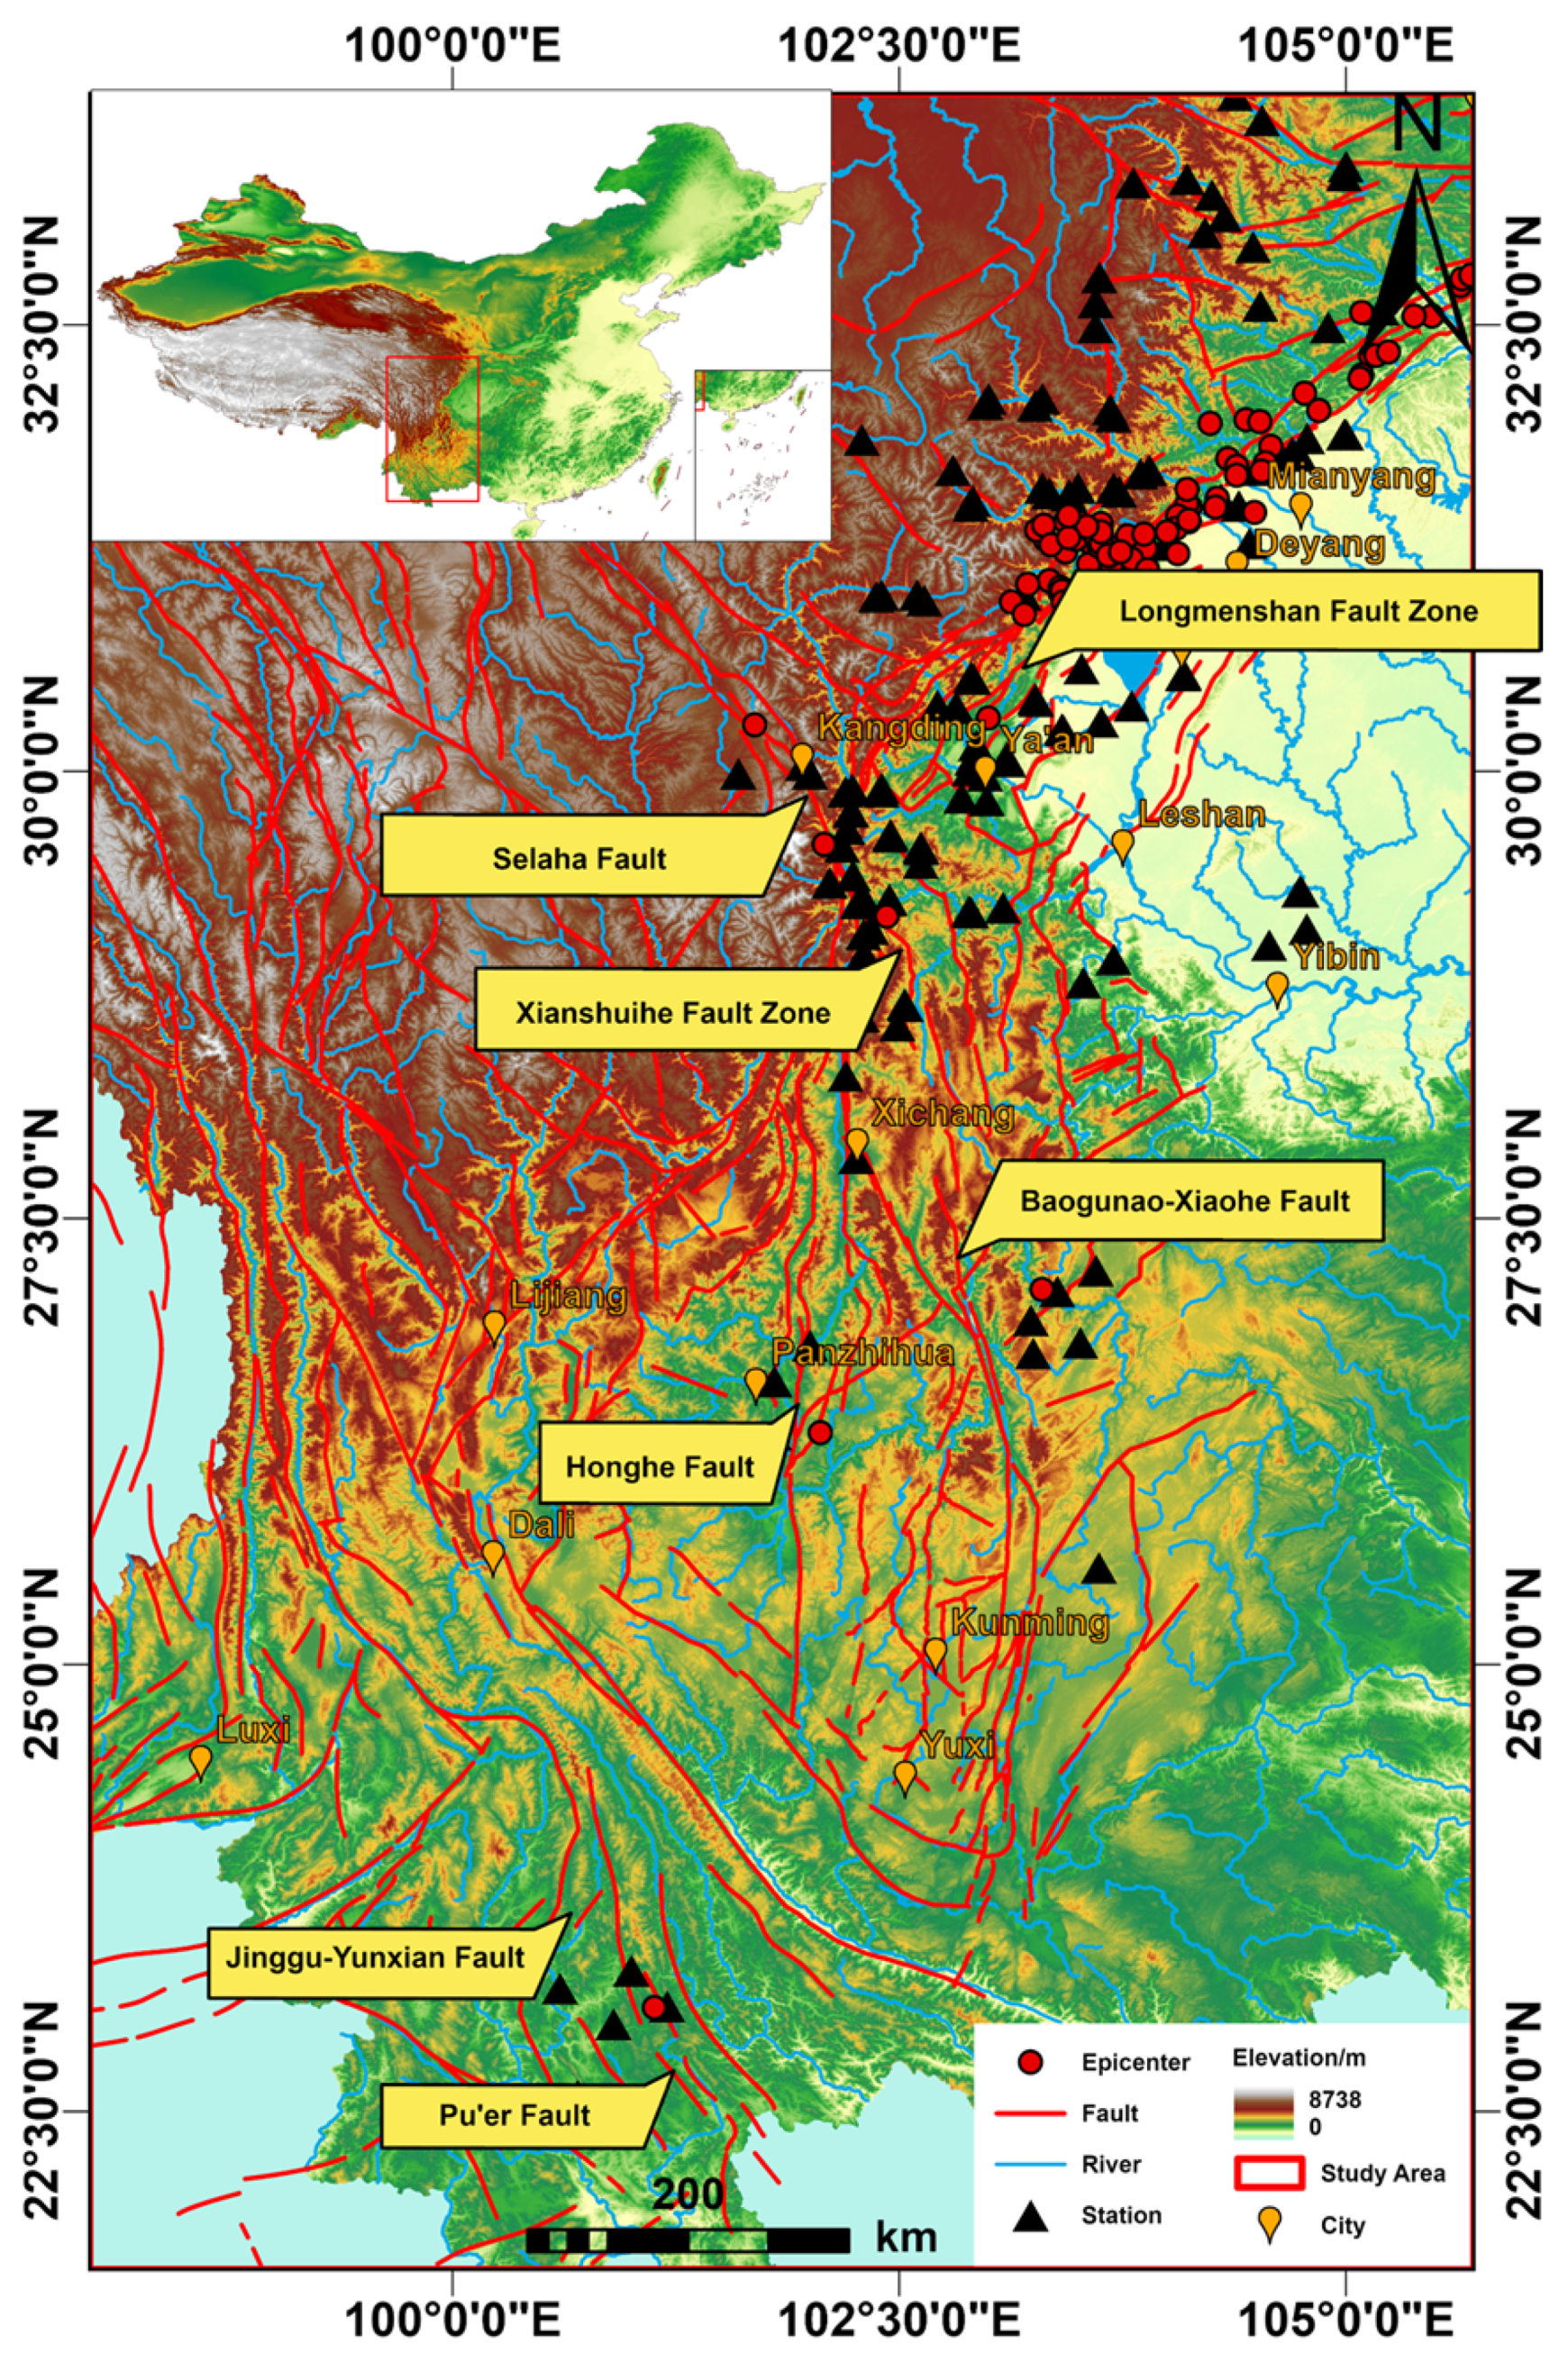
The study area encompasses the seismically active mountainous region of Southwest China, primarily including Sichuan Province and the northeastern part of Yunnan Province (
Figure 1). This area is situated at the tectonically intense southeastern margin of the Tibetan Plateau, where the ongoing India-Eurasia collision has generated major fault systems such as the Xianshuihe and the Longmenshan faults. The resultant combination of frequent strong earthquakes, steep terrain, and fragile geology makes this area one of the regions in China most prone to coseismic landslides, as evidenced by numerous catastrophic events. Therefore, it serves as a critical and representative area for developing and testing a regionally optimized Newmark displacement prediction model.
A robust, region-specific strong-motion database is critical for addressing the regional limitations of existing Newmark models. Our analysis is based on 591 horizontal components of ground-motion records obtained from 174 stations during nine significant earthquakes in Southwest China (2007–2022). Data for this study were provided by the Motion Observation Data Center, Institute of Engineering Mechanics, China Earthquake Administration (Strong Motion Observation Data Subcenter of the National Earthquake Data Center). The selection, preprocessing, and analytical treatment of this dataset are described in this section, with the geographical and seismological context of the records provided in
Figure 1 and
Table 1.
Figure 1 shows the spatial distribution of the earthquake epicenters and recording stations.
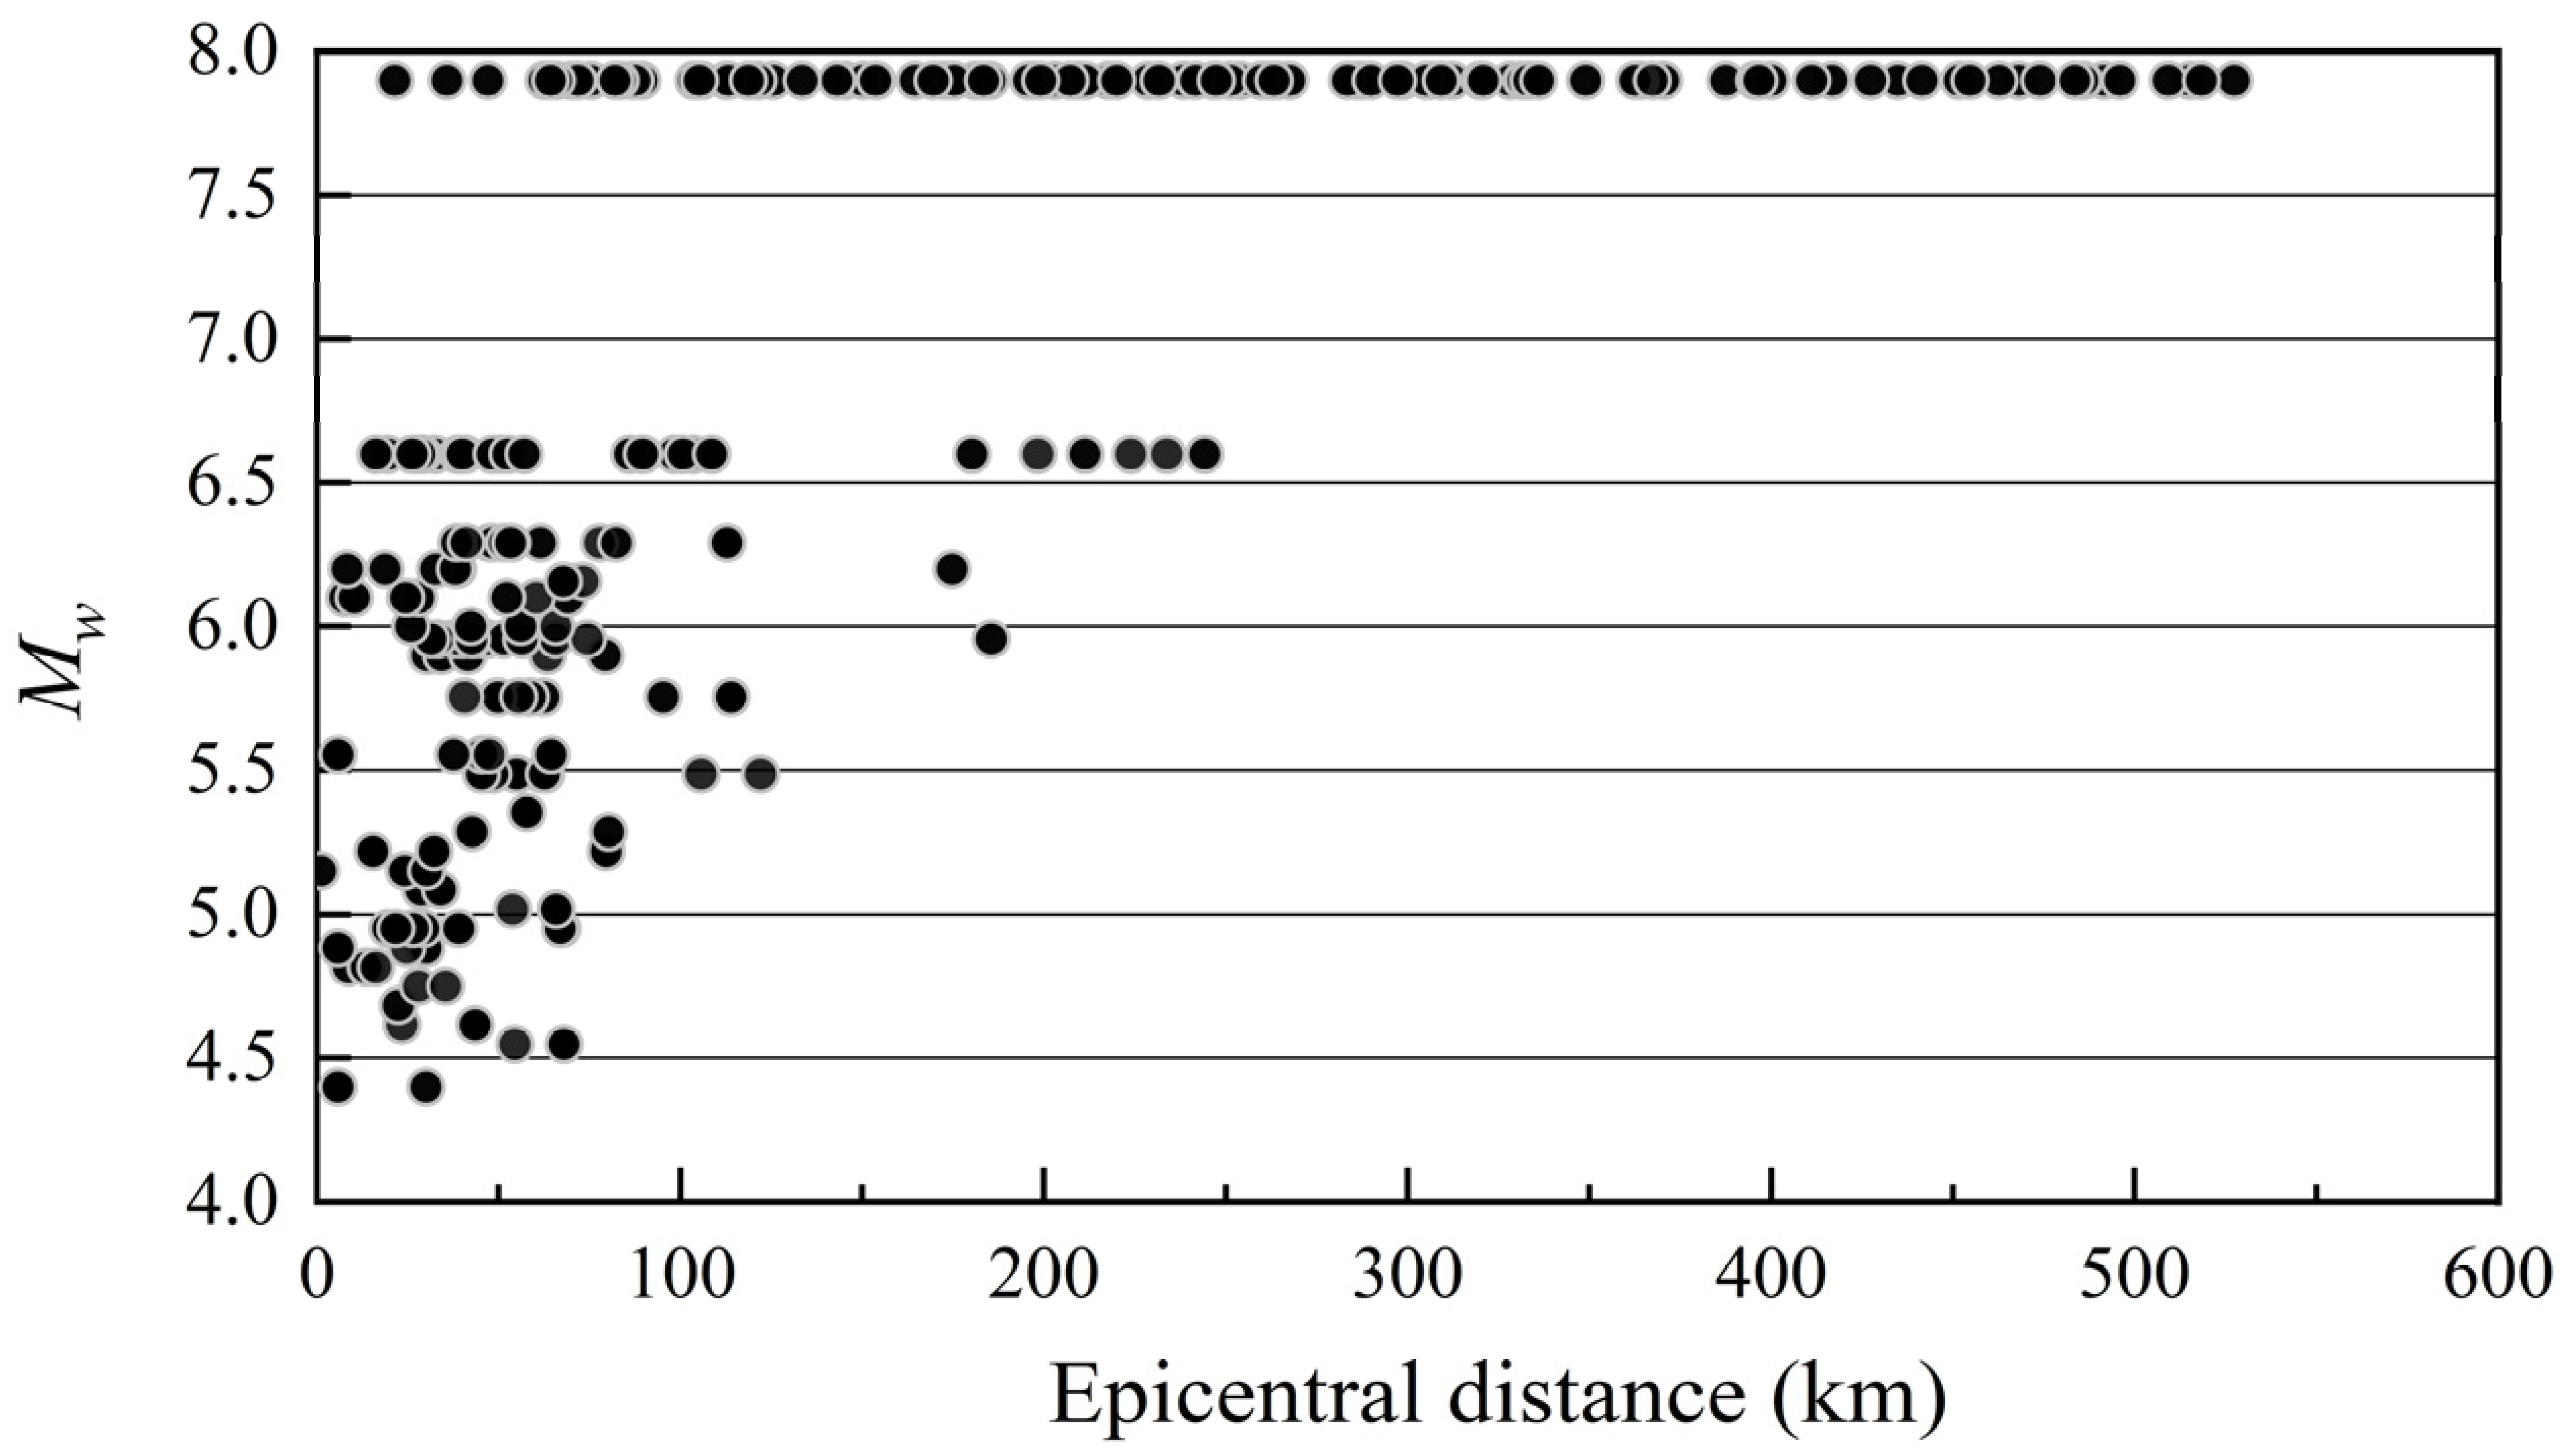
Figure 2 presents the distributions of Mw and epicentral distance.
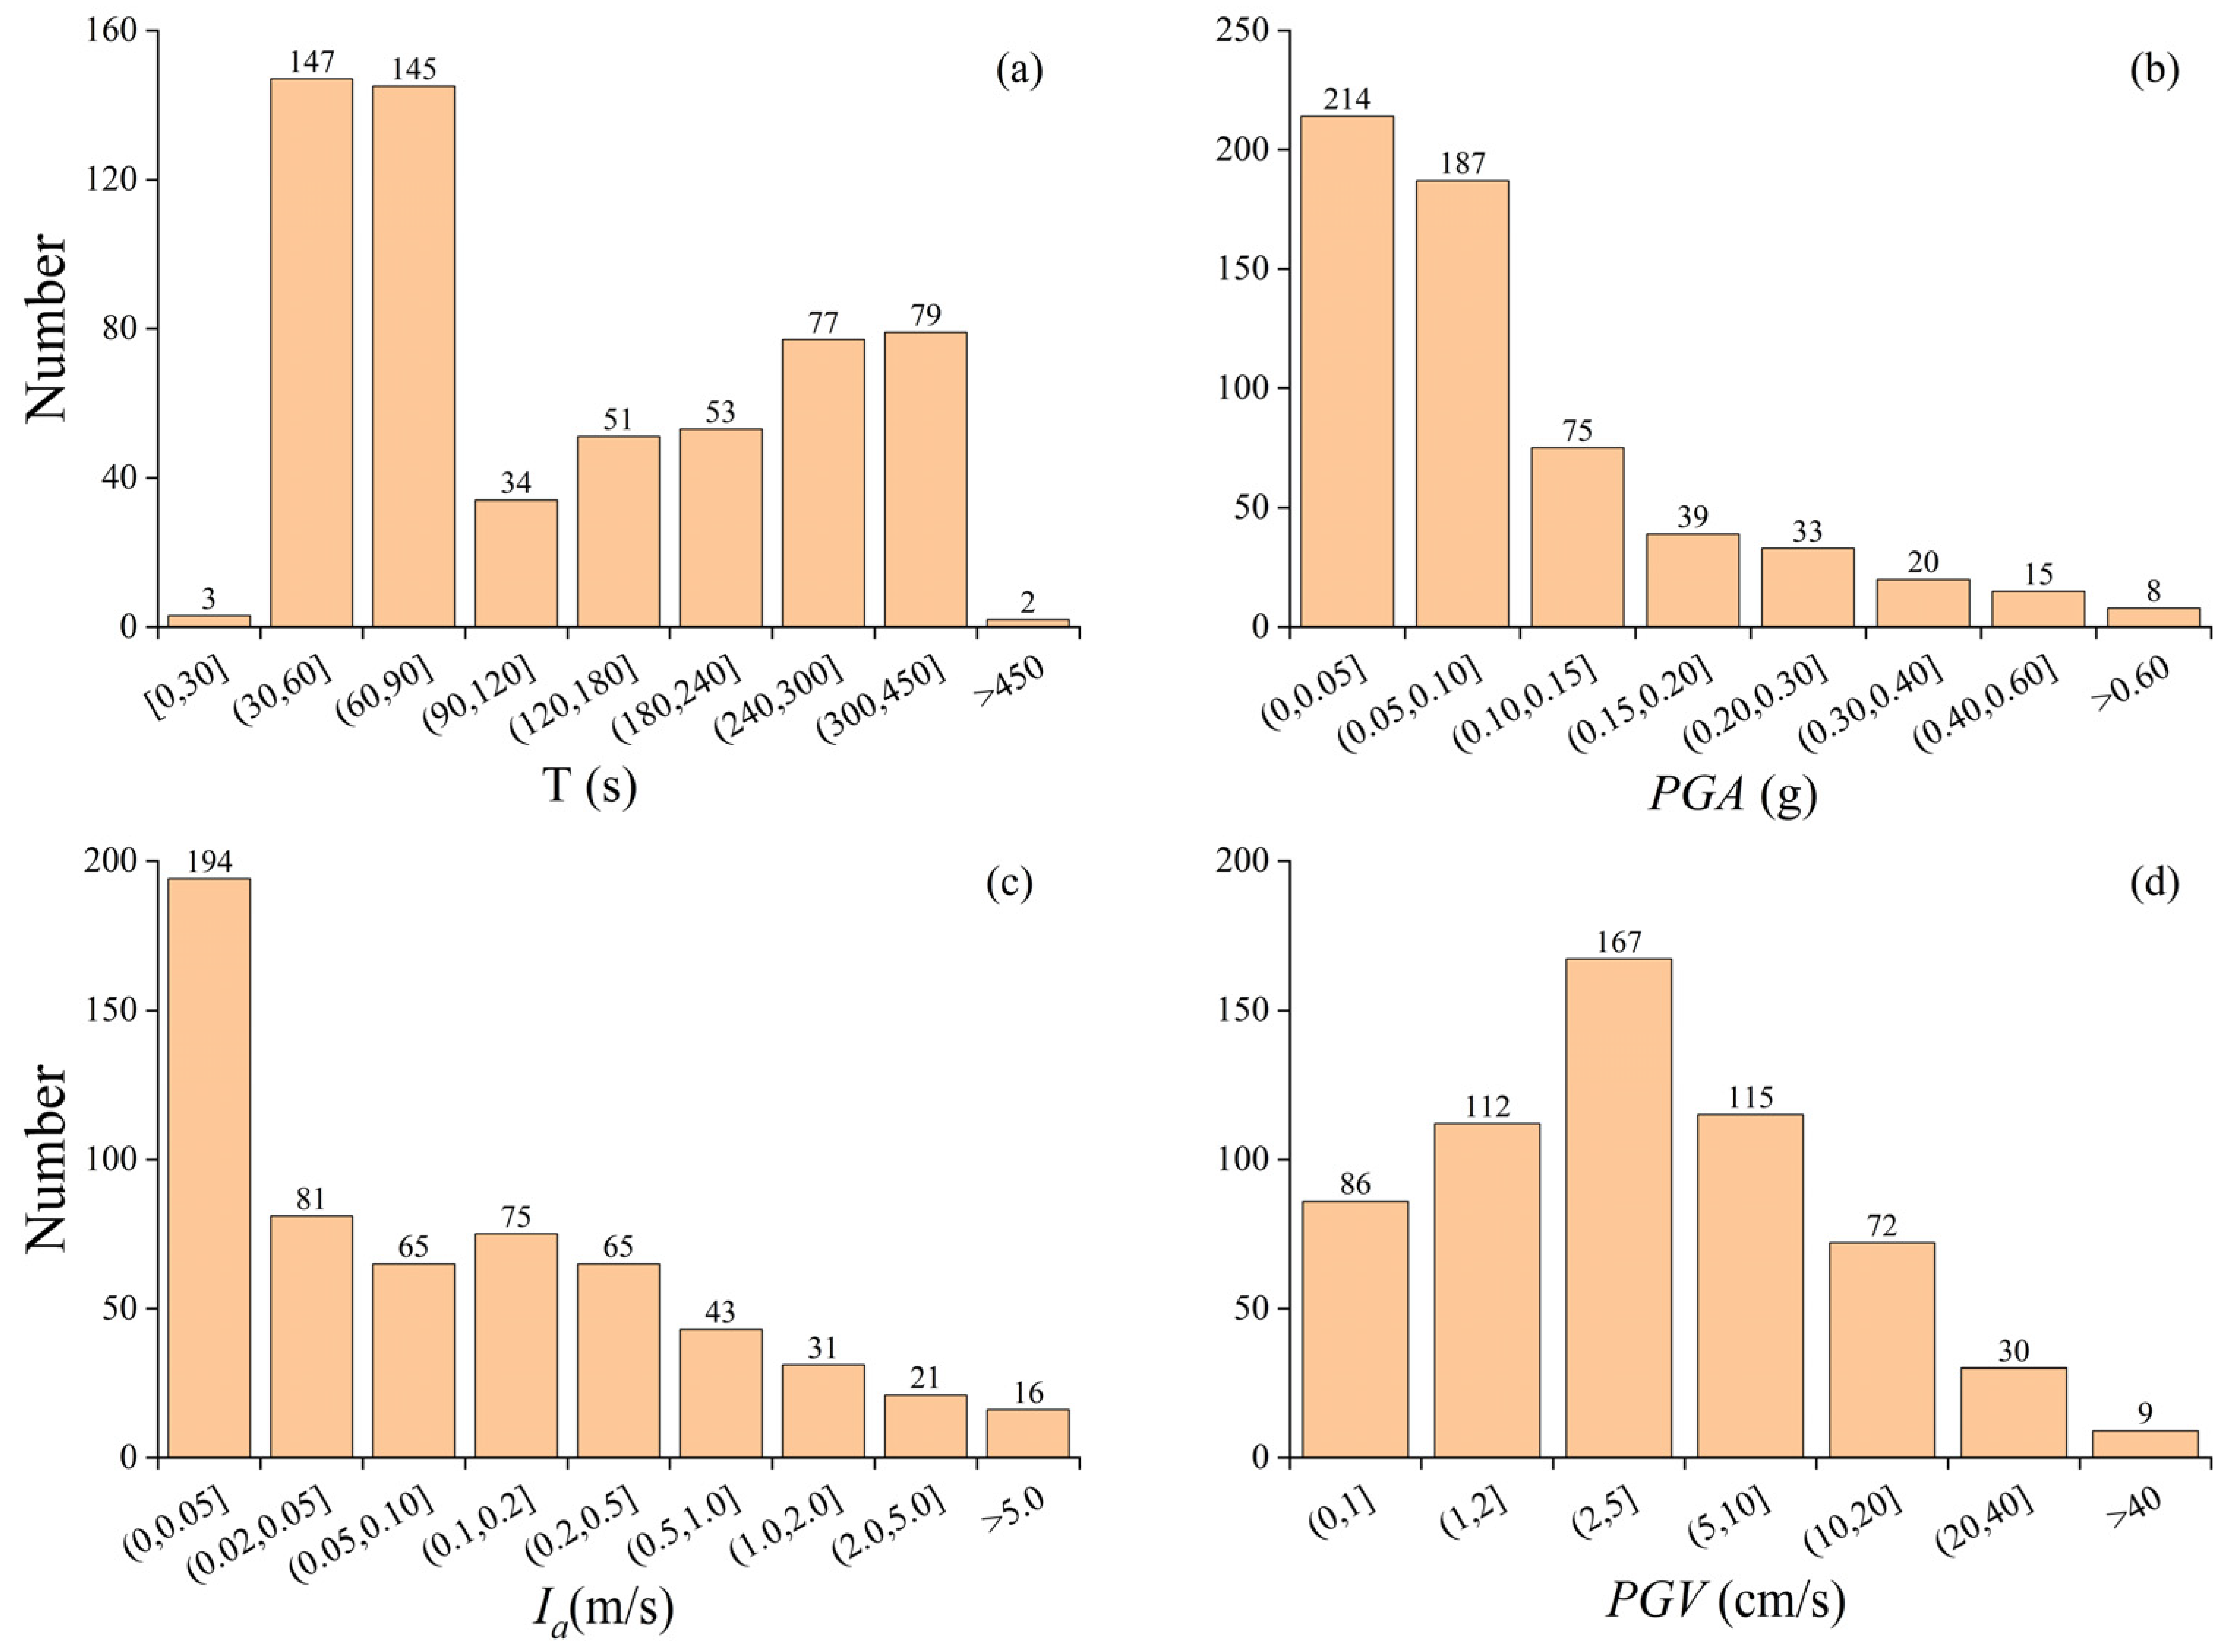
Figure 3 shows the distributions of several key strong-motion parameters in the dataset. This dataset encompasses earthquakes with a broad spectrum of moment magnitudes (Mw, sourced from the USGS), ranging from moderate (Mw 4.4) to great (Mw 7.9) events. The epicentral distances of the recording stations also cover a wide span, from near-fault (~1 km) to far-field (>500 km) conditions. This diversity in both source intensity and wave propagation paths is crucial for developing a robust prediction model with wide applicability.
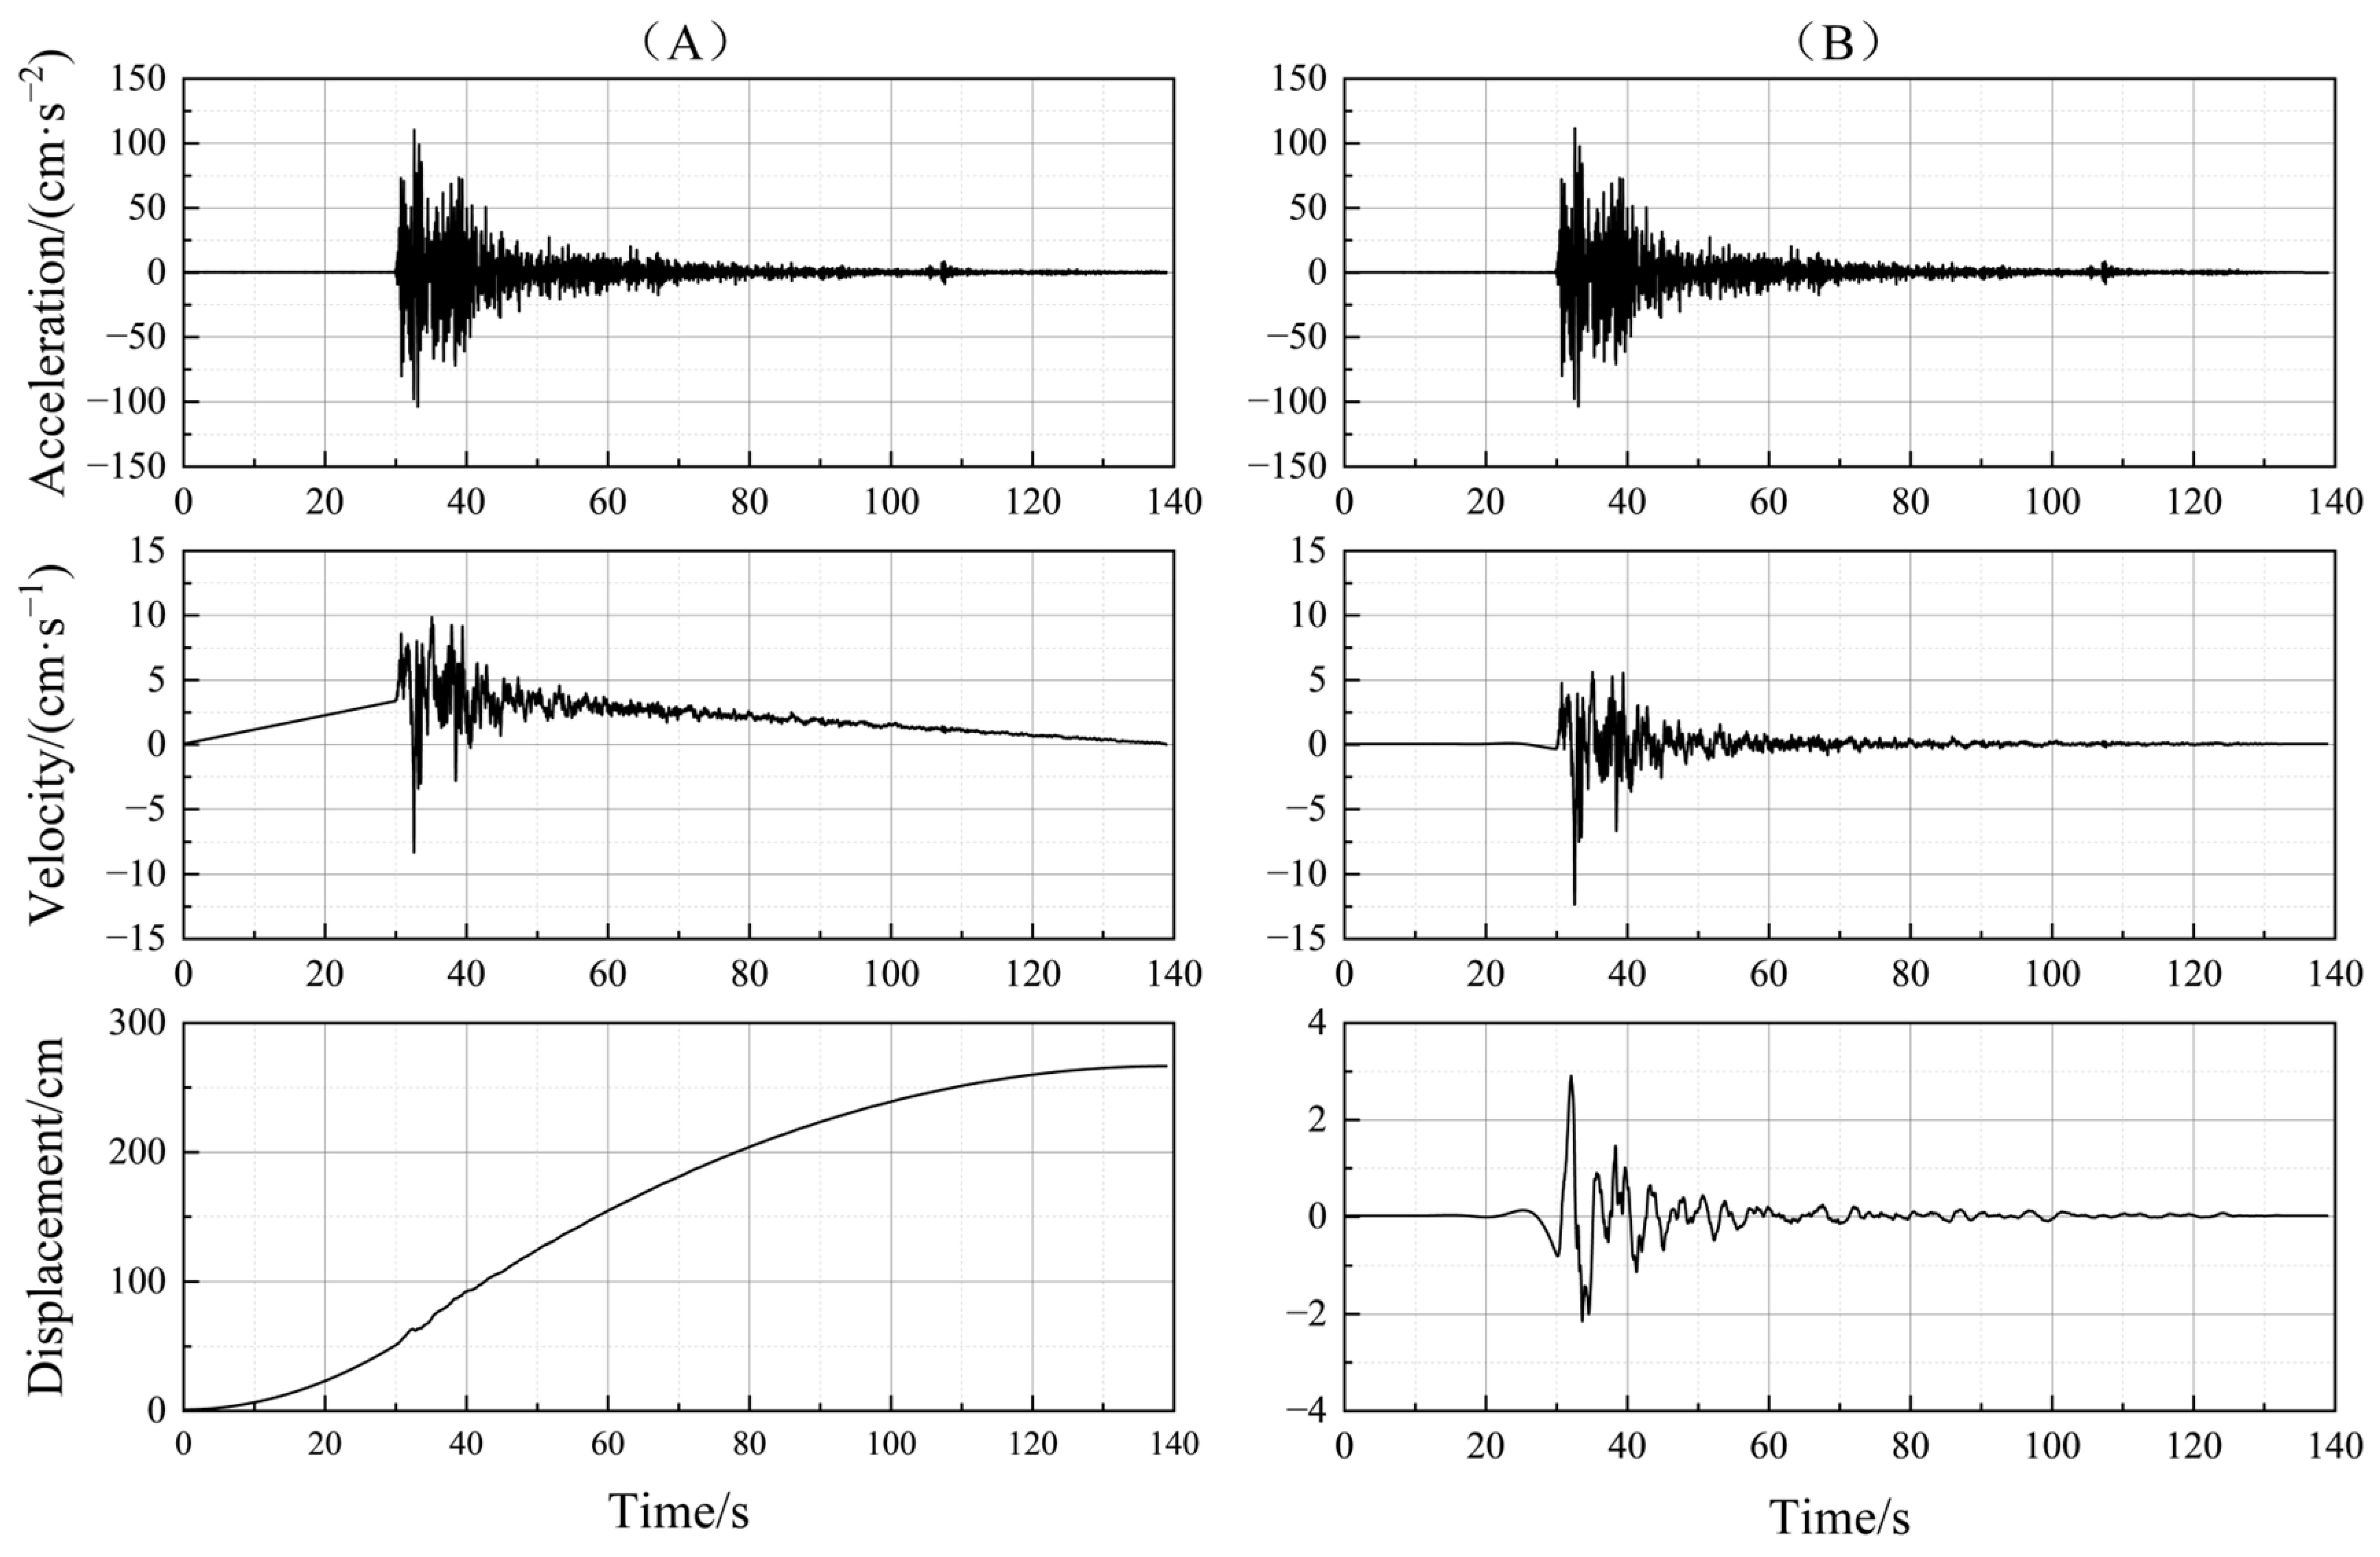
To ensure the consistency of the acceleration, velocity, and displacement time histories of filtered strong-motion records and to mitigate the influence of displacement baseline drift during integration on the correction of the Newmark displacement prediction model, the post-processing method proposed by Yao et al. was adopted in this study [
26]. As a representative example, the EW component recorded at station 51LDJ during the 2022 Luding Ms 6.8 earthquake was selected to illustrate the preprocessing effect, because it is complete and shows clear velocity/displacement drift before correction. The comparison before and after correction is shown in
Figure 4. The records were then band-pass filtered over the frequency range of 0.1–40 Hz. After filtering, the
PGA values decreased by about 5% on average.
After preprocessing, the displacement value,
Dn, for each record was calculated using the classical Newmark sliding-block model [
27]. A series of critical acceleration values was defined for slope dynamic stability analysis, with
ac ranging from 0.01 g to 0.40 g at intervals of 0.01 g. The Newmark displacement
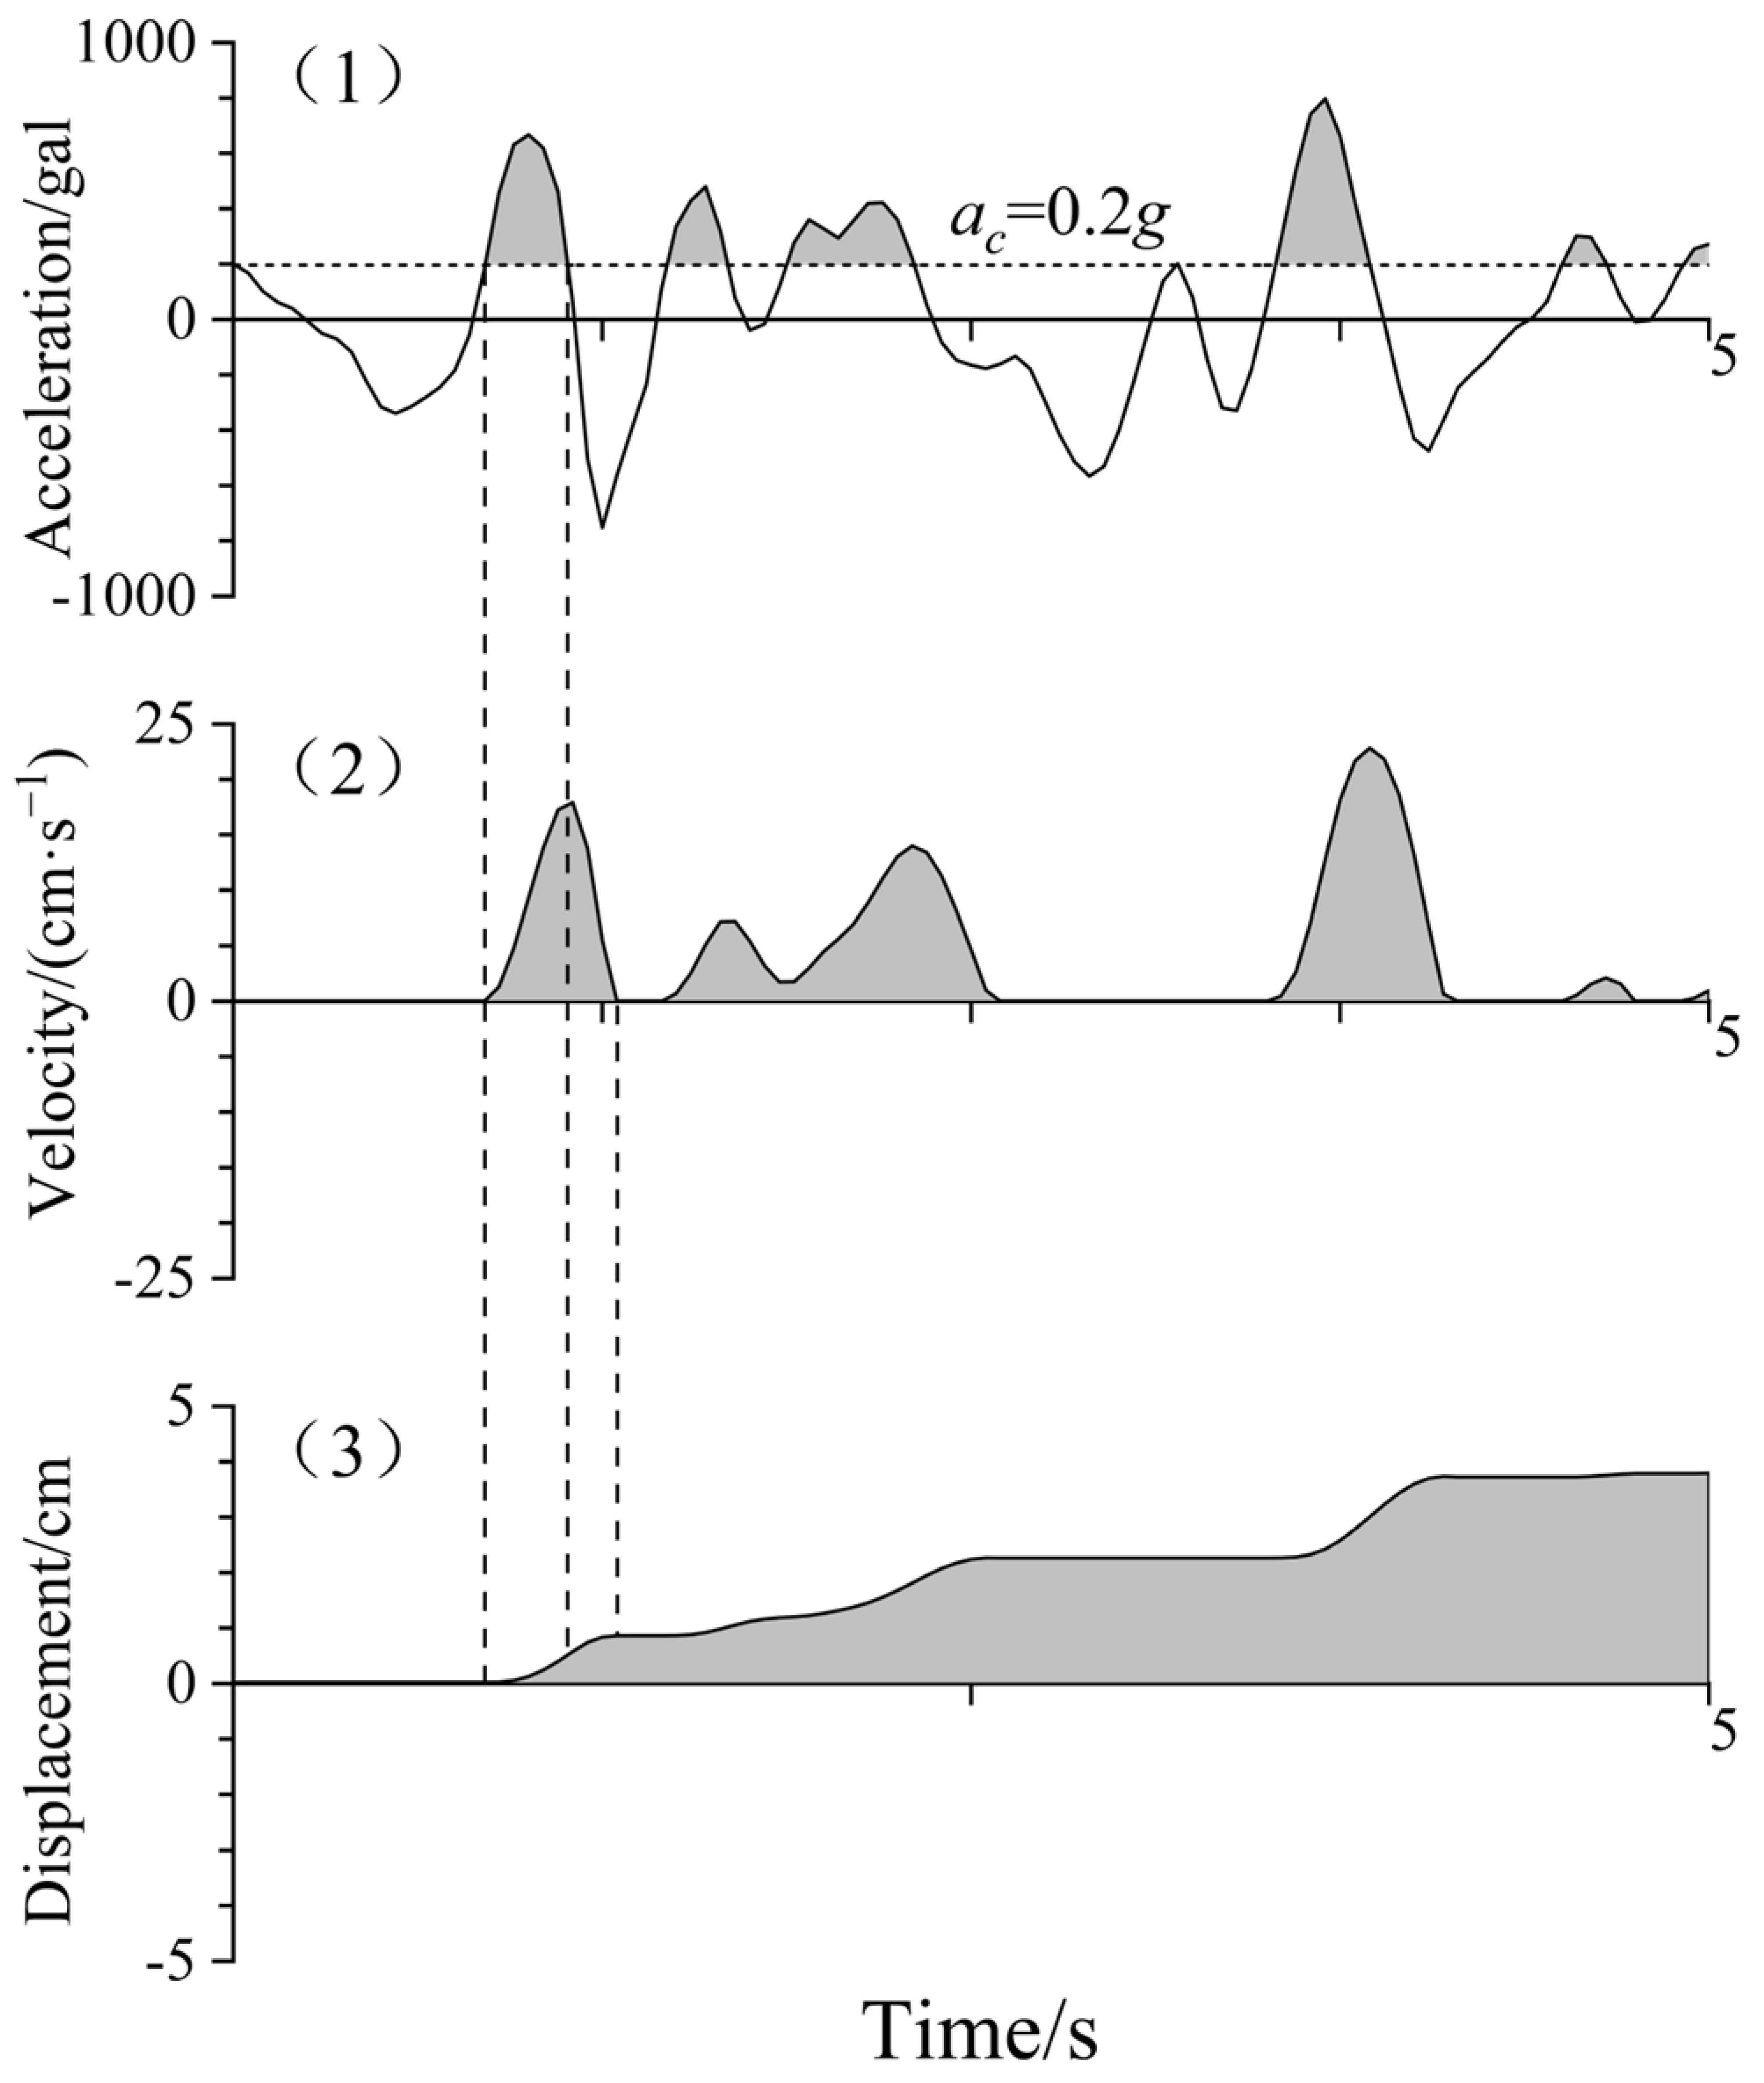
Dn was then calculated for each horizontal strong motion record under each critical acceleration condition. The calculation procedure of Newmark displacement using the sliding-block model is illustrated in
Figure 5.
To reduce record-level leakage, the strong-motion records were split into a training set and a validation set using a record-level, event-stratified strategy. Because a single strong-motion record can generate multiple Newmark permanent-displacement (Dn) samples under different critical acceleration levels (ac), a row-wise random split would allow samples derived from the same time history to appear in both subsets, thereby inflating the apparent predictive performance. Therefore, each strong-motion record (uniquely identified by earthquake event–station–component–data file) was treated as an indivisible unit, and all samples derived from the same record across all ac levels were assigned to the same subset.
The split was implemented via event-stratified random sampling. Specifically, the 591 records were first grouped by earthquake event; within each event, records were randomly shuffled and then assigned to the training and validation sets at an approximate 70%/30% ratio, ensuring that both subsets contain records from all events and maintain comparable event composition. Notably, no displacement-magnitude-based partitioning (by
Dn) was used; the assignment of records to the training or validation set was solely determined by the stratified random sampling procedure. The final split consists of 413 records for training and 178 records for validation (591 records in total). This split avoids overlap between samples from the same strong-motion record, but it should be regarded as a record-level validation rather than a strict inter-event generalization test. The event-wise distribution of strong-motion records in the training and validation subsets is summarized in
Table 2.
Newmark displacement occurs only when the peak ground acceleration exceeds the critical acceleration of the slope. However, the dataset used in this study contains many records with low PGA values. Under the predefined ac sequence, this leads to a large number of calculated displacement values that are zero or close to zero. Including such samples in the regression analysis could reduce the statistical significance of the results. To ensure model reliability and rigor, samples with Dn < 0.01 cm were excluded. This threshold was adopted because very small displacement values are practically negligible for regional hazard interpretation, but may exert a disproportionate influence on model calibration and error evaluation. In particular, near-zero values can increase the sensitivity of logarithmic regression and artificially amplify relative error because of the small denominator. Moreover, retaining a large number of such samples would cause the regression to be dominated by the near-zero-displacement range, thereby weakening model calibration for the non-negligible displacement levels that are more relevant to regional coseismic landslide assessment. Records affected by clear data-quality problems, such as incomplete time histories, corrupted samples, or obvious instrumental/processing artifacts, were also removed. After screening, 4240 valid displacement values were retained, including 2941 for model fitting and 1299 for model validation.
3. Improvement of the Newmark Displacement Prediction Model
3.1. Recalibration of Existing Displacement Prediction Models
To assess the applicability of existing Newmark displacement prediction models to the Southwest China dataset, the original forms of seven commonly used models were first applied. Recalibration was performed using nonlinear least-squares regression (i.e., Levenberg–Marquardt algorithm) with coefficient estimates obtained by minimizing the sum of squared logarithmic residuals. No constraints were imposed on the regression parameters. The resulting coefficients of determination (R
2) and standard deviations (σ) are listed in
Table 3. The results show that all seven models exhibit clear prediction bias for the present dataset. Among them, the Jin2018 model performs worst, with a negative coefficient of determination (R
2 = −0.3797). This indicates that its predictive performance is even poorer than that of a simple mean-value predictor, suggesting very poor direct applicability to the present Southwest China dataset. These results further confirm the strong regional dependence of empirical Newmark displacement models and the necessity of regional recalibration.
Given the established regional dependence of Newmark displacement relationships [
23,
24,
28], we first evaluated the direct applicability of seven prevalent models to our Southwest China dataset. The results confirmed significant prediction bias, with poor performance metrics (e.g., low R
2 values as shown in
Table 3), underscoring that these models cannot be directly applied without regional adjustment.
Therefore, a systematic recalibration was essential. We recalibrated all models, which can be categorized into three functional forms based on their predictor variables: (1) models using only the critical acceleration ratio (
ac/
PGA); (2) models combining critical acceleration (
ac) and Arias intensity (
Ia); and (3) models incorporating both the
ac/
PGA ratio and Ia. The performance metrics (coefficient of determination, R
2, and standard deviation, σ) of the recalibrated forms are summarized and compared with their original versions in
Table 3.
Among the recalibrated versions, models utilizing both ac/PGA and Ia (i.e., the Jibson2007, Xu2012-2, and Yiğit2020 forms) achieved distinctly superior performance, with R2 values between 0.78 and 0.82. Notably, the recalibrated Yiğit2020 model emerged as the most effective, yielding the highest R2 (0.82) and the lowest σ (0.45) within this group. This model successfully integrates the predictive strengths of both the acceleration ratio and energy content, providing the most robust regional baseline after calibration. Consequently, it was selected as the foundational framework for our further model enhancement.
3.2. Development of a New Displacement Prediction Model
As noted above, the coefficients of seven categories of displacement prediction models were recalibrated using the present dataset. As shown in
Table 3, among the revised existing models, the recalibrated Yiğit2020 model performs best, with an R
2 of 0.82 and a standard deviation (σ) of 0.45. Although its fitting performance is better than that of the other recalibrated models, the overall error remains relatively large. This indicates that the predictive performance still has room for improvement. Therefore, the recalibrated Yiğit2020 model was selected as the basis for developing a new displacement prediction model. This role of
PGV is also physically reasonable. Newmark displacement is a cumulative permanent displacement generated after the ground acceleration exceeds the critical threshold, and is therefore related not only to the peak amplitude of shaking but also to the velocity response and sustained sliding tendency of the slope mass. Compared with
PGA, which mainly reflects the peak acceleration demand,
PGV can better capture the motion demand associated with displacement accumulation and, in some cases, also reflects the influence of frequency content and pulse-like characteristics of the ground motion. Previous studies have likewise shown that velocity-related parameters are effective for predicting earthquake-induced slope displacement and are closely associated with coseismic landslide response [
29,
30,
31,
32].
To identify a more effective predictive relationship, we systematically examined the correlation between Peak Ground Velocity (
PGV) and Newmark displacement (
Dn) under different critical acceleration (
ac) levels.
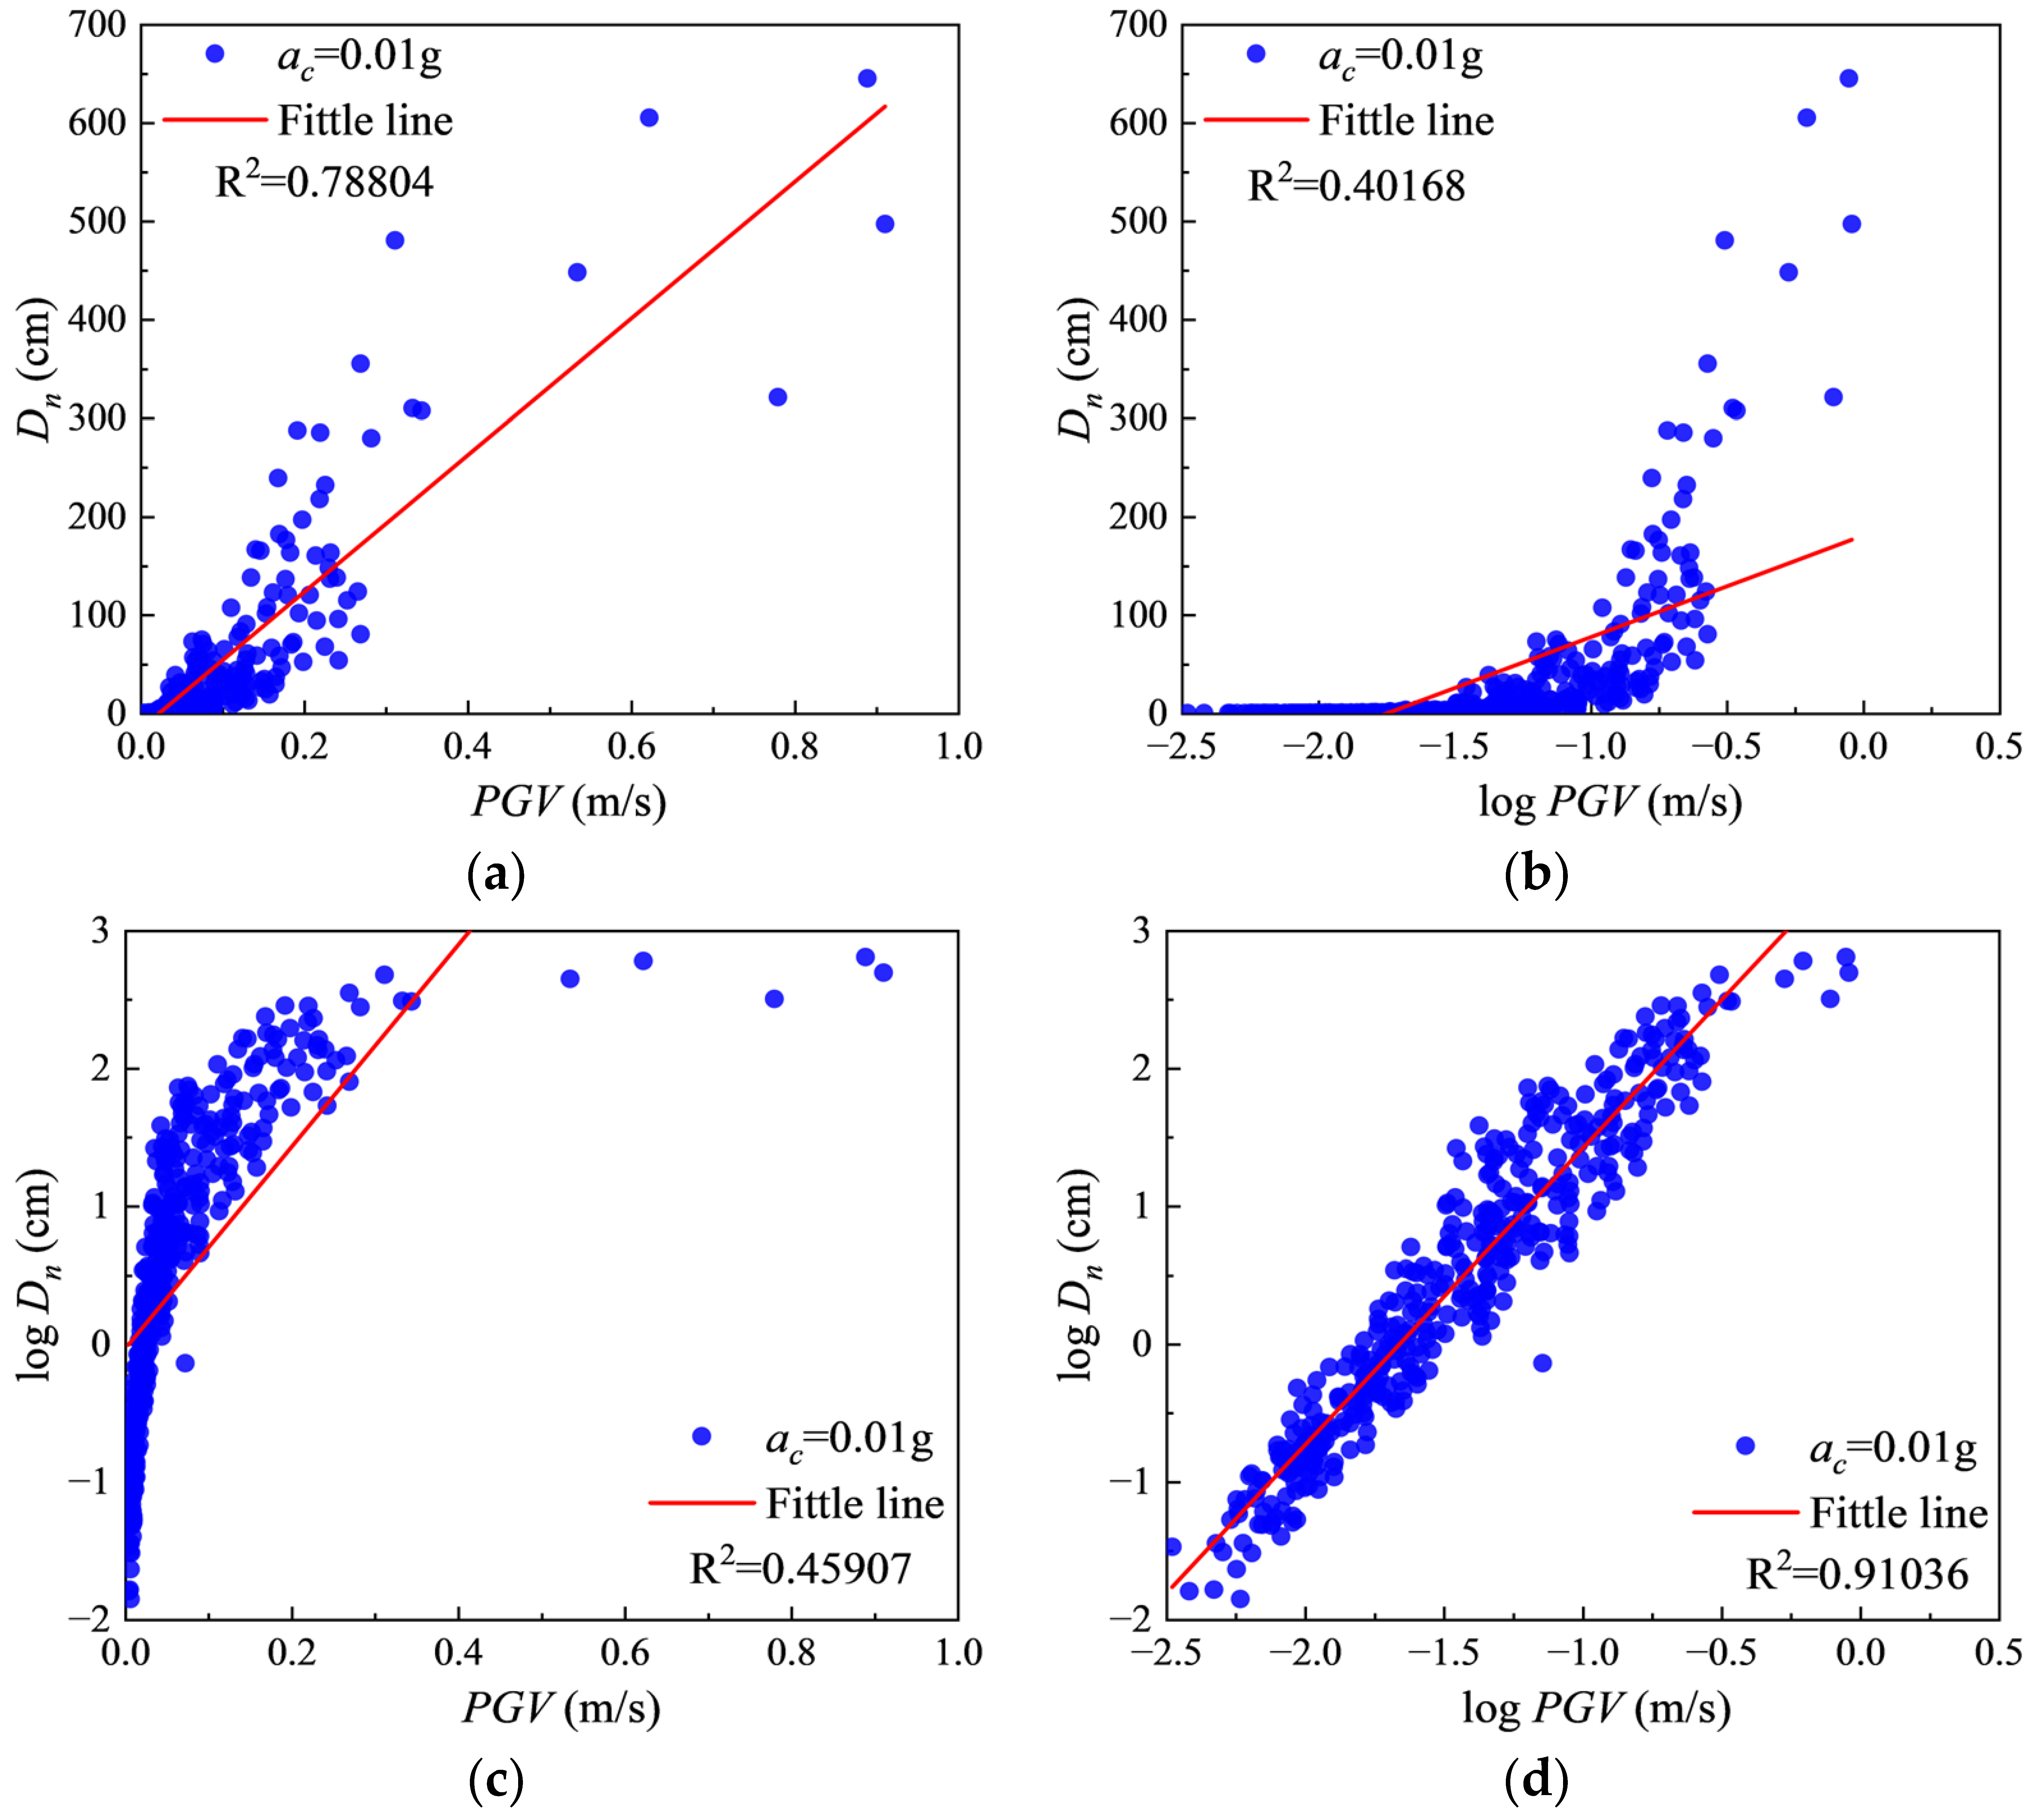
Figure 6 illustrates this analysis for a representative case of
ac = 0.01 g, comparing four relational forms. In logarithmic space (log PGV vs. log
Dn;
Figure 6d), a markedly superior and near-linear correlation was observed (R
2 = 0.91) compared to other forms (R
2 = 0.40–0.79). This clear log-linear trend indicates that
PGV is a governing parameter for predicting
Dn when both variables are log-transformed.
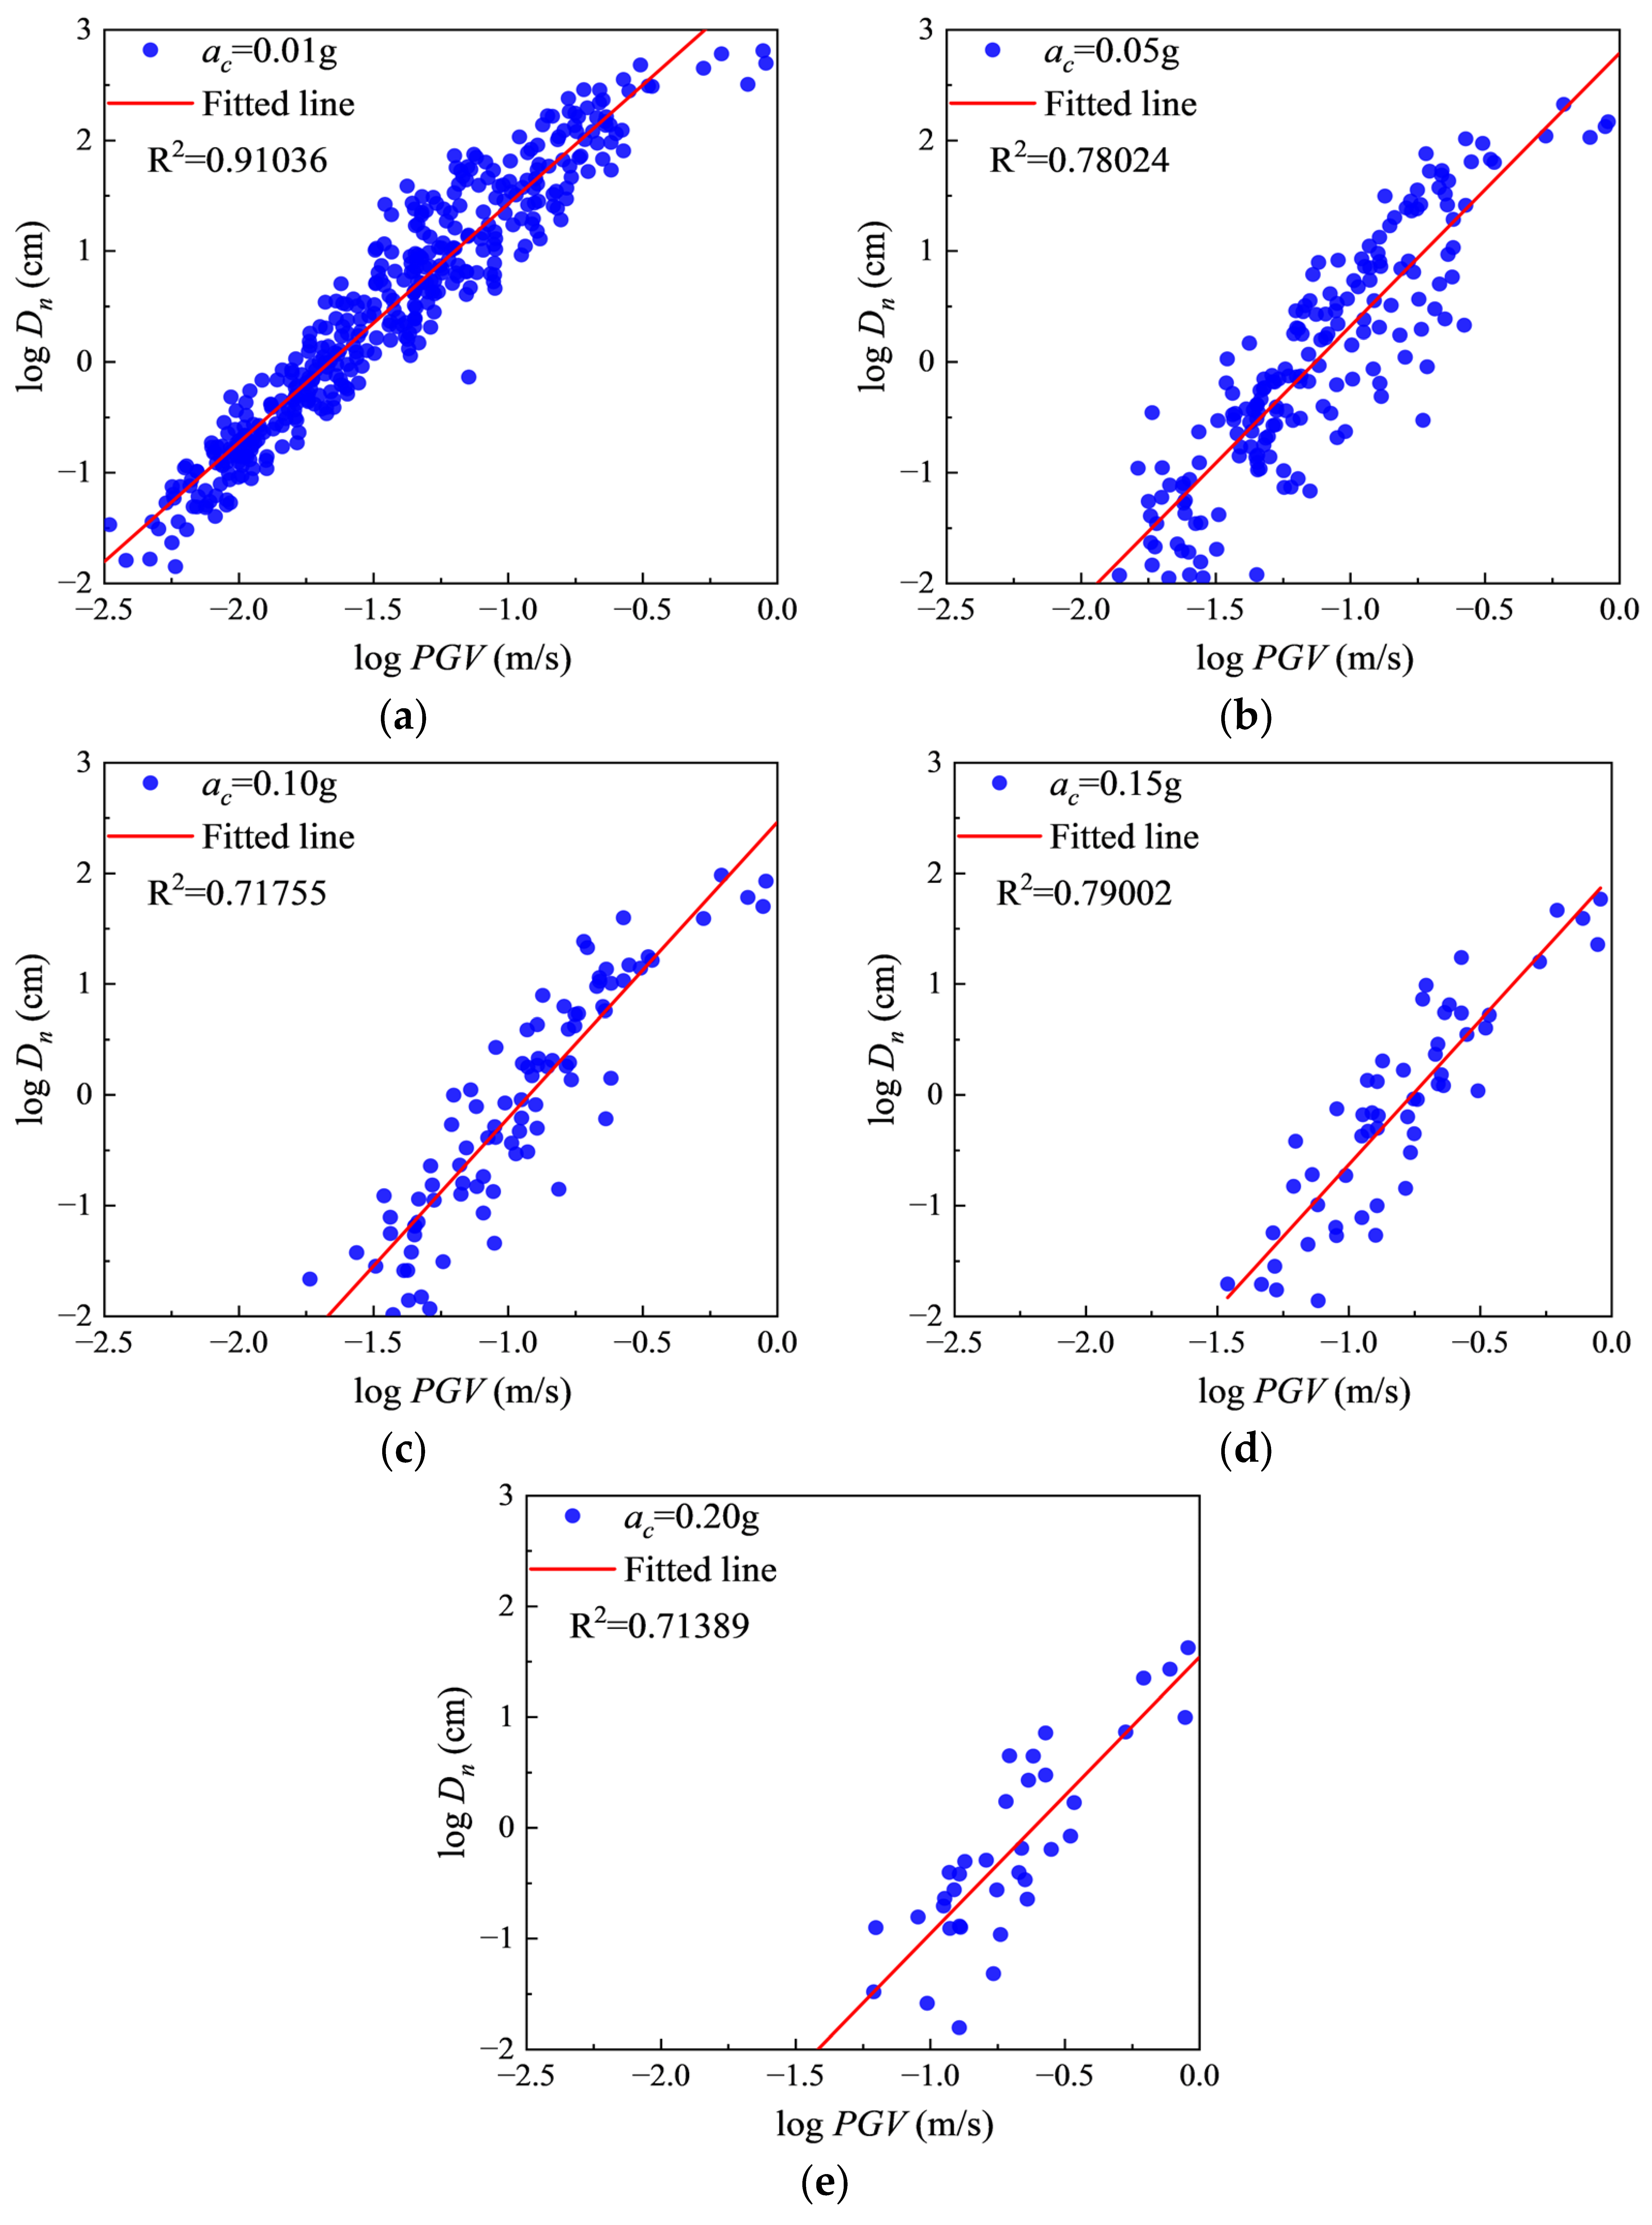
To validate the generality of this finding, we performed the same log-log linear fit across a spectrum of critical accelerations (
ac = 0.01 g to 0.40 g). As shown in
Figure 7, the results show that log
PGV and log
Dn maintain a clear linear correlation under different critical acceleration conditions. The coefficients of determination remain at a relatively high level overall, with an average value of 0.78. This consistent log-linear relationship between
PGV and
Dn across diverse stability conditions provides a compelling rationale for formally incorporating log
PGV as an additional predictive term in the Newmark model to enhance its performance.
Building upon the best-performing recalibrated model (Yiğit2020), we sought to further enhance predictive accuracy. Analysis revealed that peak ground velocity (PGV) exhibits a strong, stable correlation with Newmark displacement (Dn) in logarithmic space across varying critical acceleration (ac) levels, a relationship not fully utilized in existing models.
Based on the recalibrated Yiğit2020 model, this study introduced log
PGV as an additional term into the model structure. According to the correlation between log
PGV and log
Dn established above, the regression form of the displacement prediction model can be expressed as follows:
where
q denotes the coefficient and
p denotes the constant term. As shown by the comparison above, among the previously published Newmark displacement prediction models considered in this study, the recalibrated Yiğit2020 model performed best. Its regression form can be written as follows:
where
b,
c, and
d are coefficients, and
a is a constant term. Equations (1) and (2) were then combined to obtain Equation (3).
Equation (3) was fitted to the selected strong-motion dataset using multiple regression analysis, yielding Equation (4). The resulting model achieved a coefficient of determination (R
2) of 0.92 and a standard deviation (σ) of 0.30. To examine potential multicollinearity in the final model, the variance inflation factor (VIF) was calculated for log
Ia, log (1 −
ac/
PGA), log
ac and log
PGV. The corresponding VIF values are 3.84, 1.97, 3.11, and 3.99, respectively, all below the commonly used threshold of 5. This indicates that the final model contains some predictor correlation, but not severe multicollinearity. Therefore, no additional dimensionality reduction was applied in this study.
Although the proposed model is structurally derived from the recalibrated Yiğit2020 framework, its methodological novelty lies in more than the addition of one extra regression term. The new formulation is based on the identification of a stable log-linear relationship between PGV and Newmark displacement across different critical acceleration levels, indicating that velocity-related ground-motion characteristics are not fully captured in the existing form. By retaining the original physically interpretable structure while incorporating log PGV, the proposed model provides a better representation of cumulative displacement demand under seismic loading. Therefore, its advantage is reflected not only in improved fitting statistics, but also in enhanced residual stability, reduced relative error, and stronger applicability to regional coseismic landslide hazard assessment in Southwest China.
4. Model Validation
In the preceding sections, several displacement prediction models were introduced and analyzed. In this section, their reliability is further evaluated and compared through residual analysis using the validation set of strong-motion records selected in this study.
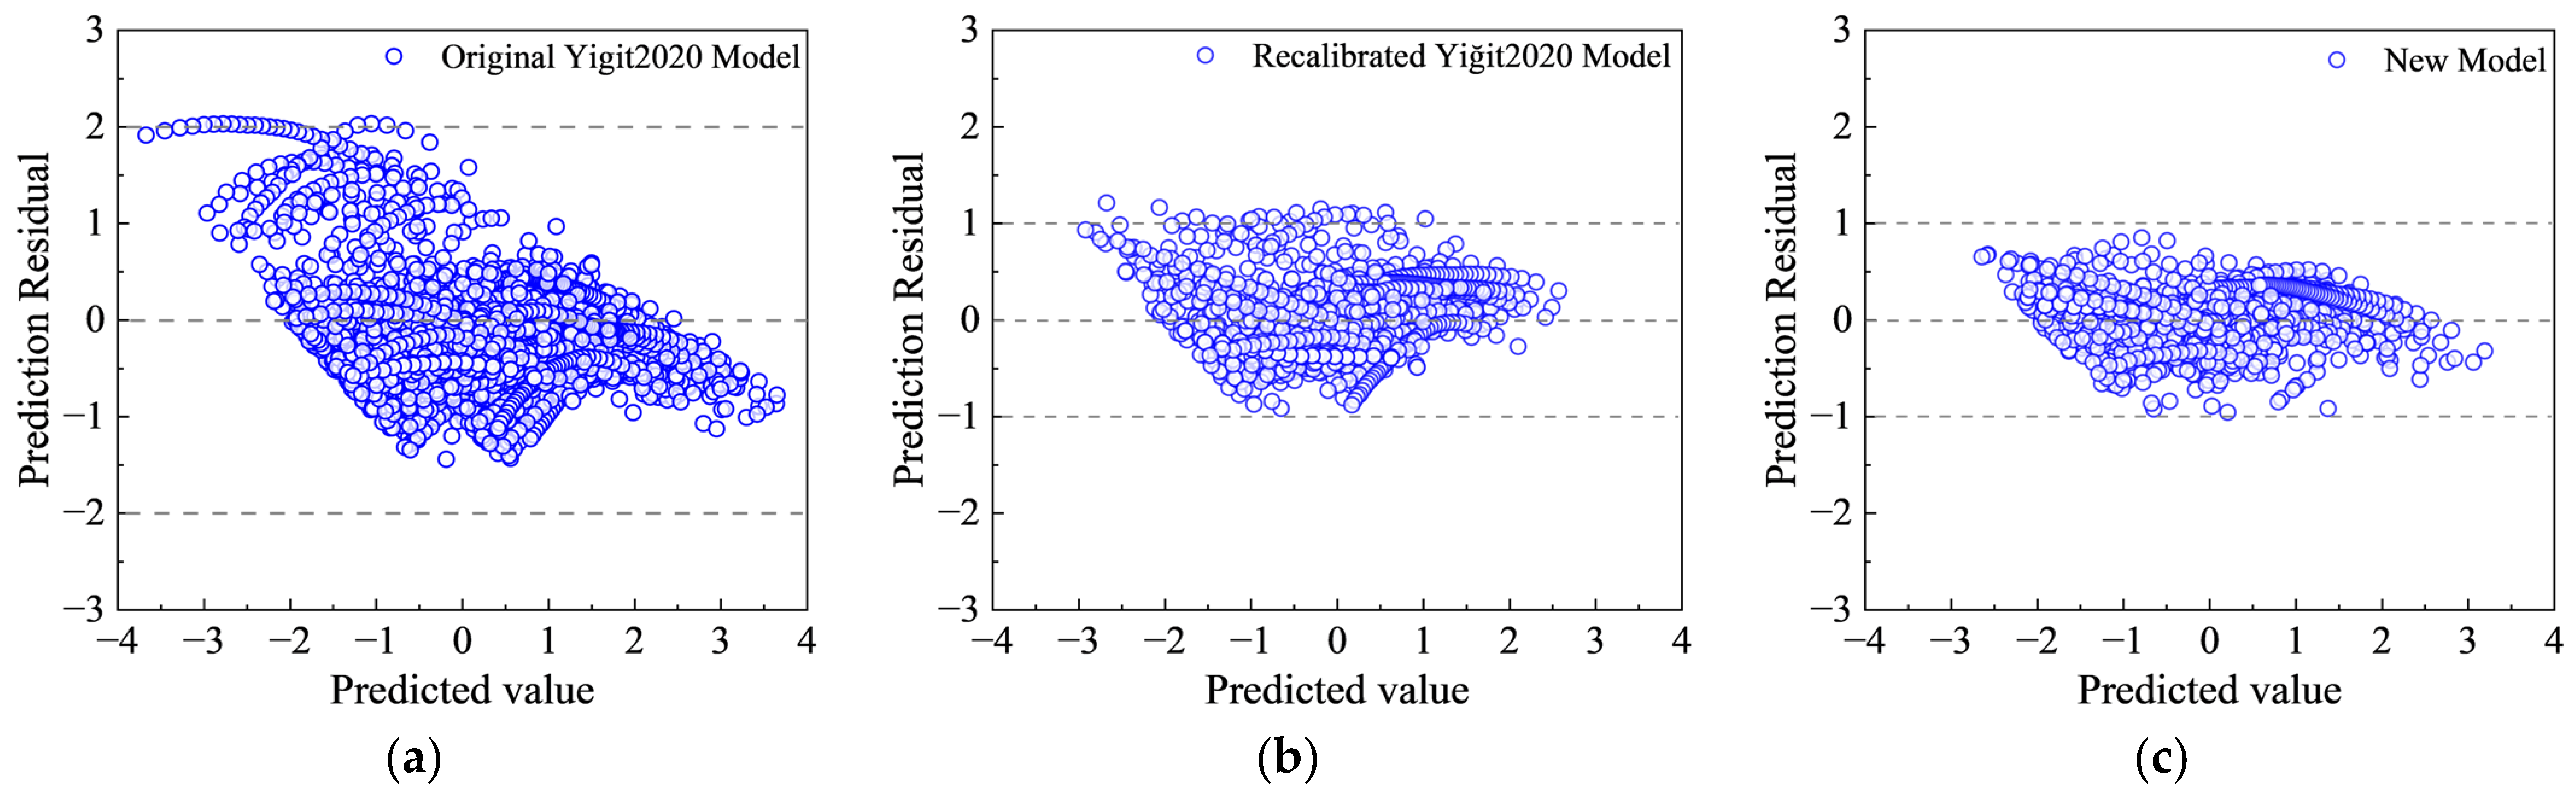
Figure 8a shows that the original Yiğit2020 model has a relatively wide residual range, approximately from −1.5 to 2.0, and displays a clear negative trend with increasing predicted value. Positive residuals dominate at low predicted values, whereas negative residuals become more common at high predicted values, indicating evident systematic bias. In
Figure 8b, the recalibrated Yiğit2020 model presents a narrower residual band, about −1.0 to 1.2, with most residuals distributed within ±0.8, suggesting that regional recalibration has substantially reduced the bias. In
Figure 8c, the new model exhibits the most compact residual distribution, with most points concentrated between −0.8 and 0.8 and a more symmetric pattern around zero. Overall, the residual distributions become progressively more concentrated from the original model to the recalibrated model and then to the new model, indicating a gradual improvement in predictive accuracy and stability.
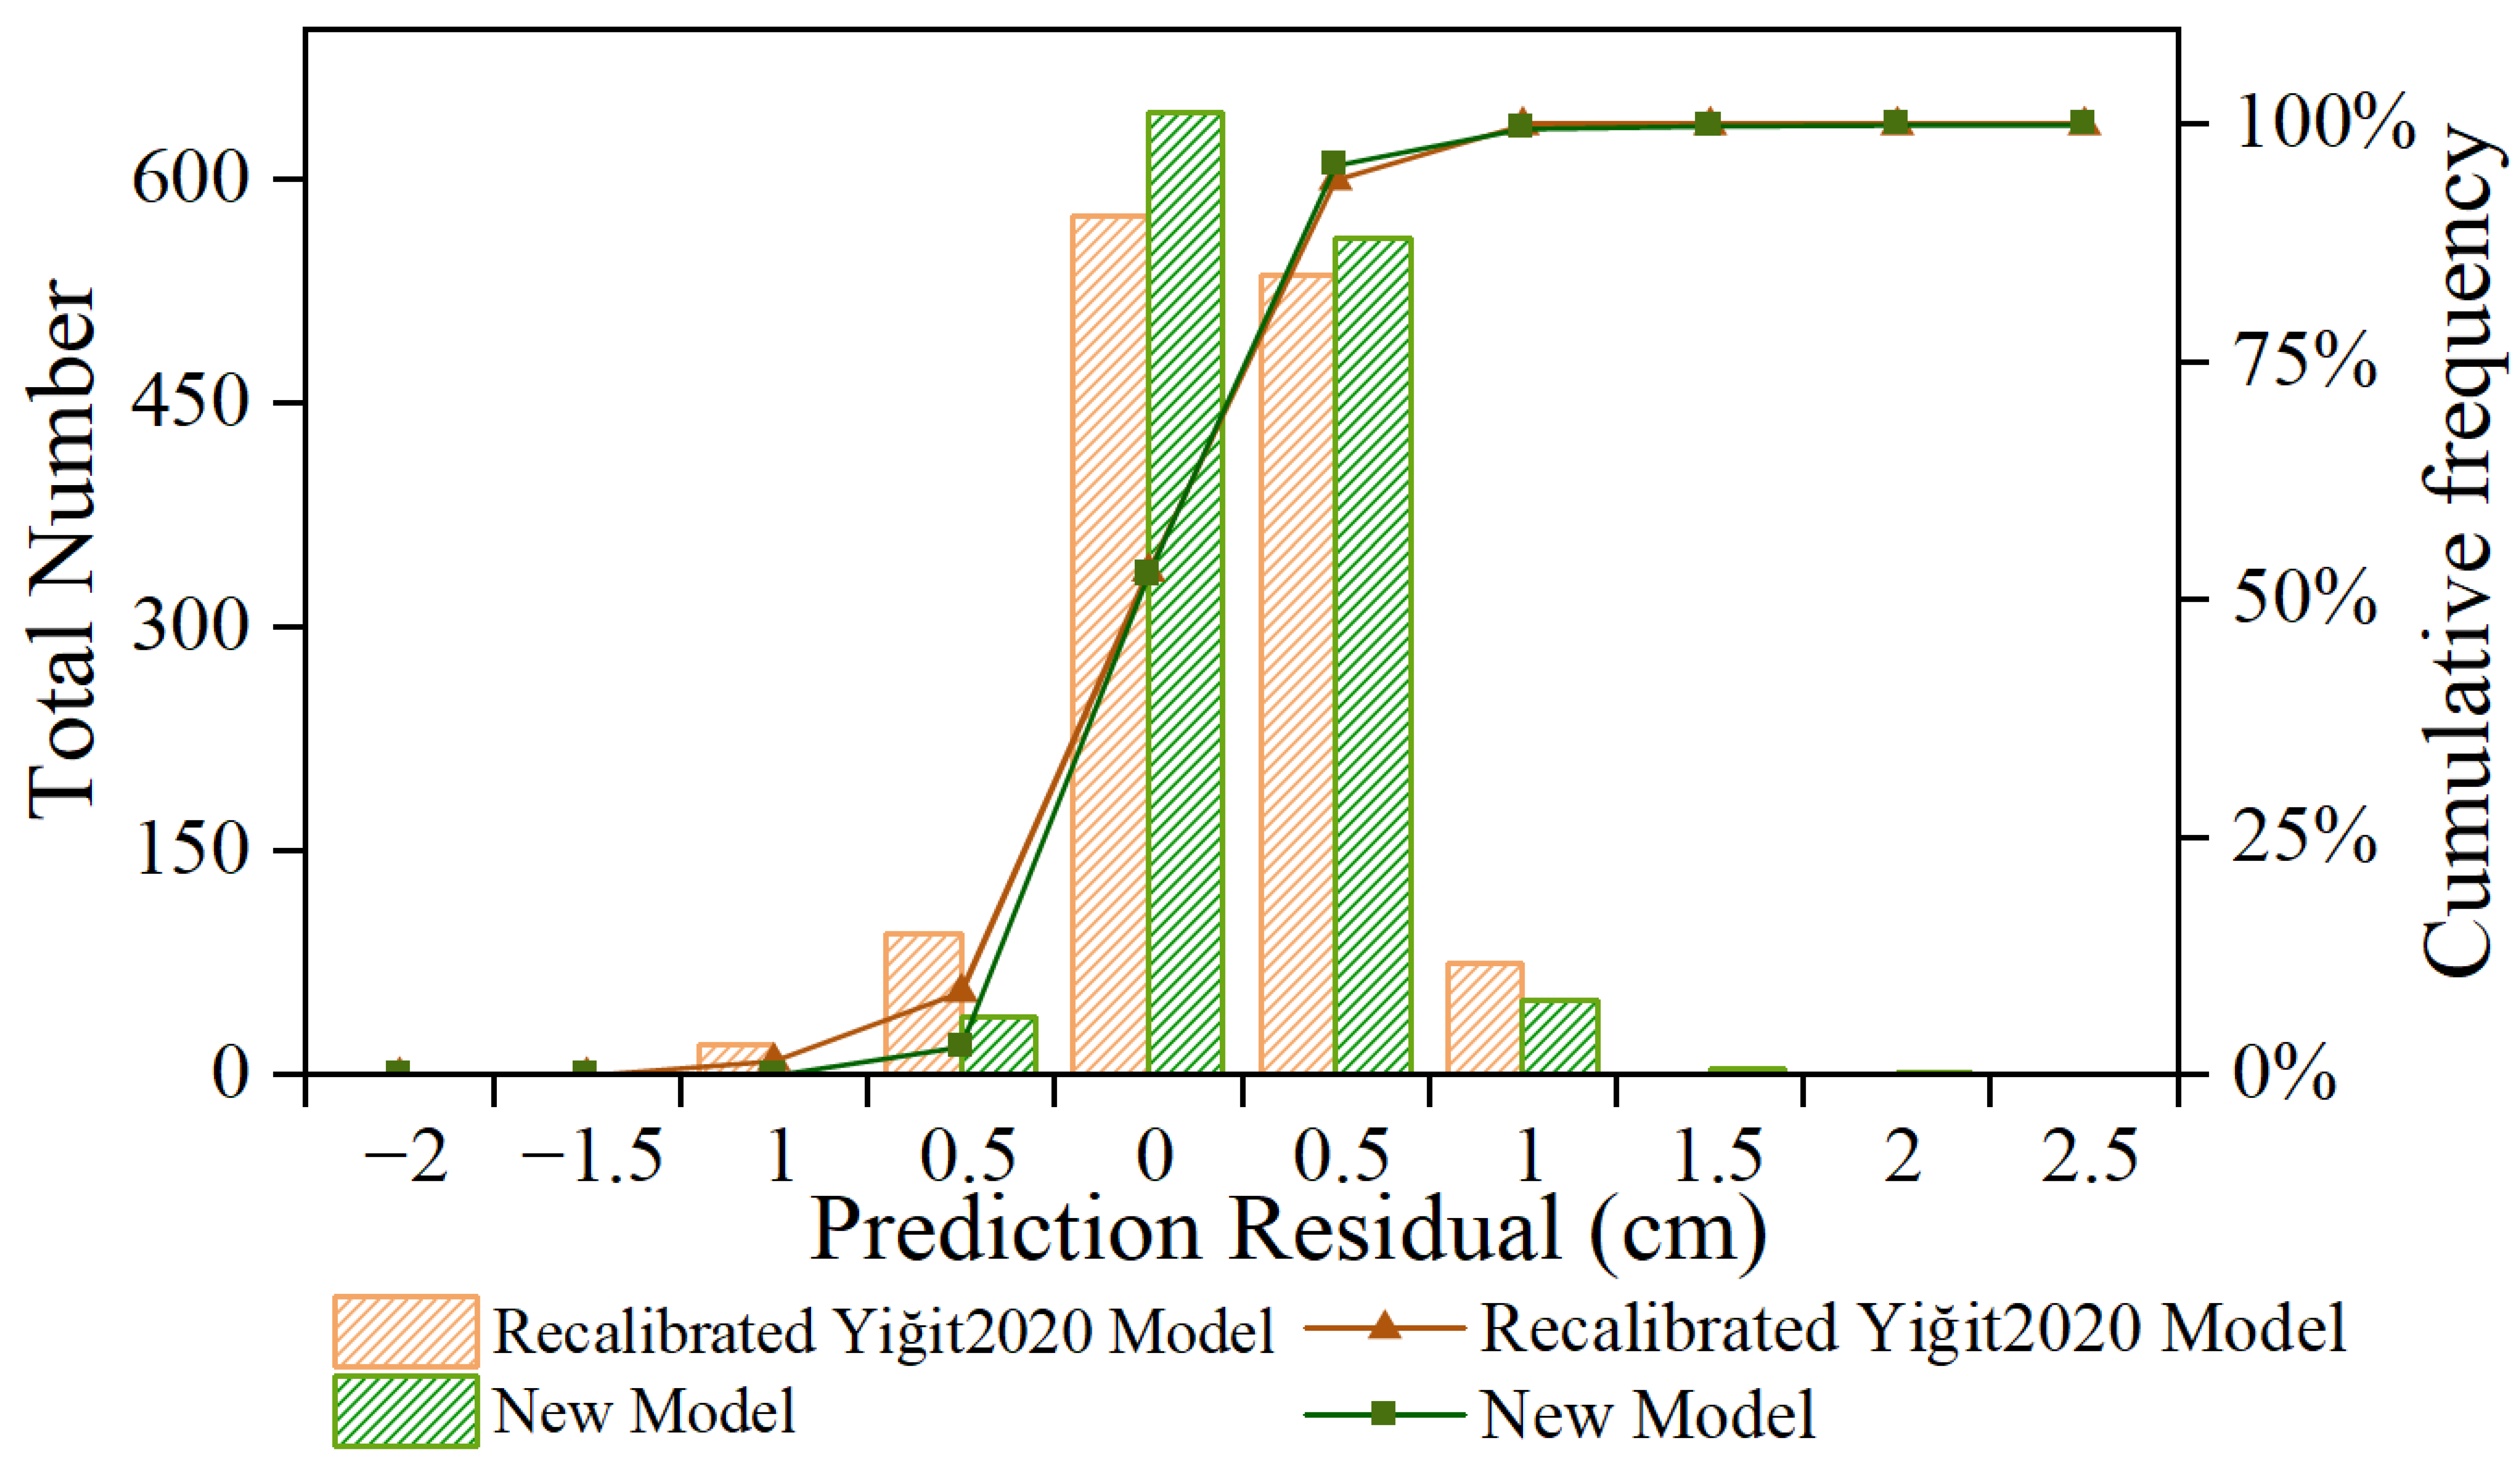
Figure 9 shows the frequency–cumulative frequency distributions of the logarithmic residuals for the recalibrated models and the new model.
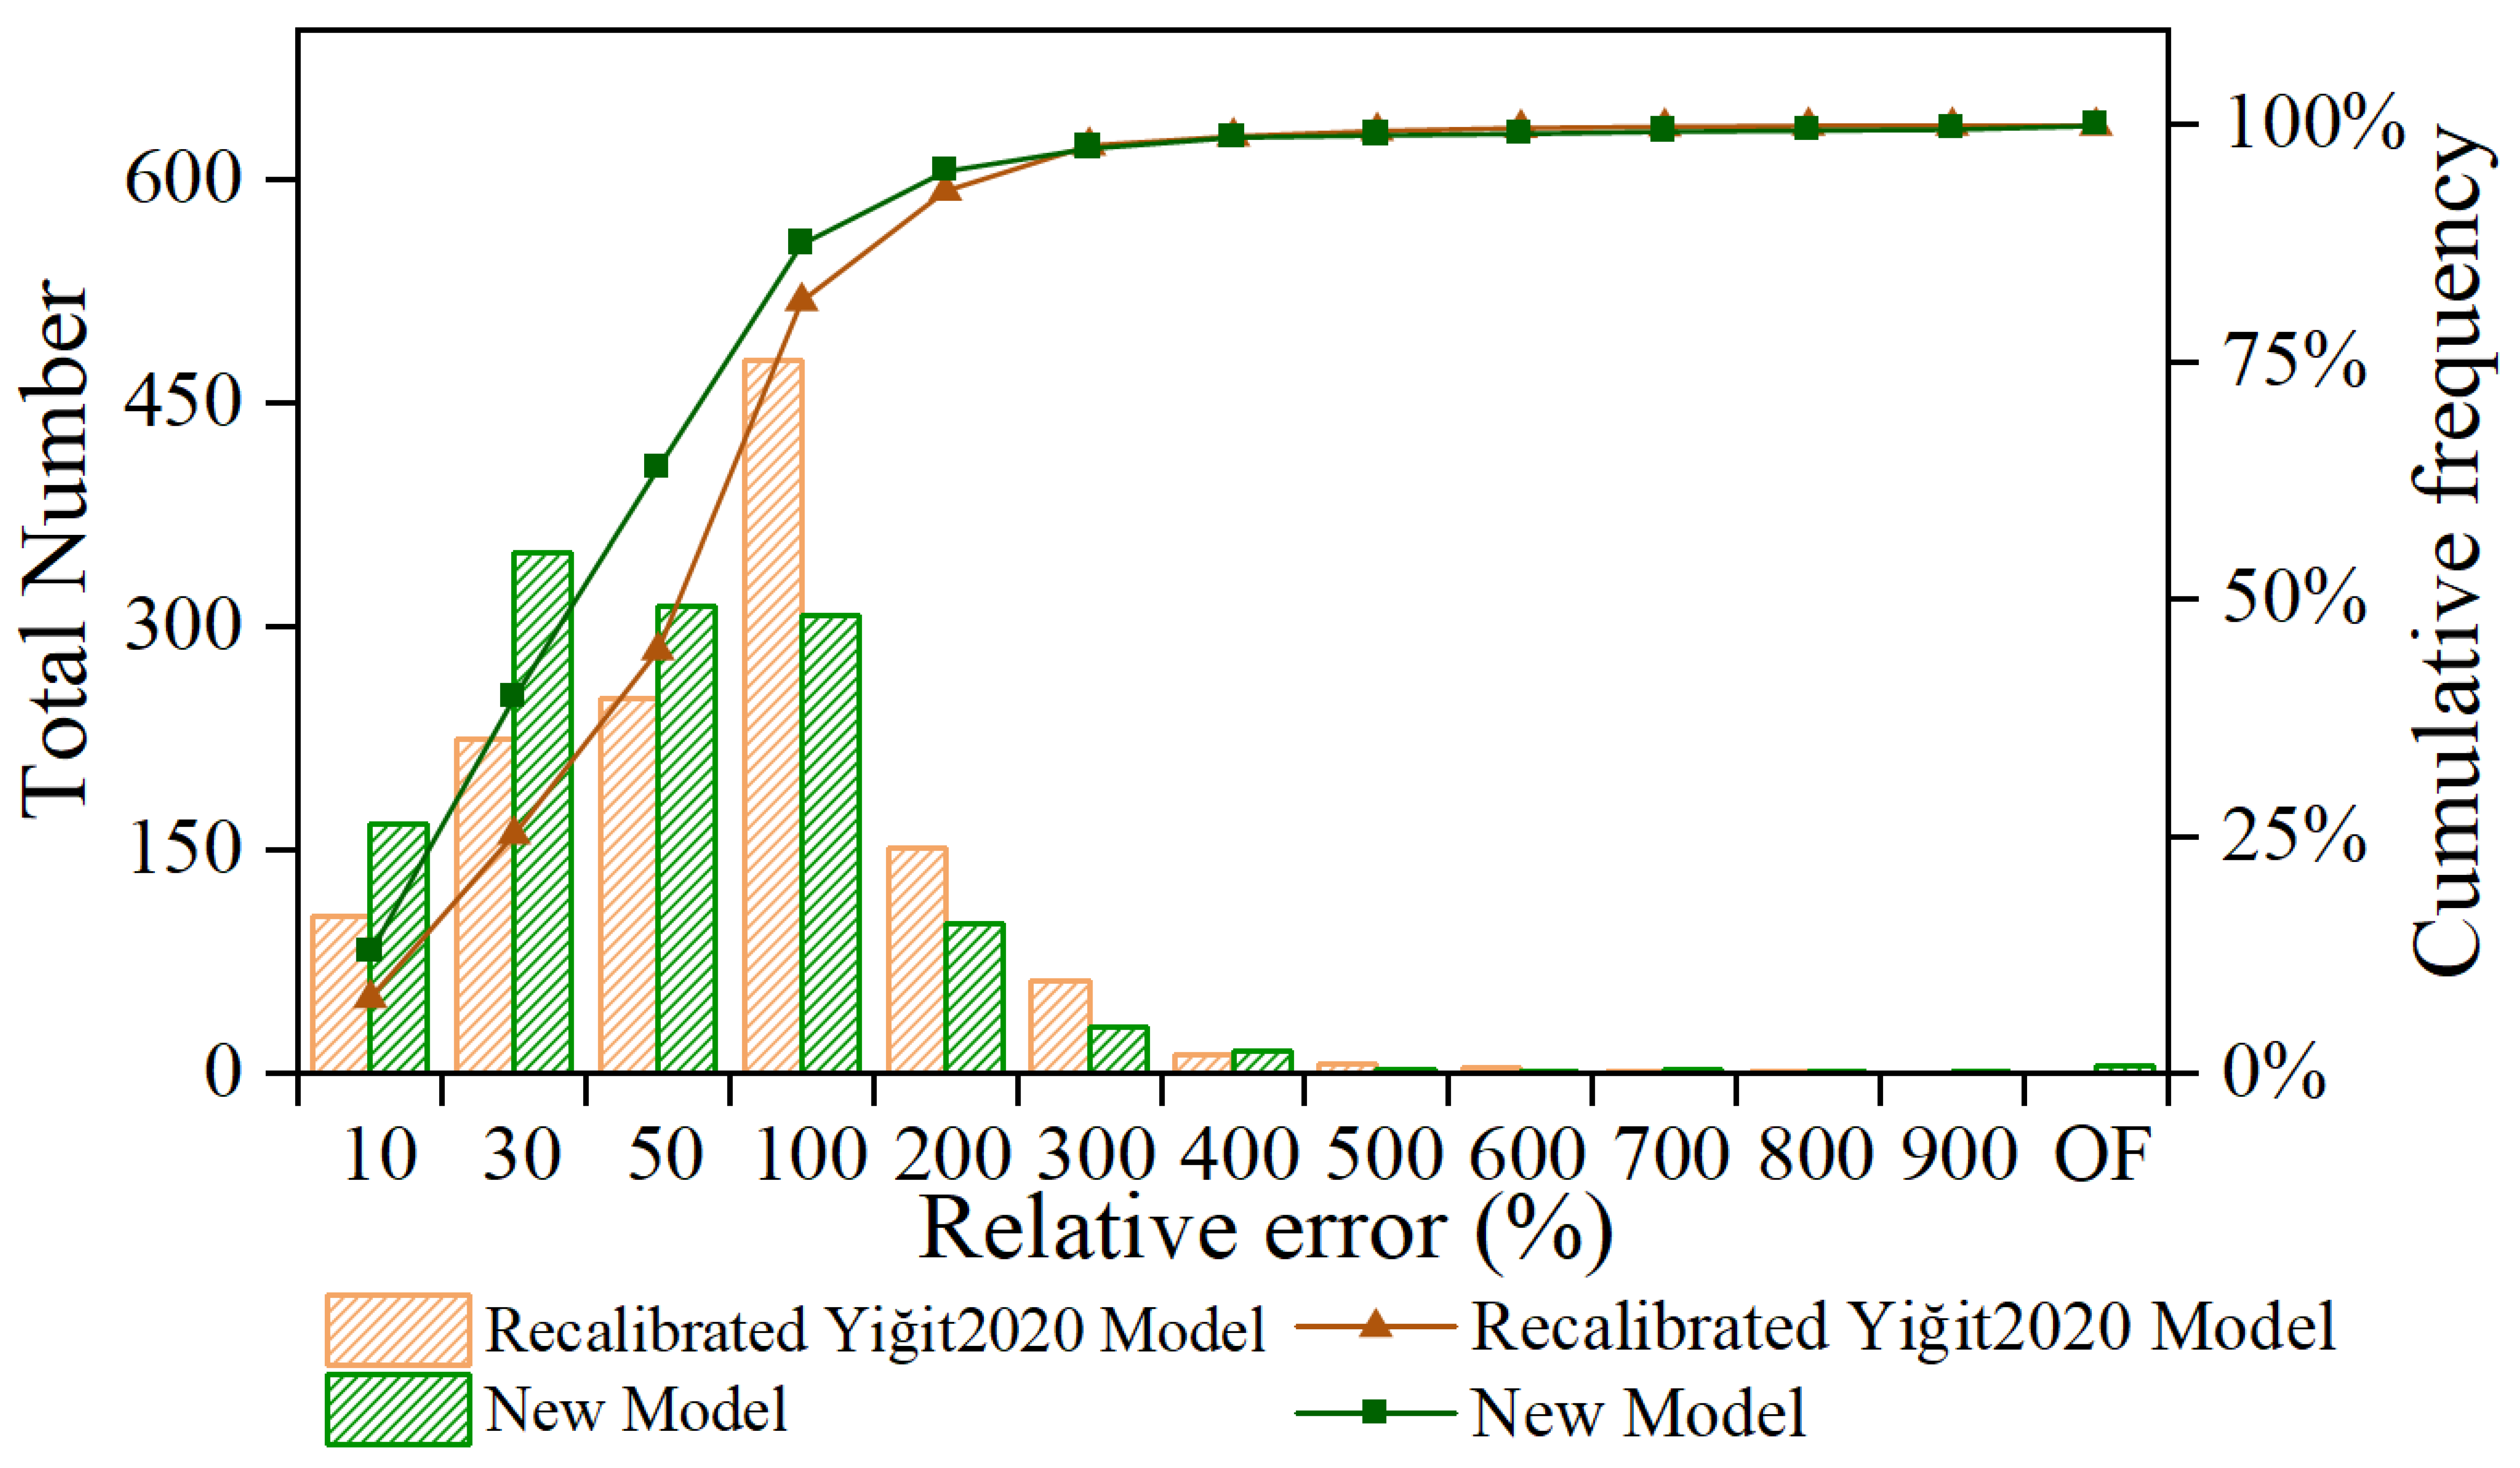
Figure 10 presents the frequency–cumulative frequency distributions of the relative errors for the same models. The relative error was calculated using Equation (5).
where
Dcalculated is the displacement calculated using the Newmark method, and
Dpredicted is the displacement estimated by the prediction model. It should be noted that when
Dcalculated is very small, the relative error may be disproportionately amplified because of the small denominator. Therefore, this metric reflects not only prediction deviation, but also its sensitivity to small-displacement samples. In this study, samples with
Dn < 0.01 cm were excluded to reduce this effect.
Combined with
Figure 9 and
Figure 10 and
Table 4, the new model shows a clear improvement over the recalibrated Yiğit2020 model on the validation set. In terms of logarithmic residuals, the residual distribution of the new model is more concentrated around zero, with a residual standard deviation of 0.30, indicating lower dispersion and a more stable error structure. This advantage is also reflected in the proportion of low-residual samples: 92.76% of the samples for the new model satisfy |Residual| ≤ 0.5, compared with 85.45% for the recalibrated Yiğit2020 model, while the proportions satisfying |Residual| ≤ 1.0 are 99.62% and 98.46%, respectively. Consistently, the cumulative frequency curve of the new model rises more rapidly, indicating that its residuals are more strongly concentrated in the near-zero interval.
The comparison of relative error metrics further supports the superiority of the new model, although these metrics should be interpreted with caution because relative error can be amplified when
Dcalculated is very small. The mean relative error and median relative error decrease from 74.22% and 53.83% for the recalibrated Yiğit2020 model to 66.43% and 38.90% for the new model, respectively. Although a mean relative error of 66.43% should not be interpreted as high-precision prediction, this level of error is within a reasonable range for regional-scale empirical Newmark-based assessment, where prediction uncertainty is commonly substantial. Previous studies have shown that regression-based Newmark displacement models often exhibit considerable intrinsic scatter; for example, Jibson [
20] reported standard deviations of about 0.5 log units, while later uncertainty analyses suggested that model uncertainty generally remains on the order of 0.4–1.0 in log space even for multi-parameter formulations. Therefore, the present result is better understood as a moderate but meaningful error level at the regional scale, rather than as site-specific predictive precision. Meanwhile, the proportions of samples with relatively small errors are markedly higher for the new model, with 12.86%, 39.72%, 63.90%, and 87.53% of the samples satisfying RE ≤ 10%, RE ≤ 30%, RE ≤ 50%, and RE ≤ 100%, respectively, compared with 8.08%, 25.33%, 44.73%, and 81.52% for the recalibrated Yiğit2020 model. These results indicate that the new model not only reduces overall error levels, but also substantially increases the proportion of samples with relatively accurate predictions.
Overall, although the recalibrated Yiğit2020 model already improves the predictive capability after recalibration, the new model performs better in both residual concentration and relative error distribution. Therefore, from the perspectives of residual structure, error dispersion, and the proportion of low-error samples, the new model provides more accurate and robust predictions than the recalibrated Yiğit2020 model.
5. Coseismic Landslide Hazard Assessment and Validation in the Luding Earthquake Area
As described in the preceding sections, a new Newmark displacement prediction model was developed using strong-motion records from the mountainous regions of Southwest China. To further evaluate its regional applicability, this section applies the model to the 2022 Luding Ms 6.8 earthquake as a representative case study. This case study provides an independent assessment of model utility for hazard zonation, especially for a recent event for which a high-quality landslide inventory is available.
5.1. Overview of the Luding Earthquake
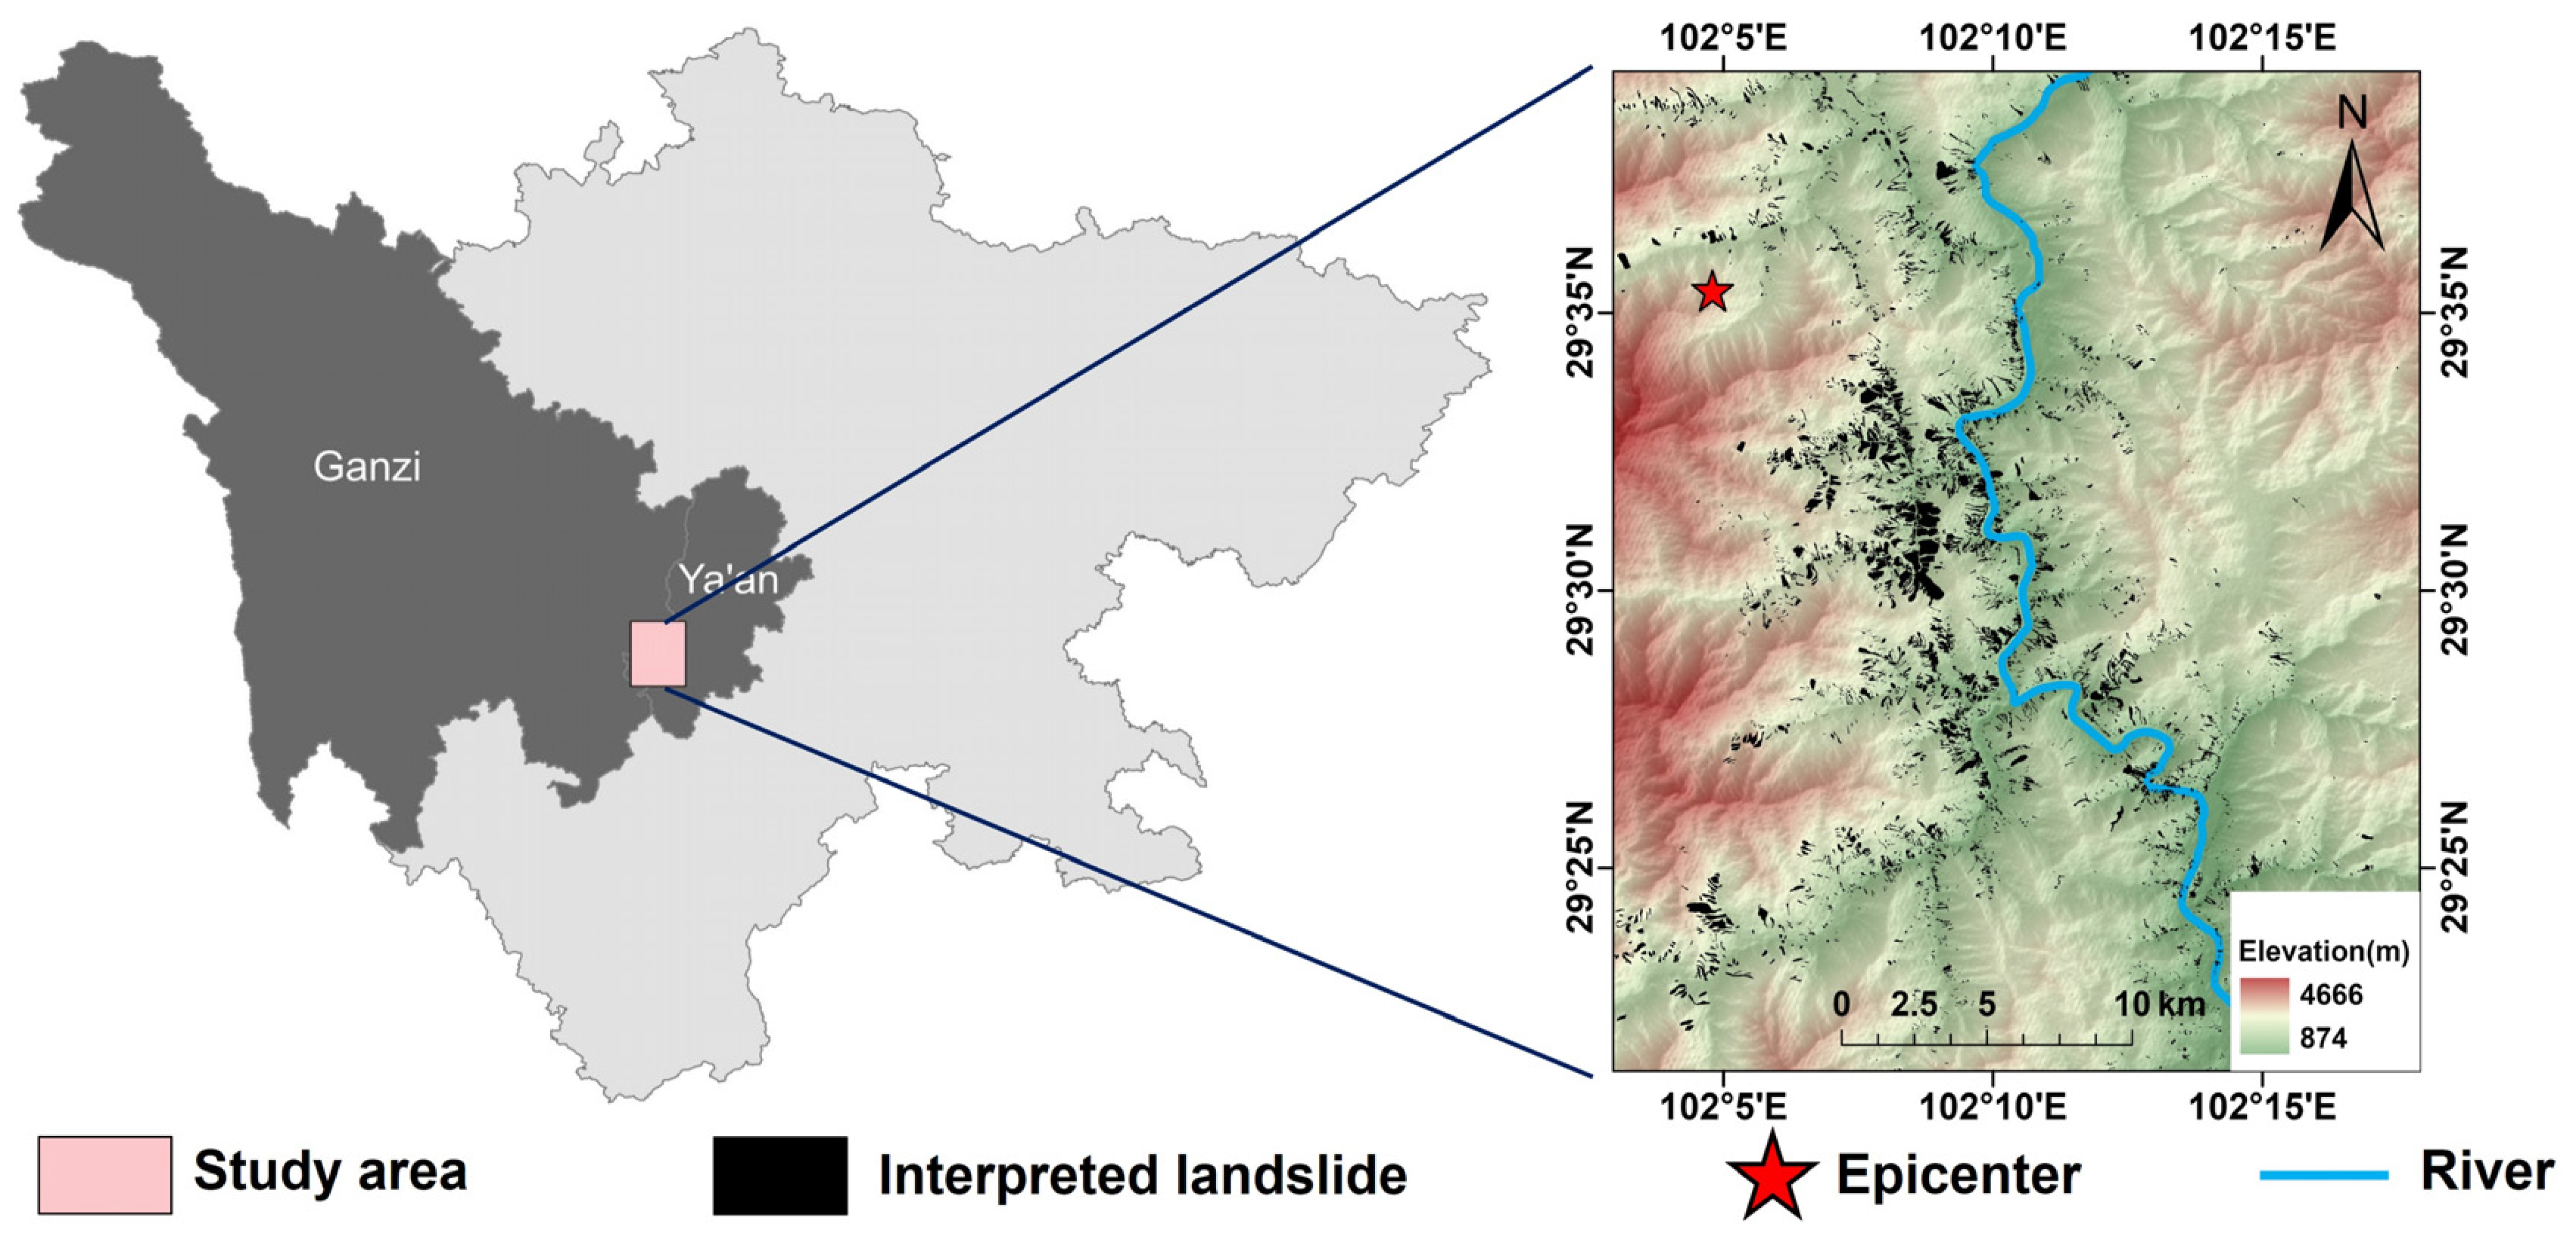
At 12:52 on 5 September 2022, an Ms 6.8 earthquake struck Luding County, Ganzi Prefecture, Sichuan Province. The earthquake had a focal depth of 16 km and reached a maximum intensity of IX. According to the China Earthquake Networks Center, the epicenter was located near Hailuogou Glacier Forest Park in Moxi Town (29.59° N, 102.08° E). Field investigations indicate that the earthquake triggered a large number of landslides in the affected area. These landslides damaged houses and roads and caused severe casualties and economic losses [
33].
5.2. Newmark Model Parameters and Ground-Motion Input
The study area is located at the boundary between Ganzi Prefecture and Ya’an City in western Sichuan Province. It covers approximately 964.8 km
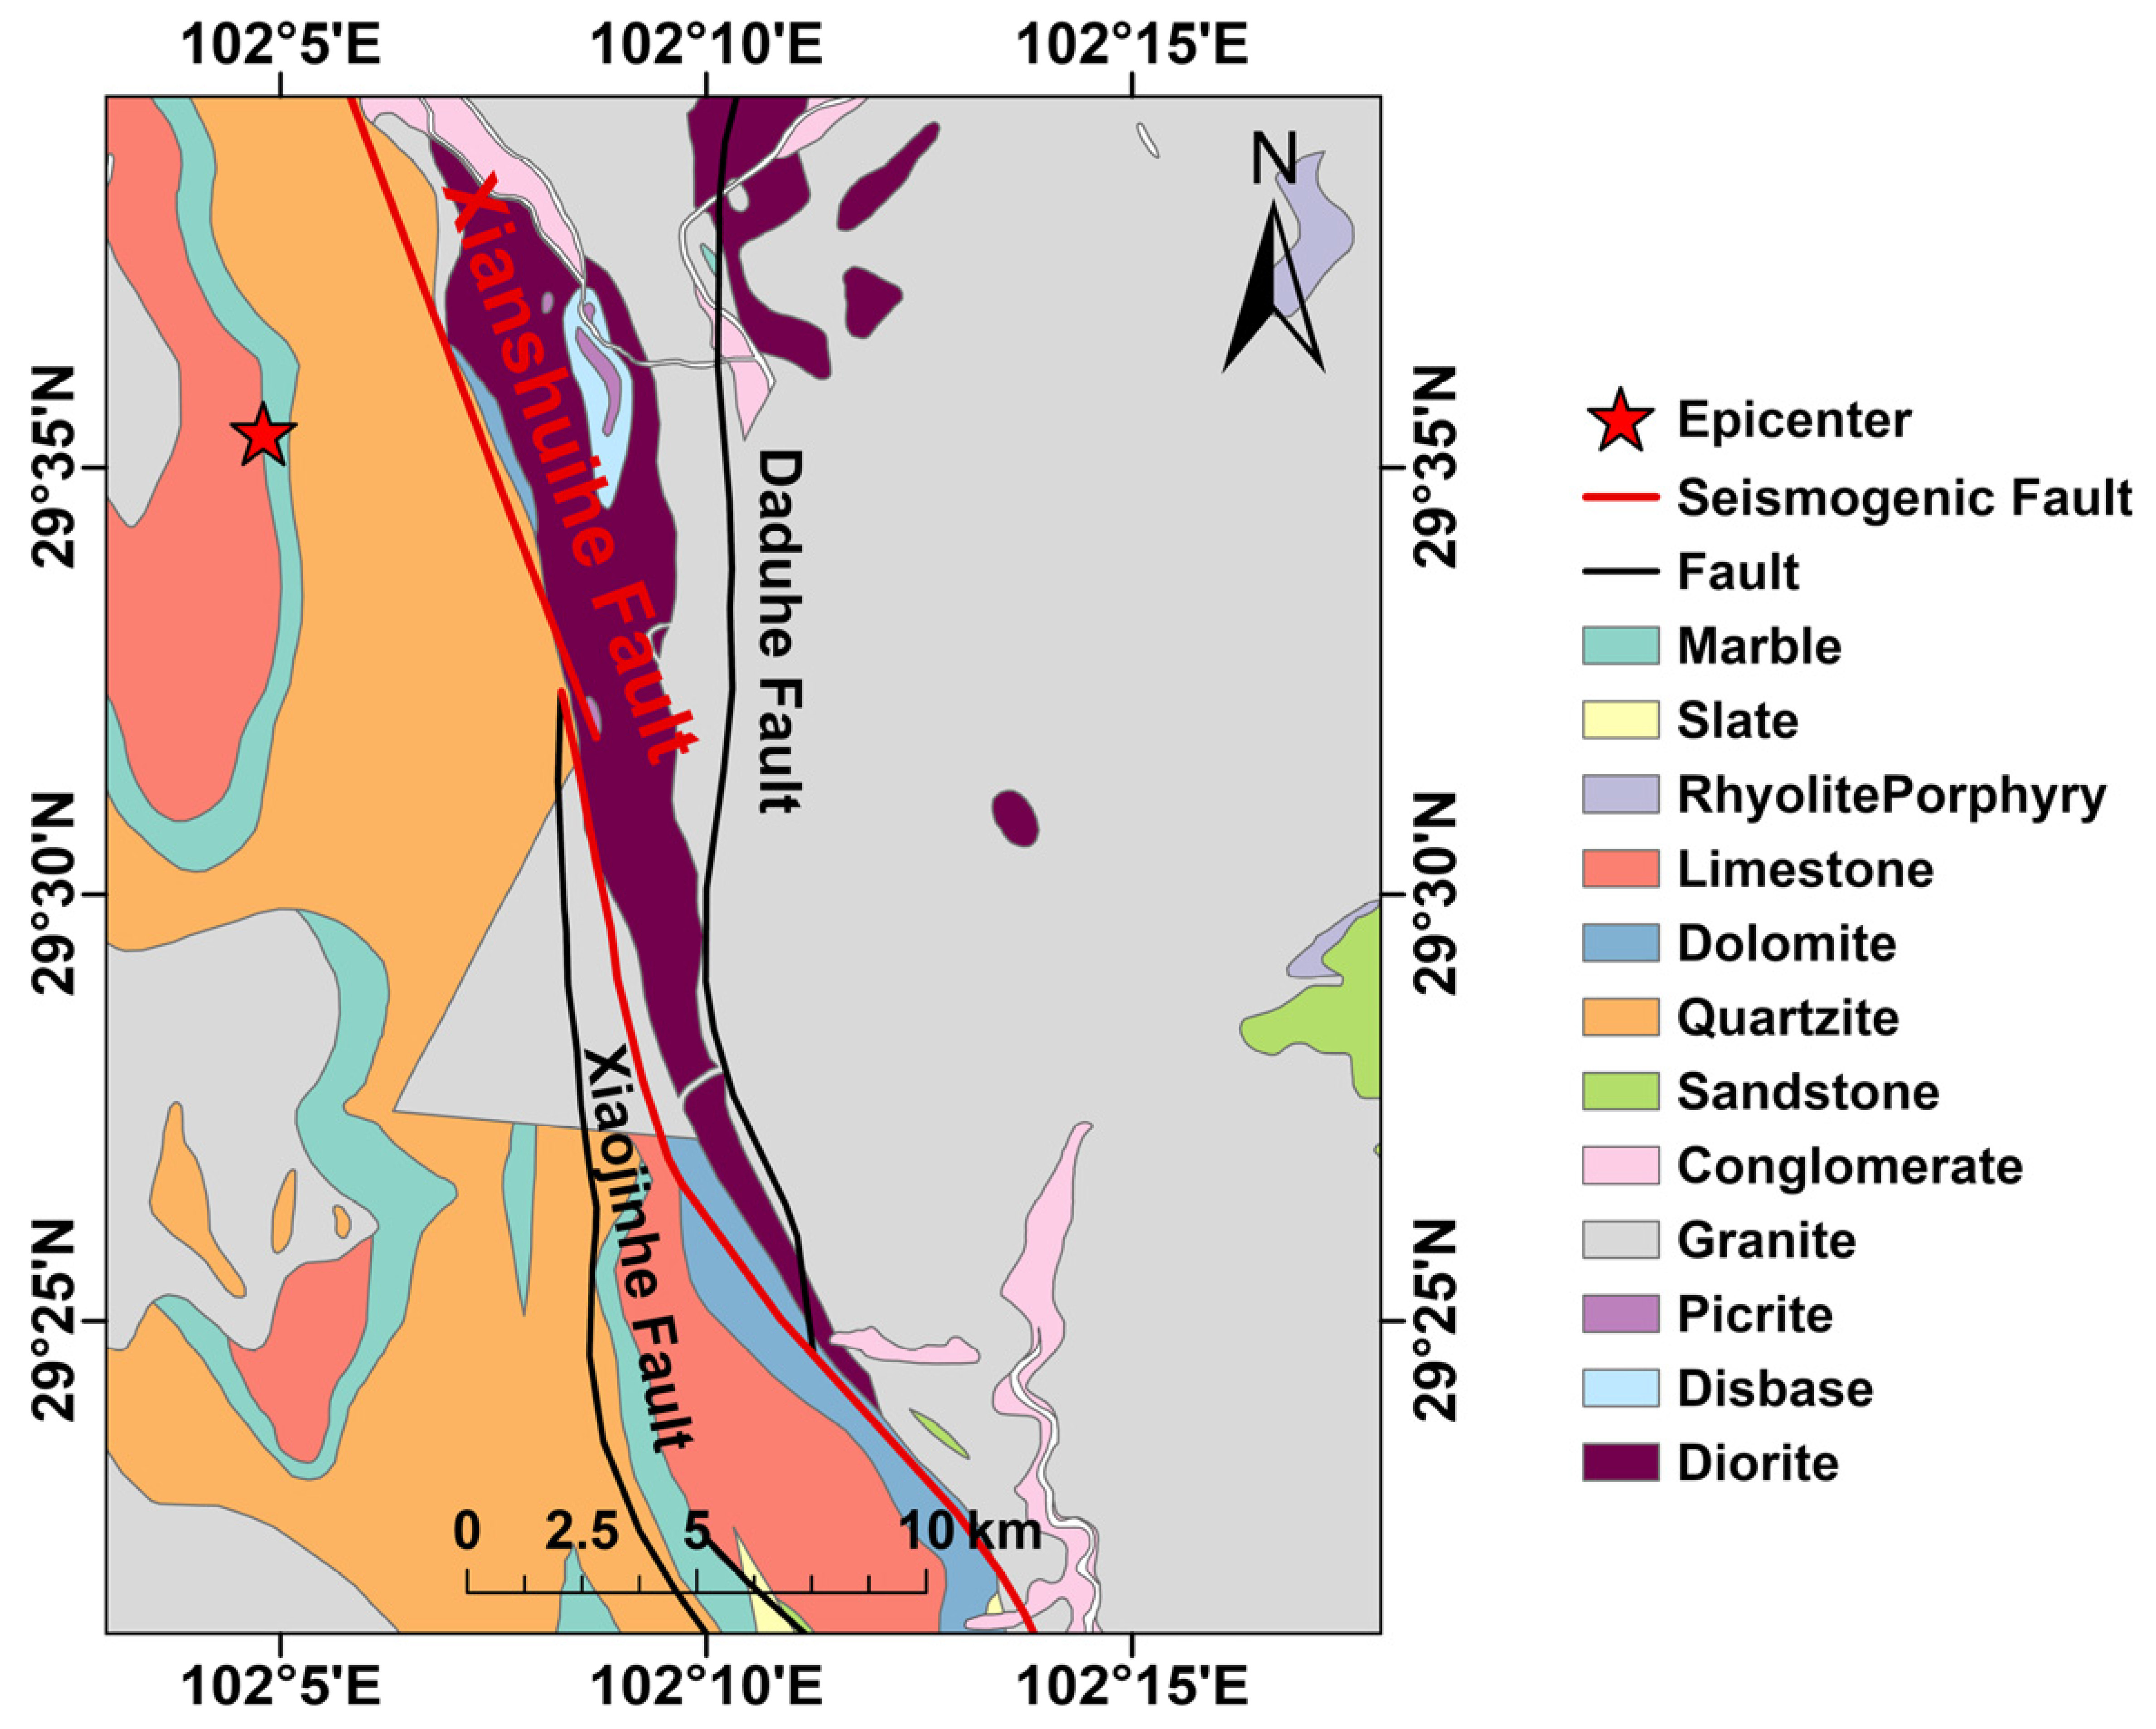
2 and includes the epicenter, the seismogenic fault, and most of the landslides triggered by the 2022 Luding earthquake, as shown in
Figure 11.
The strata exposed in the study area span a wide range of geological ages, from the Paleoproterozoic to the Mesozoic. The seismogenic fault of this earthquake is the Moxi segment at the southern end of the Xianshuihe Fault Zone. The engineering geological rock–soil units and fault distribution in the study area are shown in
Figure 12.
In this study, several key aspects were kept consistent with those reported in Reference [
34]. These include the extent of the study area and its topographic characteristics. The physical and mechanical parameters of the rock and soil masses were directly adopted from the published values, as summarized in
Table 5. Peak ground acceleration (
PGA) and Arias intensity (
Ia) were derived using the same data sources and processing procedures as those used in Reference [
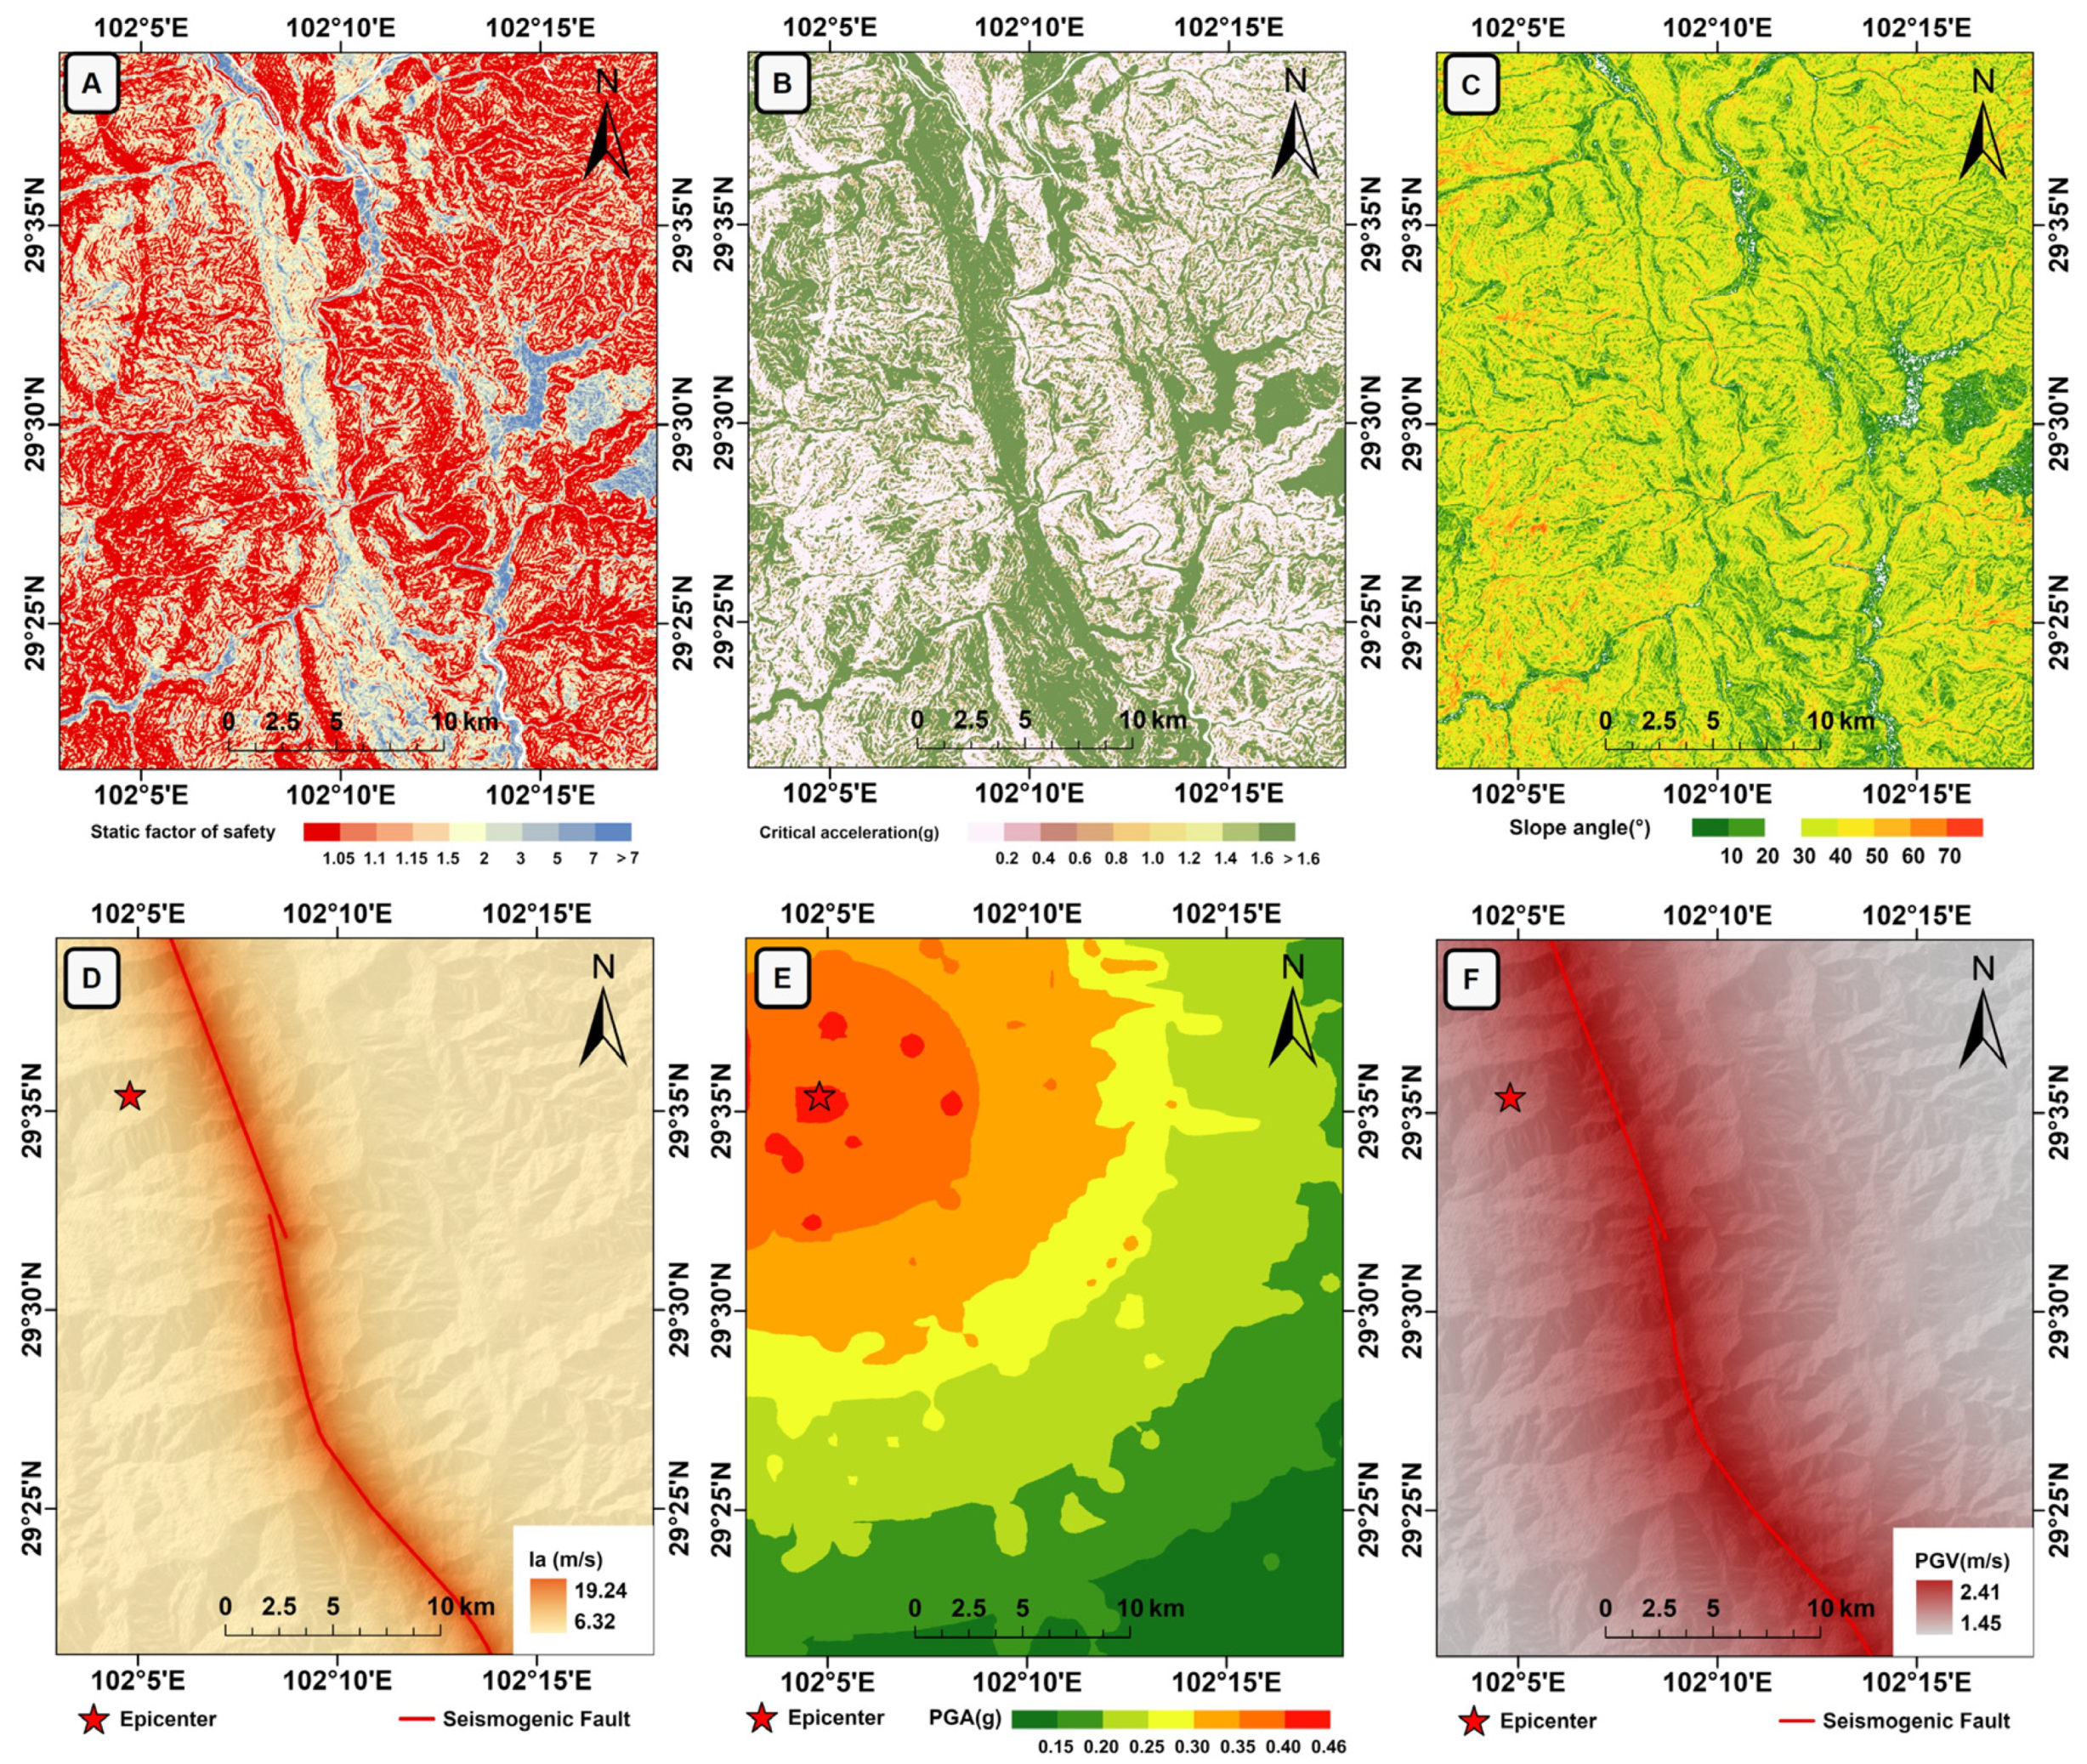
34]. In addition, the static safety factor and critical acceleration maps were produced following the parameter settings and computational workflow described in that study.
Figure 13 shows the spatial distributions of the main parameters used in the regional analysis.
5.3. Regional Analysis of Coseismic Landslide Displacement
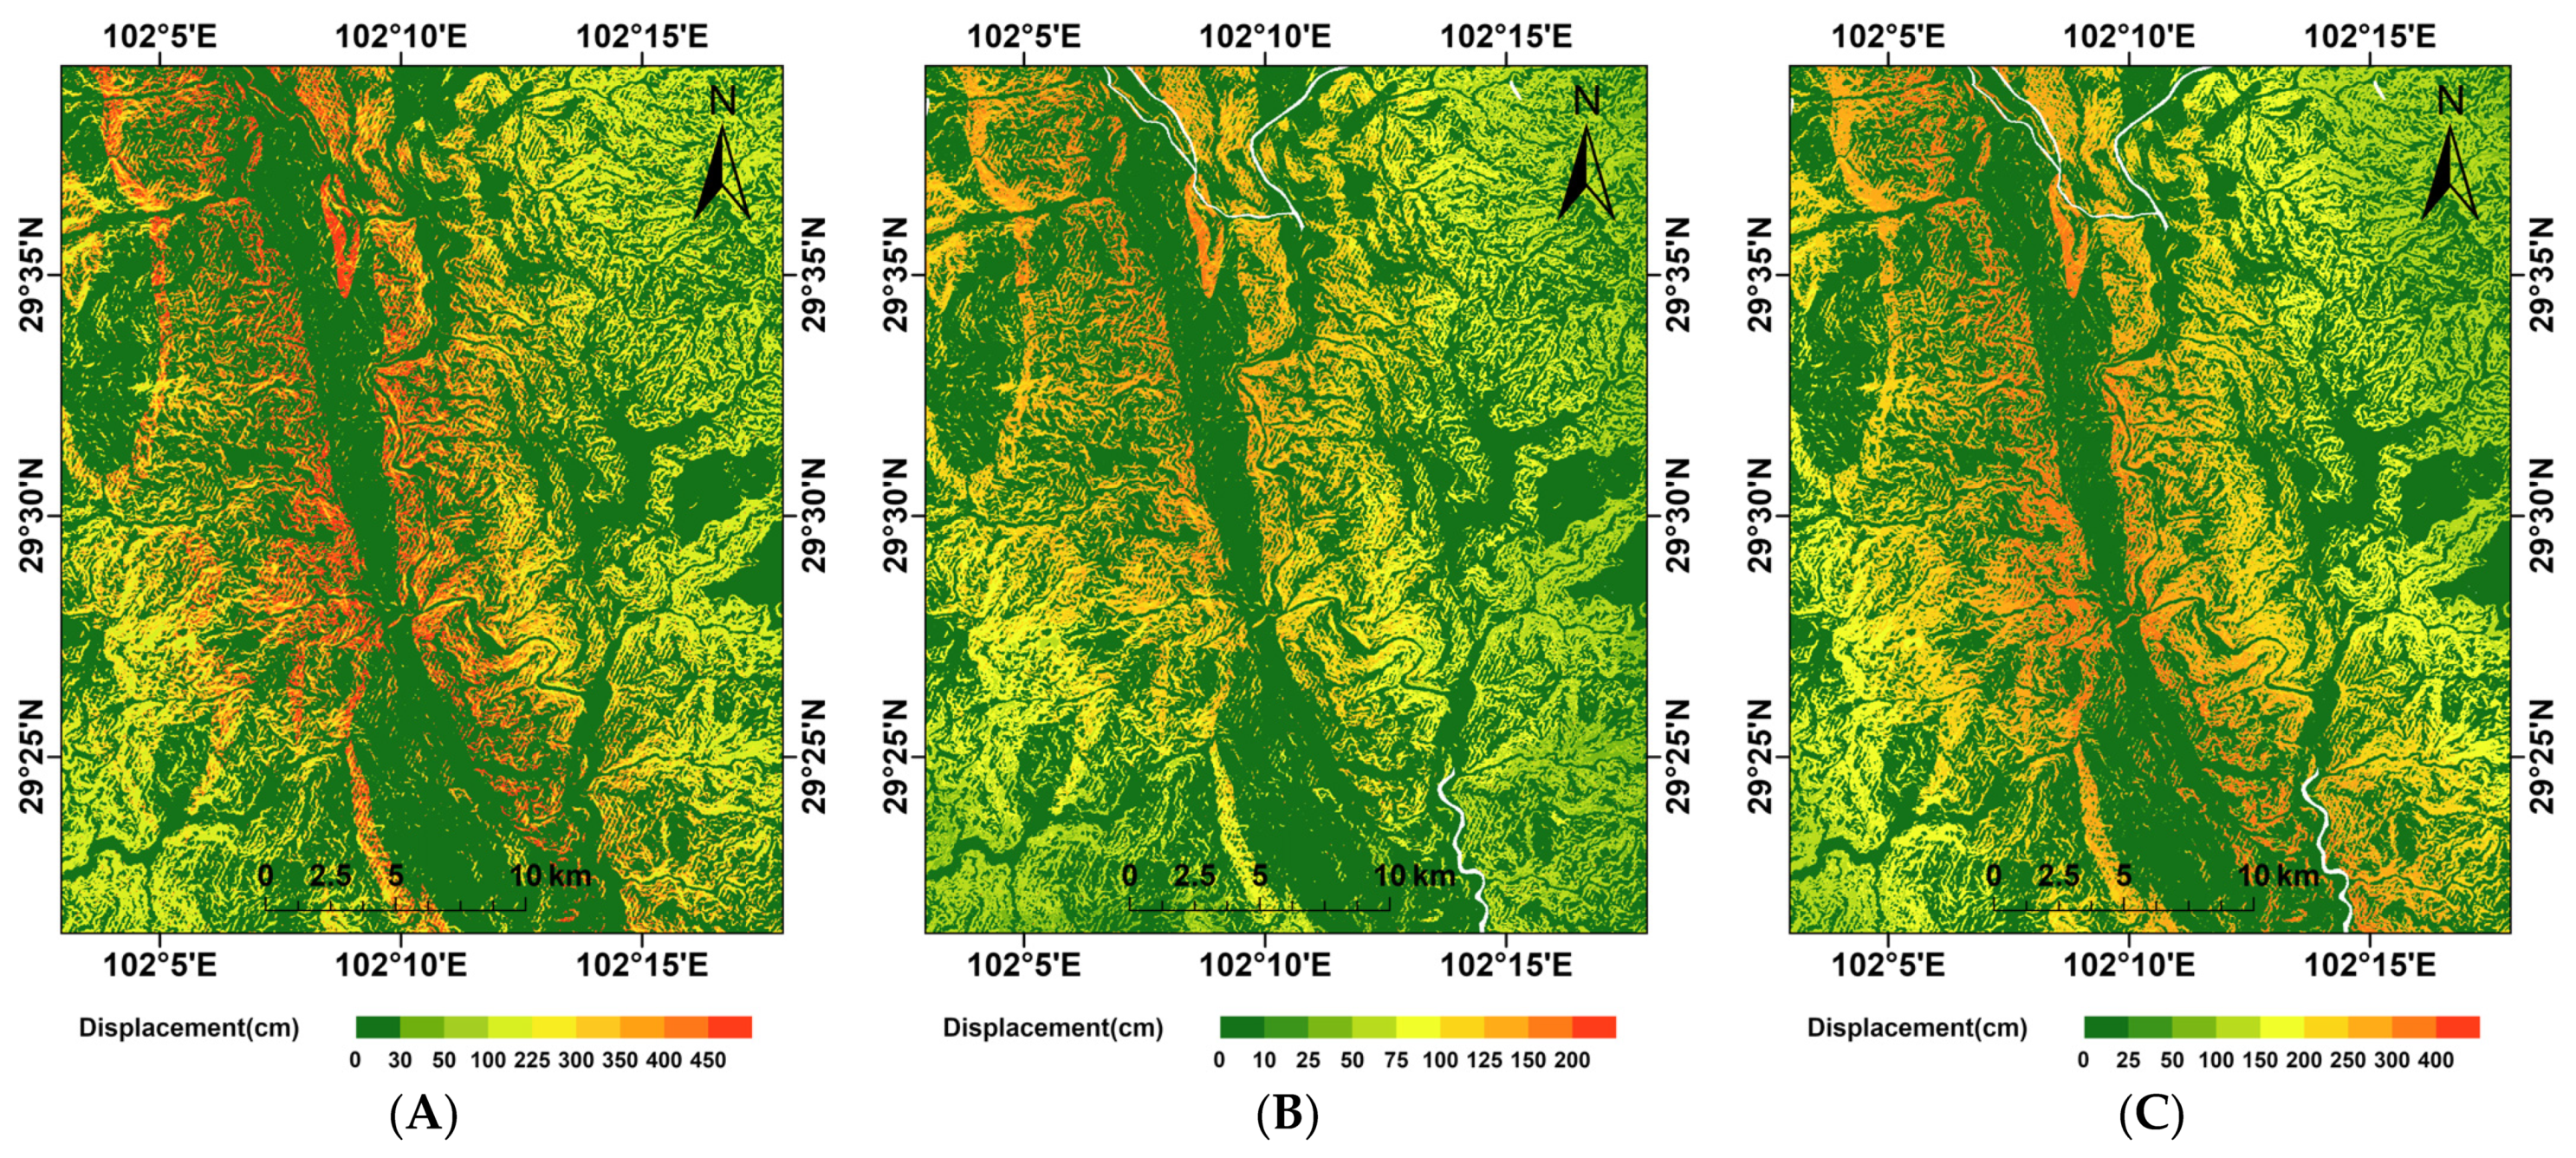
For comparison and validation, three recalibrated displacement prediction models with relatively high coefficients of determination were selected, namely the Xu2012-2, Jin2018, and Yiğit2020 models. These models were used to calculate regional Newmark displacement values, and the corresponding coseismic landslide hazard assessment results are shown in
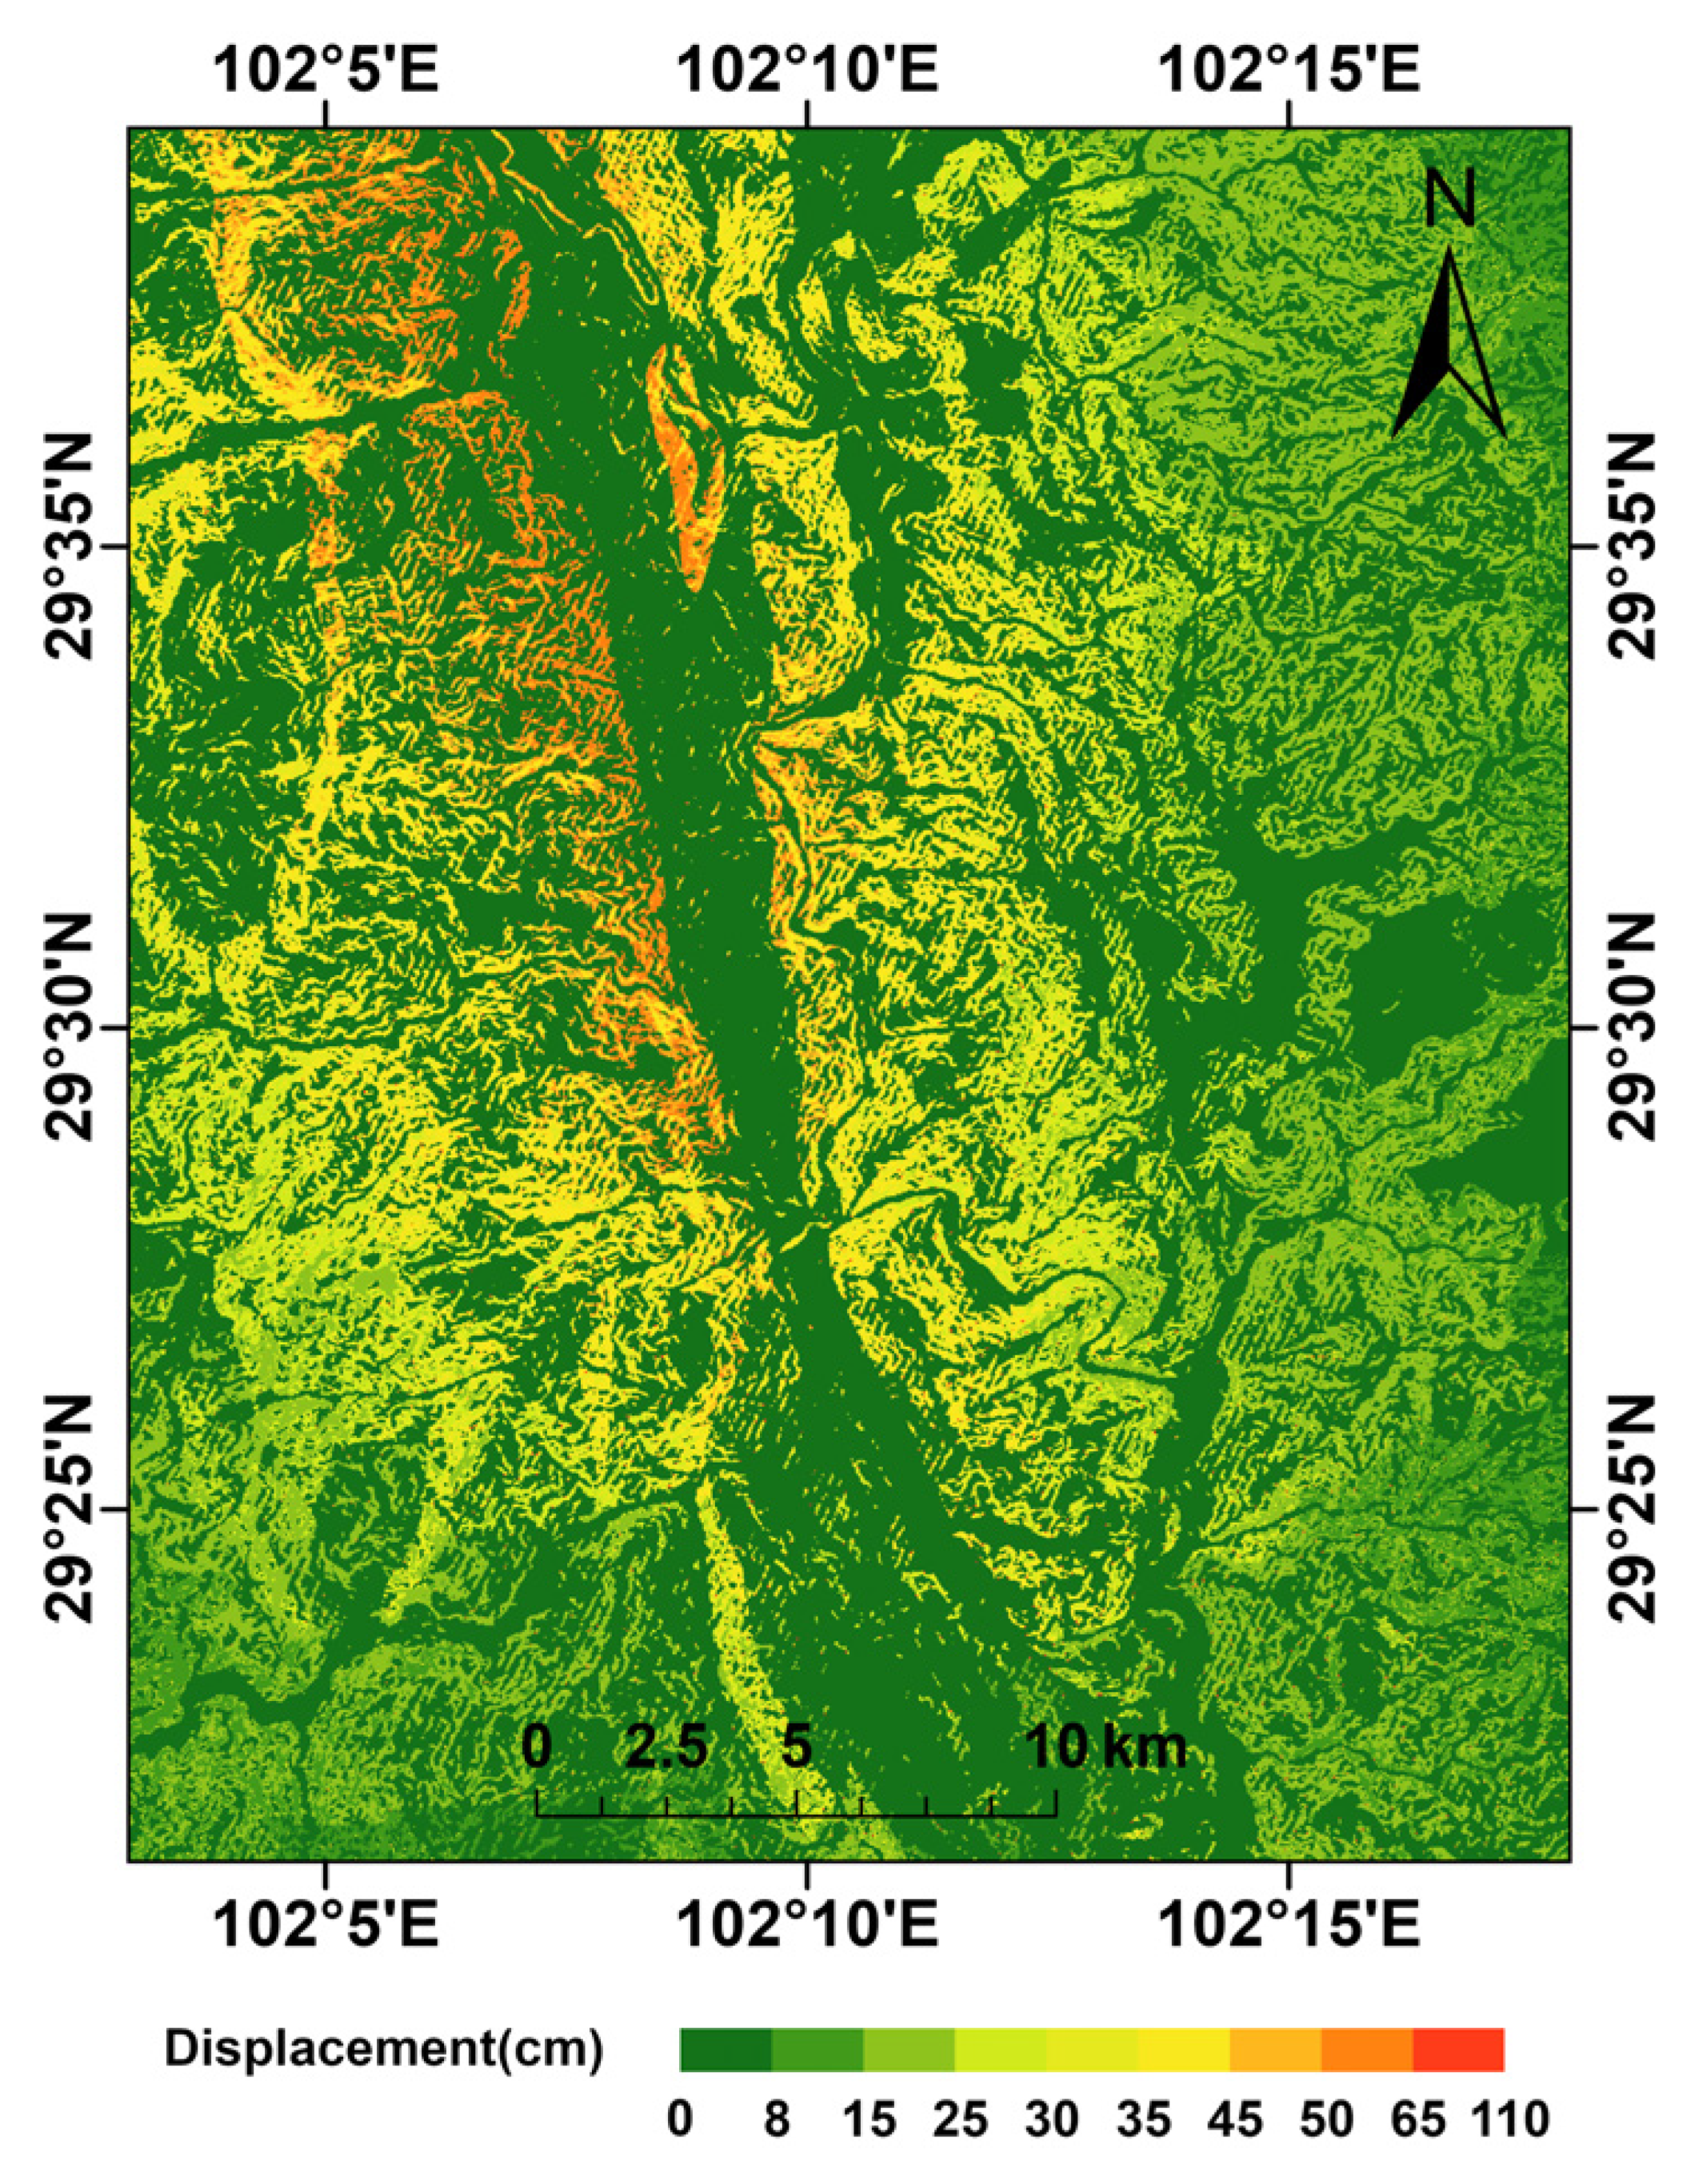
Figure 14. For the same study area, the new Newmark displacement prediction model proposed in this study was also applied to analyze coseismic landslide displacement. The resulting hazard assessment map is presented in
Figure 15.
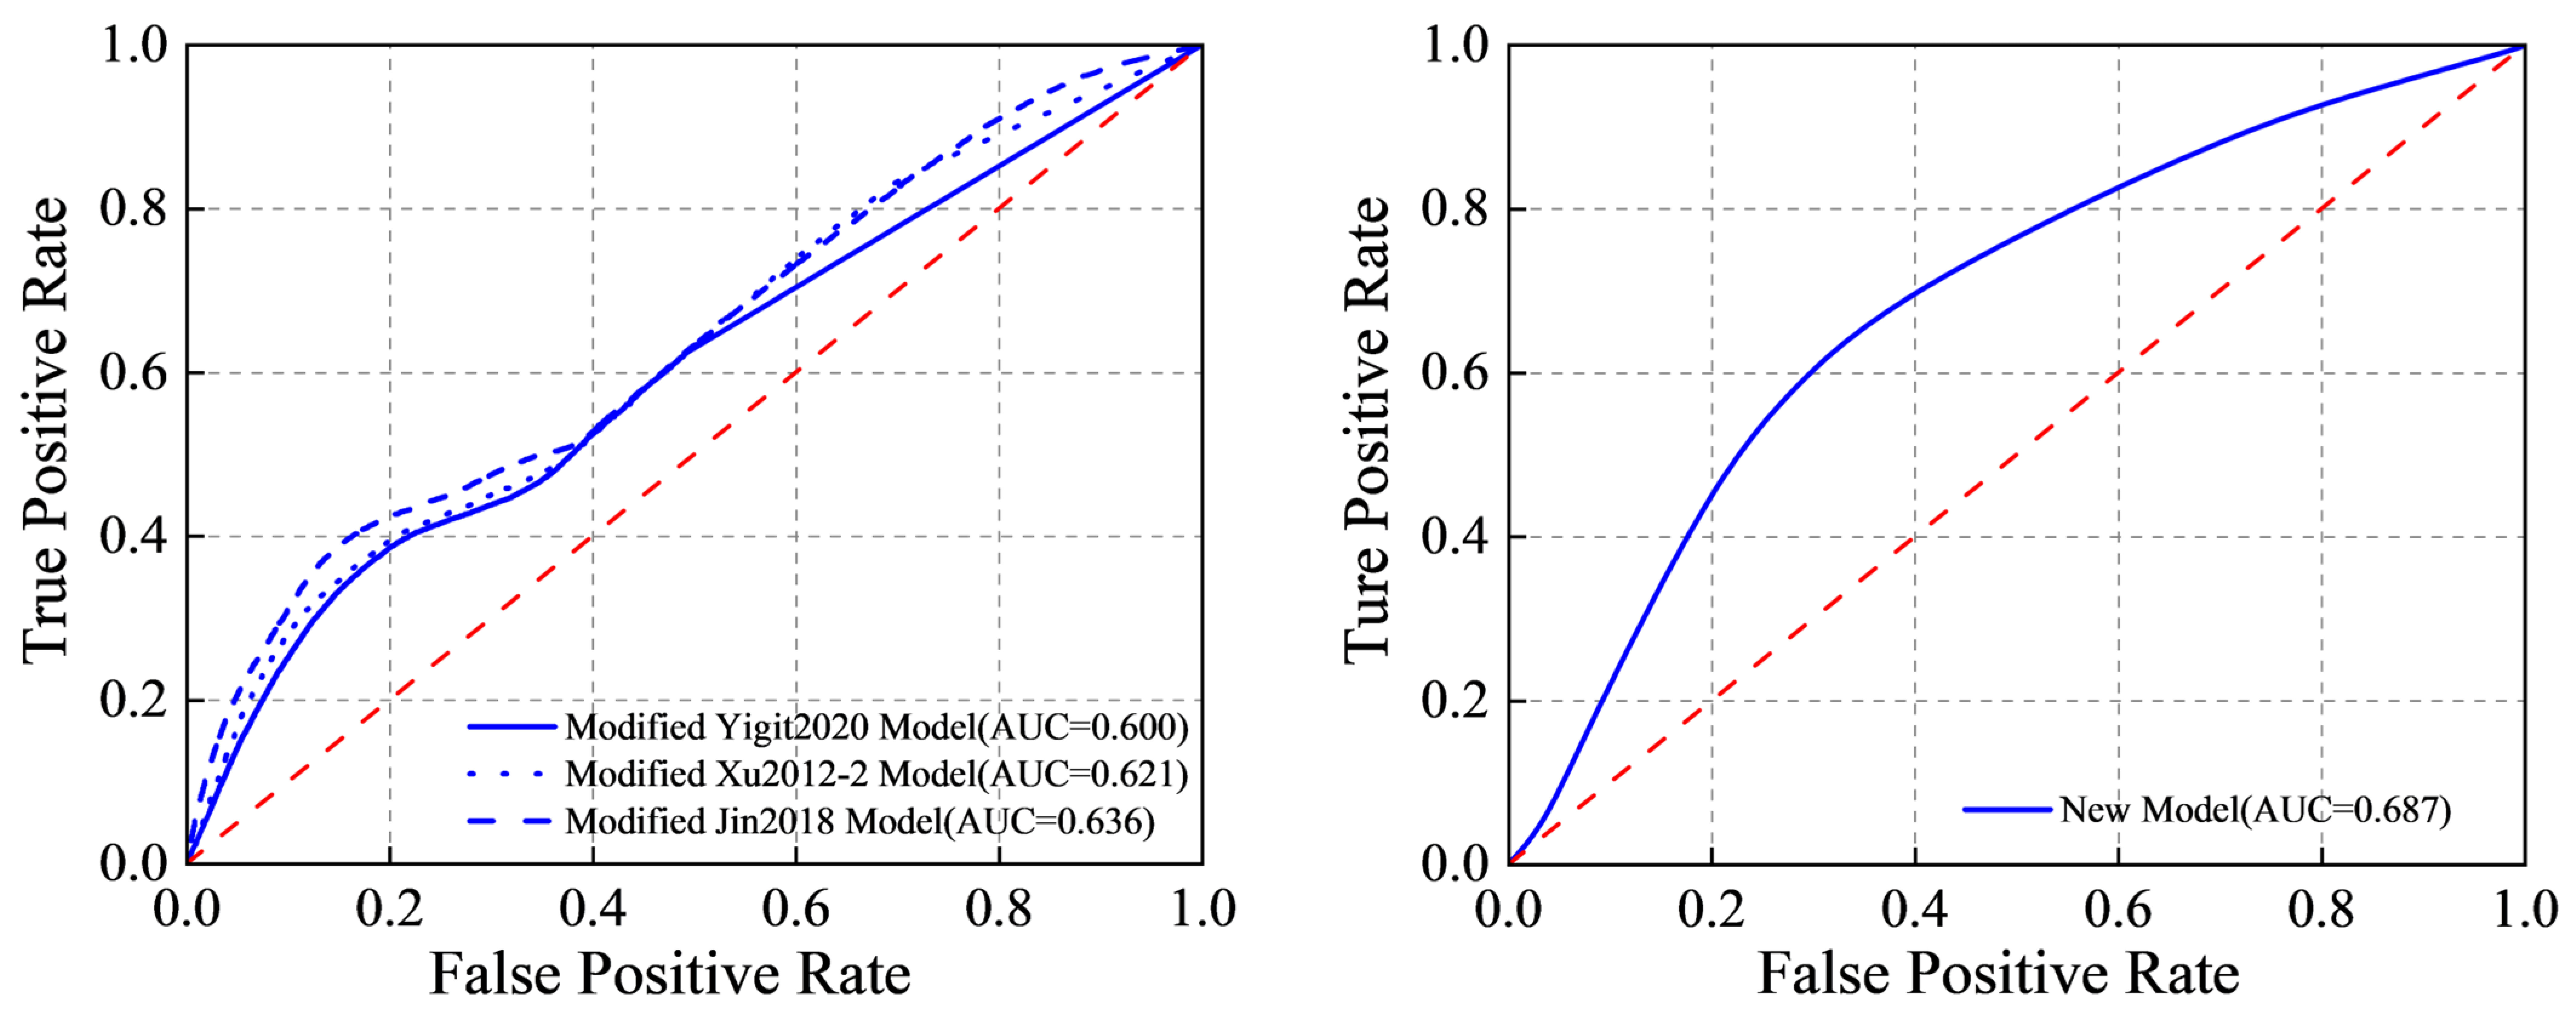
In this study, the area under the receiver operating characteristic curve (AUC) was used to evaluate predictive accuracy. The ROC analysis results for the three recalibrated Newmark displacement prediction models and the new model are shown in
Figure 16. In this figure, the red curve represents the random-guess line, whereas the blue curve represents the ROC curve of model performance. The AUC value is defined as the area under the ROC curve, and a larger AUC indicates better overall model performance.
The ROC analysis results show that all three recalibrated displacement prediction models, as well as the new model, exhibit a certain ability to discriminate landslides. Their ROC curves all lie above the random reference line, indicating that the model predictions are generally reasonable. The AUC values of the three recalibrated models are 0.600, 0.621, and 0.636, respectively. These results indicate some differences in their ability to explain the spatial distribution of landslides, although the overall improvement remains limited. In contrast, the new model achieves an AUC value of 0.687, which is clearly higher than those of the three recalibrated models. Its ROC curve is also closer to the upper-left corner. This indicates that the model can achieve a higher true positive rate at a lower false positive rate and therefore has better overall discrimination ability. These results show that the new model performs better than the three recalibrated models in identifying coseismic landslide hazard within the study area. It can therefore be regarded as the preferred model for subsequent hazard assessment.
6. Discussion
Although the proposed model shows improved performance for the present dataset, several issues still deserve further discussion regarding its interpretation, limitations, and potential directions for future improvement. Future work should expand the strong-motion database to include earthquakes with different moment magnitudes. This would make it possible to establish the relationships among moment magnitude, epicentral distance, seismic moment, multiple strong-motion parameters, and Newmark displacement, thereby further refining the proposed model. Another issue is that the dataset used in this study does not distinguish between pulse-like and non-pulse-like strong-motion records. Existing studies have shown that conventional Newmark displacement prediction models often underestimate the slope displacement induced by pulse-like ground motions [
35]. Since the dataset used in this study does not include near-fault pulse-like ground-motion records, the absence of pulse classification is unlikely to have directly affected the current model fitting and validation results. Future studies should therefore consider introducing pulse-identification methods to classify strong-motion records and develop more targeted model improvements. It should also be noted that the exclusion of samples with
Dn < 0.01 cm means that the proposed model is primarily calibrated for the non-trivial displacement range relevant to regional hazard assessment. As a result, the model is not intended to resolve differences among extremely small or nearly zero displacements, and its applicability in that range may be limited.
The landslides triggered by the 2022 Luding earthquake in Sichuan were predominantly shallow debris slides. Given this failure mode, the Newmark rigid sliding-block method is a reasonable approach for displacement prediction in this case. However, the Newmark method has continued to evolve, and some recent studies have adopted decoupled and coupled analytical models to investigate coseismic landslide displacement [
36,
37]. In future work, recalibrated flexible-block Newmark models based on decoupled or coupled analyses could be developed to better evaluate the displacement of earthquake-induced landslides involving deep-seated failure modes.
Although the proposed model achieved the highest AUC value among the models compared in this study, the absolute value of 0.687 should be interpreted with caution. Under common ROC-based criteria, this level of performance indicates moderate rather than strong discrimination ability. Nevertheless, it still represents a clear relative improvement over the three recalibrated benchmark models, whose AUC values range from 0.600 to 0.636. For regional Newmark-based assessments carried out without site-specific geotechnical testing and with simplified spatial parameterization, such moderate AUC values are not unusual. Previous Luding-earthquake studies based on displacement regression models have likewise reported relatively modest AUC values around 0.55–0.61 [
34], whereas higher values have generally been obtained only after introducing stronger spatial corrections or more specialized model improvements. Therefore, the present result should be understood mainly as a meaningful regional improvement over existing comparison models, while also indicating that further refinement of geotechnical and ground-motion inputs is still needed. In particular, the use of static and homogeneous geotechnical parameters is likely one of the main factors limiting the AUC value. This simplification ignores the spatial variability and possible dynamic strength attenuation of rock masses, which may reduce the final landslide discrimination capability.
It should also be noted that Newmark displacement is influenced by multiple controlling factors. Its reliability depends not only on the suitability of the displacement prediction model, but also on how critical acceleration is estimated within the study area. In this process, the assigned physical and mechanical parameters of the rock units, the choice of constitutive model, and the engineering geological classification are all critical factors that should not be overlooked. In current studies on regional coseismic landslide hazard assessment, large-scale field sampling and laboratory testing across an entire study area are generally impractical. Therefore, a common approach is to classify the engineering geological rock units within the region and assign fixed physical and mechanical parameters to each unit type, although the spatial variability of these parameters is rarely considered. Although assigning parameter values based on codes, standards, and engineering judgment is common and convenient, its validity is not without question. In particular, it remains debatable whether simply assigning fixed values to different rock units can adequately capture the local geomechanical properties and geological characteristics of the study area [
38]. To address this limitation, future regional assessments could incorporate probabilistic approaches in which key geotechnical parameters are treated as spatially variable rather than fixed values. In addition, sensitivity analyses may help identify which parameters most strongly influence predicted displacement, thereby guiding targeted field investigation and parameter refinement in areas with high uncertainty. In this way, future work could further integrate the uncertainty of ground-motion parameters with the spatial variability of rock and soil strength, thereby improving the accuracy of coseismic landslide identification.
Although the model coefficients presented here are calibrated specifically for Southwest China, the proposed model should not be directly applied to other mountainous seismic regions. This is because empirical Newmark displacement relationships are strongly region-dependent, and their applicability is influenced not only by ground-motion characteristics, but also by regional seismotectonic setting, geological conditions, topographic features, and the dominant types of earthquake-induced landslides. In fact, the results of this study show that several previously published models exhibit clear prediction bias when directly transferred to the Southwest China dataset, indicating that cross-regional application of such models may lead to substantial errors. Therefore, the present model should be regarded as a region-specific formulation for Southwest China rather than a universally transferable predictive equation.
7. Conclusions
The main conclusions of this study are as follows:
(1) Based on 591 horizontal strong-motion records from nine significant earthquakes in Southwest China, seven commonly used types of Newmark displacement prediction models were systematically recalibrated and compared. The results show that the original forms of these models generally produce clear prediction bias for the dataset used in this study. This confirms that Newmark displacement prediction models have strong regional dependence and should therefore be locally recalibrated before being applied to a specific region.
(2) Among the recalibrated existing models, the Yiğit2020 model performs best, with a coefficient of determination of 0.82 and a standard deviation of 0.45. It outperforms the other six recalibrated model types overall. Further analysis shows that, under different critical acceleration levels, peak ground velocity (PGV) and Newmark displacement (Dn) maintain a relatively stable linear relationship in logarithmic space, with an average coefficient of determination of 0.77. This result indicates that PGV has a significant influence on Newmark displacement and can be used as an important parameter to improve model predictive performance.
(3) After a log
PGV term was incorporated into the recalibrated Yiğit2020 model, the newly developed model showed a clear improvement in both fitting and validation performance. Its coefficient of determination increased to 0.92, while the standard deviation decreased to 0.30. Residual analysis of the validation set further shows that the new model performs better than the recalibrated models in three aspects: the predicted value–residual relationship (
Figure 8), the distribution of logarithmic residuals (
Figure 9), and the distribution of relative errors (
Figure 10). Its residuals are more tightly concentrated around the zero line, mainly within the range of (−1, 1), and the overall spread is the narrowest. In addition, 92.76% of the logarithmic residuals satisfy |Residual| ≤ 0.5. The mean and median relative errors are 66.43% and 38.90%, respectively, both lower than those of the recalibrated models. These results indicate that the new model performs best in terms of error control, stability, and overall predictive capability.
(4) Using the new model proposed in this study together with several previously published displacement prediction models, a comparative regional coseismic landslide hazard assessment was carried out for the area most severely affected by the 2022 Luding Ms 6.8 earthquake. The predicted displacement distributions were compared with the actual landslide distribution, and the results were validated using ROC curves. The AUC values of the three recalibrated models are 0.600, 0.621, and 0.636, respectively, whereas the new model achieves an AUC value of 0.687. This value is clearly higher than those of the comparison models, indicating a meaningful relative improvement in regional landslide discrimination. However, the absolute AUC level remains moderate, suggesting that further refinement of geotechnical and ground-motion inputs is still needed to improve predictive accuracy. These results show that the new model has a better ability to identify coseismic landslides and can provide a useful reference for regional coseismic landslide hazard assessment in the mountainous areas of Southwest China.
By improving the accuracy of regional coseismic landslide hazard assessment, the proposed model can support more reliable post-earthquake screening, evidence-based land-use planning, and infrastructure development in seismically active mountainous regions. In this sense, the present work contributes not only to regional hazard analysis, but also to disaster risk reduction, resilient mountain communities, and more sustainable regional development in Southwest China.




 ,
,