Article

Sustainable Selection of Disaster Recovery Centers: A Comparative GIS Analysis and Fucom-Based Electre I Approach for Digital Infrastructure Resilience

Faculty of Health Science, Department of Occupational Health and Safety 1, Sinop University, Sinop 57000, Türkiye
*
Author to whom correspondence should be addressed.
Sustainability 2026, 18(9), 4543; https://doi.org/10.3390/su18094543
Submission received: 3 March 2026 / Revised: 9 April 2026 / Accepted: 21 April 2026 / Published: 5 May 2026
(This article belongs to the Topic Disaster Risk Management and Resilience)

Abstract

Organizations’ increasing reliance on digital systems has made Disaster Recovery Centers (DRCs) a critical component of sustainable urban resilience. Disruptions in digital infrastructures directly affect corporate operations as well as the continuity of education, healthcare, and public services. Therefore, DRC site selection requires a holistic evaluation of multidimensional criteria, including environmental risk, infrastructure continuity, and operational reliability, rather than relying solely on physical suitability analysis. This study proposes a generalizable decision-making framework that comparatively evaluates GIS-based spatial suitability analysis and the ELECTRE I outranking model. Criterion weights are derived using the Fuzzy FUCOM method and applied exclusively within the ELECTRE I model for alternative evaluation. In the first stage, spatial suitability was assessed in a GIS environment using topographic and physical risk indicators such as slope, landslide susceptibility, and flood hazard. In the second stage, operational continuity criteria, including energy redundancy, telecommunication continuity, and RTO/RPO compliance, were weighted using Fuzzy FUCOM. The resulting weights were employed in the ELECTRE I model to calculate outranking relationships, supported by net concordance and discordance indices. Application results demonstrate differing ranking structures between the two approaches, reflecting distinct representations of physical suitability and operational resilience. Sensitivity analysis confirms the robustness of the findings. The study presents a scalable decision-support framework for sustainable digital infrastructure planning. Ultimately, this study demonstrates that the integrated GIS–MCDM approach can support decision-makers in enhancing digital resilience and maintaining the long-term operational continuity of critical infrastructures in disaster-prone regions. The findings further indicate that locations with balanced physical suitability and strong infrastructure continuity emerge as the most appropriate alternatives for DRC establishment.

1. Introduction

Disasters negatively affect the social, economic, and environmental fabric of societies. In response, risk-informed decision-making and resilience-based planning have become increasingly emphasized in global policy frameworks, particularly in the context of ensuring the continuity and reliability of critical infrastructures [1,2]. Focusing solely on technical repair processes is insufficient for addressing post-disaster damages; this process must be approached holistically to encompass the reconstruction of socioeconomic sustainability [3,4]. Ensuring business continuity for organizations in the post-disaster period supports the uninterrupted provision of essential social services. This accelerates economic recovery and enhances societal resilience.
In the pre-disaster period, infrastructures that ensure the continuity of critical systems such as information, communication, and energy should be designed to minimize service disruptions during crisis conditions. Interdependencies and systemic vulnerabilities among critical infrastructures can create cascading effects during disasters, necessitating holistic continuity planning [5]. Information systems are integrated digital infrastructures that support organizational decision-making and coordination processes. Therefore, the continuity of information systems is not limited to protecting technical infrastructure but requires an integrated approach that encompasses organizational and operational resilience [6].
The continuity of information systems requires coordinated planning for integrated processes, including data security, authorization, backup, disaster recovery, and risk management. The integration of IT disaster recovery plans (DRP) with business continuity management is critical for ensuring the uninterrupted operation of digital systems [7]. The ability to quickly restore systems in the face of multiple threats, such as natural disasters, cyberattacks, and power outages, is considered a concrete indicator of organizational resilience [8]. In this context, the development of business continuity and disaster recovery plans has become a strategic and managerial imperative, especially for public institutions and universities.
In universities, educational, research, and administrative activities are primarily carried out through information systems. The uninterrupted operation of student information systems, distance learning platforms, academic databases, and research infrastructures is critical to the continuous production and sharing of information. Interruptions in information systems can weaken academic productivity and institutional sustainability by disrupting educational processes, leading to the loss of research data, and halting institutional activities. This situation positions universities not merely as educational institutions but also as operators of critical digital infrastructure.
Interruptions in information and communication technology infrastructure caused by natural disasters, cyberattacks, or technical failures can render information systems inoperable and halt institutional activities. The role of digital infrastructure in maintaining institutional stability has evolved beyond mere technical support into a critical component of broader societal resilience. As demonstrated by Zhang et al. [2], robust digital infrastructure serves as a fundamental driver for urban economic resilience, facilitating industrial structural upgrades and ensuring economic vitality against external shocks such as pandemics or geopolitical conflicts. Building on this perspective, Lu et al. [9] emphasize that the systematic construction of such infrastructure is vital for enhancing urban resilience and maintaining the continuity of essential public services during large-scale disruptions. Within this framework, the strategic site selection of Disaster Recovery Centers (DRCs) acts as a cornerstone of digital infrastructure resilience, providing the necessary redundancy and operational continuity required to safeguard both economic stability and institutional functions in the face of unpredictable crises. In this context, Disaster Recovery Centers (DRCs) are strategic digital infrastructures that enable institutions to continue their core functions during crises by backing up critical components of information systems and providing alternative operating environments [7,10]. The appropriate placement of DRCs requires the combined evaluation of multidimensional criteria, such as geological safety, energy access, environmental sustainability, accessibility, and disaster risk. Appropriate site selection increases resilience to disasters and strengthens sustainable recovery capacity.
In site selection for infrastructure and facilities planned as part of pre-disaster investments, multidimensional factors such as geological safety, transportation accessibility, energy access, environmental sensitivity, and distance to residential centers must be evaluated together. Incorrect placement of infrastructure and facilities can result in high maintenance costs, service interruptions, and significant losses during disasters [11,12]. In contrast, appropriate site selection enables more efficient resource use and contributes to improved disaster response effectiveness [12].
In recent years, the combined use of Geographic Information Systems (GIS) and Multi-Criteria Decision Making (MCDM) methods has become widespread in site selection problems, offering a practical analytical framework for spatial decision-making processes [13,14,15]. These approaches enhance decision-making accuracy by integrating expert judgments with spatial data. For example, applying these methods to plan critical facilities such as disaster recovery centers (DRCs), healthcare facilities, and energy infrastructure is crucial for disaster-resilient urbanization [16].
In the existing literature, Multi-Criteria Decision Making (MCDM) approaches applied to disaster-related facility location problems can be broadly classified into three main methodological groups: (i) AHP-based weighting approaches, (ii) compensatory ranking methods such as TOPSIS, VIKOR, and PROMETHEE, and (iii) GIS-integrated hybrid frameworks. AHP and its fuzzy extensions are widely used to determine criteria weights through pairwise comparisons, providing a structured hierarchical decision-making framework [13,14,17]. In contrast, compensatory ranking methods such as TOPSIS and VIKOR evaluate alte rnatives based on their relative distance to ideal solutions, allowing trade-offs between criteria [18,19,20]. These hybrid frameworks integrate the spatial analysis capabilities of GIS with MCDM techniques, enhancing the accuracy, consistency, and applicability of location selection decisions in complex environments. While these approaches provide effective decision-support tools, they inherently rely on compensatory logic, where poor performance in critical criteria can be offset by strong performance in others. This limitation is particularly critical in the context of Disaster Recovery Center (DRC) site selection, where factors such as physical risk, energy continuity, and telecommunication reliability cannot be compromised. Despite the increasing integration of GIS and MCDM methods for spatial decision-making [16], most studies predominantly focus on physical infrastructure planning and humanitarian response systems, with limited emphasis on digital infrastructure continuity and information system resilience. Furthermore, the application of non-compensatory outranking methods, such as ELECTRE, remains relatively limited in disaster-related facility location problems. Unlike compensatory methods, outranking approaches prevent unacceptable alternatives from being compensated by high scores in other criteria, providing a more robust and risk-averse decision-making framework. This characteristic makes outranking methods particularly suitable for critical infrastructure planning problems. These findings clearly indicate the need for an integrated approach that combines GIS-based spatial analysis with non-compensatory decision logic to address the sustainability and continuity requirements of digital critical infrastructures such as Disaster Recovery Centers.
Recent studies have demonstrated the applicability of GIS-integrated MCDM approaches across various domains, including healthcare facility planning [21], emergency preparedness evaluation [20], infrastructure planning [13,22], and disaster-related facility location problems such as emergency logistics and shelter planning [18,19]. These studies highlight the flexibility and effectiveness of combining spatial analysis with multi-criteria decision-making techniques for complex site selection problems.
These findings clearly indicate that GIS-based MCDM approaches have become a standard framework in spatial decision-making problems. However, the dominance of compensatory evaluation methods and the limited focus on digital infrastructure continuity highlight an important research gap that necessitates more robust and non-compensatory decision-making approaches. These studies collectively demonstrate that while GIS-based MCDM approaches provide effective tools for spatial decision-making, they remain largely focused on physical infrastructure and compensatory evaluation logic, highlighting a significant gap in addressing digital infrastructure continuity through non-compensatory methods.
Recent studies have increasingly begun to address Disaster Recovery Center (DRC) location selection within the context of supply chain resilience and business continuity [23]. These studies highlight that strategically located DRCs play a critical role in mitigating operational disruptions and ensuring continuity under crisis conditions. However, existing approaches are generally based on simulation or single-method decision frameworks and often lack integration with spatial analysis and advanced multi-criteria decision-making methods.
While previous studies have extensively addressed site selection problems for emergency logistics, shelter, and healthcare facilities, the continuity of digital infrastructures remains relatively underexplored. The uninterrupted operation of decision support systems, communication networks, and data infrastructures is critical for effective disaster response and institutional resilience. Therefore, this study adapts existing GIS and MCDM approaches to the DRC site selection problem from the perspective of information system continuity, aiming to bridge this gap. Although the case study focuses on a university, the proposed framework is applicable to similar institutional contexts.
This study contributes to the sustainable and resilient planning of critical digital infrastructures by offering a framework aligned with the Sustainable Development Goals, particularly Goal 9 (Industry, Innovation, and Infrastructure) and Goal 11 (Sustainable Cities and Communities).
This research aims to address this gap by focusing on the site selection problem for Disaster Recovery Centers (DRCs) from the perspective of information system continuity. The main contributions of this study to the literature can be summarized as follows:
  • Unlike existing location selection studies focusing on disaster logistics, shelter, and healthcare facilities, this study addresses the site selection of Disaster Recovery Centers (DRCs) from the perspective of enterprise information systems and business continuity.
  • By comparing the results of GIS-based spatial suitability analysis with those obtained from the ELECTRE I outranking model, conducted using criteria weights determined by the Fuzzy FUCOM method, the study reveals structural differences between the compensatory spatial suitability approach and the non-compensatory dominance-based decision logic.
  • The proposed method offers a generalizable and replicable framework for sustainable digital infrastructure planning for universities and similar public institutions.
Thus, the study provides a comparative, generalizable decision-support framework for sustainable planning of digital critical infrastructure.

2. Literature Review

The location selection of critical facilities after a disaster is a complex decision-making problem that requires the simultaneous evaluation of interacting criteria, such as geological and topographical conditions, accessibility, infrastructure continuity, and multi-hazard risks [11,18,24]. Therefore, single-objective classical models are insufficient, and Multi-Criteria Decision Making (MCDM) approaches are gaining prominence [12,25,26]. In the literature, the location selection of logistics centers, emergency shelter areas, and healthcare facilities has been widely studied using GIS-supported MCDM methods.
A significant portion of the literature on disaster-related facility location problems focuses on determining criterion weights using AHP and its related methods. For instance, refs. [13,14,17] employed AHP, fuzzy AHP, and BWM, respectively, within GIS-supported frameworks, while Ayyıldız et al. [27] proposed an intuitionistic fuzzy SWARA-based approach to address uncertainty in emergency response center location problems. Similarly, Desticioğlu-Taşdemir [28] utilized a Pythagorean fuzzy AHP method to evaluate emergency station locations. These studies demonstrate that structured pairwise comparison methods provide reliable and consistent weighting results; however, these approaches primarily focus on the weighting stage and offer a limited perspective on how critical risks are addressed during the ranking process.
A substantial number of studies employ compensatory MCDM methods to evaluate and rank alternative locations. For example, Feng et al. integrated Entropy and CRITIC weighting methods with VIKOR ranking in a GIS environment [15], while Liu applied interval AHP combined with TOPSIS for multi-hazard-based facility planning [29]. Similarly, Dehnavvi Elagh and Abbaspour utilized CRITIC and TOPSIS within a location-allocation framework [19], and Atmaca et al. compared multiple ranking methods, including TOPSIS, COPRAS, and BORDA [30]. Boyacı and Şişman also adopted a GIS-based fuzzy AHP–TOPSIS framework [21], while Choukolaei et al. employed PROMETHEE for prioritizing alternatives under different scenarios [31]. These studies demonstrate the flexibility and applicability of compensatory approaches in spatial decision-making problems.
However, these approaches rely on compensatory evaluation logic, allowing trade-offs between criteria. While this provides flexibility, it may result in alternatives with poor performance in critical criteria being selected, which is not desirable in high-risk infrastructure planning contexts.
In addition, several studies have adopted hybrid MCDM approaches to capture complex relationships among criteria. For instance, Yang et al. [32] employed DEMATEL and ANP to identify interdependencies among criteria in disaster recovery center location selection, while Yang et al. [33] proposed a hybrid DEMATEL–DNP–VIKOR framework for academic institutions. Similarly, Ortiz-Barrios et al. [20] integrated FAHP, fuzzy DEMATEL, and TOPSIS to evaluate hospital disaster preparedness. These approaches enhance the representation of interdependent criteria and improve analytical depth; however, they generally continue to rely on compensatory evaluation logic and increase model complexity and data requirements.
A comparative evaluation of the reviewed studies further confirms that most existing approaches rely on compensatory decision-making structures and predominantly emphasize physical infrastructure criteria, while the continuity of digital infrastructure and the use of non-compensatory evaluation methods remain limited in the literature. Unlike the aforementioned studies that primarily rely on compensatory decision-making logic and focus on physical infrastructure planning, this study adopts a non-compensatory ELECTRE I approach to ensure that critical digital infrastructure risks are not masked by other favorable criteria. These findings systematically indicate three key limitations in the existing literature: (i) the dominance of compensatory decision-making approaches, (ii) the limited consideration of digital infrastructure continuity, and (iii) the insufficient application of non-compensatory methods in high-risk infrastructure planning.
When the literature is examined, it is observed that criterion weights are determined mainly by methods such as AHP and its derivatives, Entropy, and CRITIC. At the same time, alternatives are typically evaluated using compensatory ranking methods such as TOPSIS, VIKOR, and PROMETHEE. Since these methods base criterion performance on the logic of total or relative proximity, they allow low-performing criteria to be compensated by other high-performing criteria. The majority of studies focus on operational criteria such as accessibility, population density, and response capacity; however, digital infrastructure continuity and the corporate business continuity dimension have received limited attention.
Although a growing number of studies have addressed facility location problems using GIS-based MCDM approaches, research specifically focusing on digital infrastructure and information system continuity remains limited. Existing studies predominantly emphasize physical infrastructure planning, such as emergency logistics, shelter areas, and healthcare facilities, while the spatial planning of digital infrastructures- such as Disaster Recovery Centers (DRC)- has received relatively little attention.
These observations highlight the need for a more targeted and integrated approach that considers both spatial risk factors and digital infrastructure continuity. In this context, the present study contributes to the literature by addressing DRC site selection through a GIS-based and non-compensatory decision-making framework.
The continuity of digital infrastructure is critical to the uninterrupted functioning of sustainable cities and public services. Therefore, the spatial planning of Disaster Recovery Centers should be approached not only with a focus on post-disaster response but also with a holistic perspective that considers both institutional resilience and digital sustainability.
This study examines the spatial site selection problem for Disaster Recovery Centers (DRCs), a relatively underexplored topic in the literature, within the framework of multidimensional disaster risks and infrastructure continuity criteria. Spatial suitability analysis was performed in a GIS environment, criterion weights were determined using the Fuzzy FUCOM method, and the outranking relationships of alternatives were evaluated using the ELECTRE I method. Unlike the commonly preferred compensatory methods in the literature, the ELECTRE I approach offers a more cautious elimination mechanism by preventing high-risk alternatives from being offset by strong criteria. Furthermore, the conducted sensitivity analysis shows that the obtained results are robust against changes in criterion weights. This approach presents a viable decision-support model for sustainable, resilient critical infrastructure planning that addresses both spatial risk assessment and institutional business continuity requirements. Therefore, this study provides a robust, non-compensatory decision-support framework that comparatively evaluates GIS-based spatial analysis and MCDM approaches, while addressing both spatial suitability and digital infrastructure continuity in a unified manner.

3. Materials and Methods

3.1. Study Area

This study focuses on the site selection for a planned Disaster Recovery Center (DRC) for Sinop University, located within the province of Sinop in Turkey’s Black Sea Region. Sinop province has an area of approximately 5862 km2 and is a coastal city situated on the Black Sea. The province exhibits significant topographical differences between its coastal and inland areas, characterized by sloping terrain, river valleys, and diverse geomorphological features along the coast.
Sinop University largely conducts its education, research, and administrative activities through digital information systems. Therefore, a Disaster Recovery Center is critical to ensuring institutional business continuity. The DRC needs to be planned in a location that is safe, accessible, and ensures high infrastructure continuity against multiple disaster risks such as earthquakes, landslides, floods, and extreme meteorological events.
These five districts were selected to represent the spatial, environmental, and infrastructural heterogeneity of Sinop province. Each district exhibits distinct characteristics in terms of disaster risks, geographical conditions, and accessibility, thereby enabling a comprehensive and comparative evaluation of potential DRC locations under varying conditions. Coastal districts such as Gerze and Ayancık are more exposed to hydro-meteorological hazards, including heavy rainfall and flooding, whereas inland districts such as Boyabat and Dikmen display different topographical and geological characteristics. Erfelek, on the other hand, represents a transitional area with mixed features in terms of accessibility and infrastructure. Moreover, these districts are closely associated with the operational structure of Sinop University, as they host various academic and administrative units, enhancing the practical relevance of the study in terms of accessibility, service coverage, and infrastructure connectivity. Therefore, the selected districts provide a systematic, representative, and contextually relevant basis for DRC site selection, enabling the results to be evaluated under different spatial conditions and strengthening the applicability of the proposed approach in similar situations.
The spatial and disaster profile differences among the alternative districts necessitated evaluating DRC site selection using a multi-criteria approach. In this context, GIS-based spatial analyses were performed to reveal the physical risk and topographical suitability profiles of the alternatives. Criterion weights, determined in line with the literature, relevant national guidelines, and international standards, were calculated using the Fuzzy FUCOM method; alternatives were compared using the ELECTRE I method based on expert evaluations covering physical, institutional, and operational criteria. GIS and ELECTRE results were compared, and the decision-making process was interpreted holistically.
The selection of these five districts was also guided by their ability to collectively represent the full range of disaster risk profiles, geographical conditions, and infrastructure variability within the province, ensuring that the analysis captures both high-risk and relatively safer areas.

3.2. GIS-Based Spatial Analysis Process

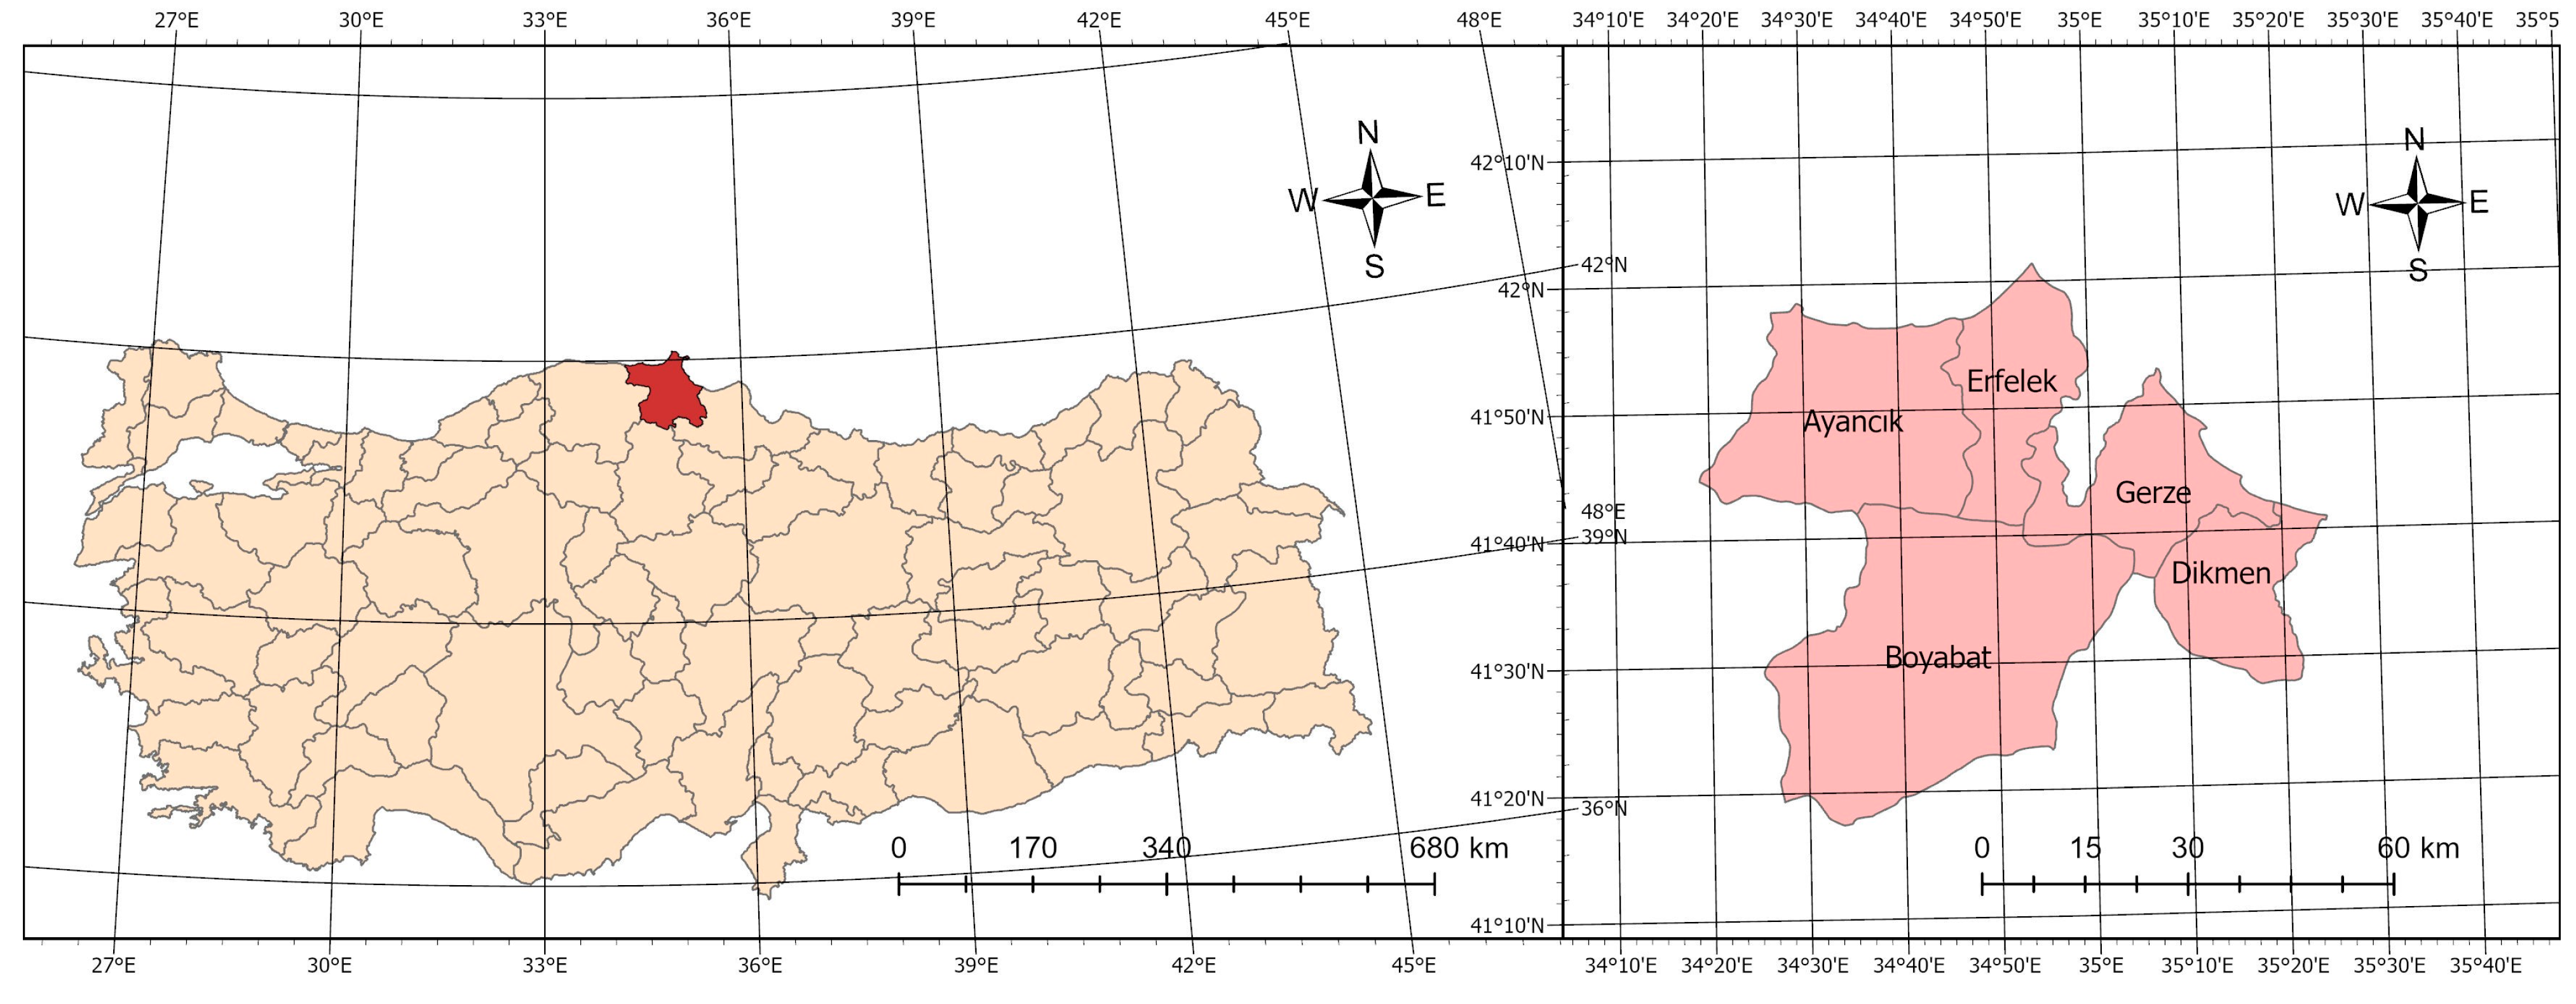
Figure 1 shows the geographical location of the study area and the spatial distribution of the alternative districts analyzed for DRC site selection within Sinop province.
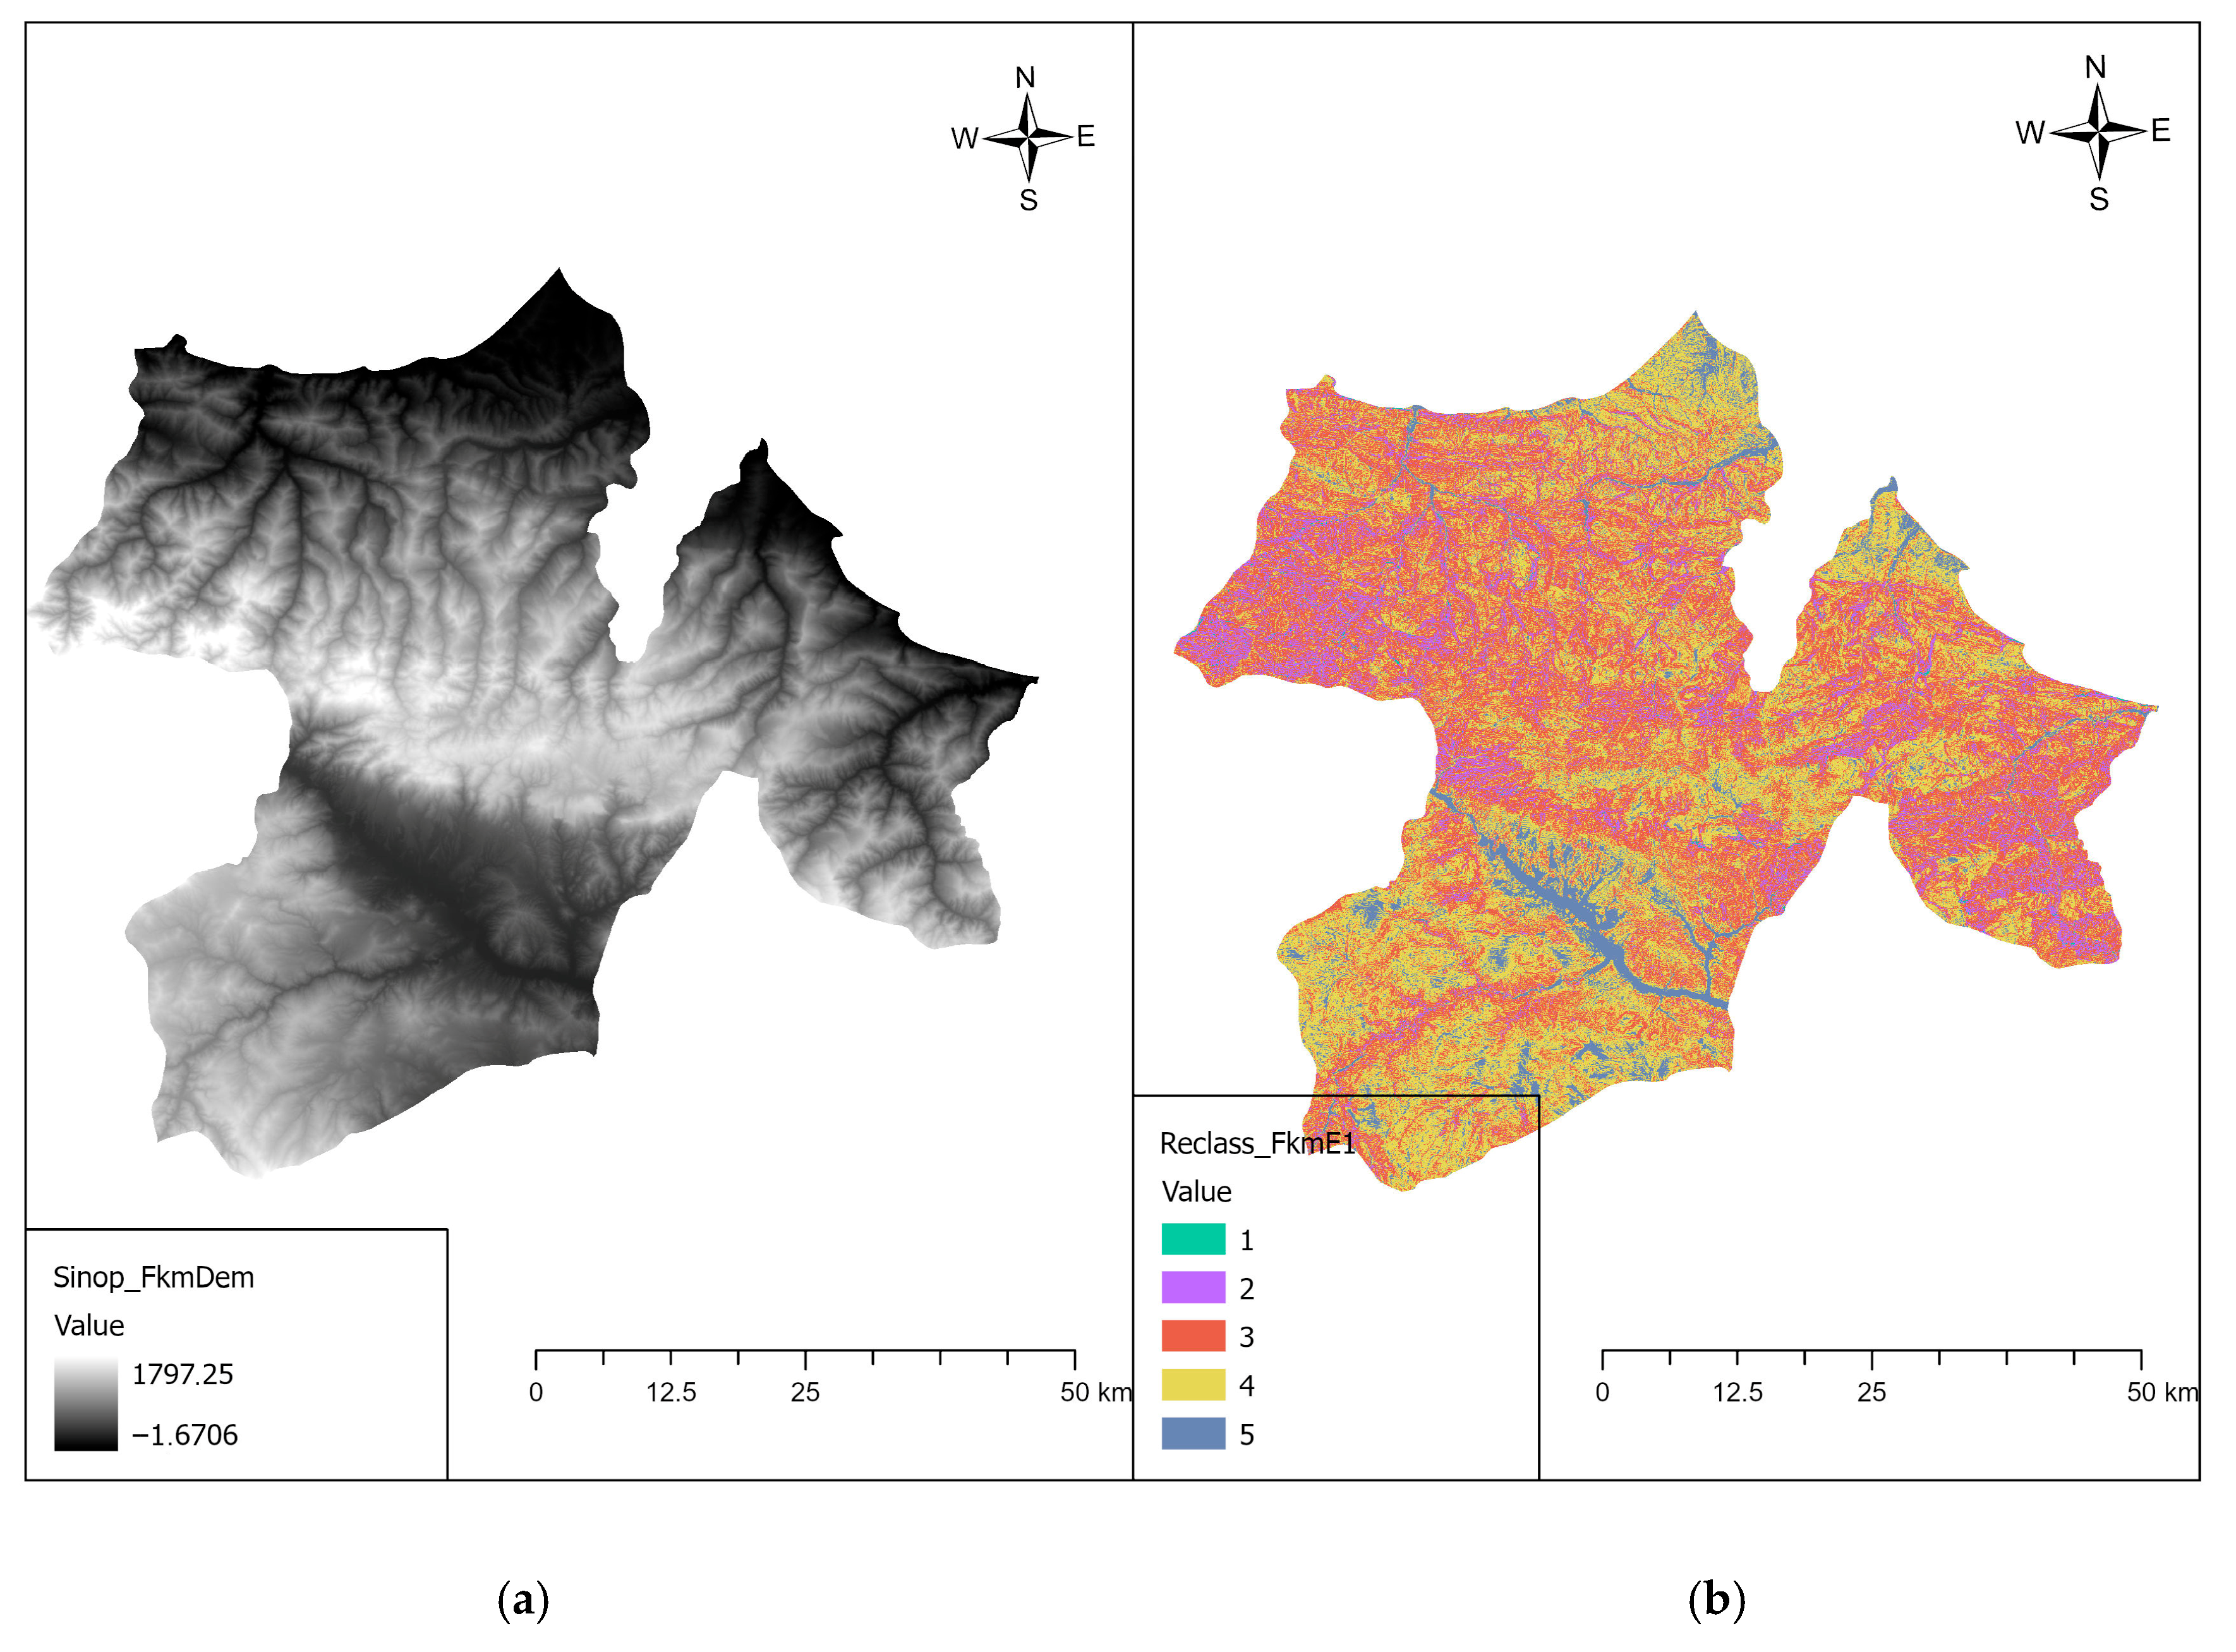
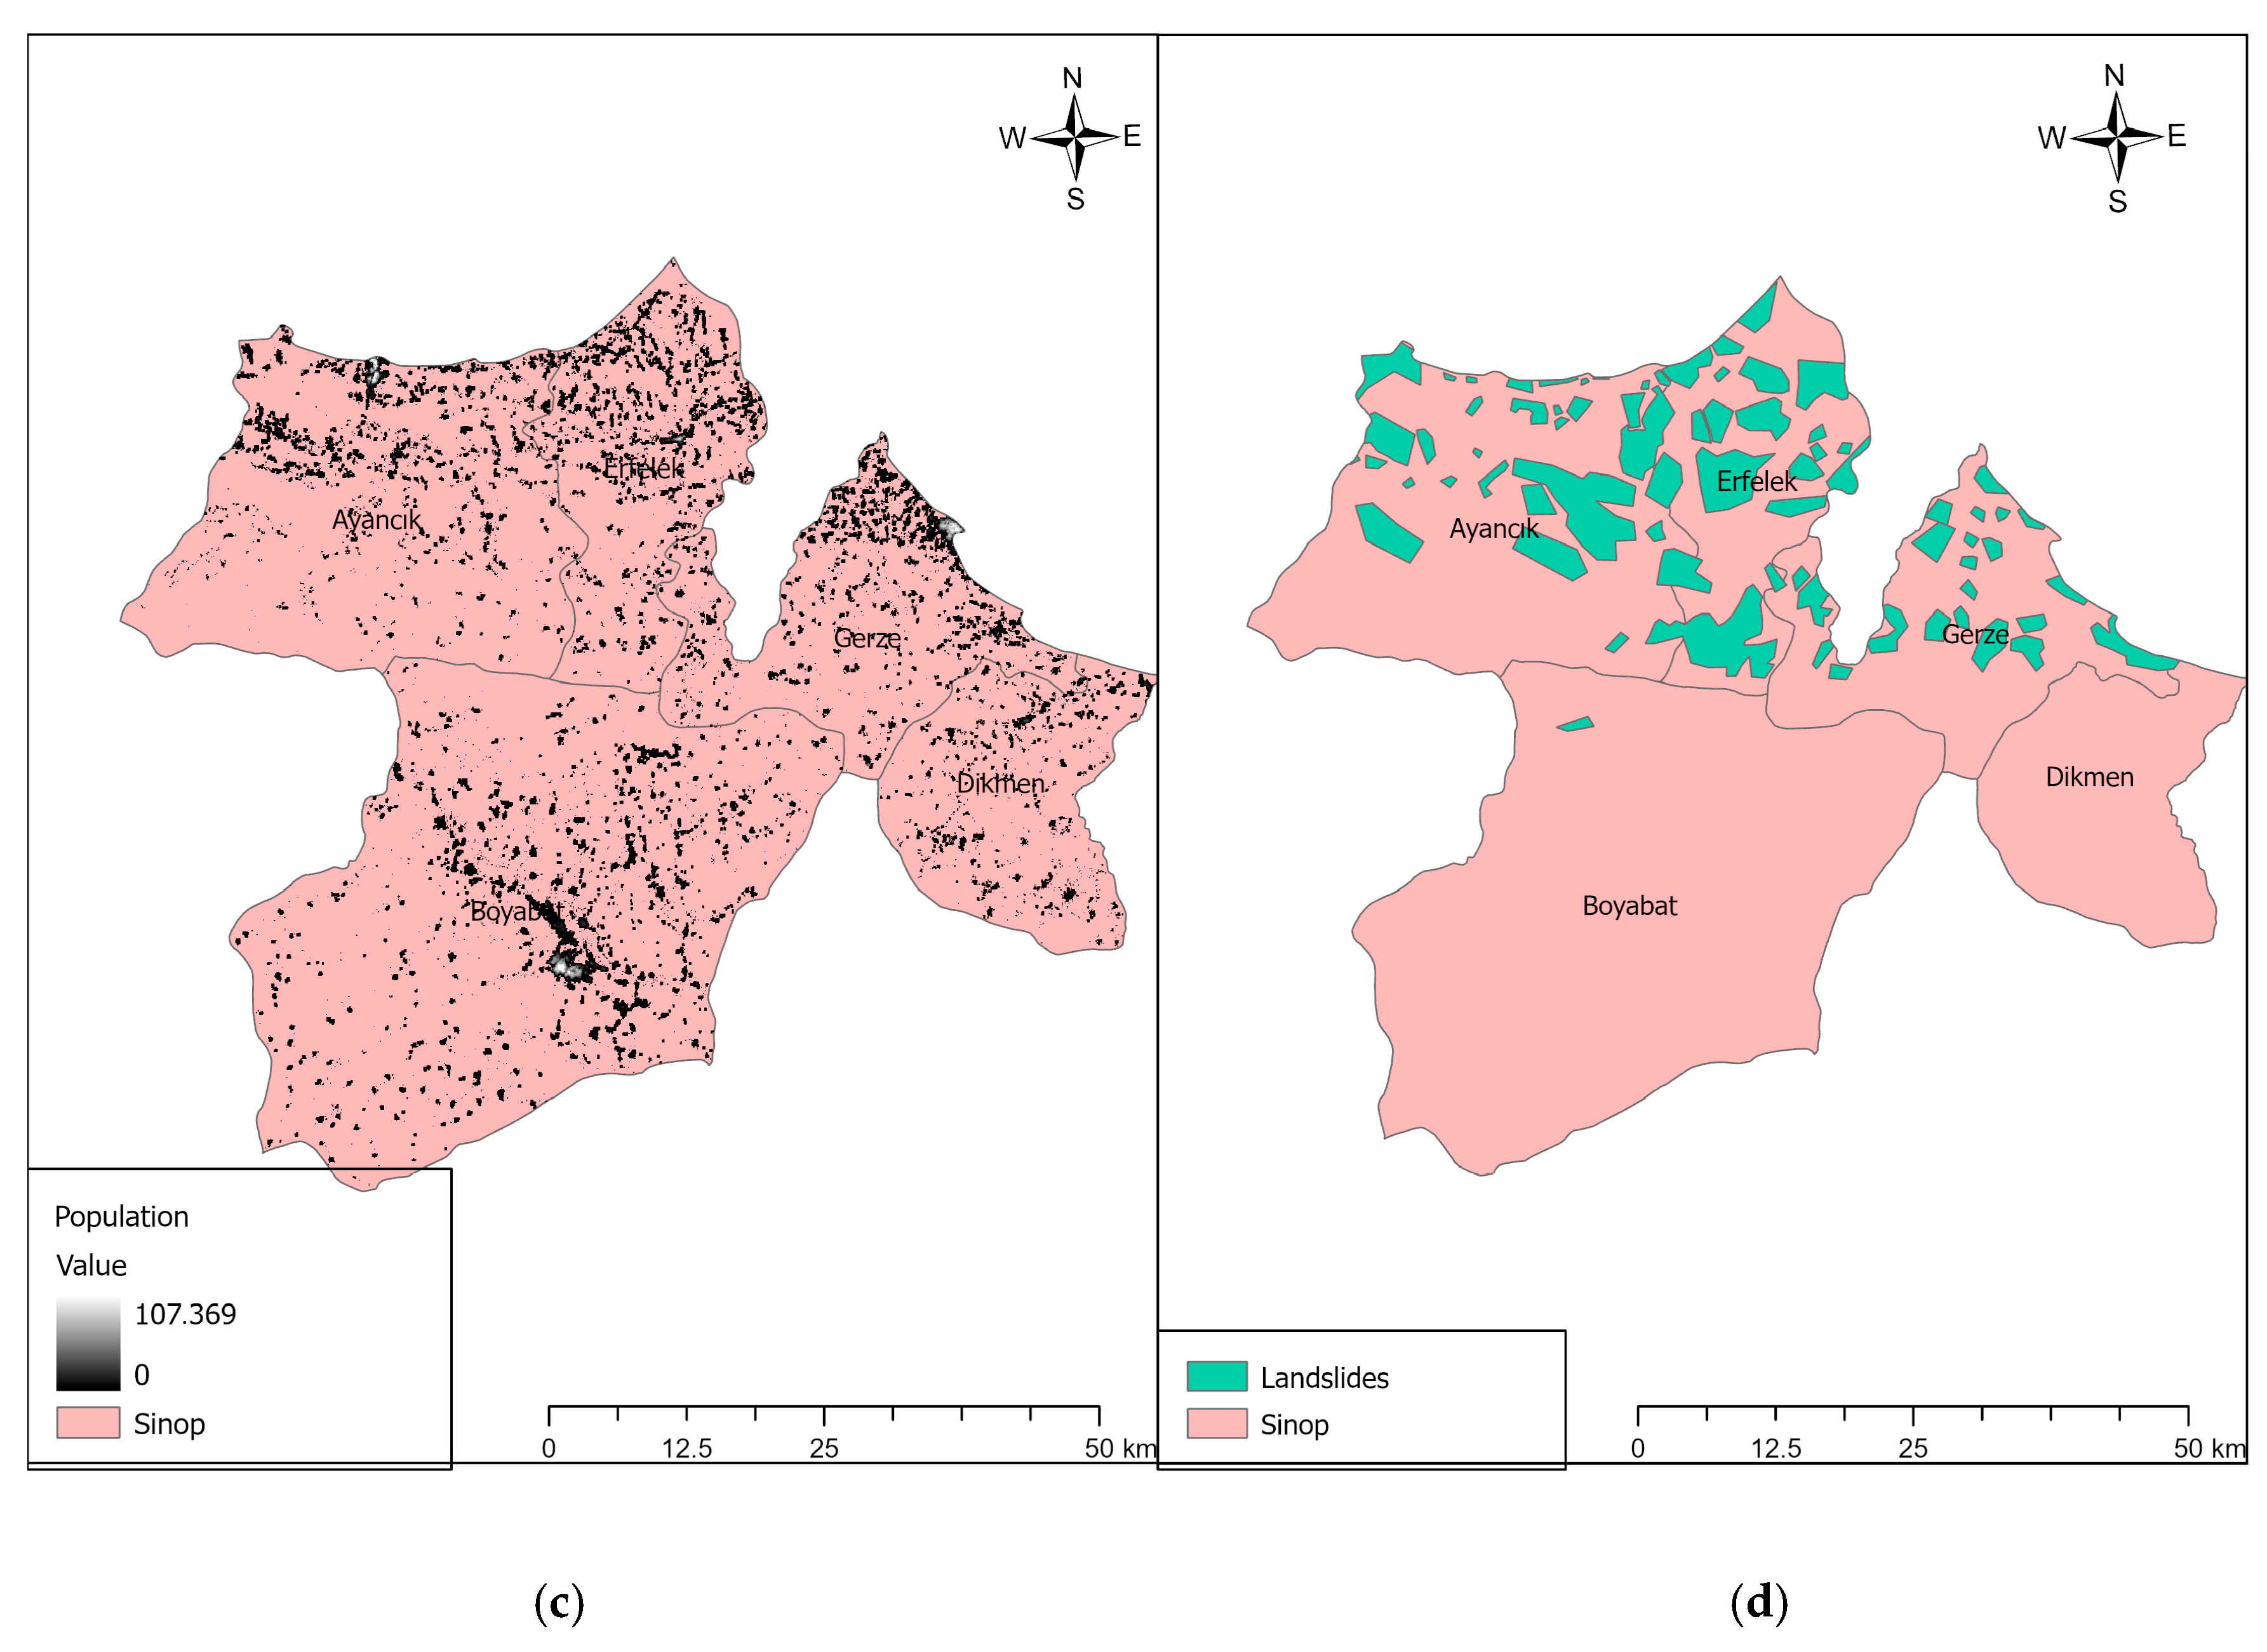
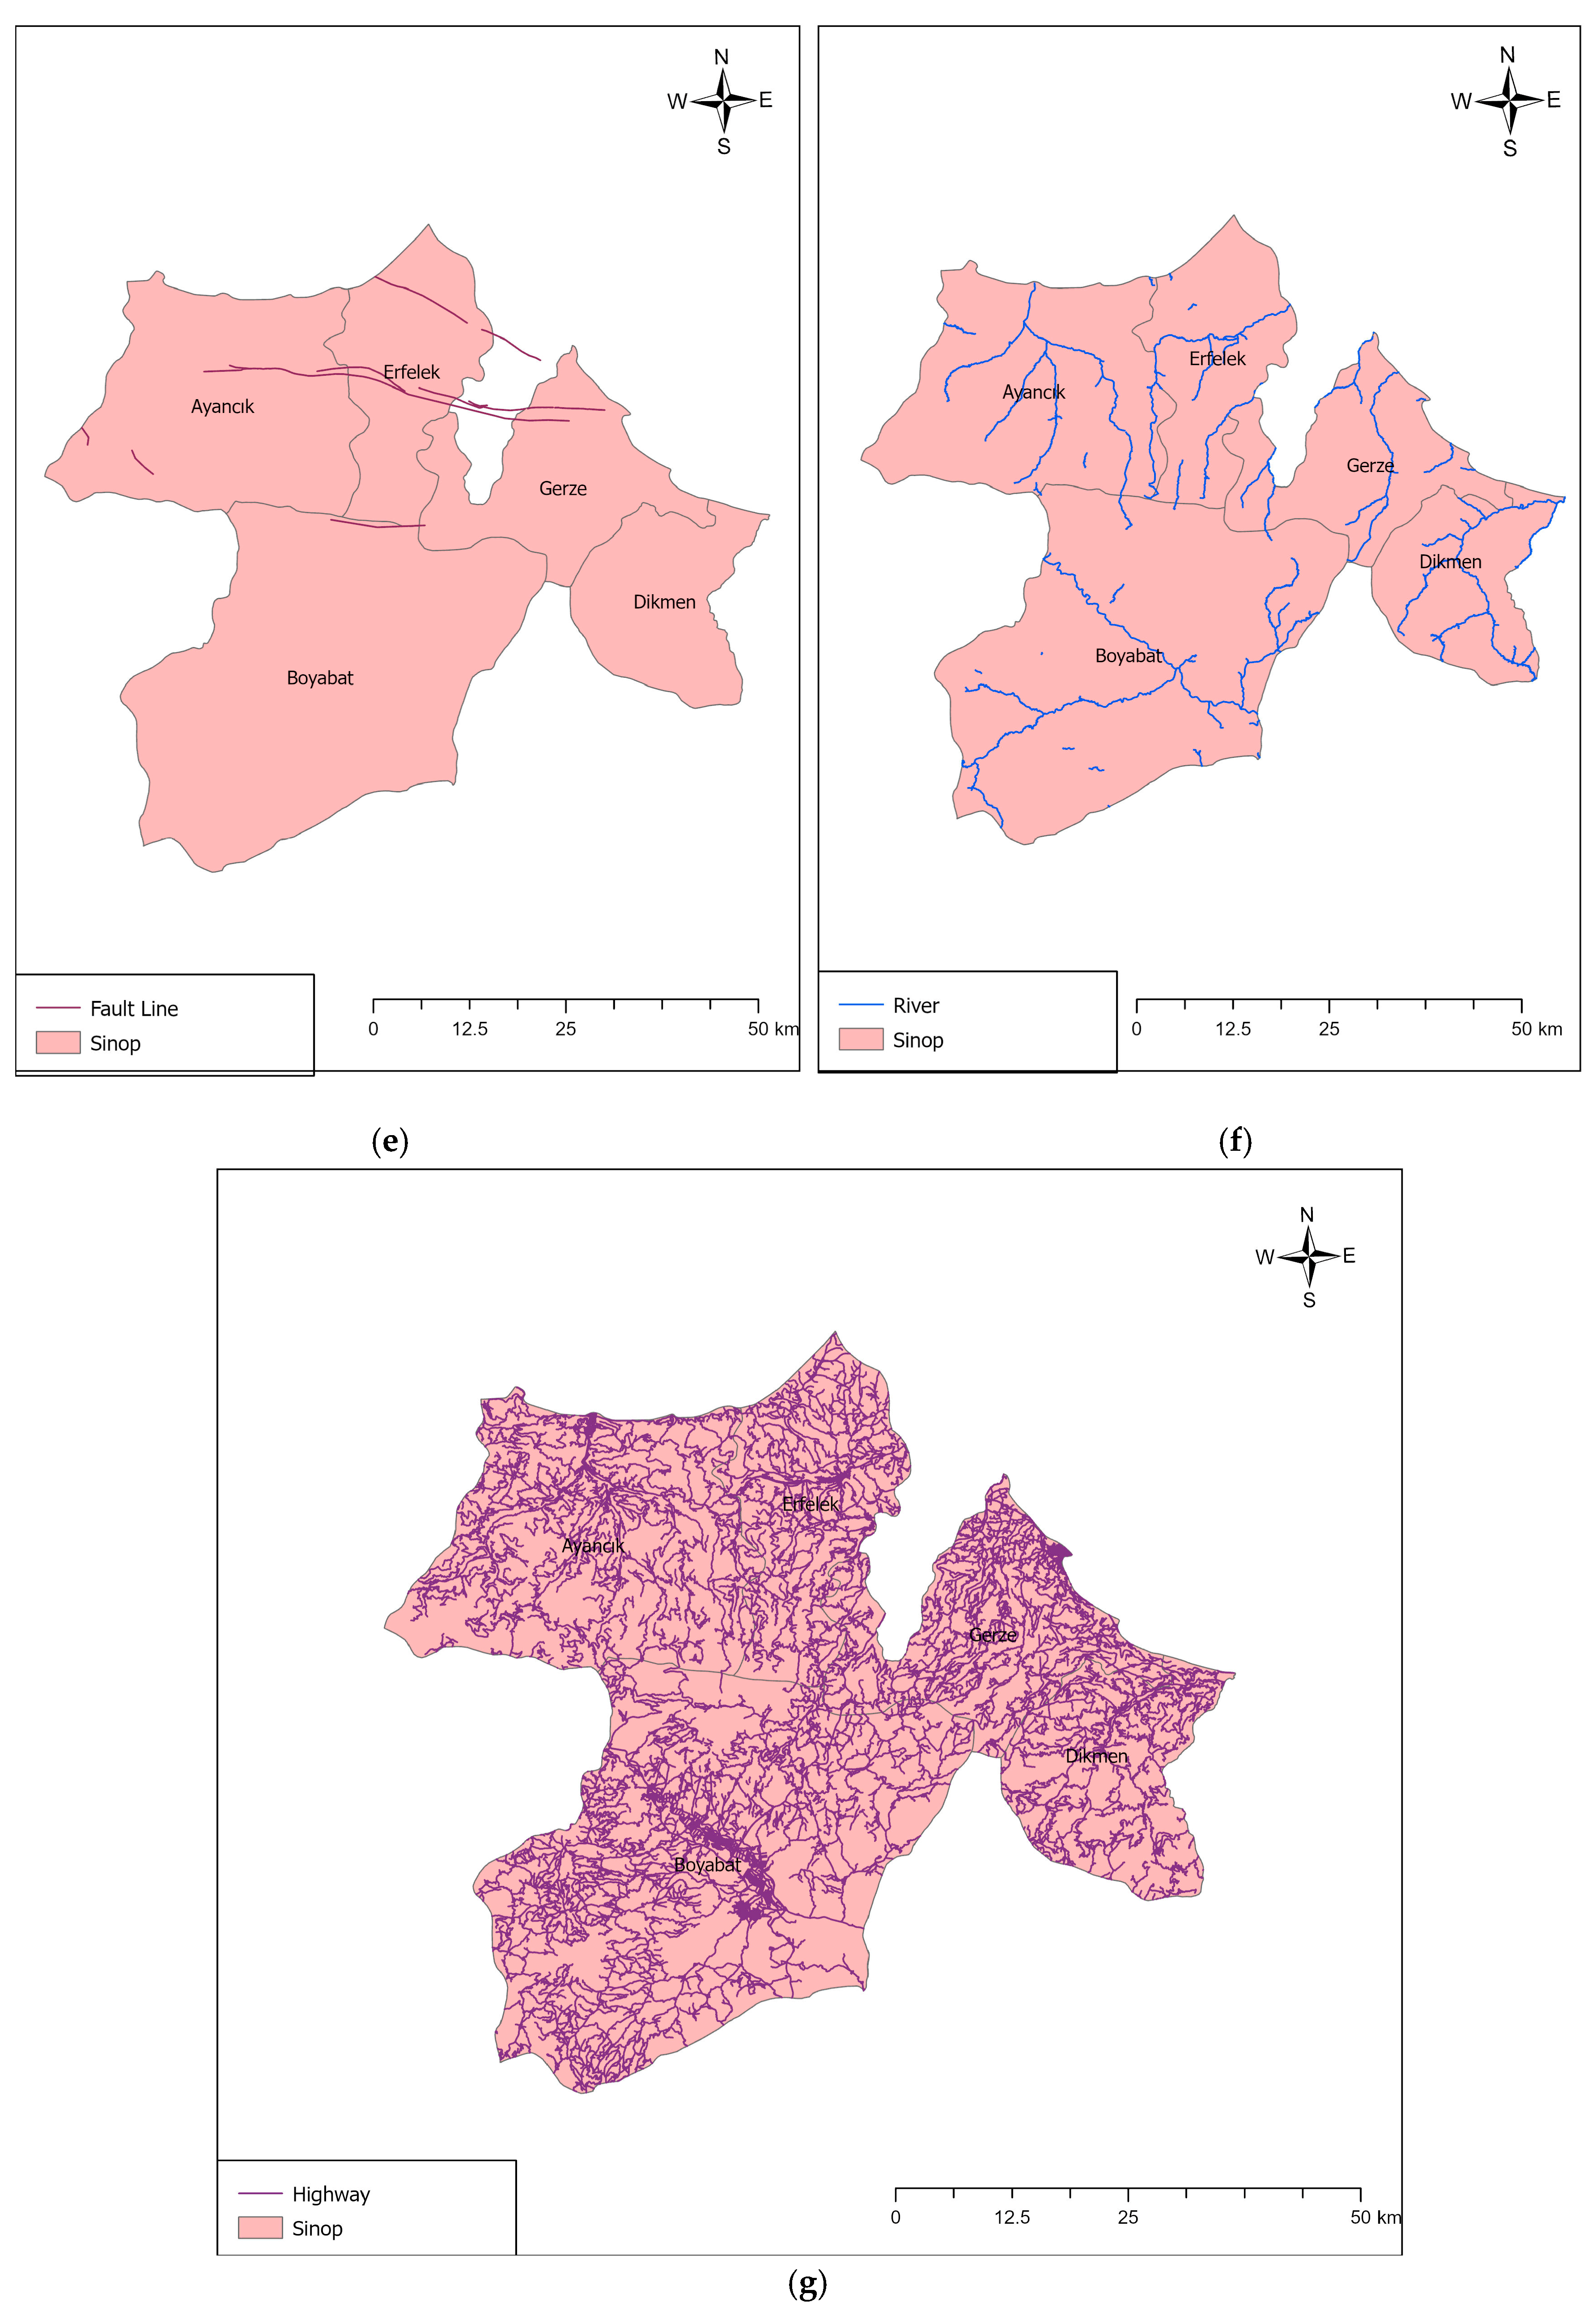
In this study, datasets used for spatial analyses of Disaster Recovery Center site selection were obtained from various institutional and open-access sources. A Digital Elevation Model (DEM) with 30 m spatial resolution was used to determine topographical features, and a slope layer was derived from this data. Grid-based raster population data obtained from the WorldPop data portal was included in the analysis to represent population distribution. Spatial layers related to disaster hazards were created from fault lines and landslide inventory data provided by the General Directorate of Mineral Research and Exploration (MTA). Road network, river, and building layers representing accessibility and settlement characteristics were obtained from OpenStreetMap, an open-source spatial data platform, and subsequently organized in QGIS (QGIS Development Team, Open Source Geospatial Foundation, Beaverton, OR, USA) and prepared for analysis. The spatial data layers used in the GIS-based multi-criteria analysis are presented in Figure 2.
All datasets were transformed into a common coordinate system, clipped according to the study area boundaries, and resampled to ensure compatibility for raster analyses.
A systematic preprocessing workflow was implemented to ensure consistency and comparability among datasets with varying spatial resolutions and time intervals. All spatial layers were reprojected to a common coordinate system (WGS 84/UTM) and clipped to the study area boundaries. Raster datasets were resampled to a spatial resolution of 30 m to align with the DEM data. Appropriate resampling techniques were employed based on the data type: bilinear interpolation for continuous variables and nearest neighbor for categorical data.
Furthermore, the reliability and quality of the spatial data were supported by the use of widely recognized databases, including geological and hazard data from the General Directorate of Mineral Research and Exploration (MTA), population distribution from WorldPop, and infrastructure layers from OpenStreetMap (OSM). WorldPop datasets are generated using advanced statistical and remote sensing-based methods, providing a robust foundation for spatial population modeling [34]. In addition, previous studies have demonstrated that OSM data can achieve high levels of completeness and acceptable positional and semantic accuracy when compared with authoritative datasets [35,36]. These findings indicate that the selected datasets are suitable for regional-scale spatial analysis and decision-support applications.
Although a formal accuracy assessment was not conducted, consistency checks were performed through cross-comparison of datasets and verification of spatial coherence across layers.
For continuous variables, classification was performed using the reclassification method, with natural breaks and threshold values recommended in the literature. Euclidean distance was calculated for distance-based criteria, and the resulting rasters were normalized on a 1–5 scale. To ensure comparability, raster layers were standardized within the 0–1 range using the min–max normalization technique. In the GIS analysis, criteria were evaluated with equal weighting.
In this study, GIS-based spatial analysis and the FUCOM–ELECTRE I model were integrated as a two-stage decision-support framework with complementary roles. The GIS analysis evaluates the physical and spatial suitability of alternative locations based on objective data; therefore, equal weighting was adopted to ensure methodological neutrality at the spatial analysis stage, allowing the GIS-based suitability assessment to remain data-driven and directly comparable with the FUCOM-based weighting applied in the ELECTRE model. It should be noted that equal weighting may influence the relative ranking of alternatives; however, in this study, the GIS analysis was designed to provide a baseline spatial suitability assessment rather than a final decision model. Therefore, the impact of equal weighting is intentionally limited and is complemented by the FUCOM-based weighting applied in the ELECTRE analysis.
In this study, all criteria used in the GIS-based spatial analysis were considered to have consistent and unidirectional effects on site suitability. Accordingly, the criteria were evaluated as indicators that contribute either positively or negatively to site suitability.
Since no criteria with ambiguous or neutral effects (i.e., unclear advantages or disadvantages) were identified, standard normalization procedures were applied. This approach ensures that each criterion contributes to the suitability mapping in a consistent and objective manner, ensuring consistency in the interpretation of suitability across all spatial criteria.
For example, criteria such as slope were evaluated as factors that reduce suitability, whereas accessibility-related factors were considered as elements that increase suitability.
In contrast, the FUCOM–ELECTRE I model incorporates a broader set of criteria, including operational, institutional, and infrastructural factors, and determines their relative importance based on expert judgment. This difference in weighting strategy and criteria scope is a deliberate and systematic choice.
The comparison of GIS-based results with FUCOM–ELECTRE I outputs suggests that equal weighting tends to emphasize overall physical and environmental suitability, whereas FUCOM-based weighting refines the prioritization of alternatives by reflecting operational and infrastructural priorities. This indicates that, for critical infrastructure such as Disaster Recovery Centers (DRCs), relying solely on GIS-based spatial suitability is not sufficient, and the integration of advanced MCDM methods is necessary to ensure both physical feasibility and strategic resilience.
To integrate the layers, a weighted linear combination approach was applied, and the suitability index was calculated as follows:
S = i = 1 n w i x i
Here, wi represents the criterion weight, and xi represents the standardized raster value. Analyses were performed in ArcGIS Pro 4.0 (Esri, Redlands, CA, USA).
The GIS-based analysis in this study generates a spatial suitability index based on the integration of physical and environmental risk indicators, such as slope, landslide susceptibility, and flood hazard.
The index is calculated using a weighted linear combination of standardized raster layers. All raster layers were normalized to a common scale (0–1) using Min–Max normalization to ensure comparability. In this standardized scale, values closer to 1 indicate higher suitability and lower risk, while values closer to 0 represent lower suitability and higher risk. For example, slope values were inversely normalized, since higher slope values indicate lower suitability.
In this context, the suitability index reflects spatial risk conditions and infrastructure resilience, supporting sustainable planning objectives.
All criteria used in the GIS analysis were defined as having consistent and unidirectional effects on suitability. Therefore, no neutral indicators with ambiguous effects were included in the model.
In the standardized scale, values closer to 1 indicate higher suitability and lower risk, while values closer to 0 represent lower suitability and higher risk.
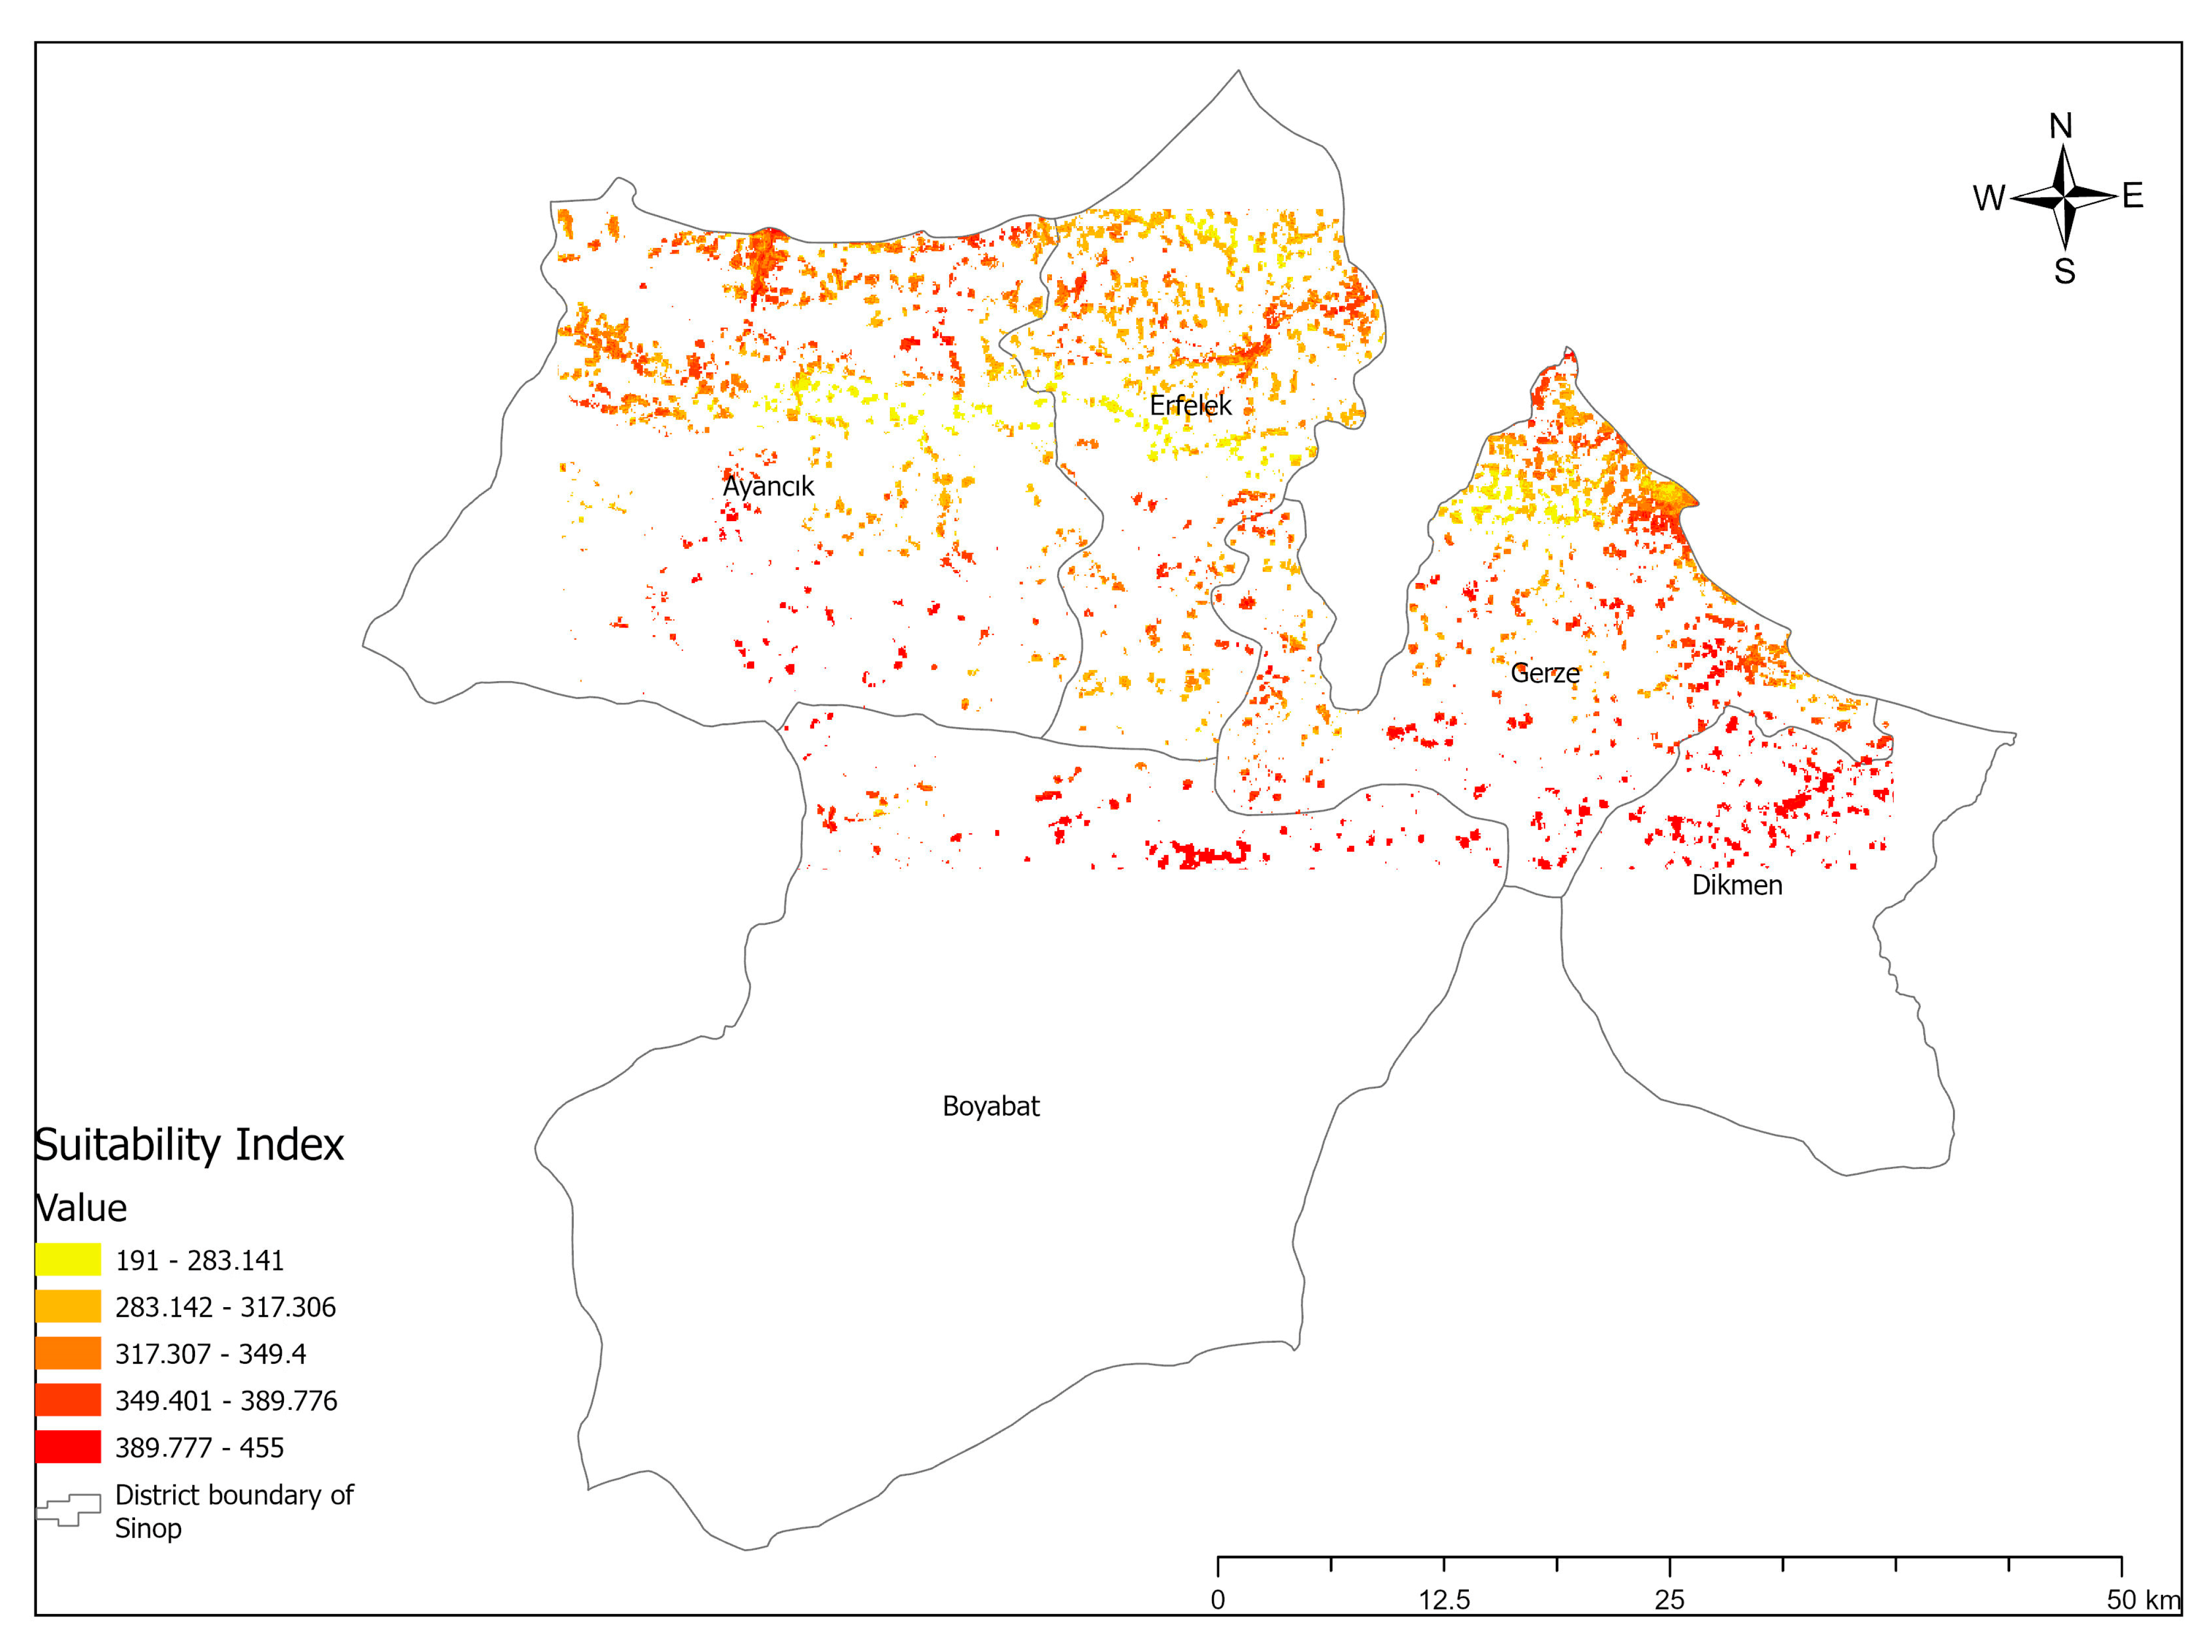
As a result of this process, a suitability index map was generated. The suitability values obtained from the Weighted Sum analysis were interpreted by examining the distribution of raster cells within each district boundary. Analysis results were evaluated based on the spatial distribution and continuity of high-suitability classes (Figure 3).
The obtained suitability distribution was analyzed at the district level; Ayancık, Erfelek, Gerze, Dikmen, and Boyabat were compared, and their spatial suitability levels were classified. Table 1 shows the ranking of the districts for DRC establishment based on the GIS-based spatial suitability analysis results. As a result of the analysis, Dikmen district was identified as the alternative with the highest spatial suitability, due to extensive, continuous high-suitability areas, low-to-moderate slope values, and limited landslide and flood risk. Boyabat district similarly exhibits a high suitability level, with low slope values and limited disaster susceptibility. Gerze district shows moderate suitability, with topographic constraints limiting the continuity of suitable areas. In Ayancık and Erfelek districts, low suitability classes are more prevalent due to high slopes, landslide susceptibility, and coastal-riverine influences. Particularly in Erfelek district, the limited and fragmented suitable areas reduce the overall spatial suitability level.
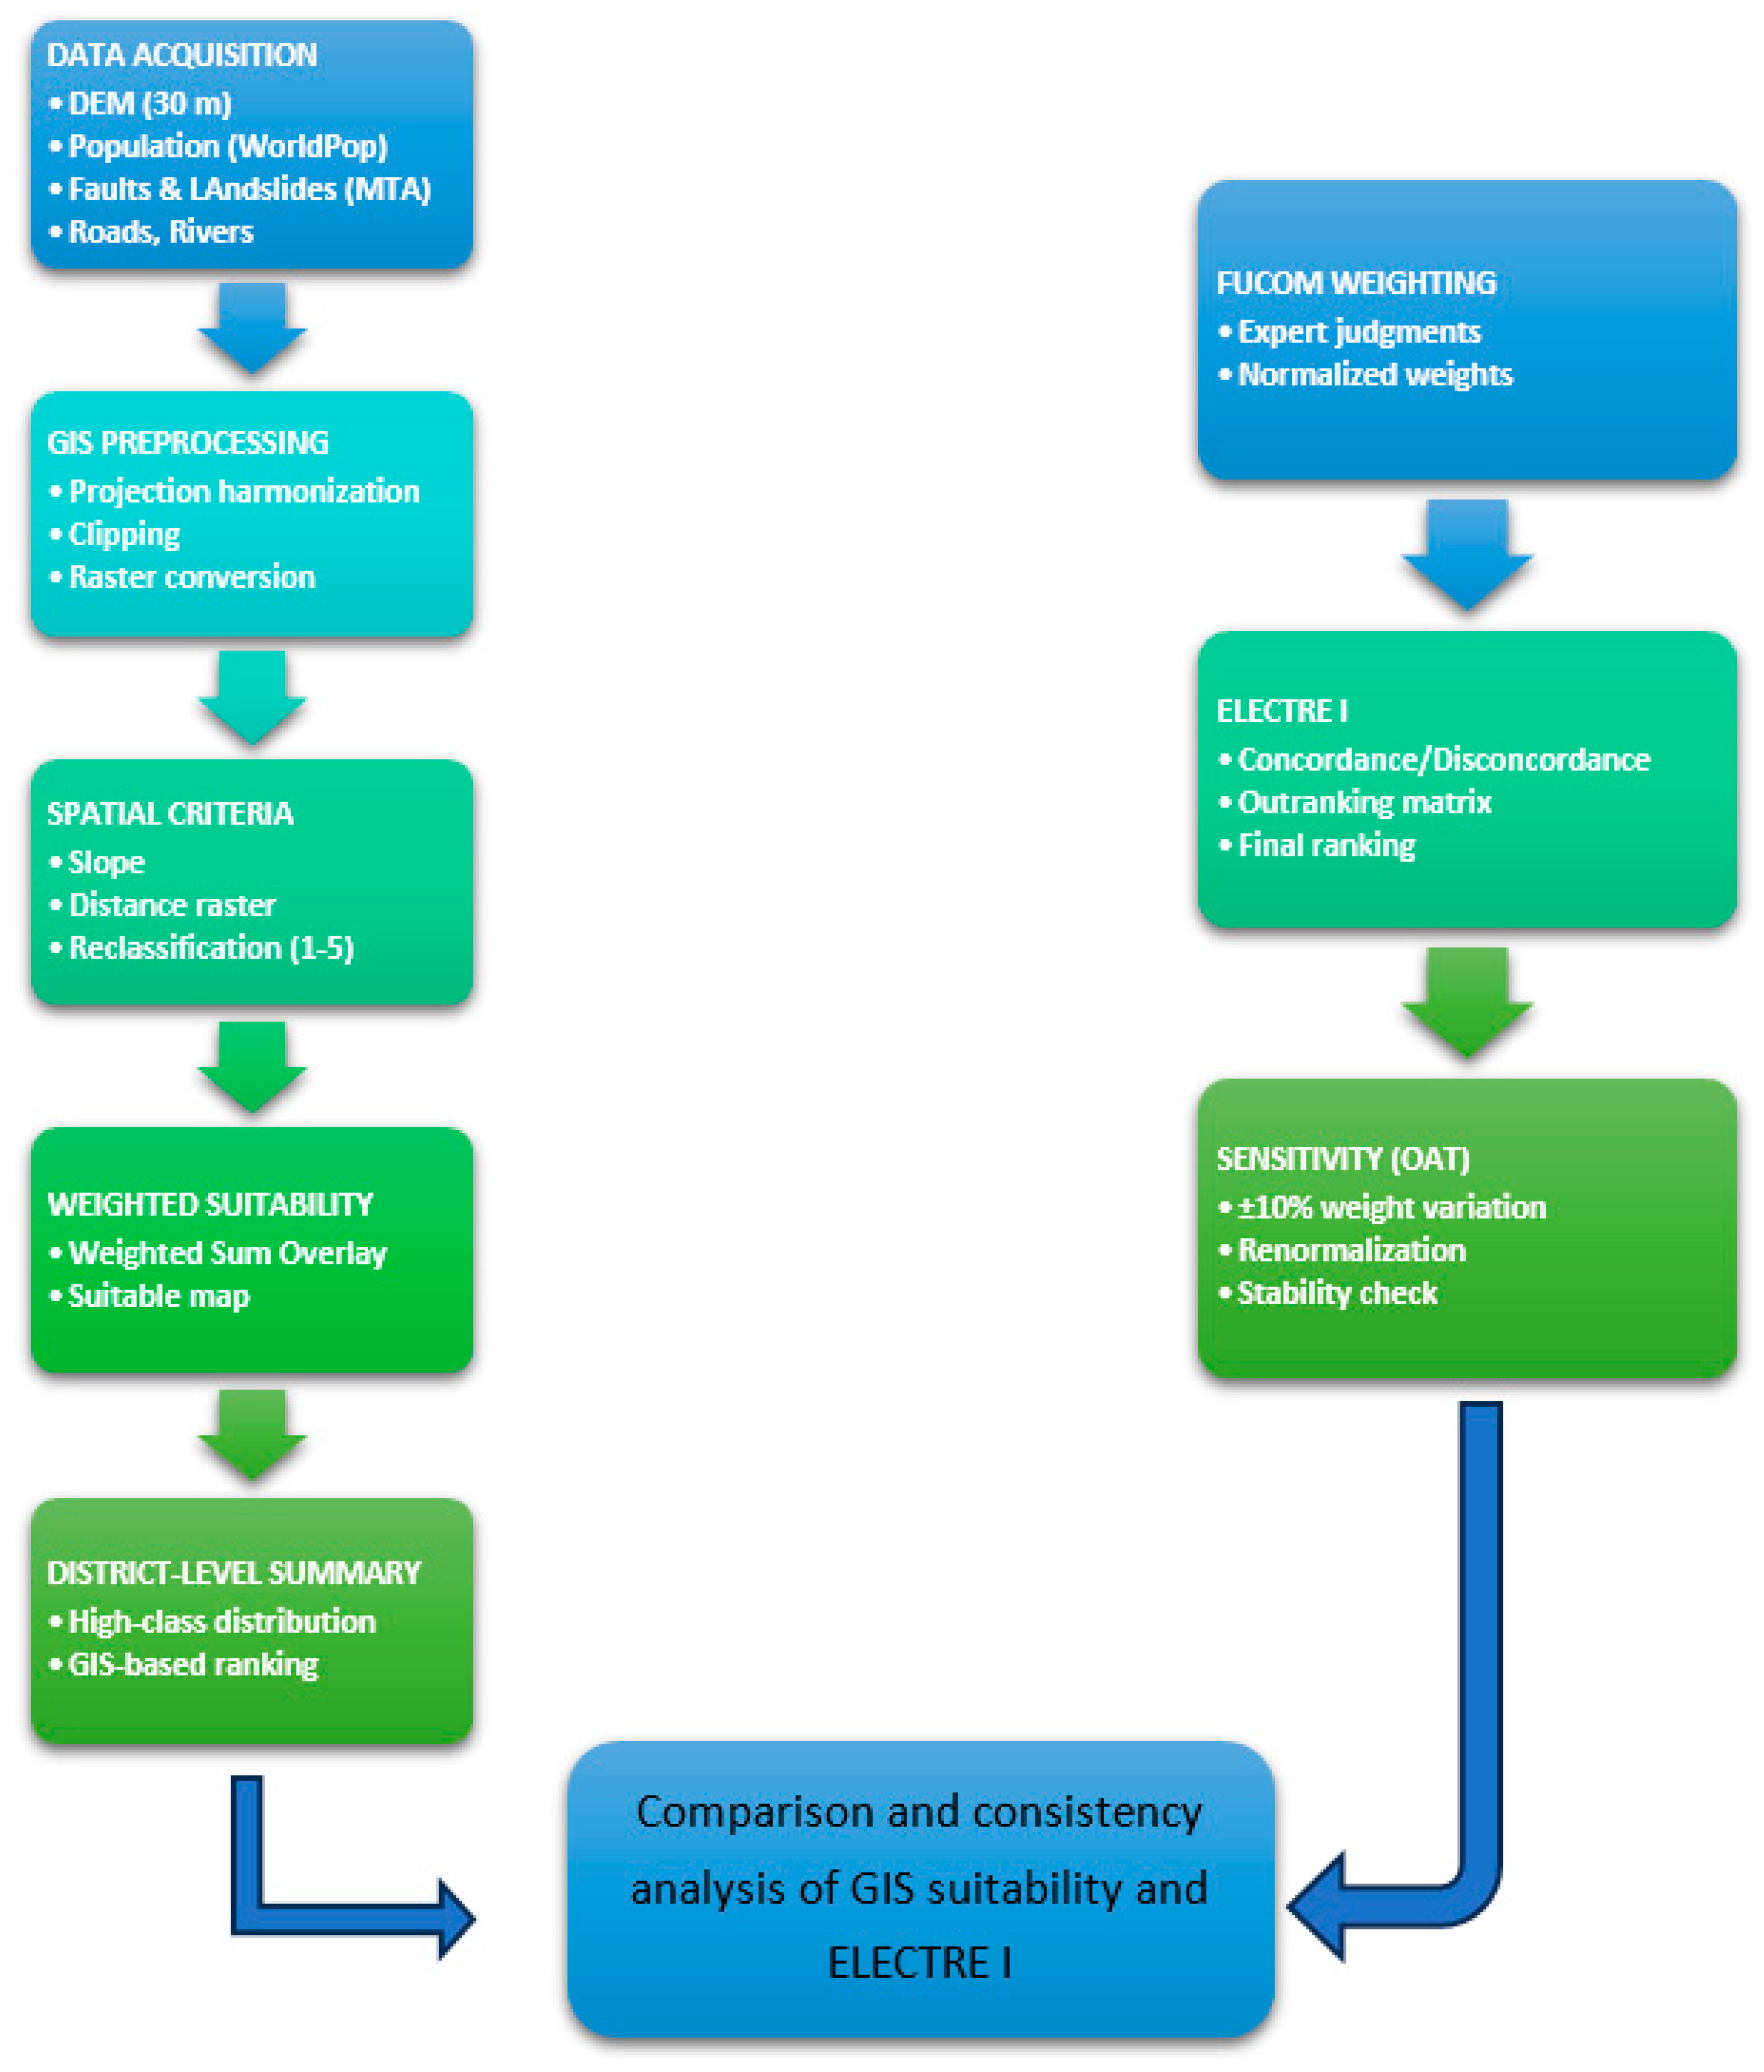
The methodological workflow illustrating the relationship between GIS-based spatial modeling and the FUCOM–ELECTRE decision model is presented in Figure 4.

3.3. Evaluation Criteria and FUCOM Weighting Process

The evaluation criteria used in the Disaster Recovery Center (DRC) site selection process were determined based on the existing literature on disaster risks, infrastructure continuity, accessibility, and institutional requirements, and were explicitly structured for the Sinop University case study. The criteria identified for DRC site selection were addressed under eight primary headings:
C1—Physical Risk: Distance to fault lines, topographic structure, and earthquake, landslide, and flood hazards.
C2—Accessibility: Proximity to main transportation networks and transportation continuity.
C3—Energy Redundancy: Electrical infrastructure, alternative energy sources, and elements ensuring energy continuity.
C4—Telecommunication Redundancy: Factors related to data communication infrastructure, alternative communication lines, and network continuity.
C5—Physical Security: Security risks of the area, as well as its controllability and protectability against external threats.
C6—RTO/RPO Alignment: The compatibility of spatial conditions with the Recovery Time Objective and Recovery Point Objective requirements of information systems.
C7—Environmental Suitability: Spatial characteristics related to land use status, environmental sensitivities, and sustainability.
C8—Legal and Regulation: The suitability of the area in terms of legislation, zoning status, and institutional regulations.
The indicator system was developed through a two-stage screening process. Initially, a set of candidate indicators was identified based on the literature on disaster risk assessment and infrastructure resilience [5,7], as well as the ISO/IEC 27000 series standards [37] and national digital transformation guidelines [38]. These indicators were structured under four main dimensions—physical risk, environmental conditions, infrastructure continuity, and institutional requirements—and subsequently screened based on their relevance to DRC requirements, data availability, and applicability to the study area. As a result of this process, eight criteria were retained as the most representative and applicable set for the analysis.
Although all criteria were evaluated by experts within the FUCOM framework, criteria such as physical risk (C1), accessibility (C2), and environmental suitability (C7) were additionally quantified using GIS-based spatial analysis techniques (e.g., weighted overlay, Euclidean distance, and reclassification). The remaining criteria (C3–C6 and C8) were evaluated based on expert-based qualitative assessment due to the absence of directly measurable spatial data. This approach ensures consistency between expert-based weighting and spatial analysis.
Detailed information regarding the calculation methods, data sources, and data acquisition procedures for each criterion is provided in Table 2. The data used for the criteria were obtained from multiple sources, including national disaster databases (AFAD, MTA), open-source spatial datasets (OpenStreetMap, CORINE), and expert-based field assessments, ensuring both data reliability and contextual relevance.
In the ELECTRE I analysis, a 1–10 scoring scale was used to construct the decision matrix, where 1 represents the lowest suitability and 10 represents the highest suitability. The scoring process was carried out based on predefined and criterion-specific evaluation rules to reduce subjectivity.
All criteria were evaluated independently by experts based on clearly defined criterion descriptions and their domain-specific knowledge. For C1 (Physical Risk), lower exposure to hazards such as earthquakes, landslides, floods, and greater distance from fault lines were considered as higher suitability. For C2 (Accessibility), areas with better proximity to major transportation networks and higher transportation continuity received higher scores. For infrastructure-related criteria, C3 (Energy Redundancy) and C4 (Telecommunication Redundancy), scoring was based on the availability, diversity, and continuity of infrastructure systems. Locations with alternative energy sources and redundant communication networks were assigned higher scores. For C5 (Physical Security), areas with lower security risks and higher controllability and protection capacity were evaluated as more suitable. For C6 (RTO/RPO Alignment), locations that better support recovery time and data continuity requirements were assigned higher scores. For environmental and regulatory criteria, C7 (Environmental Suitability) and C8 (Legal and Regulation), evaluations were based on land-use compatibility, environmental sensitivities, sustainability considerations, and compliance with zoning and regulatory frameworks. Areas with fewer environmental constraints and higher regulatory suitability received higher scores.
The scoring process was conducted independently by experts, and the individual evaluations were subsequently aggregated to form the final decision matrix. This two-stage approach reduced individual bias and ensured a more robust, systematic, and comparable decision-making process.
Importantly, expert evaluations were conducted independently of the GIS-based analysis results. This distinction was intentional and allowed the study to compare data-driven spatial suitability with expert-based decision-making outcomes.
The selection of the Fuzzy FUCOM method for determining criterion weights is based on several methodological advantages over commonly used weighting techniques such as AHP, Entropy, and CRITIC [39,40,41,42]. Unlike the Analytic Hierarchy Process (AHP), which requires $n (n − 1)/2$ pairwise comparisons, FUCOM requires only $n − 1$ comparisons. For the eight criteria considered in this study, this corresponds to 7 comparisons instead of 28, reducing both expert workload and the risk of inconsistency [42].
In contrast to objective methods such as Entropy and CRITIC, which rely solely on data variability [41], FUCOM incorporates expert judgment, making it more suitable for evaluating complex and context-dependent criteria such as those involved in Disaster Recovery Center site selection. Furthermore, the fuzzy extension of FUCOM enables the handling of uncertainty inherent in human decision-making, particularly for qualitative criteria such as physical security and legal conditions, which are critical for digital infrastructure resilience.
Therefore, Fuzzy FUCOM provides a consistent, efficient, and reliable weighting framework that effectively integrates expert knowledge with a mathematically robust structure, making it well-suited for the requirements of this study. This is particularly important in this study, where several criteria (e.g., infrastructure continuity, security, and regulatory suitability) cannot be directly quantified and require expert-based evaluation.
In addition to commonly used weighting approaches, recent studies have explored hybrid weighting methods. In this study, criterion weights were determined using the Fuzzy FUCOM method. However, as demonstrated by Jin et al. [43], the Combination Weighting of Game Theory (CWGT) method offers an advanced approach by integrating subjective and objective weights to reduce bias. However, the application of such hybrid weighting methods requires sufficient objective data, which was limited in the context of this study.
Nevertheless, due to the expert-driven nature of the DRC site selection problem and the limited availability of objective data, the Fuzzy FUCOM method was preferred. FUCOM requires fewer pairwise comparisons, minimizes inconsistencies among evaluations, and ensures a high level of consistency, while its fuzzy structure allows a more realistic representation of expert judgments.
Furthermore, hybrid weighting approaches such as CWGT represent a promising direction for future research to enhance the robustness of decision-making processes.
This study focuses on macro-scale suitability analysis, representing the initial stage of the site selection process. The alternatives were defined at the district level based on the locations of existing university campuses, rather than as specific parcel- or site-level candidates. Accordingly, the study provides a strategic-level comparative evaluation across regions where these campuses are located, rather than conducting micro-scale site selection.
The results reveal the relative suitability of these macro-level alternatives and support decision-making processes at a higher planning level. Therefore, the proposed approach is intended to support strategic-level decision-making rather than detailed site-level implementation. Thus, the study provides a practical basis for decision-makers by identifying priority districts and their associated institutional lands as initial candidate locations for DRC implementation. However, the identification of specific candidate sites (parcels) within the selected districts would require micro-scale analyses based on high-resolution data (e.g., slope, land ownership, and infrastructure), and is considered an important direction for future research. Nevertheless, the existing university-owned lands within the highest-ranking districts serve as the primary candidate locations for immediate strategic consideration.


3.4. Determination of Criterion Weights Using the Fuzzy FUCOM Method

In this study, the Fuzzy Full Consistency Method (Fuzzy FUCOM) was used to determine the weights of the criteria employed in the Disaster Recovery Center (DRC) site selection problem. In this context, the criteria are first arranged by priority level, and comparisons are made only between adjacent criteria [42]. Decision-makers’ evaluations were quantified using linguistic expressions represented by triangular fuzzy numbers.
The C1–C8 criteria identified within the scope of the study were ranked by three expert decision-makers according to their importance levels, and criterion weights were calculated through fuzzy comparisons (see Section 4.1). Individual fuzzy evaluations from the decision-makers were combined using the arithmetic mean. The resulting fuzzy comparisons were analyzed according to the consistency conditions of the FUCOM method, and the final weight values were obtained.
The criterion weights determined by the Fuzzy FUCOM method were used within the ELECTRE I framework to evaluate alternatives. The detailed mathematical framework of the method is presented by Pamučar and Ecer [44].

3.5. Evaluation of Alternatives Using the ELECTRE I Method

In this study, the ELECTRE I method was used to compare alternatives in the Disaster Recovery Center (DRC) site selection problem. This method was preferred because it provides a non-compensatory evaluation structure and an elimination-based outranking approach. This structure is particularly suitable for decision problems involving a limited number of alternatives.
TOPSIS and VIKOR are among the most widely used compensatory MCDM methods in the literature [45]. In compensatory approaches, poor performance in one criterion can be offset by better performance in another. However, in the context of DRC site selection, certain criteria—such as physical risk and regulatory compliance—are critical and cannot be compensated. For example, high accessibility cannot justify a location exposed to significant hazard risks.
Unlike TOPSIS and VIKOR, which are based on distance to ideal solutions or compromise rankings, ELECTRE I uses concordance and discordance relationships to identify and eliminate unsuitable alternatives. This feature provides a more cautious and realistic decision-making framework for critical infrastructure planning, where unacceptable risks must be avoided rather than compensated. This is particularly important in this study, where multiple critical criteria—such as hazard exposure, infrastructure continuity, and regulatory constraints—must be satisfied simultaneously. Therefore, a non-compensatory approach such as ELECTRE I is more appropriate for ensuring that unsuitable alternatives are effectively eliminated.
In the application of the method, alternatives were compared using the criterion weights determined by the FUCOM method. As a result, the relative ranking and dominance relationships among the alternatives were obtained. Finally, the results of the ELECTRE I analysis were comparatively evaluated with the findings of the GIS-based spatial suitability analysis to provide a more comprehensive and integrated interpretation of the decision-making process. The mathematical framework of the ELECTRE method is presented in Benayoun, Roy, and Sussman [46].

4. Findings and Discussion

From a methodological perspective, the integrated Fuzzy FUCOM-ELECTRE I approach proposed in this study offers several significant advantages for critical infrastructure planning. Unlike commonly used compensatory methods such as AHP and TOPSIS, which have been frequently applied in recent regional site selection studies in Türkiye [13,21], the ELECTRE I method adopted here utilizes a non-compensatory structure. This prevents poor performance in critical criteria—such as high physical risk or inadequate infrastructure—from being offset by strengths in other less critical areas. This distinction is vital for Disaster Recovery Center (DRC) site selection, where safety and continuity factors cannot be compromised, a requirement also emphasized in recent disaster-resilient facility planning [20]. Furthermore, the selection of FUCOM addresses the consistency challenges often noted in traditional weighting methods. Similar to recent studies using the Best-Worst Method (BWM) for emergency facility and assembly site selection [14,47], FUCOM facilitates a more efficient and consistent weighting process by requiring significantly fewer pairwise comparisons (n-1) than AHP, thereby reducing expert fatigue and enhancing the mathematical reliability of the weight coefficients.

4.1. Determination of Criterion Weights (Fuzzy FUCOM Results)

In this section, the relative importance levels of the criteria considered in the Disaster Recovery Center (DRC) site selection problem were determined using the Fuzzy FUCOM method. The obtained weight values indicate the relative influence of the criteria on the decision-making process and serve as the basis for the ELECTRE I analysis.
In determining criterion weights, the opinions of three decision-makers with different areas of expertise were used. The first decision-maker is a mapping engineer specializing in spatial analysis and GIS. The second decision-maker is a computer engineer with experience in cybersecurity and digital infrastructure management. The third decision-maker, with a background in electronics and communication engineering, has operational experience in IT infrastructures and network management. This structure enabled the simultaneous and balanced evaluation of physical disaster risks and digital infrastructure continuity requirements in the DRC site selection problem.
The criterion set was developed in line with the literature on disaster management, critical infrastructure planning, and information systems continuity [37,38]. To reflect uncertainties in decision-maker evaluations, the relative importance levels of the criteria were expressed using a linguistic scale represented by triangular fuzzy numbers, as shown in Table 3. This scale consists of five levels ranging from “equally important” to “extremely important” and was converted into quantitative values following the FUCOM approach [44].
The criterion weighting process was conducted based on expert evaluations. A panel of three experts, each with more than 10 years of professional experience in their respective fields, participated in the study. The experts have backgrounds in geomatics engineering and GIS-based spatial analysis, information technologies and digital infrastructure, and electronics and communication systems.
All experts were provided with an identical set of criteria and were asked to independently evaluate and rank them according to their relative importance within the FUCOM framework. The expert evaluations were obtained through direct consultation with the experts. Each expert independently assessed and ranked the criteria based on their professional knowledge and experience, and no interaction between experts was allowed during the evaluation process (Table 4). All expert evaluation forms were distributed and collected directly, resulting in a 100% response rate.
The collected expert judgments were aggregated using the arithmetic mean within the fuzzy FUCOM framework to obtain a unified set of criterion weights. The consistency of the evaluations was ensured by satisfying the full consistency conditions of the FUCOM method, thereby enhancing the reliability of the obtained weight values.
1.
Ranking of criteria according to Decision Maker (DM1):
C 1 > C 2 > C 5 > C 6 > C 8 > C 3 = C 4 > C 7
Based on the priority order of the criteria determined by the decision-makers, the fuzzy relative importance values (weights) between the criteria were calculated using the relevant FUCOM equations [44]. Accordingly:
φ C 1 C 2 = 2 3 , 1 , 3 2 ( 1 , 1 , 1 ) = 2 3 , 1 , 3 2
φ C 2 C 5 = 3 2 , 2 , 5 2 2 3 , 1 , 3 2 = 1 , 2 , 15 4
φ C 5 C 6 = 2 3 , 1 , 3 2 3 2 , 2 , 5 2 = 4 15 , 1 2 ,   1
φ C 6 C 8 = 3 2 , 2 , 5 2 2 3 , 1 , 3 2 = 1 , 2 , 15 4
φ C 8 C 3 = 3 2 , 2 , 5 2 3 2 , 2 , 5 2 = 3 5 , 1 , 5 3
φ C 3 C 4 = 1 , 1 , 1 3 2 , 2 , 5 2 = 2 5 , 1 2 ,   2 3
φ C 4 C 7 = 2 3 , 1 , 3 2 ( 1 , 1 , 1 ) = 2 3 , 1 , 3 2
φ C 1 C 5 = 2 3 , 1 , 3 2 1 , 2 , 15 4 = 2 3 , 2 , 45 8
φ C 2 C 6 = 1 , 2 , 15 4 4 15 , 1 2 , 1 = 4 15 , 1 , 15 4
φ C 5 C 8 = 4 15 , 1 2 , 1 1 , 2 , 15 4 = 4 15 , 1 , 15 4
φ C 6 C 3 = 1 , 2 , 15 4 3 5 , 1 , 5 3 = 3 5 , 2 , 25 4
φ C 8 C 4 = 3 5 , 1 , 5 3 2 5 , 1 2 , 2 3 = 6 25 , 1 2 , 10 9
φ C 3 C 7 = 2 5 , 1 2 , 2 3 2 3 , 1 , 3 2 = 4 15 , 1 2 ,   1
Based on the obtained fuzzy comparisons, an optimization model was formulated to minimize deviations from the relative importance ratios, and the model solution yielded criterion weights for each decision-maker. The model structure was identical across all decision-makers; the model equations are presented in detail for one decision-maker (DM1), and the same structure was applied to the others.
(C1–C8) m i n x
w 1 l 2 3 w 2 u x w 2 l w 5 u x w 5 l 4 15 w 6 u x w 6 l w 8 u x w 8 l 3 5 w 3 u x
w 1 m w 2 m x w 2 m 2 w 5 m x w 5 m 1 2 w 6 m x w 6 m 2 w 8 m x w 8 m w 3 m x
w 1 u 3 2 w 2 l x w 2 u 15 4 w 5 l x w 5 u w 6 l x w 6 u 15 4 w 8 l x w 8 u 5 3 w 3 l x
w 3 l 2 5 w 4 u x w 1 l 2 3 w 5 u x w 2 l 4 15 w 6 u x w 5 l 4 15 w 8 u x w 6 l 3 5 w 3 u x
w 3 m 1 2 w 4 m x w 1 m 2 w 5 m x w 2 m w 6 m x w 5 m w 8 m x w 6 m 2 w 3 m x
w 3 u 2 3 w 4 l x w 1 u 45 8 w 5 l x w 2 u 15 4 w 6 l x w 5 u 15 4 w 8 l x w 6 u 25 4 w 3 l x
w 4 l 2 3 w 7 u x w 8 l 6 25 w 4 u x w 3 l 4 15 w 7 u x
w 4 m w 7 m x w 8 m 1 2 w 4 m x w 3 m 1 2 w 7 m x
w 4 u 3 2 w 7 l x w 8 u 10 9 w 4 l x w 3 u w 7 l x
w 1 l + 4 w 1 m + w 1 u 6 + w 2 l + 4 w 2 m + w 2 u 6 + w 3 l + 4 w 3 m + w 3 4 6 + w 4 l + 4 w 4 m + w 4 4 6 + w 5 l + 4 w 5 m + w 5 u 6 + w 6 l + 4 w 6 m + w 6 u 6 + w 7 l + 4 w 7 m + w 7 u 6 + w 8 l + 4 w 8 m + w 8 u 6 = 1 ;
w 1 l w 1 m w 1 u ; w 2 l w 2 m w 2 u ;   w 3 l w 3 m w 3 u ;
w 4 l w 4 m w 4 u ; w 5 l w 5 m w 5 u ; w 6 l w 6 m w 6 u ;
w 7 l w 7 m w 7 u ;   w 8 l w 8 m w 8 u ;
w 1 l , w 2 l , w 3 l , w 4 l , w 5 l , w 6 l , w 7 l , w 8 l 0 .
Based on the optimization model solution, the consistency deviation values for the decision-makers were calculated as χ1 = 0.078, χ2 = 0.077, and χ3 = 0.074, respectively. These values indicate that the inter-criteria comparisons exhibit an acceptable level of consistency.
2.
Ranking of criteria according to Decision Maker (DM2) (Table 5)
C 2 > C 1 > C 5 = C 6 > C 8 > C 7 > C 3 = C 4
3.
Ranking of criteria according to Decision Maker (DM3) (Table 6)
C 3 > C 4 > C 1 > C 6 > C 5 > C 2 > C 8 > C 7
The criteria weights of the decision-makers are presented in Table 7, Table 8 and Table 9 below.
Specific priority differences were observed among the decision-makers. While the first decision-maker prioritized the physical risk and accessibility criteria, the second decision-maker demonstrated a more balanced distribution of importance across the criteria. The third decision-maker, on the other hand, assigned higher importance to criteria related to telecommunication and infrastructure continuity. These differences indicate that the decision-makers’ areas of expertise were reflected in the evaluation process. However, to ensure objectivity and avoid bias, the individual weight values obtained by the decision-makers were combined using the arithmetic mean and were normalized to ensure comparability (Table 10). All decision-makers were assumed to have equal competence, and equal weight was assigned to each opinion.
When normalized so that the sum of criteria is 1.0:
Upon examining the normalized final weights, physical risk (C1), criteria related to energy and telecommunication continuity (C3–C6), and accessibility (C2) were identified as the most prominent factors (Table 11). These findings indicate that the DRC site selection decision is not limited to physical and spatial suitability alone, but that elements such as digital infrastructure continuity and operational reliability also play a significant role in the decision-making process.
The obtained weight distribution shows that not only physical safety indicators but also critical infrastructure components, such as energy and telecommunications, are decisive in selecting Disaster Recovery Center sites. This is consistent with contemporary approaches to disaster management and critical infrastructure planning that emphasize the continuity of digital infrastructure [2,5,9]. Especially for data centers and enterprise information systems, the critical role of energy and communication redundancy in operational continuity is strongly emphasized in the literature. In this context, the study findings reveal that DRC site selection cannot be reduced solely to topographical safety, but must also be evaluated from the perspective of digital infrastructure resilience.

4.2. Comparison of Alternatives Using the ELECTRE I Method

In the Disaster Recovery Center (DRC) site selection problem, the multi-criteria evaluation of alternatives was performed using the ELECTRE I method, utilizing the final criterion weights obtained from the Fuzzy FUCOM method. Alternative districts were evaluated on a scale of 1–10 for each criterion, and individual scores from decision-makers were combined using the arithmetic mean to construct the decision matrix (Table 12). All criteria were defined as benefit-oriented, and it was assumed that higher scores indicate greater suitability.
To enable comparison of alternatives based on the criteria, the decision matrix was normalized using vector normalization. The resulting normalized decision matrix is presented in Table 13.
x i j * = x i j x i j 2
The normalized decision matrix was multiplied by the final criterion weights obtained from the Fuzzy FUCOM method to create the weighted normalized decision matrix (Y). The weighted, normalized decision matrix was used as the primary input to determine the concordance and discordance sets in the ELECTRE I method.
V i j = N i j × w j
Here
wj = Normalized Weight;
Nj = Normalized decision matrix value.
The values presented in Table 14 were obtained by multiplying the normalized decision matrix elements in Table 11 by the normalized criterion weights in Table 13.
In the ELECTRE I method, concordance and discordance sets were first created to identify dominance relationships among alternatives (Table 15 and Table 16). Concordance sets indicate the criteria for which one alternative performs better than or at least as well as another, whereas discordance sets represent the criteria for which significant negative differences between alternatives occur
C a b = j C ( a , b )   w j
The criterion weights corresponding to the determined concordance sets were summed to construct the concordance matrix; the discordance sets were converted into a discordance matrix by considering the maximum negative differences between criteria. The concordance and discordance matrices are 5 × 5, as there are 5 alternatives for site selection (Table 17 and Table 18).
D a b = m a x j D ( a , b )   v a j v b j m a x j   v a j v b j
The concordance threshold was determined by calculating the average of the elements of the concordance matrix, while the discordance threshold was calculated based on the values of the discordance matrix. According to the ELECTRE I method, for one alternative to be considered dominant over another, the concordance value must be equal to or greater than the determined concordance threshold, and simultaneously, the discordance value must be less than the discordance threshold. Accordingly, the concordance threshold value and discordance threshold value are calculated as follows:

4.2.1. Concordance Threshold Value ( c ¯ ) Calculation

C a b c ¯ ; when the condition is met, alternative ‘a’ is dominant over alternative ‘b’ in terms of concordance.
Threshold value:
c = 1 n ( n 1 ) a b   C a b
Since there are 5 alternatives:
n ( n 1 ) = 5 × 4 = 20
Calculating the concordance average:
a b   C a b = 10.3732
c = 10.3732 20 = 0.51866 0.5187
According to the Concordance Dominance Rule; C a b 0.5187 1 C a b < 0.5187 0

4.2.2. Discordance Threshold Value ( d ¯ ) Calculation

D a b d ¯   i s e   1 D a b > d ¯   i s e   0
D a b d ¯ When the condition is met, an acceptable level of discordance is achieved.
Discordance Threshold Value ( d ¯ )
d ¯ = 11.5398 20 = 0.57699 0.577
According to the Discordance Dominance Rule; D a b 0.577 1 D a b > 0.577 0
By comparing the calculated concordance threshold value with the concordance matrix elements and the discordance threshold value with the discordance matrix elements, the concordance dominance matrix and the discordance dominance matrix were obtained (Table 19 and Table 20).

4.2.3. Ultimate Dominance Matrix (Concordance Dominance ∧ Discordance Dominance)

By evaluating the concordance and discordance dominance matrices together, the final dominance matrix was obtained (Table 21). The final dominance matrix summarizes the mutual outranking relationships among the alternatives and shows the dominance level of each alternative over the others. This structure forms the basis for identifying the most suitable alternatives for Disaster Recovery Center site selection.
Alternative a is considered to dominate alternative b only when both conditions are met simultaneously.
S a b = 1 ,   e ğ e r   C d o m a b = 1   v e   D d o m a b = 1 0 ,   a k s i   h a l d e  
Accordingly, based on the final ELECTRE I ranking, Boyabat and Gerze ranked first with equal dominance levels, while Erfelek, Dikmen, and Ayancık exhibited lower outranking levels, respectively. The total number of dominances gained by the alternatives (Table 22) shows that Boyabat and Gerze have a stronger outranking structure than the other districts. This result stems from these districts demonstrating balanced, high performance across both physical risk criteria and operational criteria, such as energy and telecommunications continuity. In particular, the strong scores obtained in the high-weight physical risk (C1) and energy and telecommunication redundancy (C3–C4) criteria enabled these alternatives to achieve higher dominance in the ELECTRE I outranking structure. This situation indicates the presence of multiple strong candidates for Disaster Recovery Center (DRC) site selection and clearly reflects the non-compensatory, relative outranking-based decision structure of the ELECTRE I method.
In addition to the ranking results, the influence of each criterion on the location selection outcomes was interpreted by jointly considering the FUCOM-derived weights and their role within the ELECTRE I outranking process. In the ELECTRE I method, criterion weights directly contribute to the calculation of concordance indices, which form the fundamental mechanism for establishing dominance relationships among alternatives. Consequently, criteria with higher weights tend to be more decisive in pairwise comparisons and exert a stronger influence on the final ranking.
The findings indicate that C1 (Physical Risk), C2 (Accessibility), and infrastructure-related criteria (C3–C6) play a dominant role in the decision-making process. The higher rankings of Boyabat and Gerze can be attributed to their balanced and strong performance across these higher-weighted criteria. In contrast, C7 (Environmental Suitability) and C8 (Legal and Regulatory) exhibit a more limited influence on the final ranking due to their lower weights and reduced contribution to concordance indices.
Overall, the results demonstrate that DRC site selection decisions are not solely driven by physical spatial suitability, but are primarily shaped by risk mitigation, accessibility, and particularly infrastructure continuity factors. This finding highlights the critical role of operational continuity criteria in decision-making for digital infrastructure planning.

4.2.4. Net Concordance and Net Discordance Indices

To summarize the overall outranking and weakness levels of the alternatives and to support the final dominance matrix results, net concordance and net discordance indices (Table 23) were also calculated. These indices are complementary measures that quantitatively summarize each alternative’s overall concordance superiority and discordance disadvantage relative to the other alternatives. Thus, the dominance matrix results obtained with the ELECTRE I method can be interpreted more comprehensively, and the relative positions of the alternatives are numerically supported. The use of net indices helps better distinguish the alternatives, especially in scenarios where equal dominance arises, thereby enhancing the explanatory power of the decision analysis.
Net Fit (C_net) Formula
C _ n e t ( a ) = b a   C d o m ( a , b ) b a   C d o m ( b , a )
Total concordance superiority of an alternative against others → gain
Total dominance of others against it → loss
Net Discrepancy (D_net) Formula
D _ n e t ( a ) = b a   D d o m ( a , b ) b a   D d o m ( b , a )
If an alternative is ‘better’ in terms of discordance against others → positive
If others dominate it → negative
The dominance relationships obtained from the ELECTRE I analysis indicate that the Boyabat and Gerze districts occupy stronger positions than the other alternatives for selecting a Disaster Recovery Center (DRC) site. These two alternatives stand out for their balanced performance across criteria, including the manageability of physical risks, high accessibility, energy and telecommunications redundancy, and environmental and legal/regulatory aspects.
These findings are also numerically supported by the net concordance (C_net) and net discordance (D_net) indices presented in Table 23. Boyabat exhibits a stronger dominance structure compared to the other alternatives, with high net concordance and low net discordance values. Gerze, on the other hand, demonstrates a stable candidate profile, with positive net concordance and low net discordance values.
Erfelek’s net concordance and net discordance values being close to zero indicate a moderate level of suitability. Dikmen and Ayancık, however, performed worse than the other alternatives due to negative net concordance and positive net discordance values. Ayancık, in particular, emerged as the least suitable alternative.
Overall, the net concordance and net discordance indices are consistent with the dominance matrix and final ranking obtained by the ELECTRE I method, confirming that Boyabat and Gerze represent priority candidates for DRC site selection.

4.3. Comparison of GIS and ELECTRE I Results

When the results of GIS-based spatial suitability analysis and the ELECTRE I method are evaluated together, it is observed that there is no complete overlap in the rankings produced by the two approaches (Table 24). This difference stems from the decision logic underlying each method. GIS analysis reflects spatial suitability based on topographic and physical risk indicators (e.g., slope, landslide, flood susceptibility) using an equally weighted, compensatory weighted-sum approach. In contrast, the ELECTRE I method incorporates continuity-based criteria more prominently, such as energy redundancy, telecommunication continuity, RTO/RPO compliance, and operational reliability, into the decision-making process through a non-compensatory outranking structure.
In this context, while GIS analysis focuses on physical suitability, the ELECTRE approach emphasizes organizational continuity and infrastructure resilience. Therefore, the resulting ranking difference does not indicate a methodological inconsistency but rather reflects the multidimensional nature of the decision problem. The combined evaluation of physical suitability and operational continuity criteria provides a more realistic and sustainable decision framework for digital infrastructure resilience.
The joint evaluation of GIS-based spatial suitability and the ELECTRE I outranking results provides a holistic framework for DRC site selection. While GIS analysis emphasizes physical and topographical suitability, the ELECTRE I method highlights the importance of operational continuity and infrastructure-related criteria.
By synthesizing the results of both approaches, Boyabat emerges as the most suitable alternative due to its balanced and strong performance in both physical suitability and operational resilience. In addition, Gerze represents a viable secondary option, particularly due to its strong performance in continuity-related criteria.
These findings clearly demonstrate that relying on a single evaluation method is insufficient for DRC site selection; therefore, an integrated approach is essential for achieving more reliable and effective decision-making.
These results are generally consistent with previous studies highlighting the limitations of compensatory MCDM methods in critical infrastructure planning, where high-risk conditions may not be adequately offset by strengths in other criteria [20,47]. In line with earlier GIS–MCDM applications, the observed differences between spatial suitability and multi-criteria decision results suggest the importance of jointly considering both physical and operational factors in site selection processes [13,14].

4.4. Sensitivity Analysis

A sensitivity analysis was conducted to evaluate the effect of criterion weights determined by the Fuzzy FUCOM method on the ELECTRE I ranking. The analysis was performed using the one-at-a-time (OAT) weight variation approach, which is commonly used in multi-criteria decision-making literature. In this context, the final normalized weights were taken as the base scenario (S0); a ±10% change was applied to the physical risk (C1) and energy redundancy (C3) criteria, which had the two highest weights in the ranking. In each scenario, the weights were re-normalized, and the ELECTRE I evaluation process was re-executed from the beginning.
The results show that the final ranking of alternatives did not change across all scenarios (Table 25). The ranking determined in the base scenario, Boyabat > Gerze > Erfelek > Dikmen > Ayancık, was preserved even when the C1 and C3 criterion weights were increased or decreased (S1–S4). As shown in Table 23, reasonable weight changes did not alter the final outranking matrix or the relative dominance structure of the alternatives.
This indicates that the proposed decision model is not overly sensitive to the dominance of a specific criterion and that the results maintain their structural stability under reasonable weight changes. In other words, the DRC site selection decision does not depend on the weight of a single criterion; instead, the decision structure relies on the balanced integration of physical risk, operational continuity, and infrastructure resilience criteria.
Consequently, the OAT sensitivity analysis findings support the robustness of the proposed integrated GIS and ELECTRE I approach. This confirms that the Fuzzy FUCOM–ELECTRE I framework produces stable and consistent decision outcomes under varying weighting conditions, reinforcing its suitability for critical infrastructure planning. The model maintains its structural stability even under different decision-maker preferences or weighting uncertainties. However, as only the one-at-a-time variation approach was applied in this study, future research could integrate multi-scenario analyses or Monte Carlo-based probabilistic uncertainty modeling to test simultaneous changes across multiple criteria.

4.5. Limitations of the Study

The Disaster Recovery Center (DRC) site selection model developed within the scope of this study should be evaluated within the context of the datasets and methodological framework employed. The data used in spatial analyses were obtained from various institutional sources and exhibit heterogeneity in spatial resolution and production year. Specifically, the 30 m resolution Digital Elevation Model (DEM), while providing sufficient accuracy at a regional scale, may not fully reflect micro-topographic differences. This situation may lead to minor deviations at the local scale.
The reliance of population, infrastructure, and disaster-susceptibility layers on different production methodologies may introduce some uncertainty regarding spatial and temporal consistency. Although data standardization and harmonization procedures were performed before the analysis, it is not possible to eliminate structural differences among data sources.
In this study, criterion weights were determined based on the opinions of three experts. While the selection of experts from different disciplines contributed to the balanced structuring of the decision process, the limited number of experts may limit the model’s representativeness. Including a broader and interdisciplinary group of experts in future studies could further enhance the robustness of the weighting process. Furthermore, the conducted sensitivity analysis showed that reasonable variations in criterion weights did not affect the ranking of alternatives.
Methodologically, ELECTRE I is a non-compensatory outranking approach that evaluates relative dominance relationships between alternatives. Therefore, the results obtained reflect the comparative superiority of the alternatives rather than their absolute performance. The sensitivity analysis conducted in this study was based on the One-at-a-Time (OAT) weight variation approach. In this method, the weight of one criterion was changed while other criteria were kept constant, and the model results were recalculated. A ±10% change was applied separately to the C1 (Physical Risk) and C3 (Energy Redundancy) criteria.
In future studies, model robustness can be tested more comprehensively through multi-parameter scenario analyses involving simultaneous changes in multiple criteria or through Monte Carlo-based probabilistic uncertainty modeling.
Furthermore, the established criterion system primarily focuses on physical and operational continuity requirements. A limitation of this approach is that broader dimensions such as economic costs, stakeholder preferences, and environmental sustainability (e.g., the carbon footprint of DRCs) were not explicitly considered, although they may also influence site selection decisions. Future research may enhance the indicator system by incorporating more comprehensive and dynamic criteria—including socio-economic impacts and evolving legal and regulatory considerations—to better reflect the complexity of real-world planning contexts.
This study focuses on a macro-scale suitability analysis, representing the initial strategic stage of the site selection process. The results provide a strategic-level comparative evaluation across regions, supporting decision-making at a higher planning level. This macro-level prioritization is consistent with established spatial decision-making frameworks used for large-scale infrastructure and renewable energy site assessments [22,48]. Therefore, the proposed approach is intended to facilitate strategic prioritization rather than detailed site-level implementation. While the transition from macro-level district prioritization to micro-scale parcel analysis—requiring higher-resolution data—remains a prioritized direction for future research as demonstrated in two-phase GIS-MCDM frameworks [47], the identified university-owned lands serve as the primary candidate locations for immediate strategic consideration. The robustness and transferability of this framework suggest its potential for wide application across diverse geographic contexts requiring digital resilience planning.
Beyond the expansion of criteria, future research may explore the integration of intelligent optimization techniques to refine the decision-making process. In particular, machine learning (ML) algorithms can be effectively utilized to analyze historical disaster and environmental data, helping to identify complex risk patterns that can serve as additional inputs for the MCDM model.
Furthermore, the inclusion of more diverse datasets—covering infrastructure, environmental, and population dynamics—may improve the overall robustness and reliability of the framework. These advancements may support the development of more informed decision-making tools for critical infrastructure planning.

4.6. Policy Implications and Model Scalability

From a policy perspective, the findings of this study provide a strategic decision-support framework for regional planning in Sinop Province in alignment with Türkiye’s Provincial Disaster Risk Reduction Plan. The prioritization of alternative districts—such as Boyabat and Gerze—based on both physical suitability and digital infrastructure continuity can inform infrastructure investment decisions and disaster risk reduction policies.
In particular, high-priority zones identified in this study may be considered within zoning and land-use planning processes as potential areas for critical infrastructure and digital resilience development. Conversely, districts such as Dikmen, which demonstrate strong physical suitability but relatively lower infrastructure readiness, highlight areas where targeted investments in energy redundancy and telecommunication infrastructure are needed. These results can be directly integrated into provincial spatial planning processes, such as land-use planning, zoning regulations, and disaster risk reduction strategies, to support evidence-based decision-making.
Furthermore, the integration of operational continuity criteria—such as energy redundancy and RTO/RPO compliance—provides a more comprehensive basis for planning compared to traditional spatial approaches. This facilitates coordinated decision-making among key stakeholders, including Sinop University, AFAD, and local municipalities, and supports the development of Disaster Recovery Centers (DRCs) that are both physically suitable and operationally sustainable.
Overall, these findings offer actionable policy insights for integrating digital resilience into sustainable urban planning and disaster risk reduction strategies in Sinop Province.
The proposed Fuzzy FUCOM–ELECTRE I framework is designed with a modular and hierarchical structure, supporting its scalability and replicability across different geographical scales and institutional contexts. For application to larger regions or different provinces, spatial criteria (e.g., landslide susceptibility or distance to fault lines) can be updated using locally available GIS datasets without altering the core mathematical structure of the model. Furthermore, the framework can be adapted to different institutional settings—such as financial centers, healthcare systems, or industrial facilities—by redefining the expert-based criteria in line with specific operational priorities (e.g., supply chain accessibility or telecommunication infrastructure). This flexibility allows the model to function as a generalizable decision-support framework for resilient infrastructure planning beyond the current case study.

5. Conclusions

This study presented an integrated decision approach that addresses the Disaster Recovery Center (DRC) site selection problem not only within the framework of physical spatial suitability but also by encompassing the dimensions of digital infrastructure continuity and organizational resilience. The comparative use of GIS-based spatial suitability analysis and the Fuzzy FUCOM-based ELECTRE I outranking method revealed that different decision logics can yield different evaluations of alternatives.
While GIS analysis primarily reflected topographical and physical risk indicators, the ELECTRE I method more prominently incorporated operational continuity criteria, such as energy redundancy, telecommunication continuity, and RTO/RPO compliance, into the decision process. This indicates that DRC site selection cannot be reduced solely to topographical safety, and that the digital infrastructure resilience dimension plays a significant role in the decision-making structure.
According to the FUCOM results, physical risk (C1) received the highest normalized weight (0.1908), followed by energy redundancy (C3) (0.1581) and physical security (C5) (0.1275). This indicates that risk-related and infrastructure continuity criteria play a dominant role in the decision-making process. As a result of the ELECTRE I analysis, Boyabat and Gerze districts were identified as the strongest alternatives with equal dominance levels. The lack of a complete ranking overlap between GIS and ELECTRE I results was interpreted as a structural difference arising from the different representations of physical suitability and operational resilience dimensions, rather than a methodological contradiction.
The conducted sensitivity analysis showed that the model maintained ranking stability under ±10% changes in the weights of the C1 and C3 criteria. This finding supports the robustness of the proposed decision approach under reasonable levels of weight uncertainty.
Based on the comparative results of GIS and ELECTRE analyses (Table 22), practical implications can be developed for decision-makers. While GIS-based analysis identified Dikmen as the most suitable location in terms of physical and topographical conditions, the ELECTRE results highlight the importance of operational continuity factors in final decision-making. Boyabat, which ranked high in both methods and achieved the top position in the ELECTRE analysis, can be considered the primary candidate for DRC establishment. Therefore, priority investments should be directed toward this district.
Gerze, which improved its ranking in the ELECTRE analysis due to strong performance in continuity-related criteria, represents a viable secondary alternative. Strengthening infrastructure investments in this region may further enhance its suitability.
Although Dikmen demonstrates strong physical suitability, its lower ranking in the ELECTRE analysis indicates the need for improvements in operational continuity factors such as energy redundancy and telecommunication infrastructure before it can be considered a primary option.
Erfelek showed moderate performance in the ELECTRE analysis despite low spatial suitability. Targeted improvements in accessibility and the mitigation of physical risk conditions may increase its potential.
Ayancık, which ranked low in both methods, currently has limited suitability for DRC establishment. Significant improvements in both physical and infrastructure-related criteria would be required for future consideration.
From a practical perspective, these findings provide guidance for regional planning in Sinop by identifying priority areas such as Boyabat and Gerze for DRC establishment and highlighting infrastructure gaps in districts such as Dikmen. This approach supports informed decision-making in alignment with Türkiye’s Provincial Disaster Risk Reduction Plan and contributes to more resilient and sustainable urban development.
In conclusion, the study demonstrates that combining spatial analysis with a non-compensatory outranking approach provides a more comprehensive evaluation framework for critical digital infrastructure planning. This study contributes to the literature by comparatively evaluating GIS-based spatial analysis and a non-compensatory ELECTRE I approach, while explicitly incorporating digital infrastructure continuity into DRC site selection decisions. The proposed framework offers a viable decision-support model that can contribute to sustainable, resilient digital infrastructure planning for universities and similar institutional structures. Its modular design supports high adaptability to different geographical regions and various institutional contexts—such as healthcare or financial systems—through the modification of spatial datasets and evaluation criteria.
Despite these contributions, the study has certain limitations. The analysis is based on heterogeneous spatial datasets and a limited number of experts, which may affect the generalizability of the results. In addition, some criteria were evaluated based on expert judgment due to the lack of measurable spatial data. Future studies may expand the expert group, incorporate more detailed datasets, and apply the proposed framework under different geographical and scenario-based conditions.

Author Contributions

Conceptualization, A.U. and G.U.; methodology, A.U.; software, G.U.; validation, A.U. and G.U.; formal analysis, A.U.; investigation, A.U.; resources, G.U.; data curation, G.U.; writing—original draft preparation, A.U.; writing—review and editing, G.U.; visualization, G.U.; supervision, A.U.; project administration, A.U. and G.U. All authors have read and agreed to the published version of the manuscript.

Funding

This research received no external funding.

Institutional Review Board Statement

Not applicable.

Informed Consent Statement

Not applicable.

Data Availability Statement

The spatial datasets used in this study were obtained from publicly accessible national open data portals, the General Directorate of Mineral Research and Exploration (MTA), and satellite imagery sources, as detailed in the Materials and Methods section. All processed data and analytical results are included in the article. Further information is available from the corresponding author upon reasonable request.

Conflicts of Interest

The authors declare no conflict of interest.

References

  1. United Nations Office for Disaster Risk Reduction. Global Assessment Report on Disaster Risk Reduction 2022; UNDRR: Geneva, Switzerland, 2022. [Google Scholar]
  2. Zhang, J.; Yang, Z.; He, B. Does Digital Infrastructure Improve Urban Economic Resilience? Sustainability 2023, 15, 14289. [Google Scholar] [CrossRef] [Scilit]
  3. United Nations Office for Disaster Risk Reduction. Sendai Framework for Disaster Risk Reduction 2015–2030. Available online: https://www.undrr.org/publication/sendai-framework-disaster-risk-reduction-2015-2030 (accessed on 2 May 2025).
  4. Cutter, S.L.; Burton, C.G.; Emrich, C.T. Disaster Resilience Indicators for Benchmarking Baseline Conditions. J. Homel. Secur. Emerg. Manag. 2010, 7, 51. [Google Scholar] [CrossRef] [Scilit]
  5. Galaitsi, S.E.; Pinigina, E.; Keisler, J.M.; Pescaroli, G.; Keenan, J.M.; Linkov, I. Business Continuity Management, Operational Resilience, and Organizational Resilience: Commonalities, Distinctions, and Synthesis. Int. J. Disaster Risk Sci. 2023, 14, 713–721. [Google Scholar] [CrossRef] [Scilit]
  6. Steen, R.; Haug, O.J.; Patriarca, R. Business Continuity and Resilience Management: A Conceptual Framework. J. Contingencies Crisis Manag. 2024, 32, e12501. [Google Scholar] [CrossRef] [Scilit]
  7. Kesa, D.M. Ensuring Resilience: Integrating IT Disaster Recovery Planning and Business Continuity for Sustainable Information Technology Operations. World J. Adv. Res. Rev. 2023, 18, 970–992. [Google Scholar] [CrossRef] [Scilit]
  8. Rouco, J.C.; Figueiredo, P.C.N. Business Continuity Management and Resilience; IGI Global: Hershey, PA, USA, 2024. [Google Scholar] [CrossRef] [Scilit]
  9. Lu, B.; Shi, R.; Wang, Y. Digitalization and Resilience Enhancement: How Digital Infrastructure Construction Affects Urban Resilience. PLoS ONE 2025, 20, e0339790. [Google Scholar] [CrossRef] [Scilit]
  10. Snedaker, S. Business Continuity and Disaster Recovery Planning for IT Professionals; Syngress: Burlington, MA, USA, 2007. [Google Scholar]
  11. Xu, J.; Yin, X.; Chen, D.; An, J.; Nie, G. Multi-Criteria Location Model of Earthquake Evacuation Shelters. Int. J. Disaster Risk Reduct. 2016, 20, 51–62. [Google Scholar] [CrossRef] [Scilit]
  12. Gutjahr, W.J.; Nolz, P.C. Multicriteria Optimization in Humanitarian Aid. Eur. J. Oper. Res. 2016, 252, 351–366. [Google Scholar] [CrossRef] [Scilit]
  13. Kabak, M.; Erbaş, M.; Çetinkaya, C.; Özceylan, E. A GIS-Based MCDM Approach for the Evaluation of Bike-Share Stations. J. Clean. Prod. 2018, 201, 49–60. [Google Scholar] [CrossRef] [Scilit]
  14. Nyimbili, P.H.; Erden, T. Comparative Evaluation of GIS-Based Best–Worst Method for Emergency Facility Planning. Nat. Hazards 2021, 105, 1031–1067. [Google Scholar] [CrossRef] [Scilit]
  15. Feng, Z.; Li, G.; Wang, W.; Zhang, L.; Xiang, W.; He, X.; Zhang, M.; Wei, N. Emergency Logistics Centers Site Selection by Multi-Criteria Decision-Making and GIS. Int. J. Disaster Risk Reduct. 2023, 96, 103921. [Google Scholar] [CrossRef] [Scilit]
  16. Horney, J.A.; Dwyer, C.; Chirra, B.; McCarthy, K.; Shafer, J.; Smith, G. Measuring Successful Disaster Recovery. Int. J. Mass. Emergencies Disasters 2018, 36, 1–22. [Google Scholar] [CrossRef] [Scilit]
  17. Turgut, B.T.; Taş, G.; Herekoğlu, A.; Tozan, H.; Vayvay, Ö. A Fuzzy AHP-Based Decision Support System for Disaster Center Location Selection. Disaster Prev. Manag. Int. J. 2011, 20, 499–520. [Google Scholar] [CrossRef] [Scilit]
  18. Liu, Q.; Ruan, X.; Shi, P. Selection of Emergency Shelter Sites for Seismic Disasters in Mountainous Regions: Lessons from the 2008 Wenchuan Earthquake. J. Asian Earth Sci. 2011, 40, 926–934. [Google Scholar] [CrossRef] [Scilit]
  19. Dehnavi Eelagh, M.; Abbaspour, R.A. A Location-Allocation Optimization Model for Post-Earthquake Emergency Shelters Using Network-Based Multi-Criteria Decision-Making. Decis. Anal. J. 2024, 10, 100430. [Google Scholar] [CrossRef] [Scilit]
  20. Ortiz-Barrios, M.; Gul, M.; López-Meza, P.; Yucesan, M.; Navarro-Jiménez, E. Evaluation of Hospital Disaster Preparedness by MCDM: Turkish Case. Int. J. Disaster Risk Reduct. 2020, 49, 101748. [Google Scholar] [CrossRef] [Scilit] [PubMed]
  21. Boyacı, A.Ç.; Şişman, A. Pandemic Hospital Site Selection: A GIS-Based MCDM Approach Employing Pythagorean Fuzzy Sets. Environ. Sci. Pollut. Res. 2022, 29, 1985–1997. [Google Scholar] [CrossRef] [Scilit] [PubMed]
  22. Villacreses, G.; Gaona, G.; Martínez-Gómez, J.; Jijón, D.J. Wind Farms Suitability Using GIS and MCDM. Renew. Energy 2017, 109, 275–286. [Google Scholar] [CrossRef] [Scilit]
  23. Wang, H.; Lin, J.-L.; Chen, Z.-S.; Wang, Z. Large-Scale Group Decision Making for Disaster Recovery Center Location Selection. Inf. Sci. 2025, 700, 121854. [Google Scholar] [CrossRef] [Scilit]
  24. Trivedi, A. A Multi-Criteria Decision Approach Based on DEMATEL to Assess Shelter Site Selection. Int. J. Disaster Risk Reduct. 2018, 31, 722–728. [Google Scholar] [CrossRef] [Scilit]
  25. Najafi, M.; Eshghi, K.; Dullaert, W. A Multi-Objective Robust Optimization Model for Logistics Planning in the Earthquake Response Phase. Transp. Res. Part E Logist. Transp. Rev. 2013, 49, 217–249. [Google Scholar] [CrossRef] [Scilit]
  26. Mohammadi, R.; Ghomi, S.F.; Jolai, F. Prepositioning Emergency Earthquake Response Supplies: A New Multi-Objective PSO Algorithm. Appl. Math. Model. 2016, 40, 5183–5199. [Google Scholar] [CrossRef] [Scilit]
  27. Ayyıldız, E.; Erdoğan, M.; Gül, M. An Integrated Intuitionistic Fuzzy Framework for Emergency Response Center Location Planning in Industrial Areas. Int. J. Crit. Infrastruct. Prot. 2026, 52, 100813. [Google Scholar] [CrossRef] [Scilit]
  28. Desticioğlu Taşdemir, B. Locating Emergency Stations Using Multi-Criteria Decision-Making (MCDM) Methods: Application of Ankara Province. Eurasia Proc. Sci. Technol. Eng. Math. 2024, 28, 448–461. [Google Scholar] [CrossRef] [Scilit]
  29. Liu, K. GIS-Based MCDM Framework Combined with Coupled Multi-Hazard Assessment for Site Selection of Post-Earthquake Emergency Medical Service Facilities in Wenchuan, China. Int. J. Disaster Risk Reduct. 2022, 73, 102873. [Google Scholar] [CrossRef] [Scilit]
  30. Atmaca, E.; Aktaş, E.; Öztürk, H.N. Evaluated Post-Disaster and Emergency Assembly Areas Using Multi-Criteria Decision-Making Techniques: A Case Study of Turkey. Sustainability 2023, 15, 8350. [Google Scholar] [CrossRef] [Scilit]
  31. Choukolaei, H.A.; Ghasemi, P.; Goodarzian, F. Evaluating the Efficiency of Relief Centers in Disaster and Epidemic Conditions Using Multi-Criteria Decision-Making Methods and GIS: A Case Study. Int. J. Disaster Risk Reduct. 2023, 85, 103512. [Google Scholar] [CrossRef] [Scilit] [PubMed]
  32. Yang, C.-L.; Yuan, B.J.C.; Huang, C.-Y. Key Determinants for IT Disaster Recovery Site Selection. Sustainability 2015, 7, 6149–6188. [Google Scholar] [CrossRef] [Scilit]
  33. Yang, C.-L.; Huang, C.-Y.; Kao, Y.-S.; Tasi, Y.-L. Disaster Recovery Site Selection for Academic Big Data. Eurasia J. Math. Sci. Technol. Educ. 2017, 13, 4553–4589. [Google Scholar] [CrossRef] [Scilit]
  34. Stevens, F.R.; Gaughan, A.E.; Linard, C.; Tatem, A.J. Disaggregating census data for population mapping using random forests with remotely-sensed and ancillary data. PLoS ONE 2015, 10, e0107042. [Google Scholar] [CrossRef] [Scilit]
  35. Fan, J.; Han, F.; Liu, H. Challenges of big data analysis. Natl. Sci. Rev. 2014, 1, 293–314. [Google Scholar] [CrossRef] [Scilit]
  36. Küçük, K.; Anbaroğlu, B. OpenStreetMap Binalarının Mekansal Doğruluğunun Analiz Edilmesi. Türkiye Coğrafi Bilgi Sist. Derg. 2019, 1, 5–13. [Google Scholar]
  37. ISO/IEC Standard No. 27001:2013; Information Technology—Security Techniques—Information Security Management Systems—Requirements. International Organization for Standardization & International Electrotechnical Commission: Geneva, Switzerland, 2013.
  38. Presidency of the Republic of Türkiye Digital Transformation Office (DTO). Information and Communication Security Audit Guide (Version 1.0). 2021. Available online: https://ms.hmb.gov.tr/uploads/2021/12/BG_Denetim_Rehberi-1.pdf (accessed on 23 March 2025).
  39. Saaty, T.L. Decision Making with the Analytic Hierarchy Process. Int. J. Serv. Sci. 2008, 1, 83–98. [Google Scholar] [CrossRef] [Scilit]
  40. Hwang, C.L.; Yoon, K. Multiple Attribute Decision Making: Methods and Applications; Springer: Berlin/Heidelberg, Germany, 1981. [Google Scholar] [CrossRef] [Scilit]
  41. Diakoulaki, D.; Mavrotas, G.; Papayannakis, L. Determining Objective Weights in Multiple Criteria Problems: The CRITIC Method. Comput. Oper. Res. 1995, 22, 763–770. [Google Scholar] [CrossRef] [Scilit]
  42. Pamučar, D.; Stević, Ž.; Sremac, S. FUCOM Method for Determining Weight Coefficients. Symmetry 2018, 10, 393. [Google Scholar] [CrossRef] [Scilit]
  43. Jin, T.; Zhang, P.; Niu, Y.; Lv, X. Integrating Combination Weighting of Game Theory and Fuzzy Comprehensive Evaluation for Selecting Deep Foundation Pit Support Scheme. Buildings 2024, 14, 619. [Google Scholar] [CrossRef] [Scilit]
  44. Pamučar, D.; Ecer, F. FUCOM-F Method under Fuzziness. Facta Univ. Ser. Mech. Eng. 2020, 18, 419–437. [Google Scholar] [CrossRef] [Scilit]
  45. Opricovic, S.; Tzeng, G.H. Compromise Solution by MCDM Methods: VIKOR vs. TOPSIS. Eur. J. Oper. Res. 2004, 156, 445–455. [Google Scholar] [CrossRef] [Scilit]
  46. Benayoun, R.; Roy, B.; Sussman, B. ELECTRE: Une Méthode pour Guider le Choix en Présence de Points de Vue Multiples; Note de Travail No. 49; SEMA (Métro International): Paris, France, 1966. [Google Scholar]
  47. Yıldırım, R.E.; Şişman, A. Spatial Decision Support for Emergency Assembly Places Using GIS and MCDM. Sustainability 2025, 17, 2144. [Google Scholar] [CrossRef] [Scilit]
  48. Nassar, A.K.; Al-Dulaimi, O.; Fakhruldeen, H.F.; Sapaev, I.; Jabbar, F.I.; Dawood, I.I.; Khalaf, D.H.; Algburi, S. Multi-Criteria GIS-Based Approach for Optimal Site Selection of Solar and Wind Energy. Unconv. Resour. 2025, 7, 100192. [Google Scholar] [CrossRef] [Scilit]
Figure 1. Location map for Sinop University DRM site selection.
Sustainability 18 04543 g001
Figure 2. Spatial data layers used in GIS-based multi-criteria analysis (DEM (a), slope (b), population (c), landslide (d), fault (e), river (f), and road (g)).
Sustainability 18 04543 g002aSustainability 18 04543 g002bSustainability 18 04543 g002c
Figure 3. GIS based spatial suitability map generated using the Weighted Sum method (higher values indicate higher suitability).
Sustainability 18 04543 g003
Figure 4. Comparative Decision Support Framework Based on GIS and “FUCOM+ELECTRE I”.
Sustainability 18 04543 g004
Table 1. Ranking of Districts for DRM Site Selection Based on GIS-Based Suitability Analysis.
OrderDistrictSuitability LevelSuitability Index Value
1DikmenVery High390–455
2BoyabatHigh349–390
3GerzeMedium317–349
4AyancıkLow283–317
5ErfelekVery Low191–283
Table 2. Summary of evaluation criteria, calculation methods, and data sources.
Code Criterion Calculation Method Data Source Data Acquisition
C1Physical RiskGIS-Based Weighted Overlay AnalysisAFAD/MTANational GIS Portals
C2AccessibilityGIS-Based Euclidean Distance AnalysisOpenStreetMapGIS Extraction
C3Energy RedundancyExpert-Based Qualitative EvaluationExpert PanelExpert Knowledge/Site Survey
C4Telecommunication RedundancyExpert-Based Qualitative EvaluationExpert PanelExpert Knowledge/Site Survey
C5Physical SecurityExpert-Based Qualitative EvaluationExpert PanelExpert Knowledge/Site Survey
C6RTO/RPO AlignmentExpert-Based Qualitative EvaluationExpert PanelLiterature & Expert Knowledge
C7Environmental SuitabilityGIS-Based ReclassificationCORINE Land CoverCopernicus Data
C8Legal & RegulationExpert-Based Qualitative EvaluationExpert PanelRegulatory Framework & Zoning Plans
Note: AFAD refers to the Disaster and Emergency Management Authority of Türkiye, and MTA refers to the General Directorate of Mineral Research and Exploration. Quantitative criteria were derived using GIS-based spatial analysis, while qualitative criteria were evaluated based on expert judgment due to the lack of directly measurable spatial data.
Table 3. Triangular Fuzzy Scale Used for Criterion Comparisons.
DescriptionSignificance Level (l, m, u)
Equally Important (EI)(1, 1, 1)
Slightly Important (SI)(2/3, 1, 3/2)
Important (I)(3/2, 2, 5/2)
Very Important (VI)(5/2, 3, 7/2)
Extremely Important (EI)(7/2, 4, 9/2)
Table 4. Fuzzy linguistic expressions between consecutive criterion pairs are determined by DM1.
C 1 C 2 C 2 C 5 C 5 C 6 C 6 C 8 C 8 C 3 C 3 C 4 C 4 C 7
SIISIIIEISI
Table 5. Fuzzy linguistic expressions between consecutive criterion pairs are determined by DM2.
C 2 C 1 C 1 C 5 C 5 C 6 C 6 C 8 C 8 C 7 C 7 C 3 C 3 C 4
SIIEISISISIEI
Table 6. Fuzzy linguistic expressions between consecutive criterion pairs are determined by DM3.
C 3 C 4 C 4 C 1 C 1 C 6 C 6 C 5 C 5 C 2 C 2 C 8 C 8 C 7
IIISISISISI
Table 7. Criterion weights for DM1 (Fuzzy FUCOM results).
CriterionWeight
wc10.2940479
wc20.1764288
wc30.05712633
wc40.05712625
wc50.150509
wc60.150509
wc70.05712633
wc80.05712633
Table 8. Criterion weights for DM2 (Fuzzy FUCOM results).
CriterionWeight
wc10.1417769
wc20.1194077
wc30.11940766
wc40.1194077
wc50.11940766
wc60.11940766
wc70.11940768
wc80.1194077
Table 9. Criterion weights for DM3 (Fuzzy FUCOM results).
CriterionWeight
wc10.1322963
wc20.08147504
wc30.2942154
wc40.1471077
wc50.1097650
wc60.1028245
wc70.0633136
wc80.06890176
Table 10. Arithmetic mean of the criteria for the three decision-makers.
CriterionCombined Weight
wc10.1893737
wc20.1257705
wc30.1569165
wc40.1078805
wc50.1265605
wc60.1242470
wc70.0799492
wc80.0818119
Total = 0.9925098. Note: The sum of the combined weights is 0.9925, and the final weights have been normalized for comparability.
Table 11. Normalized final criterion weights.
CriterionAverage WeightNormalized Weight
wc10.189373700.19080282
wc20.125770510.12671965
wc30.156916460.15810064
wc40.107880550.10869468
wc50.126560550.12751565
wc60.124247050.12518469
wc70.079949200.08055254
wc80.081811930.08242933
Total0.99250981.0
Table 12. Average Decision Matrix.
AlternativeC1C2C3C4C5C6C7C8
Ayancık2.004.003.333.674.333.003.335.00
Erfelek4.006.335.335.336.005.676.006.33
Boyabat8.005.008.008.007.007.677.007.00
Dikmen4.673.004.004.005.004.005.005.00
Gerze6.007.337.007.007.006.007.007.00
Table 13. Standard Decision Matrix (X) Normalized by Vector Norm.
AlternativeC1 Physical RiskC2 AccessibilityC3 Energy RedundancyC4 Telecom RedundancyC5 Physical SecurityC6 RTO/RPO ComplianceC7 Environmental ComplianceC8 Legal/Regulation
Ayancık0.1679490.3335680.2565350.2807520.3247760.2433500.2553330.364596
Erfelek0.3358990.5278710.4106110.4077410.4500370.4599310.4600590.461578
Boyabat0.6717970.4169600.6163010.6119940.5250430.6221650.5367350.510434
Dikmen0.3921620.2501760.3081500.3059970.3750300.3244670.3833820.364596
Gerze0.5038480.6112630.5392630.5354950.5250430.4867000.5367350.510434
Table 14. Weighted Standard Decision Matrix (Y).
AlternativeC1C2C3C4C5C6C7C8
Ayancık0.032045140.042269620.040558350.030516250.041414020.030463690.020567720.03005340
Erfelek0.064090480.066891630.064917860.044319280.057386760.057576320.037058920.03804757
Boyabat0.128180760.052837030.097437580.066520490.066951200.077885530.043235370.04207473
Dikmen0.074825620.031702220.048718710.033260250.047822190.040618300.030882390.03005340
Gerze0.096135620.077459030.085257830.058205460.066951200.060927390.043235370.04207473
Table 15. Table of Concordance Sets.
ComparisonCompatibility Set (C)
Ayancık → Erfelek
Ayancık → Boyabat
Ayancık → DikmenC2, C8
Ayancık → Gerze
Erfelek → AyancıkC1, C2, C3, C4, C5, C6, C7, C8
Erfelek → BoyabatC2
Erfelek → DikmenC2, C3, C4, C5, C6, C7, C8
Erfelek → Gerze
Boyabat → AyancıkC1, C2, C3, C4, C5, C6, C7, C8
Boyabat → ErfelekC1, C3, C4, C5, C6, C7, C8
Boyabat → DikmenC1, C2, C3, C4, C5, C6, C7, C8
Boyabat → GerzeC1, C3, C4, C5, C6, C7, C8
Dikmen → AyancıkC1, C3, C4, C5, C6, C7, C8
Dikmen → ErfelekC1
Dikmen → Boyabat
Dikmen → Gerze
Gerze → AyancıkC1, C2, C3, C4, C5, C6, C7, C8
Gerze → ErfelekC1, C2, C3, C4, C5, C6, C7, C8
Gerze → BoyabatC2, C5, C7, C8
Gerze → DikmenC1, C2, C3, C4, C5, C6, C7, C8
Table 16. Table of Discordance Sets.
ComparisonNon-Compliance Set (D)
Ayancık → ErfelekC1, C2, C3, C4, C5, C6, C7, C8
Ayancık → BoyabatC1, C2, C3, C4, C5, C6, C7, C8
Ayancık → DikmenC1, C3, C4, C5, C6, C7
Ayancık → GerzeC1, C2, C3, C4, C5, C6, C7, C8
Erfelek → Ayancık
Erfelek → BoyabatC1, C3, C4, C5, C6, C7, C8
Erfelek → DikmenC1
Erfelek → GerzeC1, C2, C3, C4, C5, C6, C7, C8
Boyabat → Ayancık
Boyabat → ErfelekC2
Boyabat → Dikmen
Boyabat → GerzeC2
Dikmen → AyancıkC2
Dikmen → ErfelekC2, C3, C4, C5, C6, C7, C8
Dikmen → BoyabatC1, C2, C3, C4, C5, C6, C7, C8
Dikmen → GerzeC1, C2, C3, C4, C5, C6, C7, C8
Gerze → Ayancık
Gerze → Erfelek
Gerze → BoyabatC1, C3, C4, C6
Gerze → Dikmen
Table 17. Concordance Matrix.
AlternativeAyancıkErfelekBoyabatDikmenGerze
Ayancık0.00000.00000.00000.20910.0000
Erfelek1.00000.00000.12670.80920.0000
Boyabat1.00000.87330.00001.00000.8733
Dikmen0.87330.19080.00000.00000.0000
Gerze1.00001.00000.41721.00000.0000
Table 18. Discordance Matrix.
AlternativeAyancıkErfelekBoyabatDikmenGerze
Ayancık0.00001.00001.00001.00001.0000
Erfelek0.00000.00001.00000.30511.0000
Boyabat0.00000.21930.00000.00000.7684
Dikmen0.24701.00001.00000.00001.0000
Gerze0.00000.00001.00000.00000.0000
Table 19. Concordance Dominance Matrix.
AlternativeAyancıkErfelekBoyabatDikmenGerze
Ayancık00000
Erfelek10010
Boyabat11011
Dikmen10000
Gerze11010
Table 20. Discordance Dominance Matrix.
AlternativeAyancıkErfelekBoyabatDikmenGerze
Ayancık00000
Erfelek10010
Boyabat11010
Dikmen10000
Gerze11010
Table 21. Final Dominance Matrix (S).
AlternativeAyancıkErfelekBoyabatDikmenGerze
Ayancık00000
Erfelek10010
Boyabat11010
Dikmen10000
Gerze11010
Table 22. Total Number of Dominances Gained by Alternatives.
AlternativeDominance Number
Boyabat3
Gerze3
Erfelek2
Dikmen1
Ayancık0
Table 23. Net Concordance and Net Discordance Values.
AlternativeNet Compatibility (C_net)Net Divergence (D_net)
Ayancık−3.66423.7530
Erfelek−0.12820.0858
Boyabat3.2027−3.0123
Dikmen−1.95421.9419
Gerze2.5439−2.7684
Table 24. Comparison of GIS Suitability Analysis and ELECTRE I Results.
DistrictGIS RankELECTRE RankEvaluation
Boyabat21It ranked high in both methods, demonstrating strong dominance, especially in the ELECTRE analysis with respect to the continuity criteria.
Dikmen14Despite having the highest spatial suitability, it ranked lower in the ELECTRE ranking due to operational continuity criteria.
Gerze32Although positioned at a moderate level in the GIS analysis, it rose to a higher position in the ELECTRE ranking due to the influence of continuity-focused criteria.
Erfelek53Despite being in the lower group in terms of spatial suitability, it achieved a moderate position in the ELECTRE analysis thanks to its relative superiority in some criteria.
Ayancık45It ranked low in both methods and showed limited performance, especially in dominance relationships.
Table 25. Alternative Rankings According to OAT Sensitivity Analysis Scenarios.
ScenarioModified CriterionNew Value (Before Change)Approximate Weight After NormalizationRanking Change
S0C1 = 0.1908/C3 = 0.1581Base valuesNone
S1C1 + %100.2099C1 ≈ 0.2060None
S2C1 − %100.1717C1 ≈ 0.1733None
S3C3 + %100.1739C3 ≈ 0.1706None
S4C3 − %100.1423C3 ≈ 0.1446None
Disclaimer/Publisher’s Note: The statements, opinions and data contained in all publications are solely those of the individual author(s) and contributor(s) and not of MDPI and/or the editor(s). MDPI and/or the editor(s) disclaim responsibility for any injury to people or property resulting from any ideas, methods, instructions or products referred to in the content.