Article

Thermal Characterization of Innovative Insulating Materials Through Different Methods: An Intra-Laboratory Study


by
Giorgio Baldinelli
1,*,
Francesco Asdrubali
2,
Chiara Chiatti
2,
Dante Maria Gandola
2,
Stefano Fantucci
3,
Valentina Serra
3,
Valeria Villamil Cárdenas
3,
Giorgia Autretto
3,
Rossella Cottone
3,4 and
Cristiano Turrioni
5
1
Department of Engineering, University of Perugia, 06123 Perugia, Italy
2
Department of International Human and Social Sciences, Perugia Foreigners’ University, 06122 Perugia, Italy
3
Department of Energy, Politecnico di Torino, 10129 Torino, Italy
4
Department of Materials Engineering and Physics, Slovak University of Technology in Bratislava, 811 07 Bratislava, Slovakia
5
Sezione di Perugia, Istituto Nazionale di Fisica Nucleare, 06123 Perugia, Italy
*
Author to whom correspondence should be addressed.
Sustainability 2026, 18(9), 4474; https://doi.org/10.3390/su18094474
Submission received: 28 February 2026 / Revised: 1 April 2026 / Accepted: 13 April 2026 / Published: 2 May 2026
(This article belongs to the Special Issue Built Environment and Sustainable Energy Efficiency)

Abstract

Accurate thermal characterization of building insulation materials is essential for reliable energy performance assessment, regulatory compliance, and the development of high-performance envelopes. On one hand, the growing adoption of innovative insulating products, such as nanoporous materials, aerogel-based composites, bio-based panels, and thin insulating coatings, helps to enhance buildings’ energy efficiency by means of sustainable raw materials. On the other hand, conventional measurement techniques encounter significant challenges, due to their heterogeneity, reduced thickness, and unconventional geometries. In this study, an intra-laboratory comparison of three widely used methods for thermal conductivity determination is presented: the Transient Plane Source (TPS, Hot Disk) method, the Guarded Hot Plate (GHP) method, and the Heat Flow Meter (HFM) method. A total of twelve insulating materials, spanning super-insulating cores, insulating renders, bio-based panels, and nanocomposite coatings, were experimentally characterized under controlled laboratory conditions. A view on the analyzed insulating materials’ cradle-to-grave environmental impact is also given, to enhance the users’ awareness for the highly informed choice. The results highlight systematic differences between transient and steady-state approaches, with TPS measurements generally exhibiting larger deviations for materials characterized by surface roughness, limited thickness, or strong internal heterogeneity. In contrast, GHP and HFM methods show closer agreement when specimen geometry and stabilization requirements are satisfied. The influence of contact resistance, probing depth, specimen preparation, and uncertainty propagation is critically analyzed for each technique. The study provides practical insights into the applicability limits of commonly used thermal characterization methods and emphasizes the importance of selecting measurement techniques in relation to material morphology and testing constraints. These findings support more reliable thermal property assessment of emerging insulation materials and contribute to improved consistency between laboratory measurements and energy performance evaluations for buildings.

1. Introduction

The building sector plays a central role in global energy consumption and greenhouse gas emissions, accounting for approximately 36% of final energy use and nearly 40% of energy-related CO2 emissions worldwide [1,2]. In response, increasingly stringent regulations, particularly within the EU, emphasize improving the thermal performance of building envelopes as a key strategy for reducing operational energy demand [3]. This regulatory pressure has accelerated the deployment of innovative insulation solutions in both new constructions and deep energy retrofits, thereby exposing the limitations of conventional test methods that were originally tailored to standard, homogeneous products [4].
Within this context, accurate thermal characterization of construction materials is not only a scientific requirement but also a regulatory and design necessity [5]. Thermal conductivity, together with related thermophysical properties such as thermal diffusivity and heat capacity, directly affects heat transfer through opaque building components, influencing heating and cooling loads, indoor thermal comfort, condensation risk, and long-term durability of building systems [6,7]. As a result, thermal property data are extensively used in energy simulations, compliance calculations, and certification schemes, including EN ISO 52016-1 [8] based methods and green building rating systems. For designers and energy modelers, the reliability of these input data is crucial, since even moderate deviations in λ-values can lead to significant differences in calculated energy demand, HVAC sizing, and payback periods of retrofit measures. This has direct implications for both performance guarantees and investment decisions [9].
Beyond static energy performance assessment, recent studies highlight that the thermal properties of envelope materials also influence operational strategies for buildings, including demand-side flexibility and dynamic load management. For instance, envelope characteristics and thermal inertia affect the capability of buildings to shift and modulate cooling loads in response to grid signals [10]. At the same time, accurate estimation of thermal loads (strongly dependent on envelope thermal conductivity) directly impacts the effectiveness of advanced control strategies for HVAC systems. These findings underline that uncertainties in measured thermal properties can be observed both in energy demand predictions and the evaluation of flexible control strategies and load response potential [11].
Over the last two decades, research and industrial development have increasingly focused on innovative insulation materials. These include nanoporous inorganic products, aerogel-based composites, bio-based and recycled materials, and multifunctional coating and plasters [12,13,14]. These materials often exhibit complex internal structures, strong heterogeneity and unconventional geometries. The stated properties challenge traditional testing methodologies originally developed for homogeneous, rigid, and relatively thick specimens. Consequently, discrepancies between declared thermal properties and experimentally measured values are frequently reported, particularly when different measurements techniques are employed [15,16]. In practice, this means that the same material may appear to perform differently depending on the characterization method adopted. This inconsistency complicates the comparison between products, the validation of numerical models, and the definition of robust safety margins in envelope design [17].
Thermal conductivity can be determined using either steady-state or transient experimental approaches [18,19]. Steady-state techniques, such as the Guarded Hot Plate and Heat Flow Meter, are considered reference procedures due to their solid theoretical foundation and direct relation to Fourier’s law of heat conduction. However, they require long stabilization times, strict specimen geometry, and well-controlled boundary conditions, which can limit their applicability to innovative or non-standard materials. In contrast, transient methods, including the Transient Plane Source (Hot Disk) technique, offer significantly shorter testing times, reduced sample preparation requirements, and flexibility in handling fragile materials [16]. These advantages have led to their increasing adoption in both research laboratories and industrial quality control [20].
Despite the extensive use of these techniques, systematic comparisons between steady-state and transient methods remain limited, especially when applied to emerging insulation materials with markedly different physical characteristics. Existing studies indicate that measurement results may differ substantially depending on the method used and the sample’s geometry, surface quality, density, and internal heterogeneity. Additionally, assumptions in the underlying heat transfer models also increase this difference [21,22]. Such discrepancies are not merely methodological; they can propagate into the sizing of envelope assemblies and HVAC systems, the estimation of primary energy savings, and the assessment of cost-effectiveness of retrofit strategies. This potentially leads to under- or over-dimensioning and to a mismatch between predicted and actual building performance [23,24]. Clarifying the magnitude and origin of such differences is therefore essential to define appropriate correction factors, confidence intervals, or conservative design values for advanced insulation products, and to keep the uncertainty in simulated energy savings within acceptable bounds.
Within this framework, the present work investigates the thermal characterization of a broad set of traditional and innovative insulating materials by means of three commonly adopted laboratory techniques: the Transient Plane Source (TPS), the Guarded Hot Plate (GHP), and the Heat Flow Meter (HFM). The study is conceived as an intra-laboratory comparison, aiming to assess the consistency of measured λ-values, identifying systematic deviations between methods, and highlight the practical limitations and applicability of each technique for non-conventional building materials.
By combining experimental results with a detailed analysis of specimen characteristics, testing conditions, and uncertainty sources, this work seeks to provide practical guidance for researchers and practitioners involved in the thermal assessment of emerging insulation systems.
Furthermore, the paper provides reliable data on the embodied carbon and the embodied energy of the various selected materials, to provide useful information on their environmental properties.
The outcomes are intended to support more informed selection of measurement techniques, improve the interpretation of experimental data, and contribute to the reliable integration of innovative materials into energy-efficient and sustainable building design.

2. Literature Review

The building sector is fundamental to achieving global climate objectives, particularly within the European Union (EU). EU legislative frameworks, notably the Energy Performance of Buildings Directive (EPBD, recast 2018/844/EU) [25], underscore this by mandating nearly zero-energy buildings (nZEBs) and advocating for high-performance building envelopes [26,27]. Consequently, precise determination of thermal parameters is not merely a technical prerequisite but a regulatory imperative. This accurate assessment directly impacts energy certifications and ensures compliance with performance standards (EN ISO 52016 [8]). Furthermore, the increasing reliance of green building rating systems (e.g., LEED, BREEAM) on comprehensive material performance data highlights the critical need for robust thermal characterization methods in both research and practical applications [28].
This section reviews the existing literature, beginning with an exploration of the primary factors influencing material thermal performance (Section 2.1). It then progresses to commonly employed measurement and characterization techniques (Section 2.2), concluding with an overview of both traditional and innovative insulating prototypes (Section 2.3).

2.1. Importance of Thermal Conductivity in Building Applications

Understanding the thermal properties of insulation materials is essential due to their significant influence on heat transfer within building envelopes. The primary parameters characterizing these materials include: (i) thermal conductivity, i.e., a material’s ability to conduct heat; (ii) specific heat capacity, which is the amount of energy required to raise the temperature of 1 kg of a substance by 1 °C; (iii) thermal diffusivity, representing how quickly heat spreads through a material; (iv) thermal expansion, which describes the tendency of a material to change in size or volume due to a temperature change; and (v) mass loss, which refers to the reduction in mass caused by thermal degradation, evaporation or decomposition when the material is subjected to heating. Among them, thermal conductivity (λ) is a key parameter because it directly determines the thermal effectiveness of an insulation layer, impacting the overall thermal performance of a building envelope.
By definition, λ is the steady-state heat flow through a unit area of homogeneous material in a direction perpendicular to its isothermal planes, induced by a unit temperature difference across the sample [29]. Lower values indicate better thermal insulation performance, an essential characteristic to enhance building energy efficiency and reducing heating and cooling loads. According to DIN 4108 [30], materials with λ-values below 0.1 W/m·K are classified as thermal insulators: in particular, if λ < 0.03 W/m·K, they are highly effective; if 0.03 W/m·K < λ < 0.05 W/m·K, they provide moderate insulation; and if λ > 0.07 W/m·K, they have a limited insulating capacity. Manufacturers usually specify the thermal conductivity of their insulating products according to standardized laboratory conditions [31]. However, the thermal behavior of construction materials is highly dependent on multiple factors. At the microscopic level, λ is influenced by structural factors such as cell size, fiber or particle diameter and arrangement, transparency to thermal radiation, gas type and pressure, and the nature of bonding materials. Whereas at the macroscopic scale, thermal conductivity is affected by parameters like temperature, moisture content, material density, and aging [32].
In building applications, minimizing thermal conductivity is essential to improve the thermal resistance of the envelope, enhancing occupant comfort and mitigation efforts. Indeed, the relationship between λ and building performance is driven by Fourier’s law of heat conduction, which states that the heat flux entering or exiting the building is proportional to the thermal conductivity and temperature gradient. Materials with lower λ-values contribute to higher thermal resistance (R-value), which directly correlates with improved energy performance. Proper thermal performance reduces heating, ventilation and air conditioning (HVAC) energy consumption, which typically accounts for 40% of total building energy usage. Buildings with effective thermal insulation can achieve energy savings of up to 50% compared to conventional construction. In hot–arid climates, proper insulation can reduce cooling energy consumption by up to 37%, while maintaining consistent indoor temperatures throughout varying weather conditions. On the other hand, the thermal conductivity of building materials significantly affects the sizing and operation of HVAC systems: better-insulated indoor areas require less heating and cooling capacity, leading to smaller, more efficient systems with lower operating costs [33]. Furthermore, good insulation helps mitigate issues like condensation, which can lead to mold growth and compromised indoor air quality. By keeping internal surface temperatures above the dew point, materials with low thermal conductivity contribute to a healthier building structure, safeguarding both the building’s integrity and their occupants’ wellbeing.
Recently, empirical investigations have quantified how envelope quality and thermal protection levels affect actual heat consumption in residential building stocks located in cold and temperate European climates. Long-term monitoring of multifamily buildings in north-eastern Poland, for instance, shows that improved thermal protection enables more accurate forecasting and reduction of specific energy consumption indicators at the estate scale [34]. Similarly, analyses of heat consumption trends in developing housing estates highlight that better insulated building envelopes help lower ordered heating power and annual heat demand, which in turn reduces heating expenditures that can otherwise account for more than half of total housing maintenance costs in Central Europe [35]. These findings corroborate the central role of λ and related thermophysical properties in determining not only theoretical energy ratings, but also operational energy performance and economic burdens for occupants in real-use conditions.

2.2. Measurement Techniques

Thermal characterization of building materials is essential for determining their energy performance, thermal comfort, and safety properties. While the thermal properties of pure materials are well documented in standard reference databases, most materials in construction are not pure. They are alloys, compounds, polymers, composites and mixtures, often available in different physical forms with varying thermophysical behavior. For this reason, several laboratory techniques have been established to accurately determine key thermal properties of materials in their conditions of use for a given application.
In this framework, thermal conductivity (λ) can be measured using either steady-state or transient methods. In both cases, the material must be in thermal equilibrium with its surroundings before the measurement starts. Steady-state techniques require the sample to reach and maintain a uniform thermal gradient throughout the measurement, while transient methods rely on a short heat pulse to infer the thermal performance. This translates into much longer stabilization times for completing a single steady-state test, especially when characterizing low-λ materials, resulting in a shift over the past decade towards transient approaches.

2.2.1. Stationary Techniques

The Guarded Hot Plate method is one of the most widely recognized steady-state techniques for measuring low-λ materials, standardized in ASTM C177-13 [36] and ASTM STP879 [37]. It is considered the reference method for building materials due to its high accuracy and traceability. However, several limitations restrict its broad applicability. First, test specimens must generally be at least 2 cm thick and in complete thermal equilibrium with the environment, which often translates into very long stabilization and measurement times. The presence of inhomogeneities in composition or structure, particularly in highly porous materials, can further extend the equilibration period. Moreover, achieving acceptable measurement accuracy requires the sample to meet strict geometrical constraints. According to ISO 8302 [38], specimens must have a high area-to-thickness ratio and surfaces that are flat and parallel within defined tolerances, making sample preparation demanding and sometimes impractical for irregular or heterogeneous building materials.
Another steady-state technique, the Radial Heat Flow method (ASTM C335 [39] and ISO 8497 [40]), is primarily designed for determining the thermal transmission properties of cylindrical specimens, especially pipe insulation. Similar to the Guarded Hot Plate, it provides reliable and standardized results but is associated with significant challenges. These include labor-intensive sample preparation, strict geometric requirements to ensure reproducibility, and extended testing times required to achieve thermal equilibrium across the radial direction. Consequently, while both methods are indispensable for generating reference data, their limitations in handling non-standard geometries, highly porous structures, or time-sensitive testing scenarios have contributed to the growing adoption of transient methods in research and industrial practice.

2.2.2. Transient Techniques

In contrast to steady-state, transient techniques for thermal conductivity measurements exploit a material’s time-dependent thermal response to a controlled heat input. A short energy pulse generates a non-equilibrium temperature field within the specimen, and the resulting temperature rise is monitored over time. The recorded data is then interpreted using appropriate analytical models and boundary-condition assumptions. These techniques have become widely established in both research and industry, owing to their versatility, short testing times, and suitability for samples that are irregular in shape, heterogeneous in composition, or otherwise difficult to evaluate under steady-state conditions. Unlike steady-state approaches, transient techniques do not require lengthy equilibration periods, making them particularly effective for highly porous, anisotropic, or moisture-sensitive materials.
Among the most widely adopted techniques is the Transient Plane Source (TPS), standardized in ISO 22007-2 [41]. It employs a flat double-spiral element that functions simultaneously as both heater and temperature sensor. Placed between two halves of a sample, the sensor records the transient temperature increase following a short heating pulse. From this response, thermal conductivity, diffusivity, and volumetric heat capacity can be extracted [42]. The TPS method is valued for its broad applicability—ranging from solids and powders to liquids—and minimal sample preparation. However, measurement accuracy strongly depends on sensor–sample contact quality, and interfacial thermal resistance can introduce errors. Another widely adopted approach is the Transient Hot Wire (THW) method, described in ASTM D5930 [43] and ISO 8894 [44]. Here, a thin wire embedded in the sample serves as both heating element and thermometer. The wire’s temperature increase during a controlled current pulse is analyzed to determine thermal conductivity. The THW method is particularly effective for fluids and granular media, as it minimizes boundary effects and heat losses. Its use for solid building materials, however, is more constrained due to the practical challenges of embedding the wire without disturbing the internal structure. A third relevant technique is the Transient Line Source (TLS) method, a simplified adaptation of the hot wire concept, often employed for soils, concretes, and insulation products [45]. In this method, a needle-shaped probe containing a heater and a temperature sensor is inserted into the material. Analysis of the radial temperature field yields the thermal conductivity within relatively short measurement times. The TLS method is especially attractive for field testing because of its portability and straightforward operation, although uncertainties can arise from insertion effects and imperfect thermal contact.
Overall, transient techniques provide a valuable complement to steady-state reference methods. While their absolute accuracy may be somewhat lower than that of standards such as the Guarded Hot Plate, their speed, adaptability, and reduced sample preparation requirements make them indispensable for the characterization of innovative and non-standard building materials.

2.3. Novel Materials in Thermal Insulation

In parallel with advances in industrial and technological processes, a broad range of thermal insulation materials has been developed over the past few decades. These materials are typically either naturally derived or artificially engineered, characterized by their low density and porous or hollow structure. They generally consist of a solid matrix interspersed with pores filled with air or other gases.
Recent research has increasingly focused on the development of novel insulation materials that combine high thermal performance with sustainability and reduced environmental impact. These include bio-based and recycled products, nanostructured materials, and composites specifically engineered to enhance porosity and minimized thermal conductivity. For instance, aerogels, phase-change material-integrated systems, and bio-aggregates derived from agricultural by-products are attracting growing interest. Such innovations not only improve the energy efficiency of buildings, but also contribute to circular economy strategies, offering renewable, biodegradable, or recyclable alternatives to traditional insulation products.

2.3.1. Nanoporous Inorganic Materials

Nanoporous inorganic insulators exploit extreme porosity and gas confinement effects to achieve very low thermal conductivities, well below those of conventional fibrous or cellular materials [46,47]. Fumed silica is widely used as the core of vacuum insulation panels, where its fine particle network and evacuated pores yield effective conductivities on the order of a few mW/mK, enabling slim, high-performance insulation for building envelopes and refrigeration [48]. Current research focuses on stabilizing fumed silica under cyclic moisture and mechanical loads and on integrating it into composite boards or renders to mitigate edge losses and improve robustness in real building applications [48].
Silica aerogels, on the other hand, combine ultra-low density with porosities often exceeding 90%, leading to thermal conductivities of about 0.012–0.020 W/m·K in ambient conditions, with growing use in coatings, blankets, and prefabricated panels [49]. Recent work explores flexible, mechanically reinforced aerogels and hybrid organic–inorganic networks that maintain low λ while improving toughness, hydrophobicity, and high-temperature stability for façade retrofits and high-performance envelopes.

2.3.2. Aerogel- and Nano-Enhanced Plasters and Renders

Plasters and renders are being reformulated as active insulation layers, able to be applied directly on masonry or concrete substrates while providing thermal upgrading [50]. Aerogel-enhanced plasters embed hydrophobic silica aerogel granules within lime or cement matrices, achieving conductivities significantly below conventional mortars and allowing internal or external insulation with minimal added thickness [47]. Aerogel thermal insulation pastes, often polymer-modified, offer sprayable solutions with high thermal resistance and good adhesion, suited for complex geometries and refurbishment of historic buildings where space and reversibility are critical.
In parallel, research on lightweight plasters incorporates expanded aggregates, recycled fines, and in some cases bio-fillers, aiming to reduce density and λ while preserving workability, vapor permeability, and compatibility with existing substrates [50]. Such coatings can couple thermal insulation with moisture buffering and, when appropriately designed, improved fire resistance, extending their role beyond purely decorative finishes [47].

2.3.3. Bio-Based Panels and Composites from Residues

Bio-based insulation panels use plant-derived or agro-industrial by-products to provide low-impact, often carbon-negative alternatives to petrochemical foams and mineral wool [51,52]. Numerous studies demonstrate that panels filled with chopped agro-wastes (e.g., straw, corn cobs, rapeseed stalks) or woodchips achieve thermal conductivities below 0.1 W/m·K, comparable to several conventional loose-fill insulations [53]. These systems, typically arranged as sandwich panels with wood-based facings, show favorable heat storage capacity and moisture regulation, contributing to damping of temperature fluctuations and acceptable indoor air quality when VOC emissions are controlled [51].
Current developments extend this concept to forest-derived residues and pruning waste, such as softwood offcuts, bark, and branches from species like spruce, as well as lignocellulosic fractions from olive groves and other perennial crops, bonded into rigid or semi-rigid insulation boards. These materials leverage local biomass streams to reduce embodied energy and transportation impacts, and their fibrous structure offers a favorable balance between thermal insulation, acoustic absorption, and end-of-life biodegradability or energy recovery [53].

2.3.4. Phase-Change Materials (PCMs) and PCM-Based Systems

Phase-change materials are not primarily insulators but act as variable thermal resistance components, storing and releasing heat near a target temperature to smooth indoor conditions and reduce peak loads [54]. Organic PCMs such as paraffin or fatty alcohols are widely studied for integration into wallboards, floor screeds, and ceiling tiles, where their latent heat enhances thermal inertia without excessive mass increase. To prevent leakage during melting, PCMs are often micro- or macro-encapsulated in polymer shells, inorganic matrices, or porous supports, enabling repeated cycling and compatibility with conventional construction products.
Shape-stabilized PCMs combine phase-change compounds with supporting materials like fumed silica, aerogels, or magnetic nanoparticles, yielding composites that maintain form and minimize leakage over many cycles [55]. Recent studies demonstrate fumed-silica-based composites where nanostructured supports control thermal conductivity—either enhanced for faster charging or reduced for insulation—and magnetic fillers allow remote heating or improved dispersion for smart building elements.

3. Materials and Methods

3.1. Description of Tested Samples

Twelve samples were selected for thermal testing. They span four material categories, chosen to represent a broad range of innovative building insulation solutions.
  • Super-insulating materials: materials claiming a thermal conductivity < 25 mW/mK.
  • Thermal insulating render: mortars generated from mineral binders and lightweight insulating aggregates.
  • Bio-based insulation: wood-based insulting boards.
  • Thermal insulating coatings: thin plaster finishing layer or paint.
Table 1 summarizes the tested samples, reporting their category, thickness (d), density (ρ), a brief material description, and additional information on internal structure and application in the building envelope. Pictures of the tested materials are provided in Figure 1.
The tests on the three instruments have been executed at the same temperature (the average of the cold and hot plate for the steady-state measurements and the environmental temperature for the Hot Disk). All the samples have been conditioned at 20 °C and 50% of relative humidity for at least two days before each measurement.

3.2. TPS Method (Transient Plane Source—Hot Disk)

Thermal properties were measured by employing the Hot Disk TPS 2500 S thermal constants analyzer (Hot Disk AB, Göteborg, Sweden), which uses the Transient Plane Source (TPS) technique. In fact, this device boasts considerable flexibility in testing solids, liquids, powders, and pastes over the range of thermal conductivity values (from around 0.005 to 1800 W/m·K), and temperatures varying between cryogenic and near 1000 °C conditions [56,57]. Furthermore, it strictly meets ISO 22007-2 standards for transient plane heat-source testing, meaning that standardized testing and standardized results can be ensured for this device and different applications [58]. Details given in the manufacturer literature state that it has an accuracy of less than 5% when testing thermal conductivity and an accuracy of about 2% when testing thermal diffusivity, and it therefore has 10% accuracy for diffusivity in comparison within the same setup [59]. All tests for this work were performed at ambient temperatures (~20 °C), after reaching equilibrium conditions between the test specimens and the sensor.
The TPS method uses a planar sensor that has a thin double spiral of nickel coated with insulating Kapton foil on both sides [41,59]. The sensor contains the heating area and the temperature sensor in one device. In the process of measuring, and when the sensor is connected to the power source, the spiral heats up for a short period, and this process is measured in terms of resistance, which is directly proportional to temperature [32,50]. By fitting the transient data to the analytical solution of the diffusion of heat in an infinite medium and taking into account the values of λ and α obtained, ρ·Cp can be calculated using the formula λ = α·(ρ·Cp), and specific heat capacity can be obtained when ρ is known [60,61]. Another important aspect of TPS is that it can be used to determine several thermophysical properties simultaneously within a matter of minutes, unlike steady-state methods like the Guarded Hot Plate, whereby several minutes of stabilization are necessary and only λ can be determined [60,61,62,63]. Another important aspect of the TPS is that it is an absolute technique that does not use any known materials, and this ISO-based protocol increases the reliability of the results obtained [41].
Two Kapton insulation sensors were used based on material properties: the smaller sensor type 7531 (with a size of about 0.5 mm in radius) for highly insulating aerogels and the larger sensor type 7577 (with a size of about 2.0 mm in radius) for wood, plaster, and PCM specimens [56]. All of the sensors had been calibrated in conformity with the manufacturer’s instructions and were tested on known materials.
In situations where possible, the positioning of the sensor between two halves of the specimen ensured that it had symmetry in terms of the flow of heat. Also, the contact surfaces were smoothened and pressed gently to eliminate resistance at the contact area, and the size of the specimens satisfied the infinite medium approximation. Within the scenario for the single thick specimen, the experimental setup was such that the sensor was placed behind it and used an adiabatic boundary condition due to low-conductivity materials [57]. Measuring was performed at low heating levels of 10–30 mW and pulse durations of 10–40 s to prevent any nonlinear effects [56]. Cooling breaks of 15–20 min were chosen to allow for full thermal relaxation, and at least three measurements on each sample confirmed that no drift effects occurred.

3.3. Guarded Hot Plate Method (Perugia)

The Guarded Hot Plate (GHP) technique was utilized with a specialized built device set up at the University of Perugia Thermal Engineering Laboratory. The device was first conceived at the University of Rome “La Sapienza” during the early 2000s and was then upgraded to enhance its accuracy and conform to international norms such as ISO 8302 [38], EN 12664 [64], and EN 12667 [65].
The apparatus consists of a single-specimen design with a maximum sample size of 500 × 500 mm. The top-heating section comprises a central 250 × 250 mm square plate within a 125 mm-wide guard ring; both are formed by 30 mm-thick plates of aluminum, which are heated by embedded cartridge resistors. The bottom-heating plate, between two panels of insulation, is at the same temperature as the top plate to reduce downward losses by conduction through the atmosphere.
A stainless-steel cold plate with a spiral coil is attached to an external chiller to provide controlled heat removal. The system contains 34 type-J thermocouples to monitor temperature in real time:
  • 17 in the central measuring zone;
  • 8 in guard ring;
  • 8 in cooling unit;
  • 1 on the lower guard plate.
Additional type-T thermocouples are offered to enhance thermal contact as necessary. A National Instruments multichannel data acquisition system captures all signals every 30 s and connects to a precision digital multimeter to read the electrical input.
When steady-state conditions are attained, the thermal conductivity λ [W/m·K] is determined by the one-dimensional steady-state version of Fourier’s law:
λ =   ϕ · d   A · ( T c T f )
where ϕ is the rate of heat flow, d is the thickness of the specimens, A is the surface area of the heated central zone, and Tc and Tf are hot and cold face temperatures respectively.
The system was set up using reference materials with known conductivity, e.g., poplar wood (λ ≈ 0.12 W/m·K) and EPS (λ ≈ 0.033 W/m·K), following standard procedures [66,67]. Preliminary experiments with ON/OFF control logic experienced problems with stability as well as temperature imbalance. These were resolved by designing a more refined PID control regulation strategy over three zones: central heater, top guard, and bottom plate. Results after the upgrade exhibited very good comparability with reference values (e.g., λpoplar = 0.114 W/m·K; λEPS = 0.0325 W/m·K), with errors lower than 2%.
For optimal accuracy, sample thicknesses are recommended to be between 30 and 70 mm, as per EN 12667 [65]. For thicker samples (e.g., 100 mm), additional lateral insulation and energy correction procedures were introduced, including a thermal balance based on monitored boundary conditions.
This device allows quantitative characterization at all temperatures of materials with low conductivity (0.02–0.2 W/m·K) and is particularly well adapted to examine new insulating materials in non-standard forms. The experimental data obtained with this technique were applied to check the outcome of a calibrated hot box test on equivalent materials [67] to ensure its comparability and reliability with respect to the Guarded Hot Plate technique. The Guarded Hot Plate (GHP) represents a mature mainstay primary technique for steady-state measurements of thermal conductivity, particularly insulating materials. There are many GHP design variants described within the literature as well as within commercial product lines that differ by construction and performance to accommodate various uses [68]. For instance, NIST’s 1 m line-heat-source GHP represents a reference-grade device capable of conducting low-density insulation up to ~0.23 m thick with sub 1% uncertainty. This large GHP uses a circular metering plate and sophisticated guarding arrangement to ensure one-dimensional heat flow within thick specimens and has been key to producing Standard Reference Materials and calibrated transfer specimens of thermal insulation alike. National metrology institutes such as NPL (UK) run GHPs of a more standard size (e.g., 305 mm square plates) which are extended to large temperature ranges (≈−175 °C to 160 °C) with high accuracy. These reference instruments usually have expanded uncertainties on the order of 1–3% on the thermal resistance quantity, which depends on the thickness of specimens [69]. Custom GHP arrangements have been reported within the applied research literature for special requirements: in a report [70], a double-sided square GHP for conductivities of 0.02 upwards to 3.0 W·m−1·K−1 (range spanning low to moderate insulators) within a temperature span of 323–573 K. The high-temperature prototype optimized for this temperature regime featured about 6% combined uncertainty due to challenges involved with high-temperature usage. The other variants are optimized for thick, highly inhomogeneous specimens: for example, an assembled GHP accepts specimens up to 0.40 m thick (such as straw bale insulation) with a remaining accuracy of about 2% as well [71]. Commercial GHP instruments (e.g., NETZSCH GHP 500/600/900 series) usually follow ISO 8302 design specifications and provide a compromise of variability and accuracy, and often come with interchangeable set sizes (metering areas from about <0.01 to 0.09 m2) and selectable one- or two-specimen test operations. Such instruments accommodate specimen thickening by up to about 0.2 m and conductivity by up to about 2 W/m·K, covering building insulations and even more dense materials alike.

3.4. Heat Flux Meter (HFM) Apparatus (Torino)

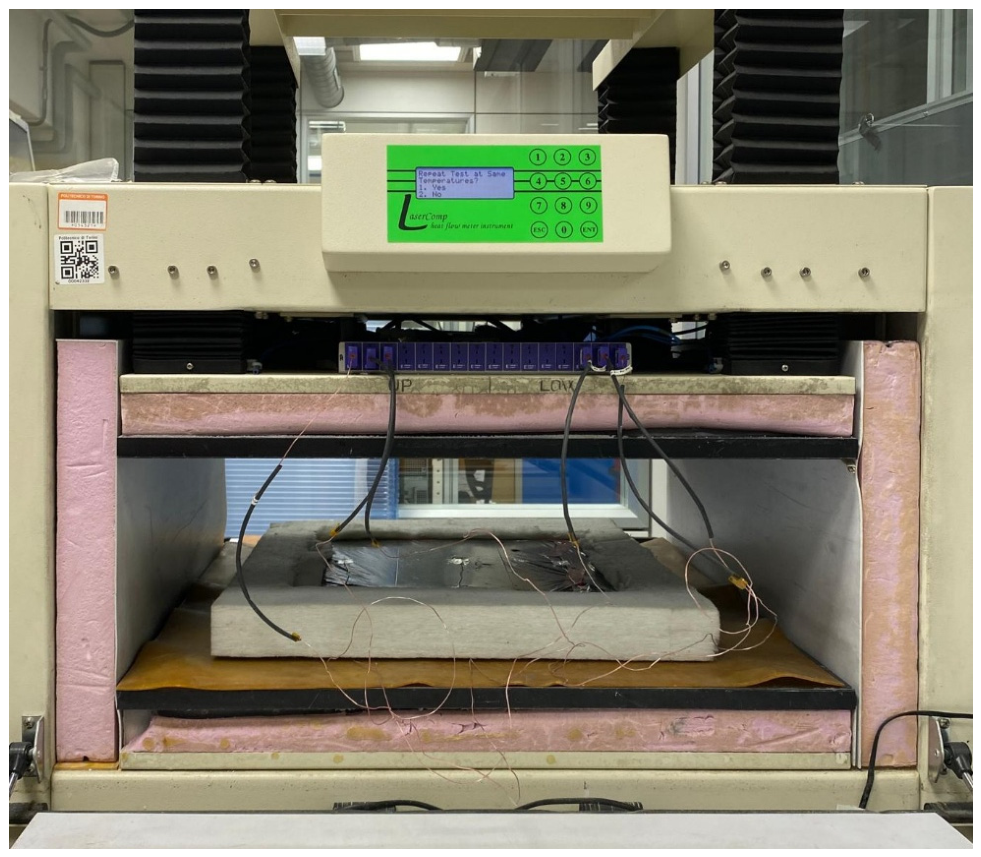
The Heat Flux Meter (HFM) apparatus LaserComp FOX600, see Figure 2, is a machine employed to measure, among other properties, the thermal conductivity and thermal resistance of building material and assemblies. The instrument is composed of two plates (upper side and lower side) which are heated or cooled according to the pre-defined set temperatures. The specific heat flux [W/m2] crossing the sample, with the given temperature difference and the sample thickness, is measured.
Only flat single samples can be tested, with a minimum face dimension of 300 × 300 mm, a maximum of 610 × 610 mm and a maximum thickness of 200 mm. The HFM LaserComp FOX600 can test temperatures from −10 to 65 °C for materials of a thermal conductivity from 0.001 to 2.00 [W/m·K]. Additionally, the equipment has an accuracy, declared by the manufacturer, of ~1%, a repeatability of ~0.2% and a reproducibility of ~0.5%. The precision of the thickness measurement is around ± 0.025 mm. The experimental characterization was performed according to the standards ASTM C518-21 [31] and EN12667: 2002 [60], for medium and high thermal resistances of a material R-value > 0.5 m2·K/W.
The thermal conductivity λ of the sample is calculated following the equation:
λ =   s R
where s is the thickness of the sample [m] and R is the thermal resistance [m2·K/W].
To calculate the thermal resistance of the sample, the equation used is:
R = T 1 T 2 q
where T1 and T2 are the temperatures on the surfaces of the sample [K] and q is the specific heat flux [W/m2], measured as the average value obtained from the two heat flux meter sensors embedded in the plates.

Procedure

Samples are placed, centered in the HFM device, to match the metering area of 254 × 254 mm. For hygroscopic materials, after a drying or conditioning period in a climatic chamber until constant mass is reached, samples must be enveloped in a polyethene foil to prevent changes in moisture content while performing the test. For samples with dimensions smaller than the plate sizes, in order to prevent the effect of lateral heat losses, a compressible insulated ring is adopted to surround the four sides. For samples with irregular surfaces, rubber mats are placed both in the upper and lower sides of the sample; for this latter case, additional thermocouples connected to the apparatus are used to measure the temperature at the interface between the sample and the rubber mats. The sample must be placed cantered inside of the HFM apparatus. Regarding the thermal characterization of Phase Change Materials (PCMs), the specific protocol followed is described in [72].

3.5. Data Treatment and Uncertainty

All measurements included an extensive uncertainty analysis. The combined standard uncertainty has been calculated in compliance with the General Law on propagation of uncertainty [73] using the root sum square approach for combination of individual contributions [74]. If Y represents the measurand (thermal conductivity, for instance), expressed in terms of the input values Xk and their standard uncertainties u(Xk), the combined standard uncertainty is represented as:
U c Y = k = 1 n f X k 2 u 2 X k
assuming that all the measured values are uncorrelated. This GUM-compliant step was performed for both Guarded Hot Plate (GHP) and Transient Plane Source (TPS) measurements. A detailed description of the calculation of the coverage factor and expanded uncertainty is given in later sections. Here, the expanded uncertainty, denoted as “U”, at the 95% confidence level is calculated as the coverage factor “k”.
In the GHP approach, the leading contributors were the accuracy of heat flux measurements, thermocouple precision, specimen thickness, and specification of metering area [36]. Smaller corrections were due to edge protection and losses due to structural effects [36]. In contrast, for TPS methods, leading contributors include contact resistance between the sensor and specimen, accuracy of geometric arrangements, temperature coefficient of resistance (TCR) of the sensor, and fitting precision. Other causes of asymmetry may be due to imprecise symmetry of the specimen or heat storage effects in low-density or anisotropic specimens [75,76].
Repeatability and reproducibility tests were performed in order to separate the random variations from the systematic errors. Repeatability in TPS has been reported in the literature within ±2% and accuracy within ±5% of TPS values, whereas that of optimized GHP systems has been obtained to have expanded uncertainties less than 2% [57]. In this work, for both TPS and GHP systems, the type A and type B uncertainty contributions were added in quadrature, in accordance with the known uncertainty budget of GHP systems and TPS methods [77]. Regarding the Heat Flow Meter (HFM) method, the expanded measurement uncertainty is slightly higher than that of the GHP method. It typically ranges from 2.0 to 2.5% (standard measurement uncertainty for conventional insulating material) and 2.5–3.5% for high-performance thermal insulation materials, such as vacuum insulation panels) [78,79].

3.6. Material Classification and Embodied Environmental Framework

This study locates four material groups of interest (Table 1) concerning insulating materials (A–D) within a life cycle assessment framework that considers the cradle-to-gate system boundary.
The objective is to transparently discuss the upfront environmental impact of insulating materials alongside their thermal performance, as it is understood that the choice of material can significantly impact the environmental impact of a building, even after accounting for energy savings [80,81,82,83]. In the case of insulating materials, functional equivalence can be defined in terms of a resistance-based functional unit (FU), that considers the mass of material necessary to achieve a certain level of resistance, e.g., R = 1 m2·K/W (or RSI = 1 m2·K/W). Indeed, “per-kg” comparisons may lead to inverted rankings of insulating materials based on their differing material properties [80,84,85,86,87,88]. The cradle-to-gate system boundary (A1–A3) was selected to account for raw material acquisition (A1), transportation to manufacturing (A2), and manufacturing (A3) stages, in line with European practice for product LCA/EPDs, deferring use-phase and end-of-life variation to scenario/sensitivity analyses [89,90,91]. Table 2 presents a synthetic comparison of the embodied carbon range and the embodied energy range for the four groups of materials.
To further illustrate the definition of the functional unit, where R is equal to 1 m2·K/W, the thickness required for each material can be directly calculated based on the relationship between thermal resistance and thermal conductivity.
R = s λ
Thus, if R is equal to 1 m2·K/W, the thickness needed (s) is numerically equal to the thermal conductivity of the material in meters. As such, this finding also supports the use of an R-based functional unit for meaningful environmental assessment, where highly insulating materials, such as aerogels or vacuum insulation panels, will only require a thickness of a few millimeters to achieve the desired thermal resistance, whereas more conventional or bio-based insulation materials may need several centimeters.
Table 3 presents more detailed data for various materials belonging to the four groups.
Category A encompasses super-insulation materials, including vacuum insulation panels, silica aerogel composites in blankets, boards, and panels, and other high-performance systems that allow for high R-values with low panel thickness. Typically, center-of-panel thermal conductivity ranges from 0.004 to 0.008 W/m·K for VIPs and from 0.013 to 0.020 W/m·K for commercial aerogel insulation, with conventional high-performance foams having higher thermal conductivity [92,93,94]. These systems generally carry high embodied energies and carbon footprints per kilogram, and in some cases, per area, due to high processing energies and multi-material construction. As a result, cradle-to-gate hotspots can be found in material production and processing energies, whereas robustness is a function of aging and puncture protection, and interfacial details [80,89,95]. Category B encompasses thermal insulating renders, including cement, lime, gypsum plaster, and multi-layer renders with lightweight aggregate inclusions such as expanded perlite and vermiculite, EPS microbeads, cork granules, and, in some cases, aerogel granulates.
Typically, reported dry thermal conductivity ranges from 0.059 to 0.118 W/m·K for insulating renders with perlite. However, when in use, they can increase in conductivity under hygrothermal attack, and hygrothermal durability is a key operative factor in determining effective material performance [96,97]. From a sustainability perspective, renders generally carry a lower cradle-to-gate environmental load than super-insulation systems, although binder production, particularly clinker-rich cement and high-temperature lime, can be a significant hotspot, and material robustness is generally a function of downcycling to mixed waste [96,98]. Category C (bio-based insulation boards) includes wood-fiber boards, cellulose fiber boards, and more generally plant fiber insulation materials, with typical conductivities similar to conventional insulation materials, approximately 0.035 to 0.050 W/m·K, depending on density, moisture, and additive content. The cradle-to-gate profile is often characterized by low fossil GWP and primary energy, dependent on binder and additive content, as well as fire retardant formulations, respectively [4,11,92]. The methodological caveat, relevant to all biogenic systems, is the treatment of biogenic carbon, where storage can have a significant influence on results if the system boundaries extend only to A1–A3, necessitating reporting of biogenic flows and testing of alternative approaches where relevant [84,99,100,101]. Category D (thermal insulating coatings) consists of (i) thin insulating coatings based on aerogels, often developed to overcome retrofit constraints and mitigate condensation risk, and (ii) radiative/reflective “cool” coatings, where the primary mechanism is optical, and characterized by high solar reflectance and high emittance, rather than conductive resistance. Aerogel insulating coatings can exhibit low material-scale conductivity, but the benefits are thickness-dependent and application continuity-dependent, with moisture exposure being also an important factor, as shown in [102,103]. Cool paints, by contrast, can exhibit significant operational benefits in cooling-dominant climates, even at low material masses, with cradle-to-gate hotspots centered on polymer binder and pigment content, as well as durability/reflection degradation, as shown in [104,105,106].
The tables are intended to be read as a cradle-to-gate, screening-level inventory for the purpose of providing an initial differentiation between the product families before providing functional unit consistent (R-based) comparisons and building-level scenario analyses in the Results section. Three aspects of the methodology require consideration and are addressed in the present analysis. First, the per-kg impact ranges are not comparable between the different insulation materials, as the effectiveness of the material depends on the required thickness, which is dependent on thermal conductivity and density. Hence, it is not appropriate to compare the lower impact ranges with respect to mass with the actual impact, and the ranks may vary significantly after normalizing to 1 m2·K/W [80,84,85]. Second, the effectiveness of renders and coatings depends on the moisture uptake and degradation mechanisms, and the thermal conductivity values, although derived from laboratory testing, might not reflect the actual conditions of service. Hence, for an accurate analysis, it would be appropriate to select the conservative values for the effective thermal conductivity or to assess the material’s performance using the sensitivity approach [80,96,97]. Lastly, the insulating coatings require an accurate definition of the mechanism, and some of the materials, although referred to as insulating materials, might not provide the required resistance in terms of R value but instead operate by radiative means, and the material’s effectiveness would thus be determined by the albedo and emissivity values rather than the R value itself [104,105]. Hence, the screening-level analysis is presented for all the material categories, and the main analysis is carried out on the functional unit basis, with the harmonization and incomparability issues addressed and documented appropriately [90,91,107].

4. Results and Discussion

4.1. Comparison of Measured Thermal Conductivity

The values of thermal conductivity (λ) obtained after employing the three experimental methods are shown in Table 4: Hot Disk (TPS), Guarded Hot Plate (Perugia), and Heat Flow Meter (Torino). Table 4 encompasses all the data and points out conditions for which a specific experiment could not be performed due to the fact that the specimen did not meet the minimum criteria relative to the experimental setup. Thickness (d) and density (ρ) values are also included for completeness.
Comparing the values of thermal conductivity obtained for different samples through the three methods, large variations are seen. This variation is expected due to the differences in the underlying physical models of each of the three methods described above.
More specifically, results obtained from the Hot Disk (TPS) readings are generally those that have the largest deviations when compared to steady-state methods. This can be generally explained in terms of the TPS methods’ sensitivity to several factors such as contact quality and internal inhomogeneity compared to steady-state methods. In practical applications of the Hot Disk method, small deviations in conditions can create differences in the values obtained for conductivity.
By contrast, the Guarded Hot Plate and the Heat Flow Meter, which employ steady-state methods, are expected to approach similar values when the test pieces meet the required conditions for their use. In addition, the longer equilibration times for the two methods are conducive to neutralization of small-scale irregularities in the test pieces or on the surfaces of the test pieces.
With the purpose of quantitatively analyzing the impact of the different results, it is evident that the two steady-state approaches showed similar performance. On the other hand, higher differences may be seen with the Hot Disk. Excluding the samples Ae4 and Ae5, where the Hot Disk clearly gave unrealistic values, the Transient Plane Source method seems to overestimate the thermal conductivity, often doubling the values (samples VIP1, Sc1 and Sc2). The deviations cannot be attributed to the uncertainties or the accuracies of the instruments as they range maximum to 5% of the measured value; therefore, there is an intrinsic difficulty of the TPS to precisely catch the thermal conductivity trends of the analyzed samples.
If this circumstance does not produce particular effects for medium insulating materials such as woodchips panels, it may cause misleading design choices in highly insulating solutions, such as the VIP case, where passing from 0.0214 W/mK to 0.0511 W/mK completely changes the panel to be chosen.

4.2. Methodological Considerations

The comparison among the three methods used in this work reveals that the choice of which one to opt for depends largely on the geometric and structural properties of the specimen that is to be investigated. In this case, methods such as the Guarded Hot Plate and Heat Flow Meter can provide relative ease and reliability for large and relatively thick specimens that are flat and large enough. However, in this case, it can be observed that the Hot Disk method has specific conditions that must be met, particularly in terms of the depth of probing and the homogeneity of the specimen being investigated. In this case, it can be seen that the Hot Plate and Heat Flow Methods are the best in terms of specimens that can allow for relative ease of testing and are relatively large and have large stabilization periods. Alternatively, in the case of specimen shapes that are difficult for testing in the Hot Disk apparatus, this specific testing and analysis method constitutes the elective choice.
The surface quality (planarity) is, for all the methods, a fundamental point where a particular focus is needed. Being that the Hot Disk is based on the diffusion of heat from a flat sensor placed between or, in single-sided mode, on top of the material undergoing testing, any amount of ruggedness or irregularities can create substantial interfacial thermal resistance and erroneous transient data. Materials Sc1 and Sc2, made of olive and spruce waste wood, are characteristic in that the quality of their surfaces is inherently irregular and fibrous, owing to the nature of the raw wood itself, and despite some attempt at improvement of the contact, the sensor never made full contact with it. Consequently, the plots showed irregular behavior and prove unreliable for detailed analysis. By contrast, the plaster samples (Int1 and Int2) represented an optimal setup for transient analysis: material surfaces were adequately flat and of optimal thickness, and mechanical properties were adequate for the specimen to maintain sufficient contact with the sensor at all points in space and time. In this case, the single-sided TPS mode of operation for the Hot Disk sensor was accomplished by placing it on top of the specimen and employing a lower backing layer made of a material of roughly one order of magnitude lower thermal conductivity than that of the plaster itself, in accordance with the ratio required for the model of heat diffusion to hold.
Thickness and probing depth were also important factors in deciding the suitability of each sample for analysis when using the Hot Disk. Some of the materials were too thin to allow the thermal probing depth for the chosen sensor and power scan. Aerogel blankets Ae4 and Ae5 and thermal insulating coatings layers NC1 and NC3 fall within this category. Though some of the materials presented relatively flat surfaces, it was difficult to judge them as suitable for TPS analysis because of their small thickness, preventing the heat wavefront from staying within the specimen for the entire transit period, thus invalidating the basic TPS model assumptions. Attempts to analyze the suitability of some of the materials for the “sandwich” analysis using the Hot Disk were fruitless, as the materials were too irregular and deformable, in addition to their small thickness. Tentative reexamination of the suitability of the materials for single-sided Hot Disk analysis by employing an insulating layer above the sensor area was unsuccessful. Indeed, the requirement that the insulating material’s thermal conductivity should be one order of magnitude with respect to that of the sample was not met.
Regarding the granular aerogels (Ae1, Ae2, and Ae3), because of their inherent granular nature, specific molds of polystyrene were built to create a stable and controlled density and a sufficient compaction before testing. After taking these precautions, the readings obtained from the Hot Disk indicated that granular or loose materials can be tested for TPS parameters, provided that the materials are placed in well-controlled conditions and that the compaction around them is homogeneous. In this case, it may be noted that any slight variation in grain size distribution had little effect on the capacity of the materials to comply with TPS parameters, and of course, any variation in the three types of aerogel materials is slight.
For the vacuum insulation panel (VIP1), even though there was sufficient area available for the sensor, some local irregularities were present on the surfaces. Furthermore, since the probing depth depends on the sensor power and the testing time, in some cases the heat wave went beyond the thickness of the specimen, thus making the theoretical model invalid.
In the case of the Heat Flow Meter at the Turin lab, no operating problems were observed as the specimens were pre-selected in the laboratory. Thus, it had been guaranteed that the specimens were well within the geometric and mechanical limits required for that device, and thus the testing did not present the same limitations that existed for some materials in the transient mode. In contrast to this, the Guarded Hot Plate device can only be used for specimens that match the smallest dimensions (commonly 300 × 300 mm) and with thickness suited to the metering section of the device. In this case, granular materials and blankets of aerogels were naturally excluded due to mechanical or dimensioning factors.
Table 5 summarizes the two methods’ strengths and weaknesses.

4.3. Discussion of the Results

The intra-laboratory dataset confirms that, when innovative insulation materials depart from the ideal assumptions embedded in standardized heat transfer models (homogeneity, sufficient thickness, flat/parallel faces, stable contact), the measured thermal conductivity becomes strongly method dependent. This is particularly evident when comparing the transient TPS (Hot Disk) approach with the two steady-state approaches (GHP and HFM). Overall, the steady-state methods tend to converge when specimen geometry and stabilization requirements are satisfied, while TPS values show larger excursions for materials with limited thickness, surface roughness, deformability, or marked heterogeneity. If a comparison is conducted when grouping the material families, the following results emerge.
Regarding super-insulating materials (VIP core and aerogels), they exhibit the most striking divergence between transient and steady-state measurements, a gap consistent with the known sensitivity of TPS to contact resistance and to the risk that the heat penetration depth approaches or exceeds the specimen thickness. In practical terms, the steady-state values are more aligned with the expected performance of microporous VIP cores, and they better support design decisions where small thicknesses are used to achieve high thermal resistance (e.g., internal retrofits with geometric constraints). The TPS outcome here should be interpreted as “screening-level” unless contact and thickness constraints are demonstrably controlled.
In granular aerogels, the consistent offset suggests a systematic contribution (not random scatter), plausibly related to how the granular packing, sensor contact, and near-sensor density distribution influence the transient temperature rise; granular materials can be tested reliably, but only if compaction is homogeneous. For building applications, the declared thermal conductivities are inseparable from installation density/compaction, so lab tests should explicitly document bulk density and packing procedure to ensure that in situ performance can be reproduced.
As far as aerogels go, steady-state plate-based methods (HFM/GHP) with appropriate soft interface layers and controlled compression are far more defensible for product qualification.
For the insulating mortars, plaster surfaces and thickness are generally favorable for TPS single-sided testing (good planarity/contact), unlike more fibrous materials. This circumstance suggests that, when surface finish and thickness are controlled, transient methods can provide reliable and rapid characterization for renders, which is valuable during formulation iterations and quality control.
Moving to bio-based insulation panels, steady-state plate methods are inherently better matched, because they enforce a macroscopic one-dimensional heat flow and “average out” local roughness/void effects, provided that edge losses and contact layers are properly handled.
From an application standpoint, these bio-based boards are attractive for circular economy building solutions (low embodied carbon, potential moisture regulation, etc.), but their thermal conductivity appears highly sensitive to the test method and to surface conditions.
The inability to apply TPS to thin insulating coatings aligns with the methodological constraints highlighted for thin layers: insufficient thickness and difficulty meeting the boundary-condition requirement for single-sided samples. The HFM protocol described (use of rubber mats for irregular surfaces, additional thermocouples at interfaces) is exactly the kind of adaptation that can shift the effective measured resistance if not harmonized across labs.
These coatings are rarely used as stand-alone insulation; their value is often in thermal bridge mitigation, surface-temperature uplift (condensation/mold risk reduction) [103], or retrofit constructability. For these roles, repeatable measurement of effective thermal resistance at small thickness is at least as important as the intrinsic bulk thermal conductivity, and labs should prioritize test setups that replicate service conditions (substrate, application thickness control, and realistic contact pressure).
With respect to the overall integrated thermal and environmental impact, the comparative evaluation of the insulation materials within each of the categories points to the trade-off between insulation performance and environmental impact.
The super-insulating materials (Category A), which include aerogels and the core of the vacuum-insulated panel, show the lowest thermal conductivity, allowing for the highest thermal resistance at the lowest thickness. However, the materials also show the highest embodied energy and CO2 impact per unit mass.
The bio-based insulation materials (Category C), on the other hand, show a higher thermal conductivity, requiring a greater thickness to provide the same level of thermal resistance, but show a considerably lower impact.
The thermal insulating renders (Category B) and coatings (Category D) are materials for which the level of performance is generally dictated by the thickness or the functionality of the material, as opposed to the intrinsic conductivity of the material.
From an environmental perspective, the study’s findings show that there is a clear trade-off between efficiency and environmental impacts. For instance, ultra-insulating materials can offer high levels of thermal resistance with minimal thickness but are associated with high levels of embodied energy and carbon. On the other hand, conventional materials require higher thickness but offer better environmental performance per unit mass.
The results confirm the earlier conclusion that no single category of materials can be identified as the best, and the choice of insulation materials should be made on the basis of a balanced evaluation of the thermal and environmental impact within a functional unit framework.

5. Conclusions

With the goal of creating space for materials that may fulfill both sustainability and energy-efficiency requirements, the assessment of their properties deserves particular attention, especially when different approaches are implemented for thermophysical-property evaluation.
This work presented an intra-laboratory comparison of thermal conductivity measurements for twelve conventional-to-innovative insulation materials using one transient technique (TPS/Hot Disk) and two steady-state techniques (GHP and HFM).
The results confirm that the agreement between methods depends strongly on specimen morphology, thickness, surface condition, and the extent to which each method’s boundary-condition assumptions are satisfied.
Systematic differences between transient and steady-state results were observed, with TPS generally exhibiting the largest deviations for materials with rough surfaces, limited thickness, deformability, or strong internal heterogeneity.
Steady-state methods (GHP and HFM) showed closer mutual consistency where specimen geometry and stabilization conditions were achievable, supporting their role as the most transferable basis for declared properties and building-design inputs.
Generally speaking, as envelope U-values scale linearly with the thermal conductivity for a given thickness, a sensible difference between methods can materially change the required insulation thickness, predicted energy savings, and compliance outcomes, especially for highly insulating products where small thicknesses are leveraged for high performance. The analysis shows that method selection is not a minor lab detail but a design-relevant decision. For instance, a small variation of 0.004 W/mK on the thermal conductivity evaluation of insulating materials weights as the 10% of the thermal conductivity value itself, leading to the same variation in the insulation thickness or, in the 10% variation in the heating energy demand, which is not negligible.
As always, the final word should depend on the on-site measurements, which normally can be executed with the Heat Flow Meter method. This quality check will provide information not only on the performance of the single materials used in the stratigraphy, but also in terms of their connections and the effects of their tridimensional connections.
GHP and HFM are generally the best route when products specifically require standard thermal resistance inputs and when specimens can be prepared to meet geometry and stabilization constraints. TPS can provide rapid multi-property characterization and it is especially valuable during material development, being well suited to ranking candidate formulations, mapping variability, and extracting thermal inertia indicators (via heat capacity) for materials where dynamic effects matter.

Author Contributions

Conceptualization, G.B., F.A., S.F. and V.S.; Methodology, C.C.; Investigation, D.M.G., G.A., R.C. and C.T.; Writing—original draft, V.V.C. All authors have read and agreed to the published version of the manuscript.

Funding

This study was possible thanks to the Project “Choisis-Characterization of Innovative and Sustainable Insulating Solutions”, funded within the Italian National Recovery and Resilience Plan (PNRR), Mission 4—Education and Research Measure M4C2—Investment 1.1 PRIN—Research programs of national interest—project code 2022372TM9, CUP F53D23001540006.

Institutional Review Board Statement

Not applicable.

Informed Consent Statement

Not applicable.

Data Availability Statement

The original contributions presented in this study are included in the article. Further inquiries can be directed to the corresponding author.

Conflicts of Interest

The authors declare no conflicts of interest.

References

  1. Santamouris, M.; Vasilakopoulou, K. Present and Future Energy Consumption of Buildings: Challenges and Opportunities towards Decarbonisation. e-Prime-Adv. Electr. Eng. Electron. Energy 2021, 1, 100002. [Google Scholar] [CrossRef]
  2. González-Torres, M.; Pérez-Lombard, L.; Coronel, J.F.; Maestre, I.R.; Yan, D. A Review on Buildings Energy Information: Trends, End-Uses, Fuels and Drivers. Energy Rep. 2022, 8, 626–637. [Google Scholar] [CrossRef]
  3. D’Agostino, D.; Congedo, P.M.; Albanese, P.M.; Rubino, A.; Baglivo, C. Impact of Climate Change on the Energy Performance of Building Envelopes and Implications on Energy Regulations across Europe. Energy 2024, 288, 129886. [Google Scholar] [CrossRef]
  4. Asdrubali, F.; D’Alessandro, F.; Schiavoni, S. A review of unconventional sustainable building insulation materials. Sustain. Mater. Technol. 2015, 4, 1–17. [Google Scholar] [CrossRef]
  5. Pomada, M.; Kieruzel, K.; Ujma, A.; Palutkiewicz, P.; Walasek, T.; Adamus, J. Analysis of Thermal Properties of Materials Used to Insulate External Walls. Materials 2024, 17, 4718. [Google Scholar] [CrossRef]
  6. Guattari, C.; Cristo, E.D.; Evangelisti, L.; Gori, P.; Cureau, R.J.; Fabiani, C.; Pisello, A.L. Thermal Characterization of Building Walls Using an Equivalent Modeling Approach. Energy Build. 2025, 329, 115226. [Google Scholar] [CrossRef]
  7. Corrado, V.; Paduos, S. New Equivalent Parameters for Thermal Characterization of Opaque Building Envelope Components under Dynamic Conditions. Appl. Energy 2016, 163, 313–322. [Google Scholar] [CrossRef]
  8. ISO 52016-1; Energy Performance of Buildings — Energy Needs for Heating and Cooling, Internal Temperatures and Sensible and Latent Heat Loads Part 1: Calculation Procedures. ISO: Brussels, Belgium, 2017.
  9. Mazo, J.; El Badry, A.T.; Carreras, J.; Delgado, M.; Boer, D.; Zalba, B. Uncertainty propagation and sensitivity analysis of thermo-physical properties of phase change materials (PCM) in the energy demand calculations of a test cell with passive latent thermal storage. Appl. Therm. Eng. 2015, 90, 596–608. [Google Scholar] [CrossRef]
  10. Li, W.; Sui, W.; Cheng, L.; Ji, Y.; Guo, Y.; Zhu, J. Quantifying seasonal demand-side flexibility in residential air conditioning under diverse control strategies. Energy Build. 2026, 352, 116764. [Google Scholar] [CrossRef]
  11. Jing, Q.; Guo, Y.; Liu, Y.; Wang, Y.; Du, C.; Liu, X. Optimization study of energy saving control strategy of carbon dioxide heat pump water heater system under the perspective of energy storage. Appl. Therm. Eng. 2026, 283, 129030. [Google Scholar] [CrossRef]
  12. Huang, G.; Abou-Chakra, A.; Geoffroy, S.; Absi, J. A Multiscale Homogenization Model on Thermal Conductivity of Bio-Based Building Composite Considering Anisotropy, Imperfect Interface and Moisture. Constr. Build. Mater. 2023, 377, 131156. [Google Scholar] [CrossRef]
  13. Zhang, Z.; Wang, Y.; Zhu, M.; Li, S. Development of a Bio-Inspired Aerogel with Robust Sustainability and Thermal Insulation Performance. Materials 2025, 18, 2808. [Google Scholar] [CrossRef]
  14. Gu, X.; Ling, Y. Research Progress of Aerogel Materials in the Field of Construction. Alex. Eng. J. 2024, 91, 620–631. [Google Scholar] [CrossRef]
  15. Latif, E. Transient versus Steady-State Thermal Conductivity Measurements: A Case Study of Thermal Characterisation of a Novel Biobased Insulation Material. In Proceedings of the 5th International Conference on Bio-Based Building Materials ICBBM-2023, Vienna, Austria, 21–23 June 2023. [Google Scholar]
  16. Colinart, T.; Pajeot, M.; Vinceslas, T.; Hellouin De Menibus, A.; Lecompte, T. Thermal Conductivity of Biobased Insulation Building Materials Measured by Hot Disk: Possibilities and Recommendation. J. Build. Eng. 2021, 43, 102858. [Google Scholar] [CrossRef]
  17. Petcu, C.; Hegyi, A.; Stoian, V.; Dragomir, C.S.; Ciobanu, A.A.; Lăzărescu, A.-V.; Florean, C. Research on Thermal Insulation Performance and Impact on Indoor Air Quality of Cellulose-Based Thermal Insulation Materials. Materials 2023, 16, 5458. [Google Scholar] [CrossRef]
  18. Lou, F.; Dong, S.; Zhu, K.; Chen, X.; Ma, Y. Thermal Insulation Performance of Aerogel Nano-Porous Materials: Characterization and Test Methods. Gels 2023, 9, 220. [Google Scholar] [CrossRef]
  19. Trofimov, A.A.; Atchley, J.; Shrestha, S.S.; Desjarlais, A.O.; Wang, H. Evaluation of Measuring Thermal Conductivity of Isotropic and Anisotropic Thermally Insulating Materials by Transient Plane Source (Hot Disk) Technique. J. Porous Mater. 2020, 27, 1791–1800. [Google Scholar] [CrossRef]
  20. Zheng, Q.; Kaur, S.; Dames, C.; Prasher, R.S. Analysis and Improvement of the Hot Disk Transient Plane Source Method for Low Thermal Conductivity Materials. Int. J. Heat Mass Transf. 2020, 151, 119331. [Google Scholar] [CrossRef]
  21. Vitiello, D.; Nait-Ali, B.; Tessier-Doyen, N.; Tonnesen, T.; Laím, L.; Rebouillat, L.; Smith, D.S. Thermal Conductivity of Insulating Refractory Materials: Comparison of Steady-State and Transient Measurement Methods. Open Ceram. 2021, 6, 100118. [Google Scholar] [CrossRef]
  22. Kerschbaumer, R.C.; Stieger, S.; Gschwandl, M.; Hutterer, T.; Fasching, M.; Lechner, B.; Meinhart, L.; Hildenbrandt, J.; Schrittesser, B.; Fuchs, P.F.; et al. Comparison of Steady-State and Transient Thermal Conductivity Testing Methods Using Different Industrial Rubber Compounds. Polym. Test. 2019, 80, 106121. [Google Scholar] [CrossRef]
  23. Goffart, J.; Wurtz, E.; Sauce, G.; Bejat, T. Act and source of uncertainties in high efficiency building simulation: Some examples. In Proceedings of the 12th Conference of the International Building Performance Simulation Association (Building Simulation 2011), Sydney, Australia, 14–16 November 2011. [Google Scholar]
  24. Kapoor, G.; Singhal, M. Impact of innovative thermal insulation materials in the building envelope on energy efficiency of residential buildings. Mater. Today Proc. 2024. [Google Scholar] [CrossRef]
  25. Directive (EU) 2024/1275 of the European Parliament and of the Council of 24 April 2024 on the Energy Performance of Buildings (Recast) (Text with EEA Relevance). 2024. Available online: http://data.europa.eu/eli/dir/2024/1275/oj (accessed on 20 February 2026).
  26. Maduta, C.; D’Agostino, D.; Tsemekidi-Tzeiranaki, S.; Castellazzi, L.; Melica, G.; Bertoldi, P. Towards Climate Neutrality within the European Union: Assessment of the Energy Performance of Buildings Directive Implementation in Member States. Energy Build. 2023, 301, 113716. [Google Scholar] [CrossRef]
  27. Olasolo-Alonso, P.; López-Ochoa, L.M.; Las-Heras-Casas, J.; López-González, L.M. Energy Performance of Buildings Directive Implementation in Southern European Countries: A Review. Energy Build. 2023, 281, 112751. [Google Scholar] [CrossRef]
  28. Evangelisti, L.; Guattari, C.; Asdrubali, F.; de Lieto Vollaro, R. In Situ Thermal Characterization of Existing Buildings Aiming at NZEB Standard: A Methodological Approach. Dev. Built Environ. 2020, 2, 100008. [Google Scholar] [CrossRef]
  29. ASTM C168-97; Standard Terminology Relating to Thermal Insulating Materials. ASTM International: West Conshohocken, PA, USA, 1997.
  30. DIN 4108-4:2017; Thermal Protection and Energy Economy in Buildings—Part 4: Hygrothermal Design Values. Deutsches Institut Für Normung: Berlin, Germany, 2017.
  31. ASTM C518-21; Standard Test Method for Steady-State Thermal Transmission Properties by Means of the Heat Flow Meter Apparatus. ASTM International: West Conshohocken, PA, USA, 2021.
  32. Hung Anh, L.D.; Pásztory, Z. An Overview of Factors Influencing Thermal Conductivity of Building Insulation Materials. J. Build. Eng. 2021, 44, 102604. [Google Scholar] [CrossRef]
  33. Kusuda, T. Fundamentals of Building Heat Transfer. J. Res. Natl. Bur. Stand. 1977, 82, 97. [Google Scholar] [CrossRef]
  34. Adamski, M.; Bargłowski, L.; Zhelykh, V.; Myroniuk, K.; Furdas, Y. Energy consumption indicators in residential buildings in North-Eastern Poland. Inż. Miner. 2025, 2, 1–6. [Google Scholar] [CrossRef]
  35. Bargłowski, L.; Adamski, M.; Furdas, Y.; Myroniuk, K.; Zhelykh, V. Analysis of changes in heat consumption in the developing housing estate. Inż. Miner. 2025, 2. [Google Scholar] [CrossRef]
  36. ASTM C177-13; Standard Test Method for Steady-State Heat Flux Measurements and Thermal Transmission Properties by Means of the Guarded Hot Plate Apparatus. ASTM International: West Conshohocken, PA, USA, 2019.
  37. Shirtliffe, C.; Tye, R. Guarded Hot Plate and Heat Flow Meter Methodology; ASTM International: West Conshohocken, PA, USA, 1985; ISBN 0-8031-0423-5. [Google Scholar]
  38. ISO 8302:1991; Thermal Insulation—Determination of Steady-State Thermal Resistance and Related Properties—Guarded Hot Plate Apparatus. ISO: Geneva, Switzerland, 1991.
  39. ASTM C335; Test Method for Steady-State Heat Transfer Properties of Pipe Insulation. ASTM International: West Conshohocken, PA, USA, 2017.
  40. ISO 8497:1994; Thermal Insulation—Determination of Steady-State Thermal Transmission Properties of Thermal Insulation for Circular Pipes. ISO: Geneva, Switzerland, 1994.
  41. ISO 22007-1:2009; Plastics—Determination of Thermal Conductivity and Thermal Diffusivity—Part 1: General Principles. ISO: Geneva, Switzerland, 2009.
  42. Gustafsson, S.E. Transient Plane Source Techniques for Thermal Conductivity and Thermal Diffusivity Measurements of Solid Materials. Rev. Sci. Instrum. 1991, 62, 797–804. [Google Scholar] [CrossRef]
  43. ASTM D5930-17; Standard Test Method for Thermal Conductivity of Plastics by Means of a Transient Line-Source Technique. ASTM International: West Conshohocken, PA, USA, 2017.
  44. ISO 8894-1:2010; Refractory Materials—Determination of Thermal Conductivity—Part 1: Hot-Wire Methods (Cross-Array and Resistance Thermometer). International Organization for Standardization: Geneva, Switzerland, 2010.
  45. Lobo, H.; Cohen, C. Measurement of Thermal Conductivity of Polymer Melts by the Line-source Method. Polym. Eng. Sci. 1990, 30, 65–70. [Google Scholar] [CrossRef]
  46. Firoozi, A.A.; Firoozi, A.A.; El-Abbasy, A.A.; Aati, K. Enhanced Perspectives on Silica Aerogels: Novel Synthesis Methods and Emerging Engineering Applications. Results Eng. 2025, 25, 103615. [Google Scholar] [CrossRef]
  47. Li, Z.; Chen, Z.; Duan, Y.; Chen, J.; Yao, S.; Peng, L.; Chen, W.; Menshutina, N.; Liu, M. A Review of Silica Aerogel Based Thermal Insulation Coatings: Preparation, Properties and Applications. Prog. Org. Coat. 2025, 208, 109449. [Google Scholar] [CrossRef]
  48. Doe, J. Advanced Acoustic and Thermal Insulation Materials: Mechanisms, Development, and Multifunctional Applications. Converg. Mater. Horiz. 2025, 1, 61–70. [Google Scholar] [CrossRef]
  49. Lin, P.; Qing, X.; Liu, Q.; Yang, Y. Flexible Aerogels for Thermal Insulation: Fabrication and Application. ACS Appl. Mater. Interfaces 2025, 17, 55706–55719. [Google Scholar] [CrossRef]
  50. Faria, D.L.; Gonçalves, F.G.; Maffioletti, F.D.; Scatolino, M.V.; Soriano, J.; Protásio, T.d.P.; Lopez, Y.M.; Paes, J.B.; Mendes, L.M.; Guimarães Junior, J.B.; et al. Particleboards Based on Agricultural and Agroforestry Wastes Glued with Vegetal Polyurethane Adhesive: An Efficient and Eco-Friendly Alternative. Ind. Crops Prod. 2024, 214, 118540. [Google Scholar] [CrossRef]
  51. Pavelek, M.; Adamová, T. Bio-Waste Thermal Insulation Panel for Sustainable Building Construction in Steady and Unsteady-State Conditions. Materials 2019, 12, 2004. [Google Scholar] [CrossRef] [PubMed]
  52. Giuma, A.; Khalil, H.P.S.A.; Yahya, E.B.; Sukeksi, L.; Alfatah, T.; Nurazzi, N.M.; Jaber, M.; Surya, I. Green Thermal Insulators: A Review into the Role of Biopolymer-based Aerogels in Thermal Insulation Applications. Polym. Eng. Sci. 2024, 64, 4611–4629. [Google Scholar] [CrossRef]
  53. Ortega, F.; Versino, F.; López, O.V.; García, M.A. Biobased Composites from Agro-Industrial Wastes and by-Products. Emergent Mater. 2022, 5, 873–921. [Google Scholar] [CrossRef]
  54. Zhao, P.; Ying, S.; Hu, R.; Ma, J.; Jiang, X. Aerogel-Based Phase Change Materials Meet Flame Retardancy: From Materials to Properties. Gels 2025, 11, 923. [Google Scholar] [CrossRef]
  55. Tam Nhu, N.B.; Phuong, H.; Que Anh, N.N.; Tuan, H.N.A.; Le Minh, T.; Thi Duy Hanh, L.; Yen Nhi, D.T.; Tien Nguyen, G. Novel Fumed Silica–Based Shape–Stabilized Phase Change Materials with Magnetically Boosted Charging Efficiency and Bi–Functional Thermotherapy Ability. ACS Omega 2025, 10, 40579–40589. [Google Scholar] [CrossRef]
  56. Hot Disk AB. TPS 2500 S Technical Specifications and Sensor Manual. 2023. Available online: www.hotdiskinstruments.com (accessed on 20 February 2026).
  57. Al Ashraf, A. Thermal Conductivity Measurement by Hot Disk Analyzer. 2014. Available online: https://www.researchgate.net/profile/Abdullah-Ashraf-2/publication/271840994_Thermal_Conductivity_Measurement_by_Hot_Disk_Analyser/data/54d3c1030cf25013d02661d9/Thermal-Conductivity-Measurement-by-Hot-Disk-Analyser.pdf (accessed on 20 February 2026).
  58. ISO 22007-2:2015; Plastics—Determination of Thermal Conductivity and Thermal Diffusivity—Part 2: Transient Plane Heat Source (Hot Disk) Method. ISO: Geneva, Switzerland, 2015.
  59. Gustavsson, M.; Karawacki, E.; Gustafsson, S.E. Thermal Conductivity, Thermal Diffusivity, and Specific Heat of Thin Samples from Transient Measurements with Hot Disk Sensors. Rev. Sci. Instrum. 1994, 65, 3856–3859. [Google Scholar] [CrossRef]
  60. UNI EN 12667:2002; Thermal Performance of Building Materials and Products—Determination of Thermal Resistance by Means of Guarded Hot Plate and Heat Flow Meter Methods. UNI: Milano, Italy, 2002.
  61. He, Y. Rapid Thermal Conductivity Measurement with a Hot Disk Sensor. Thermochim. Acta 2005, 436, 122–129. [Google Scholar] [CrossRef]
  62. Hot Disk AB. Hot Disk Thermal Constants Analyzer—Theory and Measurement Conditions, Description Document. Available online: https://www.google.com/url?sa=t&source=web&rct=j&opi=89978449&url=https://www.hotdiskinstruments.com/content/uploads/2017/04/TPS-500-S.pdf&ved=2ahUKEwiikYa1_vOTAxVbQvEDHeo8IDEQFnoECBoQAQ&usg=AOvVaw2142KfBxWuuoEt-FCB2RBV (accessed on 20 February 2026).
  63. Warzoha, R.J.; Fleischer, A.S. Determining the Thermal Conductivity of Liquids Using the Transient Hot Disk Method. Part I: Establishing Transient Thermal-Fluid Constraints. Int. J. Heat Mass Transf. 2014, 71, 779–789. [Google Scholar] [CrossRef]
  64. EN 12664:2001; Thermal Performance of Building Materials and Products—Determination of Thermal Resistance by Means of Guarded Hot Plate and Heat Flow Meter Methods—Dry and Moist Products of Medium and Low Thermal Resistance. European Committee for Standardization: Brussels, Belgium, 2001.
  65. EN 12667:2001; Thermal Performance of Building Materials and Products—Determination of Thermal Resistance by Means of Guarded Hot Plate and Heat Flow Meter Methods—Products of High and Medium Thermal Resistance. European Committee for Standardization: Brussels, Belgium, 2001.
  66. Hammerschmidt, U. Guarded Hot-Plate (GHP) Method: Uncertainty Assessment. Int. J. Thermophys. 2002, 23, 1551–1570. [Google Scholar] [CrossRef]
  67. Dia, M.; Faye, M.; Diallo, M.S.; Sambou, V. Measurement of the Thermal Properties of Materials by the Hot Plate Method Considering the Convection Coefficient around the Device. Mater. Res. Express 2023, 10, 065502. [Google Scholar] [CrossRef]
  68. Yang, I.; Kim, D.; Lee, S. Construction and Preliminary Testing of a Guarded Hot Plate Apparatus for Thermal Conductivity Measurements at High Temperatures. Int. J. Heat Mass Transf. 2018, 122, 1343–1352. [Google Scholar] [CrossRef]
  69. Zarr, R.R.; Guthrie, W.F.; Hay, B. Collaborative Guarded-Hot-Plate Tests between the Laboratoire National de Métrologie et d’essais and the National Institute of Standards and Technology. Int. J. Thermophys. 2014, 35, 1025–1043. [Google Scholar] [CrossRef]
  70. Reddy, K.S.; Jayachandran, S. Investigations on Design and Construction of a Square Guarded Hot Plate (SGHP) Apparatus for Thermal Conductivity Measurement of Insulation Materials. Int. J. Therm. Sci. 2017, 120, 136–147. [Google Scholar] [CrossRef]
  71. Dubois, F.; Lebeau, M. Guarded Hot Plate Characterization of Straw Bale and Other Thick Insulating Materials. Energy Build. 2013, 62, 144–153. [Google Scholar]
  72. Fantucci, S.; Goia, F.; Perino, M.; Serra, V. Sinusoidal Response Measurement Procedure for the Thermal Performance Assessment of PCM by Means of Dynamic Heat Flow Meter Apparatus. Energy Build. 2019, 183, 297–310. [Google Scholar] [CrossRef]
  73. JCGM 100:2008; Evaluation of Measurement Data—Guide to the Expression of Uncertainty in Measurement (GUM 1995). Joint Committee for Guides in Metrology (JCGM): Sèvres Cedex, France, 2008.
  74. Moffat, R.J. Describing the Uncertainties in Experimental Results. Exp. Therm. Fluid Sci. 1988, 1, 3–17. [Google Scholar] [CrossRef]
  75. Baldinelli, G.; Bianchi, F.; Gendelis, S.; Jakovics, A.; Morini, G.L.; Falcioni, S.; Fantucci, S.; Serra, V.; Navacerrada, M.A.; Díaz, C.; et al. Thermal Conductivity Measurement of Insulating Innovative Building Materials by Hot Plate and Heat Flow Meter Devices: A Round Robin Test. Int. J. Therm. Sci. 2019, 139, 25–35. [Google Scholar] [CrossRef]
  76. Albatici, R.; Tonelli, A.M. Infrared Thermovision Technique for the Assessment of Thermal Transmittance Value of Opaque Building Elements on Site. Energy Build. 2010, 42, 2177–2183. [Google Scholar] [CrossRef]
  77. Domínguez-Muñoz, F.; Anderson, B.; Cejudo-López, J.M.; Carrillo-Andrés, A. Uncertainty in the Thermal Conductivity of Insulation Materials. Energy Build. 2010, 42, 2159–2168. [Google Scholar] [CrossRef]
  78. Lorenzati, A.; Fantucci, S.; Capozzoli, A.; Perino, M. VIPs Thermal Conductivity Measurement: Test Methods, Limits and Uncertainty. Energy Procedia 2015, 78, 418–423. [Google Scholar] [CrossRef][Green Version]
  79. Fantucci, S.; Lorenzati, A.; Capozzoli, A.; Perino, M. Analysis of the Temperature Dependence of the Thermal Conductivity in Vacuum Insulation Panels. Energy Build. 2019, 183, 64–74. [Google Scholar] [CrossRef]
  80. Kunič, R. Carbon Footprint of Thermal Insulation Materials in Building Envelopes. Energy Effic. 2017, 10, 1511–1528. [Google Scholar] [CrossRef]
  81. Violano, A.; Cannaviello, M. The Carbon Footprint of Thermal Insulation: The Added Value of Circular Models Using Recycled Textile Waste. Energies 2023, 16, 6768. [Google Scholar] [CrossRef]
  82. Füchsl, S.; Rheude, F.; Röder, H. Life Cycle Assessment (LCA) of Thermal Insulation Materials: A Critical Review. Clean. Mater. 2022, 5, 100119. [Google Scholar] [CrossRef]
  83. Asdrubali, F.; Fronzetti Colladon, A.; Segneri, L.; Gandola, D.M. LCA and Energy Efficiency in Buildings: Mapping More than Twenty Years of Research. Energy Build. 2024, 321, 114684. [Google Scholar] [CrossRef]
  84. Grazieschi, G.; Asdrubali, F.; Thomas, G. Embodied Energy and Carbon of Building Insulating Materials: A Critical Review. Clean. Environ. Syst. 2021, 2, 100032. [Google Scholar] [CrossRef]
  85. Shrestha, S.S.; Biswas, K.; Desjarlais, A.O. A Protocol for Lifetime Energy and Environmental Impact Assessment of Building Insulation Materials. Environ. Impact Assess. Rev. 2014, 46, 25–31. [Google Scholar] [CrossRef]
  86. Asdrubali, F.; Cellura, M.; D’Amico, A.; Guarino, F.; Gandola, D.M.; Grazieschi, G.; Longo, S. Labels for Building Materials and Components Sustainability Assessment and Certification. In Sustainability Certifications, Labels and Tools in the Built Environment; Routledge: London, UK, 2025; pp. 208–245. [Google Scholar]
  87. Asdrubali, F.; Baldinelli, G.; Pompoli, F.; Gandola, D.M. Thermal Characterization of Sustainable Materials of Marine Origin. In Central European Symposium on Building Physics; Springer Nature: Geneva, Switzerland, 2026; pp. 545–553. [Google Scholar]
  88. Asdrubali, F.; Grazieschi, G.; Gandola, D.M. The Role of Environmental Product Declarations in the Decarbonization of Building Materials and Components. Energies 2025, 18, 1308. [Google Scholar] [CrossRef]
  89. Resalati, S.; Okoroafor, T.; Henshall, P.; Simões, N.; Gonçalves, M.; Alam, M. Comparative Life Cycle Assessment of Different Vacuum Insulation Panel Core Materials Using a Cradle to Gate Approach. Build. Environ. 2021, 188, 107501. [Google Scholar] [CrossRef]
  90. Durão, V.; Silvestre, J.D.; Mateus, R.; de Brito, J. Assessment and Communication of the Environmental Performance of Construction Products in Europe: Comparison between PEF and EN 15804 Compliant EPD Schemes. Resour. Conserv. Recycl. 2020, 156, 104703. [Google Scholar] [CrossRef]
  91. Moncaster, A.M.; Symons, K.E. A Method and Tool for ‘Cradle to Grave’ Embodied Carbon and Energy Impacts of UK Buildings in Compliance with the New TC350 Standards. Energy Build. 2013, 66, 514–523. [Google Scholar] [CrossRef]
  92. Schiavoni, S.; D’Alessandro, F.; Bianchi, F.; Asdrubali, F. Insulation Materials for the Building Sector: A Review and Comparative Analysis. Renew. Sustain. Energy Rev. 2016, 62, 988–1011. [Google Scholar] [CrossRef]
  93. Baetens, R.; Jelle, B.P.; Gustavsen, A. Aerogel Insulation for Building Applications: A State-of-the-Art Review. Energy Build. 2011, 43, 761–769. [Google Scholar] [CrossRef]
  94. Baetens, R.; Jelle, B.P.; Thue, J.V.; Tenpierik, M.J.; Grynning, S.; Uvsløkk, S.; Gustavsen, A. Vacuum Insulation Panels for Building Applications: A Review and Beyond. Energy Build. 2010, 42, 147–172. [Google Scholar] [CrossRef]
  95. Sáez de Guinoa, A.; Zambrana-Vasquez, D.; Alcalde, A.; Corradini, M.; Zabalza-Bribián, I. Environmental Assessment of a Nano-Technological Aerogel-Based Panel for Building Insulation. J. Clean. Prod. 2017, 161, 1404–1415. [Google Scholar] [CrossRef]
  96. Fenoglio, E.; Fantucci, S.; Serra, V.; Carbonaro, C.; Pollo, R. Hygrothermal and Environmental Performance of a Perlite-Based Insulating Plaster for the Energy Retrofit of Buildings. Energy Build. 2018, 179, 26–38. [Google Scholar] [CrossRef]
  97. Govaerts, Y.; Hayen, R.; de Bouw, M.; Verdonck, A.; Meulebroeck, W.; Mertens, S.; Grégoire, Y. Performance of a Lime-Based Insulating Render for Heritage Buildings. Constr. Build. Mater. 2018, 159, 376–389. [Google Scholar] [CrossRef]
  98. Laveglia, A.; Sambataro, L.; Ukrainczyk, N.; Oertel, T.; De Belie, N.; Koenders, E. How to Improve the Cradle-to-Gate Environmental and Economic Sustainability in Lime-Based Construction Materials? Answers from a Real-Life Case-Study. Dev. Built Environ. 2023, 15, 100186. [Google Scholar] [CrossRef]
  99. Cusenza, M.A.; Gulotta, T.M.; Mistretta, M.; Cellura, M. Life Cycle Energy and Environmental Assessment of the Thermal Insulation Improvement in Residential Buildings. Energies 2021, 14, 3452. [Google Scholar] [CrossRef]
  100. Hoxha, E.; Passer, A.; Saade, M.R.M.; Trigaux, D.; Shuttleworth, A.; Pittau, F.; Allacker, K.; Habert, G. Biogenic Carbon in Buildings: A Critical Overview of LCA Methods. Build. Cities 2020, 1, 504–524. [Google Scholar] [CrossRef]
  101. Cascione, V.; Roberts, M.; Allen, S.; Charbel, C.; Maskell, D.; Dams, B.; Shea, A.; Walker, P.; Emmitt, S. Evaluating Environmental Impacts of Bio-Based Insulation Materials through Scenario-Based and Dynamic Life Cycle Assessment. Int. J. Life Cycle Assess. 2025, 30, 601–620. [Google Scholar] [CrossRef]
  102. Pedroso, M.; Silvestre, J.D.; Flores-Colen, I.; Gomes, M.G. Environmental Impact of Wall Multilayer Coating Systems Containing Aerogel-Based Fibre-Enhanced Thermal Renders. J. Build. Eng. 2023, 76, 107322. [Google Scholar] [CrossRef]
  103. Fantucci, S.; Fenoglio, E.; Grosso, G.; Serra, V.; Perino, M.; Marino, V.; Dutto, M. Development of an Aerogel-Based Thermal Coating for the Energy Retrofit and the Prevention of Condensation Risk in Existing Buildings. Sci. Technol. Built Environ. 2019, 25, 1178–1186. [Google Scholar] [CrossRef]
  104. Shittu, E.; Stojceska, V.; Gratton, P.; Kolokotroni, M. Environmental Impact of Cool Roof Paint: Case-Study of House Retrofit in Two Hot Islands. Energy Build. 2020, 217, 110007. [Google Scholar] [CrossRef]
  105. Dominguez-Delgado, A.; Domínguez-Torres, H.; Domínguez-Torres, C.-A. Energy and Economic Life Cycle Assessment of Cool Roofs Applied to the Refurbishment of Social Housing in Southern Spain. Sustainability 2020, 12, 5602. [Google Scholar] [CrossRef]
  106. Zhang, Z.; Tong, S.; Yu, H. Life Cycle Analysis of Cool Roof in Tropical Areas. Procedia Eng. 2016, 169, 392–399. [Google Scholar] [CrossRef]
  107. Gelowitz, M.D.C.; McArthur, J.J. Comparison of Type III Environmental Product Declarations for Construction Products: Material Sourcing and Harmonization Evaluation. J. Clean. Prod. 2017, 157, 125–133. [Google Scholar] [CrossRef]
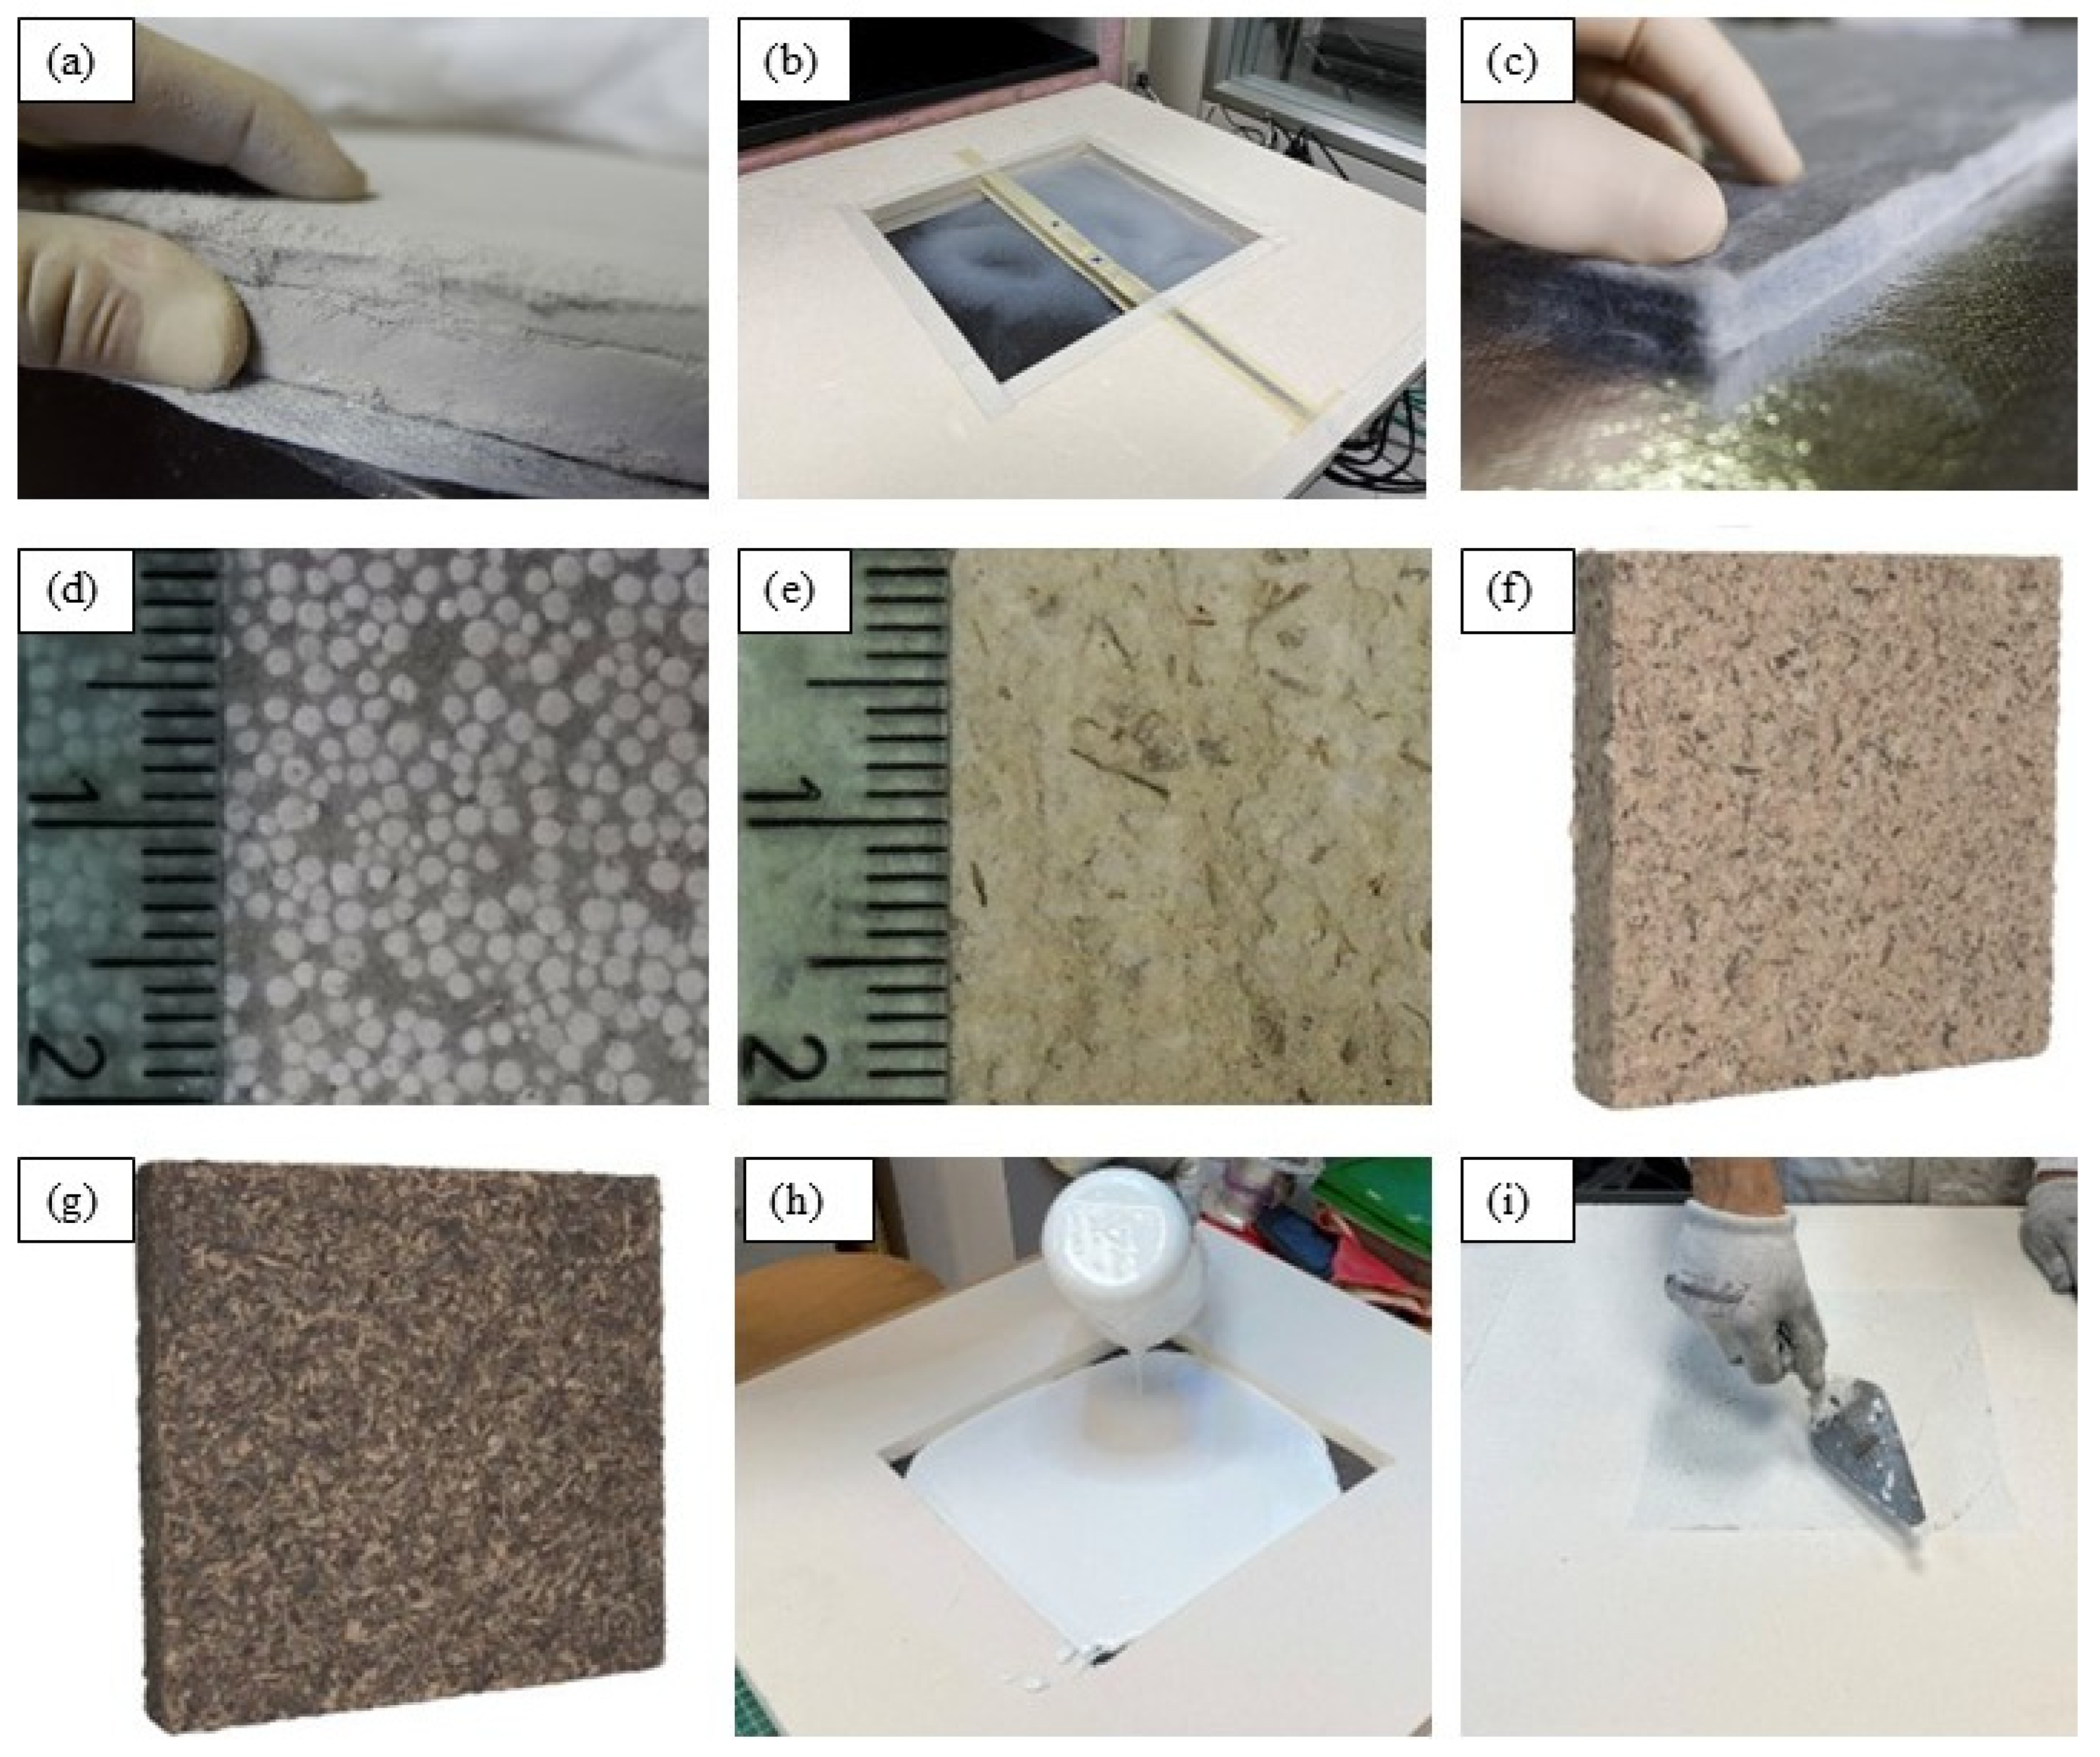
Figure 1. Pictures of tested materials: (a) Sample_VIP1; (b) preparation of Sample_Ae1,2,3; (c) Sample_Ae4,5; (d) Sample_Int1; (e) Sample_Int2, (f) Sample_Sc1, (g) Sample_Sc2; (h) preparation of Sample_NC1; (i) preparation of Sample_NC3.
Sustainability 18 04474 g001
Figure 2. Heat Flux Meter apparatus (HFM) LaserComp Fox600. Example of the setup for the Heat Flux Meter apparatus LaserComp FOX600. Thermocouples are placed in the upper and lower faces of the sample to measure the surface temperature.
Sustainability 18 04474 g002
Table 1. Overview of the tested material samples.
Sample
Name
Categoryd
[mm]
ρ
[kg/m3]
DescriptionInternal StructureApplication in the
Building Envelope
Sample_VIP1A30199Microporous insulation board
for vacuum panels core.
MicroporousWall, ceiling, and floor insulation.
Sample_Ae1A1965Granular silica Aerogel
(particle size < 500 μm).
PorousFiller or aggregate for mortars and blocks.
Sample_Ae2A1573Granular silica Aerogel
(500< particle size < 1250 μm).
PorousFiller or aggregate for mortars and blocks.
Sample_Ae3A1584Granular silica Aerogel
(1250< particle size < 3500 μm).
PorousFiller or aggregate for mortars and blocks.
Sample_Ae4A10140Flexible aerogel blanket with fibers.Fibrous–porousWall, ceiling, and floor insulation.
Sample_Ae5A10154Flexible aerogel blanket with fibers.Fibrous–porousWall, ceiling, and floor insulation.
Sample_Int1B30286Thermal insulating render with
expanded polystyrene beads.
PorousInternal/external wall insulation.
Sample_Int2B30453Thermal insulating render with
vegetal-based aggregates.
PorousInternal/external wall insulation.
Sample_Sc1C40369Pine and olive chips insulating panel.Fibrous–porousThermal/acoustic insulation.
Sample_Sc2C40520Olive chips insulating panel.Fibrous–porousThermal/acoustic insulation.
Sample_NC1D20459Premixed insulating coat with
microporous ceramic beads.
MicroporousInsulating coating for thermal bridge mitigation.
Sample_NC3D20268Premixed nanocomposite
insulating coat.
MicroporousInsulating coating for thermal bridge mitigation.
Table 2. Synthetic category comparison table.
CategoryDefinition (Study Taxonomy)Typical Products/ExamplesTypical Thermal Conductivity (Qualitative, W·m−1·K−1)Embodied Carbon Range (kg CO2e/kg, A1–A3)Embodied Energy Range (MJ/kg, A1–A3)
ASuper-insulating materialsVIPs; silica-aerogel blankets/boards; high-performance thin solutions.~0.004–0.0204.0–10.090–250
BThermal insulating rendersLime/cement/gypsum renders with perlite/vermiculite/EPS beads; multi-layer systems.~0.055–0.120 (dry; moisture-sensitive)0.20–0.602–12
CBio-based insulation boardsWood-fiber boards (various densities); cellulose-based boards.~0.035–0.050 (density/moisture dependent)0.05–0.403–15
DThermal insulating coatingsAerogel-based insulating coatings; insulating paints/micro-sphere coatings; cool/reflective coatings.Not strictly conductivity-driven for reflective coatings; conductive benefit thickness-limited.0.30–6.04–150
Table 3. Embodied carbon and embodied energy ranges of analyzed insulation materials (cradle-to-gate, per kg).
CategoryMaterial (Row-Level Archetype)Typical Composition/Market AnalogEmbodied Carbon Range (kg CO2e/kg, A1–A3)Embodied Energy Range (MJ/kg, A1–A3)Notes on Interpretation
AAerogel-based insulation (blanket/board archetype)Silica aerogel + fibers/binder4.0–10.0110–250High performance enables thickness reduction; impacts often dominated by aerogel production energy and composites.
AVacuum insulation panel (VIP archetype)Fumed silica (or alternative cores) + barrier foil + getters6.0–10.0150–250Highly assembly-dependent; puncture/aging risks mean results are sensitive to assumed service life and detailing.
AHigh-performance rigid foam (PIR/PUR/phenolic archetype)Petrochemical polymer foam with additives4.0–7.090–160Fire performance depends on formulation; blowing agents/additives can materially affect embodied profiles.
BPerlite-based insulating plasterLime/cement/gypsum binder + expanded perlite0.20–0.502–6Moisture can increase in-service λ; binder is typically cradle-to-gate hotspot.
BEPS-bead insulating renderMineral binder + EPS beads0.30–0.604–12Polymer fraction increases fossil impacts; still thin-layer use means per-kg comparisons require thickness context.
BLime-based insulating render (heritage-compatible archetype)Hydraulic lime + lightweight aggregate0.20–0.453–8Durability and moisture buffering can be decisive; external exposure requires hygrothermal validation.
CCellulose-based board (recycled fiber archetype)Recycled cellulose + fire retardants/binders0.05–0.203–10Biogenic carbon accounting and additive selection (e.g., borates) can shift results materially.
CWood-fiber board (low-density archetype)Wood fibers + binder (varies)0.10–0.304–12Performance and impacts sensitive to density, resin content, and moisture behavior.
CWood-fiber board (high density archetype)Higher density wood fibers + binder0.15–0.405–15Often higher impacts per kg than low-density boards, but may improve robustness/mechanics.
DAerogel-based insulating coatingCoating binder + aerogel filler (thin layer)3.0–6.080–150Thermal benefit is thickness-limited; system-level value is highest under strict space constraints.
DCeramic microsphere insulating paintPolymer paint + hollow microspheres0.80–3.510–80Performance claims vary; may act more as radiative/reflective layer than conductive insulation.
DPolymer-modified insulating coatingAcrylic/latex-based coating with fillers0.30–1.25–35Durability/UV aging and maintenance cycles affect life cycle relevance beyond A1–A3.
DThin mineral insulating coatingMineral binder + porous fillers0.40–1.04–20Typically good fire performance; recycled mineral content can reduce burdens if evidenced by EPD/LCA.
Table 4. Thermal conductivity intra-lab results.
Sample Testd
[mm]
ρ
[kg/m3]
λ
Hot Disk
[W/(m K)]
λ
Hot Plate
[W/(m K)]
λ
Heat Flow Meter
[W/(m K)]
Cp
Hot Disk
[J/(kg K)]
Sample_VIP1301990.05110.01780.0214970.6
Sample_Ae119650.0297Not Applicable0.02021383.6
Sample_Ae215730.0291Not Applicable0.0182874.6
Sample_Ae315840.0297Not Applicable0.0201612.7
Sample_Ae4101400.1108Not Applicable0.01664944.2
Sample_Ae5101540.1054Not Applicable0.01668530.3
Sample_Int1302860.0904Not Applicable0.0869861.08
Sample_Int2304530.1398Not Applicable0.0908551.5
Sample_Sc1403690.16700.08790.06981597.5
Sample_Sc2405200.16190.08900.08361730.3
Sample_NC120459N/A0.06190.0983N/A
Sample_NC320268N/A0.07460.0789N/A
Table 5. Comparison of the two methods.
Guarded Hot Plate and Heat Flow MeterHot Disk
Planar dimensions not lower than 300 × 300 mm.Dimensions not lower than a few centimeters for each side, driven by the probing depth.
Planarity needed for a wide area.Planarity needed for only one surface.
Long measurement duration (h).Short measurement duration (less than one min).
Result limited to the evaluation of thermal conductivity.Specific heat is also obtained for homogeneous samples.
Suitable for materials with small dimensions inhomogeneities.Not suitable for inhomogeneous materials, apart from surface coatings.
Simple equations governing the physics and easy interpretation of results.Complex equations governing the physics and careful interpretation of results needed.
Disclaimer/Publisher’s Note: The statements, opinions and data contained in all publications are solely those of the individual author(s) and contributor(s) and not of MDPI and/or the editor(s). MDPI and/or the editor(s) disclaim responsibility for any injury to people or property resulting from any ideas, methods, instructions or products referred to in the content.