A Two-Timescale Typology of Neighborhood-Scale Commercial Districts in Seoul: Evidence from Mobile Phone De Facto Population Data


Abstract
1. Introduction
2. Data and Method
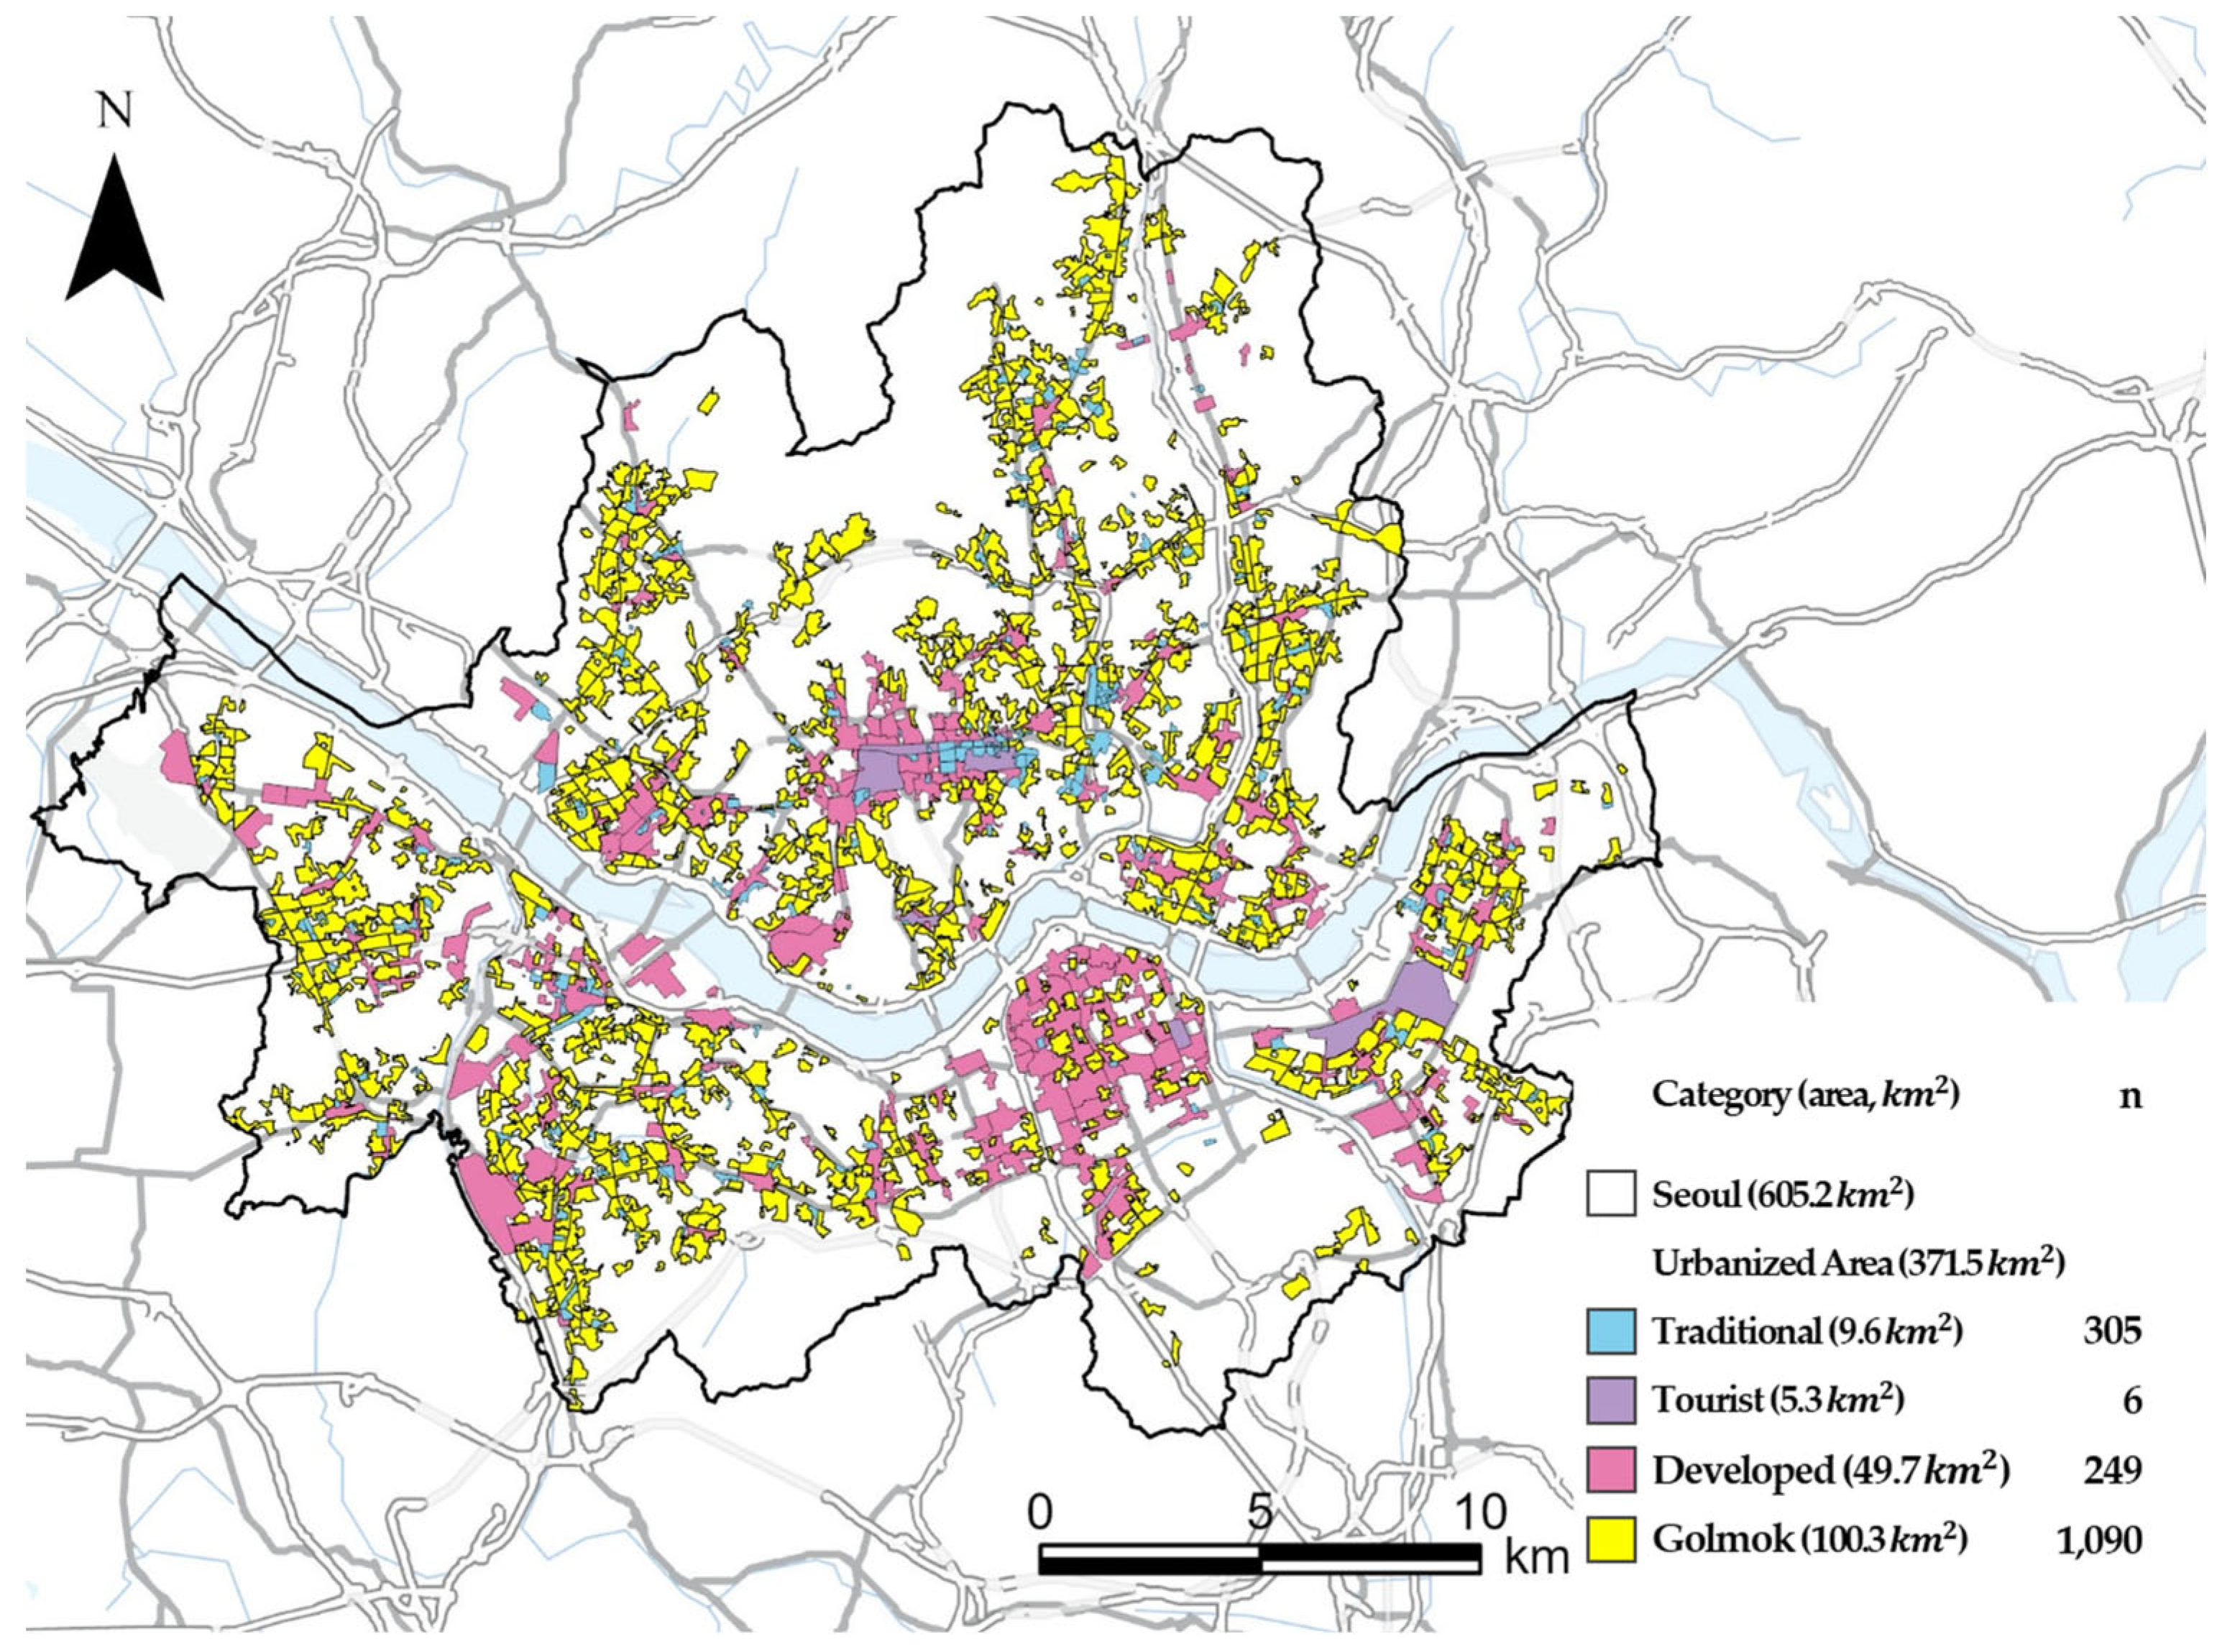
2.1. Seoul’s Commercial District Classification and Support Policies
2.2. De Facto Population Data
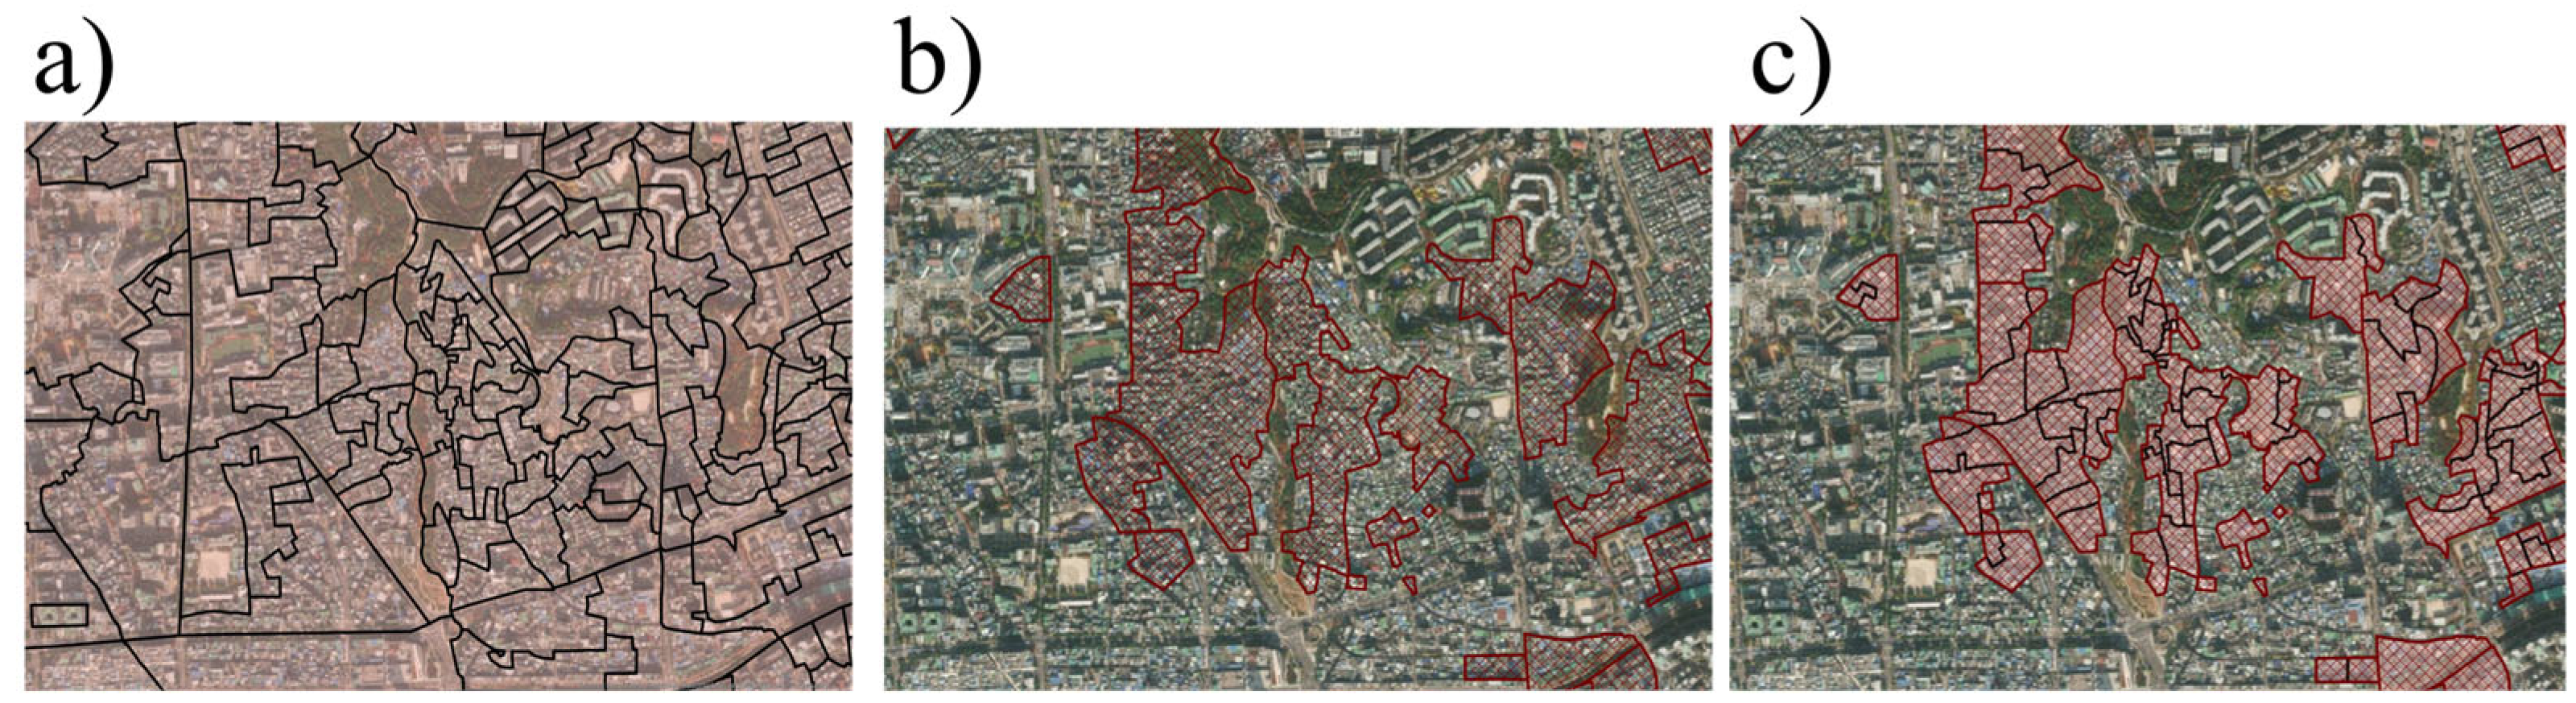
2.3. Areal Weighted Interpolation
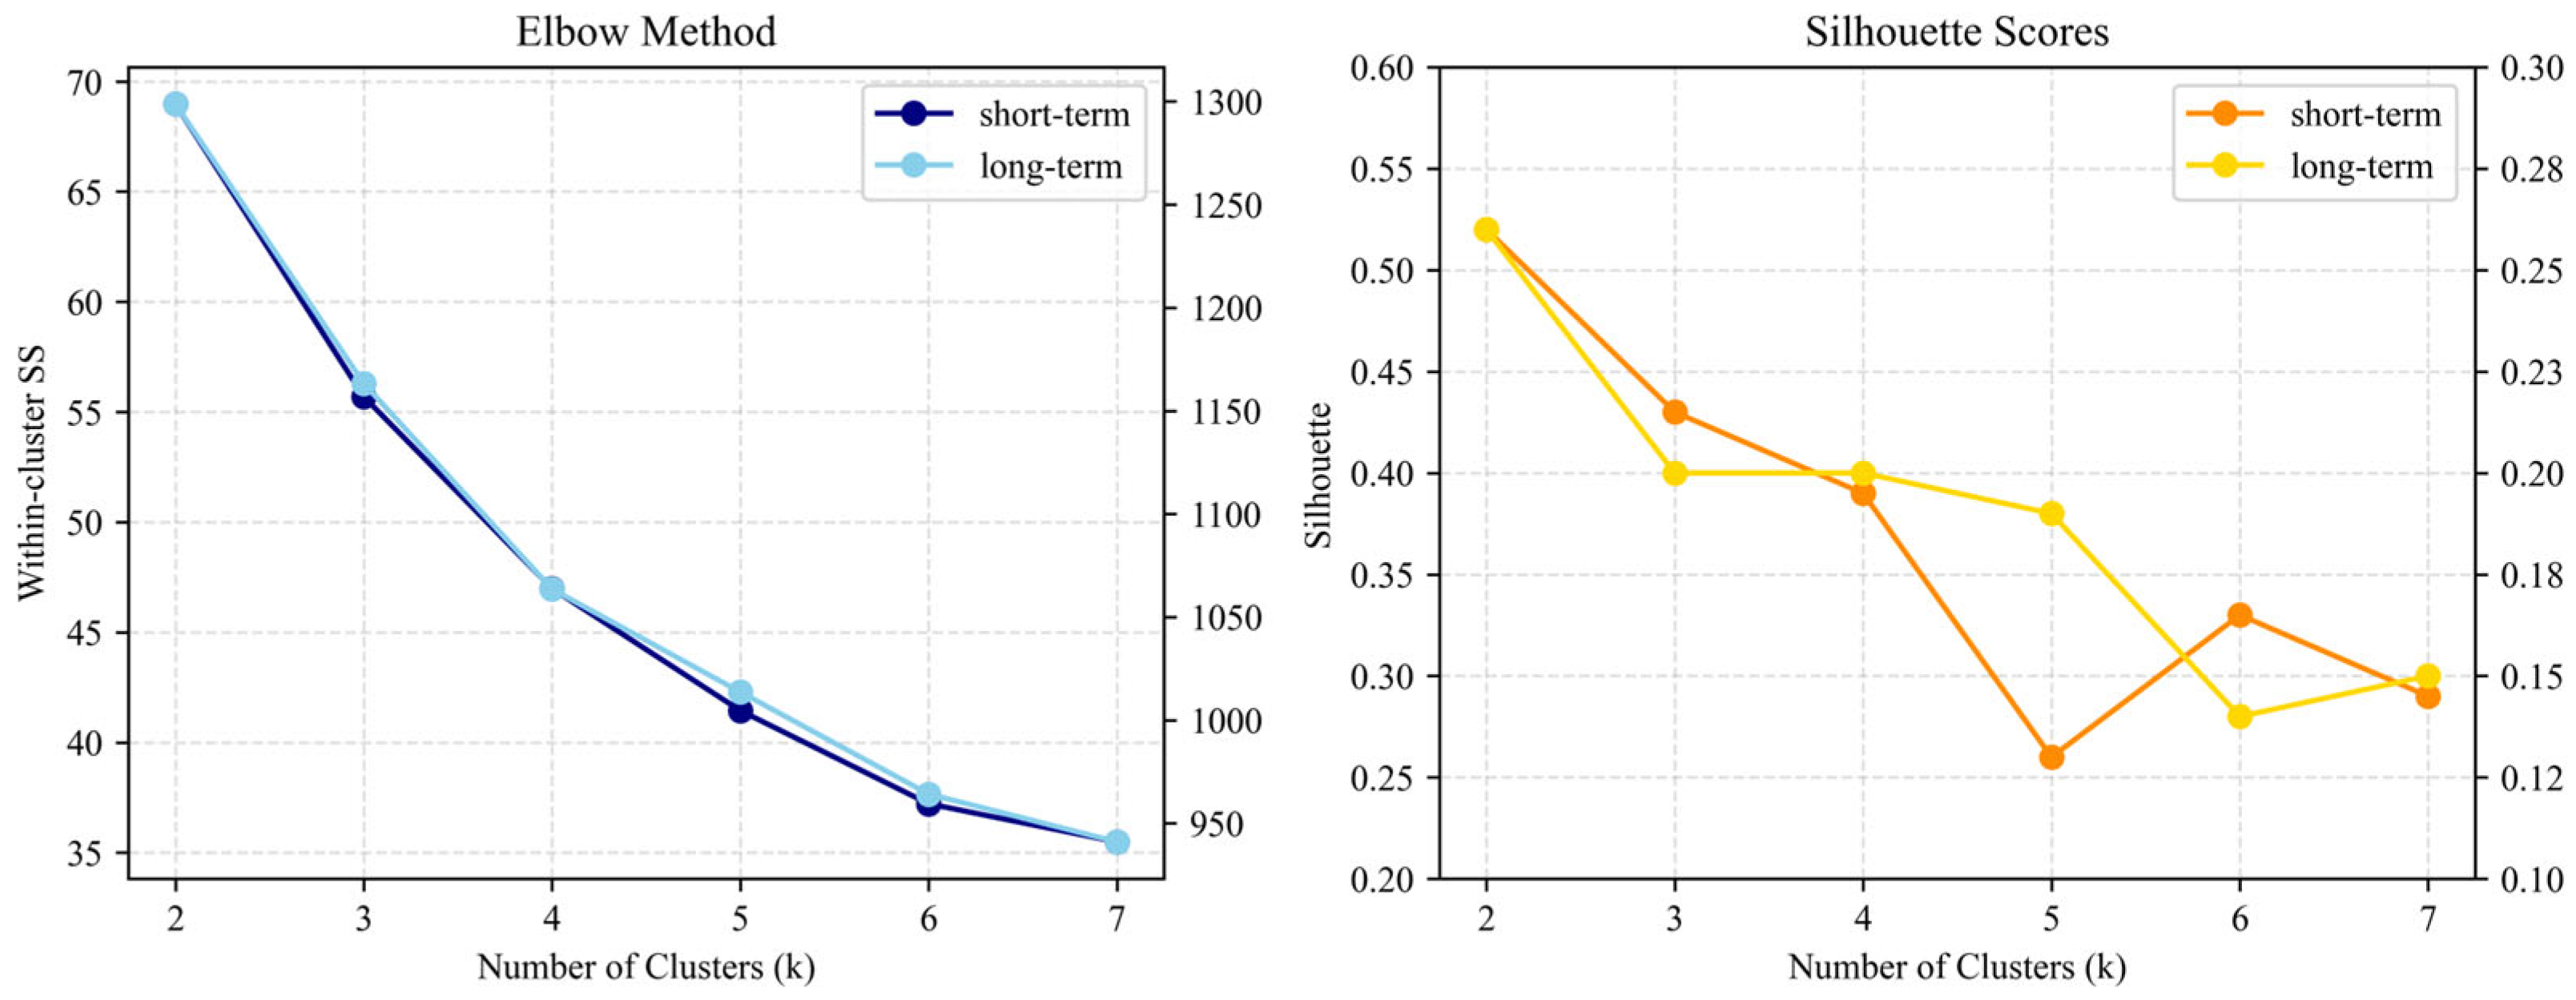
2.4. Time-Series K-Means Clustering of De Facto Population Across Two-Timescale
2.5. Random Forest Classifier for Complementary Assessment
3. Results
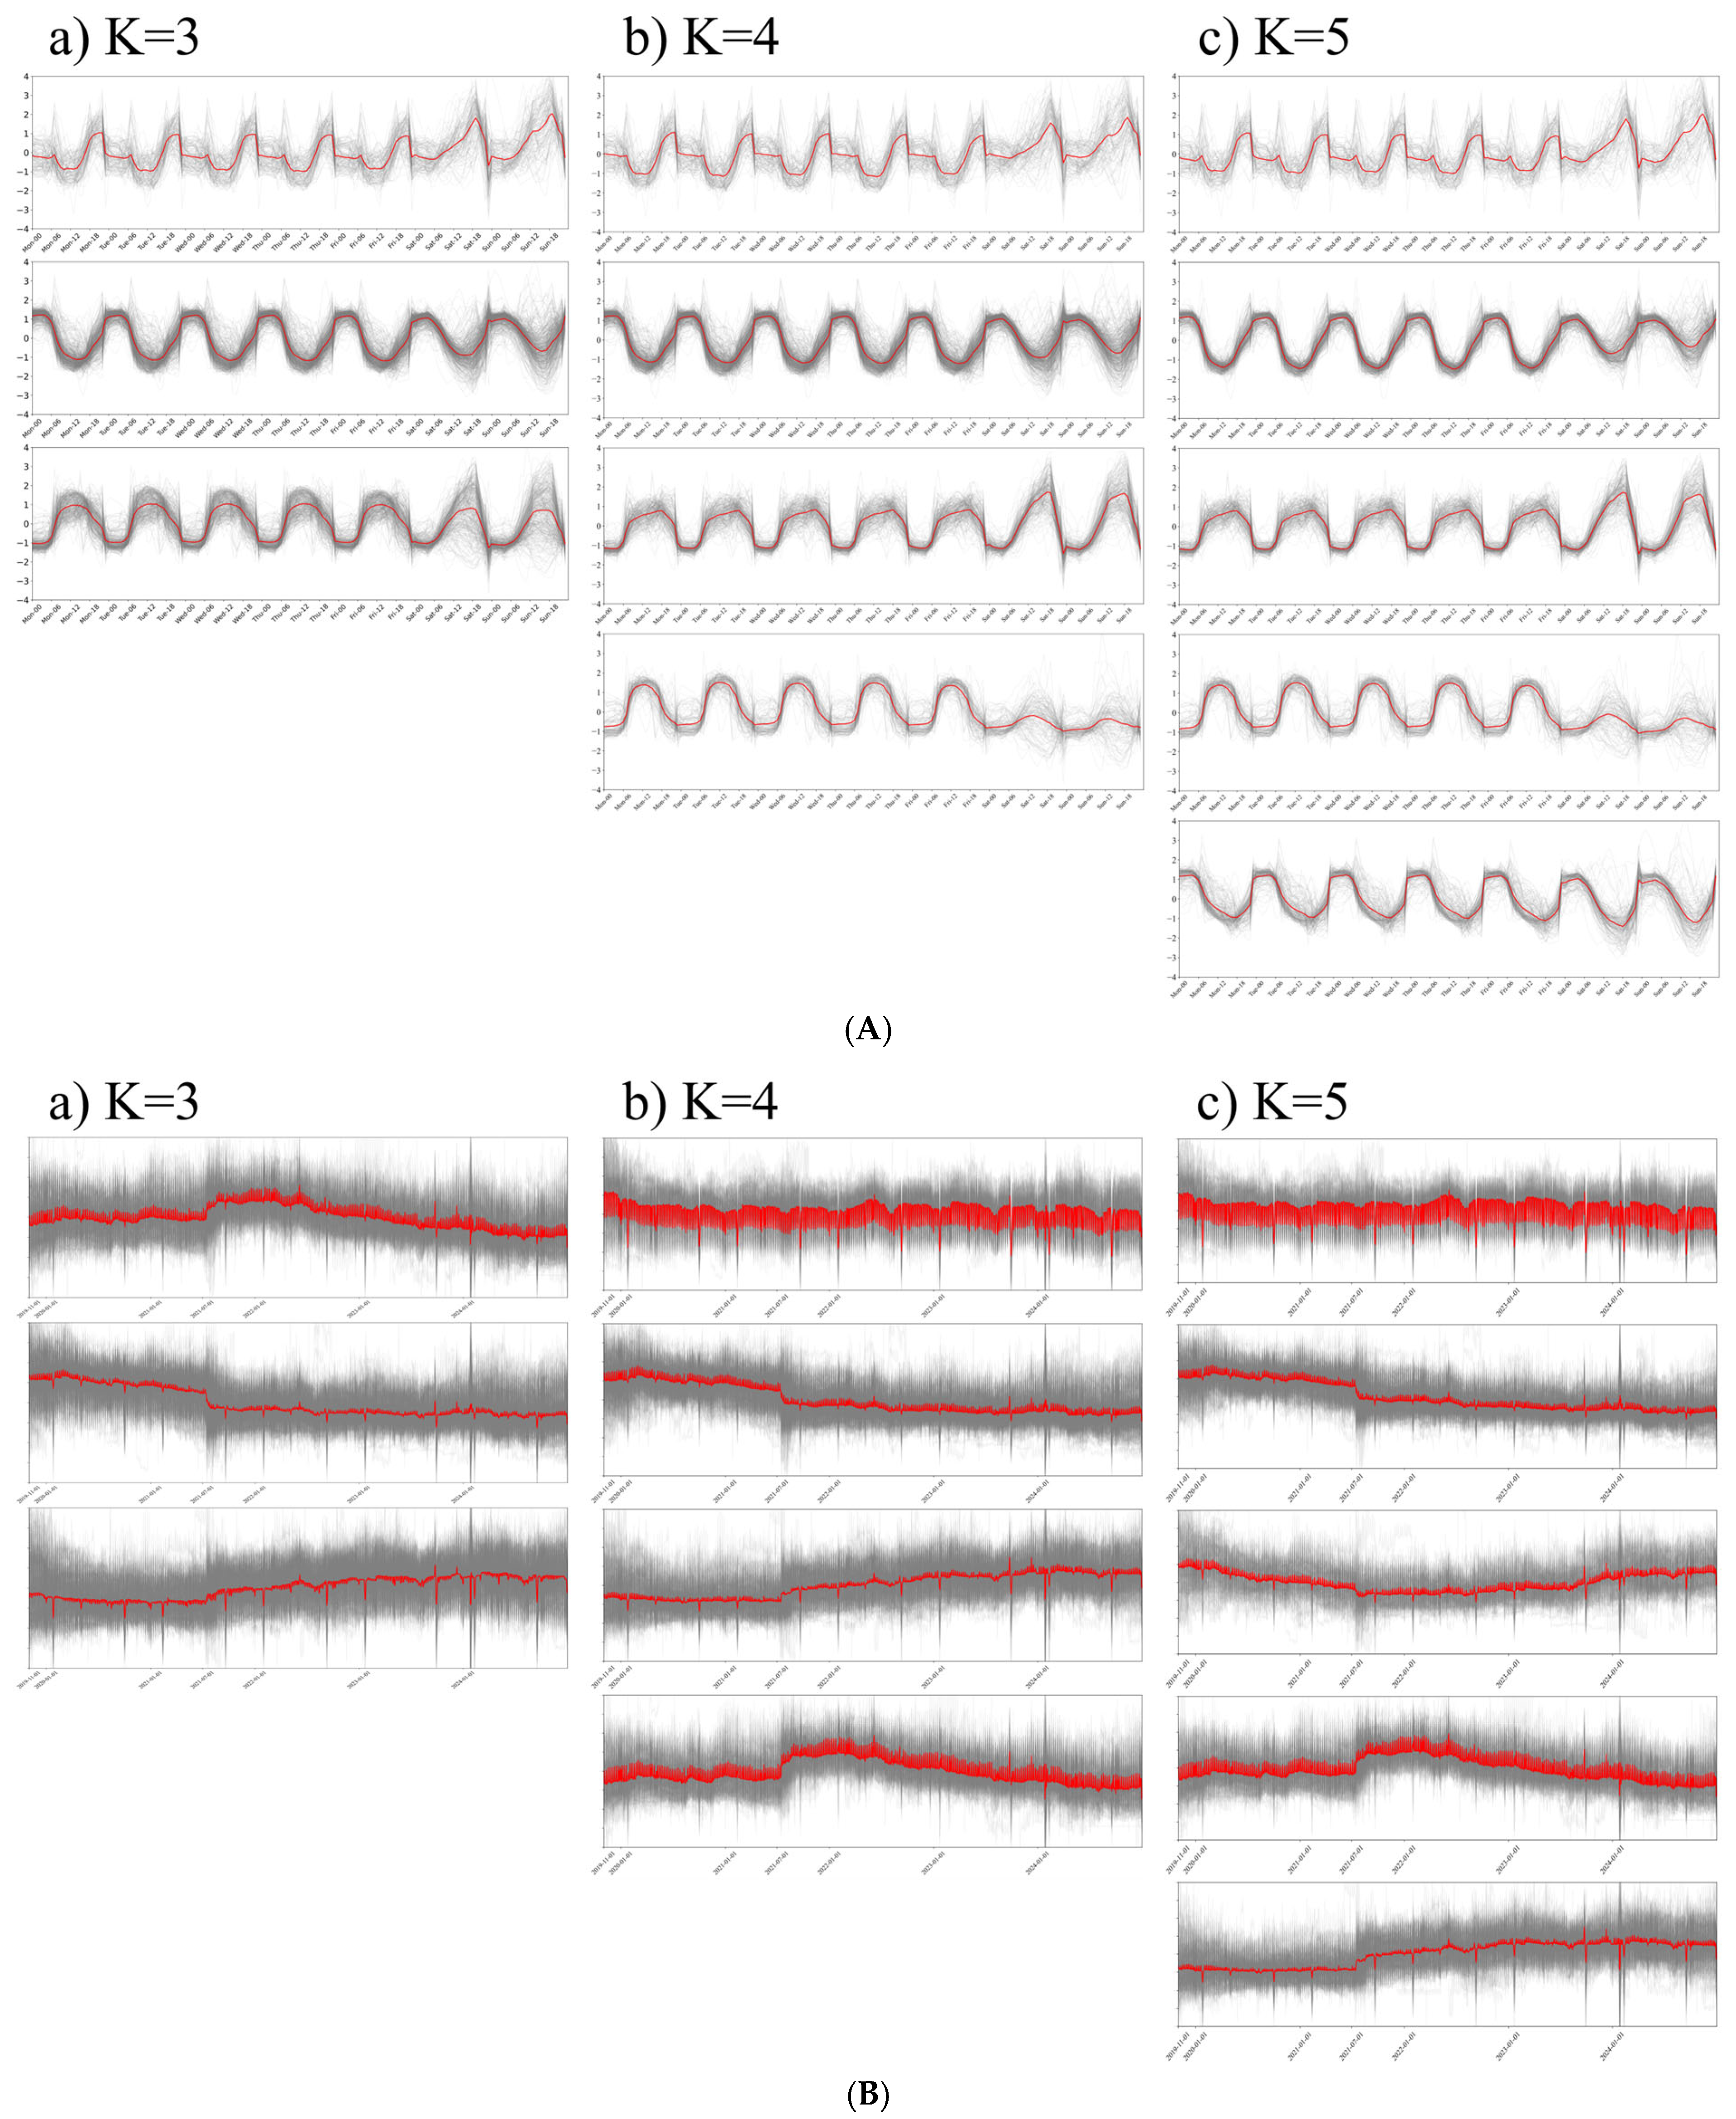
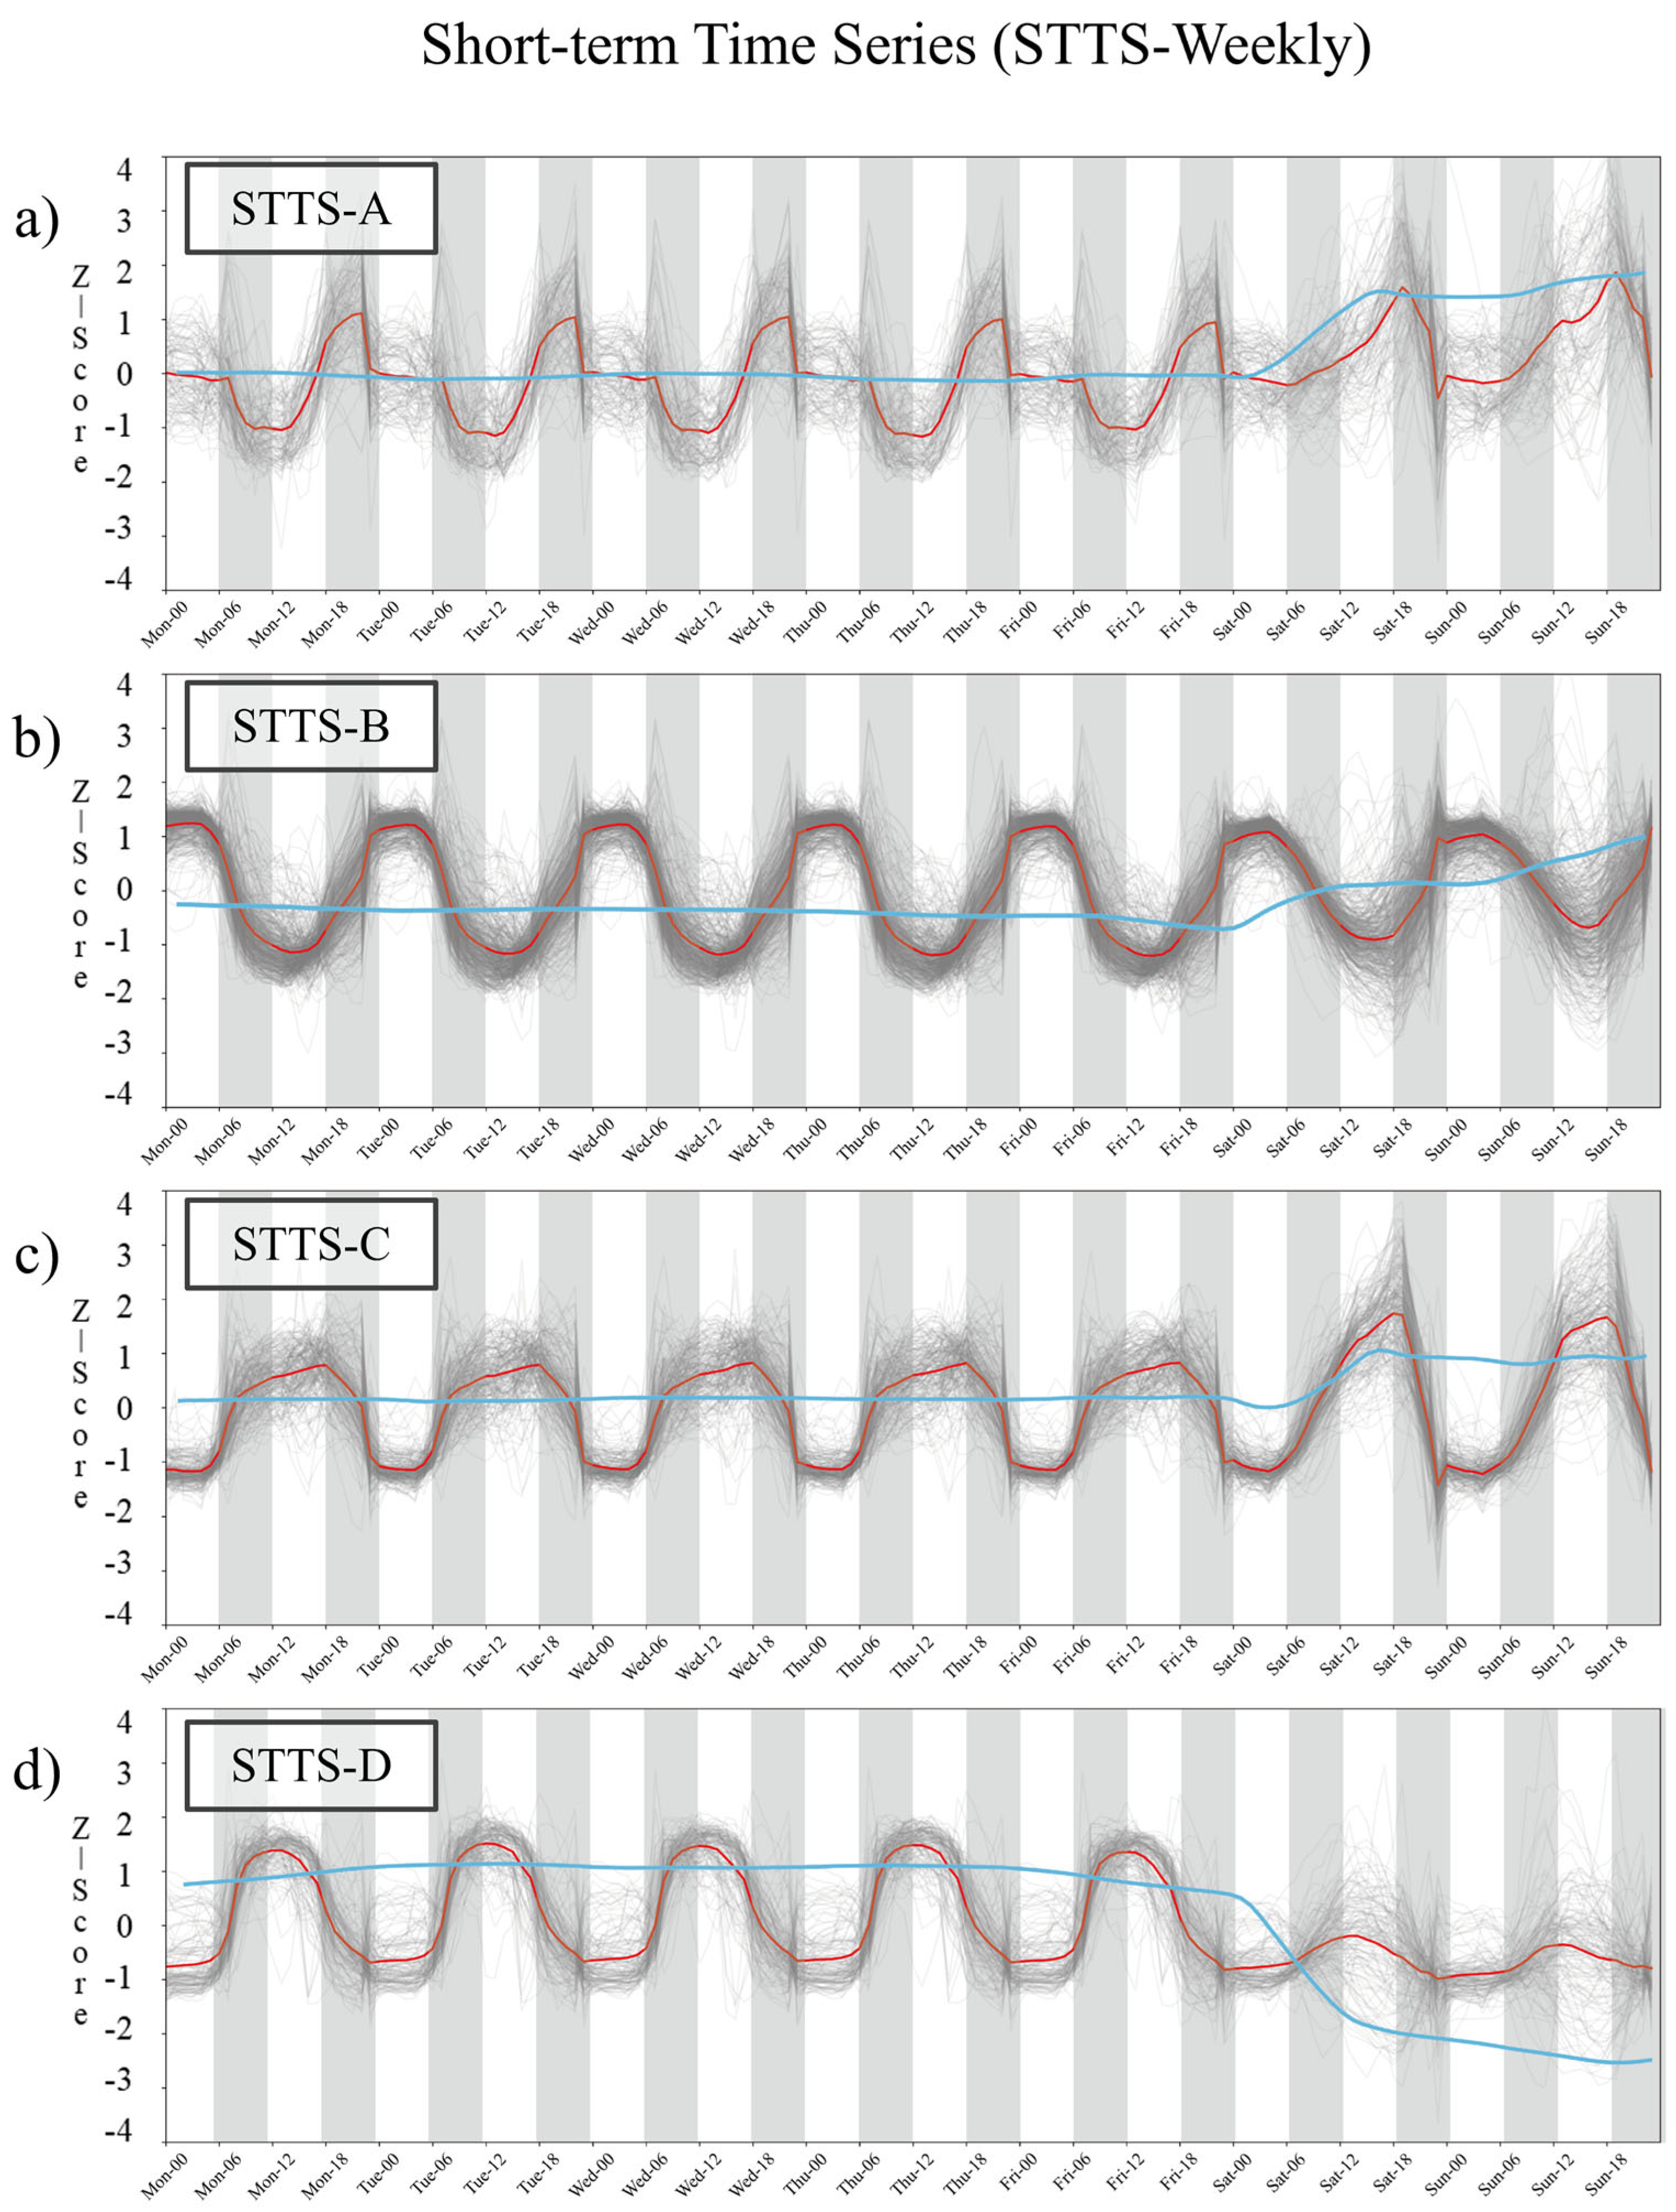
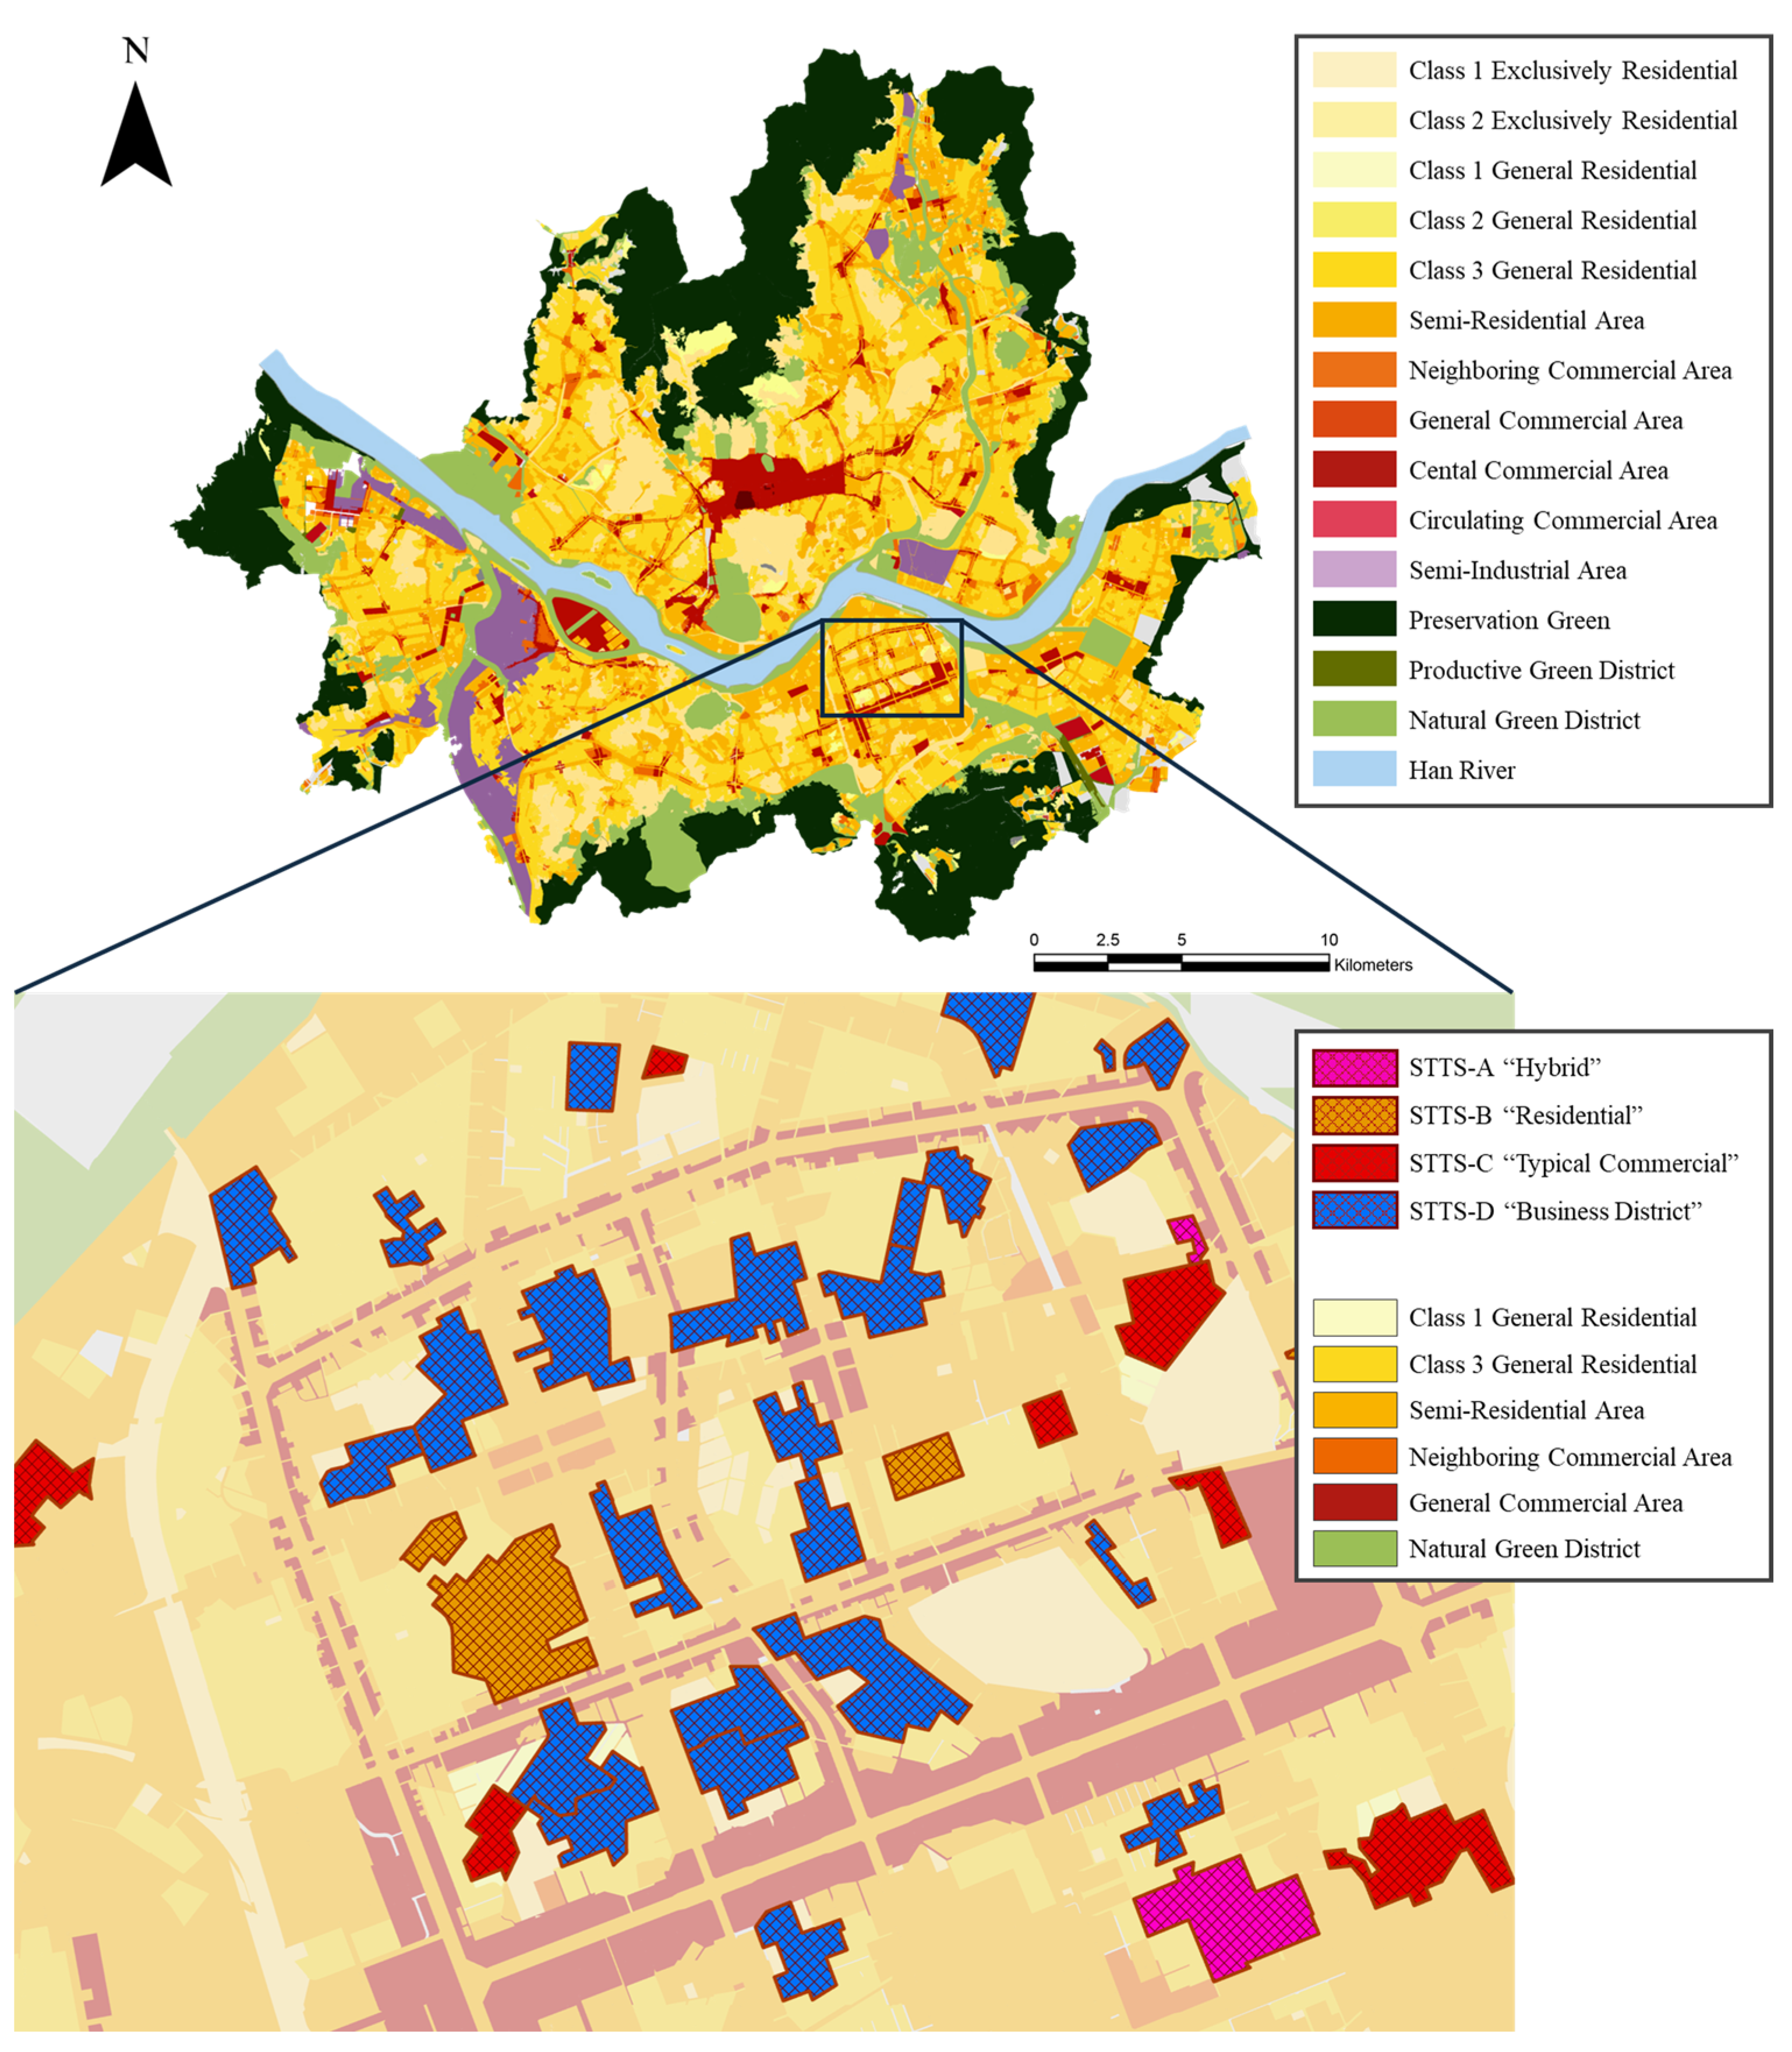
3.1. Short-Term Time Series (STTS)
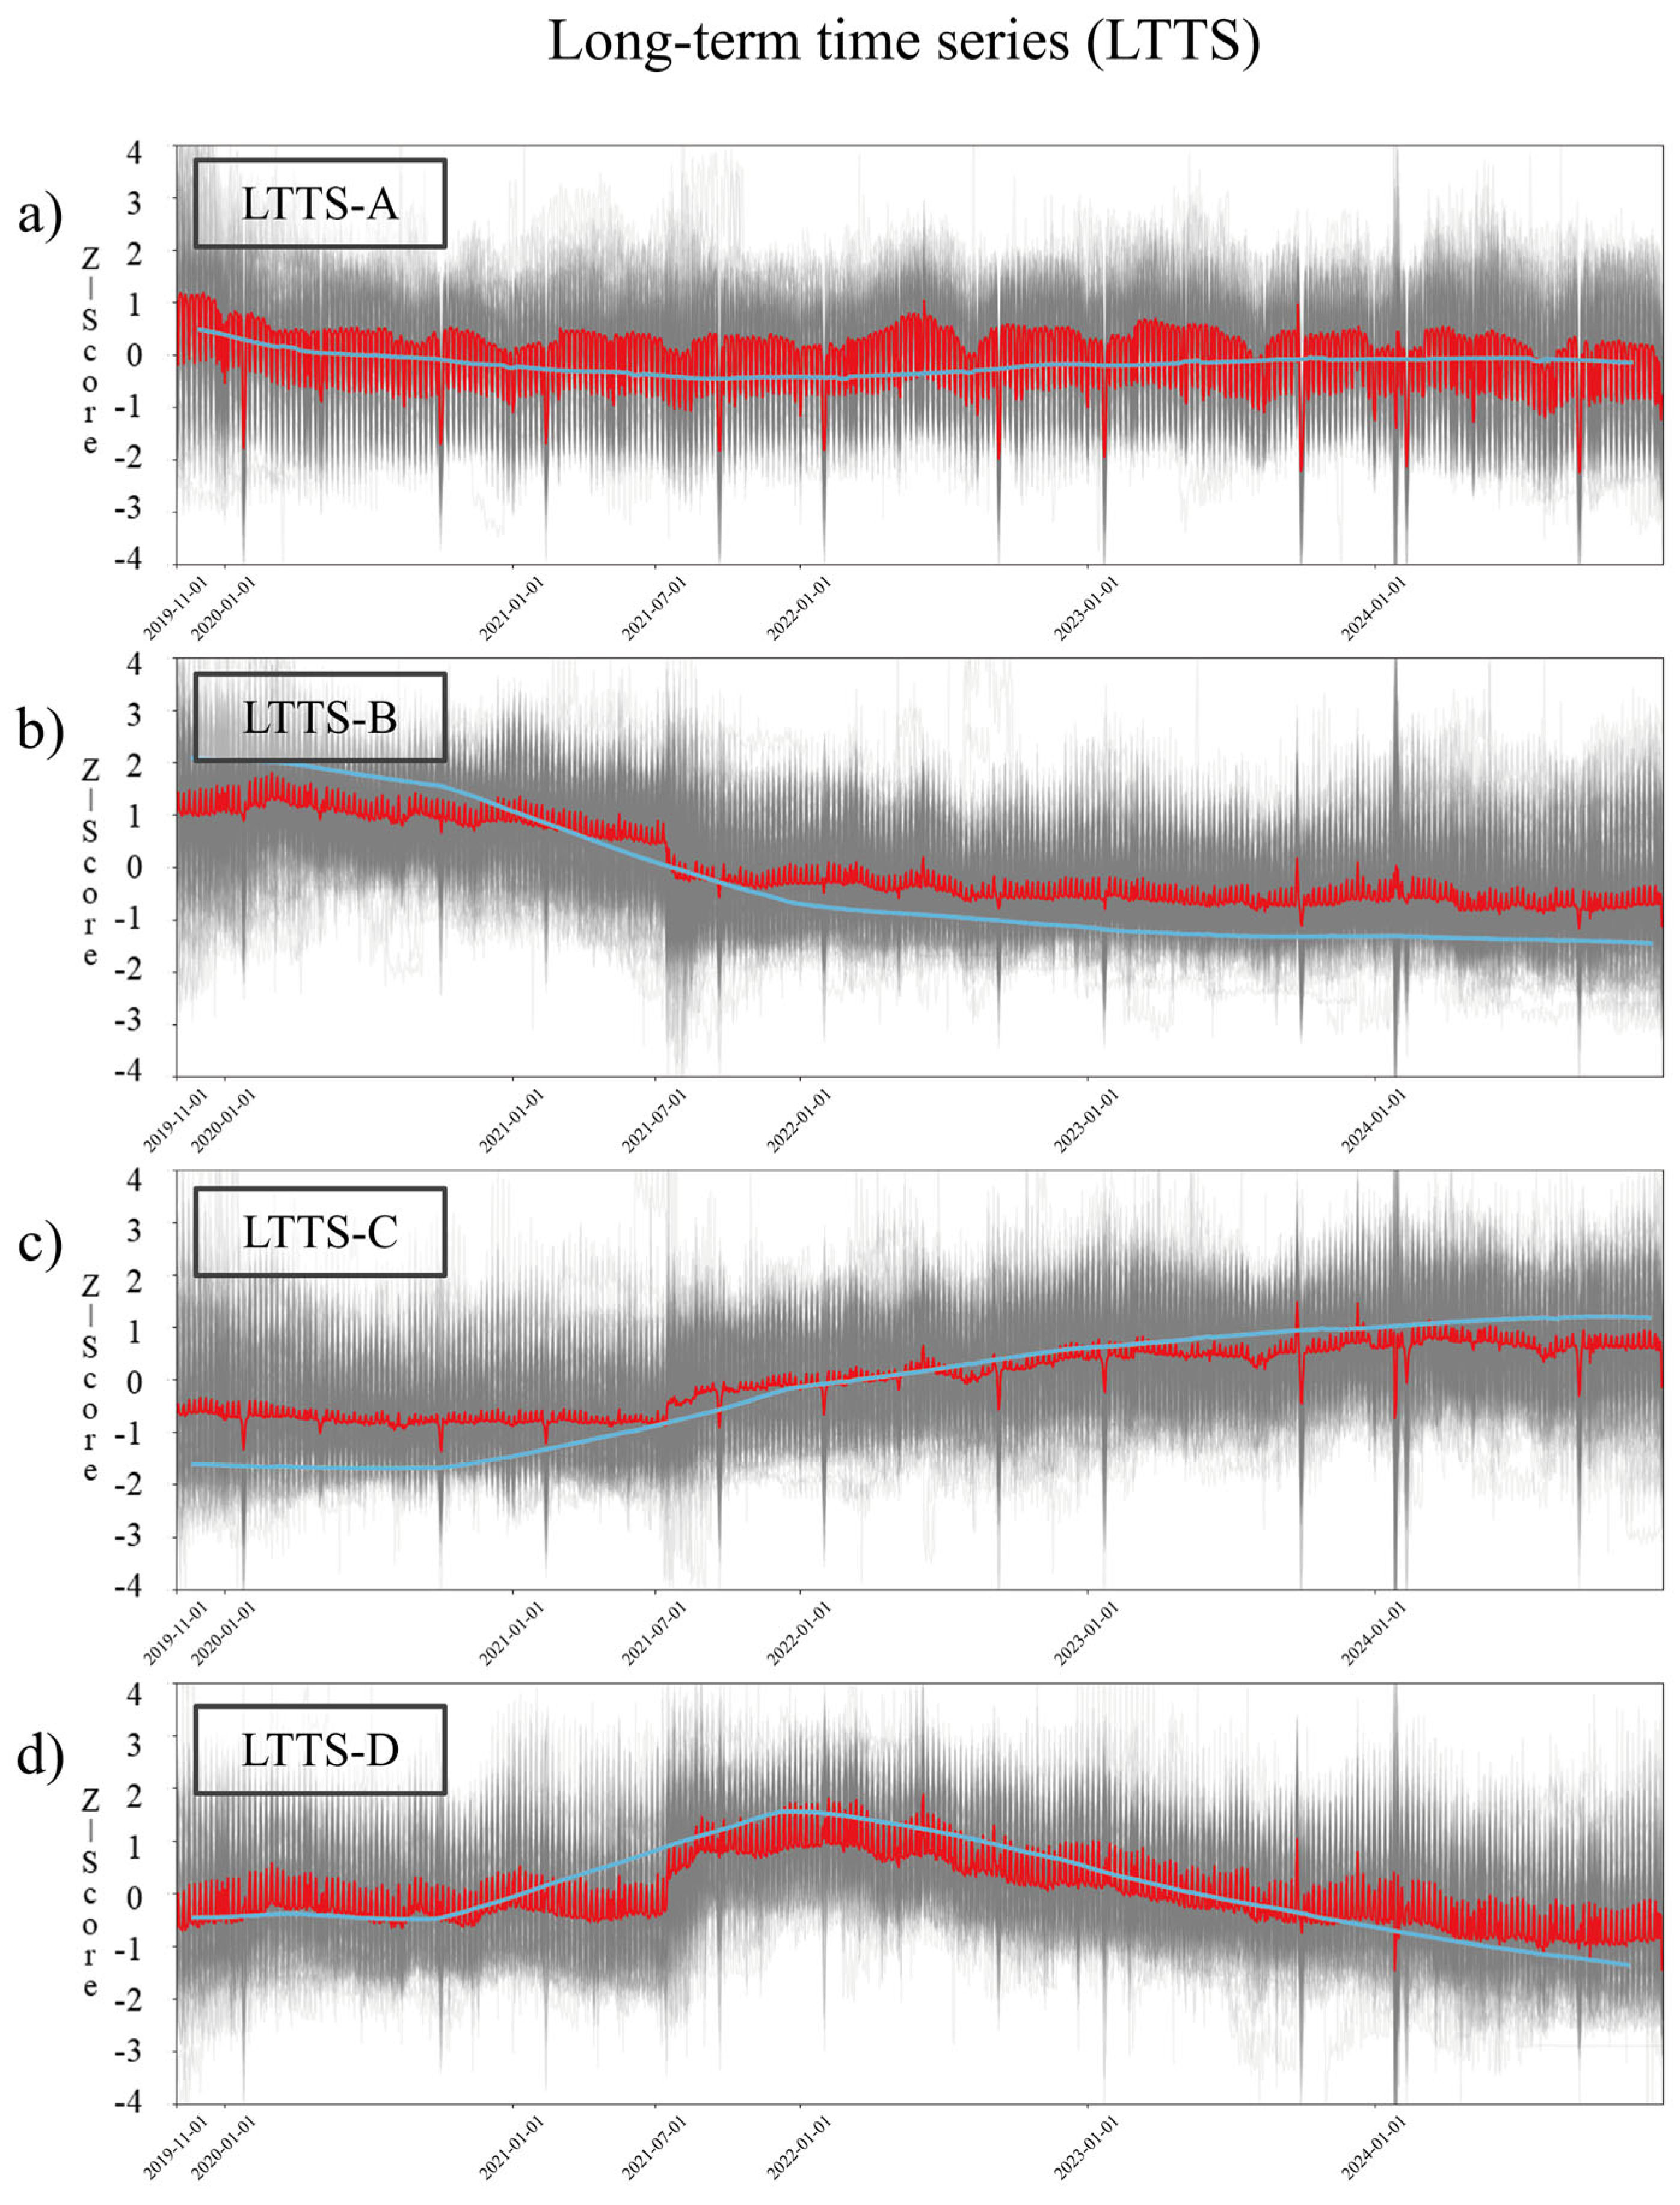
3.2. Long-Term Time Series (LTTS)
3.3. Typology Matrix
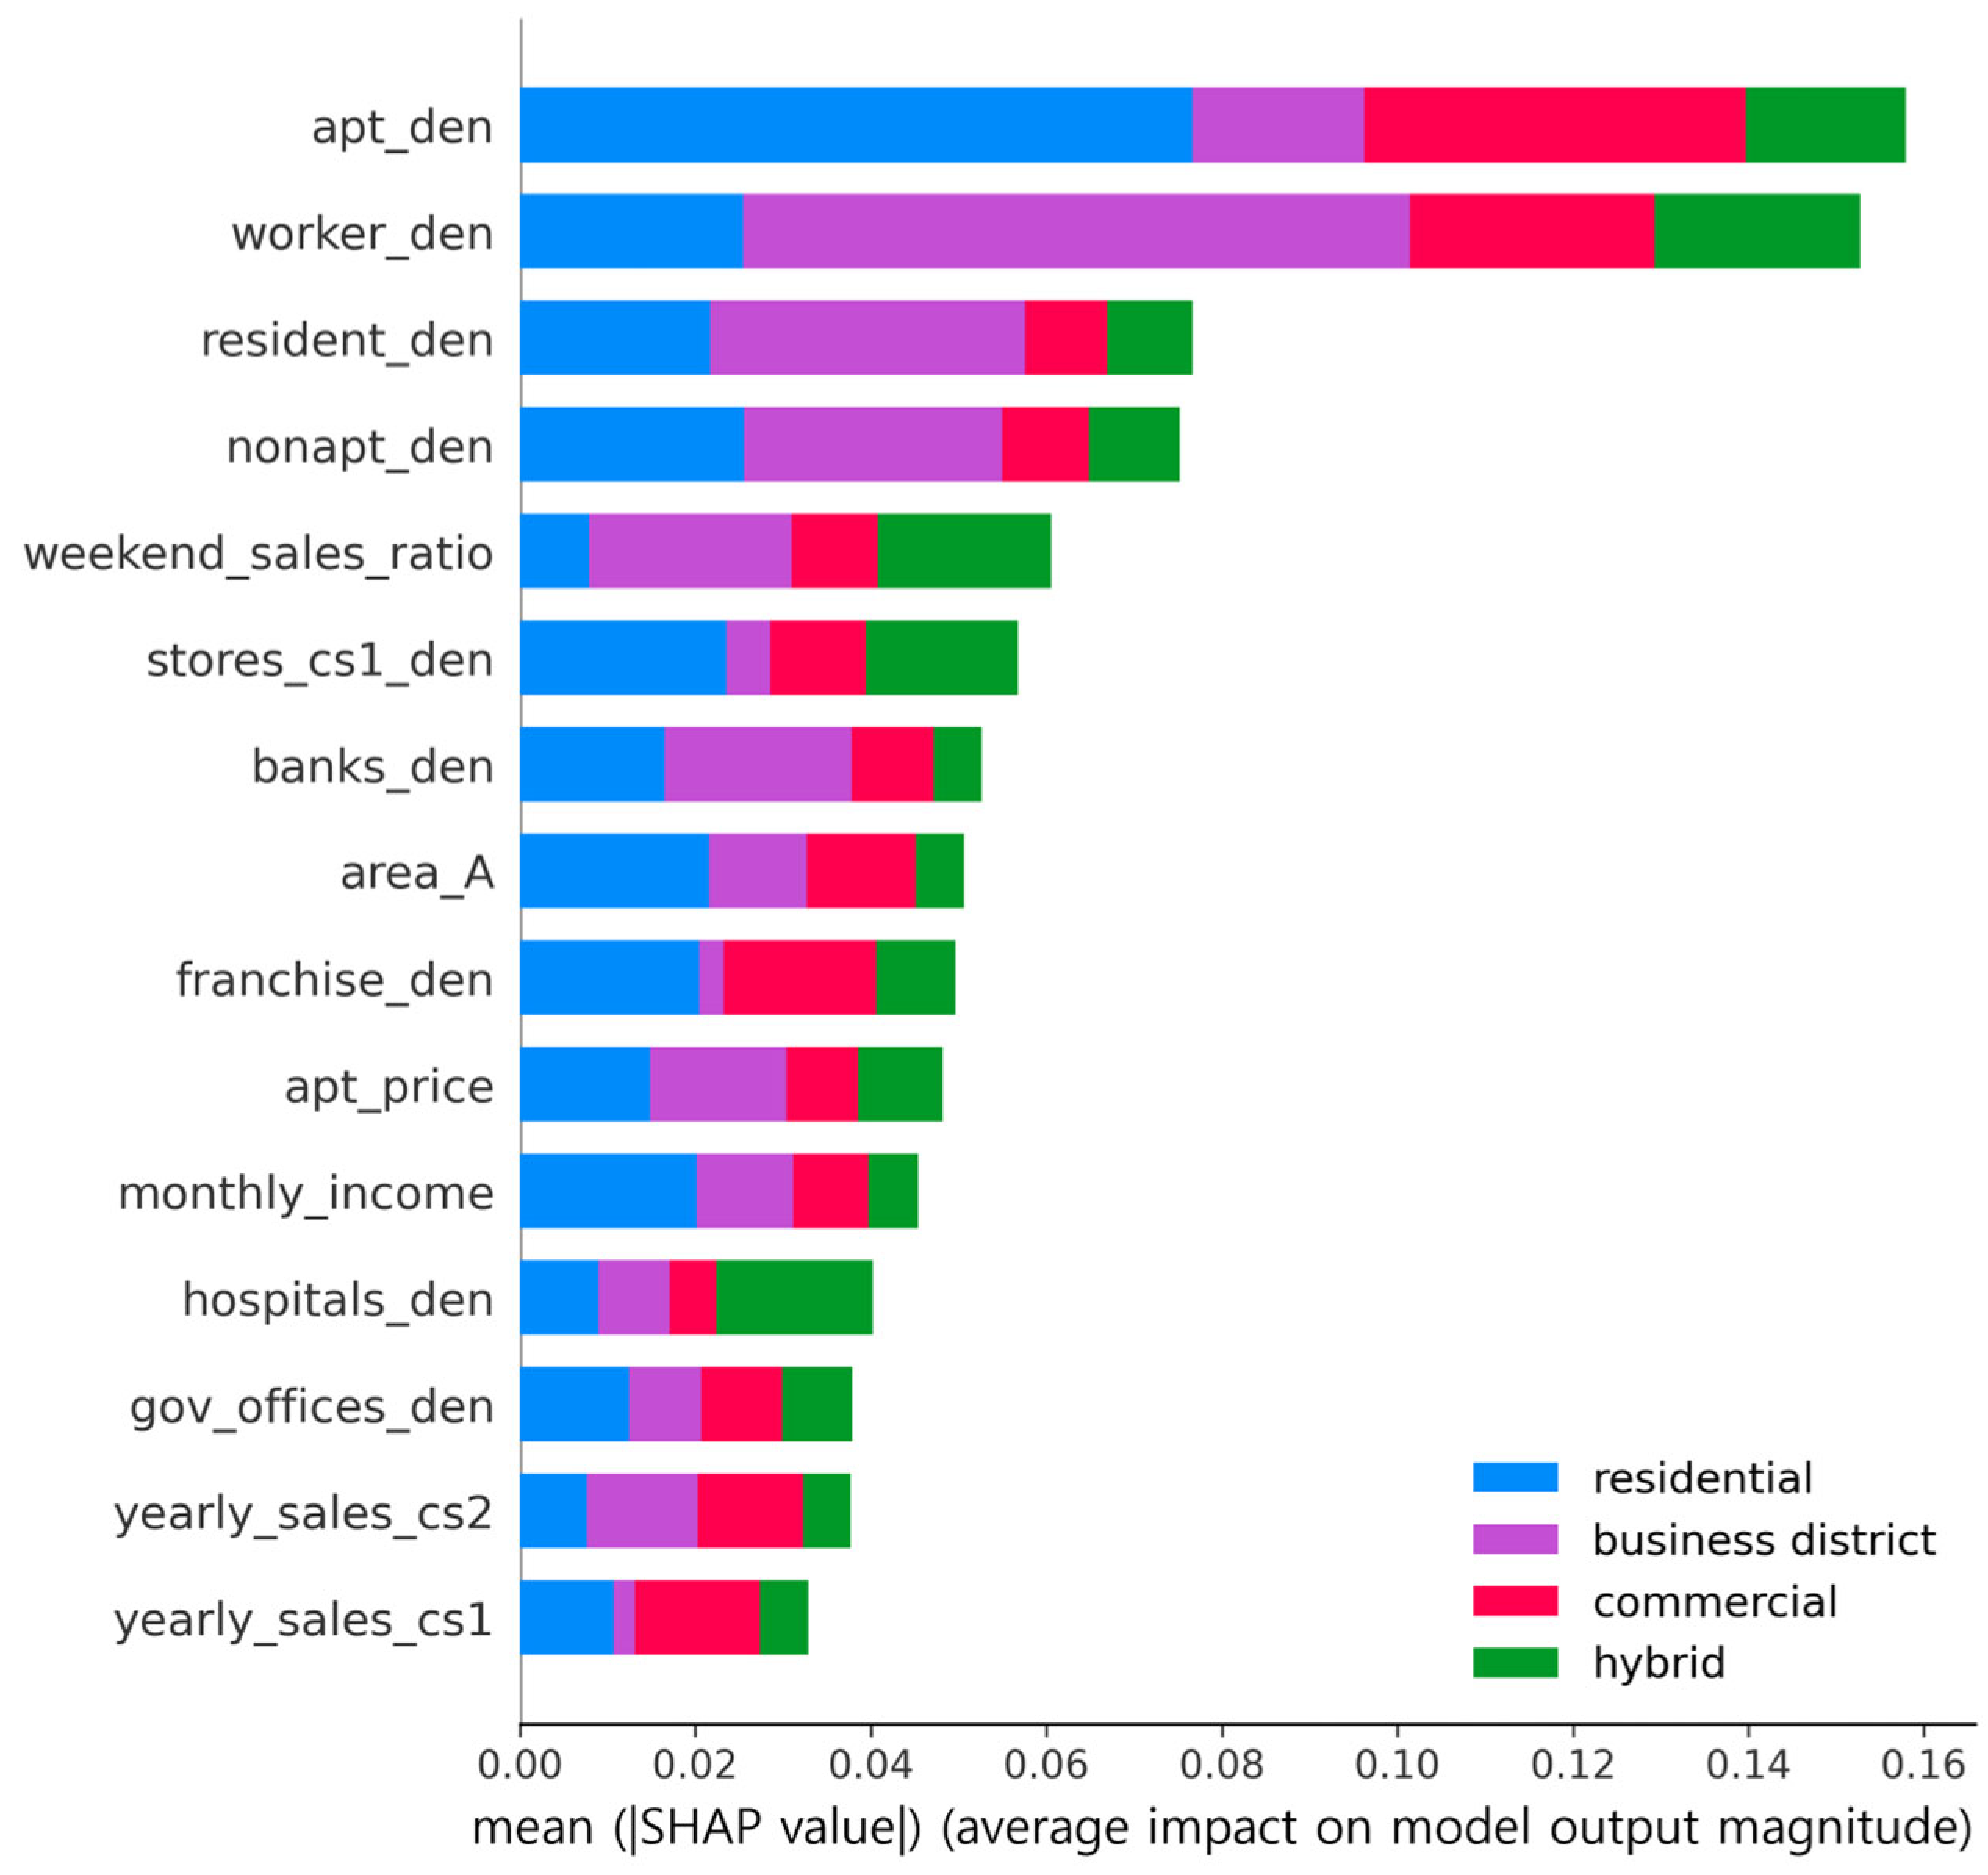
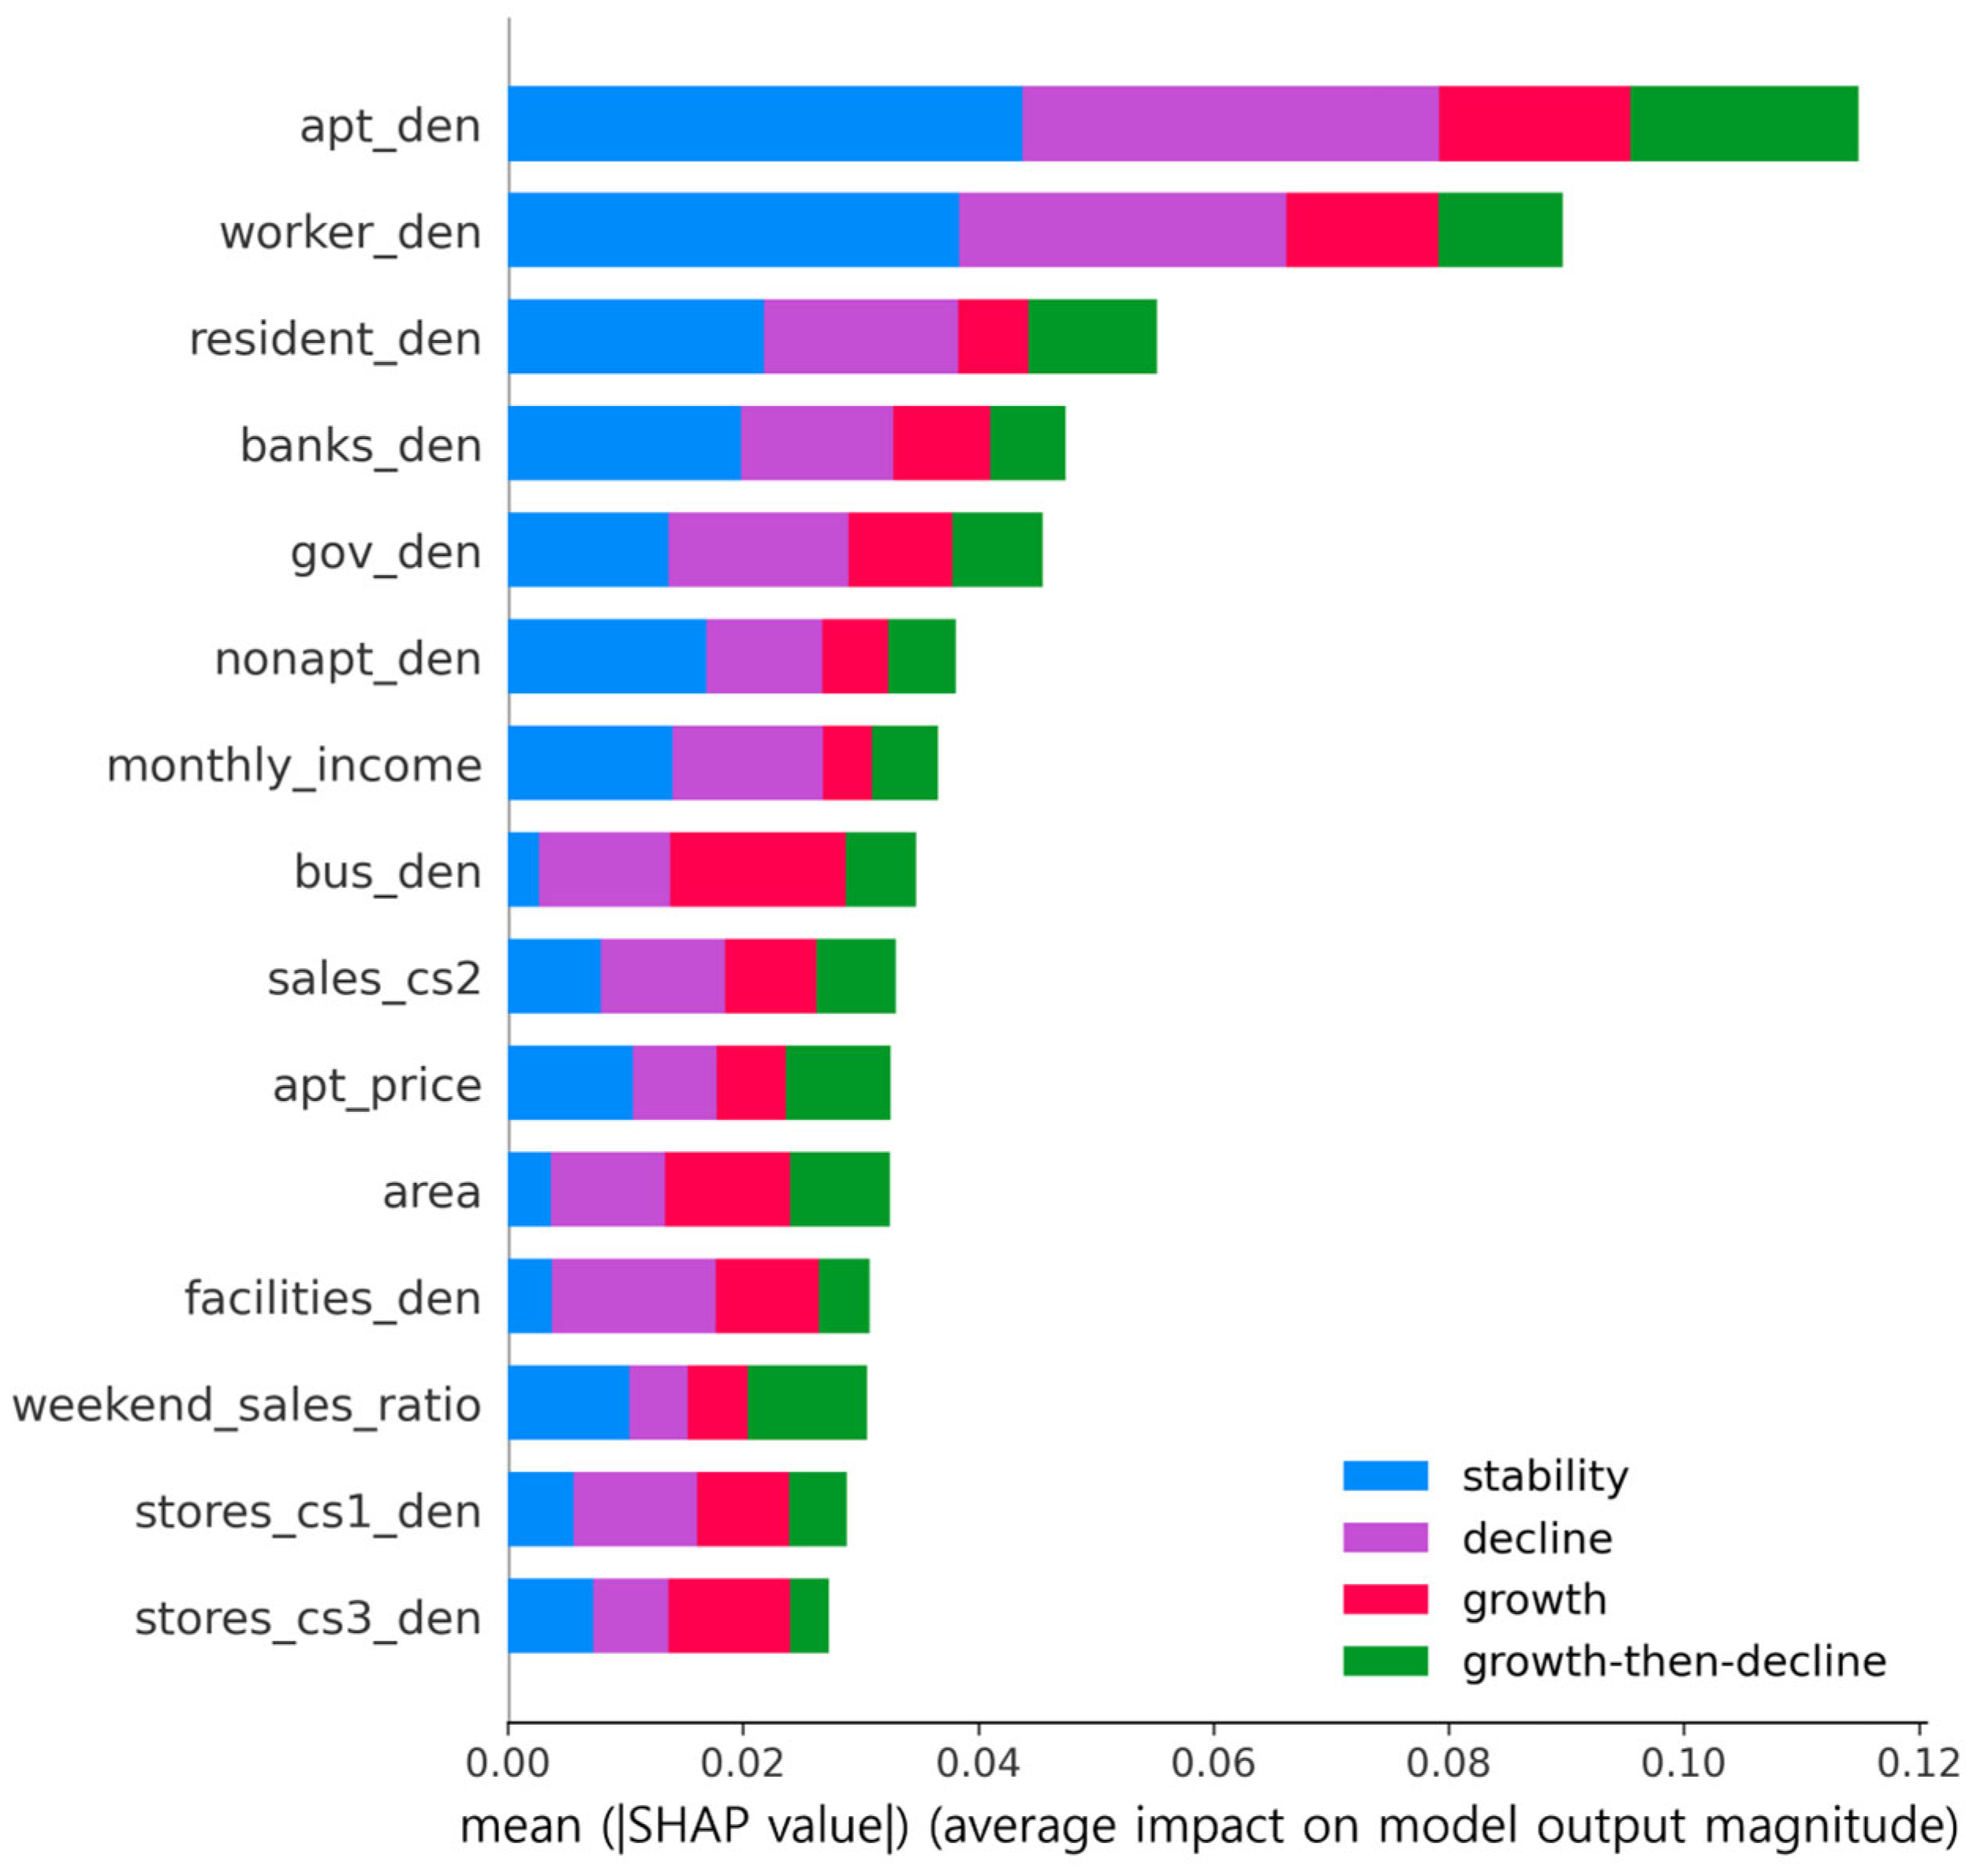
3.4. Random Forest Classifier
4. Discussion
4.1. Interpretation of the Typology and Spatial Context
4.2. Policy Implications
4.3. Limitations and Future Research
5. Conclusions
Author Contributions
Funding
Institutional Review Board Statement
Informed Consent Statement
Data Availability Statement
Conflicts of Interest
References
- Ryberg-Webster, S.R.; Kinahan, K. Historic preservation and urban revitalization in the twenty-first century. J. Plan. Lit. 2014, 29, 119–139. [Google Scholar] [CrossRef] [Scilit]
- Kickert, C.; Vom Hofe, R.; Haas, T.; Zhang, W.; Mahato, B. Spatial dynamics of long-term urban retail decline in three transatlantic cities. Cities 2020, 107, 102918. [Google Scholar] [CrossRef] [Scilit] [PubMed]
- Esposito De Vita, G.; Ragozino, S. Natural commercial centers: Regeneration opportunities and urban challenges. Adv. Eng. Forum 2014, 11, 392–401. [Google Scholar] [CrossRef] [Scilit]
- Ministry of SMEs and Startups. Framework Act on Micro Enterprises (Act No. 17623, 8 December 2020; Effective 9 March 2021). Available online: https://www.law.go.kr/LSW/lsInfoP.do?lsiSeq=223615 (accessed on 10 March 2026).
- Seoul Credit Guarantee Foundation. Strategic Plan and Support Measures for Revitalizing Seoul’s Commercial Districts (Basic Research Report No. 24-01); Seoul Credit Guarantee Foundation: Seoul, Republic of Korea, 2024. [Google Scholar]
- Seoul Credit Guarantee Foundation. Analysis of Small Business Support Policies and Policy Direction in Seoul (Small Enterprise Issue Report No. 24-04); Seoul Credit Guarantee Foundation: Seoul, Republic of Korea, 2024. [Google Scholar]
- Kim, H.; An, Y. Monitoring the dynamic change of Seoul’s side street trade areas using density and diversity of stores. Seoul Stud. 2019, 20, 149–170. [Google Scholar] [CrossRef]
- Kwon, D.; Jeon, J. The COVID-19 pandemic impact on the Seoul retail market: A spatial perspective. J. Korea Real Estate Anal. Assoc. 2022, 28, 25–44. [Google Scholar] [CrossRef] [Scilit]
- Kang, M.S.; Shin, W.-J. Comparative study on the survival rate of self-employed businesses by type and commercial area: Focused on Gwangju Metropolitan City. J. Apprais. Stud. 2024, 23, 101–128. [Google Scholar]
- Hong, H.; Ji, T. Typology Analysis of Seoul’s Golmok Commercial Districts Using the S-LOCAL Model (Issue Brief No. 2); Center for Small Business Insights, Seoul Credit Guarantee Foundation: Seoul, Republic of Korea, 2024. [Google Scholar]
- Hanson, S. The determinants of daily travel-activity patterns: Relative location and sociodemographic factors. Urban Geogr. 1982, 3, 179–202. [Google Scholar] [CrossRef] [Scilit]
- Guy, C.M. Classifications of retail stores and shopping centres: Some methodological issues. GeoJournal 1998, 45, 255–264. [Google Scholar] [CrossRef] [Scilit]
- Griswold, J.B.; Medury, A.; Schneider, R.J.; Grembek, O. Comparison of pedestrian count expansion methods: Land use groups versus empirical clusters. Transp. Res. Rec. 2018, 2672, 57–67. [Google Scholar] [CrossRef] [Scilit]
- Kim, H.; Lee, S. A study on the factors affecting the revenue in Seoul’s side street trade areas. Seoul Stud. 2019, 20, 117–134. [Google Scholar] [CrossRef]
- Buckwalter, D.W. Small area classification in urban geography: A review of multidimensional methods. Middle States Geogr. 2024, 56, 107–120. [Google Scholar]
- Berry, B.J.L.; Garrison, W.L. A note on central place theory and the range of a good. Econ. Geogr. 1958, 34, 304–311. [Google Scholar] [CrossRef] [Scilit]
- Yuan, N.J.; Zheng, Y.; Xie, X.; Wang, Y.; Zheng, K.; Xiong, H. Discovering urban functional zones using latent activity trajectories. IEEE Trans. Knowl. Data Eng. 2015, 27, 712–725. [Google Scholar] [CrossRef] [Scilit]
- Liu, X.; Tian, Y.; Zhang, X.; Wan, Z. Identification of urban functional regions in Chengdu based on taxi trajectory time series data. ISPRS Int. J. Geo-Inf. 2020, 9, 158. [Google Scholar] [CrossRef] [Scilit]
- Gao, S. Spatio-temporal analytics for exploring human mobility patterns and urban dynamics in the mobile age. Spat. Cogn. Comput. 2015, 15, 86–114. [Google Scholar] [CrossRef] [Scilit]
- Yue, Y.; Zhuang, Y.; Yeh, A.G.O.; Xie, J.Y.; Ma, C.L.; Li, Q.Q. Measurements of POI-based mixed use and their relationships with neighbourhood vibrancy. Int. J. Geogr. Inf. Sci. 2017, 31, 658–675. [Google Scholar] [CrossRef] [Scilit]
- Meltzer, R.; Capperis, S. Neighbourhood differences in retail turnover: Evidence from New York City. Urban Stud. 2017, 54, 3022–3057. [Google Scholar] [CrossRef] [Scilit]
- Statistics Korea. Gross Regional Domestic Product (GRDP) by Region (Based on 2020). Available online: https://www.index.go.kr/unity/potal/main/EachDtlPageDetail.do?idx_cd=1008 (accessed on 10 March 2026).
- Statistics Korea. Per Capita Gross Regional Domestic Product, Gross Regional Income, and Personal Income by Region (1985–2022). KOSIS. Available online: https://kosis.kr/statHtml/statHtml.do?orgId=101&tblId=DT_1C86 (accessed on 10 March 2026).
- Statistics Korea. Number of Establishments and Employees by Enterprise Size, Industrial Sector, and Region (2019–2022). Korean Statistical Information Service (KOSIS). Available online: https://kosis.kr/statHtml/statHtml.do?orgId=101&tblId=DT_3BD1006 (accessed on 10 March 2026).
- Moon, H.; Jang, C. Strategies for Supporting and Managing Seoul’s Commercial Districts in the Post-COVID-19 Era (Small Research Series No. 21-03); Seoul Institute: Seoul, Republic of Korea, 2021. [Google Scholar]
- Cho, H.; Do, H.; Seo, J.; Jin, J. Revitalizing Commercial Districts in the Post-COVID Era: Can Youth Provide the Answer? (Small Research Series No. 22-01); Seoul Institute: Seoul, Republic of Korea, 2022. [Google Scholar]
- Ministry of Government Legislation. Act on Coexistence and Revitalization of Local Trading Areas (Act No. 18357, 27 July 2021; Amended by Act No. 20365, 27 February 2024). Available online: https://www.law.go.kr/LSW/eng/engMain.do (accessed on 10 March 2026).
- Seoul Metropolitan Government Information Planning Officer; KT Big Data Business Support Group. Seoul De Facto Population Estimation Manual; Seoul Metropolitan Government: Seoul, Republic of Korea, 2018.
- Statistics Korea. Glossary of Statistical Terms—Output Area. SGIS Plus 2024. Available online: https://sgis.kostat.go.kr/view/board/expAndNoticeStatsWord (accessed on 10 March 2026).
- Statistics Korea. GIS Small-Area Statistics User Manual. Statistics Korea 2023. Available online: http://sgis.kostat.go.kr/ (accessed on 10 March 2026).
- Lee, D.; Choi, J.; Kim, S. Comparison of survival rate in food service industry between growing commercial districts and declining commercial districts of Seoul. Korea Spat. Plan. Rev. 2020, 105, 65–84. [Google Scholar] [CrossRef]
- Kim, M.; Lee, S. Categorizing alley commercial districts and analyzing the influencing factors of business openings and closings in Seoul, Korea: Using floating population big data and DTW time series clustering analysis. J. Korea Plan. Assoc. 2024, 59, 99–116. [Google Scholar] [CrossRef] [Scilit]
- Oh, S. Dynamic changes in side-street trade areas of Seoul: Using growth mixture modeling. Cities 2025, 158, 105666. [Google Scholar] [CrossRef] [Scilit]
- Chen, Y.; Liu, X.; Li, X.; Liu, X.; Yao, Y.; Hu, G.; Xu, X.; Pei, F. Delineating urban functional areas with building-level social media data: A dynamic time warping (DTW) distance based k-medoids method. Landsc. Urban Plan. 2017, 160, 48–60. [Google Scholar]
- Prener, C.G.; Revord, C.K. areal: An R package for areal weighted interpolation. J. Open Source Softw. 2019, 4, 1221. [Google Scholar] [CrossRef] [Scilit]
- Järv, O.; Tenkanen, H.; Toivonen, T. Enhancing spatial accuracy of mobile phone data using multi-temporal dasymetric interpolation. Int. J. Geogr. Inf. Sci. 2017, 31, 1630–1651. [Google Scholar] [CrossRef] [Scilit]
- Aghabozorgi, S.; Shirkhorshidi, A.S.; Wah, T.Y. Time-series clustering—A decade review. Inf. Syst. 2015, 53, 16–38. [Google Scholar] [CrossRef] [Scilit]
- Petitjean, F.; Ketterlin, A.; Gançarski, P. A global averaging method for dynamic time warping, with applications to clustering. Pattern Recognit. 2011, 44, 678–693. [Google Scholar] [CrossRef] [Scilit]
- Zhao, J.; Itti, L. shapeDTW: Shape Dynamic Time Warping. Pattern Recognit. 2018, 74, 171–184. [Google Scholar] [CrossRef] [Scilit]
- Berndt, D.J.; Clifford, J. Using Dynamic Time Warping to Find Patterns in Time Series. In Proceedings of the KDD-94 AAAI Workshop on Knowledge Discovery in Databases, Seattle, WA, USA, 31 July–1 August 1994; pp. 359–370. [Google Scholar]
- Javed, A.; Lee, B.S.; Rizzo, D.M. A benchmark study on time series clustering. Mach. Learn. Appl. 2020, 1, 100001. [Google Scholar] [CrossRef] [Scilit]
- Rakthanmanon, T.; Campana, B.J.L.; Mueen, A.; Batista, G.E.A.P.A.; Westover, M.B.; Zhu, Q.; Zakaria, J.; Keogh, E. Searching and mining trillions of time series subsequences under dynamic time warping. In Proceedings of the 18th ACM SIGKDD International Conference on Knowledge Discovery and Data Mining, Beijing, China, 12–16 August 2012; pp. 262–270. [Google Scholar] [CrossRef] [Scilit]
- Ding, H.; Trajcevski, G.; Scheuermann, P.; Wang, X.; Keogh, E. Querying and mining of time series data: Experimental comparison of representations and distance measures. Proc. VLDB Endow. 2008, 1, 1542–1552. [Google Scholar] [CrossRef] [Scilit]
- Aledavood, T.; Kivimäki, I.; Lehmann, S.; Saramäki, J. A non-negative matrix factorization based method for quantifying rhythms of activity and sleep and chronotypes using mobile phone data. arXiv 2020, arXiv:2009.09914. [Google Scholar] [CrossRef] [Scilit]
- Paparrizos, J.; Gravano, L. Fast and accurate time-series clustering. ACM Trans. Database Syst. 2017, 42, 8. [Google Scholar] [CrossRef] [Scilit]
- Thorndike, R.L. Who belongs in the family? Psychometrika 1953, 18, 267–276. [Google Scholar] [CrossRef] [Scilit]
- Rousseeuw, P.J. Silhouettes: A graphical aid to the interpretation and validation of cluster analysis. J. Comput. Appl. Math. 1987, 20, 53–65. [Google Scholar] [CrossRef] [Scilit]
- Kilani, B.H. K-means clustering algorithms in urban studies: A review of unsupervised machine learning techniques. OSF Prepr. 2023. [Google Scholar] [CrossRef] [Scilit]
- Barrena-Herrán, M.; Modrego-Monforte, I.; Grijalba, O. Revealing spatiotemporal urban activity patterns: A machine learning study using Google Popular Times. ISPRS Int. J. Geo-Inf. 2025, 14, 221. [Google Scholar] [CrossRef] [Scilit]
- Kang, H.M.; Lee, S.K. An analysis of the effects of customer characteristics on sales of alley market area using geographically weighted regression. J. Korean Soc. Surv. Geod. Photogramm. Cartogr. 2018, 36, 611–620. [Google Scholar] [CrossRef]
- Yu, H.J. A study on COVID-19 and effects factors concerning the sales of side-street trade areas in Seoul. J. Korean Reg. Dev. Assoc. 2021, 33, 45–75. [Google Scholar] [CrossRef]
- Kang, C.-D. Effect of neighborhood income and consumption on retail viability: Evidence from Seoul, Korea. Habitat Int. 2019, 94, 102060. [Google Scholar] [CrossRef] [Scilit]
- Sung, H. Estimating the spatial impact of neighboring physical environments on retail sales. Cities 2022, 123, 103579. [Google Scholar] [CrossRef] [Scilit]
- Guo, T.; Lu, Z.; Wang, F. Multi-Modal Social Media Analysis via SHAP-Based Explanation: A Framework for Public Art Perception. IEEE Access 2025, 13, 68753–68772. [Google Scholar] [CrossRef] [Scilit]
- Li, D.; Han, H.; Wang, J.; Xiao, X. Explaining Urban Vitality Through Interpretable Machine Learning: A Big Data Approach Using Street View Images and Environmental Factors. Sustainability 2025, 17, 4926. [Google Scholar] [CrossRef] [Scilit]
- Xie, Y.; Zhang, J.; Li, Y.; Zhu, Z.; Deng, J.; Li, Z. Integrating Multi-Source Urban Data with Interpretable Machine Learning for Uncovering the Multidimensional Drivers of Urban Vitality. Land 2024, 13, 2028. [Google Scholar] [CrossRef] [Scilit]
- Lu, Z.; Wang, W.; Guo, T.; Li, Y.; Wang, F. Decoding urban policies: NLP-driven concise explanations. Environ. Plan. B Urban Anal. City Sci. 2025, 53, 23998083251321981. [Google Scholar] [CrossRef] [Scilit]
- Kandt, J.; Batty, M. Smart cities, big data and urban policy: Towards urban analytics for the long run. Cities 2021, 109, 102992. [Google Scholar] [CrossRef] [Scilit]
- Wang, Z.; Ren, F. Developing a decision support system for sustainable urban planning using machine learning-based scenario modeling. Sci. Rep. 2025, 15, 13210. [Google Scholar] [CrossRef] [Scilit]
- Lowe, M.; Wrigley, N. Retail and the urban. Urban Geogr. 2000, 21, 640–653. [Google Scholar] [CrossRef] [Scilit]
- Parker, C.; Ntounis, N.; Millington, S.; Quin, S.; Castillo-Villar, F.R. Improving the vitality and viability of the UK high street by 2020: Identifying priorities and a framework for action. J. Place Manag. Dev. 2017, 10, 310–348. [Google Scholar] [CrossRef] [Scilit]
- Ozuduru, B.H.; Guldmann, J.-M. Retail location and urban resilience: Towards a new framework for retail policy. SAPIENS 2013, 6, 1–13. [Google Scholar]
- Kim, M.; Park, E.; Lee, S. Analyzing the effect of Yonsei-ro transit mall policy on commercial revitalization in Seoul, Korea: Using the synthetic control method. J. Korea Plan. Assoc. 2024, 59, 42–56. [Google Scholar] [CrossRef] [Scilit]
- Im, B.; Kang, S. Effects of urban regeneration projects on store survival rate in neighborhood commercial areas: The case of South Korea. J. Asian Archit. Build. Eng. 2024, 24, 3264–3280. [Google Scholar] [CrossRef] [Scilit]





| Attribute | Description |
|---|---|
| Data source | SMG/KTOA-based de facto population data |
| Data unit | Estimated population count |
| Spatial unit | Census Output area (Jipgyegu) |
| Temporal unit | Hourly estimates |
| Coverage | Physically present population by age and gender, including residents and non-residents |
| Study period | November 2019 to 2024 |
| Dimension | Variables |
|---|---|
| Sales structure | Retail density by category, Franchise density, Annual sales by category, Average spending, Weekend sales ratio |
| Socio-economic status | Resident density, Apartment household density, Non-apartment household density, Average monthly income, Average housing price |
| Attraction facilities | Government office density, Bank density, General hospital density, University dummy, Theater dummy, * Visitor-attracting facility density |
| Employment structure | Worker density |
| Accessibility | Subway station density, Bus stop density |
| Model | Method | Accuracy | Macro-F1 | Balanced Accuracy |
|---|---|---|---|---|
| short-term | Out-of-Bag | 0.553 | 0.558 | 0.557 |
| short-term | Out-of-Fold | 0.559 | 0.468 | 0.478 |
| long-term | Out-of-Bag | 0.463 | 0.286 | 0.304 |
| long-term | Out-of-Fold | 0.432 | 0.343 | 0.361 |
| LTTS A | LTTS B | LTTS C | LTTS D | Sum | |
|---|---|---|---|---|---|
| STTS A | 12 (1.3%) | 72 (6.6%) | 49 (4.5%) | 34 (3.1%) | 169 (15.5%) |
| STTS B | 39 (3.6%) | 227 (20.8%) | 138 (12.7%) | 125 (11.5%) | 529 (48.5%) |
| STTS C | 33 (3%) | 106 (9.7%) | 56 (5.1%) | 37 (3.4%) | 232 (21.3%) |
| STTS D | 97 (8.9%) | 24 (2.2%) | 31 (2.8%) | 8 (0.7%) | 160 (14.7%) |
| sum | 183 (16.8%) | 429 (39.4%) | 274 (25.1%) | 204 (18.7%) | 1090 (100%) |
| Precision | Recall | F1-Score | Support | |
|---|---|---|---|---|
| STTS A (hybrid) | 0.360 | 0.160 | 0.210 | 163 |
| STTS B (residential) | 0.686 | 0.747 | 0.715 | 491 |
| STTS C (commercial) | 0.388 | 0.401 | 0.395 | 217 |
| STTS D (business district) | 0.511 | 0.603 | 0.553 | 151 |
| 1022 * |
| Precision | Recall | F1-Score | Support | |
|---|---|---|---|---|
| LTTS A (stability) | 0.345 | 0.380 | 0.362 | 150 |
| LTTS B (decline) | 0.508 | 0.721 | 0.596 | 420 |
| LTTS C (growth) | 0.328 | 0.267 | 0.295 | 243 |
| LTTS D (growth-then-decline) | 0.254 | 0.077 | 0.118 | 209 |
| 1022 * |
Disclaimer/Publisher’s Note: The statements, opinions and data contained in all publications are solely those of the individual author(s) and contributor(s) and not of MDPI and/or the editor(s). MDPI and/or the editor(s) disclaim responsibility for any injury to people or property resulting from any ideas, methods, instructions or products referred to in the content. |
© 2026 by the authors. Licensee MDPI, Basel, Switzerland. This article is an open access article distributed under the terms and conditions of the Creative Commons Attribution (CC BY) license.
Share and Cite
Yim, B.; Lee, J.; Park, M. A Two-Timescale Typology of Neighborhood-Scale Commercial Districts in Seoul: Evidence from Mobile Phone De Facto Population Data. Sustainability 2026, 18, 4326. https://doi.org/10.3390/su18094326
Yim B, Lee J, Park M. A Two-Timescale Typology of Neighborhood-Scale Commercial Districts in Seoul: Evidence from Mobile Phone De Facto Population Data. Sustainability. 2026; 18(9):4326. https://doi.org/10.3390/su18094326
Chicago/Turabian StyleYim, Beomgu, Jaekyung Lee, and Minkyu Park. 2026. "A Two-Timescale Typology of Neighborhood-Scale Commercial Districts in Seoul: Evidence from Mobile Phone De Facto Population Data" Sustainability 18, no. 9: 4326. https://doi.org/10.3390/su18094326
APA StyleYim, B., Lee, J., & Park, M. (2026). A Two-Timescale Typology of Neighborhood-Scale Commercial Districts in Seoul: Evidence from Mobile Phone De Facto Population Data. Sustainability, 18(9), 4326. https://doi.org/10.3390/su18094326