Article

A Two-Timescale Typology of Neighborhood-Scale Commercial Districts in Seoul: Evidence from Mobile Phone De Facto Population Data


Department of Urban Planning, Hongik University, Seoul 04066, Republic of Korea
*
Author to whom correspondence should be addressed.
Sustainability 2026, 18(9), 4326; https://doi.org/10.3390/su18094326
Submission received: 25 March 2026 / Revised: 21 April 2026 / Accepted: 21 April 2026 / Published: 27 April 2026

Abstract

In Seoul, neighborhood-scale commercial districts, known as Golmok commercial districts, are small-scale retail areas focused on local daily life but also play a significant role in the city’s economy. Existing classification strategies for supporting Seoul’s Golmok commercial districts primarily rely on static, administrative data, failing to sufficiently capture actual citizen usage patterns. This deficiency limits the effectiveness of revitalization efforts. This study employs a two-timescale analysis of de facto population data to build a more dynamic typology of Seoul’s Golmok commercial districts. An unsupervised machine learning approach, specifically time-series K-means clustering, was applied to both weekly (short-term) and multi-year (long-term) time series data. This enabled us to classify 1090 districts into 16 distinct types. This more granular typology reveals significant heterogeneity masked by the Seoul Metropolitan Government’s current system, which groups these districts into only four broad categories. Our results show that while a minority of districts maintain stable activity, many exhibit patterns of long-term decline or significant fluctuation, underscoring the diverse and dynamic nature of these areas. The short-term analysis also captures temporal variations in population activity. The proposed typology may offer a foundation for near real-time monitoring and more proactive policy interventions to support urban economic sustainability.

1. Introduction

The decline of commercial districts is increasingly recognized as an issue that goes beyond economic concerns and threatens the sustainability of cities. The stagnation of commercial districts is associated with weakening social networks, an increasing burden of infrastructure maintenance, and deepening spatial isolation, which in turn have a negative impact on the vitality and sustainability of cities [1]. Research in North American cities shows that long-term retail vacancy contributes to physical deterioration and the weakening of city-center functions [2]. Studies in European cities further suggest that the decline of traditional commercial areas can also erode urban identity and contribute to broader urban decline [3]. Together, these studies indicate that commercial district decline is not merely an economic issue, but a phenomenon that threatens the long-term viability and sustainability of cities.
Seoul, South Korea, is now facing the decline of its commercial districts. To manage the decline of commercial districts and support their economic sustainability, the Seoul Metropolitan Government (SMG) utilizes a classification system based on static census data under national legal frameworks. This system allows the city to manage the distinct economic characteristics of various commercial areas using evidence-based approaches [4,5,6]. Among the categories within this system, this study focuses specifically on Golmok commercial districts, which serve as essential hubs for local daily life and community-based commerce [7,8]. However, some studies evaluating these policies have concluded that existing support policies and classification systems are not yielding the desired results in revitalizing Seoul’s diverse commercial areas because they do not adequately reflect the distinct characteristics and needs of individual commercial districts [4,9,10].
Few studies have pointed out that existing commercial district classifications neglect the actual usage patterns of citizens, which in turn weakens policy effectiveness for revitalization [6,11,12,13,14]. For instance, Hanson [11] critiqued the limitations of administrative districts or fixed classification systems, underscoring the theoretical necessity of classifications that genuinely reflect actual patterns of human activity. Similarly, Guy [12] emphasized that a single criterion for commercial district classification may be inappropriate, given the complex features of commercial facilities, such as goods sold, trip purpose, store size, physical form, and evolving consumer behavior. Empirically supporting these studies, Griswold et al. [13] demonstrated that classifications based on land use and pedestrian activity data can provide a more precise alternative for designing commercial district policies through comparative analysis. However, further complicating this issue, studies by Buckwalter [15] and Berry & Garrison [16] revealed that various commercial functions are often segmented and appear heterogeneously even within the same broad category. Collectively, these studies highlight the critical need for more dynamic and user-centric approaches to commercial district classification [17,18,19,20].
Recent literature addressing the limitations of traditional market commercial district classifications has increasingly focused on reclassifying Seoul’s commercial districts using time-based data, such as pedestrian flow or sales patterns. This emerging body of work applies various analysis techniques, including time series clustering, Dynamic Time Warping (DTW), and Growth Mixture Model (GMM), to commercial district classification [13,14,21]. However, a critical limitation of these studies is their reliance on analyzing only a single time window. This approach overlooks the complex interplay of both high-frequency (hourly, daily, weekly) and low-frequency (seasonal, annual, multi-year) temporal factors that shape commercial district characteristics. For instance, when commercial activities or consumer usage patterns are analyzed solely through intraday patterns, they fail to capture features influenced by multi-year business cycles. Conversely, analyses limited to monthly or quarterly data cannot reveal how citizens’ usage of commercial districts shift throughout the day, nor the distinct characteristics revealed by different commercial district types accordingly. Furthermore, focusing exclusively on annual panel data neglects the variability of commercial activities across seasons or specific times of day. Thus, multiple time windows should be integrated into the classification of commercial districts.
This study aims to overcome the limitations of previous studies by using detailed mobile phone data to classify Golmok commercial districts and to propose a new commercial district typology. By analyzing the average weekly pedestrian flow pattern and its long-term trend over several years, we aim to derive functionally different commercial district types, and the results show that different commercial district activities coexist even within the same administrative district. This empirically supports the validity of our classification system based on two-timescale activity patterns in pedestrian flow. Additionally, we intend to interpret the spatial distribution of commercial district types through GIS-based visualization in relation to urban policies. We expect that our classification system can then serve as an empirically backed spatial policy tool for micro-level commercial district management and the sustainable development of customized resource policies.
This study contributes to the literature in two ways. First, the two-timescale approach extends previous studies that relied on a single temporal window by capturing both short-term usage patterns and long-term trajectories of change, thereby reflecting the temporal complexity of commercial districts. Second, unlike static indicators, de facto population data can reflect the actual usage patterns and provide a more user-centered perspective on neighborhood-scale commercial districts. These contributions strengthen our understanding of the temporal complexity of neighborhood-scale commercial districts and of the actual patterns of human activity within them.

2. Data and Method

2.1. Seoul’s Commercial District Classification and Support Policies

Seoul, the capital of South Korea, has a population of approximately 9.33 million, while the broader metropolitan area, which includes Incheon and Gyeonggi Province, is home to over 26 million people. The nominal Gross Domestic Product (GDP) of Seoul was approximately $438 billion in 2023, while that of the entire metropolitan area was approximately $926.79 billion [22]. The city’s GDP per capita for the same year was $44,600 [23]. Furthermore, data from 2022 highlight the significant role of small businesses in Seoul’s economy. Of the 1.671 million registered businesses in the city, approximately 1.567 million (93.78%) were classified as small businesses [24]. In this context, a small business is defined as an enterprise with fewer than five or ten regular employees, depending on the industry.
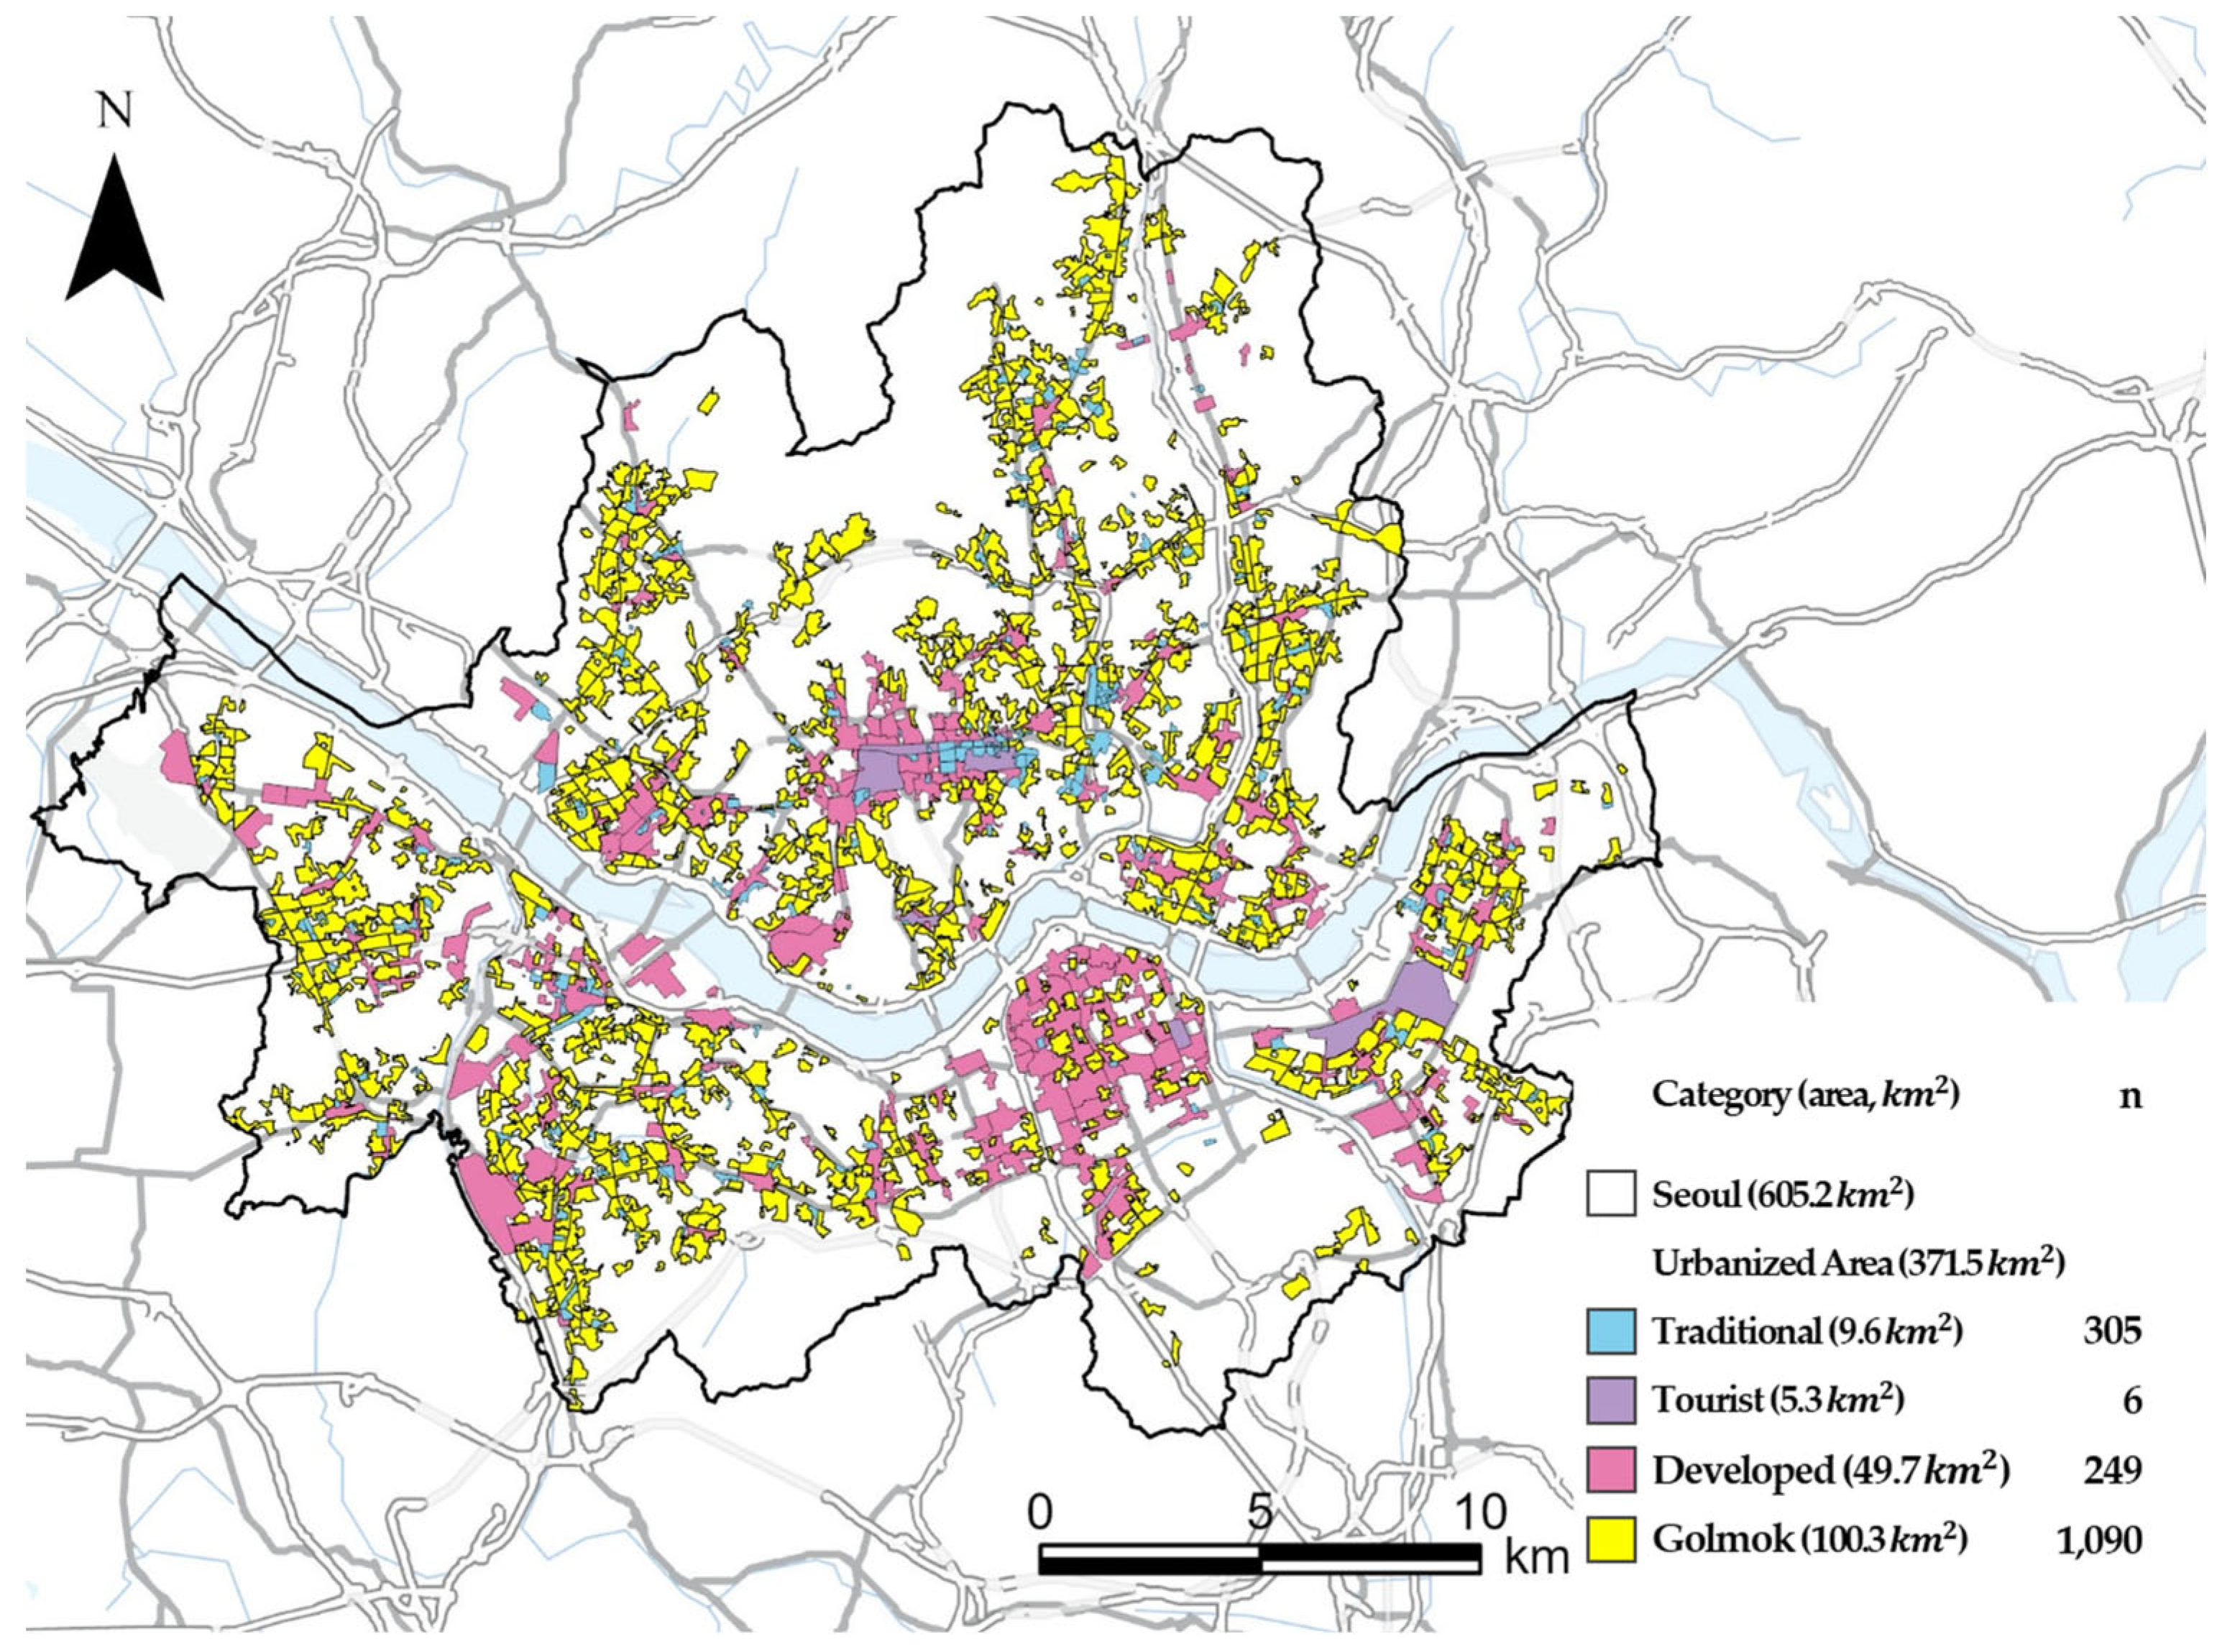
Commercial districts in Seoul are broadly classified into four categories: Traditional market commercial districts, Tourist special zone commercial districts, Developed commercial districts, and Golmok commercial districts. Traditional market commercial districts are long-established market-based commercial areas, while tourist special zone commercial districts are commercial areas located within designated tourism-oriented zones. Developed commercial districts refer to highly concentrated commercial areas with strong retail and business functions. Golmok commercial districts are neighborhood-scale commercial areas that enable local commerce, daily consumption, and exchanges between local residents. From a spatial perspective, these districts are naturally formed areas, predominantly located within low-density residential neighborhoods and mixed land-use zones [25].
Figure 1 shows the distribution of these four categories and the location of Golmok commercial districts within Seoul’s broader commercial context.
Scheme Golmok commercial districts hold a distinct economic role and status compared to core commercial zones characterized by large capital inflows. Primarily operated by small business owners and the self-employed, these districts serve as hubs for daily consumption, deeply integrated into the fabric of community life. They function as more than just spaces for selling goods and services; they play a crucial part in local job creation and in fostering the circulation of capital [25]. The unique characteristics of each Golmok commercial district provide a diversity not found in large franchise businesses [14], thereby enhancing the city’s cultural appeal and often serving as focal points for local communities. In terms of economic scale, their total sales in 2021 amounted to approximately KRW 36 trillion, representing 7.7% of the Seoul metropolitan area’s total Gross Regional Domestic Product of approximately KRW 470 trillion [25,26]. As of 2019, they comprised 159,576 (30.9%) of the 515,808 micro enterprises which employ fewer than five or ten workers. The number of micro enterprises in these districts had increased to 170,075, expanding their share in Seoul’s commercial areas [5,8].
Seoul’s policy effort to revitalize commercial districts began in 2004 with the enactment of the Special Act on the Development of Traditional Markets and Shopping Districts (2005), which marked the first attempt at a support system for unit-based commercial areas [5]. Subsequently, in 2015, the city scientifically classified over 1008 Golmok commercial districts through its ‘Our Village Store Commercial Area Analysis’ service (a public open-data platform providing micro-level retail information), and launched direct support projects for these districts starting in 2016. This effort to enhance precision continued; in 2018, the city redefined the Golmok commercial districts into 1010 areas to facilitate its independent management. Subsequently, by 2020, this number was expanded to 1090 through the advancement of a data-based algorithm (Figure 1). This algorithm more accurately delineated the boundaries by analyzing data points such as business locations and a 200 m radius for the residential and travel zones of potential visitors. The legal framework was also progressively established with the enactment of legislation such as the Framework Act on Micro Enterprises (2021) and the Enforcement Decree of the Act on Coexistence and Revitalization of Local Trading Areas (2021) [4,27]. These efforts culminated in 2022 with the appointment of a public official dedicated to commercial revitalization and the development of a proprietary classification and evaluation model, ‘S-LOCAL’. Through this model, SMG now diagnoses all Golmok commercial districts by type and delivers customized support tailored to their unique characteristics. This approach also helps foster distinctive local brands.

2.2. De Facto Population Data

This study utilized de facto population data for classifying Seoul’s Golmok commercial districts. These data, based on the LTE data usage location of cellular phone users, are provided by Korea Telecom Corporation, South Korea’s second-largest telecommunication carrier, and organized by the Korea Telecommunications Operators Association (KTOA), an association of telecommunications companies in South Korea that often collaborates with government bodies on policy discussions and provides data. It is not raw mobile-phone trace data, but an aggregated and estimated hourly population measure.
According to the Seoul de facto population estimation manual [28], the published de facto population values are not simple sums of mobile phone logs but are produced through a series of correction and estimation procedures. First, KT users are identified at the mobile phone base-station level at each point in time. Next, the total de facto popula-tion is estimated by sequentially applying adjustment factors to the observed KT user counts, including KT market share, LTE subscription rates, phone-on rates (the percentage of mobile phones that are actually turned on and connected to the network at any given time), and sex–age adjustment coefficients. This phone-on rate specifically adjusts for cas-es in which actual users are not fully captured due to powered-off phones, device mal-functions, or communication errors. The de facto population estimated at the base-station is redistributed to census output areas (spatially similar to US Census Block Groups, Ji-pgyegu in Korean), using a multiple regression model based on indicators such as regis-tered resident population, worker population, and total building floor area. This model is applied separately by day of the week and hour of the day. Finally, for specific age groups with low LTE subscription rates, an additional estimation procedure is applied. For ex-ample, the de facto population under age 10 is estimated by calculating the ratio of the de facto population aged 10–14 to the registered resident population aged 10–14 and then applying that ratio to the registered resident population under age 10. The population aged 80 and above is adjusted in a similar manner. Therefore, the de facto population data used in this study were derived through official estimation procedures developed by the Seoul Metropolitan Government in collaboration with KT.
De facto population data incorporate information on users’ age, gender, and the number of people physically present in a specific area per hour, including residents and commuters (Table 1). SMG now provides this data at the scale of census output areas. An output area is the smallest statistical aggregation unit defined by the National Statistical Office of South Korea. More than just a simple subdivision of administrative districts, it is a designed geographical unit that aims to simultaneously ensure statistical reliability and protect individual privacy.
Output areas are constructed by aggregating basic unit areas (lot-level polygons) according to several key criteria. Population size in an output area is optimized to around 500 residents, with a flexible range of 300 to 1000 individuals. This range is chosen because it prevents the exposure of personal information at overly granular levels and ensures the reliability of statistical measures [29]. In forming output areas, socioeconomic homogeneity is achieved primarily by considering housing type and land price. Buildings are categorized by types, such as detached houses, apartments, and non-residential structures, and an analysis of housing types within basic unit areas ensures that regions with similar residential characteristics are grouped into a single output area [30]. Furthermore, the average land price of basic unit areas, calculated from individual parcel values, is used to ensure that areas with comparable land values are included within the same output area, thereby securing socioeconomic consistency [30].
SMG continuously collects and publicly provides this data on an hourly basis. Therefore, de facto population data can illustrate changes in population over time within a specific commercial district. This allows us to observe the population present in a commercial district at different times of the day and identify which days of the week experience population concentration. Furthermore, because SMG has accumulated these data since 2017, they can be used for long-term time-series analysis. However, data collection was temporarily suspended from October 15th to 29th in 2019 by the SMG. To ensure continuous time series data analysis, we excluded data from 2017 to October 2019 and analyzed the data from November 2019 to 2024. As output areas contain observations of de facto population by time of day, our data set comprised a total of 867,860,736 such time-specific observations throughout the entire study period. Due to privacy concerns and restricted access, raw individual-level mobile phone trace data are generally unavailable for academic research. Thus, this study uses aggregated de facto population data, which, although unable to capture individual trajectories directly, are suitable for examining temporal population patterns. Previous studies that have attempted to classify commercial districts have primarily utilized indicators such as business closure rates, changes in the number of businesses, and shifts in business composition [7,17,31,32,33]. However, these data sources cannot directly reflect people’s daily usage patterns of commercial districts or fluctuations in the number of users on a weekly or monthly basis. In contrast, Chen et al. argued that real-time population data was crucial to classify urban areas by function, highlighting the advantages of employing such dynamic population data [17,34]. Given these limitations of traditional indicators and the demonstrated benefits of dynamic population data, our study leverages de facto population data to provide a more nuanced understanding of commercial district characteristics and usage patterns.

2.3. Areal Weighted Interpolation

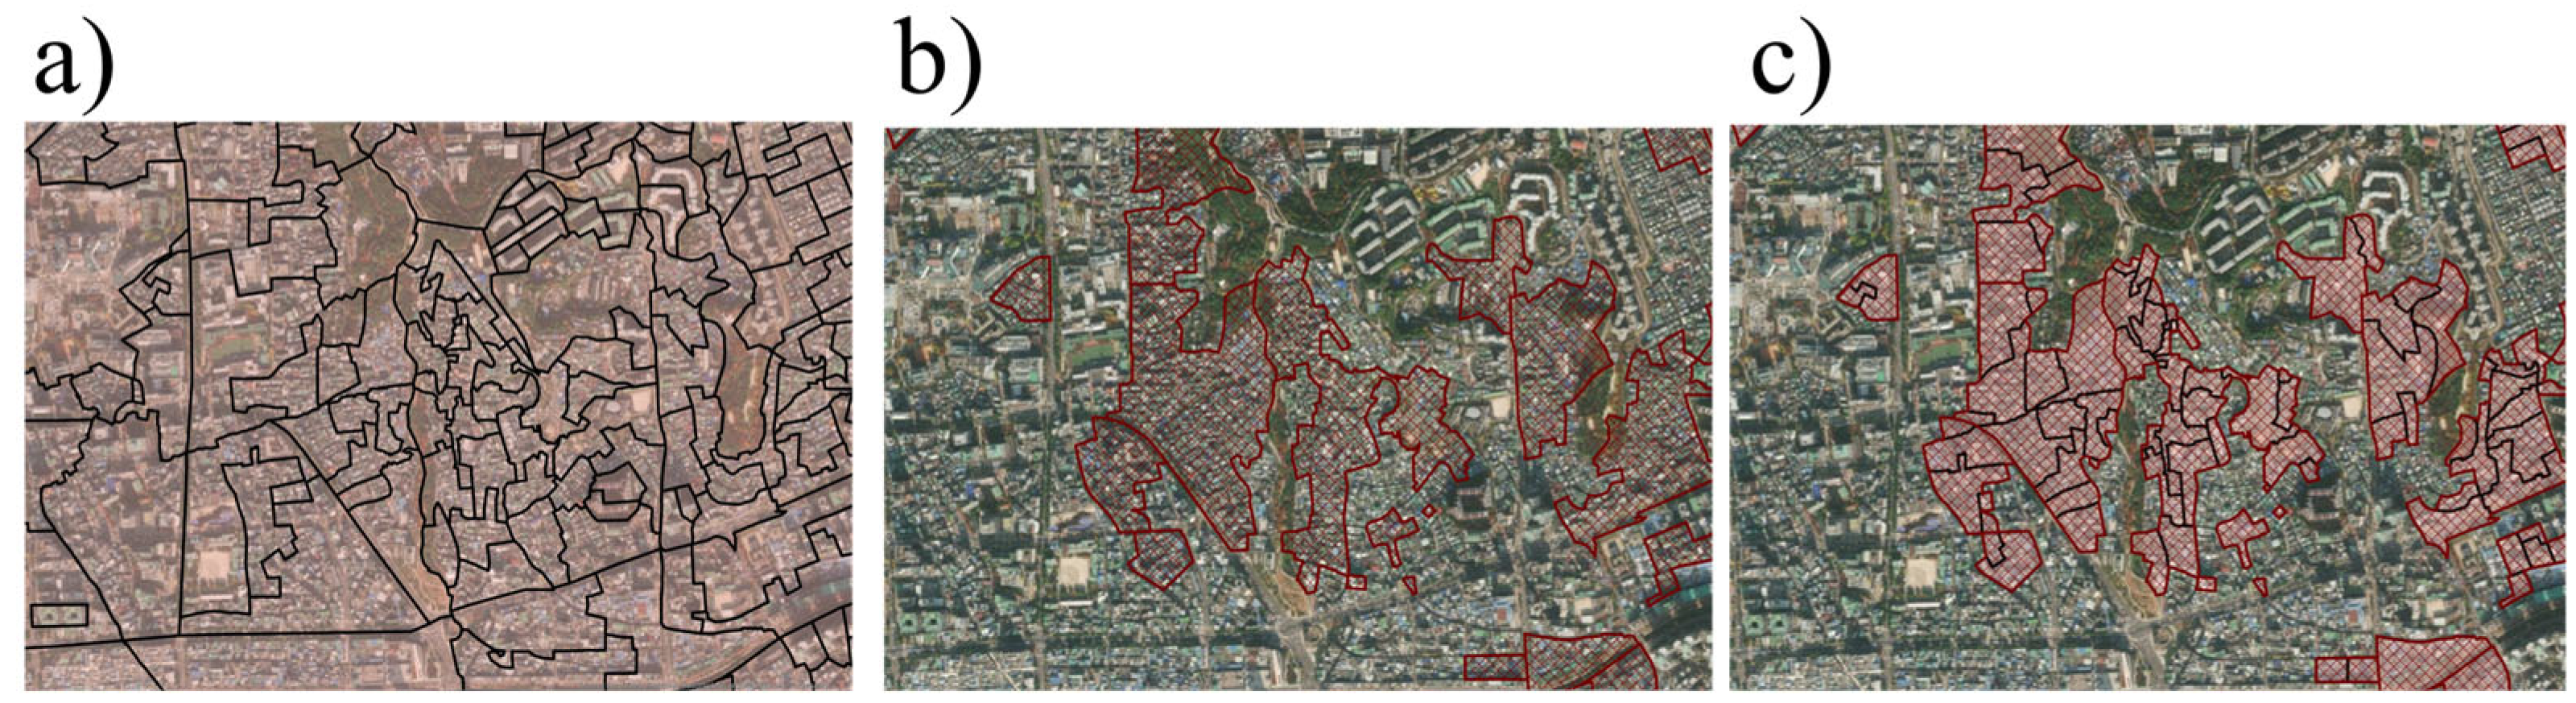
However, the boundaries of output areas do not align with those of Golmok commercial districts (Figure 2a,b). Therefore, we employed Areal Weighted Interpolation (AWI), a statistical method designed to redistribute data between different spatial units. Let w i j denote the overlap ratio between output area i and commercial district j , defined as follows:
w i j = A i j A i
The de facto population of commercial district j at time t was then estimated as:
P j t = i w i j P i t
where A i j is the intersected area between output area i and commercial district j , A i is the total area of output area i , and P i t is the de facto population of output area i at time t . Using the Python (3.11) and its libraries GeoPandas (version 0.10.2) and Shapely (version 1.8.0), we calculated the overlap area between the boundaries of all Golmok commercial districts and all output areas across Seoul. Subsequently, following the AWI procedure suggested by the study of Prener & Revord, we redistributed the time-based population values of each output area by weighting them according to the area ratio included within the corresponding commercial district [35]. These weighted values were then summed within commercial district boundaries to construct the final time series data for each district (Figure 2c). In conducting AWI, we adhered to five key guidelines proposed by Prener & Revord [35]: (1) maintaining coordinate system and object class consistency, (2) applying an area-based planar projection, (3) verifying spatial completeness, (4) preserving input values, and (5) preventing variable loss.
By adopting the ‘sum’ strategy among AWI’s calculation methods, values were distributed proportionally to each overlapping area when the same output area overlaps with multiple commercial districts. This approach enables accurate data reconstruction without information loss [35,36].

2.4. Time-Series K-Means Clustering of De Facto Population Across Two-Timescale

We analyzed the de facto population time series, distinguishing between short-term and long-term patterns. Instead of forcing a single algorithm to disentangle overlapping temporal noise, this structural decoupling isolates high-frequency weekly behaviors from low-frequency multi-year trends. To capture the short-term usage behaviors of commercial districts, we analyzed the hourly average de facto population. For the long-term growth and decline, we examined the trend of the daily average de facto population. Both analyses covered the period from 1 November 2019 to 31 December 2024. We employed the Time series K-means clustering, a prominent unsupervised machine learning algorithm, to classify these time series. In the field of time series clustering, methods based on K-shape or Dynamic Time Warping (DTW) are generally considered more advanced [37].
The shifting method in K-shape captures morphological similarity by horizontally translating the entire series, whereas the warping method in DTW assesses similarity by non-linearly stretching or compressing segments, thereby enabling the recognition of similar activity patterns despite varying speeds or durations [38,39,40,41,42,43]. Thus, these clustering approaches facilitate the classification of time series data into homogeneous categories based on their morphological profiles, accommodating minor variations in peak timing, duration, or rates of change [41,42,43]. Specifically, notwithstanding temporal misalignments in peak values, sequences of data can be identified as the same underlying pattern provided their overall trajectories are congruent [40,44]. Given these advantages, K-Shape and DTW are employed as robust, flexible frameworks for analyzing shape-based similarity in temporal datasets [42,43].
However, such flexibility may not align with the objectives of this study. In this context, the precise timing of population concentration inherently holds critical information for interpreting the usage patterns of commercial districts. For instance, one Golmok commercial district frequented primarily by local residents might experience peak foot traffic on Sunday evenings. In contrast, another commercial district catering largely to nearby office workers may see a surge in visitors on weekday evenings. While both districts exhibit similar overall trajectories with evening peaks, they actually attract distinctly different consumer groups depending on the day of the week. Because K-Shape and DTW are prone to clustering these functionally distinct districts into the same category, they may be inappropriate for commercial district classification in our research.
Furthermore, pinpointing the exact timeframes of visitor fluctuations is crucial for understanding the long-term growth and decline of these commercial districts. Specifically, when classifying districts based on their trajectories of growth and decline, it is essential to identify precisely when these transitional phases begin and end. For example, one district might have experienced a decline immediately following the COVID-19 outbreak in 2020. Conversely, due to differences in its business composition, another district might have sustained its growth during the early stages of the pandemic before eventually declining at a later point. However, employing clustering methods like K-Shape or DTW, which permit temporal shifting or warping, could result in districts with entirely different timelines of decline being grouped together simply because their overall shapes are similar. Because the exact timing of visitor fluctuations serves as vital information for interpreting long-term commercial dynamics, this study necessitates a clustering approach that strictly preserves the temporal accuracy of such variations within longitudinal time series data.
Therefore, this study selected the time-series K-means algorithm, which preserves the original temporal structure without such distortions. This approach is advantageous for interpreting the temporal patterns of commercial districts because it directly compares the similarity between time series at identical time points [41,45]. Before clustering, each time series was standardized using row-wise z-score normalization so that the analysis focused on relative temporal patterns rather than absolute differences in population size. It also improves interpretability, because each cluster centroid can be read directly as a representative temporal profile of commercial activity [41,45].
This algorithm (K-means) partitions data into a predefined number of clusters (K) based on similarity. Our objective was to independently group commercial districts into four types based on their short-term patterns (K = 4) and another four types based on their long-term trends (K = 4). Consequently, every district was characterized by a combination of two types: one for its short-term behavior and one for its long-term trajectory. The analytical procedure was as follows: First, each district’s time series data was assigned to one of k clusters. Following the assignment, a centroid, the average of all time series within a cluster, was calculated for each group. This centroid represents the average usage pattern of the cluster and was used as the basis for identifying and labeling the unique patterns of each type of commercial district.
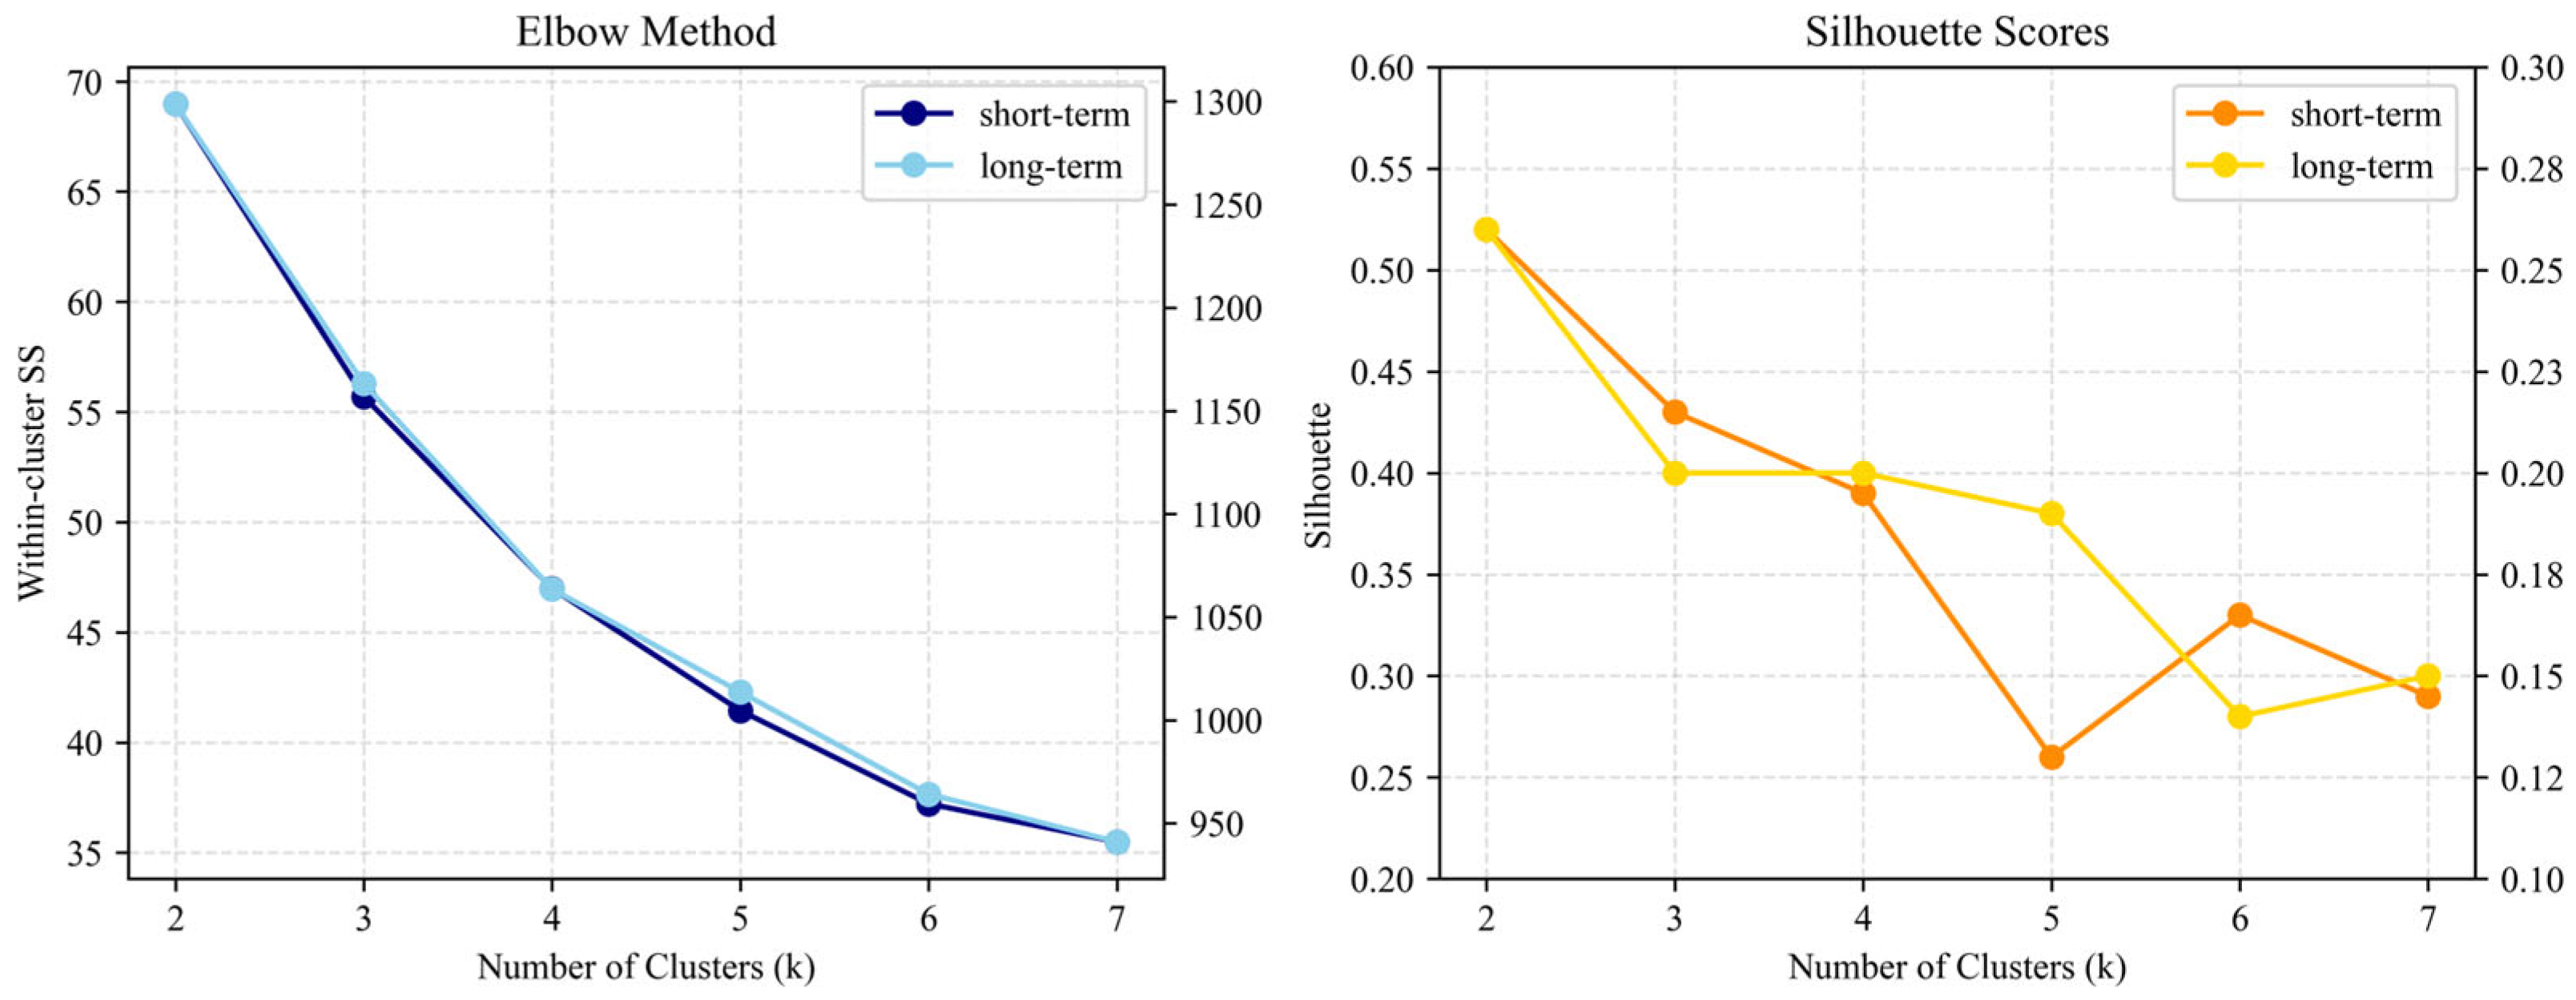
The optimal number of clusters (K) for the K-means algorithm was determined by balancing statistical metrics with theoretical interpretability. We first applied two widely adopted statistical techniques (Figure 3): the Elbow Method [46] and the Silhouette Score [47]. The Elbow Method, which analyzes the decrease in the Within-Cluster Sum of Squares (WSS), did not yield a distinct ‘elbow’ point for either the short-term or long-term time series data. Consequently, we considered K = 3 and K = 4, points where the decrease in WSS notably slowed, as initial candidates and proceeded to calculate their Silhouette Scores. We then calculated the Silhouette Score, a metric assessing cluster cohesion and separation. For the short-term data, the score was highest at K = 2 (0.52), decreasing progressively to 0.43 (K = 3), 0.39 (K = 4), and 0.26 (K = 5). For the long-term data, the score also peaked at K = 2 (0.27), followed by 0.20 (K = 3 and K = 4) and 0.19 (K = 5). While these statistical results pointed to K = 2 as the optimal choice, we argue that such a selection would produce classifications of limited practical value for urban policy. A two-cluster solution would likely reduce complex activity patterns to simple binaries, such as daytime/nighttime or growth/decline, thereby overlooking more nuanced temporal dynamics critical to understanding commercial districts [17,32]. Considering the study’s goal of generating actionable insights for policy, we prioritized the interpretability of the cluster solution. Consequently, we selected K = 4. This choice was informed by both prior research that highlights the importance of interpretability in urban typology [48] and the empirical realities of urban life. A four-cluster solution was well-suited to capture distinct, well-documented phases of daily urban activity, such as morning and evening commutes, midday commercial peaks, and nighttime activities, and aligns with temporal structures commonly identified in previous studies [44,49]. This approach allows for a more granular and realistic typology of commercial districts, moving beyond statistical optima to achieve greater explanatory power.
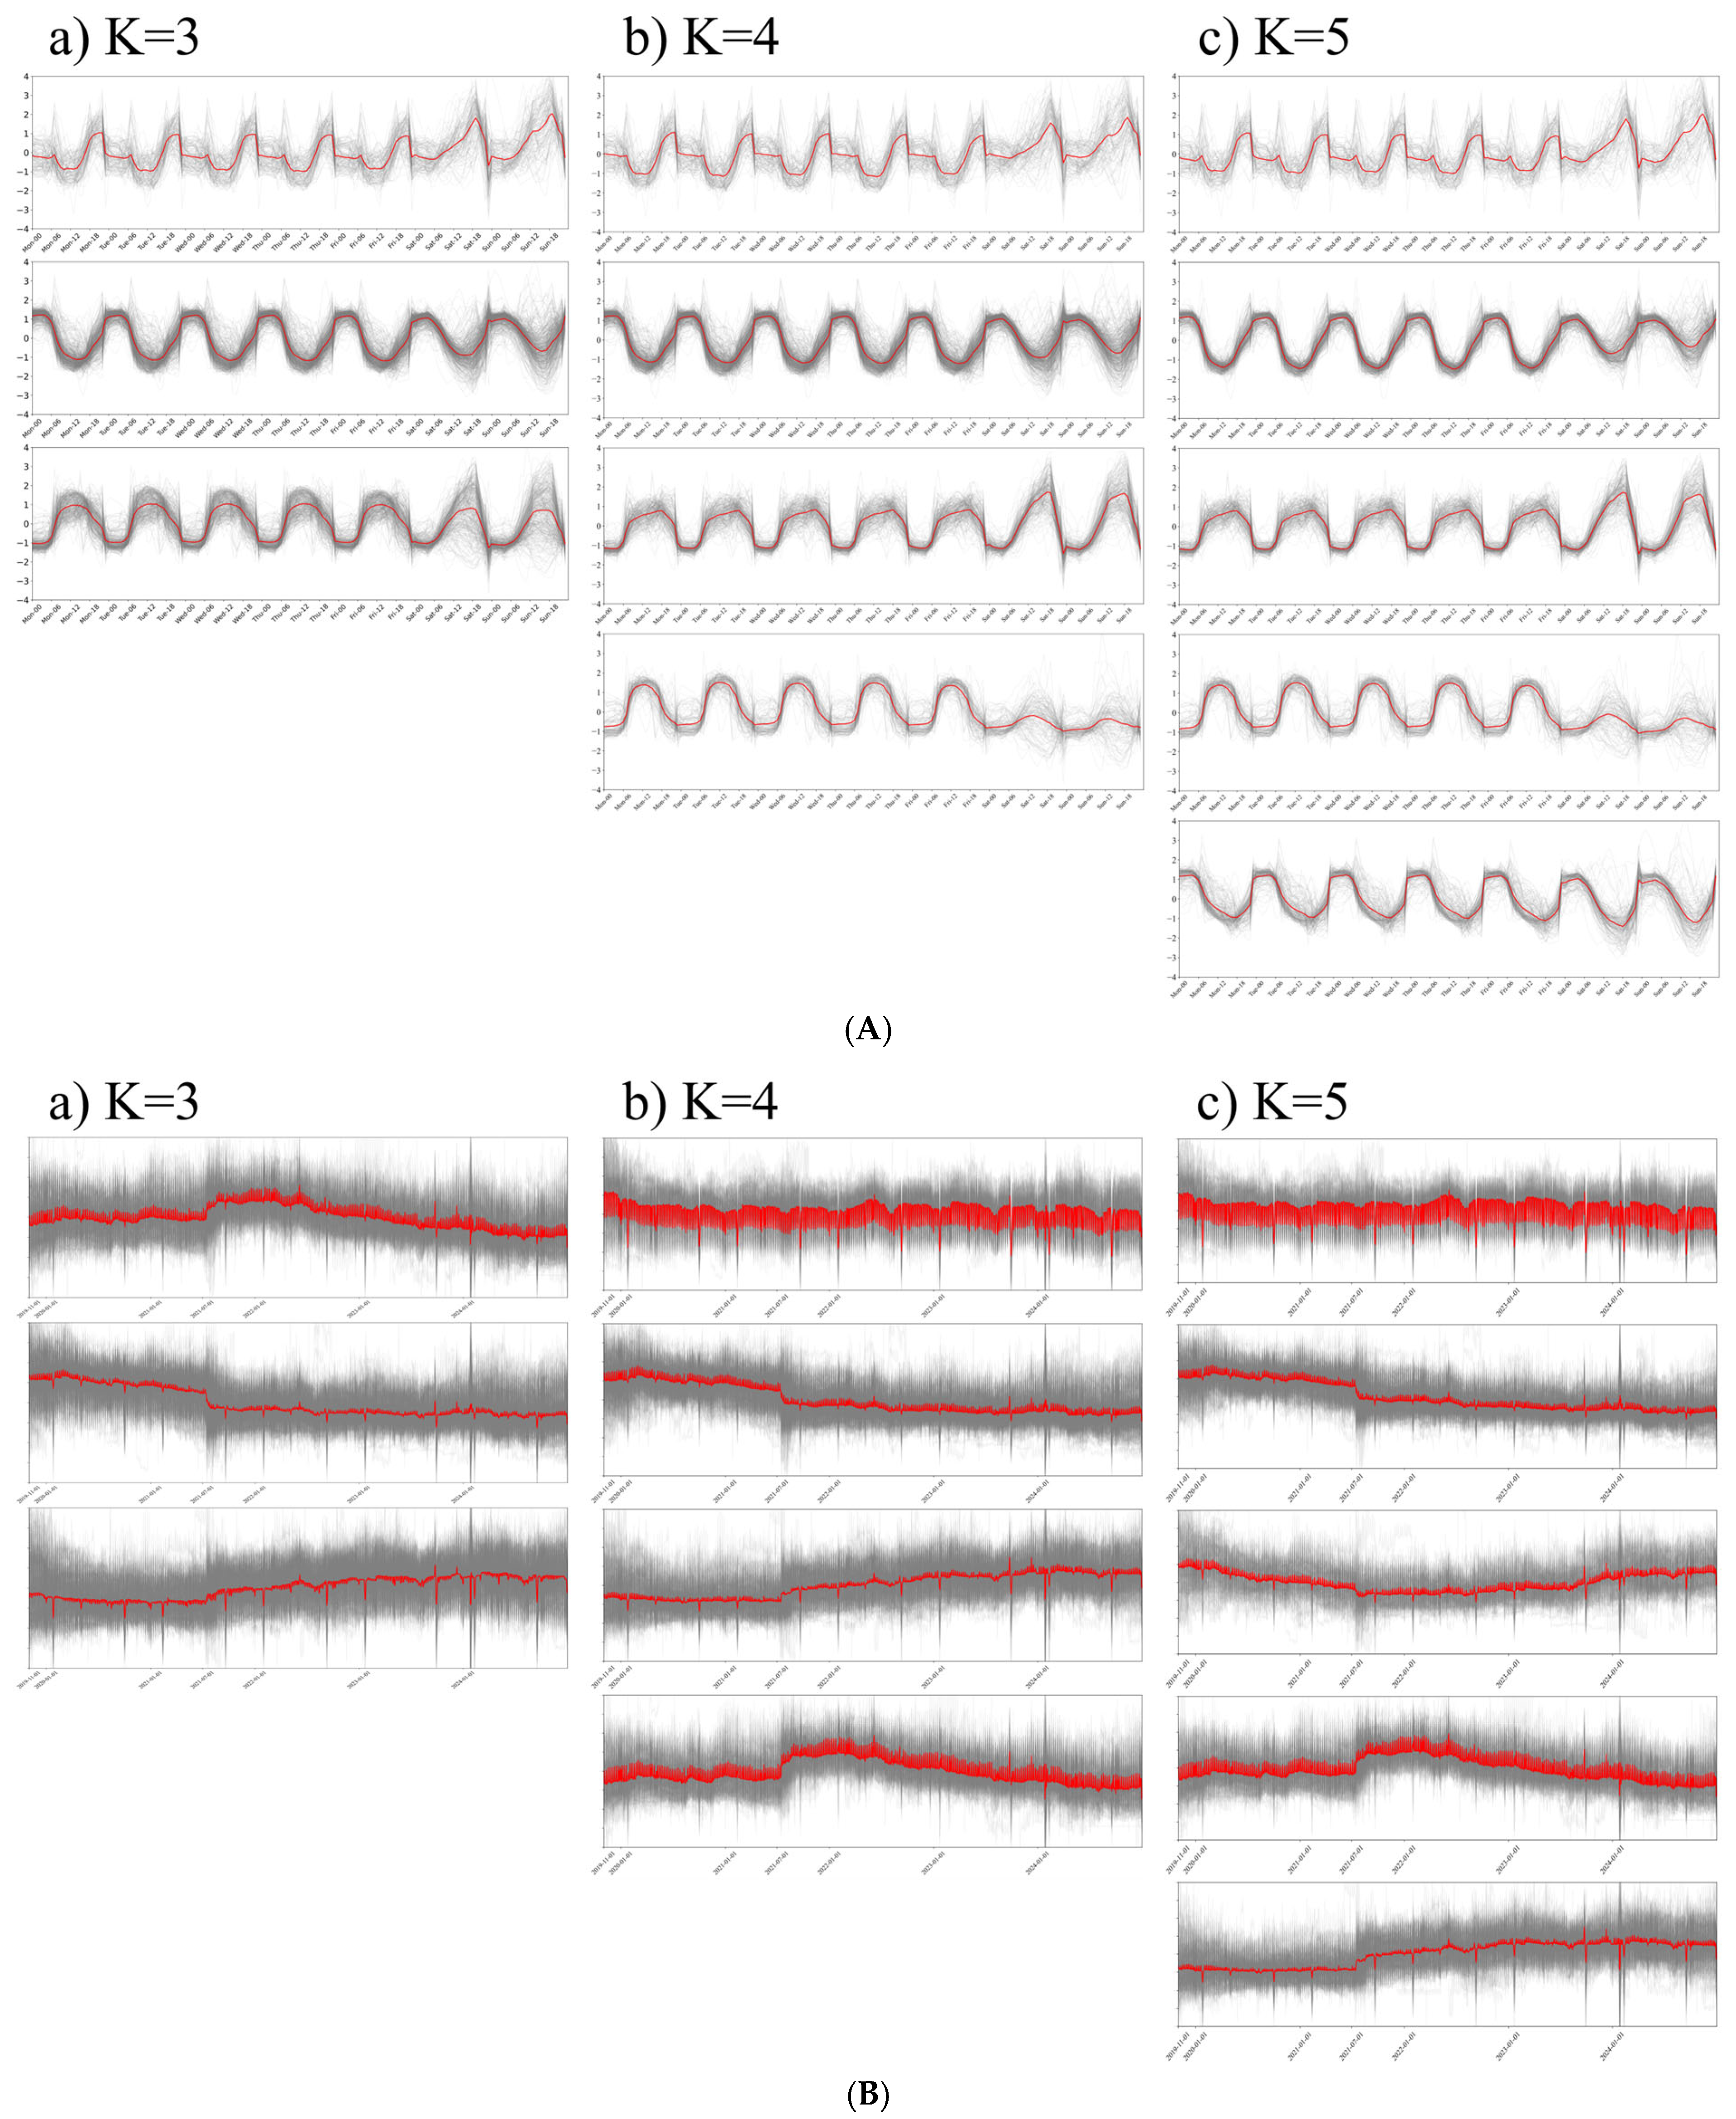
In addition to these statistical metrics, we compared the clustering results for K = 3, 4, and 5 based on the interpretability of the short- and long-term time-series patterns (Figure 4). For the short-term clustering results based on weekly patterns, when K was set to 3, the distinctions between clusters were unclear, resulting in ambiguous interpretations because the third cluster in the K = 3 solution was divided into the third and fourth clusters in the K = 4 solution. Conversely, with K = 5, the second cluster in the K = 4 solution was divided into the second and fifth clusters; however, these two clusters exhibited very similar profiles, making it difficult to distinguish them in a practically meaningful way and rendering the classification inefficient for policy application. In contrast, K = 4 provided a clear distinction among four clusters, which allowed for a more coherent and policy-relevant interpretation of the temporal usage patterns of commercial districts. Therefore, K = 4 was determined to be the most appropriate number of clusters, considering its balance of statistical adequacy and high interpretability.
In Figure 4, the long-term clustering results exhibited a similar dynamic to those of the short-term patterns, although some differences were observed. When K was set to 3, the distinctions between clusters were reasonably clear, and the solution was still interpretable. However, in the K = 4 solution, a new independent cluster emerged with a highly distinct pattern that was previously obscured. By contrast, when K = 5, the second cluster in the K = 4 solution was divided into the second and third clusters. However, these two clusters exhibited very similar trajectories, making it difficult to distinguish them in a practically meaningful way and rendering the classification inefficient for policy application. Overall, the K = 4 solution proved to be the optimal for long-term clustering because it successfully captured essential differences in developmental trajectories without introducing redundant divisions. Consequently, K = 4 was adopted as the most robust framework for interpreting how commercial districts evolve over time.

2.5. Random Forest Classifier for Complementary Assessment

External validation of time-series K-means clustering is challenging due to its nature as an unsupervised learning method. Unsupervised learning algorithms form clusters based on the data’s internal structure and similarity without predefined labels. Consequently, there is no external benchmark to directly verify whether the resulting clusters genuinely reflect socioeconomic factors. While de facto population time series data precisely captures daily activity patterns, it is difficult to ascertain the practical association with external factors such as sales structure, income, commercial facilities, employment, and transportation accessibility. Therefore, instead of conventional external validation, this study conducted a complementary evaluation of the cluster validity using external variables. We focused this analysis on data from 2024 for three reasons: (1) these data best reflect the most current socioeconomic structures; (2) they avoid inconsistencies caused by administrative boundary changes or variations in statistical items that can arise in long-term data; and (3) they provide information that was immediately applicable to policymaking at the time of analysis.
Random Forest classification was employed to compensate for the inability to directly validate the unsupervised learning results. In this study, the dependent variable was the cluster label derived from the Timeseries K-means clustering, while the independent variables were external variables reflecting the socioeconomic context of the commercial districts. These external variables were selected based on categories repeatedly identified in prior research as key factors explaining the vitality of commercial districts [14,50,51,52,53]. Specifically, they were grouped into five categories: sales structure, socioeconomic status, attraction facilities, employment structure, and accessibility (Table 2).
SHAP has been increasingly used as an interpretable machine-learning approach in complex urban-related analyses [54,55,56]. In this study, SHAP values were used to interpret the Random Forest results by showing how each external variable contributed to the classification of each cluster. Based on Shapley values from cooperative game theory, SHAP decomposes each prediction into the additive contributions of individual variables relative to a baseline prediction, thereby identifying which variables most strongly increase or decrease the likelihood that a commercial district would be assigned to a given cluster.
Among the 1090 Golmok commercial districts, 68 had missing values in the sales amount data used for complementary assessment. These cases were excluded only from the Random Forest validation analysis and did not affect the STTS and LTTS clustering itself, which was conducted using de facto population time-series data for all districts.
Random Forest is an ensemble technique that generates multiple decision trees through bootstrap sampling and random feature selection, deriving its final prediction based on a majority vote from these trees. We constructed a classification model by setting the cluster labels produced by Timeseries K-means Clustering as the dependent variable and using the external variables of the commercial districts as independent variables. The key hyperparameters were set as follows: n_estimators = 900, max_depth = None, min_samples_leaf = 4, class_weight = “balanced”, bootstrap = True, and random_state = 123. We did not impose a limit on max_depth to capture the data’s nonlinear structure, while min_samples_leaf was used to prevent overfitting.
During the model training process, we used the Out-of-Bag (OOB) performance metric and additionally calculated Out-of-Fold (OoF) predictions based on a GroupKFold (n = 5) strategy at the administrative-unit level. OOB internally estimates generalization performance using samples that were not included in the training process due to bootstrap sampling. In contrast, OoF evaluates performance by grouping commercial districts by a larger administrative unit (district-level administrative units, si-gun-gu in Korean) to prevent data leakage, performing cross-validation, and aggregating predictions obtained by using each fold as a validation set. For the short-term clusters, the OOB accuracy was 0.553 and the OOB macro-F1 was 0.558, while the OoF-based test set yielded a macro-F1 of 0.468 and a balanced accuracy of 0.478 (Table 3). The long-term pattern clusters showed relatively lower performance, with an OOB accuracy of 0.463, an OOB macro-F1 of 0.286, and a balanced accuracy of 0.304 (Table 3).
To complement these results, our study employed a confusion matrix and Shapley Additive Explanations (SHAP) analysis. The confusion matrix compares the distribution of actual versus predicted labels, revealing whether a specific cluster is distinctly identified by the external variables or is frequently confused with other clusters, indicating lower predictive power. This allows for an intuitive confirmation of each cluster’s discriminability and error patterns. Furthermore, SHAP analysis quantitatively assesses the relative contribution of external variables to the classification results. Beyond simple performance metrics, SHAP analysis allows for interpretive validation, revealing which external factors were key drivers in the classification of specific cluster types.
Finally, to complementarily verify that the classification performance was not due to random chance, this study conducted a label permutation test. Specifically, we randomly shuffled the cluster labels and repeatedly trained the same Random Forest model (1000 iterations) to estimate the performance distribution of a null model. By confirming that the model’s performance with the true labels ranked in the upper percentile of this random distribution (p = 0.000999 for both the short-term and long-term; p-value < 0.001), we provided complementary evidence that the association between the external variables and the cluster labels is statistically significant.

3. Results

3.1. Short-Term Time Series (STTS)

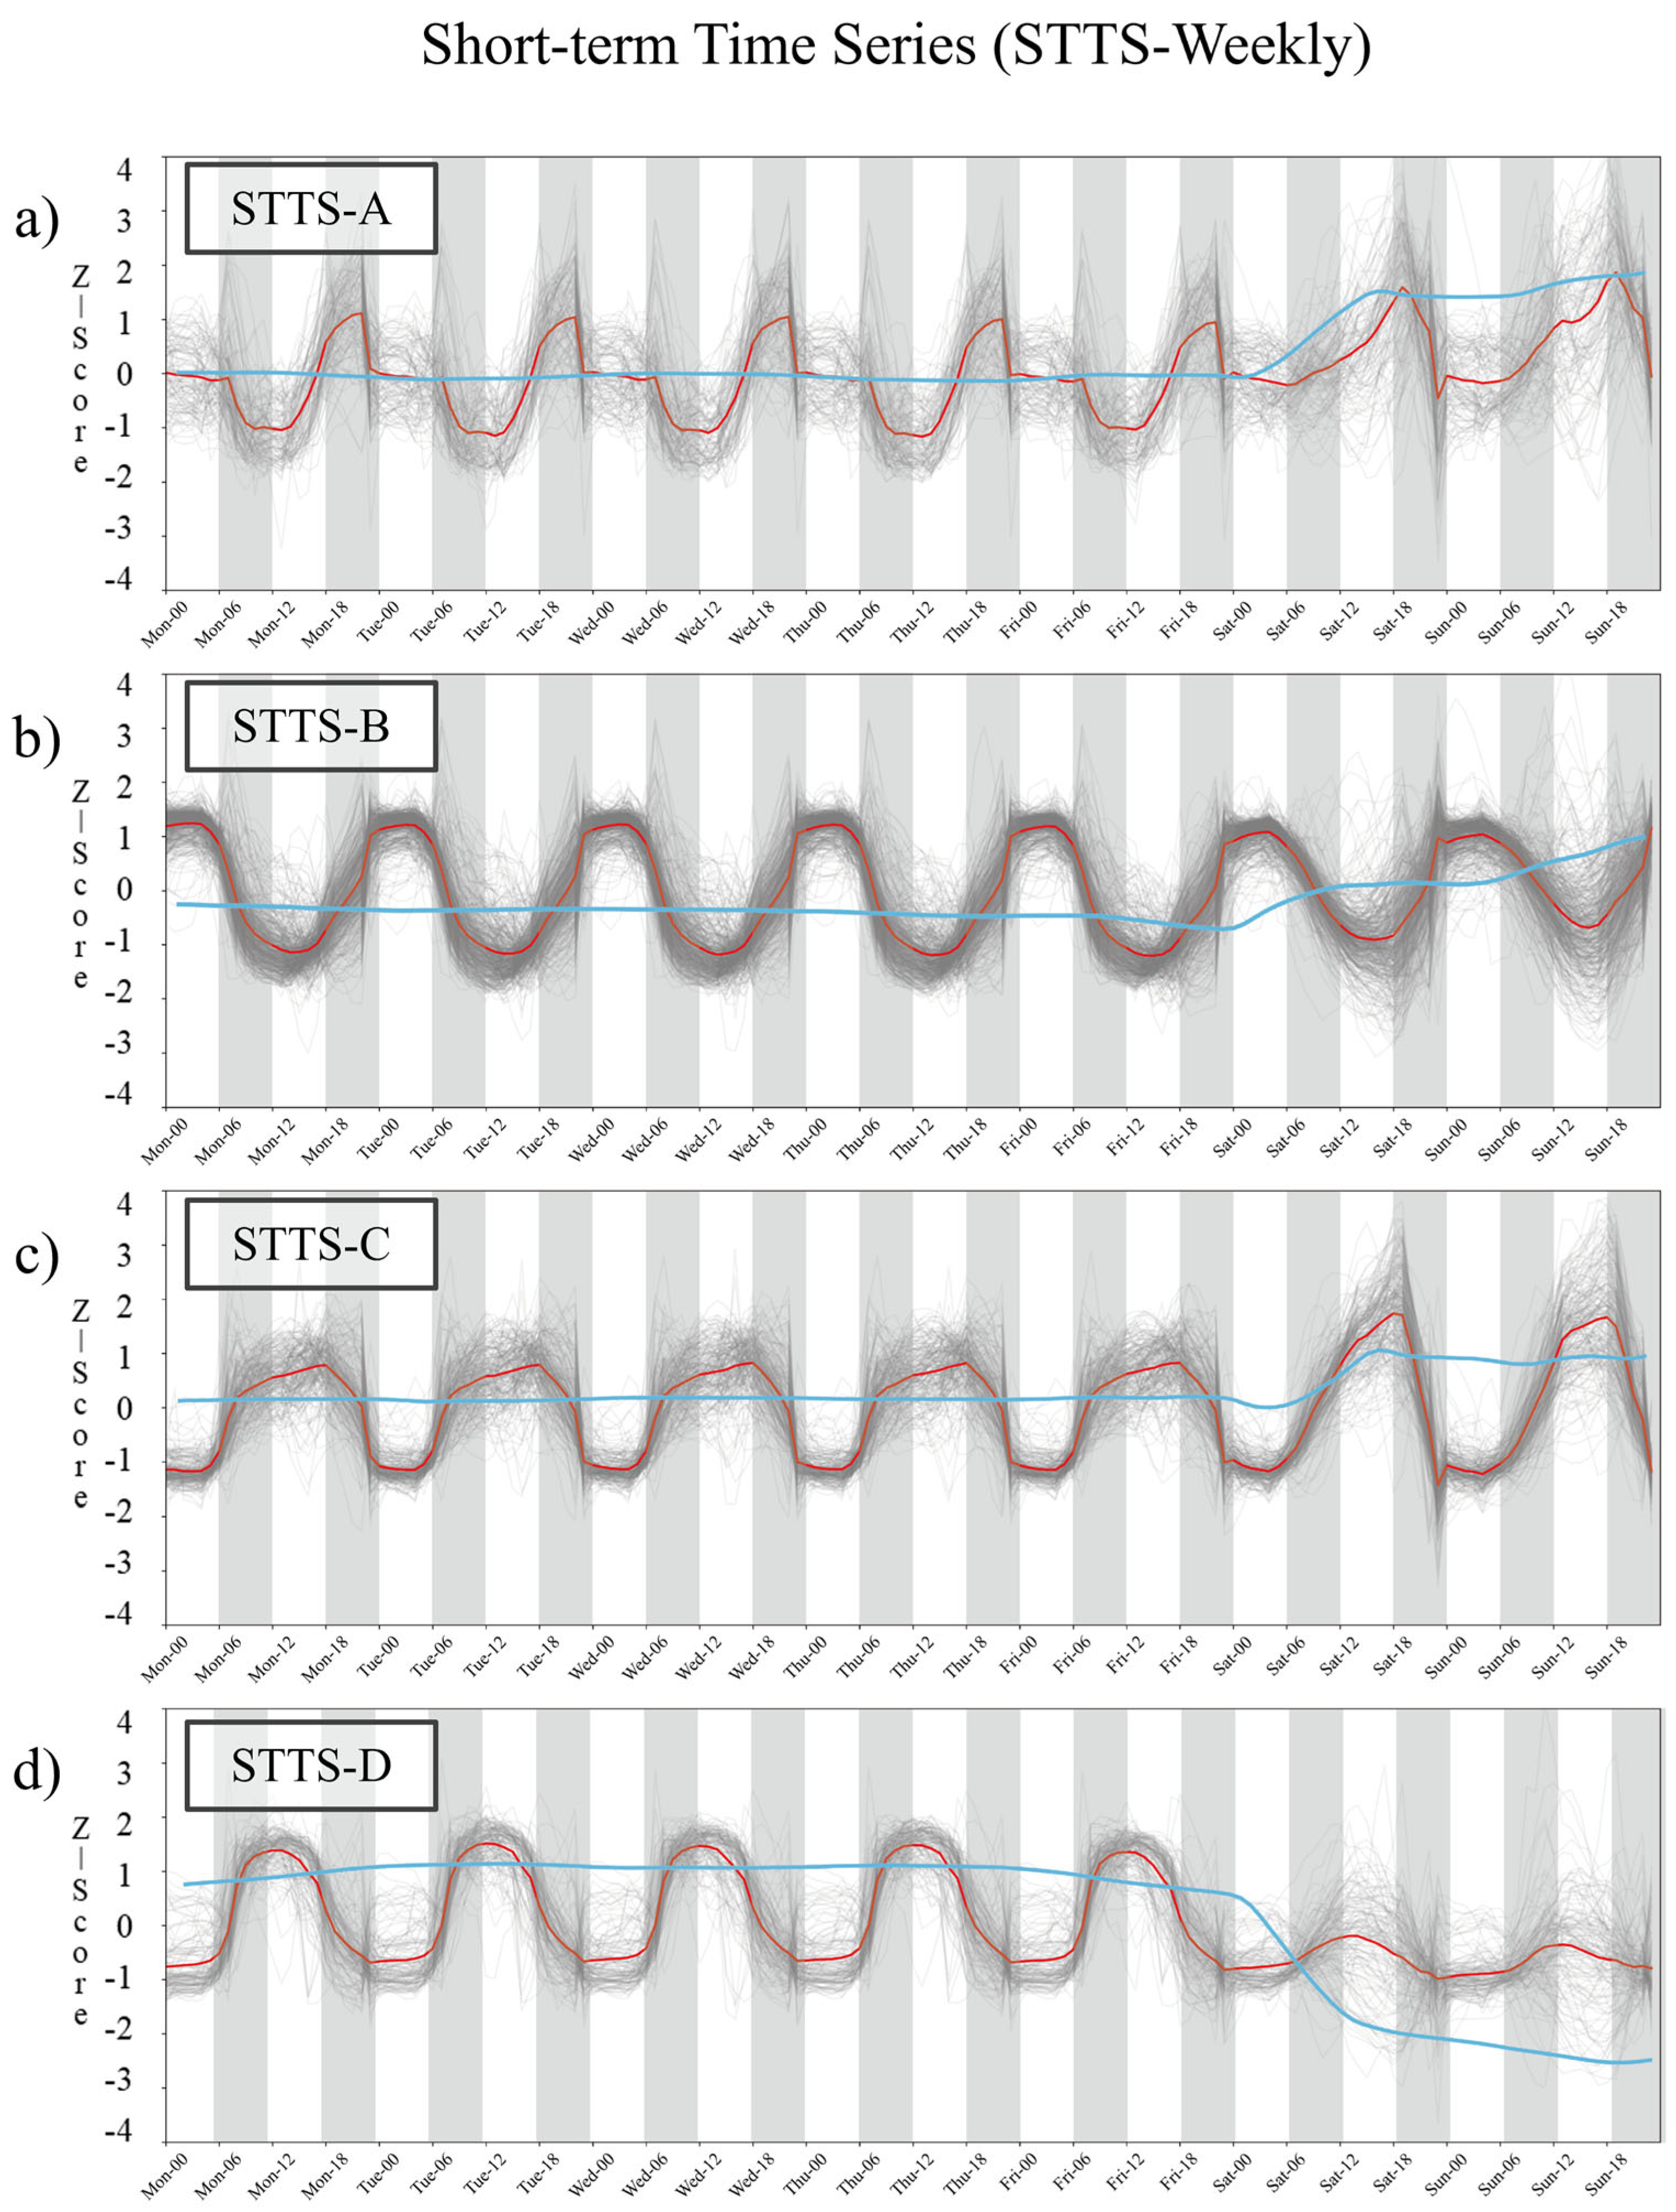
Figure 5 shows the classification of 1090 Golmok commercial districts in Seoul into four types based on their average weekly hourly patterns of de facto population. In these four graphs, the x-axis represents a one-week period, and the y-axis indicates the standardized de facto population level. The gray lines represent the weekly patterns of individual commercial districts, while the bold red line indicates the cluster’s centroid, which represents the average level of all commercial districts in a cluster. Each of the four STTS types exhibits distinct activity patterns, particularly when analyzed by key time blocks, dawn (00:00–05:00), morning (06:00–11:00), afternoon (12:00–17:00), and evening (18:00–23:00), and by the distinction between weekdays and weekends.
The first type (Figure 5a) shows a pattern in which the population decreases in the morning (06:00–11:00) and increases rapidly in the afternoon and evening (12:00–23:00) compared to other types (Figure 5a). Based on the average population within the cluster (center line), the population decreases rapidly at midnight (00:00), but in the late night and early morning (00:00–05:00), the individual commercial districts included in the cluster show different trends of increasing and then decreasing, or decreasing and then increasing. After Saturday midnight (00:00), the average population remained above 0 (Z = 0) during most time periods, and the evening population level was higher than on weekdays. This pattern is repeated on Sundays, and the population level on Sundays was slightly higher.
The second type (Figure 5b) shows a relatively constant pattern of population change throughout the week. The population value is maintained at a high level during the late night and early morning hours (00:00–05:00) and decreases during the morning hours (06:00–11:00), with the lowest population value at noon (12:00). After that, the population increases during the afternoon and evening hours (12:00–23:00) and remains high during the late night and early morning hours (00:00–05:00), which distinguishes this type from STTS Type A. Although the population value fluctuates slightly on weekends, the pattern is quite similar to that of weekdays compared to other types.
The third type (Figure 5c) has low population levels during the late-night and early-morning hours (00:00–05:00) and shows increases in the morning and afternoon (06:00–17:00), with the highest population levels around 6:00 PM (18:00). The average de facto population in the evening (18:00–23:00) is high but tends to decrease until midnight (00:00). Unlike the other STTS types, population levels remain relatively high across the morning, afternoon, and evening rather than being concentrated in a specific time period. On weekends, population levels are high in the evening (18:00–23:00), which is similar to STTS Type A. However, the levels are lower during the late-night and early-morning hours and higher in the evening.
The fourth type (Figure 5d) shows a pattern similar to that of STTS Type C in that the population is low during the late night and early morning hours (00:00–05:00). The population increases during the morning hours (06:00–11:00), reaches its highest around noon (12:00), and decreases during the afternoon and evening hours (12:00–23:00), which is different from STTS Type C. This pattern is repeated during the week, but on weekends, the population fluctuations are quite different for each business district. However, the average population during the weekend is generally lower than that of the other STTS types.
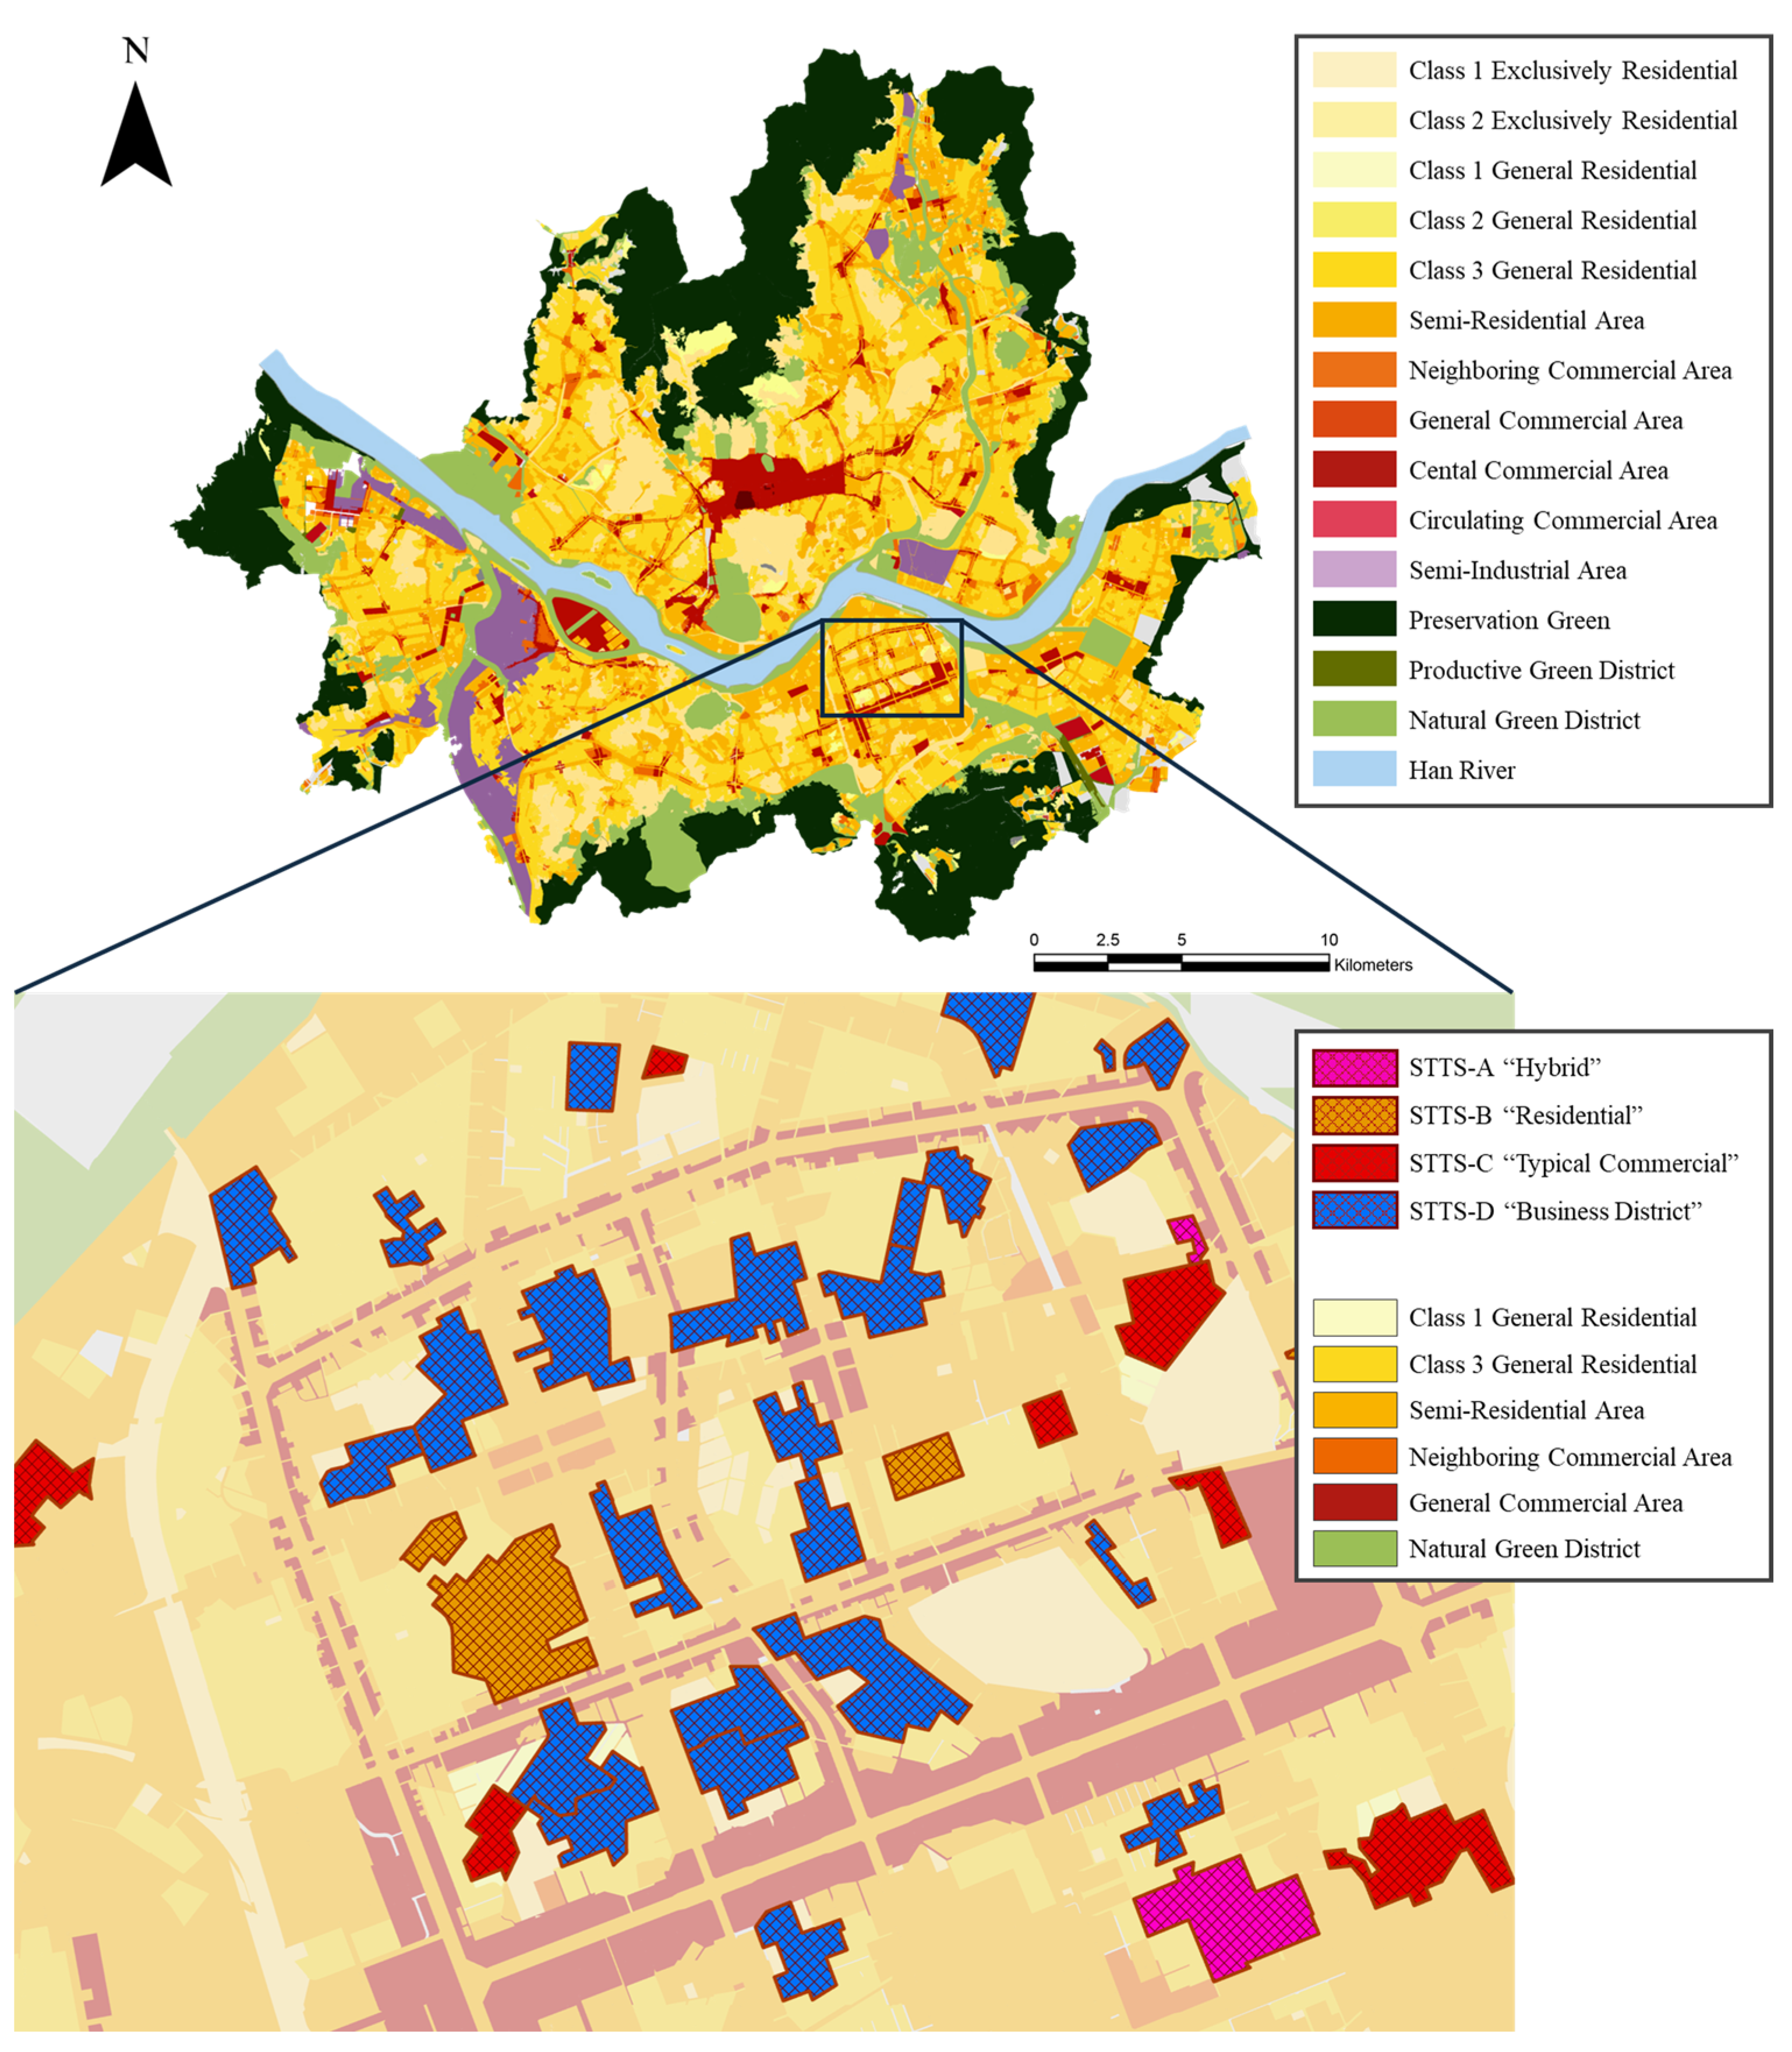
The four classified types of Golmok commercial districts demonstrate distinct temporal patterns. STTS Type A presents a hybrid profile. Its stable population in the late night and early morning hours followed by a morning decline suggests a residential function. However, the sharp population increase from the afternoon into the evening and the population concentration on weekends are strong indicators of a commercial component. This combination is typical of mixed-use residential-commercial areas. STTS Type B’s consistent pattern, with its high population levels in the late night and early morning hours (when people are typically at home) and lower levels during the day, is characteristic of a predominantly residential area. STTS Type C is characteristic of a typical commercial district, featuring high population levels throughout the day and a further surge in activity on weekends compared to weekdays. STTS Type D shows the highest population around noon (12:00) on weekdays and a low average population on weekends, indicating that these commercial areas have the characteristics of business districts. These classification results seem to partially reflect the locational characteristics of some Golmok commercial districts being connected to surrounding commercial and business areas (Figure 6).

3.2. Long-Term Time Series (LTTS)

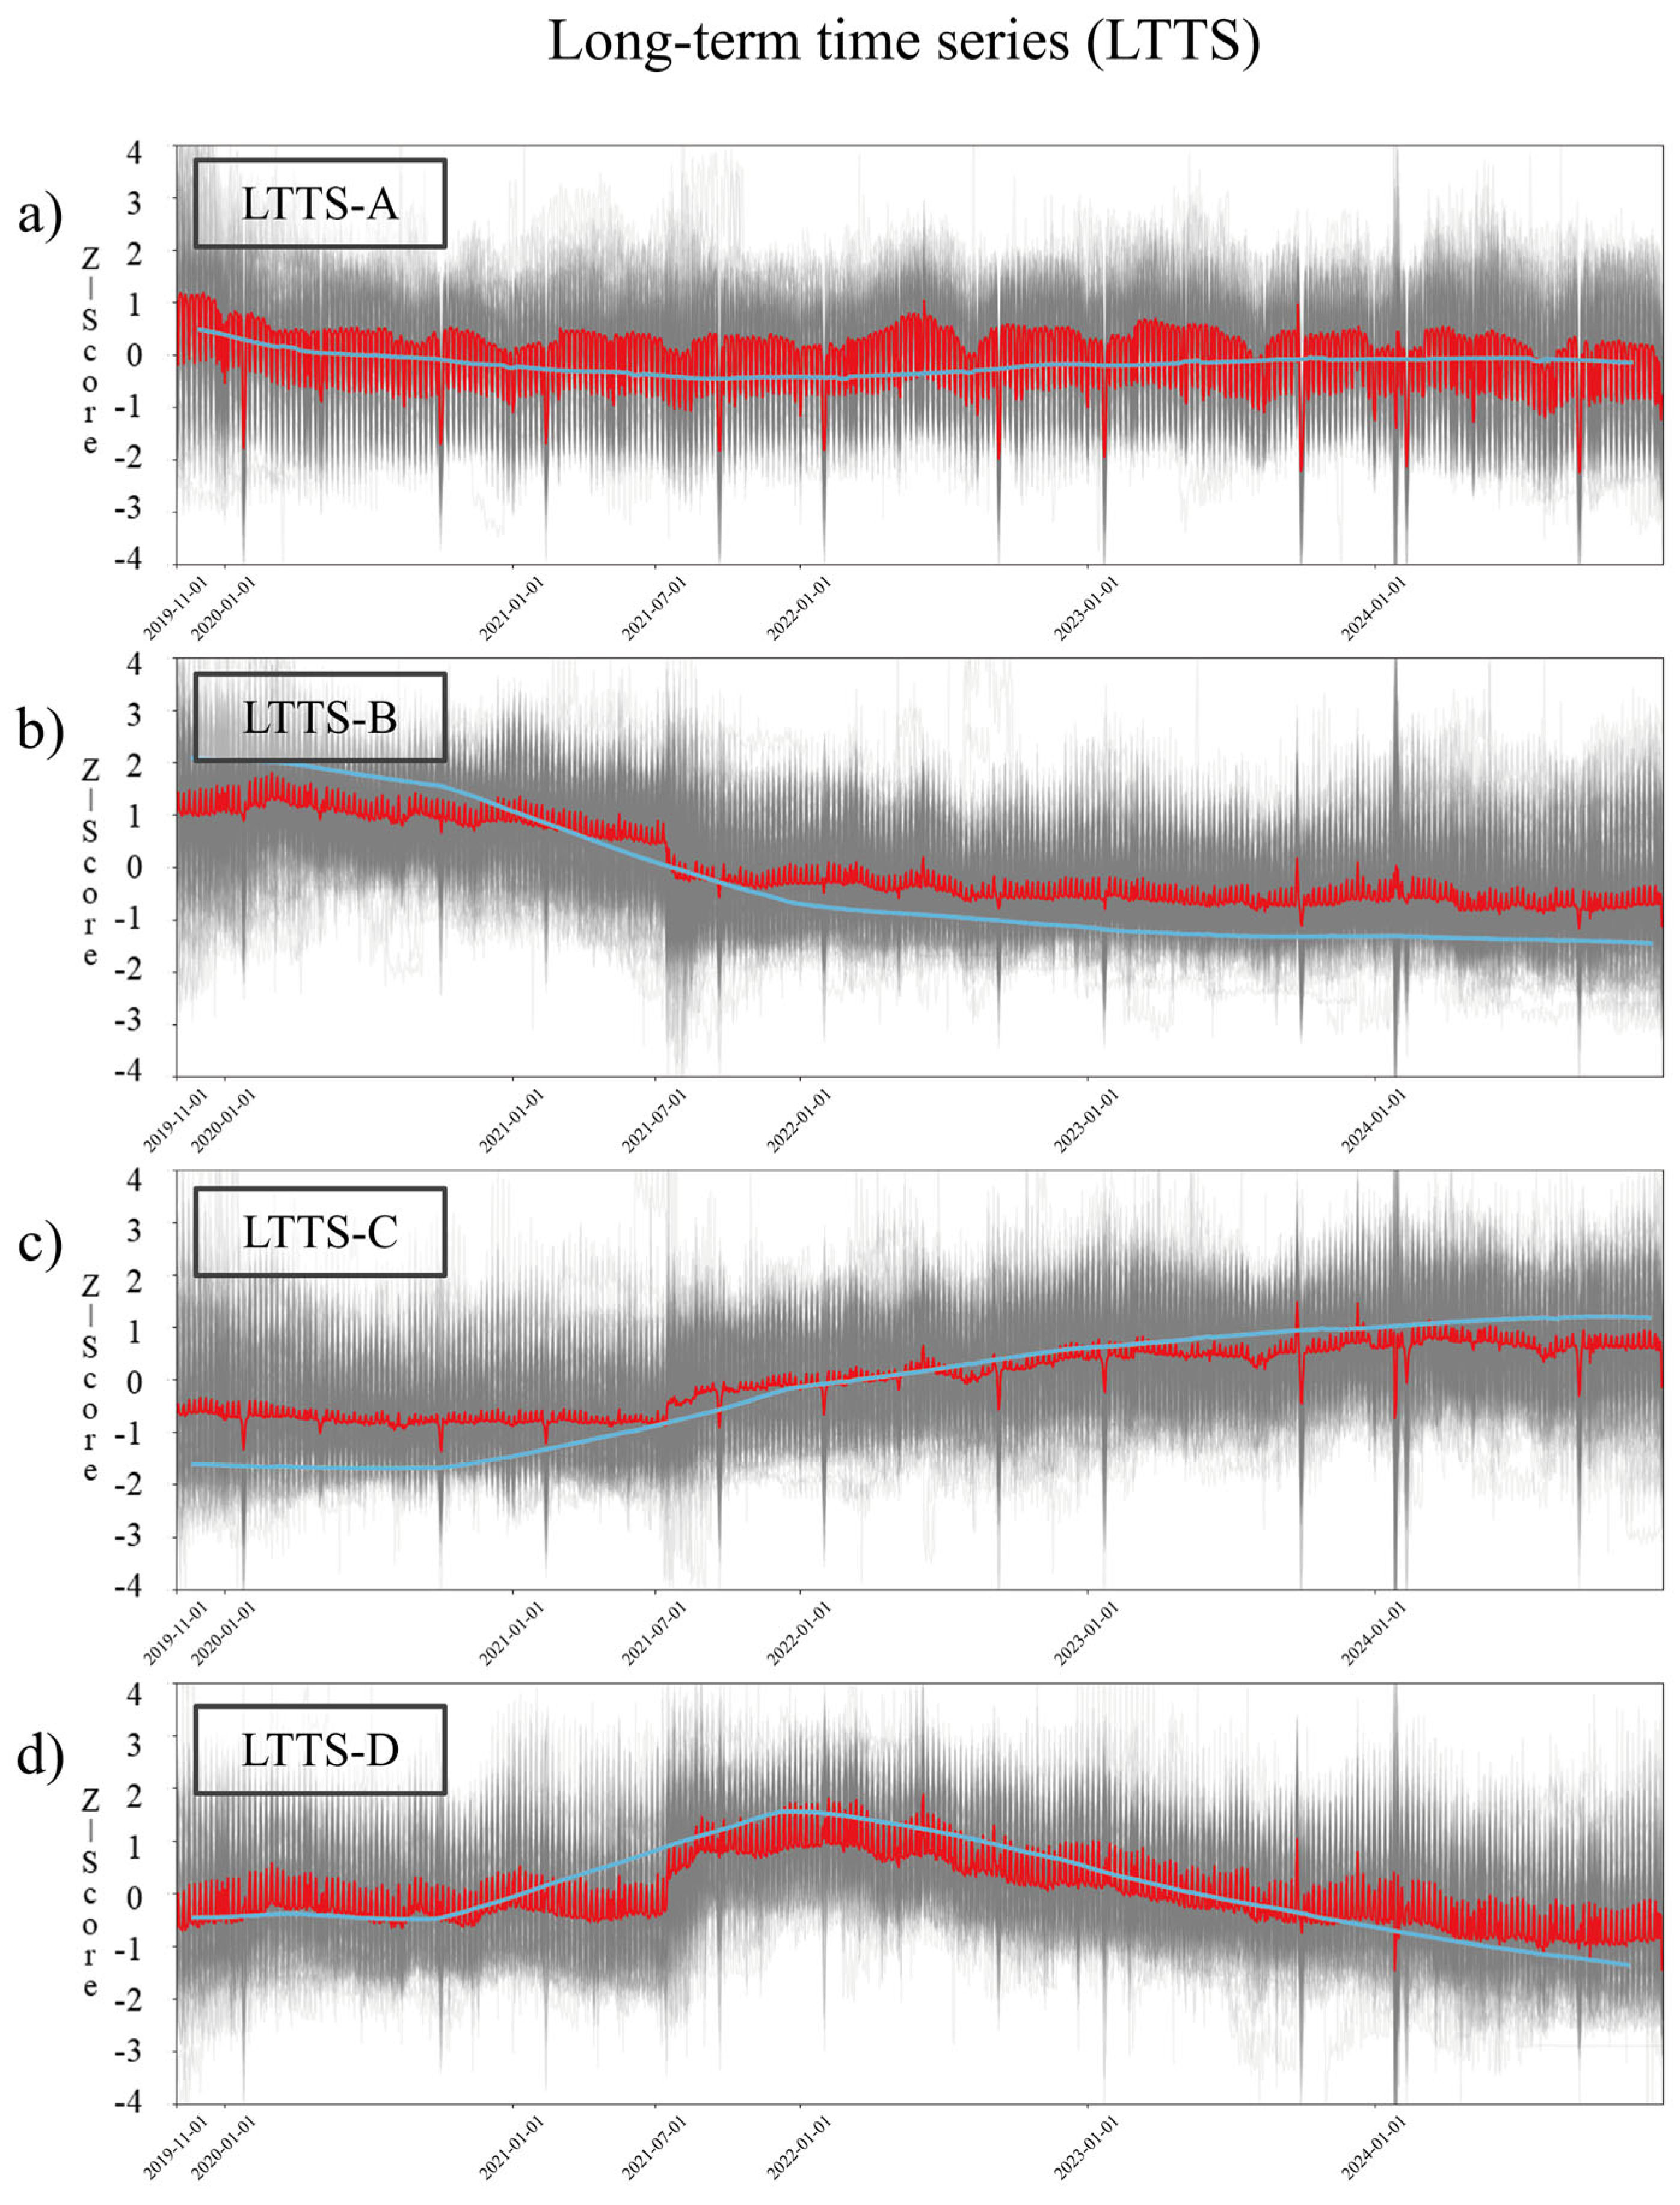
The four LTTS types show different characteristics in terms of (1) the direction of the peak, (2) fluctuation, and (3) trend changes after July 2021 of the de facto population in the time series. In the graph, the x-axis represents the entire study period, and the y-axis represents the standardized de facto population level.
The first type, LTTS Type A (Figure 7a), maintains a stable de facto population over the long term. Its centroid begins at a Z-score of approximately +1.0 in November 2019 and subsequently remains within a consistent range of ±0.4 relative to the overall mean from 2020 through 2024. The pattern is characterized by periodic downward spikes that consistently coincide with weekends (Saturday-Sunday). During weekdays, the centroid remains above the time-series mean (Z > 0) and drops to approximately Z = −0.4 each weekend. This creates a regular amplitude of about 1.2 units (from +0.8 to −0.4), which is the largest among all LTTS types, yet the shape of this fluctuation remains remarkably constant.
The second type, LTTS Type B (Figure 7b), exhibits a long-term declining trend in its de facto population. The centroid starts at a Z-score of around +1.1 in November 2019 but shows a sharp decline around July 2021. Afterward, it either stagnates or continues a gentle decline at a level below the mean (Z < 0) until the end of 2024. The accelerated downward trend around July 2021 is significant, with the centroid dropping sharply by approximately 1.7 units (from Z = +1.1 to −0.6). Unlike Type A, this type repeatedly shows upward spikes on weekends, indicating higher population levels on weekends than on weekdays, with a relatively small amplitude of approximately ±0.5.
The third type, LTTS Type C (Figure 7c), displays a long-term trend of gradual population increase. Its centroid starts at a low Z-score of −0.6 in November 2019 and begins to increase steadily from July 2021, eventually reaching a level of Z = +0.1 by the end of 2024. This trajectory is the direct opposite of that seen in LTTS Type B starting from July 2021. Similar to Type B, it features upward weekend peaks and a low amplitude of around ±0.5.
The fourth type, LTTS Type D (Figure 7d), is defined by a pattern of population increase up to a certain point, followed by a decline. Starting from an average level (Z ≈ 0) in November 2019, its centroid shows a rapid increase from July 2021, reaching a maximum Z-score of +1.6. Subsequently, the population begins to gradually decrease in the latter half of 2022, trending downwards to a Z-score of −0.5 by the end of 2024. Unlike the other types, Type D shows a more distinct rise-and-fall trajectory. Similar to Types B and C, it exhibits upward weekend peaks. Its amplitude of approximately ±0.9 is relatively large compared to that of Types B and C.
The four types of Golmok commercial districts showed divergent long-term population trends, with Types B, C, and D displaying distinct trajectories beginning around July 2021. This timing corresponds with the period when nationwide COVID-19 vaccination was being rolled out, suggesting the pandemic recovery had varying effects on different commercial districts. LTTS Type A was unique in maintaining a stable population level throughout the entire period. Its pattern of high weekday population followed by consistent weekend dips remained unchanged. Due to these characteristics, it was labeled the stability type. LTTS Type B started with a high population level but entered a continuous decline. This trend can be interpreted as the district losing its competitive edge as other commercial areas became more active post-vaccination. Accordingly, LTTS Type B was labeled the decline type. LTTS Type C began with a low de facto population in late 2019 but experienced a gradual increase from July 2021. This suggests increasing activity during the later stage of the study period. Due to its consistent growth, it was labeled the growth type. LTTS Type D showed a rapid population surge after July 2021, followed by a gradual decline. This pattern likely reflects a temporary concentration of activity immediately after pandemic restrictions eased, with demand later normalizing. Therefore, LTTS Type D was classified as the growth-then-decline type.

3.3. Typology Matrix

By cross-classifying the four short-term (STTS) types and four long-term (LTTS) types, a total of 16 composite types of Golmok commercial districts were derived. The combined typology is presented in Table 4. Commercial districts classified as LTTS B (decline) and LTTS D (growth-then-decline) constitute 633 of the 1090 total districts, representing approximately 58.1%. This indicates that a significant portion of Seoul’s Golmok commercial districts exhibit declining trend in the long-term time series classification. Among these declining types, the LTTS B–STTS B (decline–residential) combination was the most prevalent, with 227 cases, followed by the LTTS D–STTS B (growth-then-decline–residential) combination, with 125 cases. Notably, both are paired with short-term residential-type patterns. Conversely, the LTTS D–STTS D (growth-then-decline–business) combination was rare, with only 8 cases, suggesting that business-type Golmok commercial districts seldom experience such a decline.
The LTTS C (growth) type, which represents long-term growth, accounted for 274 districts (approximately 25.1%). Among these, the combination with LTTS C–STTS B (growth-residential) was the most prevalent, with 138 districts, whereas the combination with LTTS C–STTS D (growth-business) was the least frequent, with 31 districts. Furthermore, the LTTS A (stability) type showed a relatively low proportion, comprising 183 of the 1090 districts. The scarcity of these stability-type commercial districts implies that Golmok commercial districts are generally not stably maintained but are instead experiencing considerable dynamic changes.

3.4. Random Forest Classifier

The Random Forest Classifier showed that, for both the STTS and LTTS clusters, predictive accuracy using only external variables exceeded the level of random chance. This indicates that the classifications produced by K-means clustering, based on de facto population time series patterns, are significantly associated with the actual socioeconomic characteristics of the commercial districts, such as employment, sales, and residential population. Thus, this analysis provides complementary support for the validity of the K-means clustering results, suggesting that they are not arbitrary classifications.
Applying the Random Forest model to the STTS types (residential–commercial hybrid, residential, commercial, business district) yielded an overall accuracy of 0.559, and a macro F1-score of 0.468. These metrics are significantly higher than the random chance baseline (≈0.25), indicating that the external variables have considerable explanatory power for distinguishing the STTS types. According to the confusion matrix (Table 5), STTS B (residential) had the highest precision (0.686) and recall (0.747), indicating a clear association with the intensity of commercial activity. By comparison, the lowest recall (0.160) occurred for STTS A (residential–commercial hybrid), indicative of its overlap with other categories by virtue of its dual residential-commercial nature. Recall for STTS C (commercial) and STTS D (business district) was relatively consistent, due to the influence of residential features for the former and worker population and administrative/financial functions for the latter.
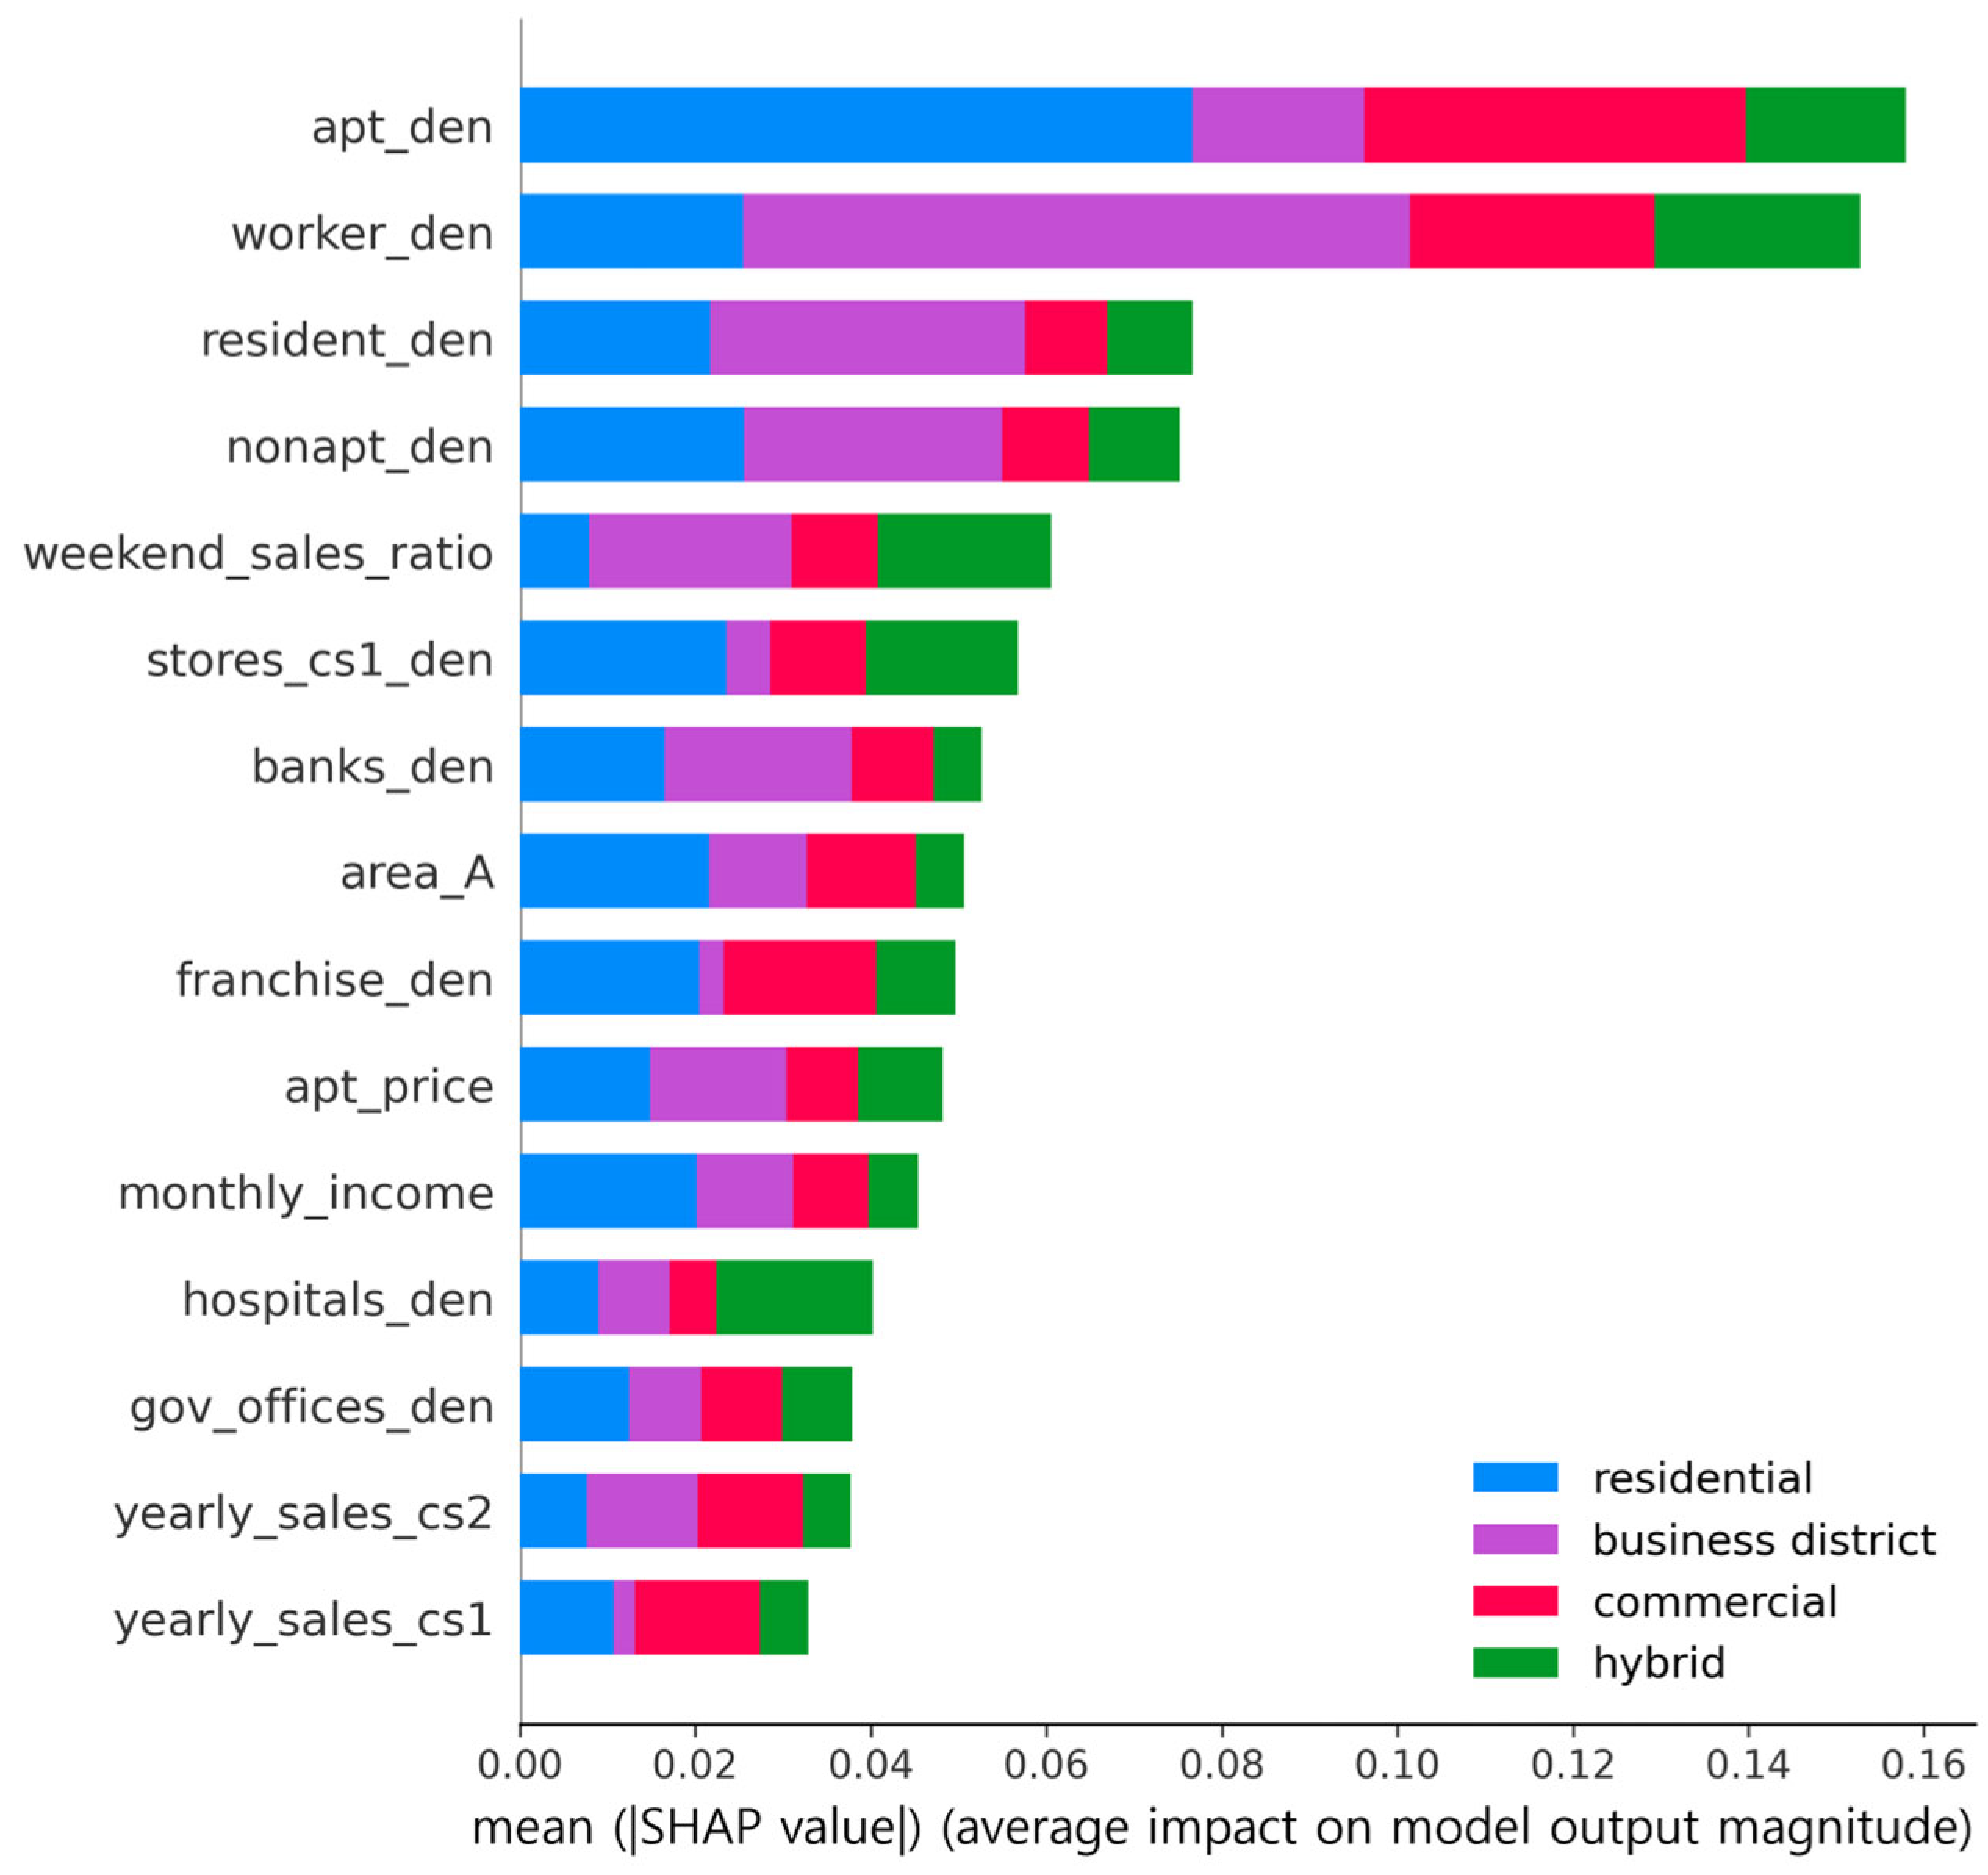
Figure 8 presents the SHAP results for the STTS types as a stacked feature-importance plot. The total length of each bar represents the overall importance of a variable in the Random Forest model, measured by its mean absolute SHAP value, while each colored segment indicates the relative contribution of that variable to a specific STTS type. The STTS types are arranged according to their cumulative SHAP contributions, in the order of STTS B (residential), STTS D (business district), STTS C (commercial), and STTS A (residential–commercial hybrid).
The SHAP analysis revealed that STTS B (residential) was influenced by residential factors such as apartment household density (apt_den), resident density (resident_den), and non-apartment household density (nonapt_den). In the case of STTS D (business district), worker density (worker_den) emerged as the most significant variable, together with variables related to administrative and financial services, such as bank density (banks_den), general hospital density (hospitals_den), and government office density (gov_offices_den). In the case of STTS C (commercial), the model was influenced mainly by variables indicative of commercial activity, including worker density (worker_den), restaurant density (stores_cs1_den), franchise density (franchise_den), and annual sales (yearly_sales_cs2). STTS A (residential–commercial hybrid) was influenced by a combination of apartment density (apt_den), resident density (resident_den), worker density (worker_den), and weekend sales ratio (weekend_sales_ratio), reflecting its dual residential and commercial characteristics.
For the LTTS types (stability, decline, growth, growth-then-decline), the Random Forest model resulted in an overall accuracy of 0.432, and a macro F1-score of 0.343. While these scores are above the random chance baseline (≈0.25), they are lower than those for the STTS results, suggesting that these long-term dynamics are harder to explain solely with static external variables. The confusion matrix (Table 6) showed that LTTS B (decline) was classified relatively well, whereas LTTS C (growth) showed lower predictive performance. However, LTTS D (growth-then-decline) had the lowest performance (recall = 0.077, F1-score = 0.118), indicating the model’s limited ability to explain this complex trajectory. This suggests that LTTS D is the most difficult LTTS type to explain using static external variables. Its low predictive performance implies that the growth-then-decline trajectory may be more strongly shaped by time-varying conditions than by fixed surrounding characteristics.
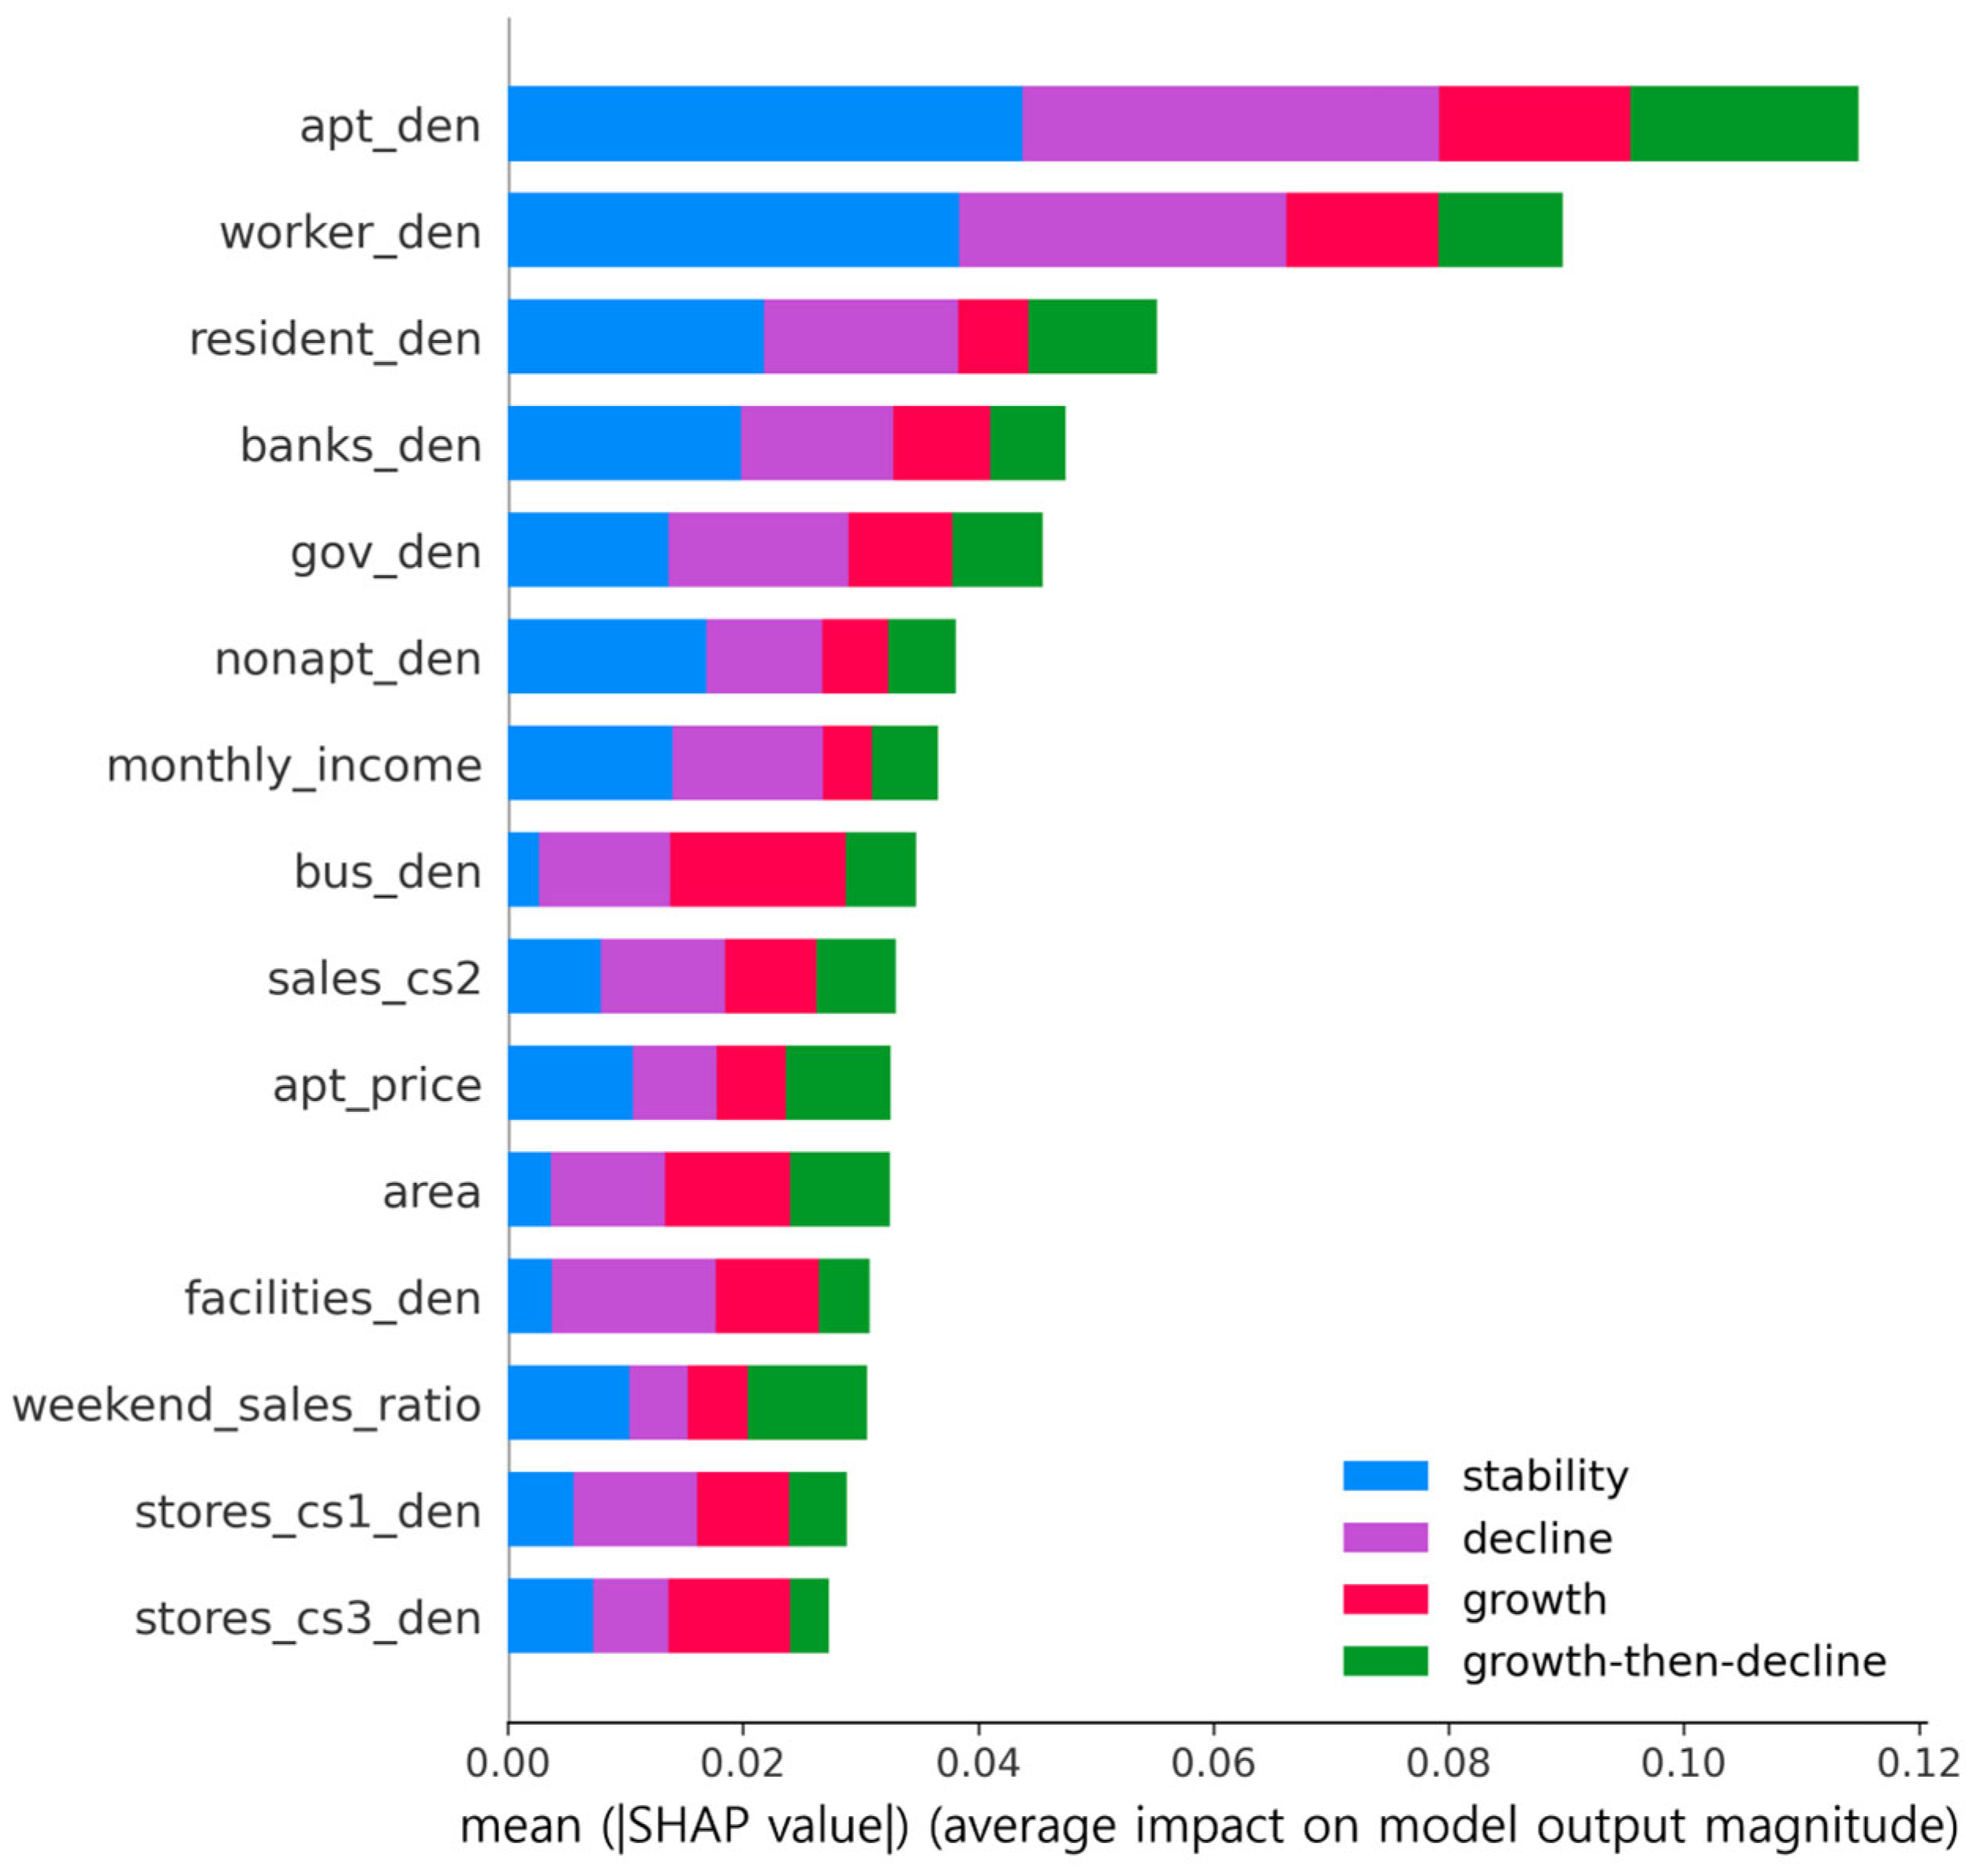
Figure 9 presents the SHAP results for the LTTS types in the same format as Figure 8. The LTTS types are ordered as LTTS A (stability), LTTS B (decline), LTTS C (growth), and LTTS D (growth-then-decline). The SHAP analysis for the LTTS clusters showed that apartment household density (apt_den) and worker density (worker_den) emerged as commonly important variables (Figure 9). For LTTS C (growth) in particular, the weekend sales ratio (weekend_sales_ratio), annual sales (yearly_sales_cs2), and bus stop density (bus_den) were key factors that improved its classification accuracy.

4. Discussion

4.1. Interpretation of the Typology and Spatial Context

This study introduces a novel classification of Seoul’s Golmok commercial districts into 16 dynamic types, using short- and long-term analyses of de facto population data. The results suggest that each district’s characteristics reflect different spatial contexts based on its short-term usage patterns and long-term growth trajectory. Although these districts are located in residential zones, the characteristics of the 16 types of Golmok commercial districts in Seoul appear to be more influenced by adjacent land uses and proximity to other growing commercial hubs than by their official residential zoning. In particular, the STTS classification suggests that usage patterns partially reflect the locational characteristics of some Golmok commercial districts in relation to surrounding commercial and business areas (Figure 6). Figure 6 shows Teheran-ro and the surrounding area, one of the largest central business districts in Seoul. It has a high concentration of large office buildings and is characterized by pronounced weekday daytime foot traffic and business functions. Many nearby Golmok commercial districts exhibited STTS-D patterns similar to this business-oriented usage pattern. However, different usage patterns were also observed among Golmok commercial districts located at similar distances from Teheran-ro. This suggests that proximity to a central business district influences short-term usage patterns, while its effect does not operate uniformly.
In contrast, the LTTS classification appears to reflect broader contextual conditions related to commercial growth and decline. As shown in Figure 9, several surrounding socioeconomic and built-environment variables contribute to the distinction among LTTS types, which is broadly consistent with previous studies emphasizing the role of neighboring conditions in commercial change [31,53].
This interpretation is also consistent with previous studies showing that time-based activity patterns can reflect spatial functional distinctions. Yuan et al. [17] demonstrated that latent activity trajectories could be used to distinguish urban functional zones such as residential, business, and educational areas, and Liu et al. [18] likewise classified urban functional regions in Chengdu into types such as Office, Urban Residential Area, and Residential/Commercial Mixed Area using time-series data. In this respect, our finding that STTS-B shows a residential rhythm, STTS-C a commercial rhythm, and STTS-D a business-district rhythm not only reinforces the existing argument that time-based activity patterns reflect spatial functional distinctions, but also suggests that such functional distinctions may be valid even at the neighborhood scale of commercial districts.
A clearer difference appears when our study is compared with a previous study that focused on long-term trajectories. Oh [33] classified long-term paths of commercial districts in Seoul based on store-density changes. However, that approach relied on annual store-density data and therefore did not account for the weekly activity rhythms associated with those trajectories. By combining LTTS and STTS, our study shows that even the same long-term trajectory can be associated with different functional rhythms. For example, the growth-then-decline trajectory appears more often in combination with a residential rhythm and only rarely with a business-district rhythm. In this respect, our study extends research on long-term trajectories by integrating those trajectories with weekly functional rhythms.

4.2. Policy Implications

The Seoul Metropolitan Government currently uses the S-LOCAL model to segment Golmok commercial districts and to inform its support policies. This model utilizes merchant-centric, static data. These include the number of shops utilizing local resources, the number of small business owners with distinctive plans, the establishment of networks and improved communication among merchants and residents, visits and purchasing activities by the nearby population from residential and workplace areas, and the development of, and satisfaction with, landscapes that encourage visitors to stay and linger [10]. As a result, this model classifies Golmok commercial districts into five types: (1) Anchor-type, (2) Potential-growth-type, (3) Residential-centered-type, (4) Mixed-use-business-type, and (5) Undifferentiated commercial districts [10]. This merchant-centric approach can be an effective method for leveraging the unique characteristics of each commercial district, as these traits can be critical resources for enhancing its vitality. However, a classification into only five types cannot sufficiently reflect the short- and long-term usage patterns of the commercial districts. For example, even if a commercial district is classified as a potential-growth-type with high growth potential indicators, the S-LOCAL model does not consider long-term usage trends, and thus, it cannot capture its growth or decline trajectory. This is because, regardless of how many potential consumer-attracting factors a district may have, it remains unknown whether these factors actually align with consumer preferences and translate into actual growth for the commercial district. Furthermore, a snapshot analysis at a specific point in time has a reactive nature; it can reveal the consequences after a problem has occurred, but it struggles to capture the problem as it is unfolding.
The 16-type classification, derived from combining short- and long-term time series analyses, enables a multidimensional analysis that transcends existing fragmentary diagnoses and provides two key policy implications. First, it highlights the need for a more granular classification of Golmok commercial districts based on de facto population data, and consequently, for more customized support policies [57,58]. Informed by the 16 types presented in this study, policy measures should be diversified to align with the specific spatio-temporal characteristics of visitors. For example, for commercial districts showing weekend population concentration and a long-term growth trend (such as LTTS C–STTS A or LTTS C–STTS C types), interventions such as improving the pedestrian environment or supporting cultural events for family visitors may be effective. On the other hand, for commercial districts showing declining weekday nighttime population within a long-term downward trend (such as the LTTS B–STTS B type), more fundamental prescriptions for revitalization may be needed. These could include improving lighting to encourage nighttime visits, providing incentives for late-night operations, or supporting the development of specialized services for office workers in the surrounding area. For commercial districts that show long-term stability with strong weekday daytime activity (such as the LTTS A–STTS D type), a relatively stable baseline demand may be maintained. Given limited municipal budget and administrative capacity, the Seoul Metropolitan Government could prioritize support policies aimed at maintaining the existing commercial base rather than implementing aggressive revitalization interventions. Because of this consistent demand, these districts may face high rent pressure. Accordingly, support policies could include rent-burden mitigation and temporary start-up loans for new businesses.
Second, our findings suggest a potential direction for support policies for Golmok commercial districts, transitioning from the current reactive model toward a more proactive framework focused on early detection and rapid intervention [54,58,59]. The vitality of commercial districts is not fixed; instead, it exhibits dynamic characteristics, constantly fluctuating in response to internal and external factors [6]. For instance, studies have documented the decline of commercial districts due to factors such as marginalization from new urban developments, which reduces public transport accessibility [60], and the expansion of car-centric lifestyles [61,62]. In a similar vein, new urban development projects in Seoul have also been found to undermine the vitality of certain commercial districts [63,64], as these projects reduce their relative accessibility and walkability. Since the vitality of commercial districts fluctuates in real time, it is difficult to detect signs of crisis in a timely manner with only static surveys conducted annually or quarterly. To address this challenge, our proposed typology could serve as a conceptual foundation for exploring a dynamic monitoring system that continuously tracks population pattern changes by commercial districts using big data such as real-time de facto population. This system detects abnormal signs in the population pattern of a specific commercial area (e.g., a sharp decline in population during a specific time period) and immediately shares the relevant information with the merchant association and planners, enabling rapid recognition of the change and preemptive response. While this is a response to an observed signal, its real-time nature allows for intervention before a negative trend becomes entrenched, thus serving a preventative function against irreversible decline. Ultimately, while currently at a proof-of-concept stage, such an approach could provide a foundation for shifting the focus of commercial area policy from a belated response to established problems to the proactive management of emerging issues [57,59]. Furthermore, if this system is advanced and combined with the origin and destination information of de facto population data, it will be possible to identify not just a drop in visitor numbers, but precisely which customer base is being lost. This would serve as a basis for precisely diagnosing the cause of a crisis and establishing an effective response strategy targeting the corresponding customer base, elevating the approach to a new level of proactive and targeted crisis management.

4.3. Limitations and Future Research

Furthermore, the findings of this study suggest that for more specific policy support, subsequent research is necessary to determine the reason for the growth and decline of commercial districts based on their specific characteristics. One limitation of this study is that, due to its focus on de facto population, it does not directly address visitor consumption behavior (e.g., spending amounts, preferred industries) or the physical environment of the commercial district (e.g., rent vacancy rates).
Our analysis relies on de facto population data derived from a single operator. Although these are rigorously adjusted statistical estimates, corrected for market share and demographics, expanding data from one provider inherently assumes its user base perfectly mirrors the national population. This assumption may lead to the underrepresentation of specific demographic groups, such as elderly or low-income residents who disproportionately use budget carriers or feature phones. Consequently, while our approach effectively captures macro-level temporal rhythms, it may not fully reflect the distinct mobility patterns of these specific sub-populations.
While ensuring privacy, the aggregated de facto population data inherently limits our analysis by obscuring microscopic behavioral and spatial details. Because the dataset captures total crowd volume without tracking individual trajectories or specific trip purposes, our clustering reflects macro-level temporal rhythms rather than direct consumer behaviors. Thus, our district typologies are inferred from crowd volume and timing rather than from directly observed individual activities.
Another limitation relates to the assumptions underlying the analytical methods. Although the number of clusters was determined by considering both statistical indicators and interpretability, some degree of subjectivity may still remain in the choice of K, and a different typology could emerge if a different number of clusters were applied. In addition, because K-means clustering assigns every observation to a cluster, observations near cluster boundaries may be classified into a single type even when they do not clearly fit that type. Likewise, the AWI procedure may simplify spatial variation within output areas when redistributing de facto population values based on areal proportions.
A notable limitation concerns the temporal scope and the interpretation of the long-term time series (LTTS). Due to a temporary gap in the dataset collection in October 2019, our analytical period begins in November 2019. Consequently, the dataset provides only a limited four-month pre-pandemic baseline before the nationwide COVID-19 outbreak in March 2020. Due to the lack of a sufficient pre-pandemic baseline, it is difficult to accurately determine whether declining districts (e.g., LTTS-B) were already experiencing structural decline prior to the pandemic or whether they were primarily responding to the COVID-19 shock. Furthermore, because our study window covers the full pandemic cycle without employing formal counterfactual models or structural break tests, the identified LTTS typologies may heavily encode pandemic-phase variations rather than purely stable, long-term commercial dynamics. Therefore, the proposed long-term typologies should be interpreted cautiously as trajectories of pandemic response and recovery, rather than definitively stable structural trends.
Accordingly, subsequent research must conduct a more in-depth analysis of the specific characteristics of each commercial district type, integrating this study’s classification results with data on card sales, social media, rent, and vacancy rates. For instance, a spatial panel regression analysis could quantitatively determine the extent to which a neighborhood’s land use characteristics explain short- and long-term usage patterns of a specific Golmok commercial district. Furthermore, to address the clustering of declining commercial districts, a spatial autocorrelation analysis used alongside the spatial panel model could quantify the spatial spillover effects of the transition from growth to decline. This series of follow-up studies can provide an essential basis for a more scientific understanding of the dynamics of Golmok commercial districts, enabling the sustainable development of precise, customized policies that consider the unique spatial and economic context and growth stage of each district.

5. Conclusions

This study is motivated by the critical issue that the current classification system for Seoul’s Golmok commercial districts inadequately reflects citizens’ usage patterns, which in turn hinders the effectiveness of policy responses. To capture actual usage patterns of citizens, we applied K-means clustering to de facto population time series data, analyzing both STTS (short-term time series) and LTTS (long-term time series) patterns with four clusters each, and classified 1090 Golmok commercial districts into 16 types using a typology matrix. Our two-timescale time series analysis revealed that approximately 58.1% of the districts (633 in total) fall into the LTTS B (decline) and LTTS D (growth-then-decline) categories, showing long-term declining trends, while the stable LTTS A type accounted for 183 districts, indicating that Seoul’s Golmok commercial districts generally experience considerable dynamic changes rather than stable maintenance. By relying on static data, the existing S-LOCAL classification in Seoul fails to capture actual usage patterns, limiting it to a reactive approach. In contrast, our study integrates both short- and long-term temporal variation in the usage patterns. This approach enables more precise identification of daily usage patterns and their long-term trajectories. The results highlight the potential for a new policy framework based on real-time change detection and proactive intervention, moving beyond the limitations of the current static and reactive model. However, as this study serves primarily as an exploratory data-driven analytical framework, further external validation and real-world implementation are necessary to fully operationalize and evaluate the practical efficacy of this proposed approach.

Author Contributions

Conceptualization, B.Y., J.L. and M.P.; methodology, B.Y.; validation, B.Y., J.L. and M.P.; formal analysis, B.Y., J.L. and M.P.; investigation, B.Y., J.L. and M.P.; resources, J.L.; data curation, B.Y.; writing—original draft preparation, B.Y. and M.P.; writing—review and editing, B.Y., J.L. and M.P.; visualization, B.Y.; supervision, J.L.; project administration, J.L.; funding acquisition, J.L. All authors have read and agreed to the published version of the manuscript.

Funding

This work was supported by the National Research Foundation of Korea (NRF), funded by the Ministry of Education (No. RS-2024–00336929).

Institutional Review Board Statement

Not applicable.

Informed Consent Statement

Not applicable.

Data Availability Statement

The raw data supporting the conclusions of this article will be made available by the authors on request.

Conflicts of Interest

The authors declare no conflicts of interest.

References

  1. Ryberg-Webster, S.R.; Kinahan, K. Historic preservation and urban revitalization in the twenty-first century. J. Plan. Lit. 2014, 29, 119–139. [Google Scholar] [CrossRef] [Scilit]
  2. Kickert, C.; Vom Hofe, R.; Haas, T.; Zhang, W.; Mahato, B. Spatial dynamics of long-term urban retail decline in three transatlantic cities. Cities 2020, 107, 102918. [Google Scholar] [CrossRef] [Scilit] [PubMed]
  3. Esposito De Vita, G.; Ragozino, S. Natural commercial centers: Regeneration opportunities and urban challenges. Adv. Eng. Forum 2014, 11, 392–401. [Google Scholar] [CrossRef] [Scilit]
  4. Ministry of SMEs and Startups. Framework Act on Micro Enterprises (Act No. 17623, 8 December 2020; Effective 9 March 2021). Available online: https://www.law.go.kr/LSW/lsInfoP.do?lsiSeq=223615 (accessed on 10 March 2026).
  5. Seoul Credit Guarantee Foundation. Strategic Plan and Support Measures for Revitalizing Seoul’s Commercial Districts (Basic Research Report No. 24-01); Seoul Credit Guarantee Foundation: Seoul, Republic of Korea, 2024. [Google Scholar]
  6. Seoul Credit Guarantee Foundation. Analysis of Small Business Support Policies and Policy Direction in Seoul (Small Enterprise Issue Report No. 24-04); Seoul Credit Guarantee Foundation: Seoul, Republic of Korea, 2024. [Google Scholar]
  7. Kim, H.; An, Y. Monitoring the dynamic change of Seoul’s side street trade areas using density and diversity of stores. Seoul Stud. 2019, 20, 149–170. [Google Scholar] [CrossRef]
  8. Kwon, D.; Jeon, J. The COVID-19 pandemic impact on the Seoul retail market: A spatial perspective. J. Korea Real Estate Anal. Assoc. 2022, 28, 25–44. [Google Scholar] [CrossRef] [Scilit]
  9. Kang, M.S.; Shin, W.-J. Comparative study on the survival rate of self-employed businesses by type and commercial area: Focused on Gwangju Metropolitan City. J. Apprais. Stud. 2024, 23, 101–128. [Google Scholar]
  10. Hong, H.; Ji, T. Typology Analysis of Seoul’s Golmok Commercial Districts Using the S-LOCAL Model (Issue Brief No. 2); Center for Small Business Insights, Seoul Credit Guarantee Foundation: Seoul, Republic of Korea, 2024. [Google Scholar]
  11. Hanson, S. The determinants of daily travel-activity patterns: Relative location and sociodemographic factors. Urban Geogr. 1982, 3, 179–202. [Google Scholar] [CrossRef] [Scilit]
  12. Guy, C.M. Classifications of retail stores and shopping centres: Some methodological issues. GeoJournal 1998, 45, 255–264. [Google Scholar] [CrossRef] [Scilit]
  13. Griswold, J.B.; Medury, A.; Schneider, R.J.; Grembek, O. Comparison of pedestrian count expansion methods: Land use groups versus empirical clusters. Transp. Res. Rec. 2018, 2672, 57–67. [Google Scholar] [CrossRef] [Scilit]
  14. Kim, H.; Lee, S. A study on the factors affecting the revenue in Seoul’s side street trade areas. Seoul Stud. 2019, 20, 117–134. [Google Scholar] [CrossRef]
  15. Buckwalter, D.W. Small area classification in urban geography: A review of multidimensional methods. Middle States Geogr. 2024, 56, 107–120. [Google Scholar]
  16. Berry, B.J.L.; Garrison, W.L. A note on central place theory and the range of a good. Econ. Geogr. 1958, 34, 304–311. [Google Scholar] [CrossRef] [Scilit]
  17. Yuan, N.J.; Zheng, Y.; Xie, X.; Wang, Y.; Zheng, K.; Xiong, H. Discovering urban functional zones using latent activity trajectories. IEEE Trans. Knowl. Data Eng. 2015, 27, 712–725. [Google Scholar] [CrossRef] [Scilit]
  18. Liu, X.; Tian, Y.; Zhang, X.; Wan, Z. Identification of urban functional regions in Chengdu based on taxi trajectory time series data. ISPRS Int. J. Geo-Inf. 2020, 9, 158. [Google Scholar] [CrossRef] [Scilit]
  19. Gao, S. Spatio-temporal analytics for exploring human mobility patterns and urban dynamics in the mobile age. Spat. Cogn. Comput. 2015, 15, 86–114. [Google Scholar] [CrossRef] [Scilit]
  20. Yue, Y.; Zhuang, Y.; Yeh, A.G.O.; Xie, J.Y.; Ma, C.L.; Li, Q.Q. Measurements of POI-based mixed use and their relationships with neighbourhood vibrancy. Int. J. Geogr. Inf. Sci. 2017, 31, 658–675. [Google Scholar] [CrossRef] [Scilit]
  21. Meltzer, R.; Capperis, S. Neighbourhood differences in retail turnover: Evidence from New York City. Urban Stud. 2017, 54, 3022–3057. [Google Scholar] [CrossRef] [Scilit]
  22. Statistics Korea. Gross Regional Domestic Product (GRDP) by Region (Based on 2020). Available online: https://www.index.go.kr/unity/potal/main/EachDtlPageDetail.do?idx_cd=1008 (accessed on 10 March 2026).
  23. Statistics Korea. Per Capita Gross Regional Domestic Product, Gross Regional Income, and Personal Income by Region (1985–2022). KOSIS. Available online: https://kosis.kr/statHtml/statHtml.do?orgId=101&tblId=DT_1C86 (accessed on 10 March 2026).
  24. Statistics Korea. Number of Establishments and Employees by Enterprise Size, Industrial Sector, and Region (2019–2022). Korean Statistical Information Service (KOSIS). Available online: https://kosis.kr/statHtml/statHtml.do?orgId=101&tblId=DT_3BD1006 (accessed on 10 March 2026).
  25. Moon, H.; Jang, C. Strategies for Supporting and Managing Seoul’s Commercial Districts in the Post-COVID-19 Era (Small Research Series No. 21-03); Seoul Institute: Seoul, Republic of Korea, 2021. [Google Scholar]
  26. Cho, H.; Do, H.; Seo, J.; Jin, J. Revitalizing Commercial Districts in the Post-COVID Era: Can Youth Provide the Answer? (Small Research Series No. 22-01); Seoul Institute: Seoul, Republic of Korea, 2022. [Google Scholar]
  27. Ministry of Government Legislation. Act on Coexistence and Revitalization of Local Trading Areas (Act No. 18357, 27 July 2021; Amended by Act No. 20365, 27 February 2024). Available online: https://www.law.go.kr/LSW/eng/engMain.do (accessed on 10 March 2026).
  28. Seoul Metropolitan Government Information Planning Officer; KT Big Data Business Support Group. Seoul De Facto Population Estimation Manual; Seoul Metropolitan Government: Seoul, Republic of Korea, 2018.
  29. Statistics Korea. Glossary of Statistical Terms—Output Area. SGIS Plus 2024. Available online: https://sgis.kostat.go.kr/view/board/expAndNoticeStatsWord (accessed on 10 March 2026).
  30. Statistics Korea. GIS Small-Area Statistics User Manual. Statistics Korea 2023. Available online: http://sgis.kostat.go.kr/ (accessed on 10 March 2026).
  31. Lee, D.; Choi, J.; Kim, S. Comparison of survival rate in food service industry between growing commercial districts and declining commercial districts of Seoul. Korea Spat. Plan. Rev. 2020, 105, 65–84. [Google Scholar] [CrossRef]
  32. Kim, M.; Lee, S. Categorizing alley commercial districts and analyzing the influencing factors of business openings and closings in Seoul, Korea: Using floating population big data and DTW time series clustering analysis. J. Korea Plan. Assoc. 2024, 59, 99–116. [Google Scholar] [CrossRef] [Scilit]
  33. Oh, S. Dynamic changes in side-street trade areas of Seoul: Using growth mixture modeling. Cities 2025, 158, 105666. [Google Scholar] [CrossRef] [Scilit]
  34. Chen, Y.; Liu, X.; Li, X.; Liu, X.; Yao, Y.; Hu, G.; Xu, X.; Pei, F. Delineating urban functional areas with building-level social media data: A dynamic time warping (DTW) distance based k-medoids method. Landsc. Urban Plan. 2017, 160, 48–60. [Google Scholar]
  35. Prener, C.G.; Revord, C.K. areal: An R package for areal weighted interpolation. J. Open Source Softw. 2019, 4, 1221. [Google Scholar] [CrossRef] [Scilit]
  36. Järv, O.; Tenkanen, H.; Toivonen, T. Enhancing spatial accuracy of mobile phone data using multi-temporal dasymetric interpolation. Int. J. Geogr. Inf. Sci. 2017, 31, 1630–1651. [Google Scholar] [CrossRef] [Scilit]
  37. Aghabozorgi, S.; Shirkhorshidi, A.S.; Wah, T.Y. Time-series clustering—A decade review. Inf. Syst. 2015, 53, 16–38. [Google Scholar] [CrossRef] [Scilit]
  38. Petitjean, F.; Ketterlin, A.; Gançarski, P. A global averaging method for dynamic time warping, with applications to clustering. Pattern Recognit. 2011, 44, 678–693. [Google Scholar] [CrossRef] [Scilit]
  39. Zhao, J.; Itti, L. shapeDTW: Shape Dynamic Time Warping. Pattern Recognit. 2018, 74, 171–184. [Google Scholar] [CrossRef] [Scilit]
  40. Berndt, D.J.; Clifford, J. Using Dynamic Time Warping to Find Patterns in Time Series. In Proceedings of the KDD-94 AAAI Workshop on Knowledge Discovery in Databases, Seattle, WA, USA, 31 July–1 August 1994; pp. 359–370. [Google Scholar]
  41. Javed, A.; Lee, B.S.; Rizzo, D.M. A benchmark study on time series clustering. Mach. Learn. Appl. 2020, 1, 100001. [Google Scholar] [CrossRef] [Scilit]
  42. Rakthanmanon, T.; Campana, B.J.L.; Mueen, A.; Batista, G.E.A.P.A.; Westover, M.B.; Zhu, Q.; Zakaria, J.; Keogh, E. Searching and mining trillions of time series subsequences under dynamic time warping. In Proceedings of the 18th ACM SIGKDD International Conference on Knowledge Discovery and Data Mining, Beijing, China, 12–16 August 2012; pp. 262–270. [Google Scholar] [CrossRef] [Scilit]
  43. Ding, H.; Trajcevski, G.; Scheuermann, P.; Wang, X.; Keogh, E. Querying and mining of time series data: Experimental comparison of representations and distance measures. Proc. VLDB Endow. 2008, 1, 1542–1552. [Google Scholar] [CrossRef] [Scilit]
  44. Aledavood, T.; Kivimäki, I.; Lehmann, S.; Saramäki, J. A non-negative matrix factorization based method for quantifying rhythms of activity and sleep and chronotypes using mobile phone data. arXiv 2020, arXiv:2009.09914. [Google Scholar] [CrossRef] [Scilit]
  45. Paparrizos, J.; Gravano, L. Fast and accurate time-series clustering. ACM Trans. Database Syst. 2017, 42, 8. [Google Scholar] [CrossRef] [Scilit]
  46. Thorndike, R.L. Who belongs in the family? Psychometrika 1953, 18, 267–276. [Google Scholar] [CrossRef] [Scilit]
  47. Rousseeuw, P.J. Silhouettes: A graphical aid to the interpretation and validation of cluster analysis. J. Comput. Appl. Math. 1987, 20, 53–65. [Google Scholar] [CrossRef] [Scilit]
  48. Kilani, B.H. K-means clustering algorithms in urban studies: A review of unsupervised machine learning techniques. OSF Prepr. 2023. [Google Scholar] [CrossRef] [Scilit]
  49. Barrena-Herrán, M.; Modrego-Monforte, I.; Grijalba, O. Revealing spatiotemporal urban activity patterns: A machine learning study using Google Popular Times. ISPRS Int. J. Geo-Inf. 2025, 14, 221. [Google Scholar] [CrossRef] [Scilit]
  50. Kang, H.M.; Lee, S.K. An analysis of the effects of customer characteristics on sales of alley market area using geographically weighted regression. J. Korean Soc. Surv. Geod. Photogramm. Cartogr. 2018, 36, 611–620. [Google Scholar] [CrossRef]
  51. Yu, H.J. A study on COVID-19 and effects factors concerning the sales of side-street trade areas in Seoul. J. Korean Reg. Dev. Assoc. 2021, 33, 45–75. [Google Scholar] [CrossRef]
  52. Kang, C.-D. Effect of neighborhood income and consumption on retail viability: Evidence from Seoul, Korea. Habitat Int. 2019, 94, 102060. [Google Scholar] [CrossRef] [Scilit]
  53. Sung, H. Estimating the spatial impact of neighboring physical environments on retail sales. Cities 2022, 123, 103579. [Google Scholar] [CrossRef] [Scilit]
  54. Guo, T.; Lu, Z.; Wang, F. Multi-Modal Social Media Analysis via SHAP-Based Explanation: A Framework for Public Art Perception. IEEE Access 2025, 13, 68753–68772. [Google Scholar] [CrossRef] [Scilit]
  55. Li, D.; Han, H.; Wang, J.; Xiao, X. Explaining Urban Vitality Through Interpretable Machine Learning: A Big Data Approach Using Street View Images and Environmental Factors. Sustainability 2025, 17, 4926. [Google Scholar] [CrossRef] [Scilit]
  56. Xie, Y.; Zhang, J.; Li, Y.; Zhu, Z.; Deng, J.; Li, Z. Integrating Multi-Source Urban Data with Interpretable Machine Learning for Uncovering the Multidimensional Drivers of Urban Vitality. Land 2024, 13, 2028. [Google Scholar] [CrossRef] [Scilit]
  57. Lu, Z.; Wang, W.; Guo, T.; Li, Y.; Wang, F. Decoding urban policies: NLP-driven concise explanations. Environ. Plan. B Urban Anal. City Sci. 2025, 53, 23998083251321981. [Google Scholar] [CrossRef] [Scilit]
  58. Kandt, J.; Batty, M. Smart cities, big data and urban policy: Towards urban analytics for the long run. Cities 2021, 109, 102992. [Google Scholar] [CrossRef] [Scilit]
  59. Wang, Z.; Ren, F. Developing a decision support system for sustainable urban planning using machine learning-based scenario modeling. Sci. Rep. 2025, 15, 13210. [Google Scholar] [CrossRef] [Scilit]
  60. Lowe, M.; Wrigley, N. Retail and the urban. Urban Geogr. 2000, 21, 640–653. [Google Scholar] [CrossRef] [Scilit]
  61. Parker, C.; Ntounis, N.; Millington, S.; Quin, S.; Castillo-Villar, F.R. Improving the vitality and viability of the UK high street by 2020: Identifying priorities and a framework for action. J. Place Manag. Dev. 2017, 10, 310–348. [Google Scholar] [CrossRef] [Scilit]
  62. Ozuduru, B.H.; Guldmann, J.-M. Retail location and urban resilience: Towards a new framework for retail policy. SAPIENS 2013, 6, 1–13. [Google Scholar]
  63. Kim, M.; Park, E.; Lee, S. Analyzing the effect of Yonsei-ro transit mall policy on commercial revitalization in Seoul, Korea: Using the synthetic control method. J. Korea Plan. Assoc. 2024, 59, 42–56. [Google Scholar] [CrossRef] [Scilit]
  64. Im, B.; Kang, S. Effects of urban regeneration projects on store survival rate in neighborhood commercial areas: The case of South Korea. J. Asian Archit. Build. Eng. 2024, 24, 3264–3280. [Google Scholar] [CrossRef] [Scilit]
Figure 1. Distribution of commercial districts in Seoul.
Sustainability 18 04326 g001
Figure 2. The process of areal weighted interpolation for de facto population data. The black lines represent the boundaries of the output areas, and the red lines indicate the boundaries of the Golmok commercial districts. This figure illustrates the spatial reallocation of population data through the following steps: (a) The original boundaries of output areas (source units); (b) The target boundaries of Golmok commercial districts; and (c) The final reallocated de facto population data after areal-weighted interpolation.
Sustainability 18 04326 g002
Figure 3. Statistical evaluation for the optimal number of clusters (K): Elbow method and Silhouette scores.
Sustainability 18 04326 g003
Figure 4. Short-term (A) and long-term (B) time series clustering results by different K values. Gray lines indicate individual commercial districts, the bold red line indicates the cluster centroid.
Sustainability 18 04326 g004
Figure 5. Short-term time series clustering results. The x-axis represents one week in 6 h intervals. Gray lines indicate individual commercial districts, the bold red line indicates the cluster centroid, and the sky-blue line indicates the overall trend of the centroid.
Sustainability 18 04326 g005
Figure 6. Golmok commercial district types and surrounding land use. Teheran-ro, visible in the inset map, is one of Seoul’s three largest central business districts. The hatched polygons indicate Golmok commercial districts.
Sustainability 18 04326 g006
Figure 7. Long-term time series clustering results. The x-axis represents the entire study period. Gray lines indicate individual commercial districts, the bold red line indicates the cluster centroid, and the sky-blue line indicates the overall trend of the centroid.
Sustainability 18 04326 g007
Figure 8. SHAP summary plot for STTS classification. The x-axis shows mean SHAP value, and colors indicate contributions of features to each cluster.
Sustainability 18 04326 g008
Figure 9. SHAP summary plot for LTTS classification. The x-axis shows mean (SHAP value), and colors indicate contributions of features to each cluster.
Sustainability 18 04326 g009
Table 1. Overview of the de facto population data.
AttributeDescription
Data sourceSMG/KTOA-based de facto population data
Data unitEstimated population count
Spatial unitCensus Output area (Jipgyegu)
Temporal unitHourly estimates
CoveragePhysically present population by age and gender,
including residents and non-residents
Study periodNovember 2019 to 2024
Note: Population counts are reported in decimal values because the dataset is statistically estimated by expanding observed KTOA users to the total population using adjustment factors such as KTOA market share.
Table 2. External variables influencing commercial district vitality.
DimensionVariables
Sales structureRetail density by category, Franchise density, Annual sales by category, Average spending, Weekend sales ratio
Socio-economic statusResident density, Apartment household density, Non-apartment household density, Average monthly income, Average housing price
Attraction facilitiesGovernment office density, Bank density, General hospital density, University dummy, Theater dummy, * Visitor-attracting facility density
Employment structureWorker density
AccessibilitySubway station density, Bus stop density
Notes: Retail density by category and Annual sales by category are divided into three business categories: CS1 (restaurant), CS2 (service), and CS3 (retail). * Visitor-attracting facility refers to clinics, pharmacies, schools excluding universities, department stores, wedding halls, and lodging facilities and other similar facilities that attract visitors.
Table 3. Performance metrics from OOB and OoF.
ModelMethodAccuracyMacro-F1Balanced Accuracy
short-termOut-of-Bag0.5530.5580.557
short-termOut-of-Fold0.5590.4680.478
long-termOut-of-Bag0.4630.2860.304
long-termOut-of-Fold0.4320.3430.361
Table 4. Typology matrix.
LTTS ALTTS BLTTS CLTTS DSum
STTS A12 (1.3%)72 (6.6%)49 (4.5%)34 (3.1%)169 (15.5%)
STTS B39 (3.6%)227 (20.8%)138 (12.7%)125 (11.5%)529 (48.5%)
STTS C33 (3%)106 (9.7%)56 (5.1%)37 (3.4%)232 (21.3%)
STTS D97 (8.9%)24 (2.2%)31 (2.8%)8 (0.7%)160 (14.7%)
sum183 (16.8%)429 (39.4%)274 (25.1%)204 (18.7%)1090 (100%)
Table 5. Confusion Matrix Report (STTS).
PrecisionRecallF1-ScoreSupport
STTS A
(hybrid)
0.3600.1600.210163
STTS B
(residential)
0.6860.7470.715491
STTS C
(commercial)
0.3880.4010.395217
STTS D
(business district)
0.5110.6030.553151
1022 *
Macro-F1: 0.468; Accuracy: 0.559. * Note: 1090 districts in total; 68 excluded due to missing sales amount data → 1022 analyzed.
Table 6. Confusion Matrix Report (LTTS).
PrecisionRecallF1-ScoreSupport
LTTS A
(stability)
0.3450.3800.362150
LTTS B
(decline)
0.5080.7210.596420
LTTS C
(growth)
0.3280.2670.295243
LTTS D
(growth-then-decline)
0.2540.0770.118209
1022 *
Macro-F1: 0.343; Accuracy: 0.432; * Note: 1090 districts in total; 68 excluded due to missing sales amount data → 1022 analyzed.
Disclaimer/Publisher’s Note: The statements, opinions and data contained in all publications are solely those of the individual author(s) and contributor(s) and not of MDPI and/or the editor(s). MDPI and/or the editor(s) disclaim responsibility for any injury to people or property resulting from any ideas, methods, instructions or products referred to in the content.