Article

Spatiotemporal Variation in Vegetation Precipitation Sensitivity and Influencing Factors in the Yellow River Basin from 2000 to 2020


1
School of Civil Engineering and Geomatics, Shandong University of Technology, Zibo 255000, China
2
Shandong Key Laboratory of Eco-Environmental Science for the Yellow River Delta, Shandong University of Aeronautics, Binzhou 256600, China
*
Author to whom correspondence should be addressed.
Sustainability 2026, 18(9), 4301; https://doi.org/10.3390/su18094301
Submission received: 10 March 2026 / Revised: 20 April 2026 / Accepted: 23 April 2026 / Published: 27 April 2026

Abstract

The Yellow River Basin (YRB) serves as a vital ecological security barrier in northern China, and the stability of its ecosystems and the dynamics of its vegetation productivity have significant implications for national ecological strategies and regional sustainable development. This study utilized net primary productivity (NPP) and precipitation data, employing a linear regression method with a 7 × 7 pixel grid and a 4-year spatiotemporal window to quantify vegetation precipitation sensitivity (VPS) in the YRB from 2000 to 2020. Principal component regression was used to assess the relative contributions of environmental and anthropogenic factors to the interannual variability and long-term trends of VPS. The results indicate that during the 2000–2020 period, 19.27% of the YRB experienced significant changes in VPS, with the area showing a decrease (14.99%) far exceeding that showing an increase (4.28%). The downward trend was most pronounced in the midstream (24.2%). Spatially, VPS exhibited a distinct pattern of negative values in the south and positive values in the north, with 36° N serving as the boundary. Among vegetation types, desert vegetation exhibited the highest VPS, while forests and shrubs exhibited the lowest. GDP and temperature were identified as key factors influencing VPS changes. It should be noted that GDP, as a proxy for human activity, has certain limitations; future studies should incorporate more direct indicators of human activity for further validation. This study clarifies the spatiotemporal characteristics and key drivers of VPS in the YRB, providing a scientific basis for regional ecological conservation.

1. Introduction

As global warming continues and vegetation becomes increasingly green [1,2], atmospheric water demand and vegetation water demand are rising across regions. This leads to intensified droughts and a reduction in water available to vegetation, adversely affecting vegetation growth [3]. Terrestrial vegetation productivity is primarily driven by climatic factors and exhibits significant interannual variability [4], the magnitude of this variability can be expressed as the product of vegetation productivity’s sensitivity to climatic fluctuations and the rate of climatic variability [5]. Here, climate is treated as an external driving force, whereas sensitivity is considered an inherent property of vegetation. On a spatial scale, evolutionary adaptation and ecological niche jointly determine the plant types suitable for growth in specific regions, and the physiological mechanisms of different vegetation types also result in distinct response patterns to environmental disturbances [6]. Precipitation is not only the primary source of water required for vegetation growth but also plays a critical role in regulating plant productivity and ecosystem processes (such as the carbon and nitrogen cycles).
Early studies attempted to quantify the effects of precipitation on productivity. However, due to limitations in technology and data availability at the time, they mainly depended on simplified fitting and modeling approaches, which could not accurately or fully capture the response of productivity to precipitation variability [7,8,9]. In the context of global warming, these limitations have become particularly pressing, as the frequency and intensity of extreme drought and precipitation events are projected to rise sharply [10,11], potentially exerting far-reaching impacts on global vegetation growth [12]. Therefore, understanding Vegetation Precipitation Sensitivity (VPS) is of paramount importance. VPS quantifies the direction and magnitude of vegetation’s response to changes in precipitation; generally, the higher the VPS value, the stronger the response. Vegetation sensitivity to precipitation exhibits significant spatial heterogeneity, decreasing overall with increasing annual precipitation [13] and typically being higher in arid regions and lower in humid regions [14,15]. In addition to precipitation, VPS is closely related to ecosystem factors such as temperature [16], soil type [17], vegetation type [18], and physiological characteristics [19]. Increased carbon dioxide concentrations and the fertilizing effects of nitrogen deposition can indirectly reduce VPS by improving plant water use efficiency [20,21,22]. As vegetation cover increases, precipitation sensitivity in some regions shows a decreasing trend [23]. In addition, human activities such as land-use change [24], vegetation restoration, and agricultural irrigation [25] continue to shape the patterns of VPS.
VPS serves not only as an ecological indicator for assessing vegetation’s ability to respond to water stress but is also closely linked to ecosystem resilience and nutrient cycling. Traits-based studies have shown that plant responses along water gradients exhibit nonlinear transitions; drought-tolerant and drought-avoidant species demonstrate significant differences in trait means and variability, and these traits directly influence community productivity and the ability to cope with water stress [26]. At the same time, disturbances (such as land-use changes) further modulate vegetation trait responses, influencing ecosystem recovery trajectories [27]. Furthermore, precipitation fluctuations significantly affect grassland productivity, and extreme events can alter carbon cycling processes [28], while the Rainfall Utilization Efficiency (RUE) framework reveals convergent efficiency patterns among different plant communities during drought years [29]. Collectively, these studies emphasize that vegetation sensitivity to precipitation is regulated by a combination of factors, including climate, soil, vegetation type, and human activities, with significant variations in the underlying mechanisms across different geographical settings.
The Yellow River Basin (YRB) serves as a critical ecological security barrier in China [30] and has long been a focal region for studying vegetation responses to climate change. Wang et al. [31] found that the basin exhibits a significant warming and moistening trend and that the influence of climatic factors on phenological parameters varies markedly across vegetation zones. In a multi-timescale analysis, Zhao et al. [32] found that annual Net Primary Productivity (NPP) is most widely affected by precipitation and exhibits the longest lag period. Wang et al. [33] confirmed that basin-wide precipitation exerts a stronger influence on vegetation growth than air temperature. Some scholars have noted differences in the sensitivity of vegetation in the YRB to precipitation [34], which to some extent reveals the patterns linking vegetation dynamics and water use during the basin’s ecological restoration process. Although previous studies have provided preliminary insights into the response characteristics of vegetation in the YRB to precipitation, systematic research on the spatiotemporal evolution, regional and vegetation-specific variations, and influencing factors of VPS remains limited. In particular, there is a lack of in-depth analysis of the role of human activities in the context of climate change and long-term ecological restoration.
To address these gaps, this study utilizes NPP and precipitation data from 2000 to 2020 and employs a spatiotemporal sliding-window linear regression model to quantify VPS in the YRB. By combining Theil–Sen trend analysis and Mann–Kendall tests, we reveal its spatiotemporal variation characteristics and differences across vegetation types and analyze the relative contributions of driving factors using methods such as principal component regression. Although linear models inherently involve simplifying assumptions, this study introduces a spatiotemporal moving window design to dynamically fit the relationship between NPP and precipitation at the pixel scale. This approach can, to some extent, reflect the spatial heterogeneity and temporal variability of vegetation responses within the region, thereby partially mitigating the limitations of global static linear models. The objectives of this study are to quantify VPS and its spatiotemporal trends across different vegetation types and river basin segments in the YRB using long-term time-series data on vegetation productivity and precipitation, and to analyze the spatial differentiation patterns of VPS driving factors. By integrating the spatial differentiation characteristics of VPS influencing factors across different river segments of the YRB, this study aims to clarify the intrinsic mechanisms of ecosystem water limitation. It provides precise scientific evidence for the ecological conservation and high-quality development of the basin, holding significant practical value, particularly in optimizing ecological restoration strategies and enhancing ecosystem resilience in the context of climate change.

2. Materials and Methods

2.1. Study Area

The YRB is located between 96 and 119° E and 32–42° N, serving as an ecological corridor where China’s ecogeographic elements transition from east to west [35]. The climate gradient within the basin varies significantly. The long-term average precipitation range from 200 to 800 mm, decreasing from southeast to northwest. The average temperatures range from −4 °C to 14 °C, showing a spatial pattern of lower values in the upstream and higher values in the middle and downstream. The topography of the YRB follows a “higher in the west, lower in the east” pattern and consists of three terraces (Figure 1). This topographic differentiation forms the basis for ecological zoning, with substantial differences in topography, vegetation, and human activity among the three terraces. The upstream is mainly located on the first and second terraces, dominated by plateaus and mountains with relatively undulating terrain. Major vegetation types include alpine meadows, shrubs, and desert grasslands. This region has a fragile ecological environment and is prioritized for ecological conservation. The midstream is in the heart of the Loess Plateau on the second terrace, a typical dryland agricultural zone with severe soil erosion. This is a key area for ecological restoration because it is where drought-resistant crops like wheat and corn are grown. The downstream is located on the North China Plain, on the third terrace, which is characterized by flat and open terrain. Cultivated vegetation dominates the landscape, with sparse natural vegetation in riverine wetlands. Human activity is intense, making the region a key area for the coordinated development of agricultural production and ecological conservation.
Since 2000, major ecological restoration projects, such as the conversion of farmland to forests and grasslands, have been implemented within the basin. These projects have extensively covered the midstream of the Loess Plateau and parts of the upstream, effectively improving regional vegetation coverage and exerting a significant impact on vegetation productivity. They represent one of the key factors influencing vegetation dynamics in the study area.

2.2. Data Sources and Processing

Data on temperature, precipitation, soil moisture, and vegetation cover were all obtained from the China National Qinghai–Tibet Plateau Scientific Data Center. Specifically, the precipitation and temperature datasets have a spatial resolution of 0.0083333° and a temporal resolution of monthly intervals; precipitation is measured in millimeters (mm) and temperature in degrees Celsius (°C). The datasets are based on CRU and WorldClim global climate data. They were refined for the Chinese region using the Delta spatial downscaling scheme. The datasets were further validated using observed data from 496 independent meteorological observation stations within China. The results indicate high accuracy, making them suitable for studying large-scale climate-vegetation interactions in river basins. The soil moisture dataset is a product with 1 km spatial resolution and monthly temporal resolution. The vegetation cover dataset is a monthly product for the Chinese region covering the period 2000–2024, with a spatial resolution of 250 m, generated using the monthly maximum averaging method. The NPP data is derived from the MOD17A3HGF Version 6.1 product (National Aeronautics and Space Administration, Washington, DC, USA) released by NASA via the Google Earth Engine (GEE, Google Inc., Mountain View, CA, USA) platform. This product is derived from MODIS sensor observations, with a spatial resolution of 500 m and an annual temporal resolution, expressed in gC·m−2. It covers the period from 2000 to 2020. Its accuracy has been validated by multiple global flux observation stations, making it suitable for studies on the spatiotemporal variations and responses of large-scale vegetation productivity.
Data on climate zones, vegetation types, GDP, and the boundaries of the YRB were obtained from the Data Center for Resources and Environmental Sciences, Chinese Academy of Sciences (Beijing, China). Given the detailed nature of the original vegetation type classification, this study focuses on major vegetation categories, classifying the vegetation in the YRB into eight categories (Figure 1c). The GDP dataset includes only six time points: 2000, 2005, 2010, 2015, 2019, and 2020. In this study, linear interpolation was used to fill in missing annual data at the pixel level. The method is a classic approach for interpolating long-term socioeconomic time series data [36,37]. This study will further analyze this uncertainty in Section 4.4. To ensure spatial consistency, all datasets were preprocessed using ArcGIS 10.8 (Esri, Redlands, CA, USA) and standardized to the WGS_1984_UTM_Zone_48N projection, with a spatial resolution of 1 km and annual average data. Specific data sources are detailed in Table 1.

2.3. Research Methods

In this study, different statistical methods were selected based on the specific objectives and data characteristics of each analysis. For the analysis of temporal trends in VPS, a nonparametric Theil–Sen median trend estimation method was employed in conjunction with the Mann–Kendall test. This method does not rely on the assumption of normal data distribution and exhibits strong robustness against outliers and extreme values, making it suitable for remote sensing time series data that may contain extreme climate events or non-normal distributions. For the calculation of VPS (linear regression within spatiotemporal moving windows) and partial correlation analysis, ordinary least squares linear regression and Pearson’s correlation coefficient were employed. These parametric methods are widely used in studies of vegetation-climate sensitivity. They directly provide easily interpretable slopes and correlation coefficients. Furthermore, given the large sample size within the moving windows used in this study, the impact of slight deviations from a normal distribution on the results is limited, as per the Central Limit Theorem. To address potential multicollinearity among the multiple factors, Principal Component Regression was further applied to ensure the robustness of the contribution rates of the driving factors.

2.3.1. Calculation of Vegetation Precipitation Sensitivity

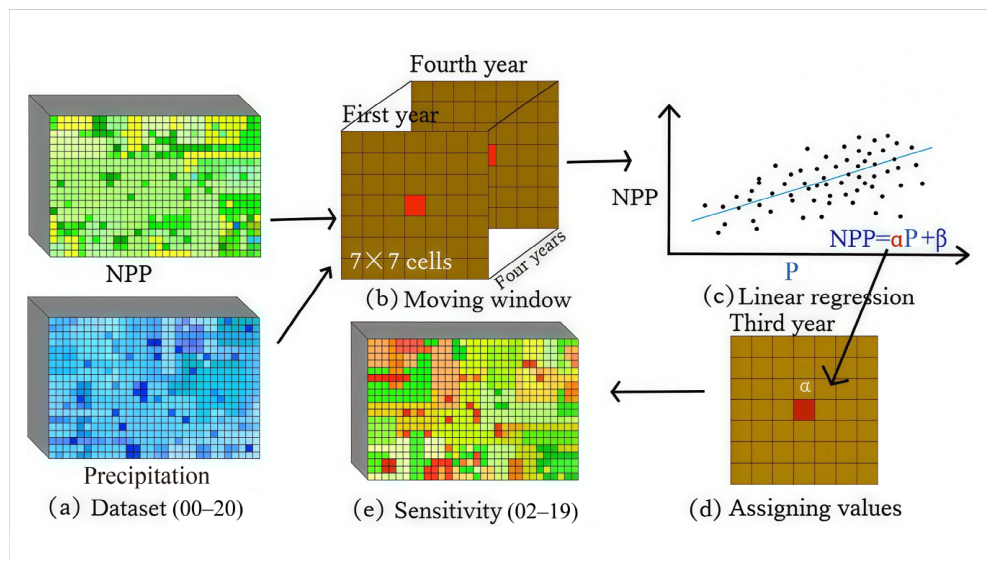
In this study, a spatiotemporal sliding window approach was employed to perform linear regression analysis on precipitation and NPP data within each window (Figure 2). The regression slope was assigned to the central pixel of the corresponding window, and the VPS index was then calculated on a pixel-by-pixel basis. During the calculation process, if more than two-thirds of the pixels within a window were invalid values (NoData) [34,38], the regression for that window was skipped. A larger absolute value of the regression slope indicates higher sensitivity of NPP to precipitation at the central pixel; a positive slope represents positive VPS, meaning that NPP increases with increasing precipitation, while a negative slope represents negative VPS, meaning that NPP decreases with increasing precipitation.
To examine the impact of window parameters on the robustness of the results, this study conducted a parameter sensitivity analysis, testing the significance (p-value) of the regression slope and the goodness-of-fit (R2) under different combinations of temporal and spatial windows. Based on the multi-year average precipitation dataset for the YRB, 10,000 pixels (including NoData values) were randomly selected to explore all combinations of time windows ranging from 2 to 8 years and spatial windows ranging from 3 × 3 to 11 × 11 pixels. The results indicate that, across all spatiotemporal window combinations, the number of pixels with significant regression results increases as the window scale increases (Table 2), while the regression goodness of fit exhibits an opposite trend (Table 3). Among these, the combination of a 7 × 7 spatial window and a 4-year temporal window yielded a proportion of significant pixels of 84.93% and an average R2 of 0.29. Balancing the requirements of minimizing window scale, maximizing the proportion of significant pixels, and ensuring reasonable regression fit, this combination demonstrated the optimal balance. Therefore, this study ultimately selected the combination of a 7 × 7 spatial window and a 4-year temporal window for subsequent analysis.

2.3.2. Theil–Sen Median Trend Analysis and Mann–Kendall Test

The Theil–Sen median estimate is a nonparametric method used to estimate the trend in time series data [39]. Its advantage lies in its insensitivity to outliers, allowing it to effectively handle time series data containing extreme values. The Theil–Sen median trend analysis effectively reduces the influence of extreme values by calculating the slopes of all data pairs in the time series and taking the median of these slopes as the overall trend slope β.
β = median x j x i j i
In Equation (1): xj and xi represent the observed values for the jth and ith years, respectively (j > i). A β greater than 0 indicates an upward trend, while a β less than 0 indicates a downward trend. Apply this method to the VPS time series data from 2000 to 2020 to calculate the magnitude of the trend.
The Mann–Kendall test is a nonparametric statistical method used to assess the significance of trends in long-term time series [40]. The advantage of this method is that the data do not need to follow a specific probability distribution, and it avoids the influence of outliers.
s g n ( x j x i ) = 1 ,   x j x i > 0 0 ,   x j x i = 0 1 ,   x j x i < 0
S = i = 1 n 1 j = i + 1 n sgn ( x j x i )
Z = S 1 var ( S ) , S > 0 0 , S = 0 S + 1 var ( S ) , S < 0
var ( S ) = n ( n 1 ) ( 2 n + 5 ) 18
In Equations (2)–(5), sgn denotes the sign function. This test is based on the null hypothesis H0. At a given significance level α, if |Z| > Z1−α/2, the null hypothesis is rejected; otherwise, it is accepted. In this study, α is set to 0.05.
This study employed Theil–Sen estimates combined with the Mann–Kendall test to conduct trend analysis on NPP, precipitation, and VPS. The Theil–Sen estimation was used to quantitatively calculate trend slopes at the pixel and regional scales, while the Mann–Kendall test was employed to assess trend significance. Through pixel-by-pixel calculations of multivariate time series from 2000 to 2020, this study achieved dual identification of rate of change and statistical significance, providing a robust basis for the analysis of long-term trends in ecohydrological processes.

2.3.3. Correlation Analysis

In multivariate correlation analysis, the relationships among different variables are highly complex and may be influenced by multiple factors. Therefore, simple linear correlation coefficients do not accurately reflect the true nature of the relationship between two variables. Partial correlation analysis is used to assess the net correlation between two variables while controlling for the effects of other variables [41,42].
r y 1 , 2 = r y 1 r y 2 r 12 ( 1 r y 2 2 ) ( 1 r 12 2 )
In this context, ry1,2 denotes the net partial correlation coefficients between x1 and y after controlling for the effect of x2 on y. The magnitude of the absolute value of the partial correlation coefficient reflects the degree of linear correlation between variables; a larger absolute value indicates a stronger linear relationship, while a smaller value indicates a weaker one. This study employs partial correlation analysis to calculate the partial correlation coefficients of the various driver variables associated with VPS and uses t-tests to determine their significance. Spatial-scale partial correlations were calculated pixel by pixel from the raster image, where each pixel contained annual observations for multiple variables from 2000 to 2020. This method provides an intuitive representation of the spatial differentiation patterns of VPS under the influence of multiple factors, facilitating the identification of dominant association patterns at the regional scale. However, this method struggles to avoid the effects of multicollinearity among independent variables and cannot quantitatively distinguish the relative contributions of individual factors.

2.3.4. Selection of Influencing Factors and Driving Force Analysis of VPS

This study selected five influencing factors: temperature (AT), SPEI, soil moisture (SM), vegetation cover (FVC), and GDP. Among these, temperature, as a key indicator of climate change, primarily influences vegetation sensitivity by altering vegetation transpiration and soil moisture evaporation [43]. SPEI integrates precipitation and potential evapotranspiration to characterize regional water balance and serves as a core indicator of drought stress [44]. Soil moisture acts as a key mediator between precipitation input and vegetation water use, regulating sensitivity through its buffering capacity [45]. FVC reflects vegetation density and community stability; as an intrinsic attribute, it influences sensitivity primarily by enhancing soil water-holding capacity and plant water-use efficiency [46]. GDP indirectly quantifies human intervention in ecosystems through economic development, including irrigation, artificial water replenishment, and land-use changes, all of which exert varying effects on vegetation [47].
In multifactor-driven analyses, multicollinearity among independent variables can compromise the stability and reliability of regression results. The results showed that there was a small number of pixels with high multicollinearity (VIF > 5) within the study area. To ensure the robustness of the pixel-by-pixel regression results and to minimize any effects of multicollinearity among the influencing factors, this study employed principal component analysis (PCA) and principal component regression (PCR) at the pixel level to ultimately identify the relative importance of each driving variable within each pixel.
Standardize the five influencing factors for each pixel, calculate the covariance matrix among the variables based on the standardized matrix, and compute the eigenvalues. The larger the eigenvalue, the more original information the corresponding principal component contains. Using the criterion that the cumulative variance explained must be ≥85%, select the first m eigenvectors corresponding to the eigenvalues and construct the principal component loading matrix. Calculate the scores for each sample. The score for each principal component reflects the position and trend of the original variable in the new principal component space, while the loadings indicate the linear relationship between the principal component and the input variables.
Z i j = X i j X j ¯ σ j
Z n × p = 1 n 1 Z T Z
F k = Z U k
α j k = U j k · λ k
In Equations (7)–(10), where z′ij represents the standardized data, Xij is the raw value of the jth variable for the ith sample, Xj is the mean of the jth variable, and σj is the standard deviation of the jth variable, the standardized matrix Z (n × p) is obtained; Z′n×p is the covariance matrix of the standardized data. solve for the eigenvalues λ and the eigenvector matrix U of the covariance matrix; Fk denotes the score vector for the kth principal component, and Uk denotes the kth column eigenvector; αjk is the principal component weight (the loading of the jth original variable on the kth principal component).
Perform multiple linear regression analysis using VPS as the dependent variable and principal component scores (Principal Component Regression, PCR) to obtain model fit indices (R-squared, Root Mean Square Error [RMSE], and significant p-values). By multiplying the regression coefficients by the principal component loading matrix, we obtain the regression coefficients corresponding to the original variables. We then calculate the proportion of the absolute value of a factor’s regression coefficient relative to the sum of the absolute values of all factors’ regression coefficients, which represents the relative contribution of each influencing factor to changes in VPS:
Y = β 0 + β 1 F 1 + β 2 F 2 + + β m F m + ε
γ j = k = 1 m β k α j k
Contribution j = γ j j = 1 p γ j × 100 %
β0 is the intercept term; βk is the regression coefficient corresponding to the principal component; and ε is the random error; γj is the total contribution coefficient of the original variable; and Contributionj is the relative contribution of the jth factor to the VPS of this pixel.

3. Results

3.1. Patterns of NPP Changes in the YRB, 2000–2020

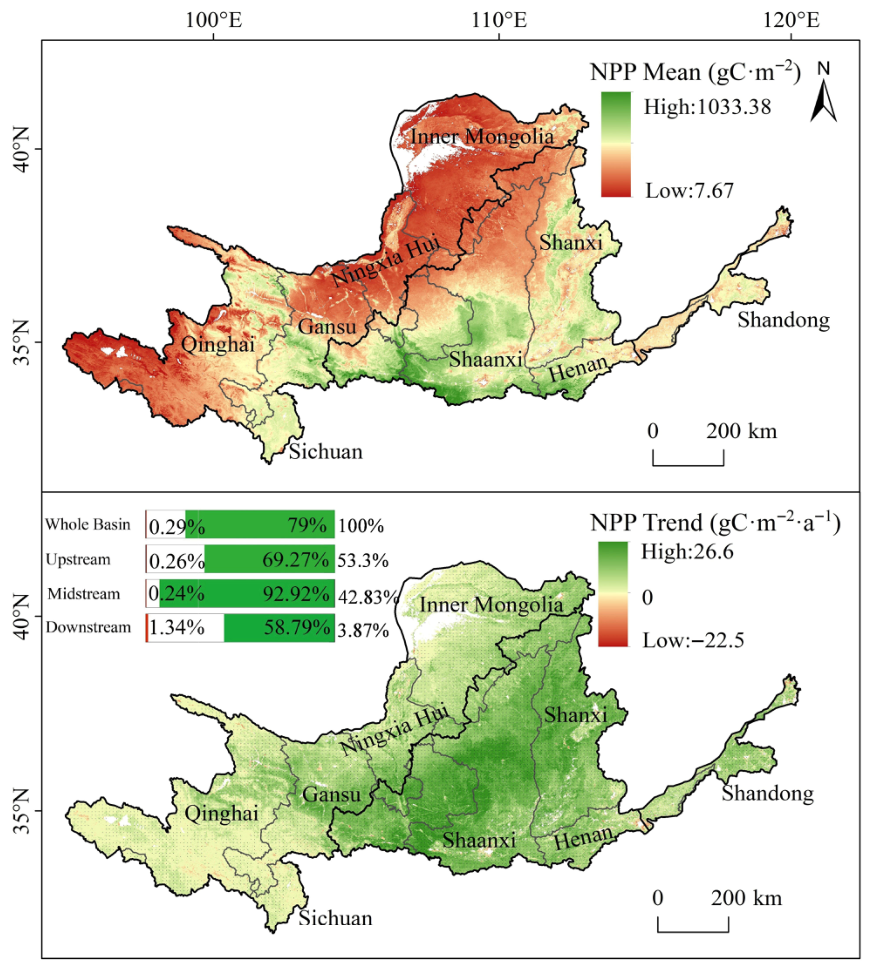
Figure 3 illustrates the spatial distribution and trend changes in NPP data in the YRB from 2000 to 2020. The spatial distribution of NPP mean values exhibits a pattern of “higher in the south and lower in the north, higher in the center and lower in the east and west.” Mean values range from 7.67 to 1033.38 gC·m−2, with low values primarily distributed in the Yellow River headwaters and the grasslands and shrublands of the Ordos Loop; high values are concentrated in areas dominated by cultivated vegetation and broadleaf forests, such as southern Shaanxi.
Analysis of NPP temporal trends indicates that since 2000, approximately 79% of the YRB has exhibited a significant increasing trend in NPP (Mann–Kendall test, p < 0.05), while only 0.29% of the area showed a significant decrease in vegetation NPP. These trend characteristics are consistent with previous studies [32,48]. Meanwhile, the proportion of areas showing an upward trend in the midstream (92.92%) was significantly higher than in the upstream (69.27%) and downstream (58.79%), with the maximum increase rate of 26.58 gC·m−2·a−1 primarily located in central Shaanxi Province. Areas with significant declines in the upstream and southern midstream were scattered. Overall, the NPP growth trend is robust; however, the uncertainty regarding localized areas of decline requires further verification using higher-resolution data.

3.2. Precipitation Pattern in the YRB During 2000–2020

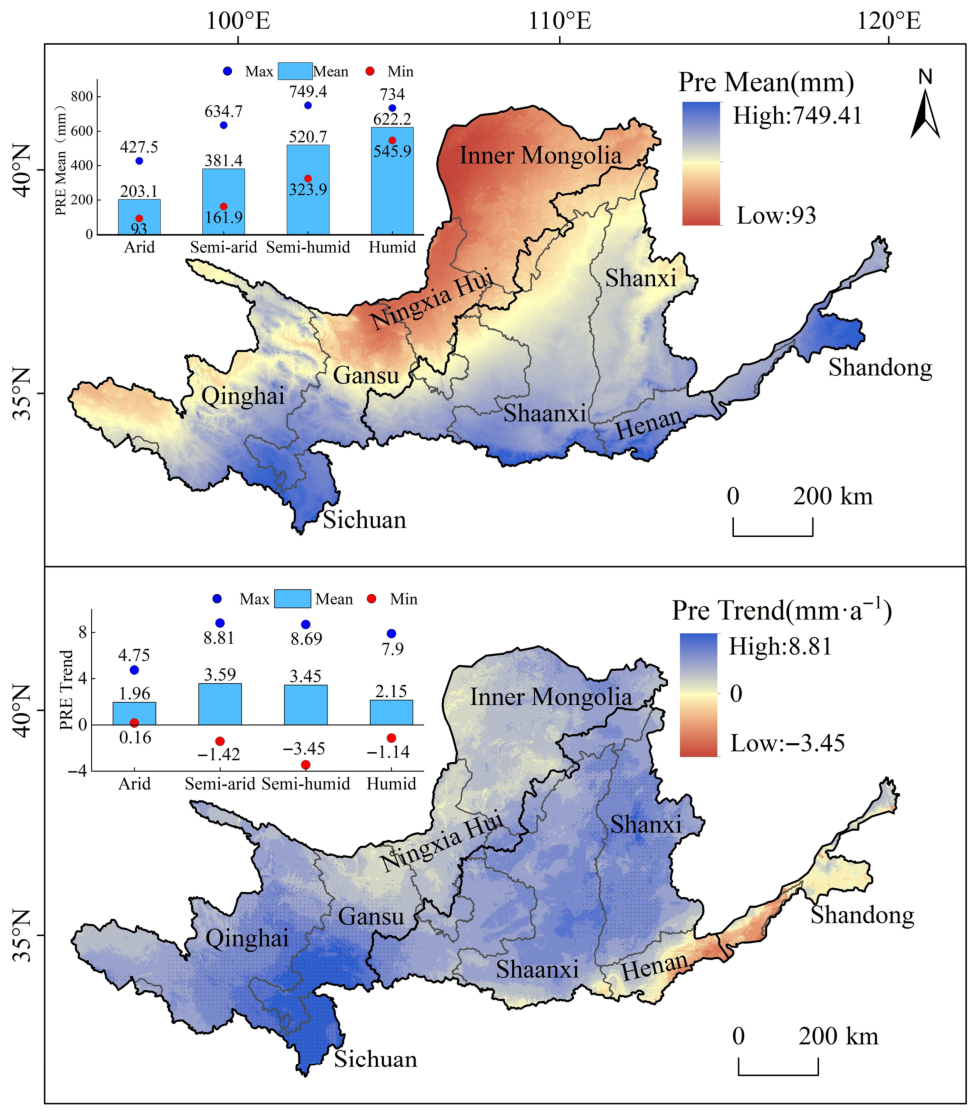
From 2000 to 2020, the average precipitation in the YRB generally showed a trend of gradually increasing from northwest to southeast (Figure 4). The arid regions in the northwest had the lowest average precipitation, at approximately 93 mm; high precipitation values were mainly concentrated in the semi-humid zone in the southern part of the YRB, specifically the Qinghai–Tibet Plateau and the middle and downstream near the Yellow Sea, with a maximum of 749.4 mm. The downstream of the Yellow River borders the Yellow Sea; influenced by factors such as the exchange of moisture between land and sea, precipitation is more abundant there. Analysis of temporal trends indicates that precipitation changes in the YRB are predominantly characterized by a significant increase (Mann–Kendall test, p < 0.05), concentrated in southern Qinghai and Gansu provinces and most of Shanxi Province, with relatively large increases observed in these areas.
Precipitation trends vary significantly across different climatic zones. The semi-arid zone (3.59 mm·a−1) and the semi-humid zone (3.59 mm·a−1) both exhibit higher mean values, with ranges of 10.23 and 12.14, which are substantially greater than those of the arid zone (4.59). Precipitation trends in the arid zone (1.96 mm·a−1) and the humid zone (2.15 mm·a−1) show weaker increases, but overall, they still exhibit a predominantly increasing trend. Negative precipitation trends were observed in the semi-arid, semi-humid, and humid zones, indicating that precipitation is decreasing in some local areas. Precipitation trends in the arid zone are generally increasing (minimum 0.158 mm·a−1, maximum 4.746 mm·a−1), but changes in the extent and severity of aridity are relatively complex.

3.3. Spatial Distribution of VPS Mean Values from 2000 to 2020

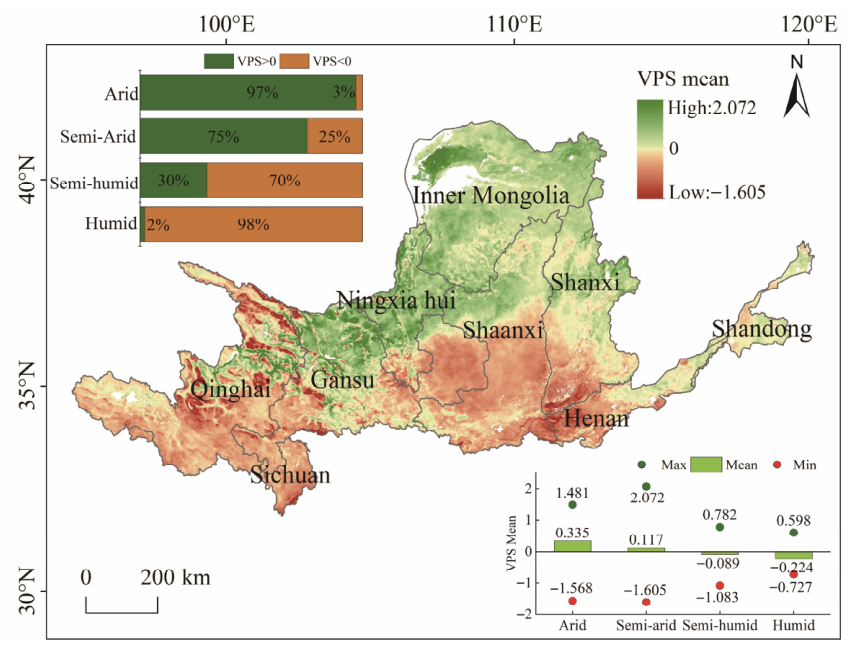
From 2000 to 2020, the mean VPS in the YRB ranged from −1.605 to 2.072 gC·m−2·mm−1, exhibiting a distribution pattern characterized by lower values in the south and higher values in the north (Figure 5). North of 36° N, VPS was generally positive; south of 36° N, VPS was predominantly negative. Statistical analysis of VPS across different climate zones indicates that positive sensitivity was primarily concentrated in arid and semi-arid regions, accounting for 97% and 75% of the total area, respectively, with mean VPS values of 0.335 gC·m−2·mm−1 and 0.117 gC·m−2·mm−1; negative sensitivity is mainly concentrated in semi-humid and humid zones, accounting for 70% and 98% of the total area, respectively, with mean VPS values of −0.089 gC·m−2·mm−1 and −0.224 gC·m−2·mm−1. High sensitivity is mainly concentrated in Bayannur City, Inner Mongolia, and is scattered across Gansu and the Ningxia Hui Autonomous Region; low sensitivity is mainly concentrated in the riverine mountainous areas at the junction of the middle and downstream of the Yellow River and is scattered across Qinghai Province.

3.4. Spatiotemporal Change Trends of VPS in the YRB from 2000 to 2020

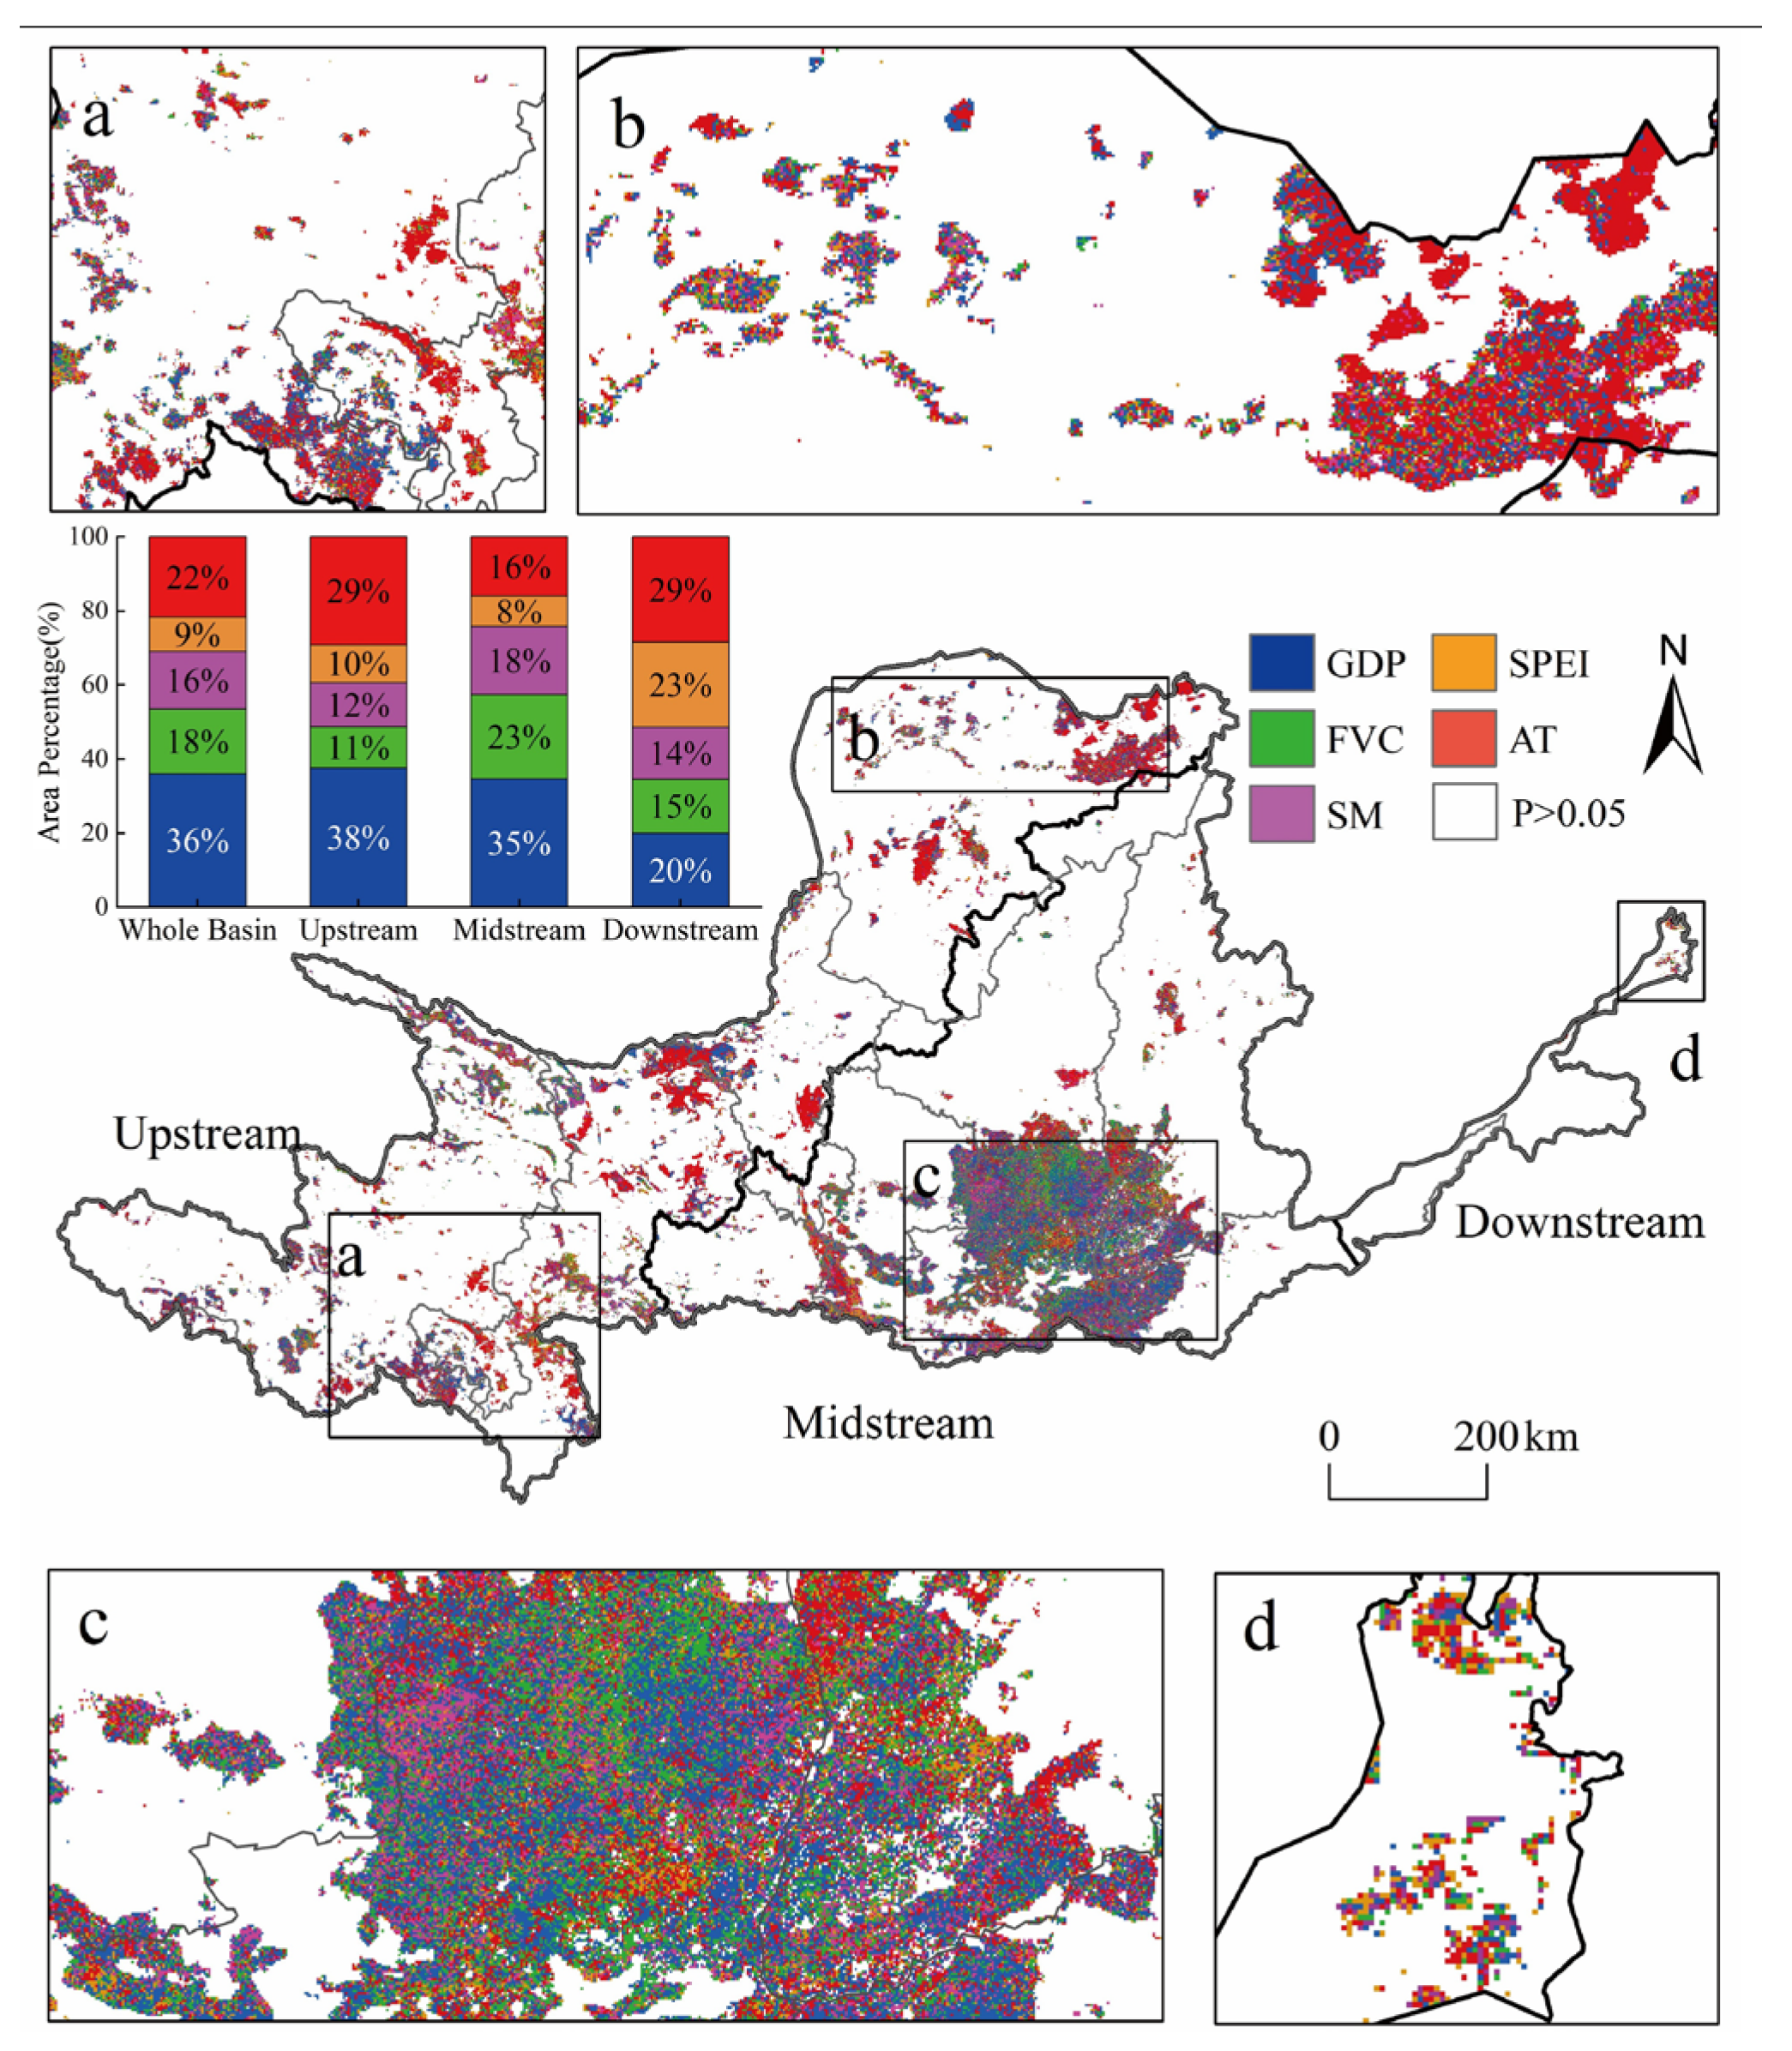
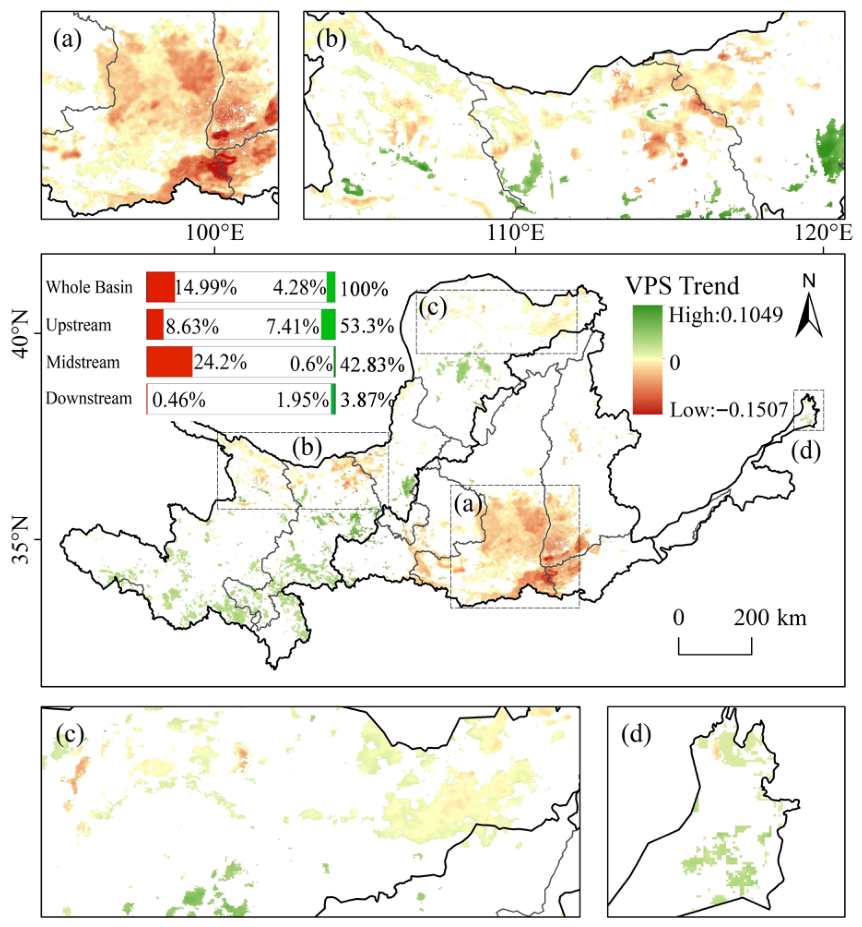
During the period from 2000 to 2020, approximately 19.27% of the area across the entire YRB exhibited a significant change in the sensitivity of NPP to precipitation, while 80.73% showed no significant change (Figure 6, Mann–Kendall test, p < 0.05). Of the areas showing a significant change, 14.99% exhibited a decreasing trend, while only 4.28% showed an increasing trend.
The proportion of areas showing a significant negative trend in VPS was highest in the midstream (24.2%) > upstream (8.63%) > downstream (0.46%), while the proportion showing a positive trend was highest in the upstream (7.41%) > downstream (1.95%) > midstream (0.6%). The midstream had the highest proportion of negative trends, primarily concentrated in the southern Loess Plateau (Figure 6a), followed by the upstream, where negative trends were mainly distributed in northern Qinghai and Gansu provinces (Figure 6b) and northern Inner Mongolia (Figure 6c). The upstream region exhibited the highest proportion of positive trends, with positive and negative trends (7.41% and 8.63%) being roughly equal; the positive trends were mainly distributed in the upstream Qinghai–Tibet Plateau and Ordos City in Inner Mongolia. The downstream region had a relatively small proportion of significant VPS trend changes, with the Yellow River Delta at the estuary being the area where positive trends were more concentrated (Figure 6d).

3.5. VPS and Its Change Trends of Different Vegetation Types

In areas of the YRB where VPS showed significant changes (Mann–Kendall test, p < 0.05), there were significant differences in the area proportions, VPS statistical characteristics, and trends of the eight major vegetation types (Table 4). In terms of area proportion, agricultural cultivated vegetation (ACV) accounted for the highest share at 36.9%; grassland (Grass) followed at 29.4%; broadleaf forest (BF), shrubland (Shrub), and coniferous forest (CF) accounted for 12.0%, 10.1%, and 6.6%, respectively; desert (Desert) accounted for 3.9%; and wetlands (WET) and alpine vegetation (Alpine) had the smallest shares, at only 0.5% and 0.7%, respectively.
Regarding VPS statistical characteristics, significant differences were observed among different vegetation types. Broadleaf forests exhibited the highest VPS maximum value (1.518 gC·m−2·mm−1), followed by coniferous forests (1.514 gC·m−2·mm−1), with deserts and grasslands close behind, indicating that natural vegetation such as forests, deserts, and grasslands responds strongly to precipitation fluctuations under extreme conditions. In terms of overall mean values, deserts (0.347 gC·m−2·mm−1), grasslands (0.101 gC·m−2·mm−1), and agricultural vegetation (0.071 gC·m−2·mm−1) exhibited positive VPS values, indicating relatively high overall sensitivity; while coniferous forests, broadleaf forests, shrublands, wetlands, and alpine vegetation exhibited lower or negative mean values, indicating a generally weaker response. In terms of trends, there are significant differences in both the direction and magnitude of trends across vegetation types. Decline trends were strongest in broadleaf forests (−0.047 gC·m−2·mm−1·a−1), followed by coniferous forests (−0.035 gC·m−2·mm−1·a−1), deserts (−0.034 gC·m−2·mm−1·a−1), shrublands (−0.028 gC·m−2·mm−1·a−1), and agricultural vegetation (−0.029 gC·m−2·mm−1·a−1) all showed decreasing trends, indicating that the precipitation sensitivity of these vegetation types is generally weakening. In contrast, the trend for grasslands remained essentially stable (mean 0.0001 gC·m−2·mm−1·a−1), making it the most stable vegetation type in the basin; wetlands (0.018 gC·m−2·mm−1·a−1) and alpine vegetation (0.014 gC·m−2·mm−1·a−1) showed slight upward trends, with sensitivity increasing slightly. Based on a comprehensive analysis combined with area proportions, cultivated agricultural vegetation, broad-leaved forests, and coniferous forests, which together account for nearly 55.5% of the area showing significant VPS changes, jointly contributed to the overall decline in VPS across the basin, while grasslands, accounting for 29.4% of the same area, played a stabilizing role in regional sensitivity.
Overall, the VPS pattern and trend in the YRB are primarily influenced by the extensive distribution of cultivated agricultural vegetation and grasslands. Natural vegetation, such as forests and deserts, mainly exhibits decreasing sensitivity, while wetlands and alpine vegetation show a slight increase. The differences among these vegetation types reflect spatial variations in vegetation functions, water use strategies, and the impacts of human activities.

3.6. Analysis of Influencing Factors on VPS

3.6.1. Partial Correlation Analysis

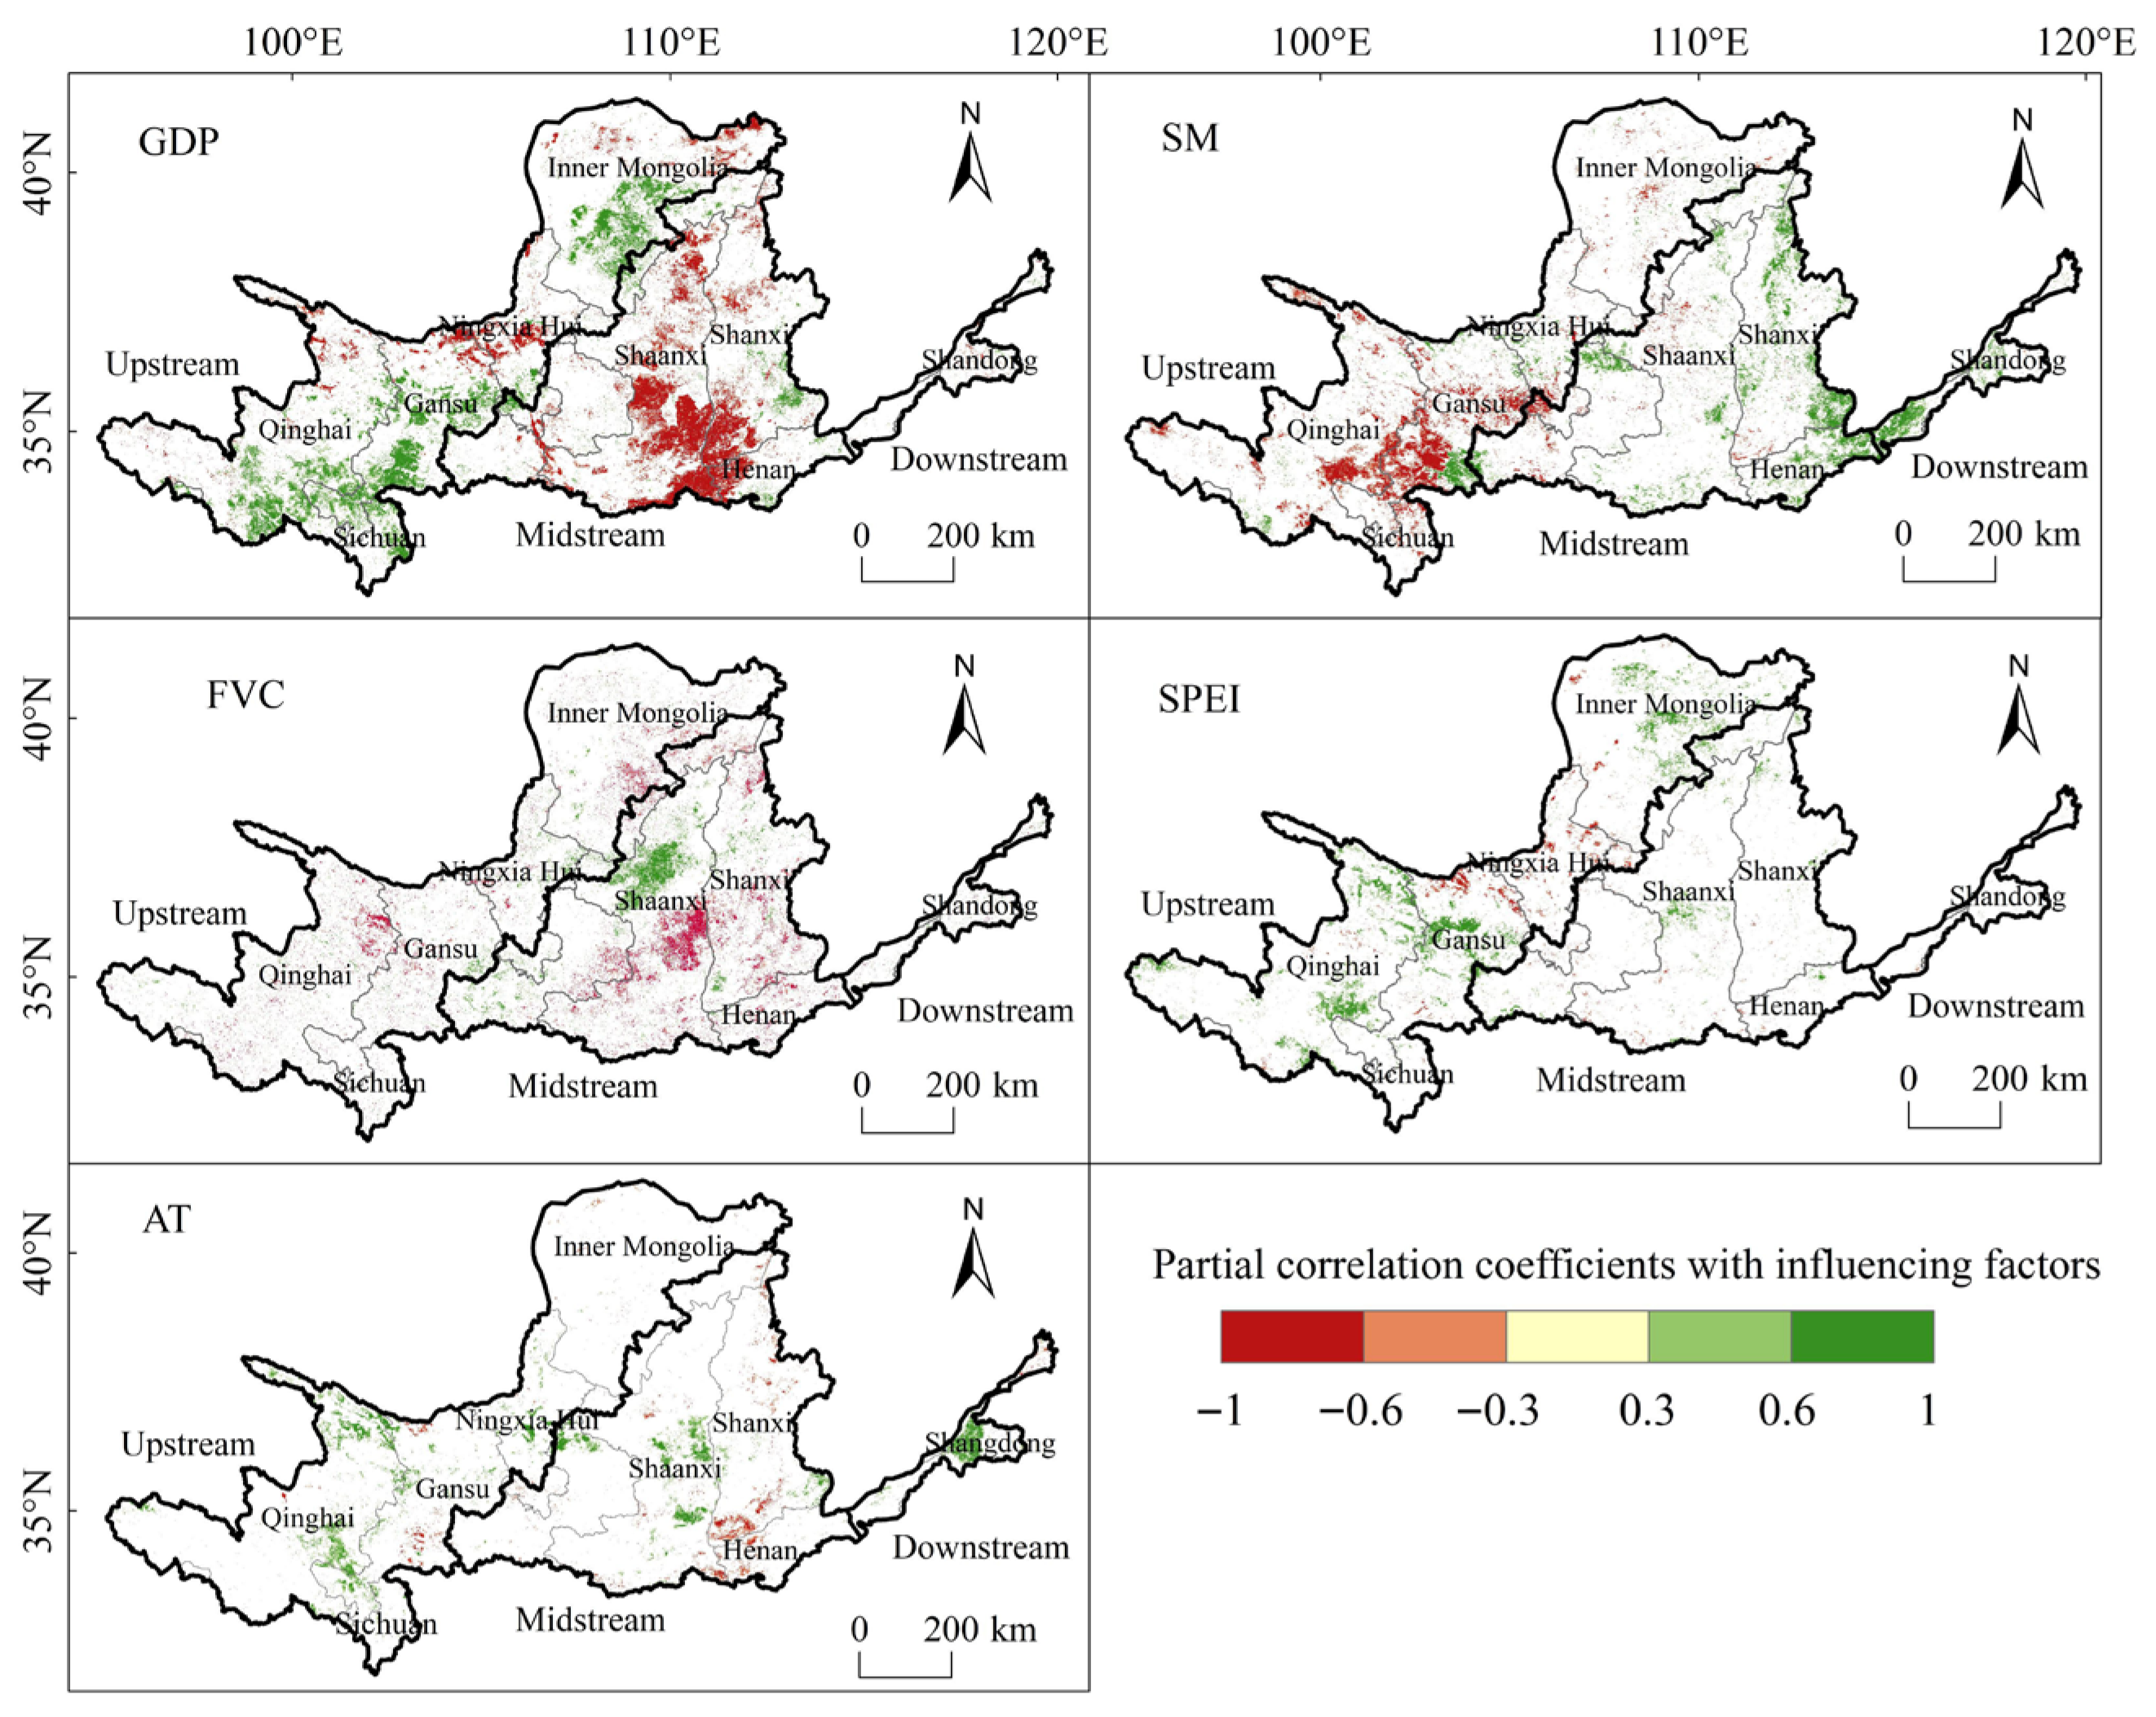
Between 2000 and 2020, the VPS in the YRB exhibited different correlation patterns with influencing factors (Figure 7). The largest area of significant correlation was with GDP, accounting for 21.28% of the basin. Positive correlations were concentrated in the upstream (9.9% of the total area), whereas negative correlations were predominant in southwestern Shanxi (11.38%). Additionally, the significant correlation between SM and VPS reached 13.28%, with positive correlations concentrated in the midstream and downstream, whereas the upstream mainly exhibited negative correlations. Other factors, such as FVC, SPEI, and AT, had a smaller significant correlation area with VPS, covering 8.8%, 6.32%, and 5.94% of the total basin area, respectively.

3.6.2. Relative Contribution of Influencing Factors to VPS

PCA-PCR analysis of pixels showing significant VPS changes across the entire basin revealed an average p-value of 0.121, a coefficient of determination (R2) of 0.55, and an RMSE of 0.212, indicating a high degree of model reliability. The results show that among the significant trends in VPS across the entire YRB (Figure 8), GDP is one of the dominant factors, acting as the primary influencing factor in 35.1% of the basin’s area. This is followed by temperature (21.2%), vegetation cover (19.6%), and soil moisture (15.1%), while the SPEI had the lowest proportion of dominant areas (9.0%). In the upstream of the basin, significant trends in VPS are primarily influenced by GDP (36.7%) and temperature (28.2%), which together dominate over 60% of the total area. However, the influence of these two factors on significant VPS trends exhibits distinct spatial heterogeneity. In the midstream, VPS changes were predominantly negative and showed a gradually increasing negative sensitivity. GDP was the dominant factor in 34.5% of the area, followed by vegetation cover (23.3%) and soil moisture (18.3%) (Figure 8c). The Yellow River Delta in the downstream is a region where positive trends in VPS are concentrated, but the driving factors exhibit a “fragmented” patchwork distribution (Figure 8d), with no contiguous areas dominated by a single factor.

4. Discussion

4.1. Spatial Patterns of VPS in the YRB

The results of this study indicate that VPS in the YRB varies widely, ranging from −1.605 to 2.072 gC·m−2·mm−1; high sensitivity is primarily concentrated in arid regions, while low sensitivity is mainly found in semi-humid regions. This finding is consistent with globally reported higher sensitivity in drier ecosystems [49], which may be attributed to the generally lower precipitation in arid regions, where vegetation growth is primarily limited by water availability. In contrast, in more humid regions, plant growth is often limited by other resources (such as nutrients and light) rather than water availability; consequently, vegetation productivity is relatively insensitive to precipitation variability. For instance, vegetation on the Qinghai–Tibet Plateau is typically constrained by thermal conditions, such as radiation and temperature. Thus, high precipitation is often accompanied by low radiation and low temperatures, resulting in lower sensitivity [50,51].
VPS also varies significantly among different vegetation types, with these differences largely dependent on the degree of aridity. For example, grassland and desert vegetation, which are primarily distributed in arid regions, exhibit higher VPS compared to other vegetation types, indicating that they are more susceptible to future precipitation fluctuations. Wetlands and alpine vegetation generally exhibit negative sensitivity. This may be because alpine vegetation and wetlands are less constrained by water availability but are more limited by other factors. For example, alpine vegetation has a poor soil water-holding capacity [52] and is constrained by low temperatures; even if precipitation increases, it is difficult to utilize it effectively, resulting in “physiological drought.” Broadleaf forests exhibit negative VPS. This ecosystem type is primarily distributed in high-altitude mountainous regions of the midstream, where the cold climate constrains plant growth. Annual precipitation in these areas is typically high but accompanied by low solar radiation, leading to reduced vegetation productivity.
From an ecological mechanism perspective, these differences also stem from the divergence in plant functional traits and water use strategies [53]. Forest ecosystems with deep root systems and high water-use efficiency exhibit more stable productivity and lower VPS; in contrast, desert and grassland ecosystems with shallow root systems rely on precipitation pulses, resulting in higher VPS and greater fluctuations [54]. This indicates that the spatiotemporal patterns of VPS are not merely statistical outcomes but rather the result of combined regulation by vegetation type, root distribution, and water adaptation mechanisms [55,56].

4.2. Temporal Dynamics and Influencing Factors of VPS in the YRB

The significant spatiotemporal trends in VPS observed in the YRB in this study indicate that VPS in the basin’s ecosystems has declined markedly over the past two decades, a finding that is consistent with existing research, while also exhibiting certain differences. Compared with the results of Yu et al. [34], there is a slight spatial shift in the location of the significant decline in the midstream; this discrepancy may be attributed to differences in the study periods and the sources of precipitation data. The differences are even more pronounced when compared with the nationwide VPS study by Miao et al. [41], primarily due to methodological differences, which also constitutes the main scientific contribution of this study. Most previous studies have performed sensitivity analyses using different time windows on a single pixel, neglecting the spatial continuity of vegetation response; this study employs a 7 × 7 pixel grid and a 4-year spatiotemporal sliding window to fully utilize spatial autocorrelation information, thereby enhancing the robustness and ecological significance of VPS estimates. This design addresses the shortcomings of traditional methods, which overlook spatial coupling effects, and more accurately reflects the continuous response pattern of vegetation to precipitation rather than discrete pixel-level results.
The driving factors behind significant changes in VPS in the YRB exhibit distinct spatial heterogeneity. Areas with high GDP influence account for the largest proportion, followed by temperature and vegetation cover. This pattern differs significantly from the climate-dominated patterns observed in most regions globally. From 2001 to 2018, global terrestrial ecosystem VPS showed an overall significant downward trend, primarily attributed to increased annual precipitation, a mechanism particularly pronounced in North America and Europe [18]; whereas the significant decline in VPS of tropical dryland vegetation was mainly driven by combined changes in temperature and soil moisture [38]. In contrast to these global or regional patterns, the YRB implemented long-term, large-scale ecological restoration projects from 2000 to 2020, with the investment in and implementation of these projects highly dependent on the level of regional economic development. An increase in GDP means that the government can allocate more funds to afforestation, irrigation infrastructure construction, and ecological conservation, thereby reducing vegetation’s reliance on natural precipitation.
In the upstream Qinghai–Tibet Plateau region, GDP and temperature jointly contribute to a shift from negative to positive trends in VPS. This suggests that increased regional economic activity and climate warming may have extended the growing season and improved the fundamental conditions for vegetation growth, thereby enhancing VPS. However, whether these positive changes will lead to sustainable environmental improvements that benefit ecosystems and people’s livelihoods remains an open question. However, in the upstream of northern Inner Mongolia, rising temperatures may enhance the CO2 fertilization effect [21], improve water-use efficiency [57], and promote the growth of drought-tolerant plants, serving as key factors in reducing VPS. In the midstream of southern Shaanxi, VPS primarily exhibits a negative trend, which may be related to the spatial distribution of the region, dominated by broadleaf forests and cultivated vegetation. The overall VPS of forest vegetation (coniferous and broadleaf forests) shows a decreasing trend, which is associated with increased vegetation cover and the stabilization of community structure. For cultivated vegetation, in addition to the impact of increased precipitation, agricultural management practices also lead to a reduction in VPS. Over the past few decades, with the development of biotechnology and breeding techniques, the drought resistance of crop species has continuously improved [58], reducing the sensitivity of agricultural productivity to precipitation anomalies. Furthermore, management practices such as irrigation can reduce the dependence of crop growth on precipitation. These mechanisms collectively explain the predominantly declining trend in VPS observed in areas with concentrated forest and cultivated vegetation within the basin. The overall trend for grasslands remains stable; this result implies that climate change has a reduced impact on the stability of vegetation productivity and carbon sinks in grassland ecosystems.

4.3. Implications for Sustainable Management of the YRB

The findings of this study provide direct support for ecological conservation, climate change adaptation, and sustainable development in the YRB, contributing to SDG 13 (Climate Action), SDG 15 (Life on Land), and the goal of high-quality development in the basin. A significant increase in VPS in areas with ample precipitation indicates that vegetation growth is being increasingly driven by positive water-heat effects; a significant increase in water-scarce regions should be prioritized for drought monitoring and early warning; areas with a significant decrease in VPS are often affected by ecological engineering and irrigation systems, and ecosystem stability can be enhanced by optimizing water resource allocation and vegetation structure. Based on the research findings, the following targeted management recommendations are proposed:
(1)
Upstream (Qinghai–Tibet Plateau and Inner Mongolia): Focus on grassland conservation and moderate grazing to maintain the natural vegetation’s drought resistance and adaptability to precipitation. Improve supporting measures such as grassland ecological compensation, livelihood diversification for herders, and support for green livelihoods to enhance the social acceptance and sustainability of conservation policies.
(2)
Midstream (Loess Plateau): Continue to advance the conversion of farmland to forests and grasslands, prioritizing native tree species with high water-use efficiency to balance soil conservation and water conservation [59]. Strengthen farmer-led participatory governance, establish mechanisms for sharing ecological benefits, and ensure both farmers’ livelihoods and the stability of policy implementation.
(3)
Lower Yellow River Delta region: Strengthen wetland protection, control human disturbances, and maintain ecosystem stability and hydrological connectivity [60,61,62,63]. At the same time, promote community co-management and eco-friendly production and lifestyles to reduce conflicts between conservation and development.
(4)
Incorporate VPS into the basin’s long-term ecological monitoring indicator system to evaluate ecological restoration outcomes and support climate adaptation and precision ecological governance [64]. Promote community-based participatory monitoring and co-management to achieve synergy between ecological conservation and livelihood improvements, thereby enhancing the sustainability of governance.

4.4. Methodological Limitations and Uncertainties

Several uncertainties in this study require explicit clarification. The use of linear regression within a moving window simplifies the potential nonlinear relationships between NPP and precipitation, such as saturation thresholds, water-stress effects, and bell-shaped curves. Although the spatiotemporal window mitigates this bias to some extent, it may still introduce potential errors. As a macroeconomic aggregate indicator, GDP cannot accurately reflect human activities that influence VPS; for example, it cannot directly distinguish between different types of disturbances, such as irrigation, land-use changes, and urban expansion. Therefore, in this study, GDP is used solely to explore the relative contributions of climate and human activities to NPP changes at a large spatial scale. This study employs linear interpolation for non-node years based on the assumption that economic activity exhibits a linear growth trend over the study period. While this approach captures the general growth pattern, it may smooth out the actual interannual fluctuations in economic activity, thereby affecting the ability to attribute human activity to VPS to some extent. The MOD17A3 NPP product contains estimation errors in areas with sparse vegetation and mountainous regions; these errors may affect VPS calculations and attribution results.
Furthermore, time lags are common between precipitation and vegetation responses. By using annual cumulative precipitation and annual NPP, this study may have overlooked lagged responses at seasonal and monthly scales, introducing some uncertainty into the results. The R2 value of the PCR model in this study was 0.55, indicating that the five selected influencing factors collectively explained 55% of the spatiotemporal variations in VPS, with 45% of VPS variability remaining unexplained by the current factors. This may be related to the model’s exclusion of potential factors such as CO2 concentration [21], plant diversity [65,66], and soil properties [67]. However, high-resolution spatiotemporal dynamic data for these factors are difficult to obtain. For example, although databases such as SoilGrid provide global soil data at 250 m resolution, these data are static variables and do not align with the spatiotemporal dynamic modeling framework of this study; therefore, they were not incorporated into the analysis. Future research could further incorporate nonlinear modeling methods, such as machine learning, to more accurately capture the nonlinear response and saturation threshold effects between precipitation and NPP. By also accounting for precipitation lag effects and integrating plant functional traits with dynamic soil data, the explanatory power and predictive capabilities of the VPS mechanism can be further enhanced, thereby providing more precise scientific support for ecological conservation and climate adaptation in the YRB.

5. Conclusions

From 2000 to 2020, the VPS in the YRB showed a spatial pattern of negative in the south and positive in the north, with an overall dominant decreasing trend. Affected by both climate and human activities, VPS exhibited significant differences across regions and vegetation types. This study revealed the spatiotemporal characteristics and key influencing factors of VPS in the basin, which can provide a reference for ecological protection and sustainable management.
(1)
During 2000–2020, areas with significant changes in VPS accounted for 19.27% of the YRB, among which the area with a significant decreasing trend was considerably larger than that with a significant increasing trend. The midstream had the highest proportion of negative trends, while the upstream had the largest proportion of positive trends, with a balanced distribution of positive and negative trends. The lower Yellow River Delta was the concentrated area of positive trends. Among vegetation types, wetlands showed the most significant increasing trend in VPS, whereas coniferous forests and broad-leaved forests displayed the most obvious decreasing trends.
(2)
VPS in the basin exhibited a south-negative and north-positive pattern bounded by 36° N. Desert vegetation had the highest VPS, while coniferous forests, broad-leaved forests, and shrubs showed relatively low sensitivity overall.
(3)
Among the areas with significant VPS changes, GDP acted as the key factor in the largest proportion of areas, followed by temperature, vegetation coverage, and soil moisture; the standardized precipitation evapotranspiration index dominated the smallest proportion of areas.
(4)
The effects of each factor on VPS showed spatial heterogeneity: the upstream were more strongly correlated with GDP and temperature; the midstream were more closely related to GDP, vegetation coverage, and soil moisture.
This study has certain limitations regarding linear assumptions, window parameters, GDP interpolation, and data uncertainties. In the future, nonlinear models, time-lag effects, and more refined ecological variables can be introduced to deepen the mechanistic analysis and predictive research of VPS.

Author Contributions

Conceptualization, J.Z. and J.X.; methodology, J.Z. and F.H.; software, J.Z. and Y.L.; validation, X.W.; formal analysis, J.Z. and Y.L.; investigation, X.L.; resources, X.L.; data curation, X.W.; writing—original draft preparation, J.Z.; writing—review and editing, J.X. and X.X.; visualization, X.X.; supervision, J.X. and F.H.; project administration, F.H. and X.L.; funding acquisition, J.X. All authors have read and agreed to the published version of the manuscript.

Funding

This research was funded by the National Key R&D Program of China (NO. 2022YFF1303203), the National Natural Science Foundation of China (NO. 32271963), and the Open Fund of Shandong Key Laboratory of Eco-Environmental Science for the Yellow River Delta (NO. 2025KFJJ04) for the project “Spatial Early Warning Atlas Study on Ecological Thresholds of Typical Vegetation in the Yellow River Delta Wetlands”.

Data Availability Statement

The data that support the findings of this study are available on Dryad at http://datadryad.org/share/LINK_NOT_FOR_PUBLICATION/ZX4Woka0aILVXoUN2QfCnKoo0Cz_bP2ud_PeWlPLG8A (accessed on 30 January 2026).

Acknowledgments

We sincerely thank the China National Qinghai–Tibet Plateau Data Center (http://data.tpdc.ac.cn/ (accessed on 20 April 2026)) and the Data Center for Resources and Environmental Sciences, Chinese Academy of Sciences (http://www.resdc.cn/ (accessed on 20 April 2026)), for providing the relevant research data.

Conflicts of Interest

The authors declare no conflicts of interest.

References

  1. Piao, S.; Liu, Q.; Chen, A.; Janssens, I.; Fu, Y.; Dai, J.; Zhu, X. Plant phenology and global climate change: Current progresses and challenges. Glob. Change Biol. 2019, 25, 1922–1940. [Google Scholar] [CrossRef] [Scilit]
  2. Feng, X.; Fu, B.; Piao, S.; Wang, S.; Philippe, C.; Zeng, Z.; Wu, B. Revegetation in China’s Loess Plateau is approaching sustainable water resource limits. Nat. Clim. Change 2016, 6, 1019. [Google Scholar] [CrossRef] [Scilit]
  3. Yuan, W.; Zheng, Y.; Piao, S.; Philippe, C.; Danica, L.; Wang, Y.; Yang, S. Increased atmospheric vapor pressure deficit reduces global vegetation growth. Sci. Adv. 2019, 5, eaax1396. [Google Scholar] [CrossRef] [Scilit] [PubMed]
  4. Piao, S.; Wang, X.; Wang, K.; Li, X.; Bastos, A.; Canadell, J.; Sitch, S. Interannual variation of terrestrial carbon cycle: Issues and perspectives. Glob. Change Biol. 2019, 26, 300–318. [Google Scholar] [CrossRef] [Scilit]
  5. Seddon, A.; Macias, M.; Peter, R.; Benz, D.; Kathy, J. Sensitivity of global terrestrial ecosystems to climate variability. Nature 2016, 531, 229–232. [Google Scholar] [CrossRef] [Scilit]
  6. Andrew, J.; Melinda, D. Integrating plant ecological responses to climate extremes from individual to ecosystem levels. Philos. Trans. R. Soc. B 2017, 372, 20160142. [Google Scholar]
  7. Houerou, H. Rain use efficiency: A unifying concept in arid-land ecology. J. Arid Environ. 1984, 7, 213–247. [Google Scholar] [CrossRef] [Scilit]
  8. Lauenroth, W.; Sala, O. Long-term forage production of north american shortgrass steppe. Ecol. Appl. 1992, 2, 397–403. [Google Scholar] [CrossRef] [Scilit]
  9. Paruelo, J.; Lauenroth, W.; Burke, I.; Sala, O. Grassland precipitation-use efficiency varies across a resource gradient. Ecosystems 1999, 2, 64–68. [Google Scholar] [CrossRef] [Scilit]
  10. Piao, S.; Zhang, X.; Chen, A.; Liu, Q.; Lian, X.; Wang, X.; Wu, X. The impacts of climate extremes on the terrestrial carbon cycle: A review. Sci. China Earth Sci. 2019, 62, 1551–1563. [Google Scholar] [CrossRef] [Scilit]
  11. Jascha, L.; Dim, C.; Katja, F. Increased record-breaking precipitation events under global warming. Clim. Change 2015, 132, 501–515. [Google Scholar]
  12. Miguel, B.; Manuel, D.; Santiago, S.; Rocío, H.; Zhao, Y.; Gaitán, J.; Maestre, F. Global ecosystem thresholds driven by aridity. Science 2020, 367, 787–790. [Google Scholar] [CrossRef] [Scilit]
  13. Maurer, G.; Hallmark, A.; Brown, R.; Sala, O.; Collins, S. Sensitivity of primary production to precipitation across the united states. Ecol. Lett. 2020, 23, 527–536. [Google Scholar] [CrossRef] [Scilit]
  14. Knapp, A.; Carroll, C.; Denton, E.; Pierre, L.; Collins, S.; Smith, M. Differential sensitivity to regional-scale drought in six central US grasslands. Oecologia 2015, 177, 949–957. [Google Scholar] [CrossRef] [Scilit]
  15. Liu, D.; Zhang, C.; Ogaya, R.; Fernández, M.; Pugh, T.; Peñuelas, J. Increasing climatic sensitivity of global grassland vegetation biomass and species diversity correlates with water availability. New Phytol. 2021, 230, 1761–1771. [Google Scholar] [CrossRef] [Scilit]
  16. Liu, M.; Yang, G.; Yuan, W.; Li, Z.; Gao, M.; Yang, Y.; Yuan, Z. Overridingly increasing vegetation sensitivity to vapor pressure deficit over the recent two decades in China. Ecol. Indic. 2024, 161, 111977. [Google Scholar] [CrossRef] [Scilit]
  17. Cui, J.; Lian, X.; Chris, H.; Gimeno, L.; Wang, T.; Ding, J.; Piao, S. Global water availability boosted by vegetation-driven changes in atmospheric moisture transport. Nat. Geosci. 2022, 15, 982–988. [Google Scholar] [CrossRef] [Scilit]
  18. Zeng, X.; Hu, Z.; Chen, A.; Yuan, W.; Hou, G.; Han, D.; Luo, D. The global decline in the sensitivity of vegetation productivity to precipitation from 2001–2018. Glob. Change Biol. 2022, 28, 6823–6833. [Google Scholar] [CrossRef] [Scilit] [PubMed]
  19. Yin, P.; Li, C.; Wei, Y.; Zhang, L.; Liu, C.; Chen, J.; Xiong, X. Impact of relative temperature changes on vegetation growth in China from 2001 to 2017. J. Clean. Prod. 2024, 451, 142062. [Google Scholar] [CrossRef] [Scilit]
  20. Gonsamo, A.; Ciais, P.; Miralles, D.; Sitch, S.; Dorigo, W.; Lombardozzi, D.; Cescatti, A. Greening drylands despite warming consistent with carbon dioxide fertilization effect. Glob. Change Biol. 2021, 27, 3336–3349. [Google Scholar] [CrossRef] [Scilit] [PubMed]
  21. Zhang, Y.; Gentine, P.; Luo, X.; Lian, X.; Liu, Y.; Zhou, S.; Keenan, T. Increasing sensitivity of dryland vegetation greenness to precipitation due to rising atmospheric CO2. Nat. Commun. 2022, 13, 4875. [Google Scholar] [CrossRef] [Scilit] [PubMed]
  22. Adams, M.; Buckley, T.; Binkley, D.; Neumann, M.; Turnbull, T. CO2, nitrogen deposition and a discontinuous climate response drive water use efficiency in global forests. Nat. Commun. 2021, 12, 5194. [Google Scholar] [CrossRef] [Scilit] [PubMed]
  23. Konings, G.; Williams, P.; Gentine, P. Sensitivity of grassland productivity to aridity controlled by stomatal and xylem regulation. Nat. Geosci. 2017, 10, 284–288. [Google Scholar] [CrossRef] [Scilit]
  24. Dale, V. The relationship between land-use change and climate change. Ecol. Appl. 1997, 7, 753–769. [Google Scholar] [CrossRef]
  25. Kevin, R.; John, M.; Melinda, D.; Alan, K. Does ecosystem sensitivity to precipitation at the site-level conform to regional-scale predictions? Ecology 2015, 97, 561–568. [Google Scholar]
  26. Chaturvedi, R.; Tomlinson, K.; Pandey, S.; Tripathi, A.; Raghubanshi, A.; Singh, J. Changes in plant traits and productivity of two functional types across a soil water content gradient in a tropical dry forest. J. Ecol. 2025, 113, 3535–3549. [Google Scholar] [CrossRef] [Scilit]
  27. Chaturvedi, S.; Kumar, A.; Liu, M.; Mohan, K.; Singh, N.; Kumar, R. Insights Into Earthworms and Fungi: Pioneering Roles in Mitigating Global Food Scarcity and Combatting Land Degradation. Land Degrad. Dev. 2025, 36, 1405–1429. [Google Scholar] [CrossRef] [Scilit]
  28. Knapp, A.; Beier, C.; Briske, D.; Classen, A.; Luo, Y.; Reichstein, M.; Smith, M.; Smith, S.; Bell, J.; Fay, P.; et al. Consequences of More Extreme Precipitation Regimes for Terrestrial Ecosystems. BioScience 2008, 58, 811–821. [Google Scholar] [CrossRef] [Scilit]
  29. Huxman, T.; Smith, M.; Fay, P.; Knapp, A.; Shaw, M.; Loik, M.; Williams, D. Convergence across biomes to a common rain-use efficiency. Nature 2004, 429, 651–654. [Google Scholar] [CrossRef] [Scilit]
  30. Bian, Z.; Yu, H.; Lei, S.; Yin, D.; Zhu, G.; Mu, S.; Yang, D. Strategic consideration of exploitation on coal resources and its ecological restoration in the Yellow River Basin, China. J. China Coal Soc. 2021, 46, 1378–1391. [Google Scholar]
  31. Wang, Y.; He, J.; He, L.; Zhang, Y.; Zhang, X. Vegetation Phenology and Its Response to Climate Change in the Yellow River Basin from 2001 to 2020. Acta Ecol. Sin. 2024, 44, 844–857. [Google Scholar]
  32. Zhao, J.; Pan, T. Spatiotemporal Variation of Multiple Time-Scale NPP and Its Response to Climate Change in the Yellow River Basin. Res. Soil Water Conserv. 2024, 31, 214–222. [Google Scholar]
  33. Wang, J.; Wang, Z.; Guo, B.; He, H.; Dong, J. Spatiotemporal characteristics of vegetation carbon use efficiency and its sensitivity to climate in the Yellow River Basin in Shaanxi Province. Arid Zone Res. 2023, 40, 1959–1968. [Google Scholar]
  34. Yu, Y.; Hua, T.; Chen, L.; Zhang, Z.; Paulo, P. Divergent Changes in Vegetation Greenness, Productivity, and Rainfall Use Efficiency Are Characteristic of Ecological Restoration Towards High-Quality Development in the Yellow River Basin, China. Engineering 2024, 34, 109–119. [Google Scholar] [CrossRef] [Scilit]
  35. Ning, Y.; Liu, Y.; Du, J.; Yang, Y.; Wang, Y. Sustainable Development Assessment and Coordinated Development Strategies in the Yellow River Basin. Acta Ecol. Sin. 2022, 42, 990–1001. [Google Scholar]
  36. Xing, G.; Wang, D.; Cai, W. Study on multidimensional shrinkage spatial-temporal patterns and driving forces of cities in the Yellow River Basin. Sci. Rep. 2025, 15, 22934. [Google Scholar] [CrossRef] [Scilit] [PubMed]
  37. Wang, X.; Shi, S.; Chen, J. Change and driving factors of vegetation coverage in the Yellow River Basin. China Environ. Sci. 2022, 42, 5358–5368. [Google Scholar]
  38. Abel, C.; Horion, S.; Tagesson, T.; De Keersmaecker, W.; Seddon, A.; Abdi Abdulhakim, M.; Fensholt, R. The human-environment nexus and vegetation-rainfall sensitivity in tropical drylands. Nat. Sustain. 2020, 4, 25–32. [Google Scholar] [CrossRef] [Scilit]
  39. Wan, L.; Liu, H.; Gong, H.; Ren, Y. Effects of Climate and Land Use changes on Vegetation Dynamics in the Yangtze River Delta, China Based on Abrupt Change Analysis. Sustainability 2020, 12, 1955. [Google Scholar] [CrossRef] [Scilit]
  40. Liu, Z.; Wang, H.; Li, N.; Zhu, J.; Pan, Z.; Qin, F. Spatial and Temporal Characteristics and Driving Forces of Vegetation Changes in the Huaihe River Basin from 2003 to 2018. Sustainability 2020, 12, 2198. [Google Scholar] [CrossRef] [Scilit]
  41. Miao, P.; Li, C.; Zhu, H.; Zhong, S.; Qiao, P.; Liu, C.; Zhang, L. Spatio-temporal evolution of precipitation sensitivity of vegetation in China from 2001 to 2020. Acta Ecol. Sin. 2025, 45, 3672–3683. [Google Scholar]
  42. Zhang, Y.; Li, T.; Li, J.; Zhong, D. Influence of the westerlies and the South Asia monsoon on water vapor transport and precipitation in the Three-River Headwaters Region during the rainy season. Adv. Water Sci. 2019, 30, 348–358. [Google Scholar]
  43. Zhao, Q.; Zhang, J.; Zhao, T.; Li, J. Vegetation Changes and Its Response to Climate Change in China Since 2000. Plateau Meteorol. 2021, 40, 292–301. [Google Scholar]
  44. Li, Y.; Li, Y. Advances in Adaptability of Meteorological Drought Indices in China. J. Arid Meteorol. 2017, 35, 709–723. [Google Scholar]
  45. Chen, S.; Liu, Y.; Wen, Z. Satellite retrieval of soil moisture: An overview. Adv. Earth Sci. 2012, 27, 1192–1203. [Google Scholar]
  46. Wei, H.; Li, R.; Yang, Q. Research progress on soil and water conservation functions of vegetation in China. Chin. J. Plant Ecol. 2002, 26, 489. [Google Scholar]
  47. Yao, C.; Zhu, H.; Lü, X.; Liu, Y. Study on the Impact of Socio-economic Driving Factors of Land Use Change on the Ecosystem Service Values in Fujian Province. J. Nat. Resour. 2009, 24, 225–233. [Google Scholar]
  48. Xia, B.; Ma, P.; Xu, C.; Zhang, L. Spatiotemporal variation of NPP and its response to extreme climate indices in Yellow River Basin in recent 20 years. Res. Soil Water Conserv. 2023, 30, 256–266. [Google Scholar]
  49. Li, W.; Mirco, M.; Matthias, F.; Jasper, D.; Markus, R.; Yang, H.; Rene, O. Widespread increasing vegetation sensitivity to soil moisture. Nat. Commun. 2022, 13, 3959. [Google Scholar] [CrossRef] [Scilit]
  50. Liu, H.; Liu, Y.; Chen, Y.; Fan, M.; Chen, Y.; Gang, C.; Wang, Z. Dynamics of global dryland vegetation were more sensitive to soil moisture: Evidence from multiple vegetation indices. Agric. For. Meteorol. 2023, 331, 109327. [Google Scholar] [CrossRef] [Scilit]
  51. Chen, J.; Wu, K.; Hu, Z.; Yang, H. Spatiotemporal variability of vegetation sensitivity on the Qinghai-Tibet Plateau during the growing season from 2000 to 2021. Acta Ecol. Sin. 2023, 43, 4054–4065. [Google Scholar]
  52. Dannenberg, P.; Wise, K.; Smith, K. Reduced tree growth in the semiarid United States due to asymmetric responses to intensifying precipitation extremes. Sci. Adv. 2019, 5, eaaw0667. [Google Scholar] [CrossRef] [Scilit] [PubMed]
  53. Gherardi, L.; Sala, O. Enhanced precipitation variability decreases grass- and increases shrub-productivity. Proc. Natl. Acad. Sci. USA 2015, 112, 12735–12740. [Google Scholar] [CrossRef] [Scilit]
  54. Reich, B. The world-wide ‘fast-slow’ plant economics spectrum: A traits manifesto. J. Ecol. 2014, 102, 275–301. [Google Scholar] [CrossRef] [Scilit]
  55. Xia, J.; Zhao, X.; Ren, J.; Lang, Y.; Qu, F.; Xu, H. Photosynthetic and water physiological characteristics of Tamarix chinensis under different groundwater salinity conditions. Environ. Exp. Bot. 2017, 138, 173–183. [Google Scholar] [CrossRef] [Scilit]
  56. Xia, J.; Lang, Y.; Zhao, Q.; Liu, P.; Su, L. Photosynthetic characteristics of Tamarix chinensis under different groundwater depths in freshwater habitats. Sci. Total Environ. 2020, 761, 143221. [Google Scholar] [CrossRef] [Scilit]
  57. Randall, J.; Michael, L.; Tim, R.; Yang, Y. A simple hypothesis of how leaf and canopy-level transpiration and assimilation respond to elevated CO2 reveals distinct response patterns between disturbed and undisturbed vegetation. J. Geophys. Res. Biogeosci. 2017, 122, 168–184. [Google Scholar]
  58. Gupta, A.; RicoMedina, A.; CañoDelgado, A. The physiology of plant responses to drought. Science 2020, 368, 266–269. [Google Scholar] [CrossRef] [Scilit] [PubMed]
  59. Cui, Q.; Xia, J.; Peng, L.; Zhao, X.; Qu, F. Positive Effects on Alfalfa Productivity and Soil Nutrient Status in Coastal Wetlands Driven by Biochar and Microorganisms Mixtures. Front. Ecol. Evol. 2022, 9, 798520. [Google Scholar] [CrossRef] [Scilit]
  60. Sun, J.; Zhao, X.; Fang, Y.; Xu, W.; Gao, F.; Zhao, W.; Xia, J. Root growth and architecture of Tamarix chinensis in response to the groundwater level in the Yellow River Delta. Mar. Pollut. Bull. 2022, 179, 113717. [Google Scholar] [CrossRef] [Scilit]
  61. Chen, P.; Xia, J.; Ma, H.; Gao, F.; Dong, M.; Xing, X.; Li, C. Analysis of spatial distribution pattern and its influencing factors of the Tamarix chinensis population on the beach of the muddy coastal zone of Bohai Bay. Ecol. Indic. 2022, 140, 109016. [Google Scholar] [CrossRef] [Scilit]
  62. Cui, Q.; Xia, J.; Yang, H.; Liu, J.; Shao, P. Biochar and effective microorganisms promote Sesbania cannabina growth and soil quality in the coastal saline-alkali soil of the Yellow River Delta, China. Sci. Total Environ. 2021, 756, 143801. [Google Scholar] [CrossRef] [Scilit]
  63. Yang, H.; Xia, J.; Cui, Q.; Liu, J.; Wei, S.; Feng, L.; Dong, K. Effects of different Tamarix chinensis-grass patterns on the soil quality of coastal saline soil in the Yellow River Delta, China. Sci. Total Environ. 2021, 772, 145501. [Google Scholar] [CrossRef] [Scilit] [PubMed]
  64. Cao, Q.; Zong, X.; Qi, C.; Yu, C.; Guo, J.; Shen, J.; Xia, J. Changes in Runoff and Sediment Loads in the Tuhai River Basin and the Factors Influencing These Changes. Water 2024, 16, 2064. [Google Scholar] [CrossRef] [Scilit]
  65. Gherardi, L.; Sala, O. Enhanced interannual precipitation variability increases plant functional diversity that in turn ameliorates negative impact on productivity. Ecol. Lett. 2015, 18, 1293–1300. [Google Scholar] [CrossRef] [Scilit]
  66. Liu, Y.; Wang, L.; Xia, J.; Guo, H.; Wang, J. Ozone enrichment and drought stress have more negative effects on invasive leguminous woody species than co-occurring native species. Environ. Exp. Bot. 2024, 217, 105580. [Google Scholar] [CrossRef] [Scilit]
  67. Zhang, W.; Fan, Z.; Jin, C.; Jiao, Y.; Di, K.; Feng, M.; Hu, Z. Reversal of the sensitivity of vegetation productivity to precipitation in global terrestrial biomes over the recent decade. Agric. For. Meteorol. 2025, 370, 110598. [Google Scholar] [CrossRef] [Scilit]
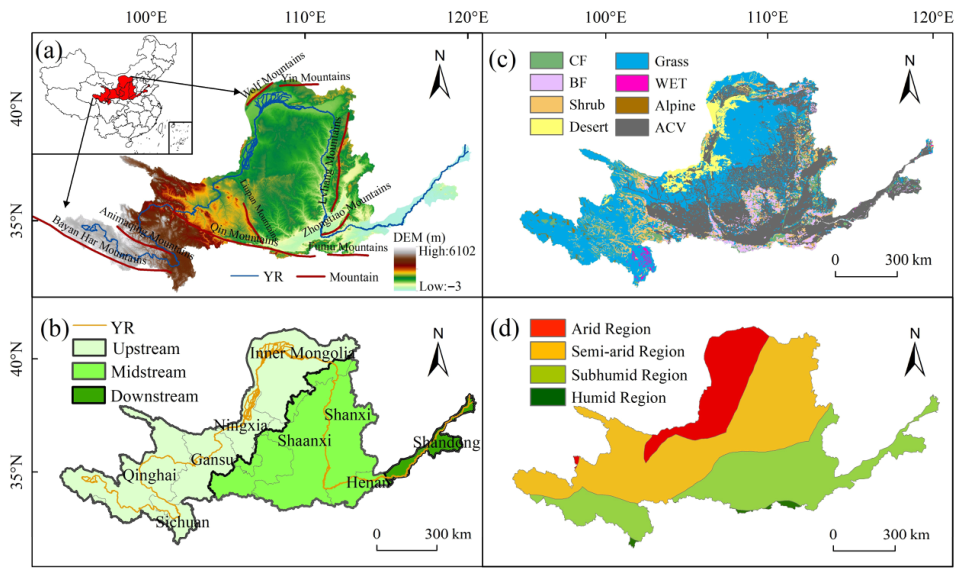
Figure 1. Overview of the YRB. (a) Spatial location of the YRB; (b) Schematic diagram of the division of the upstream, midstream, and downstream of the YRB; (c) Vegetation type map of the YRB. CF: Coniferous Forest; BF: Broad-leaved Forest; Shrub: Shrub; Desert: Desert; Grass: Grassland; WET: Wetland; Alpine: Alpine Vegetation; ACV: Artificially Cultivated Vegetation; (d) Schematic diagram of climate zoning in the YRB.
Sustainability 18 04301 g001
Figure 2. Flowchart for calculating vegetation sensitivity to precipitation. (a) Input NPP and precipitation datasets; (b) Determine NPP and precipitation data using a moving window; (c) Conduct linear regression on the NPP and precipitation data within the moving window. The slope of the regression, denoted as α, represents the relationship between NPP and precipitation, while β is the regression intercept. (d) Assign the calculated slope α to the central pixel of the moving window, with the third year as the reference year for the middle of the window. (e) Repeat steps b, c, and d to obtain the sensitivity of the entire study area.
Sustainability 18 04301 g002
Figure 3. Spatial distribution of the annual mean and trends in NPP in the YRB, 2000–2020. Triangles indicate significant regions (Mann–Kendall test, p < 0.05). Note: The bar charts display the proportions of significant positive (green) and negative (red) trends within each sub-basin. The percentages to the right of the bar charts indicate the area proportion of that sub-basin segment within the entire YRB.
Sustainability 18 04301 g003
Figure 4. Spatial distribution of annual mean precipitation and trends in the YRB from 2000 to 2020. Triangles indicate significant regions (Mann–Kendall test, p < 0.05). Note: Points and bar charts represent the mean precipitation and range of variation across different climatic zones.
Sustainability 18 04301 g004
Figure 5. Spatial distribution of mean VPS from 2000 to 2020 and distribution of mean VPS across different climate zones (unit: gC·m−2·mm−1). Note: Bar charts indicate the proportion of areas with positive and negative VPS in different climate zones. Points and bar charts indicate the range of VPS in different climate zones.
Sustainability 18 04301 g005
Figure 6. Spatial distribution and area proportion of significant VPS trends in the YRB from 2000 to 2020 (Mann–Kendall test, p < 0.05) (Unit: gC·m−2·mm−1·a−1). Note: (ac) represent typical regions with negative trends, and (d) represents regions with positive trends. The bar chart illustrates the distribution of significant positive (green) and negative (red) VPS trends across the entire watershed and its sub-basins.
Sustainability 18 04301 g006
Figure 7. The spatial distribution of partial correlation coefficients between VPS and influencing factors (p < 0.05).
Sustainability 18 04301 g007
Figure 8. Major factors influencing significant changes in VPS across the entire YRB and its various sub-basins, along with their respective proportions of the total area. Note: (ac) illustrate the driving factors in typical regions with a negative growth trend, while (d) presents those in regions with a positive growth trend.
Sustainability 18 04301 g008
Table 1. Research data and their sources.
Data TypeData SourceWebsite
Precipitation
Temperature
Soil Moisture
Fractional Vegetation Cover
National Tibetan Plateau Data Center of China (Beijing, China)https://data.tpdc.ac.cn (accessed on 20 April 2026)
NPPGoogle Earth Engine (Washington, D.C., USA)https://lpdaac.usgs.gov (accessed on 20 April 2026)
Climate Zoning
Vegetation Type
GDP
Boundary Data of the YRB
Resource and Environmental Science and Data Center, Chinese Academy of Sciences (Beijing, China)https://www.resdc.cn (accessed on 20 April 2026)
Standardized Precipitation Evapotranspiration Index (SPEI)CSTR Identification Platform (Beijing, China)https://cstr.cn (accessed on 20 April 2026)
DEMNational Cryosphere Desert Data Center (Lanzhou, China)https://www.ncdc.ac.cn (accessed on 20 April 2026)
Table 2. Proportion of significant results in linear regression fits under different window combinations (including NODATA pixels, p < 0.05, unit: %).
Duration/Window Size3 × 35 × 57 × 79 × 911 × 11
235.350.8760.7466.9371.56
345.7366.3875.3480.7383.58
464.978.3184.9388.3990.89
552.8874.4382.9386.8589.12
650.3869.0478.1783.5686.75
746.1365.6175.7581.0584.3
850.7967.9776.981.5785.09
Table 3. Mean R2 of linear regression under different window combinations (including NODATA pixels).
Duration/Window Size3 × 35 × 57 × 79 × 911 × 11
20.29450.23670.21180.19610.1852
30.27160.23680.21860.20620.197
40.33810.30810.29170.28040.2718
50.2050.18640.17660.17010.1653
60.17450.15710.14800.14150.1369
70.14330.13060.12390.11910.1155
80.14420.13040.12320.11800.1141
Table 4. Proportions of different vegetation types, mean VPS values, and differences in trends in the YRB (in areas showing significant changes).
CFBFShrubDesertGrassWETAlpineACV
Area Proportion (%)6.612.010.13.929.40.50.736.9
VPS MeanMax1.5141.5181.3631.5021.4940.6250.3481.126
Mean0.01−0.024−0.0150.3470.101−0.114−0.1550.071
min−1.265−0.933−1.317−0.7311−1.087−0.622−1.138−0.697
VPS TrendMax0.0680.0640.0840.0470.1050.0390.0370.103
Mean−0.035−0.047−0.028−0.0340.00010.0180.014−0.029
min−0.149−0.151−0.146−0.109−0.140−0.073−0.022−0.144
Disclaimer/Publisher’s Note: The statements, opinions and data contained in all publications are solely those of the individual author(s) and contributor(s) and not of MDPI and/or the editor(s). MDPI and/or the editor(s) disclaim responsibility for any injury to people or property resulting from any ideas, methods, instructions or products referred to in the content.