Article

Export Diversification and Network Effects: Evidence from a SAM-Based Analysis of Bangladesh

by
Mashrat Jahan
1,2,*,
Tetsuya Horie
3,4 and
Manual Alejandro Cardenete
4,5
1
Graduate School of Economics, Sophia University, 7-1 Kioi-cho, Chiyoda-ku, Tokyo 102-8554, Japan
2
Department of Agricultural Economics, Gazipur Agricultural University, Salna, Gazipur 1706, Bangladesh
3
Department of Economics, Sophia University, 7-1 Kioi-cho, Chiyoda-ku, Tokyo 102-8554, Japan
4
Sophia Institute for Human Security (SIHS), Sophia University, 7-1 Kioi-cho, Chiyoda-ku, Tokyo 102-8554, Japan
5
Department of Economics, Universidad Loyola Andalucía, Avenida de las Universidades, s/n, 41704 Dos Hermanas, Seville, Spain
*
Author to whom correspondence should be addressed.
Sustainability 2026, 18(9), 4265; https://doi.org/10.3390/su18094265
Submission received: 16 February 2026 / Revised: 19 April 2026 / Accepted: 21 April 2026 / Published: 24 April 2026
(This article belongs to the Special Issue Development Economics and Sustainable Economic Growth)

Abstract

This study examines how the allocation of export expansion across sectors affects economy-wide outcomes in Bangladesh. Using a Social Accounting Matrix (SAM) framework, we combine linkage analysis with simulation to evaluate how sectoral export growth propagates through the production network. The results show that the impact of export diversification depends critically on sectoral allocation rather than export intensity alone. While aggregate differences between scenarios are modest, reallocating export growth toward sectors with stronger intersectoral linkages generates larger economy-wide gains in GDP and labor income. In particular, sectors with low initial export shares but high network connectivity—such as agriculture, hunting, forestry, and fishing; retail trade; other community, social and personal services; and inland transport—produce stronger multiplier effects than most export-intensive sectors. These findings highlight a key distinction between export intensity and network centrality, demonstrating that sectors with limited direct export participation can play a central role in transmitting economic gains. The results provide a network-based perspective on export diversification and offer policy-relevant insights for designing strategies that promote more inclusive and efficient economic growth.

1. Introduction

Structural change is a central feature of economic development, involving the reallocation of resources across sectors [1,2]. Its importance lies not only in shifts in sectoral output but also in the network of intersectoral linkages that transmit production shocks throughout the economy. These linkages determine how sectoral expansion propagates into aggregate output, employment, and income distribution, making them critical for understanding the economy-wide consequences of structural transformation.
Bangladesh has undergone substantial structural transformation since independence, with sustained growth particularly after the 1980s. While agriculture has exhibited variable performance, the textile sector has emerged as the dominant driver of export-led growth [3]. More recently, service sectors such as real estate and transport have increased their contribution to domestic economic activity [4]. Despite this gradual diversification in production, exports remain highly concentrated in textiles and textile products, raising concerns about the sustainability of growth under increasing external exposure.
This concentration reflects a structural imbalance: policy support and institutional capacity have historically favored sectors with established export networks, while non-textile sectors remain underdeveloped [5]. As a result, export diversification has progressed slowly, and its potential to generate broad-based economic gains remains limited [6].
Existing studies document a positive association between export diversification and economic growth. For example, a 1% increase in horizontal diversification has been associated with a 1.7% increase in long-run GDP growth [7]. However, most evidence relies on aggregate or econometric approaches and provides limited insight into the underlying transmission mechanisms. In particular, little is known about how the allocation of export expansion across sectors—given the structure of intersectoral linkages—affects economy-wide outcomes.
This study addresses this gap by examining how export expansion allocated across sectors translates into aggregate economic effects in Bangladesh. Using a Social Accounting Matrix (SAM) framework, we identify key sectors based on their linkage structure and simulate alternative export diversification scenarios. The results show that sectors with strong intersectoral linkages—despite having low initial export shares—generate larger economy-wide gains than traditional export-intensive sectors.
These findings suggest that the effectiveness of export diversification depends not on export size per sector, but on the position of sectors within the production network. By highlighting the role of structural connectedness, this study provides new evidence on how export diversification strategies can be designed to maximize economy-wide gains.

1.1. Contextual Review of the Issue

Bangladesh is scheduled to graduate from Least Developed Country (LDC) status in 2026, after which it will lose preferential market access currently granted to LDCs. This transition is expected to reduce export competitiveness, with existing estimates suggesting a decline in total exports of between 4% and 8% [8,9].
The magnitude of this adjustment, however, depends critically on the structure of exports. Evidence from Global Trade Analysis Project (GTAP) simulations indicates that countries with more diversified export bases are less vulnerable to the removal of trade preferences and may even experience welfare gains through deeper integration and Free Trade Agreements (FTAs) [10]. This highlights export diversification as a central policy challenge in the post-LDC transition.
Despite some progress, Bangladesh’s export structure remains highly concentrated in the textiles and textile products sector. While non-textile exports have grown moderately, export performance continues to be driven predominantly by textiles and textile products [11]. This concentration has intensified in the post-COVID-19 period, as global sourcing patterns shifted toward South Asian suppliers under the “China-plus-one” strategy, further increasing Bangladesh’s share in textile exports [12,13,14].
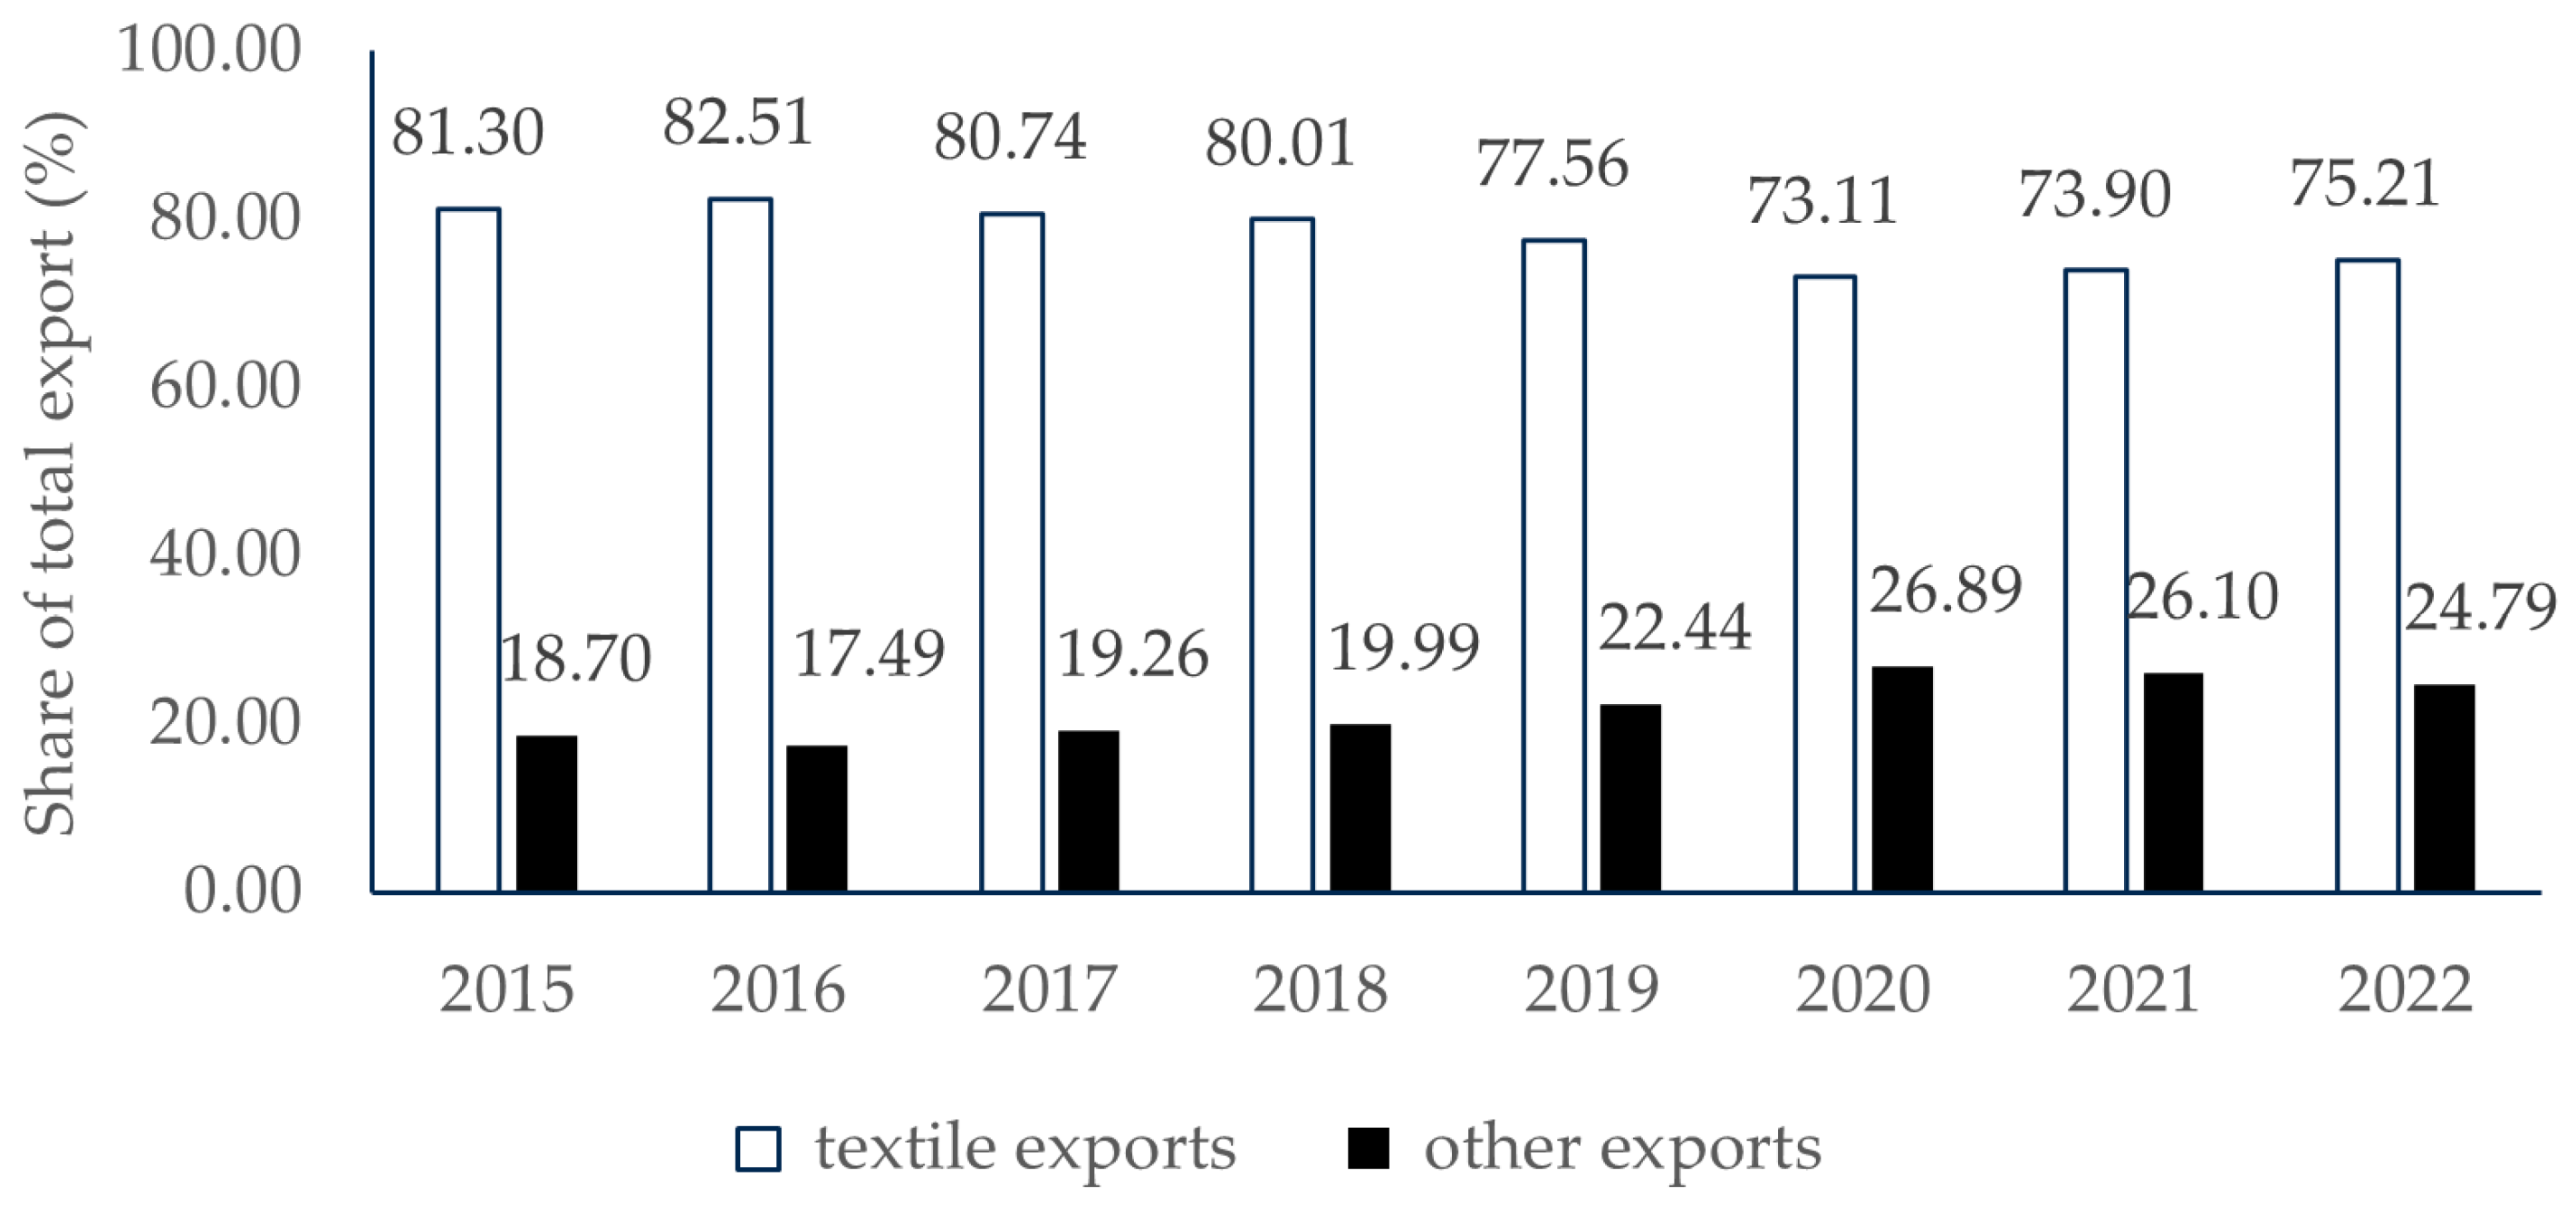
Figure 1 shows that exports remain persistently concentrated in the textile sector, accounting for more than 70% of total exports throughout the period. Although the share of non-textile exports increased temporarily, particularly after 2019, this shift was not sustained. By 2022, the export structure remained highly concentrated, indicating limited structural progress toward diversification. This persistent concentration motivates the need to examine how alternative allocation of export expansion across sectors may affect economy-wide outcomes.
This raises a key question: how does the allocation of export expansion across sectors affect economy-wide outcomes in a highly concentrated export structure? While previous studies using Social Accounting Matrix (SAM) frameworks provide insights into intersectoral relationships, many rely on outdated datasets and therefore fail to capture recent structural changes, particularly those following the COVID-19 shock. More importantly, existing studies provide limited evidence on how export expansion allocated across sectors translates into aggregate economic effects through intersectoral linkages.
To address this gap, this study constructs a SAM for Bangladesh for the year 2022, reflecting recent changes in production and export patterns. Using this updated framework, we evaluate how alternative export expansion scenarios propagate through the economy in terms of sectoral production and labor income, thereby providing a more precise basis for designing export diversification policies.

1.2. Rationale for the Export-Diversification Simulation Design

To assess the potential impact of post-LDC trade integration, this study models export expansion as an exogenous demand shock. This approach is motivated by evidence that countries entering Free Trade Agreements (FTAs) often experience increases in export demand through improved market access and reduced trade barriers [15,16,17].
Rather than imposing a uniform increase across sectors, the analysis draws on the framework of Foster [18], which emphasizes the distinction between intensive and extensive margins of export growth. This distinction is particularly relevant for small exporters, where export expansion may occur either through scaling up existing products (intensive margin) or through the introduction of new export activities (extensive margin).
Based on this framework, sectors are classified into intensive and extensive categories according to their initial export shares. Sectors accounting for more than 1% of total exports are defined as intensive, while the remaining sectors are categorized as extensive. This threshold-based classification provides a transparent rule for distinguishing established export sectors from those with limited current export presence.
Two alternative scenarios are constructed to capture different patterns of export expansion. Under the Foster diversification scenario, export growth is distributed across both intensive and extensive sectors, with relatively higher growth assigned to extensive sectors, reflecting the role of the extensive margin in generating new export activities. In contrast, the current structure scenario concentrates export growth entirely within intensive sectors, leaving extensive sectors unchanged.
The key difference between the two scenarios lies in the allocation of export expansion across sectors, conditional on the underlying structure of intersectoral linkages. This design allows us to evaluate how alternative allocation rules translate into aggregate outcomes through the production network.
The central hypothesis is that export expansion allocated toward sectors with weaker initial export positions but stronger intersectoral linkages generates larger economy-wide gains than expansion concentrated in traditional export sectors. This reflects the amplification effects of production networks, whereby shocks in structurally connected sectors propagate more widely across the economy.
The remainder of the paper is structured as follows. Section 2 describes the data and methodology, including the construction of the Social Accounting Matrix (SAM), the linkage analysis, and the simulation framework. Section 3 presents the results. Section 4 concludes.

2. Materials and Methods

This study employs a two-stage analytical framework to evaluate how alternative export allocation strategies propagate through the economy. In the first stage, the Input–Output Table (IOT) is extended into a Social Accounting Matrix (SAM), providing a comprehensive representation of intersectoral production linkages and income flows. In the second stage, linkage analysis is combined with simulation exercises to examine how exogenous changes in export demand are transmitted across sectors and institutions. The analysis is conducted within a fixed-price, fixed-coefficient framework, and therefore should be interpreted as a comparative static assessment of economy-wide effects rather than a causal estimation.
Before presenting the analytical model and simulation design, we first describe the underlying data framework.

2.1. Database

This study uses a Social Accounting Matrix (SAM) as the core database. Compared with a standard Input–Output Table (IOT), the SAM captures a broader set of economic interactions by incorporating institutional accounts and income flows in addition to intersectoral transactions [19,20].
The SAM is constructed based on the most recent IOT for Bangladesh (2022), published by the Economic Research and Development Impact Department (ERDI) of the Asian Development Bank (ADB), supplemented with national accounts data [21]. The production structure consists of 34 aggregated sectors, with intermediate transactions, final demand, and value-added components derived from the IOT. Household accounts are incorporated using the household consumption vector from the IOT, linking production activities to income generation and expenditure.
Sectoral value-added is decomposed into labor and capital income components. Labor income is allocated across sectors proportionally based on sectoral employment shares obtained from the Labor Force Survey (LFS) 2022 [22]. This procedure assumes homogeneous wages within sectors and fixed labor shares, implying that variations in labor income reflect differences in employment intensity rather than wage dispersion. Capital income is then derived residually as the difference between total value-added and estimated labor income.
Finally, the SAM is partitioned into endogenous and exogenous accounts. Endogenous accounts include production sectors, factors of production (labor and capital), and households, while exogenous accounts comprise government, capital (savings–investment), and the foreign sector [23]. This closure structure allows external shocks—such as export demand changes—to enter the system through exogenous accounts and propagate through the endogenous production network.

2.2. Construction of the SAM from the Input–Output Table

This study constructs a Social Accounting Matrix (SAM) by extending the Input–Output Table (IOT) to incorporate institutional and factor accounts, thereby providing a consistent representation of production, income generation, and expenditure flows within the economy [24]. The resulting matrix is numerically balanced and organized to distinguish between endogenous and exogenous accounts, which is essential for subsequent multiplier and simulation analysis.
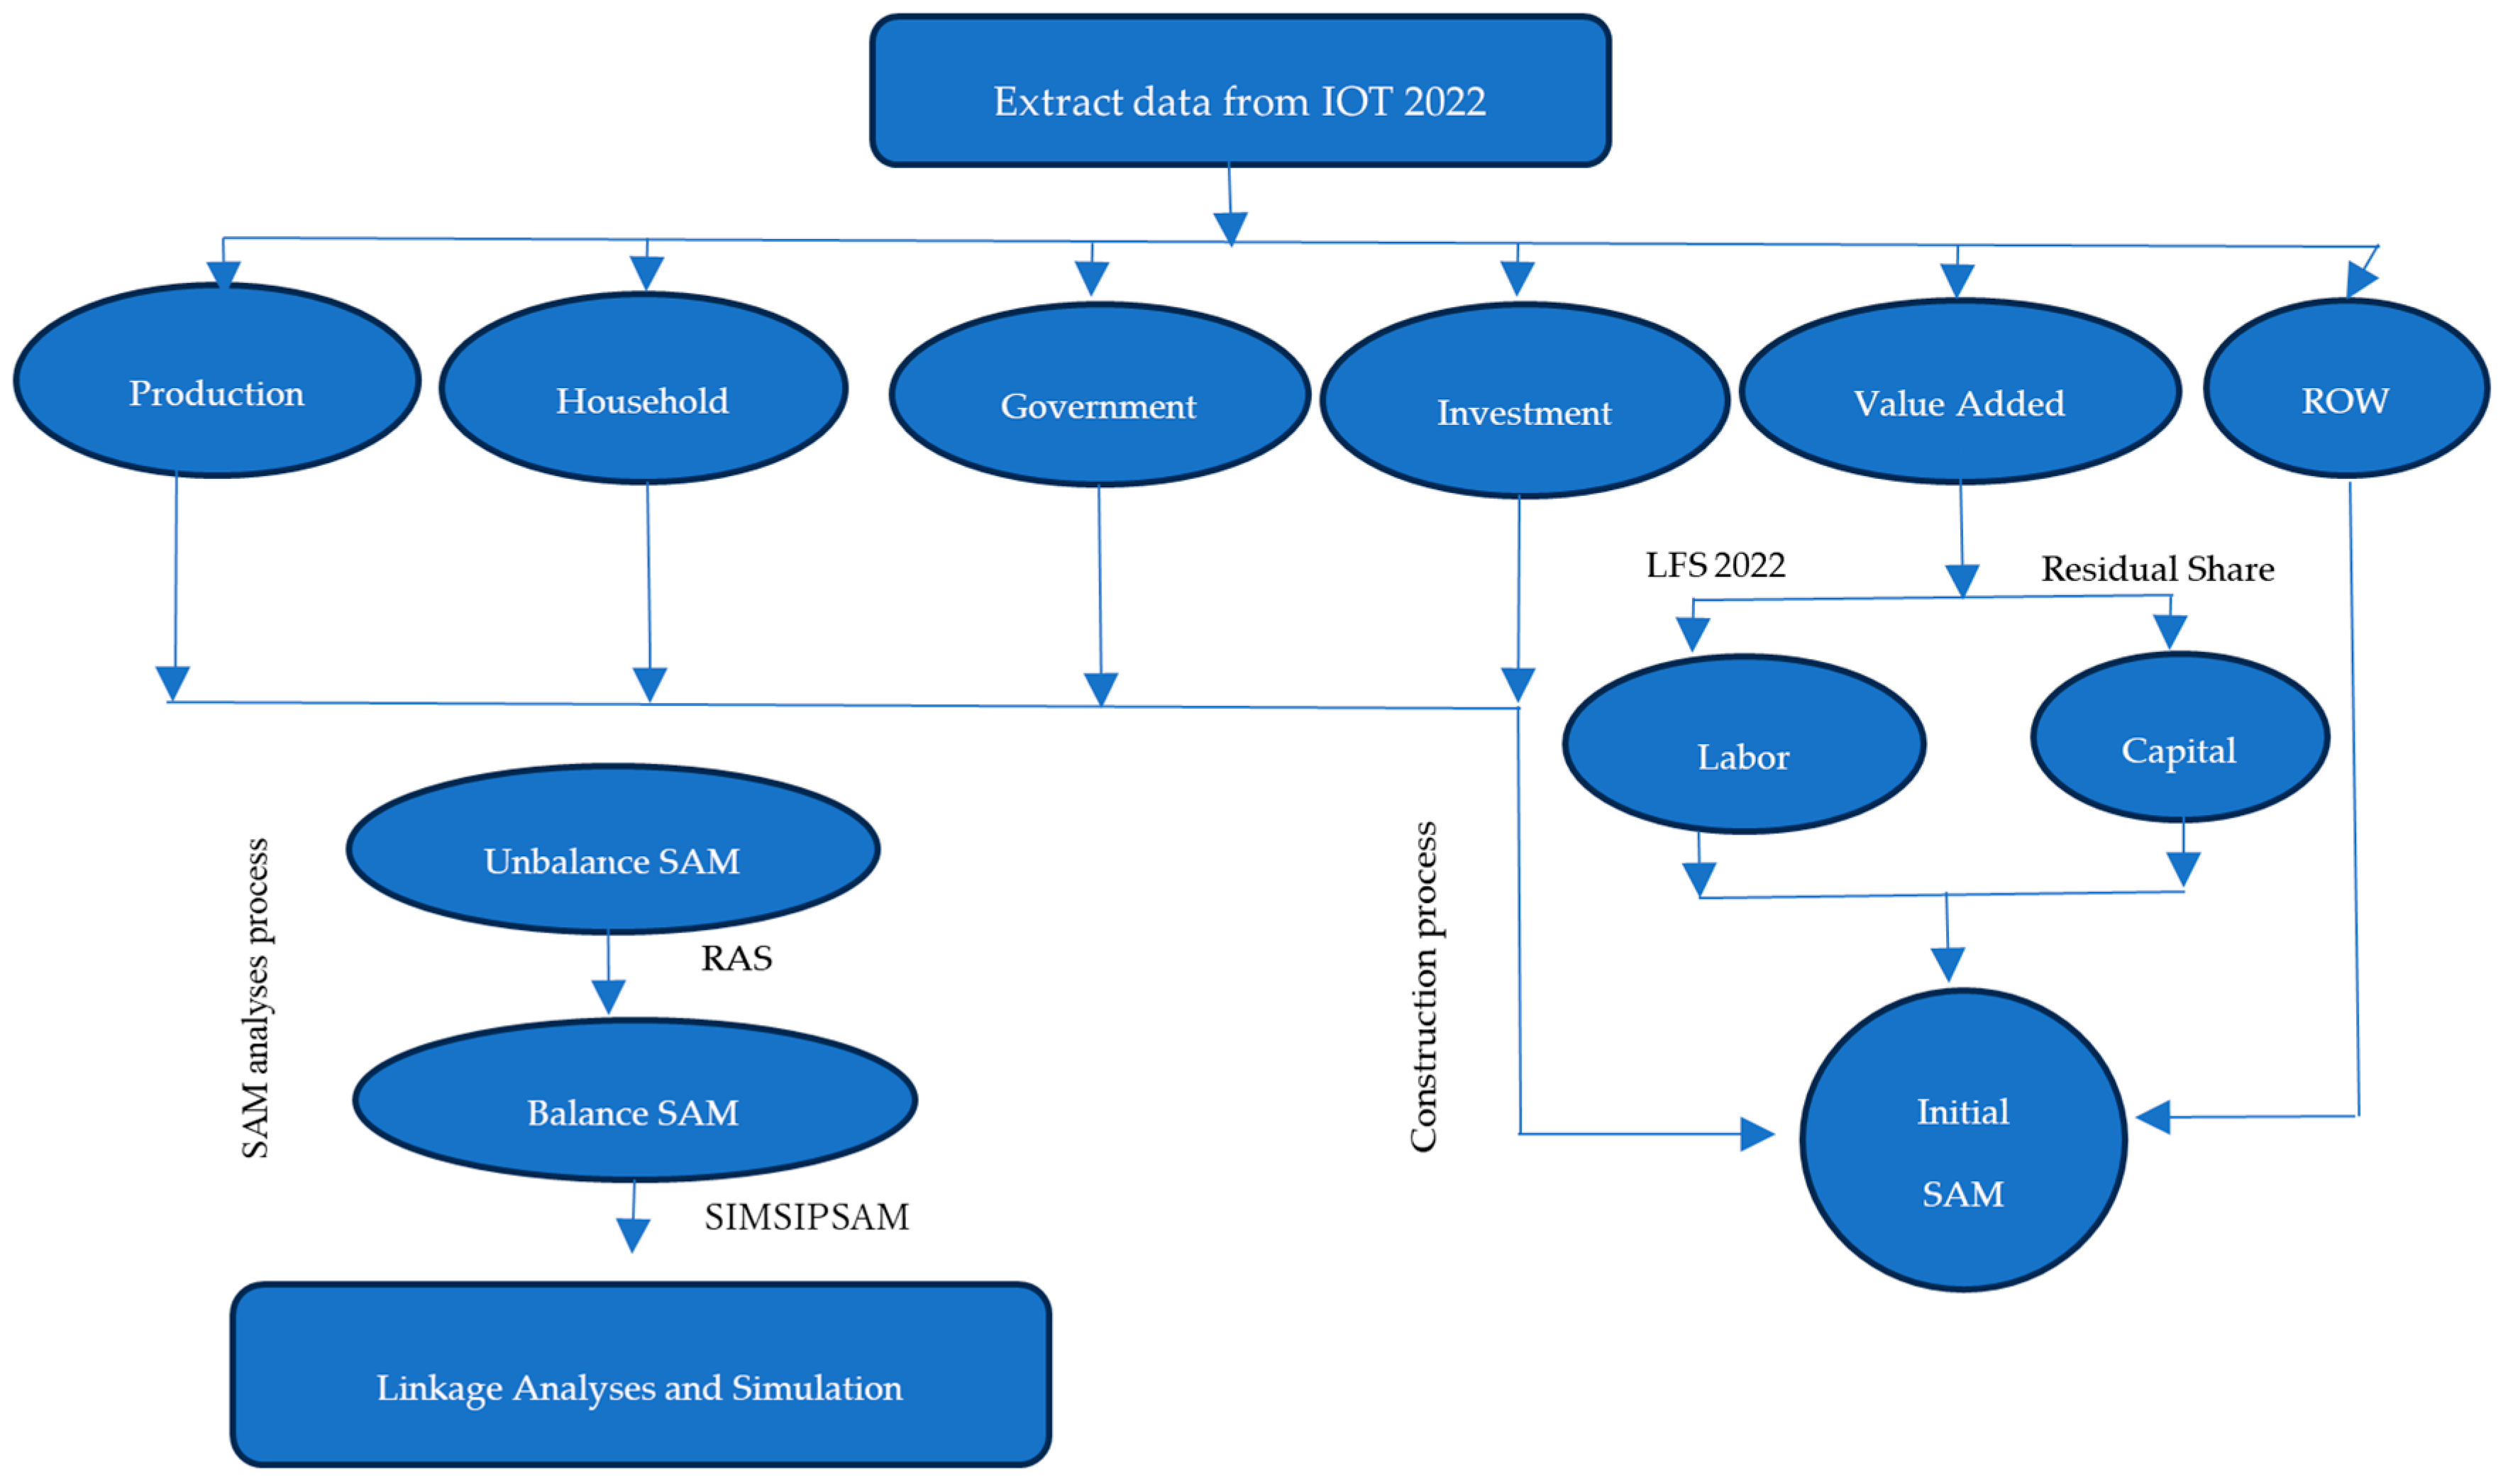
Figure 2 summarizes the transformation process from the IOT to the SAM. The construction begins with the inter-industry transaction matrix of 34 production sectors and the associated final demand components reported in the IOT. These flows are then reorganized into SAM accounts, including households, government, capital (savings–investment), and the rest of the world, ensuring consistency between production and institutional transactions.
On the income side, value added from the IOT is decomposed into labor and capital components following national accounts definitions. Labor income corresponds to employee compensation, while capital income includes gross operating surplus and land-related returns. Sectoral labor income is allocated using employment shares from the Labor Force Survey (LFS) 2022, implying proportionality between employment and labor income across sectors. This assumption abstracts from within-sector wage heterogeneity and should be interpreted as an approximation of relative labor intensity. Capital income is then derived residually as the difference between total value added and estimated labor income.
The SAM is subsequently balanced to ensure consistency between row and column totals. This study employs the RAS (bi-proportional scaling) method implemented in the SIMSIPSAM framework developed by the World Bank [25]. The RAS procedure iteratively adjusts the initial matrix to match predetermined marginal totals while preserving the underlying structure of intersectoral relationships. Compared with alternative methods such as cross-entropy, RAS provides a transparent and widely used approach for reconciling inconsistencies in aggregated SAM construction.
This construction yields a coherent accounting framework in which exogenous shocks—such as changes in export demand—can be introduced and transmitted through the endogenous production and income network.

2.3. Linkage Analysis

This study evaluates intersectoral linkages to identify key sectors within the economy. Linkage indices are derived from the SAM multiplier framework, capturing both direct and indirect interdependencies across production and institutional accounts. A sector is defined as a key sector if both its normalized backward and forward linkage indices exceed unity, indicating above-average demand-pull and supply-push effects within the production network.
To ensure comparability across sectors, linkage indices are normalized by the economy-wide average and expressed in index form, where the mean equals one. Values greater than one indicate above-average linkages, while values below one indicate weaker intersectoral connectivity.

2.3.1. Backward Linkage

Backward linkages (BL), originally proposed by Rasmussen [26], measure the extent to which a sector depends on inputs from other sectors through intermediate demand.
The SAM-based multiplier model is defined as:
E = ( I S ) 1 E x
where E is the vector of endogenous accounts, including production sectors, factors of production (labor and capital), and households, and E x is the vector of exogenous accounts, comprising government, capital (saving-investment), and foreign sectors, representing the external injections into the economic system. Here I is an identity matrix of size n , n denotes the number of endogenous accounts (in this study, n = 34 ). S = s i j is the SAM coefficient matrix representing expenditure flow among endogenous accounts. Each element s i j represents the average propensity to spend from account j to i , calculated as the ratio of the transaction from j to i to the total outlay of account j .
This formulation is analogous to the technical coefficient matrix in the input-output model but extended to incorporate institutional accounts and income flows. The matrix ( I S ) 1 denotes the SAM multiplier matrix, which is conceptually analogous to the Leontief inverse in the standard input-output model [27]. The SAM multiplier matrix captures economy-wide interdependencies, including both direct and indirect effects.
Let m i j denote its elements:
[ m i j ] = [ ( I S ) 1 ] i j  
The column sum for sector j is defined as m j = i = 1 n m i j . The global intensity M is defined as M = i = 1 n j = 1 n m i j [28]. Following Rasmussen [26], the normalized backward linkage ( B L ) index is given by:
B L j = m j 1 n M
This normalization expresses each sector’s linkage relative to the economy-wide average. A value of B L j > 1 indicates that the sector j has above-average backward linkages, implying that an increase in its final demand generates stronger-than-average economy-wide production effects. This measure captures the strength of intersectoral demand linkages by reflecting how strongly a sector is connected to upstream production activities.

2.3.2. Forward Linkage

Forward linkages (FL) measure the extent to which a sector’s output is used as an input by other sectors in their production processes. Unlike backward linkages, which capture demand-driven effects, forward linkages reflect supply-driven interdependencies within the production system.
The traditional approach, based on the Rasmussen method of summing the rows of the Leontief inverse matrix, has been criticized for its symmetry with backward linkages and its inability to fully capture the supply-driven nature of sectoral flows. To address this limitation, this study adopts the approach proposed by Augustinovics [29], which computes forward linkages using the Ghosh inverse matrix derived from the supply-driven input–output framework.
To maintain consistency with the SAM-based framework, the Ghosh-type inverse matrix is defined as:
G = ( I B ) 1
where B = [ b i j ] is the matrix of output coefficients, and each element b i j represents the share of output from sector j , calculated as the ratio of the transaction from i to j to the total output of sector i . The matrix G captures the propagation of supply shocks across sectors. Let g i j denote the elements of the matrix G . The row sum for sector i is efined as g j = j = 1 n g i j . The global intensity M is defined as M = i = 1 n j = 1 n g i j .
Following Augustinovics [29], the normalized forward linkage (FL) index is given by:
F L i = g i 1 n M
This normalization expresses each sector’s linkage relative to the economy-wide average. A value of F L i > 1 indicates that sector i has above-average forward linkages, implying that an increase in its output generates stronger-than-average downstream demand across sectors that use its output as an intermediate input. This measure captures the strength of intersectoral supply linkages by reflecting how strongly a sector is connected to downstream production activities.

2.4. Export Policy Simulation

Linkage analysis provides a static representation of intersectoral dependencies within the economy under fixed coefficients. Building on this structure, the simulation analysis examines how exogenous export demand shocks propagate through the production network. Accordingly, the results should be interpreted as comparative static responses conditional on the underlying linkage structure, rather than dynamic adjustments over time. The analysis does not impose behavioral responses or price adjustments and therefore captures only the first-round and multiplier effects of export shocks.
To operationalize the distinction between intensive and extensive margins of export diversification, sectors are classified based on their initial export shares. Sectors accounting for more than 1% of total exports are defined as intensive sectors, indicating an established export base, while the remaining sectors are categorized as extensive sectors, reflecting their limited current export presence and potential for expansion.
Based on this classification, intensive sectors include textiles and textile products (4), leather, leather products and footwear (5), food, beverages, and tobacco (3), manufacturing (nec) and recycling (16), post and telecommunications (27), renting of machinery and equipment (30), and public administration and defense (31). All other sectors are classified as extensive.
Two alternative scenarios are constructed to evaluate how the allocation of export expansion affects economy-wide outcomes. The first scenario, referred to as the Foster diversification scenario, distributes export growth across both intensive and extensive sectors. This design reflects the idea that export expansion may occur through both the scaling up of existing activities and the introduction of new export activities.
The second scenario, referred to as the current structure scenario, reflects the existing export pattern of Bangladesh, in which export growth is concentrated in a small number of established sectors. In this case, export expansion is allocated exclusively to intensive sectors, while extensive sectors remain unchanged.
Export expansion is implemented as a proportional increase in sectoral export demand. Under the Foster diversification scenario, export growth is differentiated across sector groups, with a 7% increase applied to extensive sectors and a 4% increase applied to intensive sectors. These rates are calibrated such that the aggregate magnitude of the export shock is consistent with the assumed overall expansion, while allowing for heterogeneous growth patterns across sectors.
In contrast, under the current structure scenario, the same total export expansion is allocated entirely to intensive sectors, ensuring that the aggregate size of the shock remains identical across scenarios. This design isolates the role of sectoral allocation, conditional on the underlying network structure, in determining the magnitude of economy-wide effects.
Table 1 summarizes the structure, magnitude, and economic rationale of the simulation scenarios.

2.4.1. Foster Diversification Scenario

In this scenario, export expansion is implemented through differentiated growth rates across sectors. Specifically, exports increase by 7% in extensive sectors and by 4% in intensive sectors. This specification introduces heterogeneous export growth across sectors rather than a uniform aggregate increase, allowing expansion to occur along both extensive and intensive margins.
Let i = 1 ,   , n denote sectors and let E i denote the baseline exports. The updated export value under the Foster diversification scenario, E i F , is defined as:
E i F = { E i ( 1 + 0.07 ) ,     if   i X E i ( 1 + 0.04 ) ,     if   i I
where X and I denote the sets of extensive and intensive sectors, respectively. The corresponding export shock is:
Δ E i F = E i F E i
This formulation generates a total export expansion that reflects differentiated sectoral growth while preserving internal consistency across sectors. This incremental change in exports is then introduced as a shock to the export component of the final demand vector in the SAM.

2.4.2. Current Structure Scenario

In contrast to the Foster diversification scenario, this scenario assumes that export expansion remains concentrated in existing intensive sectors, while exports from extensive sectors are held constant at their 2022 levels. Under this scenario, the entire increase in export demand is allocated to intensive sectors, reflecting the current export structure in which a small number of sectors dominate export performance.
The updated export value for each sector under the current structure scenario, E i C , is defined as:
E i C = { E i , if i X E i + E i k I E k Δ E Total , if i I
where
Δ E T o t a l = k X 0.07 E k + k I 0.04 E k .
This formulation reallocates the total export increase—computed based on differentiated growth rates across sectors under the Foster diversification scenario—entirely across intensive sectors in proportion to their existing export shares, while keeping exports from extensive sectors unchanged.
The corresponding export shock is given as:
Δ E i C = E i C E i .
The resulting export values under the two scenarios are summarized in Table 2.

3. Result Interpretation: Linkage Analysis and Simulation-Based Scenario Analysis

3.1. Linkage Analyses of Key Sectors

The linkage analysis identifies sectors with the strongest economy-wide propagation effects, based on the criterion that both normalized backward linkage (BL) and forward linkage (FL) indices exceed unity. Under this definition agriculture, hunting, forestry, and fishing (1), retail trade (21), inland transport (23), and other community, social, and personal services (34) emerge as key sectors.
Although these sectors account for relatively small shares of direct exports, their position within the production network implies a high capacity to transmit shocks across sectors. This distinction between export intensity and network centrality is central to the interpretation of the simulation results presented below.
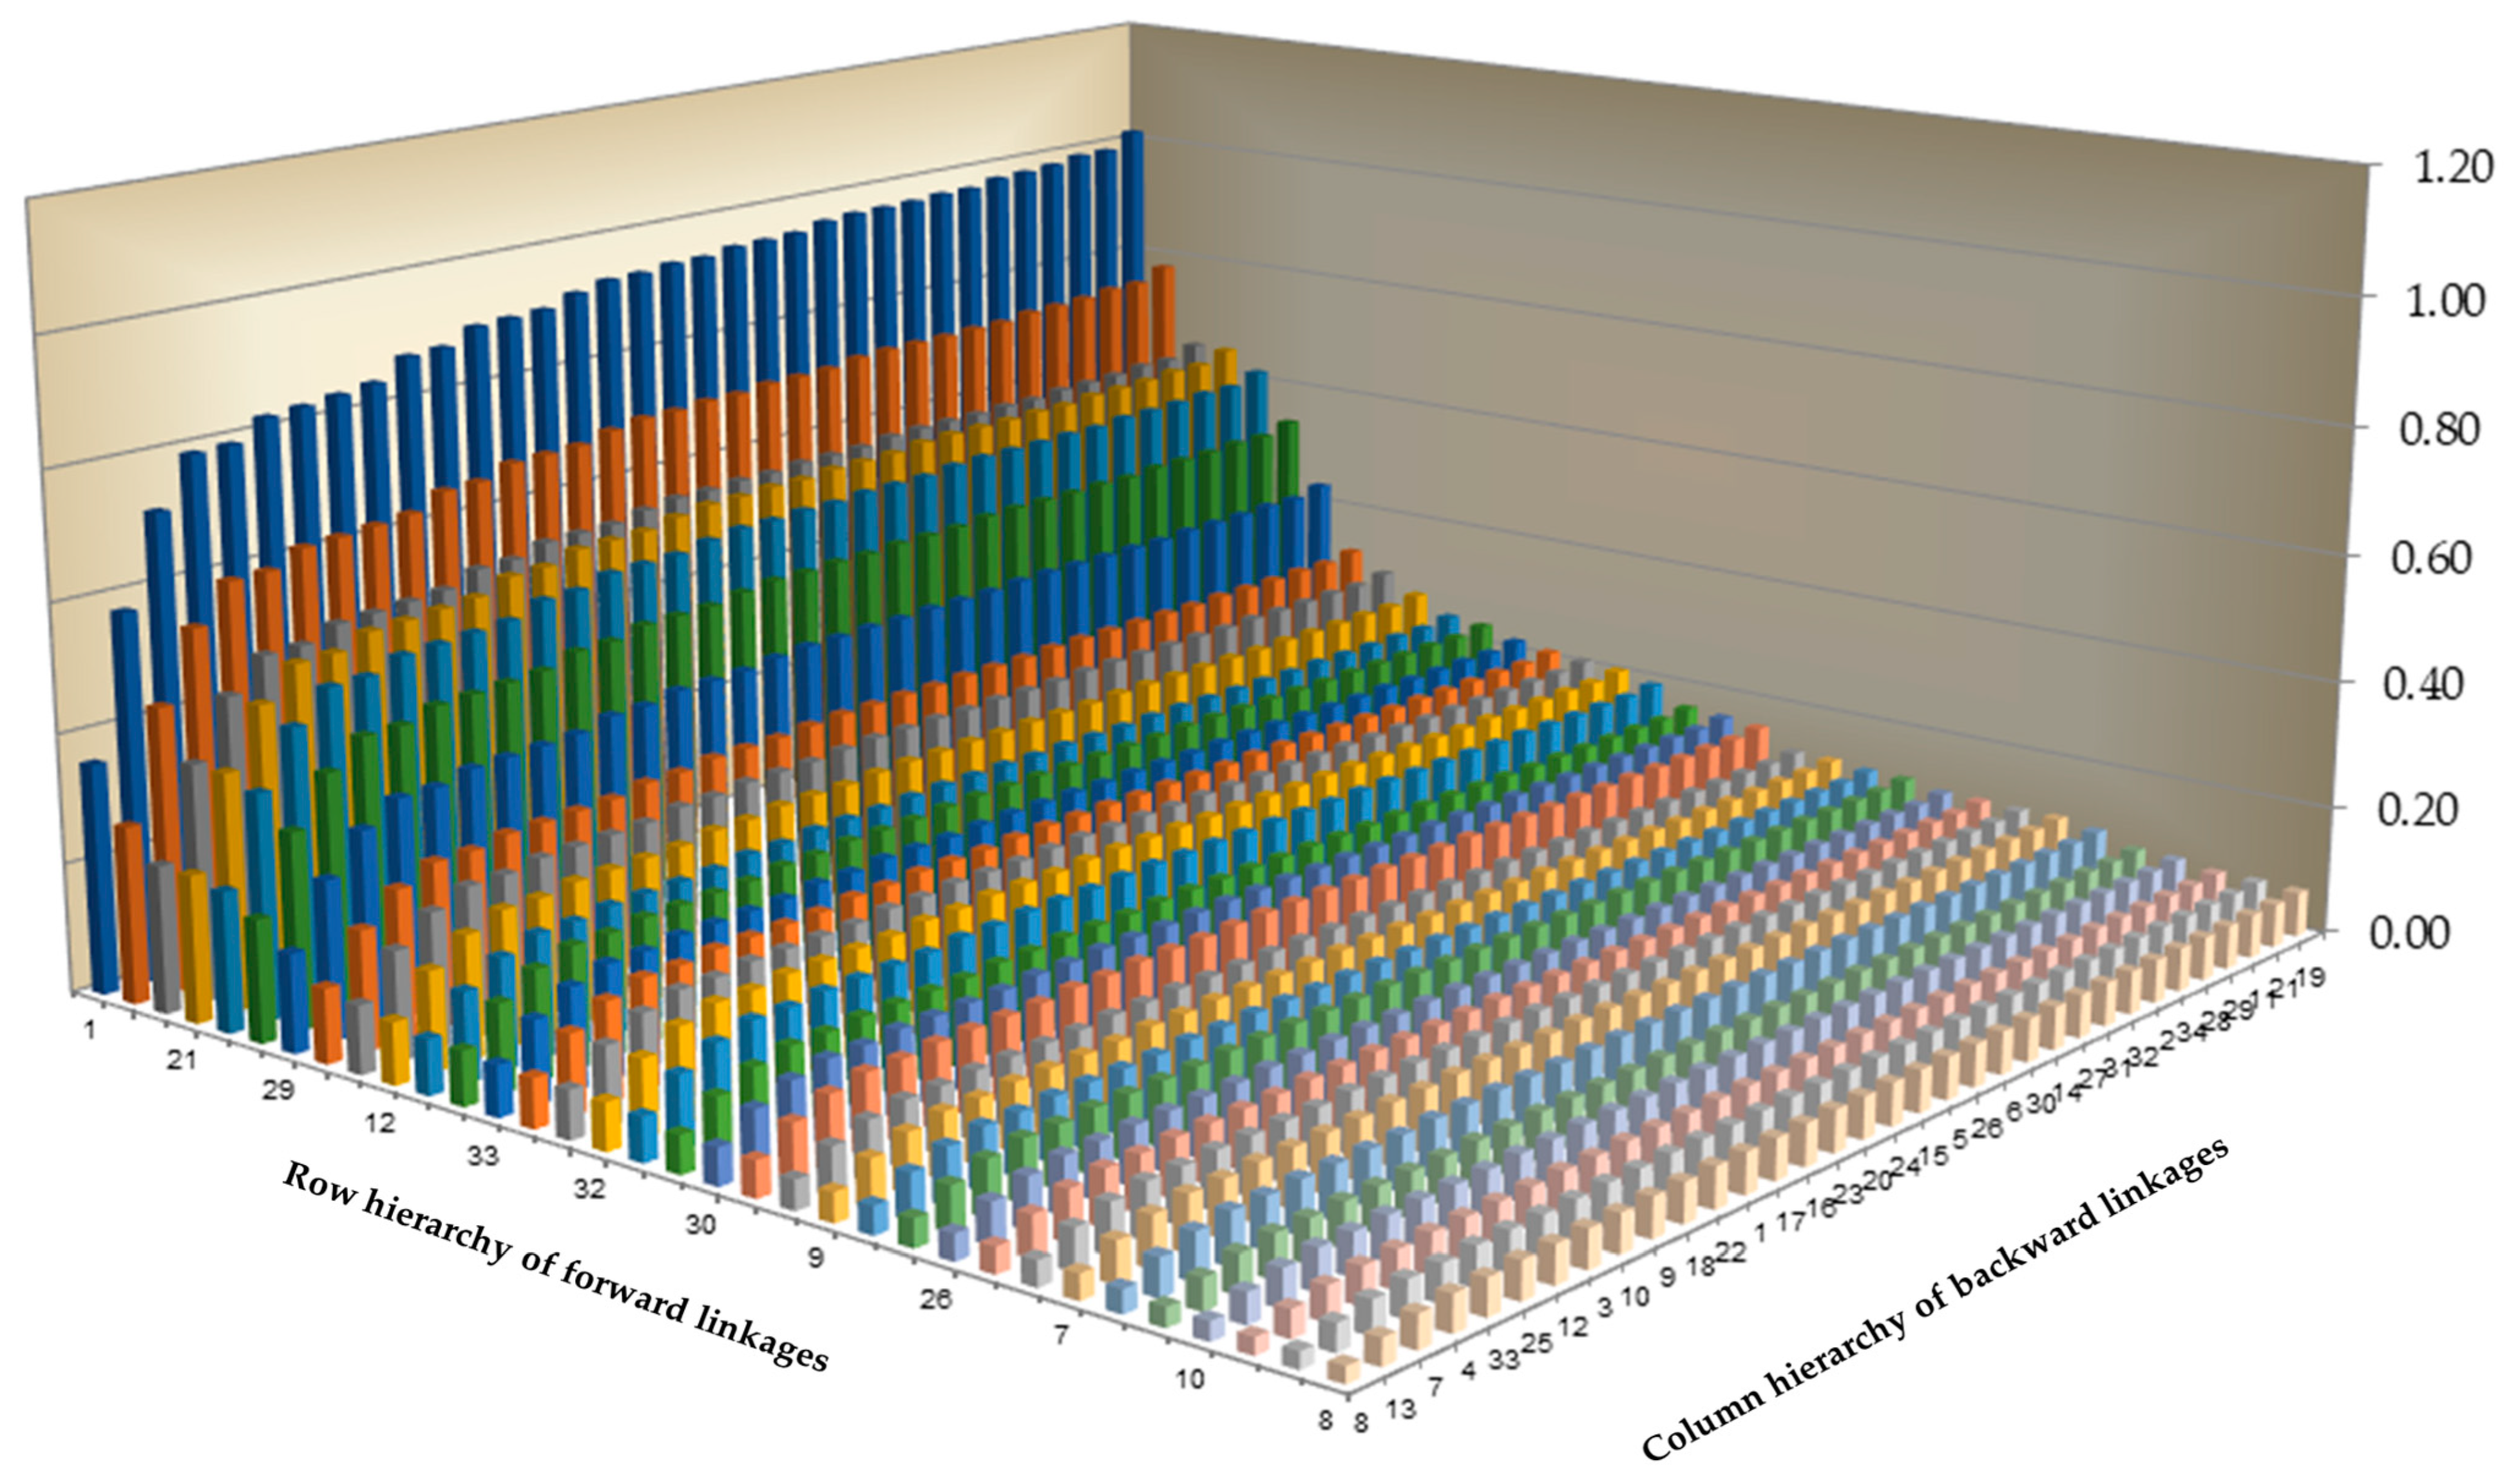
Figure 3 visualizes the distribution of sectors in the BL–FL space. Sectors located in the upper-right quadrant exhibit above-average performance in both dimensions, indicating a strong ability to both absorb and transmit economic shocks. Agriculture, hunting, forestry, and fishing (1), which records the highest forward linkage index, occupies a central position in this distribution, reflecting its role as a key supplier of intermediate inputs across the economy.
In contrast, sectors such as rubber and plastics (10), machinery (nec) (13), and coke, refined petroleum, and nuclear fuel (8) are positioned in the lower range of distribution, indicating limited intersectoral connectivity.
Table 3 (Backward Linkage) (Forward Linkage) provide a detailed classification of sectors based on alternative backward linkage (BL) and forward linkage (FL) thresholds. While a normalized value of one is commonly used to identify key sectors, this cutoff is inherently arbitrary and may affect the classification of sectors located near the threshold. In response to this concern, the analysis introduces multiple threshold values to assess the sensitivity and robustness of sectoral classification. This approach allows us to examine whether the identification of key sectors depends on the specific threshold chosen or reflects stable structural characteristics of the production network.
As shown in Table 3, increasing the backward linkage threshold from 1 to 1.10 reduces the set of key sectors to two, while no sector satisfies a threshold of 1.20. This pattern indicates that only a limited number of sectors exhibit strongly above-average backward linkages, suggesting that upstream dependence is concentrated on a small subset of the economy. By contrast, the Table 3 (Forward Linkage) shows that forward linkage patterns are more broadly distributed, with sectors (i.e., agriculture, hunting, forestry, and fishing (1), retail trade (21), inland transport (23), textiles and textile products (4), and other community, social and personal services (34)) consistently exceeding the threshold.
Retail trade (21) and other community, social and personal services (34) remain within the strongest backward linkage category across alternative thresholds, indicating that their centrality is not sensitive to the choice of cutoff value. Their high backward linkages reflect strong dependence on intermediate input from other sectors, implying that increases in final demand in these sectors generate relatively large multiplier effects throughout the economy.
Forward linkage patterns further clarify the structural roles of these sectors. Retail trade (21), with a forward linkage index of 1.19, functions as a key distribution channel linking production and final consumption. Similarly, inland transport (23) supports downstream production across multiple sectors, including agriculture and manufacturing, highlighting its role in facilitating intersectoral connectivity.
Agriculture, hunting, forestry, and fishing (1) exhibits the highest forward linkage index (1.87), indicating that its outputs serve as essential intermediate inputs for a wide range of downstream activities. Despite its relatively low export share (0.69%), its central position in the production network implies a disproportionate influence on economy-wide outcomes.
In contrast, sectors such as sale of motor vehicles and retail sale of fuel (19), other non-metallic mineral products (11), and financial intermediation (28) display strong backward linkages but relatively weak forward linkages, limiting their capacity to propagate economic effects across the production network.
In addition, textiles and textile products (4) are positioned within the strongly above-average category in terms of forward linkages, while sectors such as public administration (31), post and telecommunications (27), and renting of machinery and equipment (30) fall within the moderately above-average range of backward linkages and are also characterized by relatively high export intensity.
Overall, the results demonstrate that sectoral importance depends not only on export intensity but also on network position within the production structure. The use of multiple thresholds confirms that the identification of key sectors is robust to alternative classification criteria, reinforcing the validity of the linkage-based approach. This finding provides a consistent basis for the subsequent simulation analysis.
At the same time, this multi-threshold classification should be interpreted with caution. Consistent with the limitations of a static SAM framework, the results remain conditional on the fixed-coefficient assumption and do not capture behavioral responses or price adjustments. Nevertheless, the approach provides a more refined characterization of sectoral positions compared to single-threshold methods.

3.2. Sectoral Impact of Scenarios on GDP and Labor Income

This section evaluates how alternative allocations of export expansion translate into economy-wide outcomes through the production network. Although both scenarios impose the same aggregate export expansion (USD 55,344.33 million), they differ in how this expansion is distributed across sectors. The Foster diversification scenario assigns relatively greater weight to extensive sectors, whereas the current structure scenario concentrates growth within intensive sectors. Table 4 summarizes the resulting differences.
At the aggregate level, the Foster scenario yields modestly higher gains than the current structure scenario. GDP increases by 1.18% under the Foster scenario, compared to 1.16% under the current structure scenario. Similarly, total labor income reaches USD 54,590 million under the Foster scenario, slightly exceeding USD 54,442 million under the current structure scenario. While these differences are small in aggregate terms, they mask substantial variation at the sectoral level.
The results indicate that reallocating export expansion toward sectors with stronger intersectoral linkages leads to more effective propagation of economic gains. In particular, extensive sectors—despite their low initial export shares—generate relatively larger contributions to GDP. This reflects their position within the production network, where expansion introduces new intermediate demand and activates previously underutilized linkages.
Sector-level results further illustrate this mechanism. Agriculture, hunting, forestry, and fishing (1) contributes an additional USD 10.32 million to GDP under the Foster scenario relative to the current structure scenario. Notably, sectors such as retail trade (21) and inland transport (23), which have negligible direct export shares, generate additional labor income gains of approximately USD 12 million and USD 14 million, respectively. These outcomes highlight the importance of network position rather than export intensity in determining economy-wide impacts.
By contrast, sectors such as post and telecommunications (27) exhibit only limited increases in labor income under the current structure scenario. Similarly, renting of machinery and equipment (30) generates smaller gains despite receiving a larger share of export expansion.
These patterns can be explained by differences in linkage structure. Sectors with strong backward linkages but weak forward linkages are less able to transmit gains to downstream activities, limiting the overall multiplier effects of export expansion.
Overall, the results demonstrate that the allocation of export growth across sectors—conditional on the structure of intersectoral linkages—plays a critical role in determining the magnitude and distribution of economy-wide effects.

4. Discussion

This study contributes to the literature on export diversification by focusing on the role of sectoral allocation within the production network. While existing studies primarily examine diversification at an aggregate level, the present results show that the economic impact of export expansion depends critically on how it is distributed across sectors, conditional on their intersectoral linkages.
The findings indicate that sectors with strong linkage structures—particularly retail trade (21), inland transport (23), other community, social and personal services (34), and agriculture, hunting, forestry, and fishing (1)—generate larger economy-wide effects than traditional export-intensive sectors. This highlights a fundamental distinction between export intensity and network centrality. Even sectors with negligible direct export shares can play a central role in transmitting economic gains when they occupy structurally connected positions within the production network.
The sectoral results provide clear evidence of this mechanism. Retail trade (21) and inland transport (23) generate substantial labor income gains despite minimal export exposure, reflecting their strong integration with upstream and downstream activities. In contrast, some export-oriented sectors exhibit limited economy-wide effects due to weak forward linkages, which constrain the transmission of demand shocks across sectors.
These findings imply that export diversification strategies cannot be evaluated solely in terms of expanding existing export sectors. Instead, the effectiveness of diversification depends on how export growth interacts with domestic production structures. Allocating export expansion toward sectors with stronger intersectoral linkages enhances multiplier effects and improves the transmission of gains across the economy.
More broadly, the results suggest that sectoral importance for economic development is determined not only by export size but also by position within the production network. This perspective complements existing approaches based on product sophistication and export diversification by emphasizing the role of domestic structural connectivity.
Finally, several limitations should be acknowledged. The analysis is conducted within a static SAM framework with fixed coefficients and therefore does not capture behavioral responses, price adjustments, or dynamic structural changes over time. In addition, linkage-based sector identification reflects potential influence within the production network but does not account for supply constraints or institutional frictions. Future research could extend this framework using dynamic or recursive SAM models to evaluate longer-term structural effects.

5. Conclusions and Policy Implications

This study shows that the effectiveness of export diversification depends not only on the scale of export expansion but on its sectoral allocation. The results demonstrate that allocating export growth toward sectors with strong intersectoral linkages generates larger economy-wide gains than concentrating expansion in traditional export-intensive sectors.
In particular, sectors such as agriculture, hunting, forestry, and fishing (1), retail trade (21), inland transport (21) and other community, social and personal services (34) exhibit strong propagation effects despite their relatively low export shares. By contrast, several export-oriented sectors display limited multiplier effects due to weaker linkage structures, which restrict the transmission of gains across the economy.
These findings imply that export diversification strategies should move beyond a narrow focus on established export sectors. Instead, policy design should incorporate the structure of intersectoral linkages when determining sectoral priorities.
From a policy perspective, three implications follow. First, export promotion policies should be extended to high-linkage sectors, including services and agriculture, rather than focusing exclusively on manufacturing exports. Second, improving domestic connectivity—through transport infrastructure, logistics systems, and supply chain integration—is essential for strengthening the transmission of export growth. Third, targeted support for sectors with weak forward linkages, such as technological upgrading and digital infrastructure investment, can enhance their ability to propagate economic gains.
Overall, the results suggest that a network-based approach to export diversification can improve both the magnitude and distribution of economic gains. By aligning export expansion with the structure of the production network, policymakers can promote a more resilient and inclusive pattern of economic growth.

Author Contributions

The conceptualization of this study was carried out by M.J. and T.H. The methodology, investigation, resources, data curation and original draft preparation were undertaken by M.J. Formal analysis was conducted by M.J., T.H. and M.A.C. The review and editing of the manuscript were completed by T.H. and M.A.C. Supervision was provided by T.H. and M.A.C. and funding acquisition was secured by M.J. and T.H. All authors have read and agreed to the published version of the manuscript.

Funding

This research was supported by the Sophia University SPRING Project, which is funded by the Japan Science and Technology Agency (JST).

Data Availability Statement

Data supporting the reported results are available from the author upon reasonable request.

Acknowledgments

The author gratefully acknowledges Akira Kohsaka and Nguyen Vuong for their insightful comments on an earlier version of this paper presented at the 20th East Asian Economic Association International Conference. Their feedback substantially improved the clarity and overall quality of the study.

Conflicts of Interest

The authors declare no conflicts of interest. The funders had no role in the design of the study; in the collection, analyses, or interpretation of data; in the writing of the manuscript; or in the decision to publish the results.

Abbreviations

The following abbreviations are used in this manuscript:
IOTInput–Output Table
SAMSocial Accounting Matrix
ADBAsian Development Bank
LDCLeast Developed Country
CP1Chaina Plus one
SIMSIPSAMSocial Impact Simulation for Social Accounting Matrix
ERDIEconomic Research and Development Impact Department
LFSLabor Force Survey
RASBi-proportional Matrix Balancing Method

Appendix A

Table A1. Backward and Forward linkage of 34 sectors. The full table of BL and FL indices is given below.
Backward LinkagesValueForward LinkagesValue
Sale of Motor Vehicles and Retail Sale of Fuel1.14Agriculture, Hunting, Forestry, and Fishing1.87
Retail Trade1.11Other Community, Social, and Personal Services1.44
Other Nonmetallic Minerals1.11Textiles and Textile Products1.19
Real Estate Activities1.10Retail Trade1.19
Financial Intermediation1.10Inland Transport1.14
Other Community, Social, and Personal Services1.10Food, Beverages, and Tobacco0.99
Mining and Quarrying1.09Real Estate Activities0.79
Education1.09Financial Intermediation0.60
Public Administration and Defense1.08Construction0.54
Post and Telecommunications1.08Basic Metals and Fabricated Metals0.49
Electrical and Optical Equipment1.08Hotels and Restaurants0.44
Renting of Machinery and Equipment1.08Other Nonmetallic Minerals0.43
Wood and Products of Wood and Cork1.07Health and Social Work0.40
Other Supporting and Auxiliary Transport Activities1.06Manufacturing (nec) and Recycling0.39
Leather, Leather Products, and Footwear1.06Wholesale Trade 0.38
Transport Equipment1.05Education0.37
Water Transport1.05Electricity, Gas, and Water Supply0.35
Wholesale Trade1.05Leather, Leather Products, and Footwear0.30
Inland Transport1.04Renting of Machinery and Equipment0.29
Manufacturing (nec) and Recycling1.03Mining and Quarrying0.28
Electricity, Gas, and Water Supply1.01Sale of Motor Vehicles and Retail Sale of Fuel0.23
Agriculture, Hunting, Forestry, and Fishing1.01Chemicals and Chemical Products0.23
Hotels and Restaurants1.01Public Administration and Defense0.22
Construction0.98Wood and Products of Wood and Cork0.21
Chemicals and Chemical Products0.98Other Supporting and Auxiliary Transport Activities 0.20
Rubber and Plastics0.94Transport Equipment0.19
Food, Beverages, and Tobacco0.9Water Transport0.19
Basic Metals and Fabricated Metals0.93Pulp, Paper, Paper Products, Printing, and Publishing0.19
Air Transport0.92Post and Telecommunications0.18
Health and Social work0.89Air Transport0.15
Textiles and Textile Products0.89Rubber and Plastics0.14
Pulp, Paper, Paper Products, Printing, and Publishing0.80Machinery, nec0.13
Machinery, nec0.64Electrical and Optical Equipment0.13
Coke, Refined Petroleum, and Nuclear Fuel0.40Coke, Refined Petroleum, and Nuclear Fuel0.12
Table A2. GDP, Export and Import share based on 2022 SAM.
CodeSectorsExport %Import %GDP %
1Agriculture, Hunting, Forestry, and Fishing0.699.2012.21
2Mining and Quarrying0.010.281.59
3Food, Beverages, and Tobacco1.978.022.08
4Textiles and Textile Products75.2127.177.07
5Leather, Leather Products, and Footwear3.870.710.82
6Wood and Products of Wood and Cork0.060.340.42
7Pulp, Paper, Paper Products, Printing, and Publishing0.111.030.22
8Coke, Refined Petroleum, and Nuclear Fuel0.000.010.00
9Chemicals and Chemical Products0.670.770.52
10Rubber and Plastics0.140.340.13
11Other Nonmetallic Minerals0.160.803.11
12Basic Metals and Fabricated Metals0.167.541.35
13Machinery, nec0.110.350.05
14Electrical and Optical Equipment0.310.050.08
15Transport Equipment0.391.112.00
16Manufacturing (nec) and Recycling1.742.872.41
17Electricity, Gas, and Water Supply0.001.511.35
18Construction0.8619.948.99
19Sale of Motor Vehicles and Retail Sale of Fuel0.000.030.84
20Wholesale Trade 0.001.122.93
21Retail Trade0.000.429.56
22Hotels and Restaurants0.732.161.01
23Inland Transport0.004.197.16
24Water Transport0.100.250.44
25Air Transport0.420.300.05
26Other Supporting and Auxiliary Transport Activities0.000.170.43
27Post and Telecommunications6.840.341.07
28Financial Intermediation0.570.844.16
29Real Estate Activities0.000.195.92
30Renting of Machinery and Equipment3.690.431.61
31Public Administration and Defense1.061.033.97
32Education0.000.603.16
33Health and Social Work0.004.112.56
34Other Community, Social, and Personal services0.111.7610.73

References

  1. Constantine, C. Economic Structures, Institutions, and Economic Performance. J. Econ. Struct. 2017, 6, 2. [Google Scholar] [CrossRef] [Scilit]
  2. Krüger, J.J. Productivity and Structural Change: A Review of Literature. J. Econ. Surv. 2008, 22, 330–363. [Google Scholar] [CrossRef] [Scilit]
  3. Khondker, B.H. Backward and Forward Linkages in the Bangladesh Economy: Application of the Social Accounting Matrix Framework. In South Asia Economic and Policy Studies; Palgrave Macmillan: Singapore, 2018; pp. 171–187. [Google Scholar] [CrossRef] [Scilit]
  4. Huq, M.T.; Ichihashi, M. Prospective Accelerating Sectors to Attain Sustainable Development in the Bangladesh Economy: Findings from a Sectoral Approach Using Input-Output Analysis. Sustainability 2023, 15, 2651. [Google Scholar] [CrossRef] [Scilit]
  5. Ginting, E.; Razzaque, M.A.; Hasan, R. Export Diversification in Bangladesh: Overcoming Policy Impediments. Asian Econ. Policy Rev. 2024, 20, 57–75. [Google Scholar] [CrossRef] [Scilit]
  6. Razzaque, M.A. Revitalizing Bangladesh’s Export Trade: Policy Issues for Growth Acceleration and Diversification; Bangladesh Enterprise Institute: Dhaka, Bangladesh, 2017. [Google Scholar] [CrossRef]
  7. Azam, M.; Azam, S. Export diversification and economic growth in Bangladesh. J. Empir. Stud. 2023, 10, 1–18. [Google Scholar] [CrossRef] [Scilit]
  8. Rashid, H. Bangladesh’s Transition from Least-Developed-Country Status: Navigating Export Challenges in a New Era. Asian J. Econ. Bus. Account. 2025, 25, 74–91. [Google Scholar] [CrossRef] [Scilit]
  9. Hussain, Z.; Rizwan, N. Bangladesh Development Update; World Bank: Washington, DC, USA, 2013; Available online: http://documents.worldbank.org/curated/en/944031468212071200 (accessed on 12 December 2025).
  10. Valenzuela, E.; Gunasekera, D. Least developed countries’ graduation: Effects of preferential market access loss and investment benefits. SSRN Electron. J. 2020, 1–37. [Google Scholar] [CrossRef] [Scilit]
  11. Asian Development Bank. Bangladesh Input–Output Tables and Analysis, 2000–2022 (Updated 15 July 2023). Economics Research and Development Impact Department (ERDI). Asian Development Bank. 2018. Available online: https://data.adb.org/dataset/bangladesh-input-output-economic-indicators (accessed on 25 April 2024).
  12. New Age. Bangladesh’s RMG Exports to US Cross $10b in 2022, 2023. Available online: https://www.newagebd.net/article/193941/bangladeshs-rmg-exports-to-us-cross-10b-in-2022#:~:text=Readymade%20garment%20exports%20from%20Bangladesh%20to%20the,cent%20in%202021%2C%20the%20OTEXA%20data%20showed (accessed on 26 January 2026).
  13. Rahaman, M.; Pranta, A.; Chandrow, O.; Das, N.; Khatun, M.; Arafat, M.; Sami, W. COVID-19 Pandemic and the Future of China-Plus-One Strategy in Apparel Trade: A Critical Analysis from Bangladesh-Vietnam Point of View. Open J. Bus. Manag. 2021, 9, 2183–2196. [Google Scholar] [CrossRef]
  14. Ali, M.; Qun, W.; Hossain, M.E. Revealed Comparative Advantage of Textile and Clothing Industry of Bangladesh in the North American Market. J. Bus. Manag. Econ. Res. 2019, 3, 28–42. [Google Scholar] [CrossRef] [Scilit]
  15. Jung, H.; Alba, J.D.; Park, D. Effects of Hub-and-Spoke Free Trade Agreements on Trade: A Panel Data Analysis. World Dev. 2010, 38, 1105–1113. [Google Scholar] [CrossRef] [Scilit]
  16. Hannan, S.A. The Impact of Trade Agreements: New Approach, New Insights; IMF Working Papers 2016/117; International Monetary Fund: Washington, DC, USA, 2016. [Google Scholar] [CrossRef] [Scilit]
  17. Baier, S.L.; Bergstrand, J.H. Do Free Trade Agreements Actually Increase Members’ International Trade? J. Int. Econ. 2006, 71, 72–95. [Google Scholar] [CrossRef] [Scilit]
  18. Foster, N.; Poeschl, J.; Stehrer, R. The impact of Preferential Trade Agreements on the margins of international trade. Econ. Syst. 2010, 35, 84–97. [Google Scholar] [CrossRef] [Scilit]
  19. Cardenete, M.A.; Sancho, F. Missing Links in Key Sector Analysis. Econ. Syst. Res. 2006, 18, 319–325. [Google Scholar] [CrossRef] [Scilit]
  20. Scandizzo, P.L.; Ferrarese, C. Social Accounting Matrix: A New Estimation Methodology. J. Policy Model. 2015, 37, 14–34. [Google Scholar] [CrossRef] [Scilit]
  21. ERDI. Bangladesh: Input-Output Economic Indicators (National Input-Output Tables); Asian Development Bank: Mandaluyong City, Philippines, 2023. [Google Scholar]
  22. Bangladesh Bureau of Statistics (BBS). Bangladesh Labor Force Survey 2022; International Labor Organization Survey Catalog; Reference ID: Bgd_2022_lfs_v01_m_ilo_var; Bangladesh Bureau of Statistics (BBS): Dhaka, Bangladesh, 2026.
  23. Villegas, P.; Del Carmen Delgado, M.; Cardenete, M.A. The Economic Impact of a Tourist Tax in Andalusia Examined through a Price-Effect Model. Appl. Econ. Lett. 2022, 31, 96–101. [Google Scholar] [CrossRef] [Scilit]
  24. Marca, M.L.; Jiang, X. From IO and Supply-and-Use to Social Accounting Matrix Analysis. In How to Measure and Model Social and Employment Outcomes of Climate and Sustainable Development Policies; International Labour Organization: Geneva, Switzerland, 2017; pp. 157–202. [Google Scholar]
  25. Parra, J.C.; Wodon, Q. A Tool for the Analysis of Input-Output Tables and Social Accounting Matrices; World Bank: Washington, DC, USA, 2009. [Google Scholar]
  26. Rasmussen, P. Studies in Inter-Sectorial Relations; Einar Harks: Copenhagen, Denmark, 1956. [Google Scholar]
  27. Leontief, W. The Dynamic Inverse. In Contributions to Input-Output Analysis; Carter, A.P., Brody, A., Eds.; North-Holland: Amsterdam, The Netherlands, 1970; Volume 1, pp. 17–46. [Google Scholar]
  28. Guilhoto, J.J.M.; Sonis, M.; Hewings, G.J. Multiplier Product Matrix Analysis for Interregional Input-Output Systems: An Application to the Brazilian Economy; MPRA Paper No. 54671; University Library of Munich: Munich, Germany, 1999; Available online: https://mpra.ub.uni-muenchen.de/id/eprint/54671 (accessed on 7 December 2025).
  29. Augustinovics, M. Methods of International and Intertemporal Comparison of Structure. In Contributions to Input-Output Analysis; Carter, A.P., Bródy, A., Eds.; North-Holland: Amsterdam, The Netherlands, 1970; pp. 249–269. [Google Scholar]
Figure 1. Export shares of the textile sector and other sectors in Bangladesh, 2015–2022.
Sustainability 18 04265 g001
Figure 2. Steps followed in the construction of Bangladesh SAM 2022.
Sustainability 18 04265 g002
Figure 3. Economic landscapes 34 sectors of Bangladesh 2022.
Sustainability 18 04265 g003
Table 1. Export diversification simulation scenarios.
ScenarioShock DesignMagnitudeAssumptionsRationale
Current structure scenarioExport expansion allocated exclusively to intensive sectors (export share > 1%), proportional to their existing export sharesTotal export expansion applied only to intensive sectors; no change in extensive sectorsSectoral allocation reflects the existing export structureRepresents a concentration-driven growth pattern where expansion reinforces dominant (intensive) export sectors
Foster diversification scenarioExport expansion distributed across both intensive and extensive sectors, with differentiated growth rates+7% growth in extensive sectors (export share < 1%) and +4% in intensive sectors, calibrated to maintain a consistent aggregate export shockExport growth follows differentiated expansion across sectors based on initial export positionsEvaluates whether reallocating export growth toward underrepresented (extensive) sectors enhances economy-wide outcomes
Table 2. Distribution of export expansion under alternative diversification scenarios (million USD).
CodeSectorTypeBaseline
(SAM)
Foster
Scenario
Current Structure Scenario
1Agriculture, Hunting, Forestry, and FishingExtensive368.63395.47368.63
2Mining and QuarryingExtensive7.197.717.19
3Food, Beverages, and TobaccoIntensive1047.301089.501097.42
4Textiles and Textile ProductsIntensive39,942.2841,551.9541,627.00
5Leather, Leather Products, and FootwearIntensive2055.352138.182246.94
6Wood and Products of Wood and CorkExtensive31.4033.6831.40
7Pulp, Paper, Paper Products, Printing, and PublishingExtensive60.0964.4760.09
8Coke, Refined Petroleum, and Nuclear FuelExtensive0.150.160.15
9Chemicals and Chemical ProductsExtensive357.24383.25357.24
10Rubber and PlasticsExtensive72.6677.9572.66
11Other Non-Metallic Mineral ProductsExtensive86.2892.5786.28
12Basic Metals and Fabricated MetalsExtensive86.5292.8286.52
13Machinery (nec)Extensive60.8265.2560.82
14Electrical and Optical EquipmentExtensive164.97176.98164.97
15Transport EquipmentExtensive209.62224.88209.62
16Manufacturing (nec) and RecyclingIntensive923.09960.29971.97
17Electricity, Gas, and Water SupplyExtensive0.000.000.00
18ConstructionExtensive459.28492.72459.28
19Sale of Motor Vehicles and Retail Sale of FuelExtensive0.000.000.00
20Wholesale Trade Extensive0.000.000.00
21Retail TradeExtensive0.000.000.00
22Hotels and RestaurantsExtensive388.26416.52388.26
23Inland TransportExtensive0.000.000.00
24Water TransportExtensive50.5254.2050.52
25Air TransportExtensive225.61242.04225.61
26Other Supporting and Auxiliary Transport ActivitiesExtensive0.000.000.00
27Post and Telecommunications Intensive3630.263776.563783.20
28Financial IntermediationExtensive301.54323.49301.54
29Real Estate ActivitiesExtensive0.000.000.00
30Renting of Machinery and Equipment Intensive1959.032037.982041.56
31Public Administration and DefenseIntensive561.59584.23588.25
32EducationExtensive1.251.341.25
33Health and Social WorkExtensive0.000.000.00
34Other Community, Social, and Personal ServicesExtensive56.0560.1356.05
Total 53,107.0055,344.3355,344.33
Note: Foster denotes the extensive-led diversification scenario, in which export expansion is implemented through differentiated growth rates across sectors, with a 7% increase in extensive sectors and a 4% increase in intensive sectors. The current structure scenario represents a business-as-usual pattern, in which the export increase derived from the Foster scenario is reallocated proportionally across intensive sectors based on their 2022 export shares. Extensive sectors are defined as those with export shares below 1%, while intensive sectors exceed this threshold in the 2022 SAM. In each scenario, the resulting changes in exports are introduced as shocks to the final demand vector within the SAM framework. “nec” denotes “not elsewhere classified.” Source: Author’s estimation.
Table 3. Sector Classification Based on Backward Linkage (BL) Thresholds and Forward Linkage (FL) Thresholds.
(Backward Linkage)
Rank0.95 < BL < 11 < BL < 1.10BL > 1.10
1Construction (18)Mining and Quarrying (2)Sale of Motor Vehicles and Retail Sale of Fuel (19)
2Chemicals and Chemical Products (9)Education (32)Retail Trade (21)
3Rubber and Plastics (10)Public Administration and Defense (31)Other Non-Metallic Mineral Products (11)
4Post and Telecommunications (27)Real Estate Activities (29)
5Electrical and Optical Equipment (14)Financial Intermediation (28)
6Renting of Machinery and Equipment (30)Other Community, Social, and Personal Services (34)
7Wood and Products of Wood and Cork (6)
8Other Supporting and Auxiliary Transport Activities (26)
9Leather, Leather Products, and Footwear (5)
10Transport Equipment (15)
11Water Transport (24)
12Wholesale Trade (20)
13Inland Transport (23)
14Manufacturing (nec) and Recycling (16)
15Electricity, Gas, and Water Supply (17)
16Agriculture, Hunting, Forestry, and Fishing (1)
17Hotels and Restaurants (22)
(Forward Linkage)
Rank0.95 < FL < 11 < FL < 1.10FL > 1.10
1Food, Beverages, and Tobacco (3)Agriculture, Hunting, Forestry, and Fishing (1)
2Textiles and Textile Products (4)
3Retail Trade (21)
4Inland Transport (23)
5Other Community, Social, and Personal Services (34)
Note: Sectors are classified based on normalized backward (BL, (Backward Linkage)) and forward (FL, Forward Linkage)) linkage indices using alternative threshold ranges to assess the sensitivity of key sector identification. All sectors within each interval are reported in ascending order. Rankings are provided within each linkage interval. See Appendix A Table A1 for the full table. “nec” denotes “not elsewhere classified.” Source: Author’s calculations.
Table 4. GDP and Labor Income Effects under Alternative Scenarios (million USD).
SectorFoster Diversification ScenarioCurrent Structure
Diversification Scenario
Contribution toContribution to
GDPLabor
Income
GDPLabor
Income
Agriculture, hunting, forestry, and fishing (1)578.9325,851.00567.8025,354.40
Other community, social, and personal services (34)454.462690.50444.142628.70
Retail Trade (21)373.83857.90368.26845.30
Inland Transport (23)293.832267.90291.952253.00
Sale of Motor Vehicles and Retail Sale of Fuel (19)35.75307.4035.75307.40
Textiles and Textile Products (4)722.3620,789.80752.9121,669.10
Post and Telecommunications (27)117.3342.80120.6743.30
Financial Intermediation (28)205.81158.70189.20145.90
Public administration and defense (31)50.9961.3053.2864.10
Renting of Machinery and Equipment (30)108.8664.30107.7763.80
Total Change4161.6954,5904110.7454,442
% Change (GDP)1.18% 1.16%
Note: Contribution to GDP represents total economy-wide output, while labor income denotes total earnings accruing to labor across all sectors. Both are reported in million USD as deviations from the baseline scenario. Source: Author’s calculations.
Disclaimer/Publisher’s Note: The statements, opinions and data contained in all publications are solely those of the individual author(s) and contributor(s) and not of MDPI and/or the editor(s). MDPI and/or the editor(s) disclaim responsibility for any injury to people or property resulting from any ideas, methods, instructions or products referred to in the content.