Article

An Analysis of the Decoupling Effect of Carbon Emission Decomposition and Industrial Economic Development in Anhui Province, China

School of Business, Guilin University of Technology, Guilin 541006, China
*
Author to whom correspondence should be addressed.
Sustainability 2026, 18(9), 4217; https://doi.org/10.3390/su18094217
Submission received: 8 March 2026 / Revised: 12 April 2026 / Accepted: 20 April 2026 / Published: 23 April 2026

Abstract

Anhui Province is a crucial industrial province in China, and its carbon emission reduction work is of overarching importance as a model for the upgrading of traditional industrial industries in other regions of China. The exploratory practice in Anhui Province offers other regions exemplary models and methodologies to emulate, facilitating the transition of conventional sectors in the country towards a low-carbon and environmentally sustainable paradigm. This paper examines the decoupling state of industrial economic growth from resources and the environment by quantifying carbon emissions across 14 major industrial sectors in Anhui Province from 2007 to 2021. The intensity and structure of these emissions are analyzed using the Tapio decoupling model and the LMDI model, which connect resources and the environment. It is concluded that the inhibitory effect of energy structure and energy intensity on industrial carbon emissions is intensifying, while the carbon–economy decoupling index for 14 major industrial sectors is on a downward trend, and the traditional high-energy-consuming industries, particularly iron, steel, and coal, upon which Anhui Province depends, have been decoupled from industrial economic growth due to enhancements in energy structure. This paper ultimately presents a series of specific recommendations for enhancing future carbon emission reduction across a range of diverse industrial sectors.

1. Introduction

From the Industrial Revolution onward, extensive increases in the use of fossil fuels and accelerated industrialization have significantly increased global carbon dioxide levels [1]. The International Energy Agency (IEA) has reported that the industrial sector contributes around 25% of total world carbon emissions, positioning it as the second largest source of emissions following energy generation [2]. In industrial production, high-energy-consuming industries such as iron and steel, cement, and chemicals produce large amounts of CO 2 , accounting for approximately 70% of direct industrial emissions. Controlling carbon emissions from the industrial sector is one of the most important strategies to combat global warming [3], yet achieving carbon reduction in the industrial sector has numerous challenges: industrial production necessitates substantial fossil fuel consumption, and achieving a complete transition to clean energy in the short term poses significant challenges. Some industrial production itself inevitably produces CO 2 , which cannot be mitigated solely through enhanced energy efficiency or the adoption of cleaner energy sources [4]. The research, development, and implementation of technologies for industrial emission reduction frequently demand considerable capital investment, leading many enterprises to refrain from large-scale upgrades of emission reduction technologies [5]. For the past few years, the Chinese government has implemented several steps to diminish carbon emissions from the industrial sector and investigate viable strategies for additional emission reductions within industrial sector. The Energy Conservation and Carbon Reduction Action Program for 2024–2025, issued by the State Council, mandated that non-fossil energy consumption constituted approximately 20% by 2025; that energy-saving and carbon-reducing renovations in core areas and industries form energy savings of about 50 million tons of standard coal and carbon dioxide emission reductions of about 130 million tons; and that the best efforts be made to complete the “14th Five-Year Plan” energy-saving and carbon reduction binding targets.
Anhui Province is a key province in Central China, and it plays a pivotal role in the reduction in industrial carbon emissions, influencing other provinces in the central area [6]. However, it is marked by the substantial reliance of its industrial sectors on resources and considerable environmental stress. Within this context, this paper analyzes the drivers of carbon emissions across 14 major industrial sectors in Anhui Province, as well as the decoupling relationship between carbon emissions and industrial economic development. It employs the Tapio decoupling model and the Logarithmic Mean Decomposition Index (LMDI) to assess the extent of carbon emission decoupling in Anhui Province [7].
Earlier researchers have mostly examined the correlation between carbon emissions and economic development from national and regional viewpoints. Li et al. [8] examined the effects of structural transformations in the economy, energy sector, society, and trade on carbon emissions across 147 nations. Wang et al. [9] examined the impact of research and development on the decoupling of economic growth from carbon emissions in the United States. Wei et al. [10] examined the correlation between economic development in agriculture and animal husbandry in Henan Province and carbon emissions from both a spatial and temporal perspective. Song et al. [11] explored the path of digital economic development on carbon and carbon emission efficiency from spatial differences. As evidenced by the aforementioned research, few researchers have investigated the relationship between carbon emissions and economic development across different stages, overlooking the variations observed across different sectors; consequently, the conclusions and recommendations drawn are not entirely applicable to specific industries.
A literature survey indicates that numerous scholars have examined carbon emissions by integrating decoupling analysis with other research. Li et al. [12] integrate carbon emissions and tourist technical efficiency to improve tourism green productivity, advance tourism ecological civilization, and foster high-quality economic development in the tourism sector. Zhou et al. [13] explore the driving factors of carbon emissions and the evolutionary characteristics of decoupling trends in China’s power sector from a production and consumption perspective amidst China’s “dual carbon” goals. Amara et al. [14] analyze the influence of eco-innovation on carbon emissions and FDI moderating the GDP–eco-innovation relationship. Raza [15] and Yang [16] employ the Tapio model to evaluate the mitigation potential of CO 2 emissions. Engo [17] employs the LMDI to examine the five factors influencing the decoupling of carbon emissions in the transportation sector. Ozdemir [18] integrates the Tapio model with the LMDI methodology to disaggregate and isolate emissions associated with fossil fuels and electricity production.
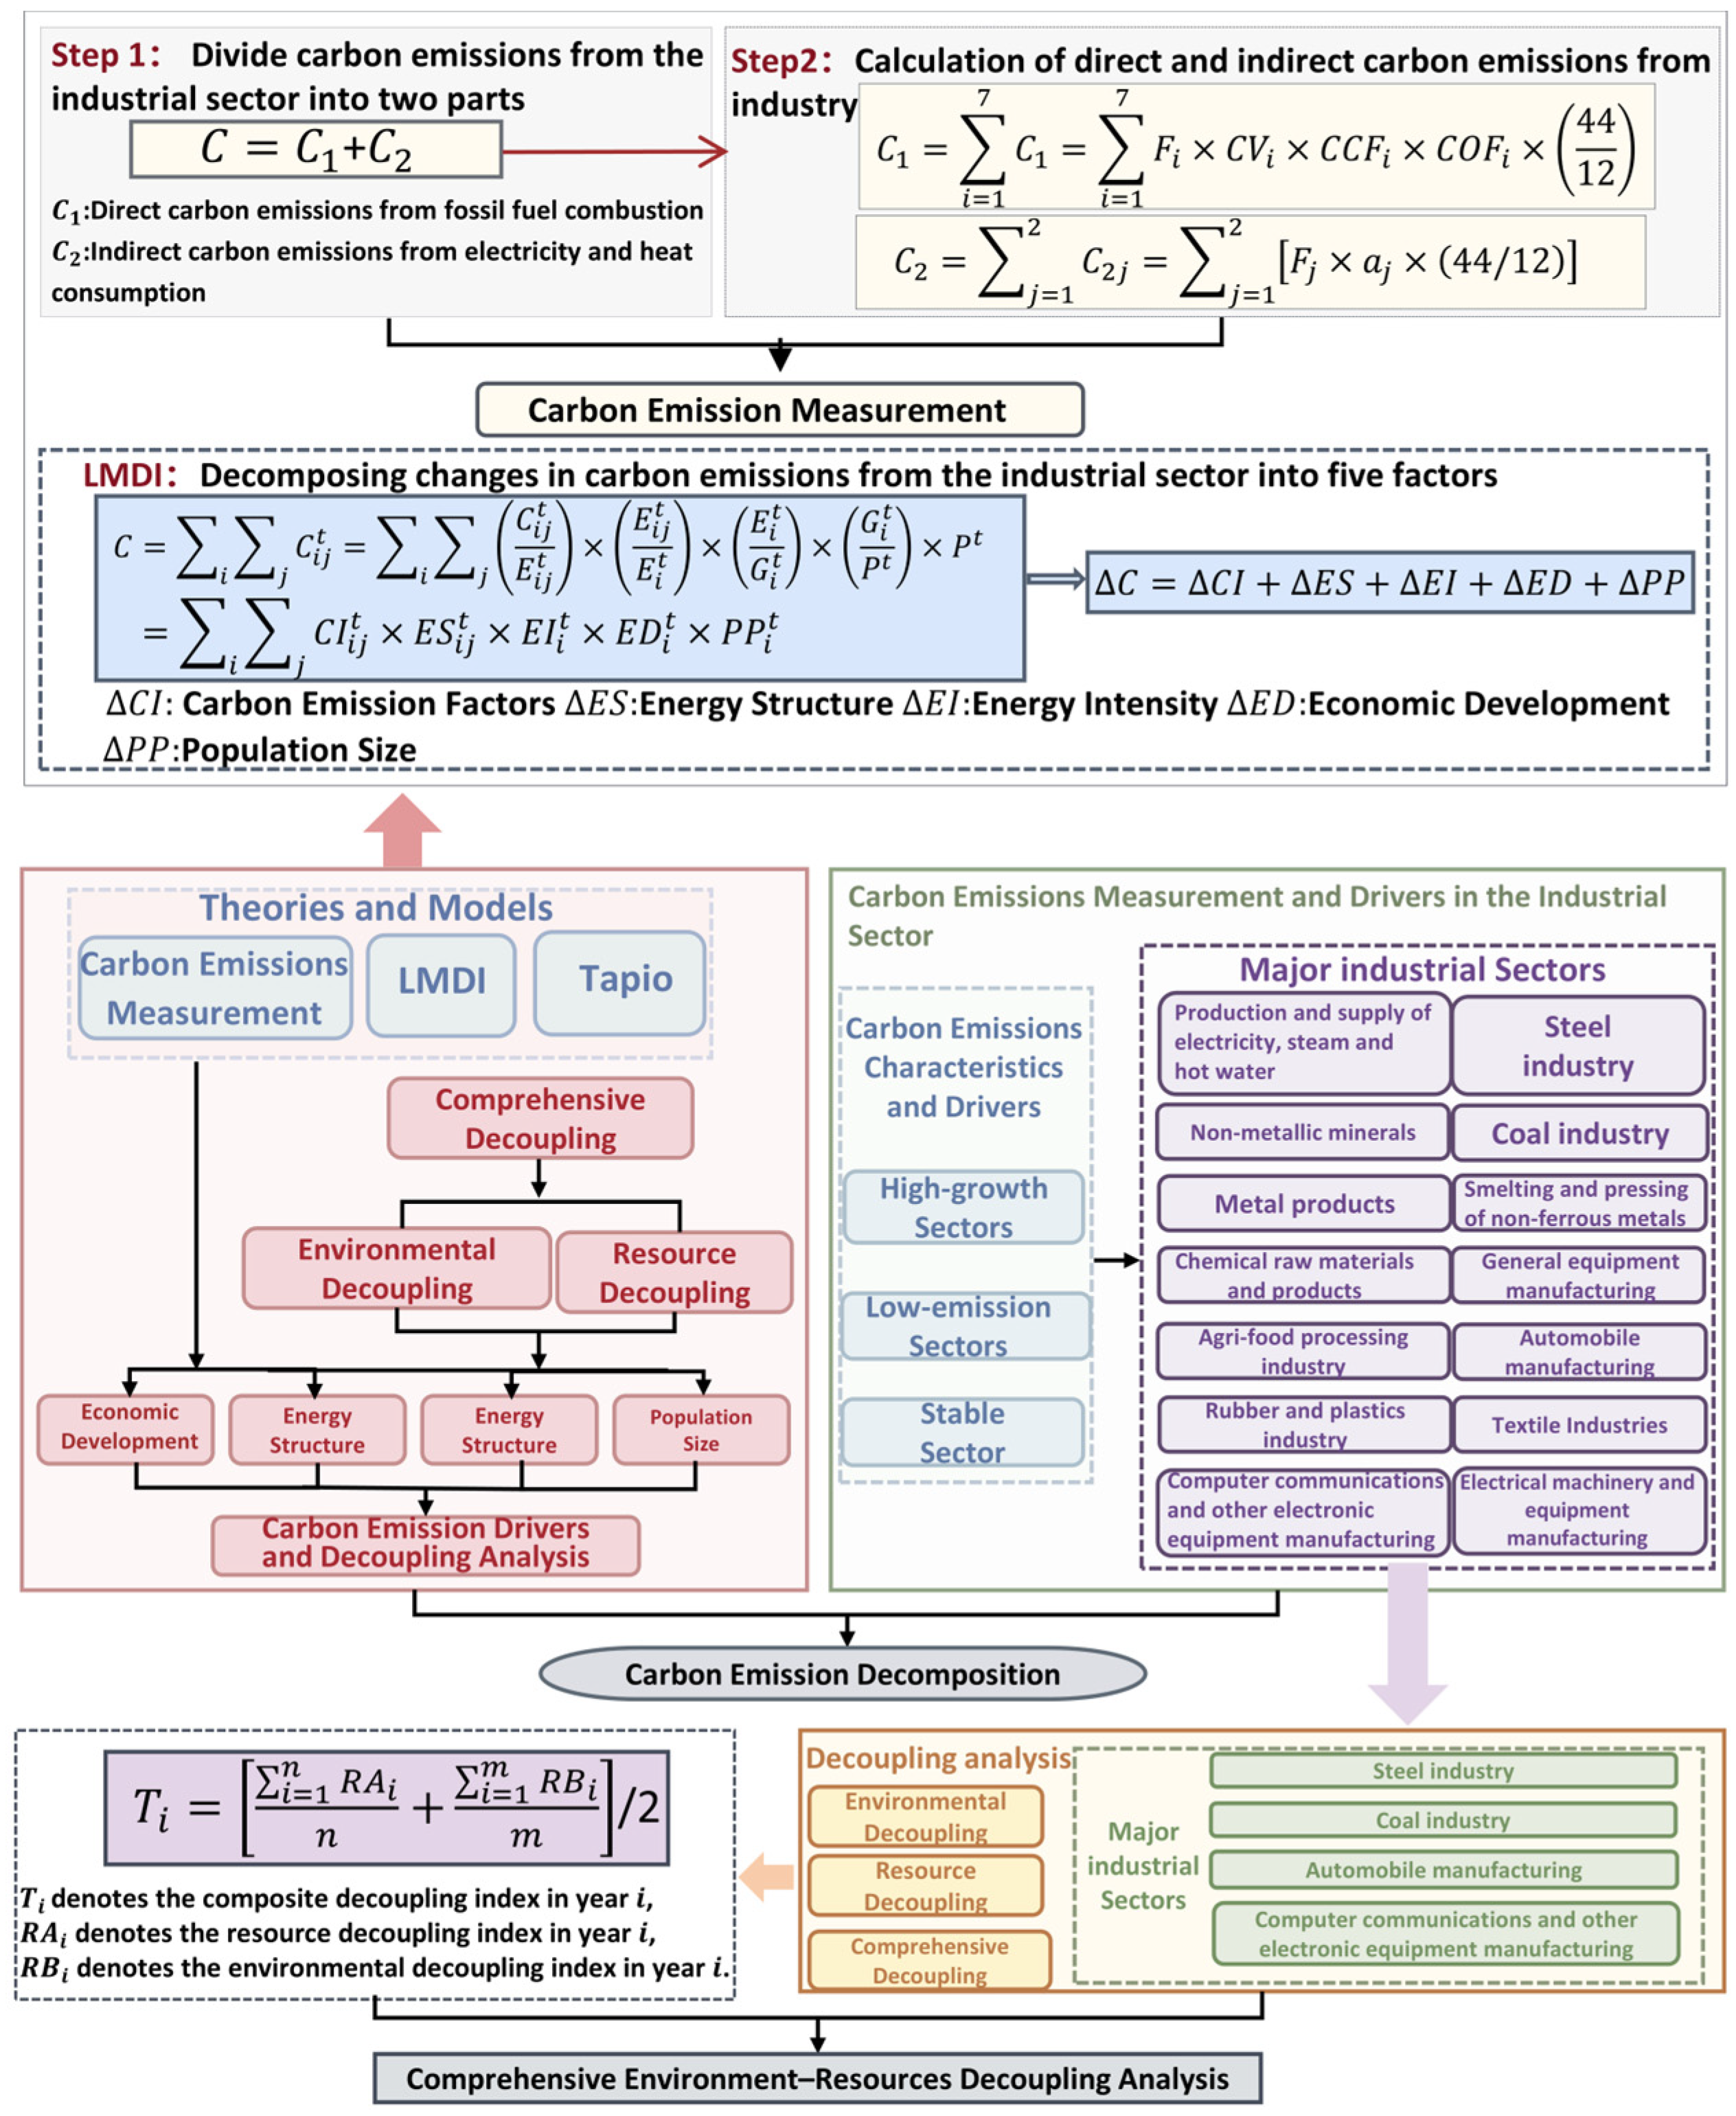
The aforementioned analysis indicates that employing decoupling methods to examine the correlation between carbon emissions and economic growth has become a prevalent approach, while the application of the LMDI method for micro-level driver analysis has gained substantial recognition. Nevertheless, current research mostly analyzes the driving causes of carbon emissions at the country or regional level or in a certain industry but lacks an analysis of differences between industry sectors, making it difficult to effectively guide specific carbon emission reduction practices. The present study employs indicator decomposition analysis (IDA) and structural decomposition analysis (SDA) to explore the driving factors of industrial carbon emissions. As one of the types components of IDA, the LMDI is widely used because it can be analyzed and compared in multiple stages, the data is more readily obtainable, the results are intuitive, and decomposition is performed without incurring any residual error. Therefore, the objective of this study is to utilize the LMDI method to analyze the driving factors of carbon emissions in 14 major industrial subdivisions. The Tapio model is employed in conjunction with a decoupling analysis to provide targeted recommendations for Anhui Province in the drafting of future carbon emission reduction programs (Figure 1). It is also anticipated that this research will yield valuable insights for regions and industries grappling with challenges including heavy resource dependence and substantial environmental pressures within their industrial sectors. Accordingly, this paper makes several potential contributions: On the one hand, by examining carbon emission characteristics and decoupling trends across diverse industrial segments, this study facilitates cross-sectoral comparisons, enabling policymakers to formulate more targeted and effective sector-specific policies and thus advance green and sustainable economic development. On the other hand, the empirical results and conclusions of this research could be a valuable point of consideration for other provinces and regions.

2. Methodology and Data Sources

2.1. Research Methodology

2.1.1. Measurement of Industrial Carbon Emissions

Carbon emissions from the industrial sector are divided into two parts: direct carbon emissions resulting from fossil fuel combustion and indirect carbon emissions arising from electricity and heat consumption (Equation (1)).
C = C 1 + C 2
Raw coal, coke, crude oil, gasoline, kerosene, diesel fuel, fuel oil, electricity, and natural gas are considered for the calculation of carbon emissions. The details are illustrated in Equation (2) [19]:
C 1 = i = 1 9 C 1 = i = 1 9 F i × C V i × C C F i × C O F i × 44 12
The energy category is symbolized by j; C 1 represents the total direct carbon emissions from industry; F refers to end-use energy consumption, which is converted to standard coal unit consumption utilizing the discounted standard coal factor; CV signifies the average low-level heating value; CCF represents the carbon content of fuel; and COF denotes the carbon oxidizing factor. The value 44 corresponds to the relative molecular mass of CO 2 , and 12 indicates the relative atomic mass of carbon (C).
This study measures CO 2 emissions from different industrial sectors utilizing the electro-thermal apportionment method (Equation (3)).
C 2 = j = 1 2 C 2 j = j = 1 2 [ F j × α j × ( 44 12 ) ]
C 2 represents the aggregate industrial indirect carbon emissions. C 2 j indicates the CO 2 emissions associated with the jth energy consumption. F j refers to the total consumption of the jth energy source, while α j denotes the carbon emission coefficient for the jth energy type.

2.1.2. Decomposition of Industrial Carbon Emission Drivers

C t denotes the carbon emission at time t, as defined by Equation (4). i signifies the industrial sector, C i j t indicates the carbon emission of energy j from industry i at time t, G signifies the total industrial output value, and P denotes the overall population [20].
C I i j t = C i j t / E i j t denotes the carbon emission coefficient of energy j in industry i at time t; E S i j t = E i j t E i t denotes the energy consumption proportion of energy j in industry i at time t, reflecting the energy structure; E I i t = E i t G i t is taken to represent the energy consumption intensity of industry i at time t. This variable serves as a reflection of energy intensity. E D i t = G i t P t denotes the per capita output value of industry i at time t, reflecting the degree of economic development.
C = i j C i j t = i j ( C i j t E i j t ) × E i j t E i t × E i t G i t × G i t P t × P t   = i j C I i j t × E S i j t × E I i t × E D i t × P P i t
The LMDI method decomposes changes in carbon emissions into five distinct factors: the carbon emission coefficient effect (∆CI), the energy structure effect (∆ES), the energy intensity effect (∆EI), the economic development effect (∆ED), and the population size effect (∆PP). An increase in population growth may increase energy demand in the power, industrial and transportation sectors, thereby raising carbon emissions. Accordingly, population size is incorporated as one of the core influencing factors of carbon emissions [21]. The carbon emission coefficient effect is excluded from this study due to the negligible changes in the carbon emission coefficient throughout the study period. The influence of each factor is presented in Equation (5).
C = C t C 0 = C I + E S + E I + E D + P P

2.1.3. Tapio Decoupling Model

The Tapio decoupling model [22] is based on the OECD one, resolving its base period selection issue and improving decoupling index measurement. The decoupling index for carbon emissions and economic development in Anhui Province’s industrial sector is presented in Equation (6) [23].
ε i = D / D 0 G / G 0
ε i represents the resource decoupling index or environmental decoupling index for the year i. D indicates the change in resource consumption or waste emission, quantified by DMI (Direct Material Input) and DPO (Domestic Processed Output). These indicators are adopted to measure the decoupling between resource consumption and pollutant emissions and to evaluate the effectiveness of targeted measures across two core dimensions: source-side energy conservation and end-of-use low-carbon governance. DMI denotes the natural resources that directly enter the economic system and participate in its operation and substances, reflecting the consumption of resources in economic activities [24], and DPO denotes the waste produced during the operation of the economic system and directly discharged into the ecological environment, reflecting the pressure of economic activities on the natural environment. In this study, industrial energy consumption is adopted to characterize natural resources and raw materials that directly enter and sustain the operation of the economic system, while industrial carbon dioxide emissions are employed to measure the waste generated during economic activities and directly discharged into the ecosystem. DMI = Δ E E Δ G G , DPO = Δ C / C Δ G / G . The change in value added by the industry is denoted by ∆G [25].
The resource and environmental decoupling indices were calculated using Equation (7), which provides a clearer picture of the impact of resources and the environment on the economy.
R i = i = 1 n ε i n
R i represents the resource decoupling index or environmental decoupling index for the year i, and ε i is the index that denotes some resource decoupling index or environmental decoupling index in the year i.
To determine the comprehensive impact of resources and the environment on the economy, these two indices are combined to obtain the comprehensive decoupling index Ti, as shown in Equation (8).
Linking these two decoupling indices, a composite decoupling index T i is obtained to confirm the cumulative impact on the economy, as seen in Equation (8).
T i = i = 1 n R A i n + i = 1 m R B i m 2
T i represents the composite decoupling index for year i, R A i signifies the resource decoupling index for year i, and R B i indicates the environmental decoupling index for year i.
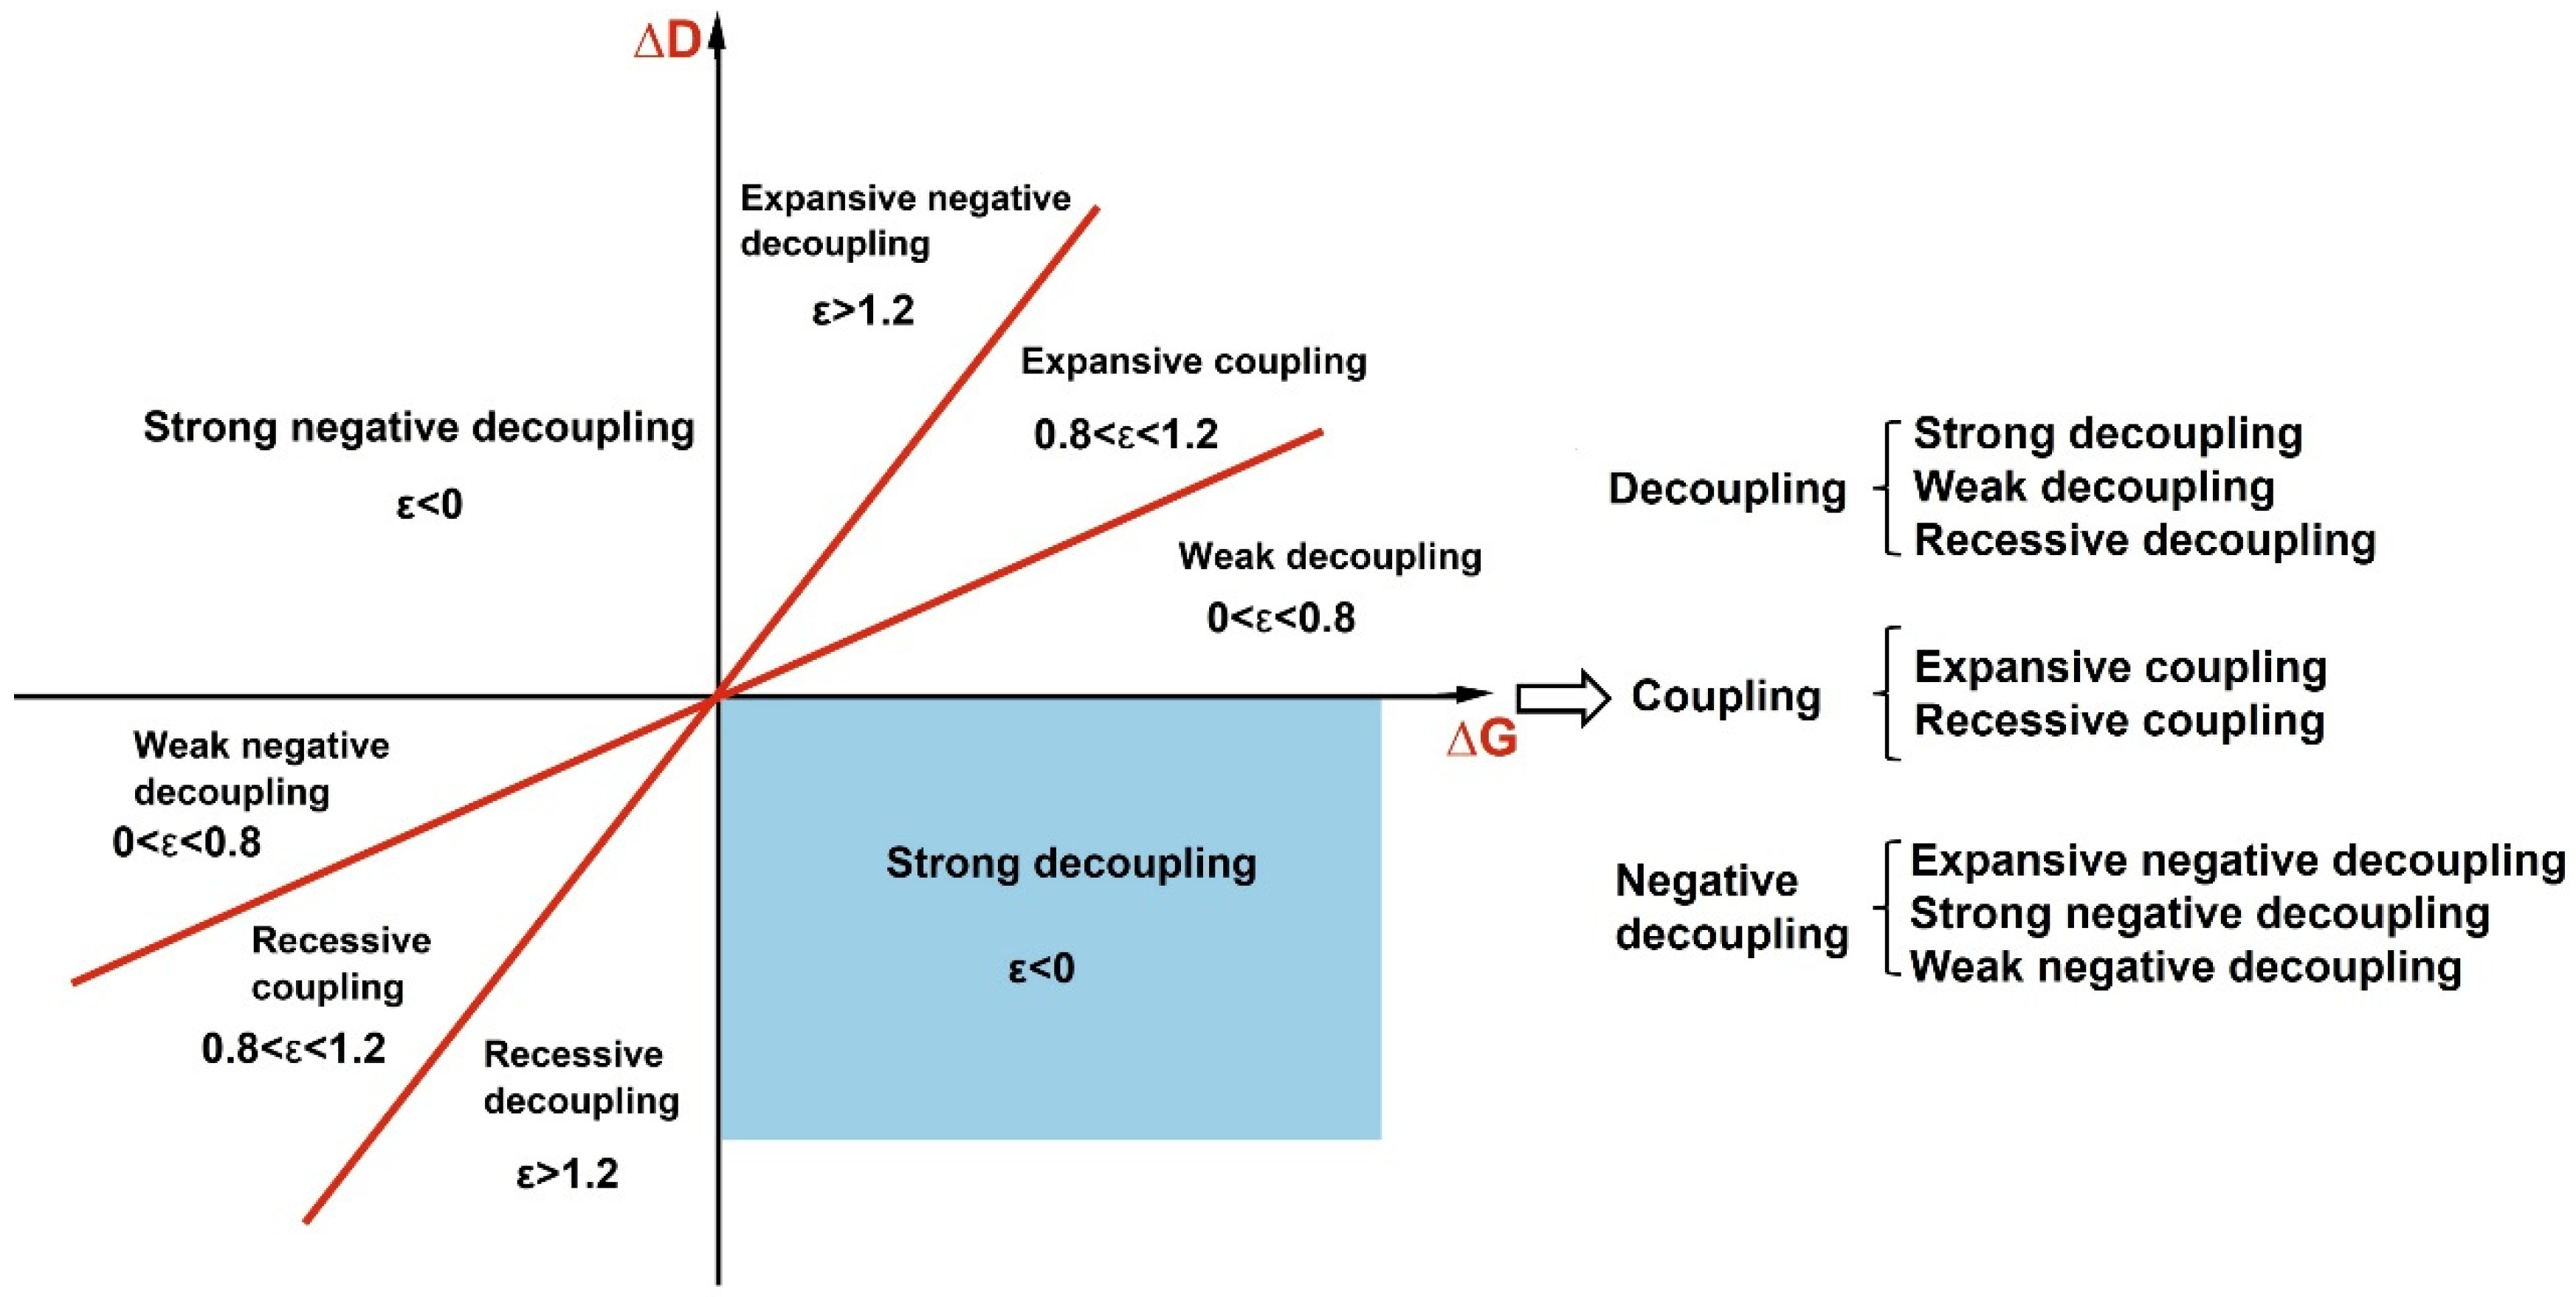
Based on the values of ∆D, ∆G and ε, the decoupling states are categorized as follows (Figure 2):
This paper elucidates the status and connotation of decoupling by calculating the change rates of resource consumption, waste emissions and gross domestic product (GDP), as well as their corresponding decoupling indices. The relevant details are presented in Table 1.

2.2. Data Sources

As carbon emission data for 2022 and beyond could not be found, the period covered by this study is 2007–2021. Data on energy consumption is from the Anhui Province Statistical Yearbook, while carbon emission data and coefficients for energy are from the China Carbon Accounting Database and the IPCC Guidelines for National Greenhouse Gas Inventories. The total industrial output value and population size were derived from the statistical yearbook and statistical bulletin of Anhui Province. To maintain data comparability over time, the gross industrial output value is adjusted using the 2007 base period prices. Table 2 provides a more detailed description of the data (Table 2).

3. Characterization of Carbon Emissions and Decomposition of Drivers

3.1. Characteristics of Carbon Emissions from Major Industrial Sectors

In 2021, the 14 industrial sectors in Anhui Province that were responsible for the majority of total carbon emissions are as listed below (A through N for discussion purposes), with the percentage of emissions from each sector from highest to lowest: Production and Supply of Electricity, Steam, and Hot Water (A—55.78%); Iron and Steel Industry (B—13.84%); Non-Metallic Mineral Products (C—13.55%); Coal Industry (D—3.10%); Fabricated Metal Products (E—0.28%); Smelting and Compacting of Non-Ferrous Metals (F—0.20%); Chemical Raw Materials and Chemical Products (G—0.17%); General Equipment Manufacturing (H—0.15%); Agri-food Processing Industry (I—0.15%); Automobile Manufacturing (J—0.12%); Rubber and Plastic Products (K—0.08%); Textile Industry (L—0.06%); Computer Communication and Other Electronic Equipment Manufacturing (M—0.05%) and Electrical Machinery and Equipment Manufacturing (N—0.03%).
The iron and steel industry and the coal industry are the traditional pillar industries of Anhui Province, which are also high-energy-consuming industries, and in the 11th Five-Year Plan period, their respective shares of total industrial energy use amounted to 16.41% and 7.63%. The Anhui Provincial Government explicitly stated in 2021 that the “14th Five-Year Plan” period would be used to promote progress in the automobile manufacturing industry, computer communications, and other electronic equipment manufacturing industries, as well as other emerging industries. In 2023, the automobile manufacturing industry was identified as the “first industry” in the province and was the first in the country to be legislated to promote the development of the new energy automobile industry cluster. Consequently, this paper opts to concentrate on the analysis of the Iron and Steel Industry (B) and Coal Industry (D), two traditional high-energy-consuming industries, as well as Automobile Manufacturing (J) and Computer Communication and Other Electronic Equipment Manufacturing (M), two strategic high-tech industries in Anhui Province.
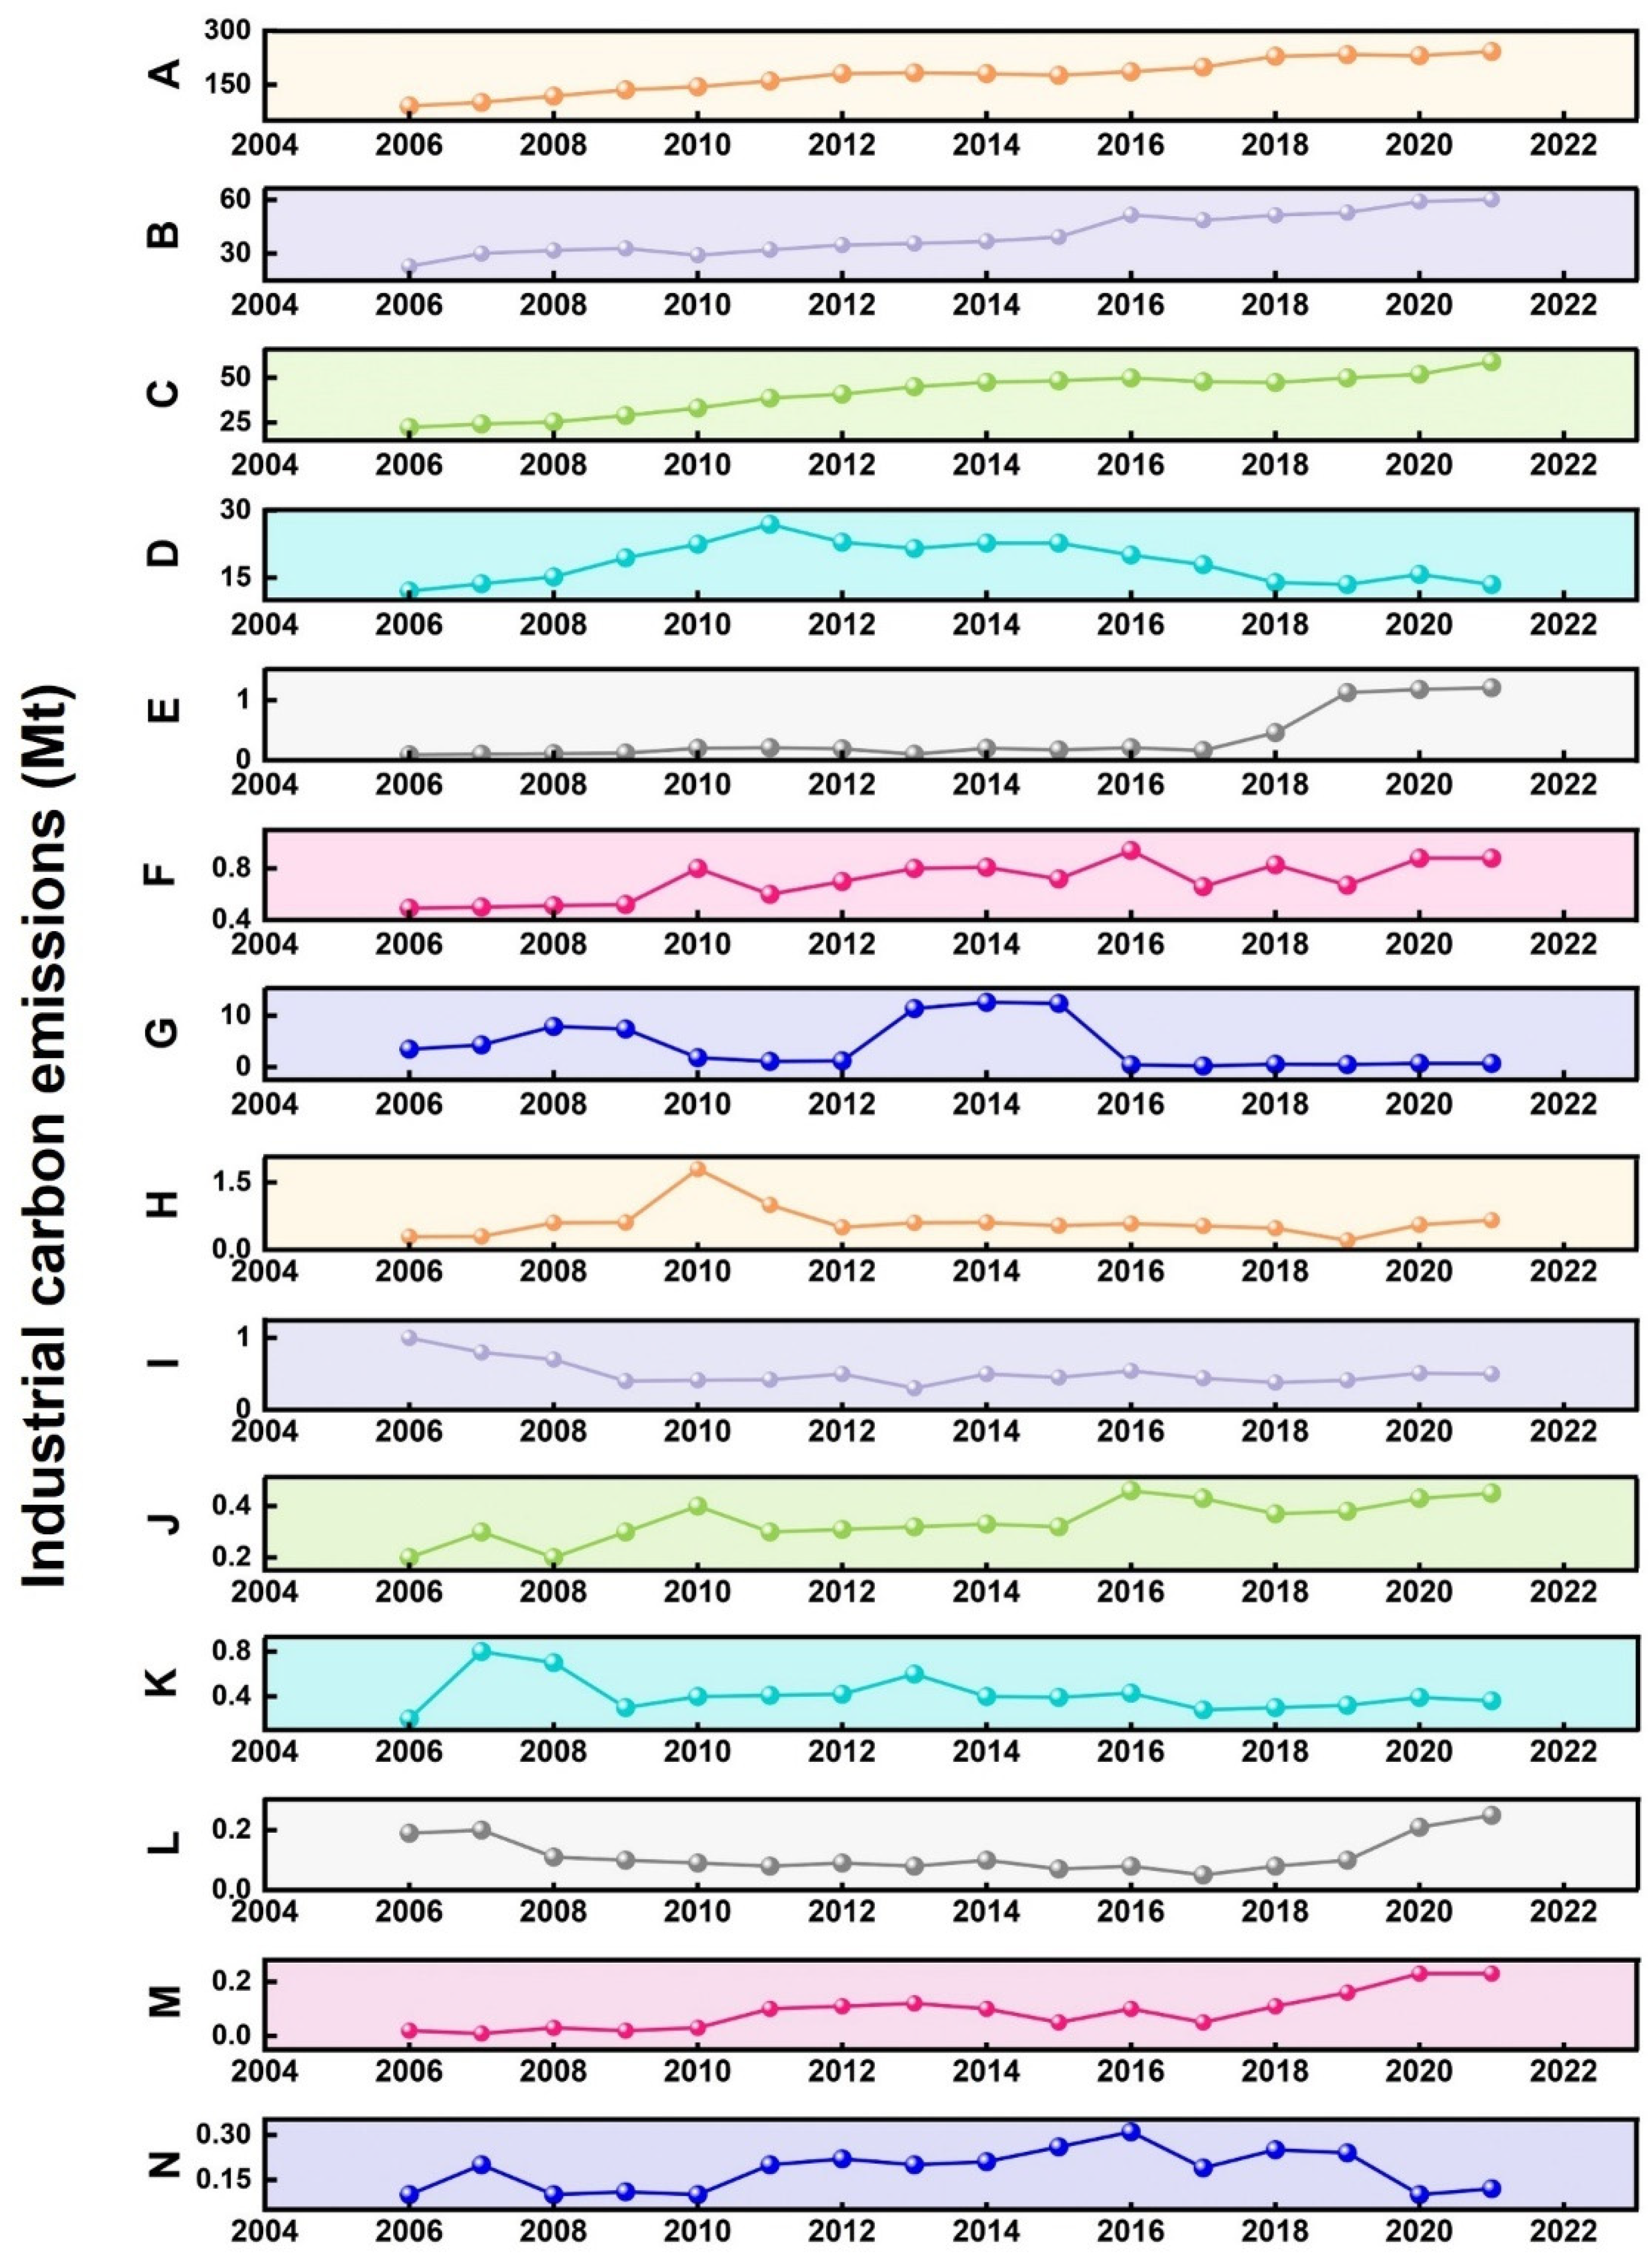
Figure 3 illustrates that the total carbon emissions from key industrial sectors in Anhui Province exhibited a gradual increase, growing from 175.8 Mt to 433.78 Mt over the period of 2007 to 2021. The 14 industrial sectors responsible for the largest proportion of carbon emissions are: Production and Supply of Electricity, Steam, and Hot Water (A); Iron and Steel Industry (B) and Non-Metallic Mineral Products (C). These sectors are fundamental to the national economy, providing essential raw materials for various production activities. The precipitous escalation in carbon emissions indicates an expansion in the production activities and energy consumption associated with electricity, steam, and hot water; the iron and steel industry; and non-metallic mineral products. On the other hand, the Coal Industry (D), Chemical Raw Materials and Chemical Products (G), General Equipment Manufacturing (H), and Agri-food Processing Industry (I) are stable sectors, wherein the rise in carbon emissions stabilizes or even declines after a certain duration. Carbon emissions from the Coal Industry (D) maintained a steady increase from 2006 to 2011 to satisfy the province’s energy demand. Between 2011 and 2016, Anhui Province implemented a series of policies aimed at reducing coal capacity, including the phased closure of outdated mines. These measures resulted in a fall in coal output and a subsequent lowering of carbon emissions within the province’s energy sector. From 2016 to 2021, the advancement of clean energy substitution drove a sustained decline in the proportion of coal consumption, thereby enabling further emission reductions in the coal industry. Carbon emissions from General Equipment Manufacturing (H) saw a significant decline in 2010, attributable to the removal of obsolete production capacity enacted by the Anhui Provincial Government-instituted stringent regulatory measures, including the eradication of obsolete production capacity and the establishment of early warning and control objectives, resulting in enhanced efficiency within the industrial sector and a more logical utilization of renewable energy. Smelting and Compacting of Non-Ferrous Metals (F), the Textile Industry (L), and Automobile Manufacturing (J) are characterized as low-emission sectors, exhibiting consistently low emission levels throughout the study period with minimal variation. This stability is attributed to the relatively constant scale of production and processes in Smelting and Compacting of Non-Ferrous Metals (F) and the Textile Industry (L), whereas Automobile Manufacturing (J) represents an emerging low-carbon sector, demonstrating a lower intensity of carbon emissions during production. To illustrate this point, consider the case of Smelting and Compacting of Non-Ferrous Metals (F). In this instance, the industrial scale was expanded in the early stage, and there has been a continued increase in carbon emissions. Investments in subsequent environmental protection improvements have increased, and environmental management facilities have gradually improved. In the subsequent phases, the industrial chain underwent further expansion, resulting in an increase in the proportion of finishing. Consequently, the industry as a whole has exhibited an upward trend in its overall output while concurrently maintaining relatively low levels of total carbon emissions.

3.2. Decomposition of Carbon Emission Drivers

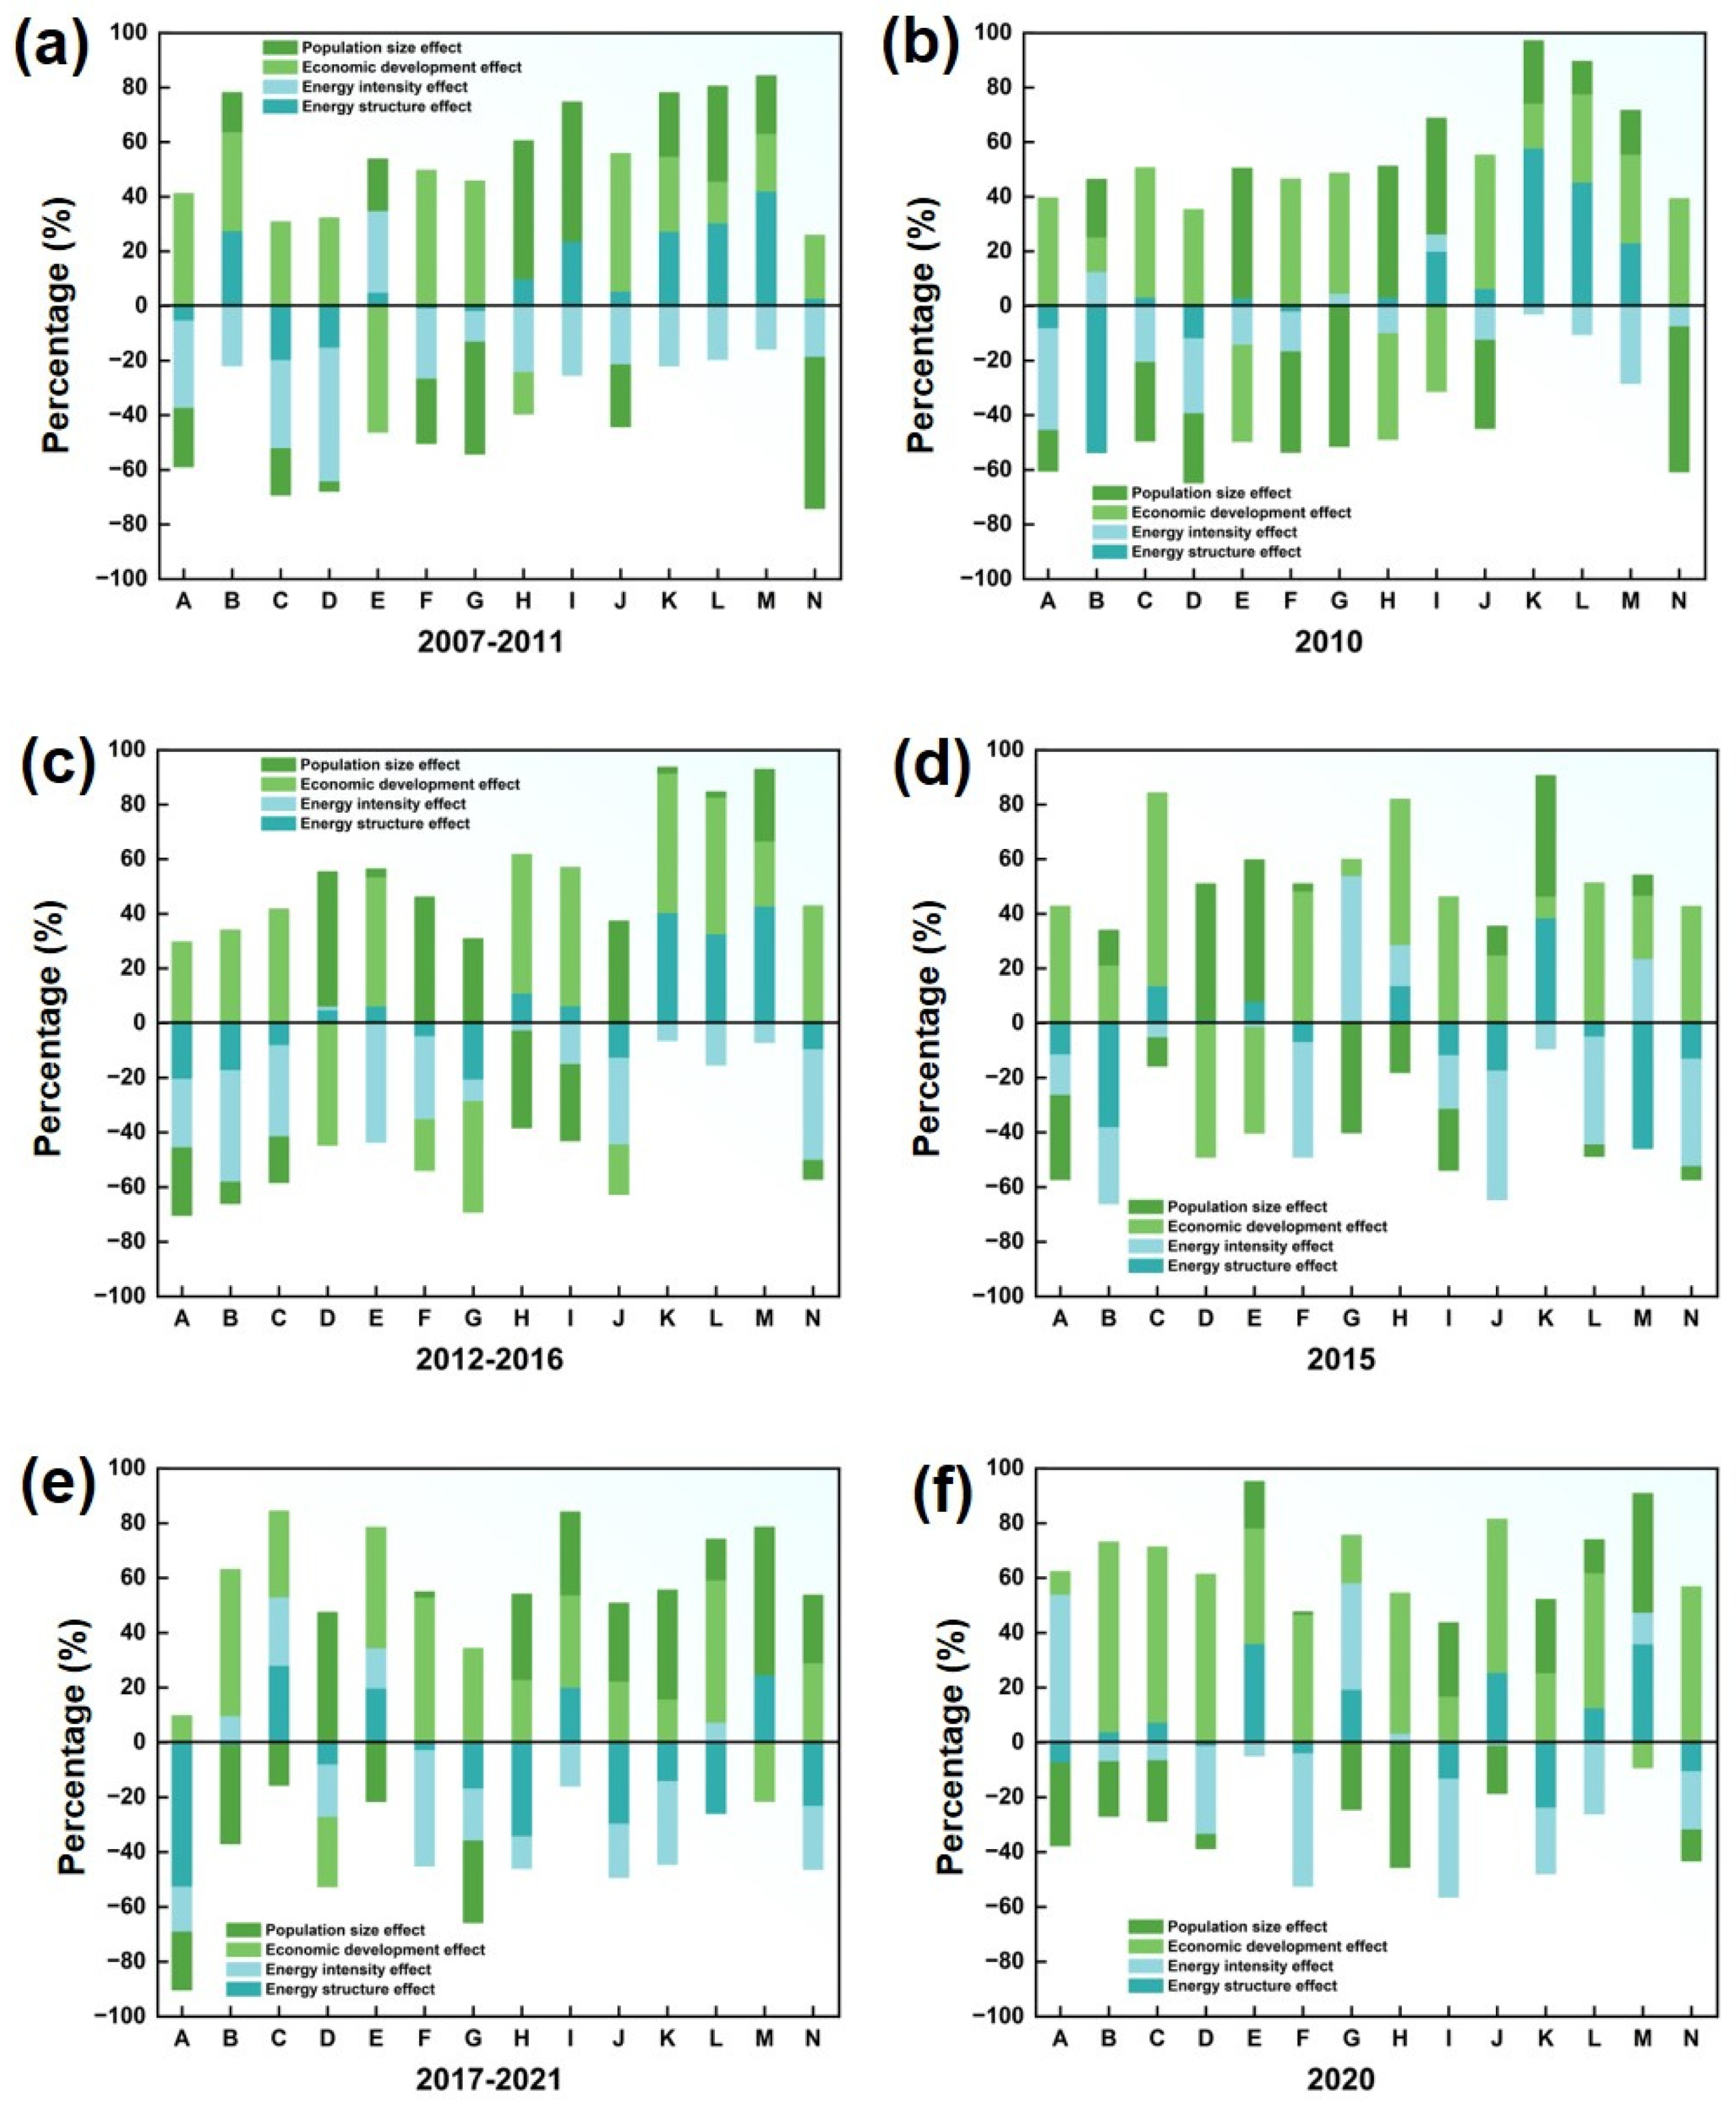
The level of influence of the drivers of each sector is measured by using the LMDI method and focusing on 14 major industrial sectors (see Table A1 in Appendix A for the specific values of the various drivers for each of the three periods). The years 2010, 2015, and 2020 are significant milestones in the “11th Five-Year Plan”,“12th Five-Year Plan”, and “13th Five-Year Plan”, indicating the recalibration of development objectives and the initiation of new targets at each phase. These three years are chosen to assist in exploring the implications of the energy structure effect and the energy intensity effect on industrial carbon emissions under the policy orientation (Figure 4).
Between 2007 and 2011, the economic development effect and the energy structure effect exhibited upward contributions. In the Iron and Steel Industry (B), Rubber and Plastic Products (K), Textile Industry (L), and Computer Communication and Other Electronic Equipment Manufacturing (M), the population size effect positively impacted several industries. This suggests that the growth in the employed population and the economic scale expansion reliant on high-carbon-emitting energy sources directly contributed to the increase in carbon emissions in the incipient stages of industrial growth. The energy intensity effect adversely impacted mineral industries, including Non-Metallic Mineral Products (C) and the Coal Industry (D), primarily due to Anhui Province’s enhanced monitoring and statistical analysis of energy consumption in the mining sector over this period, which led to a reduction in energy consumption. Furthermore, over the course of the study period, the energy intensity effect exerted a positive contribution solely within Fabricated Metal Products (E). This can be attributed to the maturity and entrenched nature of the technological processes in place, which hinders the adoption of low-carbon transformation measures. Meanwhile, other sectors are experiencing rapid expansion and exhibit a high reliance on metal materials, thereby creating inherent challenges for the reduction in short-term energy consumption.
In the period between 2012 and 2016, the impact of energy structure and population size was found to be conducive to the development of several industries. Industries such as Chemical Raw Materials and Chemical Products (G) and Automobile Manufacturing (J) did show increased carbon emissions as a result of scaling up production, and industries such as Rubber and Plastic Products (K) and the Textile Industry (L), which utilized a lower percentage of clean energy, continued to depend on a high-carbon energy structure and failed to effectively achieve an energy transition. The positive effect of economic development has become more pronounced, particularly within the following sectors, highlighting the escalating pressure on carbon emissions resulting from the swift expansion of the industrial economy: Non-Metallic Mineral Products (C), General Equipment Manufacturing (H), Agri-food Processing Industry (I) and Electrical Machinery and Equipment Manufacturing (N). The energy intensity effect exhibits a negative contribution in certain industries, primarily because, during this period, Anhui Province intensified the regulation of key sectors, established industrial policies conducive to energy emission reduction, directed social capital investment towards energy conservation and emission mitigation, and fostered the advancement of green low-carbon industries, including Computer Communication and Other Electronic Equipment Manufacturing (M) and Electrical Machinery and Equipment Manufacturing (N).
The suppression effect of the energy structure effect and energy intensity effect on carbon emissions was further enhanced in 2017–2021, which is due to the fact that during this period, the Anhui Provincial Government issued the 13th Five-Year Plan for Implementation of Energy Conservation and Emission Reduction. This initiative facilitated a shift towards the modernization and upgrading of traditional industries, including Production and Supply of Electricity, Steam, and Hot Water (A); the Coal Industry (D); Smelting and Compacting of Non-Ferrous Metals (F); General Equipment Manufacturing (H); the Textile Industry (L); and Electrical Machinery and Equipment Manufacturing (N). It also eliminated obsolete production capacity and diminished inefficient energy utilization and pollutant emissions, thereby creating opportunities for the advancement of superior production capacity and clean energy. For example, Tongwei Solar (Hefei) Co., Ltd. in Hefei, China, and Anhui Wanneng Clean Energy Co., Ltd. in Hefei, China have added new impetus to the development of the clean energy industry in Anhui Province.
In the period of the “11th Five-Year Plan”, Anhui Province’s industrial economy grew rapidly, with industrial value added rising from 137.35 billion yuan to 560.19 billion yuan, reflecting an estimated yearly increase of 22.6%. Nonetheless, due to low efficiency and backward enterprise technology, the energy structure effect and the energy intensity effect in the early stage of economic growth have improved the carbon emission of most traditional industrial industries. Consequently, Anhui Province established energy conservation and emission reduction mandates in the “11th Five-Year Plan”, thereby establishing a foundation for the regulation. In the period of the “12th Five-Year Plan”, Anhui Province proactively advanced the optimization and enhancement of its industrial structure and reduced the share of high-energy-consuming and high-emission industries while robustly fostering low-carbon sectors such as new energy vehicles, energy conservation, environmental protection, and electronic information, thereby gradually stabilizing the negative effects of energy structure and energy intensity. During the “13th Five-Year Plan” period, Anhui Province aimed to decrease carbon emission intensity by 18% relative to 2015, expedite the environmentally friendly transformation of conventional industries, and advance the intelligent and sustainable development of the manufacturing sector. So both the energy structure effect and energy intensity effect of the agricultural and Agri-food Processing Industry (I) and Rubber and Plastic Products (K) had a negative effect on industrial carbon emissions in 2020, Additionally, the energy intensity effect and the energy structure effect significantly diminished the industrial carbon emissions of the Coal Industry (D) and Electrical Machinery and Equipment Manufacturing (N), respectively, owing to the reduction in coal consumption and the investment in research and development for low-carbon technological innovation.

4. Analysis of Decoupling of Carbon Emissions from Industrial Economic Development

4.1. Analysis of Decoupling of Economic Growth and Resources–Environment

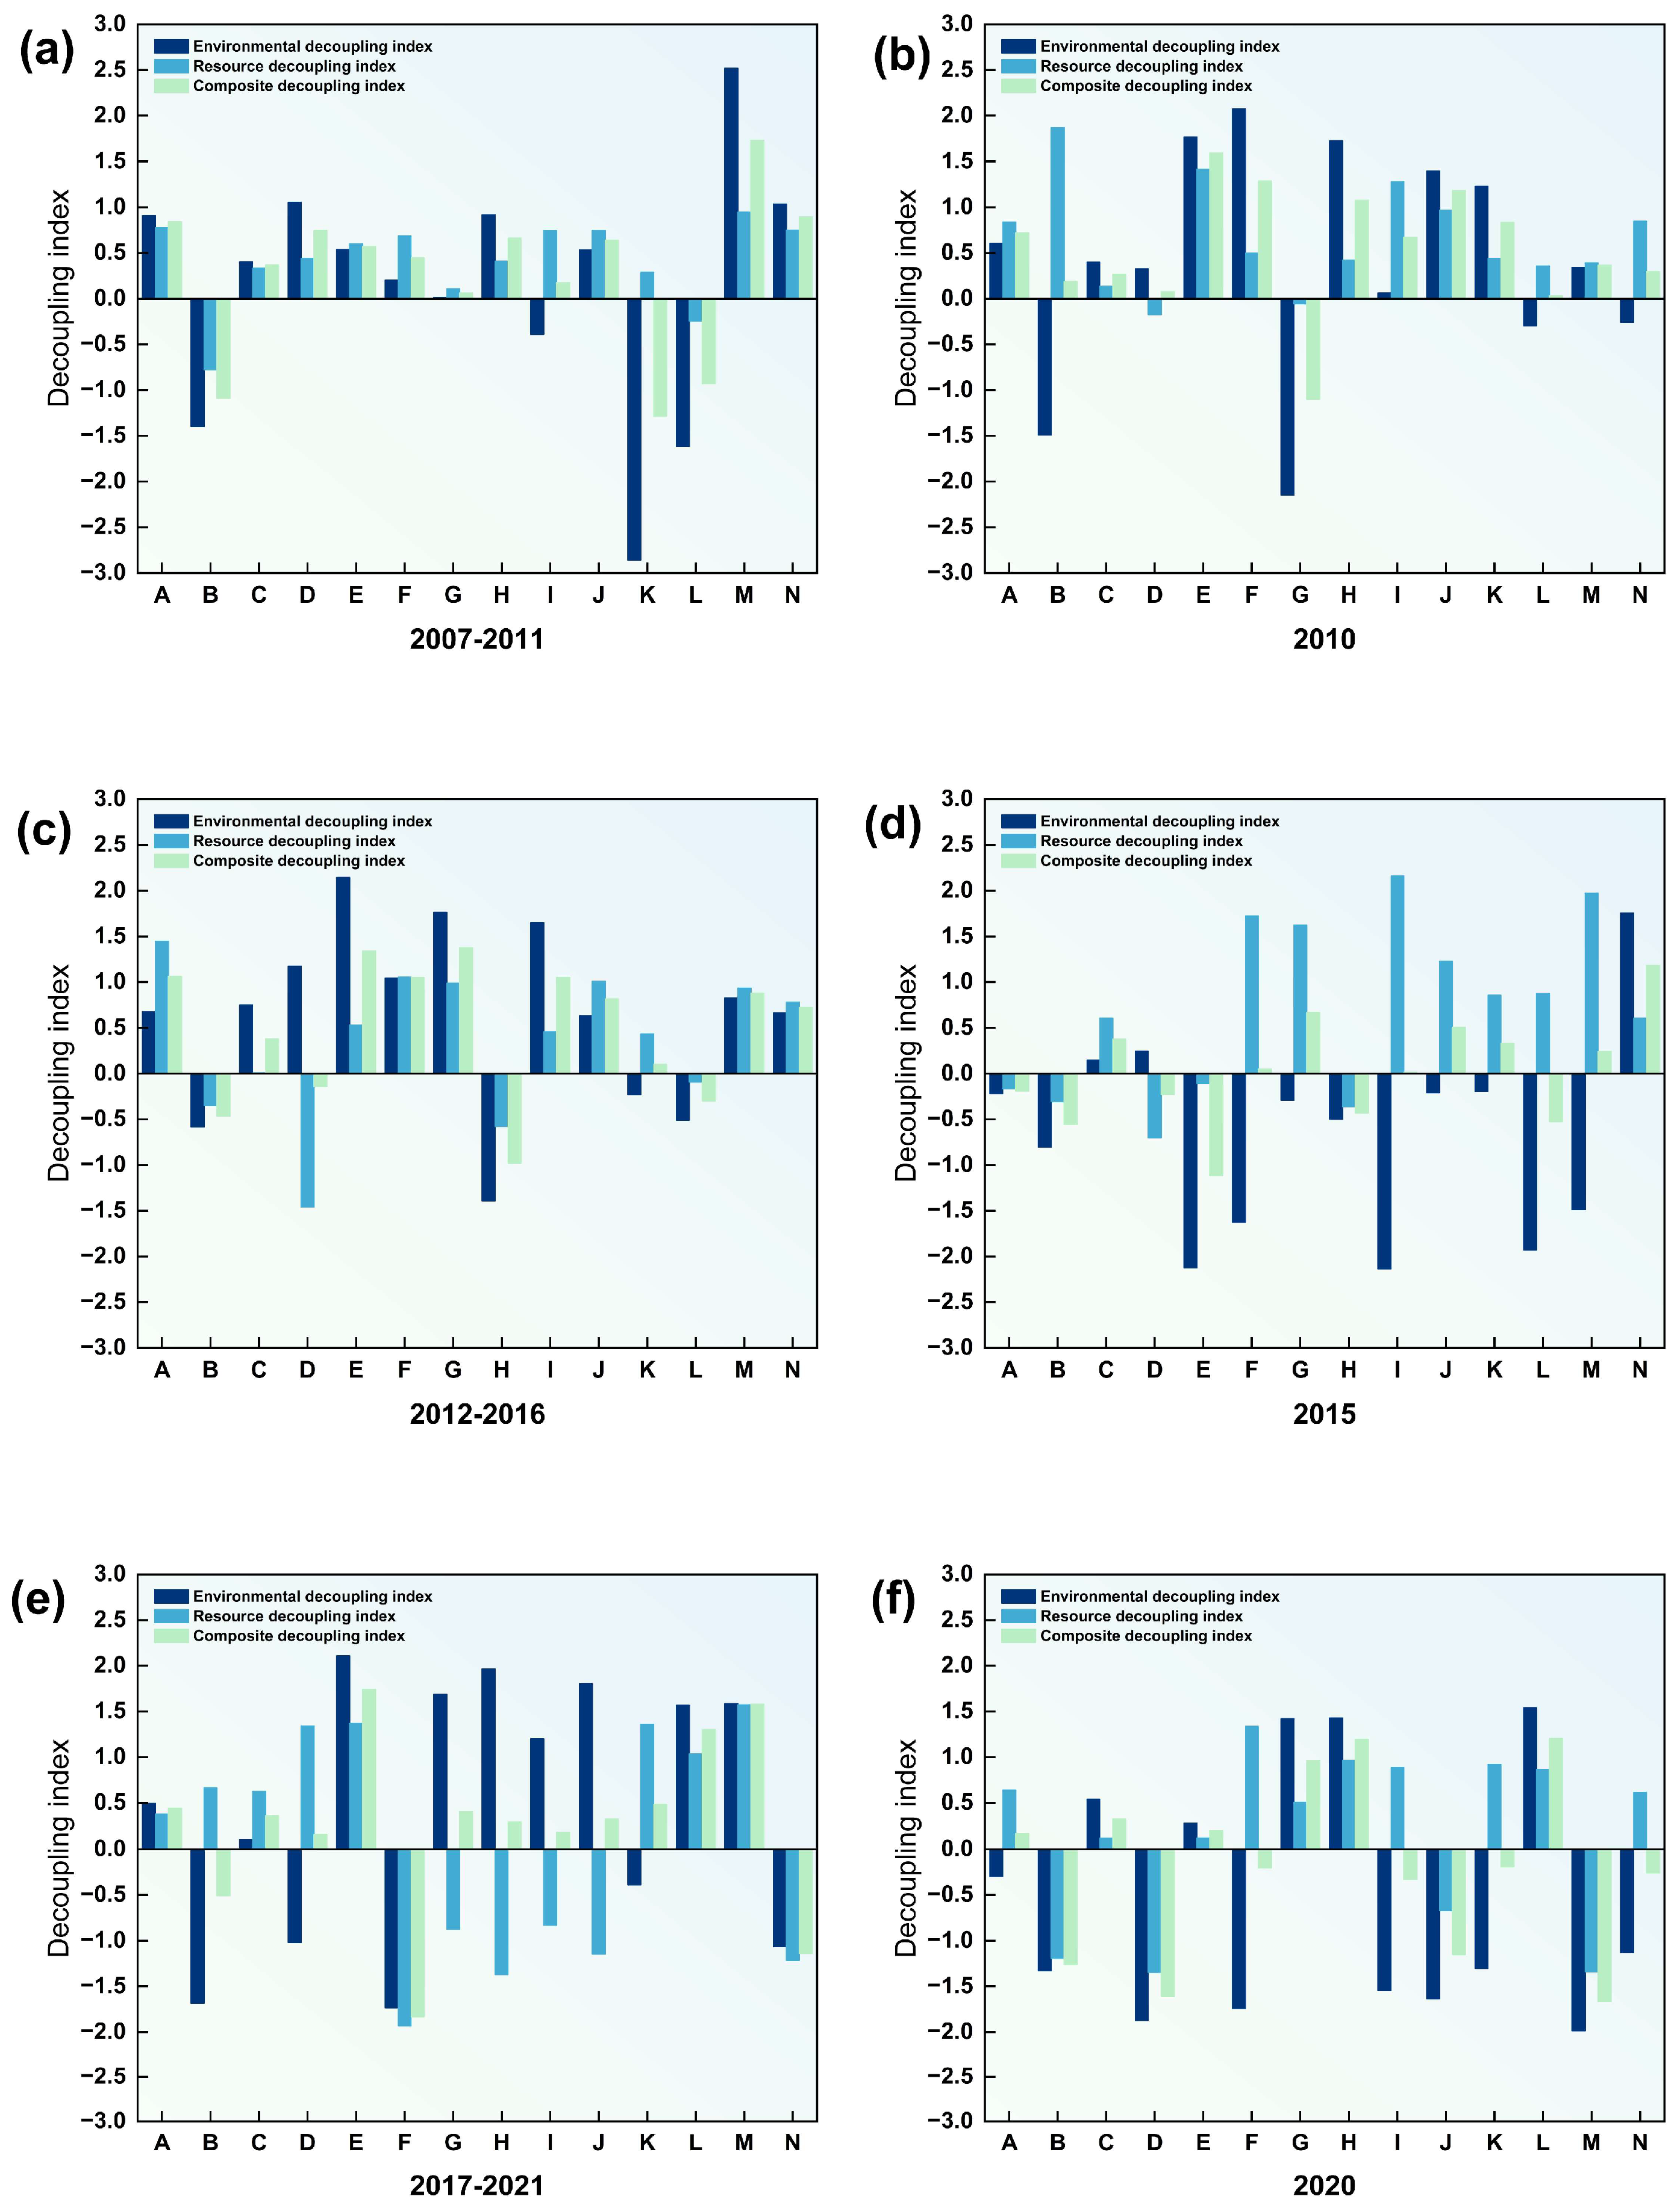
The decoupling relationship between economic growth and resources and the environment in Anhui Province’s industrial sector from 2007 to 2021 is assessed in conjunction with Equations (6)–(8), specifically in the “11th Five-Year Plan,” “12th Five-Year Plan,” and “13th Five-Year Plan”, and significant years—namely 2010, 2015, and 2020—are identified to facilitate the examination of the effects of policy orientation (Figure 5).
From 2007 to 2011, the majority of sectors demonstrate low decoupling indices, thus indicating a state of weak or even strong decoupling. Conversely, high-pollution industries are subject to significant pressures to reduce their emissions. Traditional heavy sectors, including the Production and Supply of Electricity, Steam, and Hot Water (A) and the Coal Industry (D), continue to exhibit relatively high environmental decoupling indices. This indicates a strong correlation between resource consumption and pollutant emissions in these industries and their output during economic expansion, highlighting that energy-intensive industries face significant pressure regarding resource and environmental concerns during the early process of industrialization. In contrast to conventional heavy industries, Computer Communication and Other Electronic Equipment Manufacturing (M) demonstrates higher environmental and overall decoupling indices. This finding suggests that the sector is undergoing rapid economic expansion, accompanied by a simultaneous increase in environmental pressure, thereby generating a considerable ecological impact.
The decrease in the resource and environmental decoupling index from 2012 to 2016 signifies the beneficial impact of the government’s energy conservation and emission reduction programs. Most industries are in a state of decoupling. The environmental decoupling indices for industries such as Production and Supply of Electricity, Steam, and Hot Water (A); Rubber and Plastic Products (K); the Textile Industry (L); and Computer Communication and Other Electronic Equipment Manufacturing (M) have diminished since 2007–2011, suggesting that the emission reduction policy has positively influenced the environmental practices of these heavily polluting sectors. The resource decoupling indices of sectors including Non-Metallic Mineral Products (C), Fabricated Metal Products (E), Chemical Raw Materials and Chemical Products (G), General Equipment Manufacturing (H), the Agri-food Processing Industry (I), and Computer Communication and Other Electronic Equipment Manufacturing (M) have declined relative to the 2007–2011 period. This decline can be largely attributed to the positive effects of governmental energy conservation policies.
Between 2017 and 2021, the composite decoupling indices for Automobile Manufacturing (J) and Electrical Machinery and Equipment Manufacturing (N) declined, signifying a reduction in resource consumption through technological innovation and industrial structure upgrading. This trend indicates the escalating significance of technological progress in resource-intensive sectors, demonstrating that the manufacturing industry can achieve resource and environmental decoupling through innovation during its transformation and upgrading processes. Nonetheless, despite the overall improvement in decoupling, the Coal Industry (D) and Iron and Steel Industry (B) are characterized by high energy consumption and pollution, complicating the attainment of full decoupling. These sectors should be urged to implement cleaner production, including the realization of net-zero carbon emissions across all production processes through the promotion of transformative production technologies exemplified by green hydrogen steelmaking.
In the “11th Five-Year” period, Anhui Province invested substantially in resources to increase the industrialization rate. As a result, high-energy-consumption and high-pollution industries in the industrial structure were responsible for a large part of the greater pressure on the environment. Nearly all industrial sectors exhibit an unsatisfactory state regarding the decoupling of resources and environmental indices. However, the government and enterprises have started to acknowledge the significance of environmental resource concerns, and initial investigations into the holistic utilization of resources such as coal gangue, phosphogypsum, coal bed methane, industrial waste heat, and blast furnace gas have commenced. However, overall, these efforts remain in the nascent phase, with environmental protection measures and low-carbon technologies comparatively underdeveloped. During the period of the “12th Five-Year Plan”, high-emission industries still accounted for a high proportion of the majority of industrial sectors, but the government strengthened the policy guidance on the coordination between industrial development and the environment, and the environmental decoupling indices of most of the industrial industries in Anhui Province were less than 0, except for those of Non-Metallic Mineral Products (C), the Coal Industry (D), and Electrical Machinery and Equipment Manufacturing (N), which maintains an environmental decoupling index above 0 (Figure 5d), indicating an equilibrium of economic growth and environmental pressure, and thus the optimal condition of economic expansion and decreasing environmental pressure was achieved. Throughout the “13th Five-Year Plan” period, emerging industries in Anhui Province, including integrated circuits and new energy vehicles, thrived, achieving significant advancements in environmental protection. Additionally, the production processes of chemical and other high-energy-consuming industries have progressively distanced themselves from high environmental pollution and excessive resource consumption.

4.2. Resource Environment and Composite Decoupling Analysis of Key Industrial Sectors

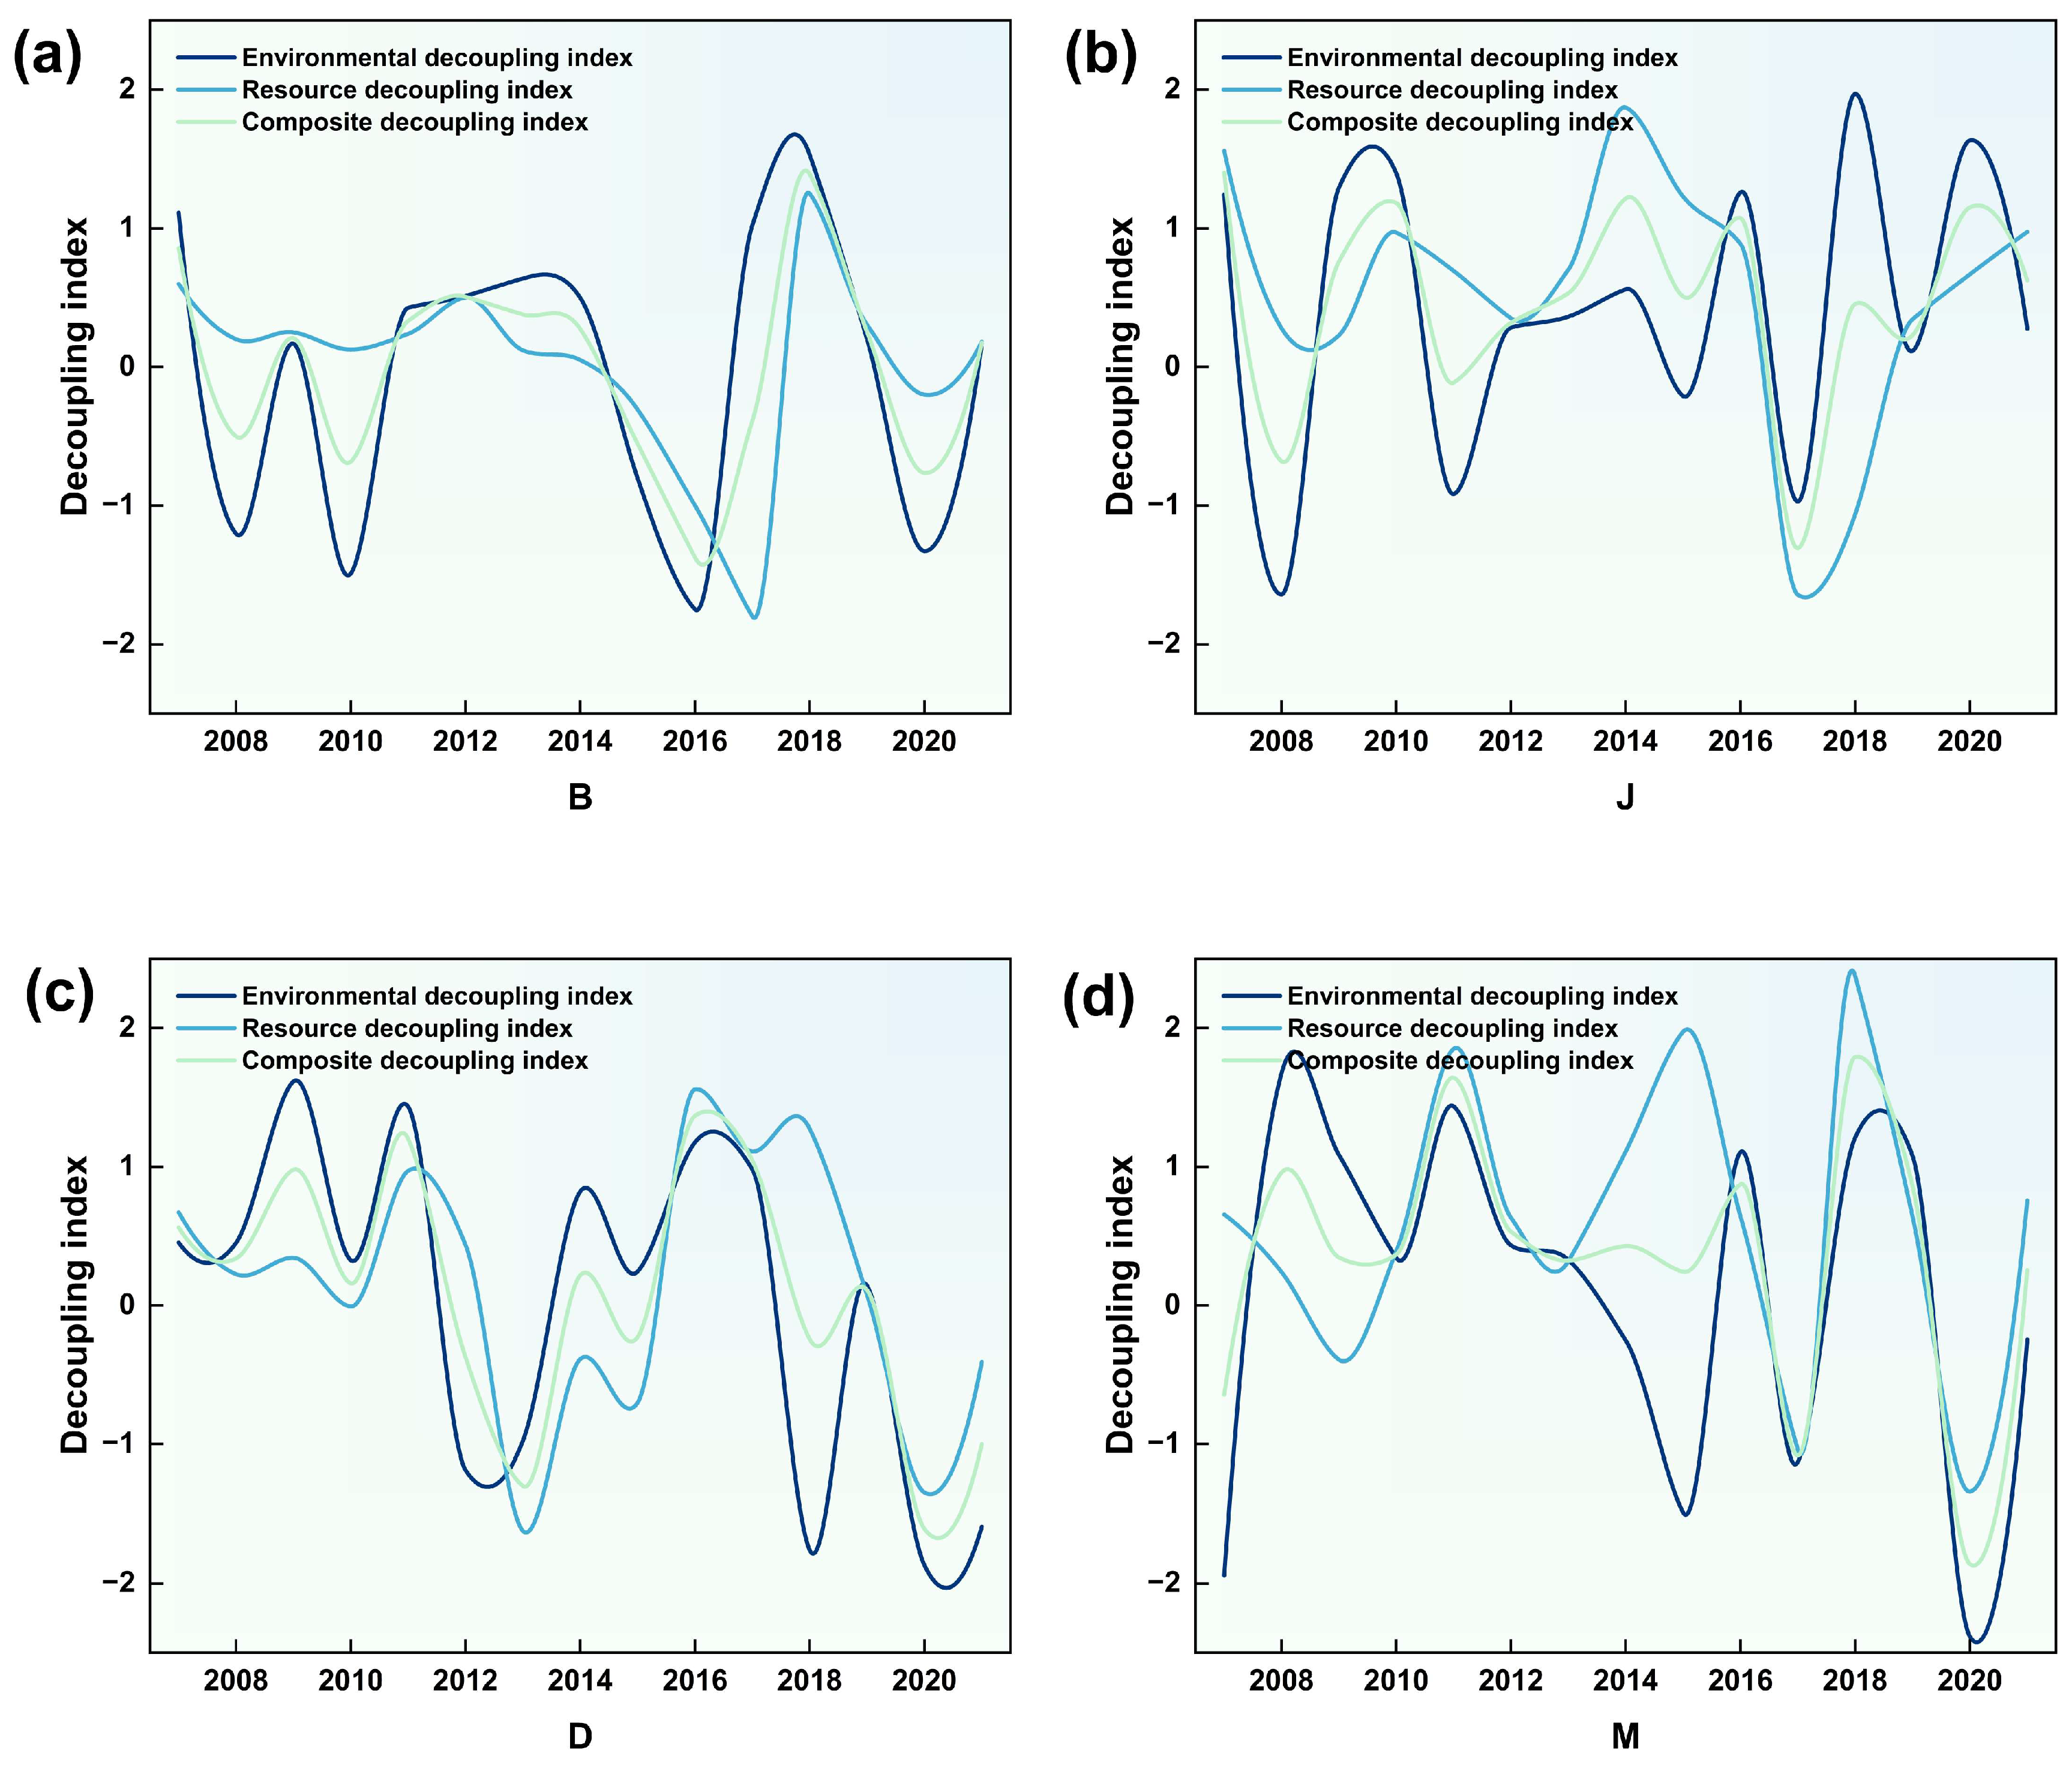
This research examines the decoupling of the Iron and Steel Industry (B) and Coal Industry (D), together with Automobile Manufacturing (J) and Computer Communication and Other Electronic Equipment Manufacturing (M), as illustrated in Figure 6:
The three indicators for the Steel Industry (B) exhibited significant volatility from 2007 to 2021. This volatility is attributable to the resource-intensive characteristics of the steel sector and its susceptibility to economic cycles, fluctuations in raw material prices, and regulatory policies. In 2009, due to the international financial crisis, the iron and steel market shrank. From 2009 to 2011, Anhui Province established a high-quality iron and steel production base along the river, with Ma’anshan and Wuhu as the focal points. The resource decoupling index and composite decoupling index exhibited weak decoupling amidst rudimentary economic development. From 2012 to 2017, the province continued to restructure, transform and improve the iron and steel industry while enhancing energy savings, cutting emissions, and maximizing resource use. Consequently, the resource decoupling indices predominantly remained between −0.2 and 0.4 during this period, reflecting strong and weak decoupling states. In this period, the factors of energy intensity and energy structure exerted a significant inhibitory effect on carbon emissions. The period from 2018 to 2021 emphasized the advancement of intelligent and sustainable development within steel enterprises. However, the environmental decoupling index exhibited a tendency to initially rise and then fall. This highlights that the sustainable growth of the steel industry encounters significant challenges and that the industry’s technological innovations and environmental policies are oriented to focus on breakthrough improvements in the short term, while sustaining long-term stability remains problematic.
The advancement of the Coal Industry (D), as a conventional energy sector, is profoundly affected by national energy transition policies. From 2007 to 2011, Anhui Province exhibited a singular energy structure, with industrial development predominantly dependent on conventional thermal power generation for energy supply. Consequently, the coal industry’s environmental, resource, and composite decoupling indices were characterized by weak decoupling and expansive coupling states. From 2012 to 2015, Anhui Province emphasized the phasing out of obsolete production capacity, but it was difficult for the coal industry to adapt to the policy change in a short period of time. During this period, the decoupling index fluctuated between strong and weak decoupling states. In this period, the factors of energy intensity and energy structure exerted a significant inhibitory impact on carbon emissions. The decoupling index continued to drop and stabilized in a strong decoupling condition from 2016 to 2021, with the most pronounced decrease observed in the energy decoupling index, which attained a minimum of −1.34. Energy intensity exerts a considerable inhibitory influence on carbon emissions. The significant outcomes of Anhui’s coal industry decoupling efforts in modifying the raw material structure, regulating the utilization of new raw materials, broadening the sources of hydrogen-rich materials, and advancing lightweight raw materials are the causes of this success.
The variations in the environmental, resource, and composite decoupling indices of Automobile Manufacturing (J) exhibit greater consistency. From 2009 to 2014, the trend in the indices remained relatively stable, attributable to the ongoing development of local automotive enterprises such as JAC and Chery Automobile in Anhui Province, alongside the sustained enhancement in industry efficiency. The strong decoupling of environmental and resource indices over certain years from 2015 to 2021 is attributable to firms’ ongoing augmentation in their R&D investments. For instance, JAC designates 3% to 5% of its yearly sales revenue for R&D, advances the application of novel technologies and materials, and persistently enhances resource consumption efficiency, thereby alleviating environmental strain.
The Computer Communication and Other Electronic Equipment Manufacturing (M) industry has shown economic growth with slow growth in resource and environmental pressures in most of the years of the study period. Between 2007 and 2012, the computer communication and electronic equipment manufacturing sector in Anhui experienced significant growth, resulting in an expanded industry scale that adversely affected the environment, with the environmental decoupling index exceeding 1 in the majority of these years. Between 2013 and 2017, the industry progressively embraced cleaner energy sources and diminished pollutant emissions during manufacturing, resulting in a gradual reduction in environmental strain, with the environmental index consistently ranging from −1.49 to 0.33. The industry in Anhui Province commenced later than others, exhibits inadequate innovation capacity, and has not significantly enhanced its resource utilization rates, with all resource indices exceeding 0. Due to the industry’s high technological intensity, improved resource utilization efficiency, and reduced environmental impact through chip process technology upgrades, the environmental index remained in a strong decoupling state over the 2018 to 2021 period, while the resource composite index exhibited a weak decoupling state, indicating significant improvement.

4.3. Discussion

This study reveals notable disparities in carbon emissions across industrial sectors in Anhui Province, identifying the production and supply of electricity, steam, and hot water as the dominant emission source [26]. The results indicate that from 2007 to 2021, industrial decoupling in Anhui was predominantly characterized by weak decoupling. And the main driver of carbon emissions was economic growth [27,28]. Concurrently, the mitigating effects of energy structure optimization and energy intensity reduction have been gradually strengthening [29], among which the energy intensity effect constitutes a particularly prominent factor curbing industrial carbon emissions in Anhui Province. These results are consistent with previous studies focusing on Anhui Province, other Chinese provinces [30], the national level [31] and even the United States [32]. In addition, further studies have observed that the driving effect of economic development intensity on carbon emission growth tends to be weaker in economically developed regions, whereas the mitigating effect of energy intensity is more salient in regions with a vibrant and evolving industrial structure.
In the 11th Five-Year period, Anhui’s industrial sector underwent rapid development, accompanied by substantial demand for fossil fuels. This caused a constant rise in carbon emissions from fossil fuel-consuming sectors. An example of such sectors includes the coal industry. Anhui Province underwent significant economic and industrial development in the 12th and 13th Five-Year periods. The province focused on upgrading and optimizing its industrial structure, fostering the growth of strategic technology-intensive industries, and implementing technological transformation in key energy-intensive sectors. Furthermore, Anhui Province made substantial progress in advancing energy-saving and emission mitigation efforts and expanded the adoption of environmentally friendly energy sources. These efforts contributed to a notable decrease in the percentage of traditional fossil fuel consumption. Consequently, carbon emissions from fossil fuel-dominated sectors such as coal continued to decrease during this period. Traditional energy-intensive industries, including the iron and steel industry and coal industry, have achieved decoupling from industrial economic growth through the improvement in energy structure. This provides a valuable reference for other regions worldwide that are striving to achieve decoupling between industrial carbon emissions and economic growth or to promote industrial carbon reduction.

5. Conclusions and Policy Recommendations

5.1. Conclusions

First, between 2007 and 2013, Anhui Province was in the midst of a rapid industrial process, and the demand for energy continued to increase, particularly as fossil fuels like coal constituted a significant portion of industrial energy consumption, thereby possibly accelerating the speed at which industrial carbon emissions were growing. In the period from 2014 to 2021, Anhui Province vigorously advanced the expansion of strategic high-tech industries and intensified the development of technology-intensive sectors, such as the manufacturing industry of computer communications and other electronic equipment. The integration of industry and information technology was deepening, which may play a positive role in controlling industrial carbon emissions.
Second, during the study period, the increase in carbon emissions from the industrial sector in Anhui Province was primarily driven by population size and economic development, with economic factors contributing more significantly. Historically, Anhui Province was characterized by resource-based industries; however, the ongoing advancement of renewable energy technology has resulted in a cleaner and more efficient energy supply, and the energy structure effect has reduced the carbon emissions of the iron and steel, chemical, and other industries. Cleaner coal combustion technology enhances coal utilization efficiency and diminishes the coal required per unit of energy produced, with a notable impact on lowering carbon emissions from the coal sector.
Finally, the government’s stringent approval and access limitations on new energy-consuming projects, coupled with advancements in blast furnace gas recycling technology within the iron and steel sector, may potentially contribute to a notable cumulative reduction in the industrial value-added energy consumption of resource-intensive industries (such as coal and iron and steel industries) in Anhui Province. Technology-intensive sectors, such as computer communication, electronic equipment manufacturing, and automobile production, have demonstrated superior adaptability during the decoupling process owing to their inherent innovation capabilities. They have effectively achieved a harmonious equilibrium of economic prosperity and resource and environmental conservation by leveraging advancements such as 5G/6G technology, the industrial Internet, and smart manufacturing technologies.

5.2. Policy Recommendations

A sub-period analysis indicates that the impact of industrial technological advancements has increasingly become evident since the period from the “11th Five-Year Plan” to the “13th Five-Year Plan”. Furthermore, a sub-industry examination reveals significant heterogeneity in carbon emissions and decoupling performance across major industrial sectors. Based on this, this paper derives policy guidance for future carbon emission reduction efforts in Anhui Province:
First, it further refined the industrial structure and persistently advanced the transition of the industrial sector towards sustainable growth. The “14th Five-Year Plan” Comprehensive Work Program on Energy Conservation and Emission Reduction aims to restrict the expansion of energy-intensive industries, particularly in the iron and steel, non-ferrous metals, and chemical sectors, while advocating for energy-saving reforms and comprehensive pollutant management. Consequently, throughout the “15th Five-Year Plan” period, we must intensify measures to eradicate obsolete production capacity and close small iron and steel mills and cement facilities that exhibit energy efficiency significantly below the industry average; actively promote the progression of new energy, new materials, and other low-carbon and zero-carbon emerging sectors; enhance the share of these industries within the industrial economy; and progressively diminish the share of conventional high-carbon industries.
Second, it is necessary to enhance technological innovation and application promotion while increasing the supply capacity of low-carbon technologies. The “14th Five-Year Plan” places emphasis on enhancing the autonomy and core competitiveness of the industrial sector, while the “15th Five-Year Plan” period should prioritize advancements of hydrogen energy utilization technology within the iron and steel and chemical industries, as well as the application of biomass energy utilization technology in the paper-making industry. Financial backing should be augmented for the research and development of Carbon Capture, Utilization and Storage (CCUS) technology, as well as microalgal carbon sequestration technology. Additionally, we should advocate for the utilization of recycled materials in the electronic equipment manufacturing sector to facilitate the recycling and repurposing of metals, plastics, and other materials from discarded electronic products. This approach will serve to minimize resource waste and environmental pollution.
Finally, we recommend enhancing energy review and oversight while further refining the carbon price mechanism. The current carbon emission trading market primarily encompasses certain sectors, including electric power. During the “15th Five-Year Plan” period, high-emission industries, such as building materials and chemicals, should be progressively integrated into the carbon emission trading system, thereby subjecting additional carbon emission sources to market constraints. A stringent Monitoring, Reporting, and Verification (MRV) system for carbon emissions must be instituted to deter firms from illicitly manipulating quota prices and to uphold market fairness and efficacy. It is necessary to engage in discussions and collaborations regarding international carbon pricing mechanisms and advocate for the creation of an equitable and rational global carbon pricing system on platforms like the United Nations Framework Convention on Climate Change (UNFCCC) to prevent carbon leakage and related issues. It is also recommended to implement the Carbon Border Adjustment Mechanism (CBAM) and levy carbon tariffs on high-carbon products to enhance trade equity and facilitate the low-carbon transition of domestic sectors.

5.3. Limitations

This study acknowledges several limitations. First, the analysis is constrained by its exclusive focus on Anhui Province, China, and its generalizability to other regions and countries is constrained; future research may adopt a broader research scope to enhance applicability. Second, this paper considers only a limited set of core driving factors of carbon emissions, which cannot fully capture the inherent complexity of carbon emission formation mechanisms. Subsequent studies could incorporate additional influencing factors to enhance and refine the analytical framework. Third, the research period is constrained by data accessibility, with this study limited to the years 2007–2021. This restriction results in a paucity of the latest insights into carbon emission drivers and industrial decoupling trends in Anhui Province. Consequently, subsequent research may integrate updated datasets or adopt alternative variables to conduct a more thorough investigation.

Author Contributions

Conceptualization, H.L. and H.J.; methodology, X.Z. and P.M.; software, P.M.; validation, X.Z. and P.M.; formal analysis, H.J.; investigation, H.J. and P.M.; resources, H.L.; data curation, X.Z.; writing—original draft preparation, H.J. and P.M.; writing—review and editing, X.Z.; visualization, P.M.; supervision, H.L.; project administration, H.L.; funding acquisition, H.L. All authors have read and agreed to the published version of the manuscript.

Funding

This research received no external funding.

Institutional Review Board Statement

Not applicable.

Informed Consent Statement

Not applicable.

Data Availability Statement

The data can be made available on request. The datasets generated during the current study are obtainable from the corresponding author [liuadele@glut.edu.cn] on appropriate request.

Conflicts of Interest

The authors declare no competing interests.

Appendix A

Table A1. Carbon emission driving factor breakdown table.
Year2007–20112012–20162017–2021
ESEIEDPPESEIEDPPESEIEDPP
A−0.469−2.7221.493−1.81−2.061−2.5011.965−2.45−2.003−0.6220.369−0.797
B0.077−0.0610.1010.04−0.018−0.0420.035−0.008−0.0010.0090.049−0.033
C−0.013−0.0210.020−0.011−0.001−0.0040.005−0.0020.0090.0080.012−0.005
D−0.338−1.0680.702−0.0730.5980.173−1.5091.0580.023−0.044−0.0580.109
E0.0120.071−0.110.0450.017−0.1190.1290.008−0.5610.0170.051−0.025
F−0.178−1.1491.991−1.78−0.663−1.986−2.4451.067−0.812−1.8041.8360.354
G−0.258−1.3862.656−1.055−0.615−0.614−3.1271.385−0.021−0.9090.014−1.415
H0.017−0.042−0.0260.0870.037−0.010.171−0.119−0.021−0.0070.014−0.019
I0.014−0.0150.000.030.005−0.0120.04−0.0220.0240.0190.040.036
J0.031−0.1230.287−0.129−0.03−0.074−0.0420.0870.020.0130.0150.019
K0.02−0.0160.020.0170.019−0.0030.0240.001−0.009−0.0190.010.025
L0.014−0.0090.0070.0160.017−0.0080.0260.0010.0070.0020.0140.004
M0.010.0030.0040.0040.018−0.0030.011.0110.0230.00−0.020.05
N0.26−1.732.113−5.068−1.526−6.2621.644−1.062−4.319−1.2991.6443.39

References

  1. Udara, S.P.R.A.; Kohilan, R.; Lakshan, M.A.L.; Madalagama, M.K.L.; Pathirana, P.R.P.; Sandupama, P.W.S. Simulation of Carbon Dioxide Capture for Industrial Applications. Energy Rep. 2020, 6, 659–663. [Google Scholar] [CrossRef]
  2. Slameršak, A.; Kallis, G.; O’Neill, D.W. Energy Requirements and Carbon Emissions for a Low-Carbon Energy Transition. Nat. Commun. 2022, 13, 6932. [Google Scholar] [CrossRef] [PubMed]
  3. Hu, Y.; Man, Y. Energy Consumption and Carbon Emissions Forecasting for Industrial Processes: Status, Challenges and Perspectives. Renew. Sustain. Energy Rev. 2023, 182, 113405. [Google Scholar] [CrossRef]
  4. Hu, Y.; Man, Y.; Ren, J.; Zhou, J.; Zeng, Z. Multi-Step Carbon Emissions Forecasting Model for Industrial Process Based on a New Strategy and Machine Learning Methods. Process Saf. Environ. Prot. 2024, 187, 1213–1233. [Google Scholar] [CrossRef]
  5. Liu, C.; Tang, C.; Liu, Y. Does the Transformation of Energy Structure Promote Green Technological Innovation? A Quasi–Natural Experiment Based on New Energy Demonstration City Construction. Geosci. Front. 2024, 15, 101615. [Google Scholar] [CrossRef]
  6. Xu, J. Study on Spatiotemporal Distribution Characteristics and Driving Factors of Carbon Emission in Anhui Province. Sci. Rep. 2023, 13, 14400. [Google Scholar] [CrossRef]
  7. Dong, J.; Li, C.; Wang, Q. Decomposition of Carbon Emission and Its Decoupling Analysis and Prediction with Economic Development: A Case Study of Industrial Sectors in Henan Province. J. Clean. Prod. 2021, 321, 129019. [Google Scholar] [CrossRef]
  8. Li, R.; Wang, Q.; Liu, Y.; Jiang, R. Per-Capita Carbon Emissions in 147 Countries: The Effect of Economic, Energy, Social, and Trade Structural Changes. Sustain. Prod. Consum. 2021, 27, 1149–1164. [Google Scholar] [CrossRef]
  9. Wang, Q.; Wang, S. Decoupling Economic Growth from Carbon Emissions Growth in the United States: The Role of Research and Development. J. Clean. Prod. 2019, 234, 702–713. [Google Scholar] [CrossRef]
  10. Wei, Z.; Wei, K.; Liu, J.; Zhou, Y. The Relationship between Agricultural and Animal Husbandry Economic Development and Carbon Emissions in Henan Province, the Analysis of Factors Affecting Carbon Emissions, and Carbon Emissions Prediction. Mar. Pollut. Bull. 2023, 193, 115134. [Google Scholar] [CrossRef]
  11. Song, C.; Liu, Q.; Song, J.; Ma, W. Impact Path of Digital Economy on Carbon Emission Efficiency: Mediating Effect Based on Technological Innovation. J. Environ. Manag. 2024, 358, 120940. [Google Scholar] [CrossRef] [PubMed]
  12. Li, X.; Zhao, M.; Xu, W.; Cui, S.; Yang, F. The Achievement of Carbon Emission Reduction Targets for Three Typical Tourism Industries: A Coordinated Analysis Based on Efficiency and Potential. Sustain. Energy Technol. Assess. 2023, 60, 103549. [Google Scholar] [CrossRef]
  13. Zhou, Z.; Zeng, C.; Li, K.; Yang, Y.; Zhao, K.; Wang, Z. Decomposition of the Decoupling between Electricity CO2 Emissions and Economic Growth: A Production and Consumption Perspective. Energy 2024, 293, 130644. [Google Scholar] [CrossRef]
  14. Ben Amara, D.; Qiao, J.; Zada, M. How to Reconcile the Climate Change Issue with Economic Growth? Spatial Dual Mediating Effects of Carbon Emissions and Foreign Investment. J. Clean. Prod. 2023, 411, 137285. [Google Scholar] [CrossRef]
  15. Raza, M.Y.; Lin, B. Decoupling and Mitigation Potential Analysis of CO2 Emissions from Pakistan’s Transport Sector. Sci. Total Environ. 2020, 730, 139000. [Google Scholar] [CrossRef]
  16. Yang, F.; Shi, L.; Gao, L. Probing CO2 Emission in Chengdu Based on STRIPAT Model and Tapio Decoupling. Sustain. Cities Soc. 2023, 89, 104309. [Google Scholar] [CrossRef]
  17. Engo, J. Decoupling Analysis of CO2 Emissions from Transport Sector in Cameroon. Sustain. Cities Soc. 2019, 51, 101732. [Google Scholar] [CrossRef]
  18. Ozdemir, A.C. Decomposition and Decoupling Analysis of Carbon Dioxide Emissions in Electricity Generation by Primary Fossil Fuels in Turkey. Energy 2023, 273, 127264. [Google Scholar] [CrossRef]
  19. Ge, W.; Cao, H.; Li, H.; Zhang, Q.; Wen, X.; Zhang, C.; Mativenga, P. Data-Driven Carbon Emission Accounting for Manufacturing Systems Based on Meta-Carbon-Emission Block. J. Manuf. Syst. 2024, 74, 141–156. [Google Scholar] [CrossRef]
  20. Zhao, M.; Tan, L.; Zhang, W.; Ji, M.; Liu, Y.; Yu, L. Decomposing the Influencing Factors of Industrial Carbon Emissions in Shanghai Using the LMDI Method. Energy 2010, 35, 2505–2510. [Google Scholar] [CrossRef]
  21. Shi, A. The Impact of Population Pressure on Global Carbon Dioxide Emissions, 1975–1996: Evidence from Pooled Cross-Country Data. Ecol. Econ. 2003, 44, 29–42. [Google Scholar] [CrossRef]
  22. Tapio, P. Towards a Theory of Decoupling: Degrees of Decoupling in the EU and the Case of Road Traffic in Finland between 1970 and 2001. Transp. Policy 2005, 12, 137–151. [Google Scholar] [CrossRef]
  23. Luo, H.; Li, L.; Lei, Y.; Wu, S.; Yan, D.; Fu, X.; Luo, X.; Wu, L. Decoupling Analysis between Economic Growth and Resources Environment in Central Plains Urban Agglomeration. Sci. Total Environ. 2021, 752, 142284. [Google Scholar] [CrossRef] [PubMed]
  24. Canas, Â.; Ferrão, P.; Conceição, P. A New Environmental Kuznets Curve? Relationship between Direct Material Input and Income per Capita: Evidence from Industrialised Countries. Ecol. Econ. 2003, 46, 217–229. [Google Scholar] [CrossRef]
  25. Kovanda, J. Total Residual Output Flows of the Economy: Methodology and Application in the Case of the Czech Republic. Resour. Conserv. Recycl. 2017, 116, 61–69. [Google Scholar] [CrossRef]
  26. Zhang, K.; Jiang, L.; Liu, W. Toward the Construction of a Sustainable Society: Assessing the Temporal Variations and Two-Dimensional Decoupling of Carbon Dioxide Emissions in Anhui Province, China. Sustainability 2024, 16, 9923. [Google Scholar] [CrossRef]
  27. Shan, Y.; Fang, S.; Cai, B.; Zhou, Y.; Li, D.; Feng, K.; Hubacek, K. Chinese Cities Exhibit Varying Degrees of Decoupling of Economic Growth and CO2 Emissions between 2005 and 2015. One Earth 2021, 4, 124–134. [Google Scholar] [CrossRef]
  28. Gao, C.; Ge, H.; Lu, Y.; Wang, W.; Zhang, Y. Decoupling of Provincial Energy-Related CO2 Emissions from Economic Growth in China and Its Convergence from 1995 to 2017. J. Clean. Prod. 2021, 297, 126627. [Google Scholar] [CrossRef]
  29. Wang, F.; Sun, C.; Chen, S.; Zhou, Q.; Wang, C. Energy-Related Carbon Emissions in Mega City in Developing Country: Patterns and Determinants Revealed by Hong Kong. Sustainability 2025, 17, 6854. [Google Scholar] [CrossRef]
  30. Wang, W.; Zhu, X.; Kao, X.; Wei, H. Decomposition and Decoupling Analysis between Economic Growth and Carbon Emissions at the Regional Level: Evidence from Six Central Provinces, China. PLoS ONE 2024, 19, e0305769. [Google Scholar] [CrossRef]
  31. Wang, Y.; Zheng, Y. Spatial Effects of Carbon Emission Intensity and Regional Development in China. Environ. Sci. Pollut. Res. 2021, 28, 14131–14143. [Google Scholar] [CrossRef]
  32. Wang, Q.; Zhao, M.; Li, R.; Su, M. Decomposition and Decoupling Analysis of Carbon Emissions from Economic Growth: A Comparative Study of China and the United States. J. Clean. Prod. 2018, 197, 178–184. [Google Scholar] [CrossRef]
Figure 1. Research methodology flowchart.
Sustainability 18 04217 g001
Figure 2. Decoupling states and their numerical characteristics.
Sustainability 18 04217 g002
Figure 3. Trends in carbon emissions from major industrial sectors. Note: A: Production and Supply of Electricity, Steam, and Hot Water; B: Iron and Steel Industry; C: Non-Metallic Mineral Products; D: Coal Industry; E: Fabricated Metal Products; F: Smelting and Compacting of Non-Ferrous Metals; G: Chemical Raw Materials and Chemical Products; H: General Equipment Manufacturing; I: Agri-food Processing Industry; J: Automobile Manufacturing; K: Rubber and Plastic Products; L: Textile Industry; M: Computer Communication and Other Electronic Equipment Manufacturing; N: Electrical Machinery and Equipment Manufacturing.
Sustainability 18 04217 g003
Figure 4. Carbon emission driver contribution rate of major industrial sectors in different periods. Note: (a): Carbon emission driver contribution rate of major industrial sectors from 2007 to 2011; (b): Carbon emission driver contribution rate of major industrial sectors in 2010; (c): Carbon emission driver contribution rate of major industrial sectors from 2012 to 2016; (d): Carbon emission driver contribution rate of major industrial sectors in 2015; (e): Carbon emission driver contribution rate of major industrial sectors from 2017 to 2021; (f): Carbon emission driver contribution rate of major industrial sectors in 2020.
Sustainability 18 04217 g004
Figure 5. Change in decoupling index for major industrial sectors in different periods. Note: (a): Change in decoupling index for major industrial sectors from 2007 to 2011; (b): Change in decoupling index for major industrial sectors in 2010; (c): Change in decoupling index for major industrial sectors from 2012 to 2016; (d): Change in decoupling index for major industrial sectors in 2015; (e): Change in decoupling index for major industrial sectors from 2017 to 2021; (f): Change in decoupling index for major industrial sectors in 2020.
Sustainability 18 04217 g005
Figure 6. Change in integrated decoupling of resources and environment in key industrial sectors. Note: (a): Change in integrated decoupling of resources and environment in Iron and Steel Industry; (b): Change in integrated decoupling of resources and environment in Automobile Manufacturing; (c): Change in integrated decoupling of resources and environment in Coal Industry; (d): Change in integrated decoupling of resources and environment in Computer Communication and Other Electronic Equipment Manufacturing. B: Iron and Steel Industry; J: Automobile Manufacturing; D: Coal Industry; M: Computer Communication and Other Electronic Equipment Manufacturing.
Sustainability 18 04217 g006
Table 1. Decoupling states and numerical characteristics.
Decoupling State G D ε
Forced decoupling > 0 < 0 ε < 0
Weak decoupling > 0 > 0 0 ε < 0.8
Expansive coupling > 0 > 0 0.8 ε < 1.2
Expansive negative coupling > 0 > 0 ε > 1.2
Strong negative coupling < 0 > 0 ε < 0
Weak negative coupling < 0 < 0 0 ε < 0.8
Recessive coupling < 0 < 0 0.8 ε < 1.2
Recessive decoupling < 0 < 0 ε > 1.2
Table 2. Variable definitions and sources.
NameLabelsUnitData TypeCharacterization
Population sizeNumber of Employeesten thousandnumeric dataaverage annual number of employees in industrial enterprises above designated size
CarbonCarbon Intensityone million tonsnumeric dataindustry carbon emissions based on IPCC emission factor method
EnergyTotal Energy Consumptionone million tonsnumeric datatotal end-use energy consumption of industries
GDPTotal Assetsone hundred million yuannumeric datatotal assets of industrial enterprises above designated size
Disclaimer/Publisher’s Note: The statements, opinions and data contained in all publications are solely those of the individual author(s) and contributor(s) and not of MDPI and/or the editor(s). MDPI and/or the editor(s) disclaim responsibility for any injury to people or property resulting from any ideas, methods, instructions or products referred to in the content.