1. Introduction
The new phase of urbanization in China has entered a late stage of rapid development. Many cities are breaking traditional administrative boundaries and forming a new spatial layout: the central urban area is the core; new towns form the main body; and key towns and general towns form the secondary core, called the metropolitan area. With the reconstruction of the spatial pattern, the occupational and residential space is gradually separated while the function of the central urban area is still concentrated. As a result, extremely large passenger volumes like commuter volumes frequently occur and problems like traffic congestion and imbalance of transportation facilities have emerged in the region. To meet passenger demands, it is necessary to optimize the configuration of transportation facilities in the metropolitan area. However, blindly configuring transportation facilities can lead to the waste of space resources.
As the skeleton of the transportation network, passenger corridors determine the direction of transportation system development at the regional level. They also facilitate the rationalization of industrial layouts and improve the utilization of the surrounding land and resources [
1,
2]. Passenger corridors have the function of gathering and dispersing passenger volumes and transportation modes. Because of their convenience, accessibility, and smaller traffic impedance, corridors attract residents [
3], employment, and tertiary industry to gather around them, leading to increased passenger volume. The agglomeration effect of passenger corridors also results in the concentration of various kinds of transportation modes, while the diffusion effect helps transportation modes become more specialized. Correctly identifying passenger corridors in metropolitan areas can support the optimization of transportation facility configuration, avoid unnecessary construction, and lead to the more efficient use of urban space resources and government funds. From a sustainability perspective, identifying passenger transport corridors can help in optimizing the allocation of transportation resources, promote multimodal coordination, and support the development of efficient and low-impact transportation systems in metropolitan areas. As a result, the imbalance of current passenger demand and supply can be eased and the intensive use of transportation facilities can be strengthened, realizing the integrative development of urban spaces and transportation systems.
Many researchers have studied the identification method of passenger corridors and most of them use the importance degree model as the basis for identification. However, it is important to note that the importance degree of routes used in these studies is simply calculated by the importance degree of nodes and the distance between them. The model fails to reflect the technological and economic characteristics of different transportation modes, which may have an impact on identification. This study defines a passenger corridor in a metropolitan area as a linear space that is closely related to surrounding land use types and is composed of various transportation modes.
To fill the research gaps, this study constructs a multilayer network in a metropolitan area to distinguish between different transportation modes and improve the identification method of passenger corridors in the metropolitan area. The multilayer network in this study includes five transportation modes, including freeways, general national highways, expressways, suburban railways, and subways. Specifically, the present research aimed to address two questions: (1) How can the technological and economic characteristics of different transportation modes be reflected in the importance degree model? (2) How can we reasonably identify passenger corridors in the metropolitan area?
The present study makes two contributions to the literature. Firstly, it improves the foundational importance degree model. It establishes an importance degree model of routes based on transportation modes, passenger demand, and transportation cost, taking into account the technological and economic characteristics of each mode. This model can be used to describe the impact of the diversity of transportation modes on identifying passenger corridors. Secondly, the identification method for passenger corridors in the metropolitan area is proposed. Passenger corridors are categorized as primary and secondary corridors, and the corridors are identified based on the importance degree of routes and regional planning.
The rest of the paper is organized as follows.
Section 2 reviews the research on identifying passenger corridors.
Section 3 proposes the method for constructing a multilayer network in the metropolitan area, the importance degree model of routes, and the method for identifying passenger corridors. The proposed model and method are applied to the Suzhou metropolitan area in
Section 4.
Section 5 analyzes the result of the case and validates the availability of the model.
Section 6 concludes the main findings and discusses future research directions.
2. Literature Review
Currently, studies of passenger transportation corridors in metropolitan areas primarily focus on route or network optimization and the analysis of demand for single transportation. Li et al. [
4] propose an approach based on paths to expand the rail network in a metropolitan area. Alonso et al. [
5] construct a transit corridor assignment model that considers congestion and dwell times to improve the service level of urban public transport. Yin and Zhang [
6] comprehensively optimize urban bus corridor location and setting of bus lanes comprehensively, taking into account the aggregation effect of the corridor. Previous studies have involved various transportation modes, such as highways, buses, railways, and subways [
7,
8,
9,
10]. However, studying only one mode of transportation can lead to neglection of the cooperation between other modes. Non-intensive transportation facilities can lead to the waste of space resources. In recent years, multilayer network theory has increasingly been applied to the analysis of transportation systems. Recent studies have used multilayer network approaches to analyze robustness of the transportation system, node importance, and network performance in integrated transport systems [
11,
12]. Ippolito and Cats [
13] analyze the robustness of a multimodal transportation network by integrating the European rail and air networks into a multilayer network framework. Du et al. [
14] developed a novel transportation network capacity model to capture the travel behaviors of intermultimodal mobility in an urban transportation system incorporating emerging travel modes. De Domenico et al. [
15] propose a modeling approach based on multilayer networks to analyze multimodal urban transportation systems and evaluate the structural properties of integrated transport networks.
Studies on the identification of passenger corridors primarily focus on urban agglomerations. Classical methods include the node importance method, the transport location analysis method, and importance combined with the area location layout method. Before calculating the importance degree of nodes, scholars analyze the factors influencing nodes and corridors. They have found that population size, GDP, and the income of urban residents are the main influencing factors [
16,
17,
18]. Research on the importance degree model is summarized as follows. Wang et al. [
19] constructed a corridor selection model to identify the main freight corridor. The importance degree of the proposed routes is proportional to the importance degree of the nodes and inversely proportional to the square of the distance between them. Taking into account the importance of nodes, transport demand, and linear distance, Xiong et al. [
20] use a gravity model to represent the connection importance degree of each pair of nodes and design a colony search-based algorithm to plan a the comprehensive transportation corridor. Luo et al. [
18] calculate the traffic accessibility using the weighted average travel time of the city and the gravity model. They used a compressed time cost to calculate the intensity of the economic connections between two cities in order to analyze the differences and priorities of interprovincial logistics connections. In addition to identifying corridors based on the importance degree, some scholars also identify corridors from other perspectives. Yakimov [
21] starts with passenger demand as the starting point and presents an algorithm that can solve the problem of constructing an entire route network for all modes of transport. Bahbouh and Morency [
22] visualize the O-D matrix and clustering desire lines to identify major corridors. Bahbouh et al. [
23] also used a trajectory clustering algorithm for desire lines, which can identify transportation corridors using O-D data. Wu et al. [
24] use the ant colony algorithm to simulate transport demand choice behavior in a traffic network. They identify and optimize comprehensive transport corridors using the load value as an indicator. Salamati et al. [
25] propose the multilayer transformed graph method in raster space to find the least-cost path for wide multimodal transportation corridors. Jiang et al. [
26] propose an improved bi-level programming model to optimize transport corridor layout, according to the decision-making department of the construction and management and the individual corridor users. While many studies have focused on identifying passenger corridors, few have considered the technological and economic characteristics of each mode.
To complete their research, scholars have quantified the technological and economic characteristics of different transportation modes. For instance, Hoffman et al. [
27] constructed a TEC model that included direct costs and the cost impact of delays and variability in delays. They then used this model to quantify the relative contributions of ports, border posts, and road travel in order to compare the economic cost of transport corridors. Guo et al. [
28] propose a generalized cost model for three typical modes to evaluate each different travel alternative. Relevant research can be summarized as studies on the coupling of different modes of transportation in passenger corridors [
29,
30], the optimization of the supply–demand structure and the travel behavior of travelers [
31,
32,
33]. Using the attributes and the supply capacity of different transportation modes as the decision variables to construct models enables the passenger volume in transportation corridors to be reasonably distributed among various transportation modes. The next challenge is to incorporate the attributes and the supply capacity of different transportation modes into identifying passenger corridors.
In summary, previous studies have two limitations. Firstly, existing research mainly focuses on urban agglomerations, while relatively limited attention has been given to metropolitan areas. Transportation connections are becoming increasingly complex due to rapid spatial development. Many studies concentrate on single transportation modes, which do not fully reflect the characteristics of modern integrated transportation systems. Secondly, current identification methods cannot reflect the multimodal and synergetic characteristics of passenger corridors. The integrated development of transportation and the intensive use of resources become a considerable task due to the resource consumption caused by spatial development in the metropolitan areas. When optimizing the structure and facilities configuration of passenger corridors in a metropolitan area, scholars have considered the technological and economic characteristics of different transportation modes. As the basis of corridor planning, passenger corridor identification should embody the comprehensiveness of transportation even more. However, it can be challenging to integrate these factors into the indicators of node importance. Currently, the weight of the routes only considers the importance degree of nodes and distance. Identifying corridors according to passenger demands also struggles to reflect comprehensiveness.
Therefore, this paper applies complex network theory to model the passenger transportation facilities network of a metropolitan area as a multilayer network. An importance degree model of routes is constructed based on the importance degree of nodes, taking into account the characteristics of the network and different transportation modes. Finally, a method of identifying passenger corridors is proposed that combines with the constructed importance degree and regional planning. This method can identify passenger corridors synthetically, which is a prerequisite for adjusting the configuration of facilities and optimizing the structure of the comprehensive traffic network in the metropolitan area. This study also plays an important role in improving the cooperative service of various transportation modes to meet passenger demands. Considering multimodal coordination and travel demand in corridor planning can reduce excessive infrastructure expansion and contribute to more sustainable metropolitan transportation development.
3. Methodology
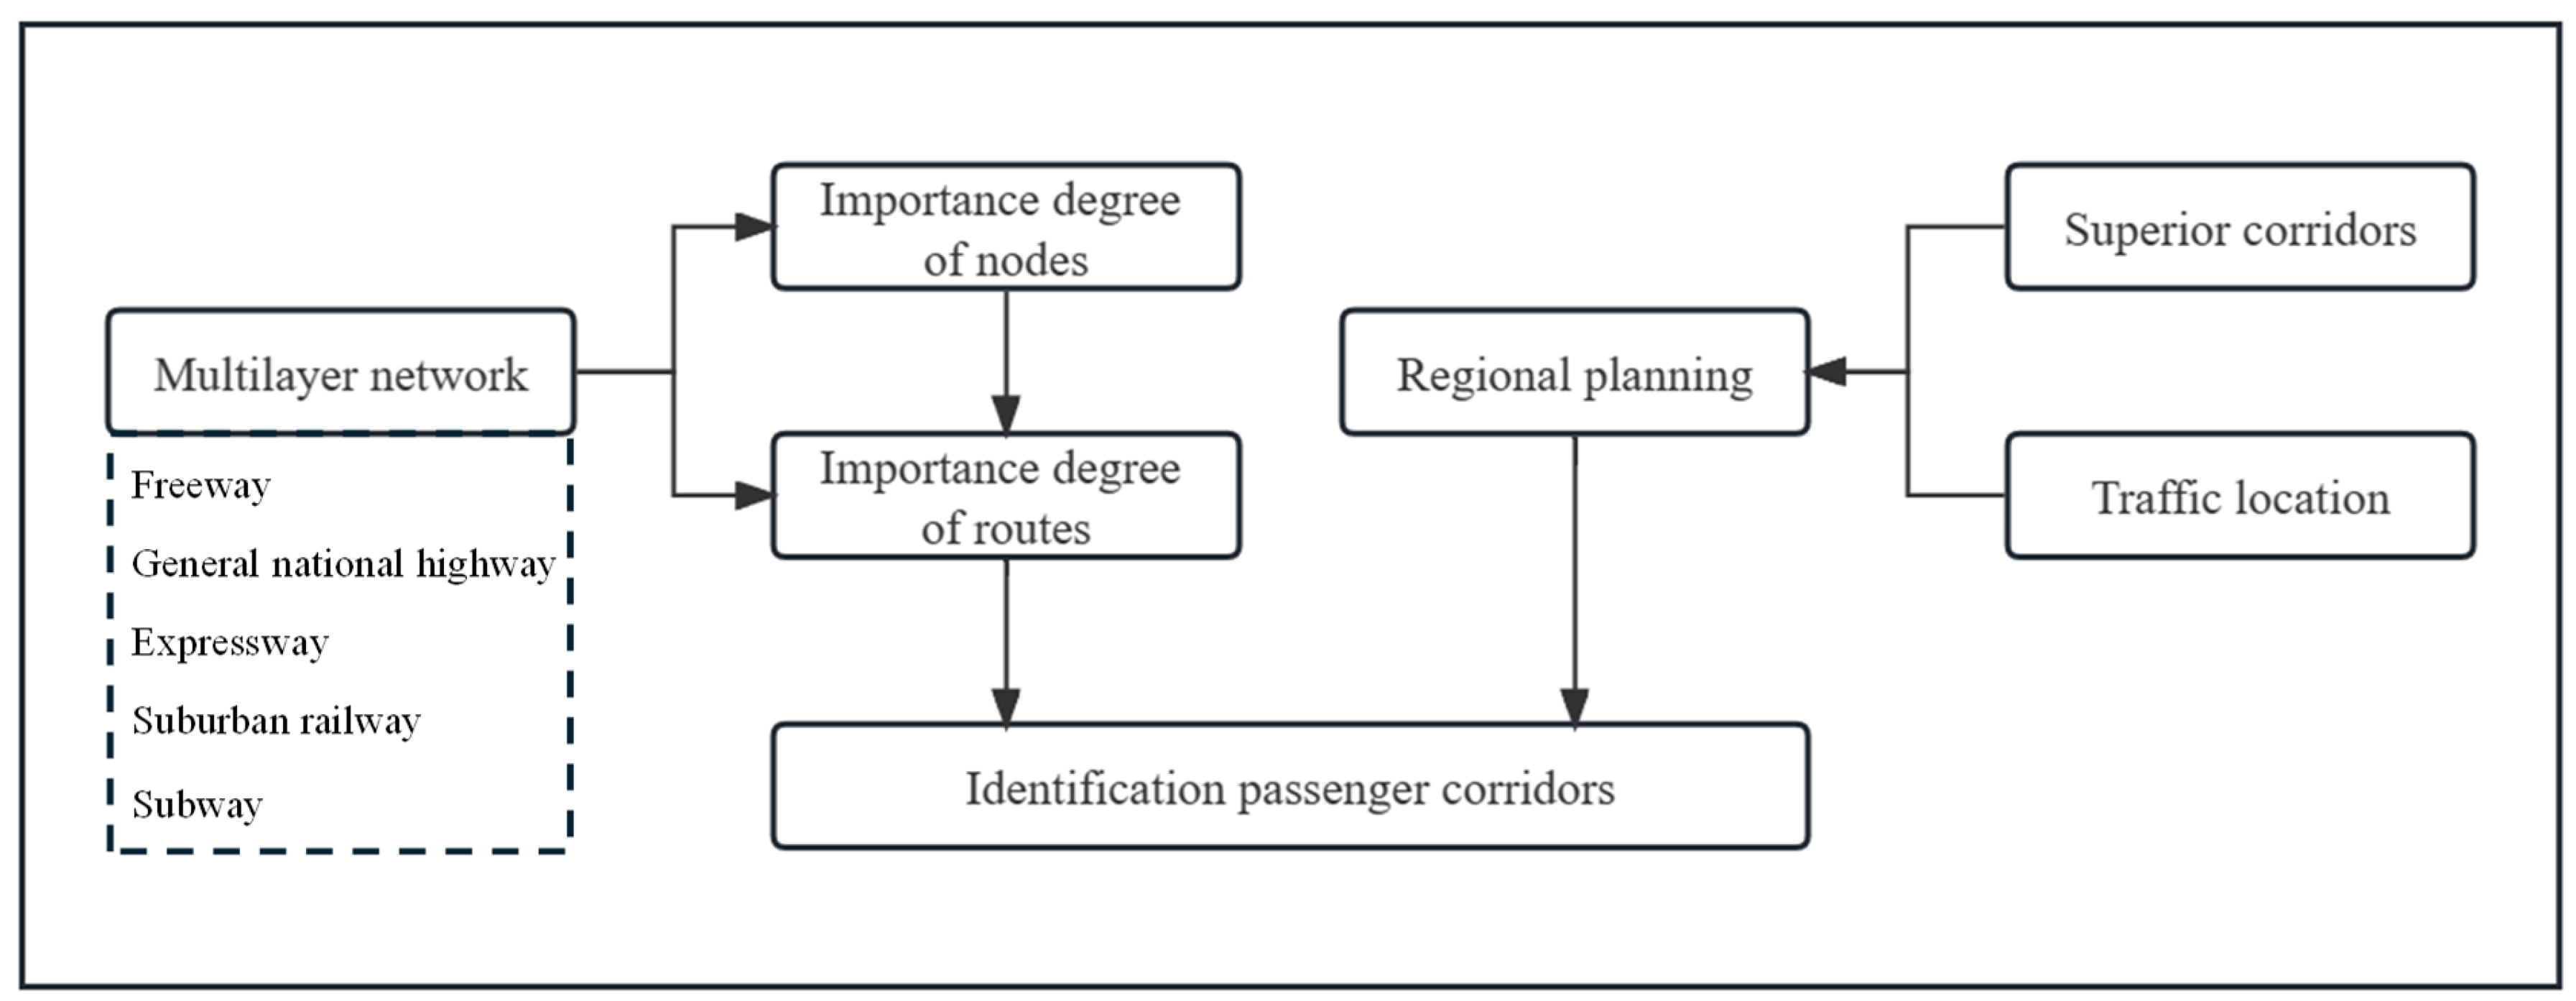
Figure 1 displays the framework of the identification method. The importance degree models of nodes and routes are established based on the constructed multilayer network. Regional planning is analyzed in terms of the superior corridors and the traffic location. Finally, passenger corridor identification is achieved by combining the importance degree of nodes and routes with the regional planning analysis.
3.1. Multilayer Network Construction
The passenger transportation facilities network in the metropolitan area comprises the highway transportation network, railway transportation network, waterway transportation network, and air transportation network. The highway transportation network consists of freeways, general national highways and expressways. Freeways are toll highways designed for high-speed car travel, while expressways are toll-free highways within cities for the same purpose. The railway transportation network includes mainline railways, interurban railways, suburban railways and subways. This paper focuses on the following transportation modes in the metropolitan area, including freeways, general national highways, expressways, suburban railways and subways.
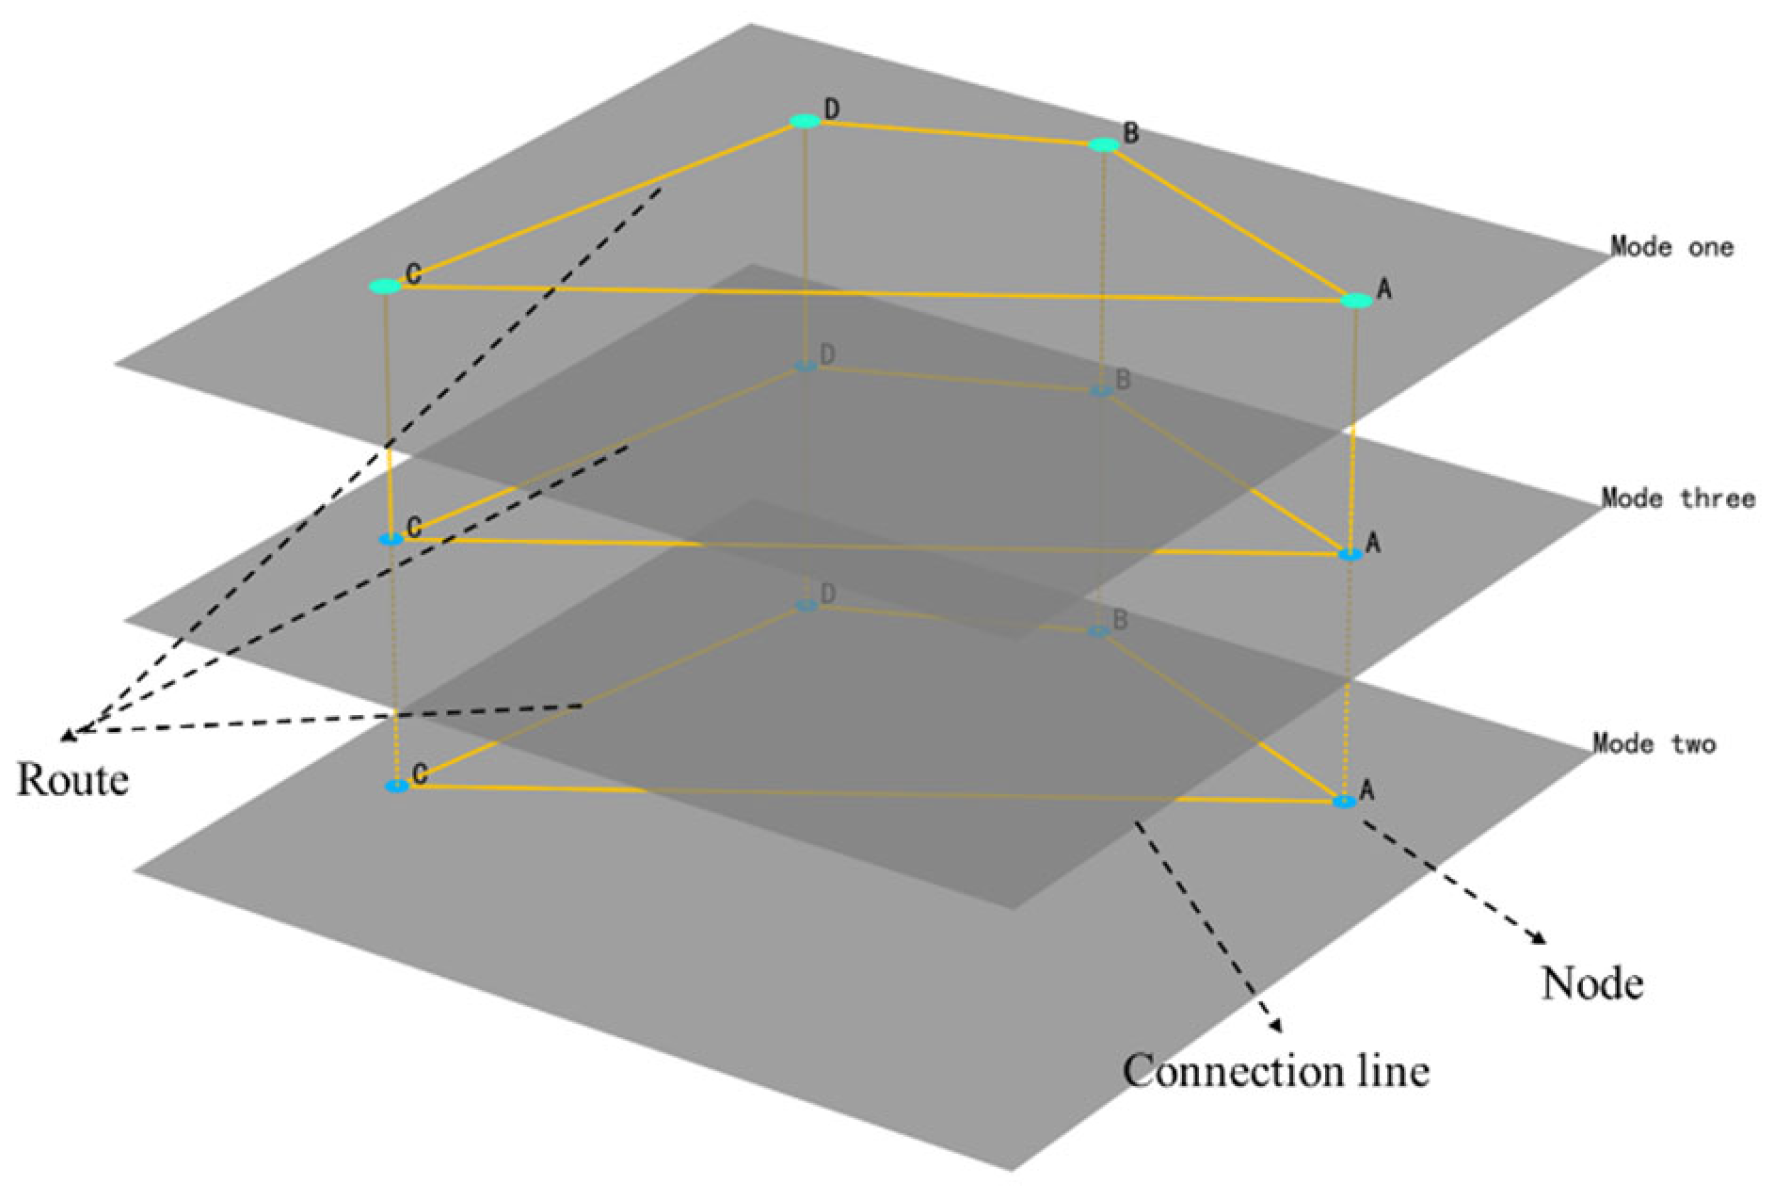
The network of passenger transportation facilities is represented as a multilayer network, with administrative regions serving as nodes (see
Figure 2). Each layer of the multilayer network corresponds to one transportation mode and each connection line corresponds to a section of a route for that mode. A route is formed by connecting connection lines with the same nodes and direction. Equations (1)–(3) describe the topological structure of layer
.
where
is the set of nodes on layer
,
is the set of connection lines,
is the weight set of nodes,
is the weight set of connection lines,
is the number of nodes,
and
are the type of transportation mode for the nodes and connection lines,
and
are the population and GDP of the administrative region represented by node,
is the passenger volume of transportation mode
,
is the number of connection lines,
and
are the number of the node at the start and end of the connection line,
is the transportation demand in the connection line,
is the length of the connection line,
is the travel time of the connection line,
is the transportation cost of the connection line. The topological structure of the interlayer network is written as Equation (4):
where
is the set of interlayer connection lines between layers
and
. The interlayer network reflects the connections and transfers between different modes of transportation at the same node.
3.2. Importance Degree Model of Nodes
Nodes are an integral part of the corridor and undoubtedly influence the importance of connection lines. In order to quantify this influence, it is first necessary to evaluate the degree of importance of the nodes.
3.2.1. Indicators of the Importance Degree of Nodes
The passenger corridors in the metropolitan area form the backbone of the regional passenger transportation network, connecting the CBD, secondary cores, and new towns. These nodes attract the majority of the area’s population, industries and passenger demand. Therefore, it is essential to reasonably evaluate the importance of these nodes to enable the corridors to serve passengers more effectively. According to previous studies on factors influencing passenger corridors, the GDP, permanent resident population and annual passenger volume of each administrative region were selected to evaluate the nodes. The dataset can be obtained from the statistical yearbook of each city. Additionally, the connectivity between nodes in the network reflects the connections between transportation modes. Nodes with high connectivity act as passenger transportation junctions and directly impact regional traffic. Therefore, the indicator system should consider the importance of nodes within the network.
In complex networks, a node’s degree centrality represents its connectivity with other nodes. A node’s importance increases with the number of its neighbors. The degree centrality of node
is defined as Equation (5).
where
is the degree of node
,
is the total number of nodes in the network.
Betweenness reflects the function and influence of nodes or connection lines in a network. It is calculated as the ratio of the number of shortest paths passing through a node to the total number of shortest paths in the network. Equation (6) defines the betweenness of node
.
where
is the number of actual shortest paths from node
to node
through node
,
is the number of actual shortest paths from node
to node
.
The indicator system for importance of nodes includes their degree centrality and betweenness of nodes to reflect their importance in the network.
Table 1 displays all the indicators. The variance inflation factor (VIF) was used to examine the multicollinearity among the indicators in
Table 1. As all the VIFs are all below 5, these variables are therefore included in the subsequent model.
3.2.2. Importance Degree of Nodes Calculation
Before calculating the importance degree of the nodes, all the indicators are normalized in Step 1 of the entropy weight method using Equation (8). Then, Equation (7) can be used to calculate the importance degree of node
based on the proposed indicators.
where
,
,
,
,
are the weights of each indicator.
To ensure objectivity and consistency with objective facts, the entropy weight method is used to determine the weight of each indicator. This method assigns weights based on differences in information, with information entropy reflecting the degree to which an indicator is dispersed. The smaller the information entropy, the greater the degree of dispersion of the indicator. The specific steps for the entropy weight method are as follows:
Step 1: Since dimensions of different indicators vary, it is necessary to normalize them. Equation (8) demonstrates this process.
where
is the value of indicator
of node
,
is the standardized value of indicator
of node
.
Step 2: The normalized information entropy of each indicator is calculated using Equation (9), in which the entropy is scaled by
to ensure the entropy values lie within the range [0, 1].
Step 3: Calculate the weight of each indicator based on its difference coefficient. A high difference coefficient indicates a greater influence on the importance degree. The equation for calculating the weight of indicator
is shown in Equation (10).
3.3. Importance Degree Model of Routes
One passenger corridor consists of multiple continuous routes. To quantify the characteristics of these corridors, reasonable indicators are constructed and used to evaluate the routes. The importance degree of routes is a crucial factor in identifying the corridor.
3.3.1. Indicators of Importance Degree of Routes
This paper establishes an importance degree model of routes based on a multilayer network. The model considers the importance of modes, demand, and cost. Passenger corridors in the metropolitan areas comprise various transportation modes that cooperate to promote the formation of an efficient passenger transportation organization system and a green, intensive land layout in the corridor. The model considers not only the characteristics and transportation demand of nodes but also the technological and economic characteristics of different transportation modes.
- (a)
Mode importance
The mode importance is a measure of the influence of different transportation modes within a given route in the global network. Rather than being reflected through a detailed comparison of the technological and economic characteristics of individual modes, the importance of different transportation modes is reflected through the structural characteristics of the multilayer transportation network. Specially, this reflects the comprehensiveness of passenger corridors, which typically comprise various transportation modes. The greater number of transportation modes included in the corridor, the greater the range of travel options between the connected nodes. Therefore, the importance of the various modes within the corridor must be considered in the network. In the constructed multilayer network, each route is formed by integrating connection lines that share the same nodes and direction. The betweenness of these connection lines reflects their influence on the global network. Combined with the importance degree of the nodes which has been calculated, the mode importance of the connection line
is defined as shown in Equations (11) and (12).
where
is the betweenness of connection line
,
is the number of the shortest paths from node
to node
through connection line
,
is the number of the shortest paths from node
to node
.
Equation (13) defines the mode importance of a route as the sum of the importance degree of the connection lines within that route.
Demand importance is determined by the total passenger demands for different transportation modes within the same administrative region. It describes travel characteristics and is a crucial factor in determining the configuration of facilities in passenger corridors within the metropolitan area. Travel demand directly affects the traffic state of corridors, with those experiencing greater demand naturally handling higher passenger volumes. If the corridor’s supply capacity is insufficient to meet the existing demand, it will be more vulnerable than others, and any fluctuations in its traffic state will also have a greater impact on the global network. The demand importance of routes is defined as Equation (14).
where
is the passenger demand of connection line
.
Cost importance reflects the generalized travel costs of the route. Residents’ choice of transportation modes and routes is influenced by travel time and cost. Routes with lower travel costs will attract more passengers, which increases the risk of overloading. Therefore, the cost importance indicator for connection lines is defined as Equation (16).
where
is the unit travel cost of transportation mode
,
is the value of time of node
.
represents the average monthly income of residents in node
,
represents the average number of working days per month, and
represents the average daily working hours.
The average generalized travel cost of the route is used as the cost importance indicator according to the cost importance of the connection lines. The cost importance of routes is defined by Equations (17) and (18).
where
is the average distance of the route
. A high value of this indicator shows that the overall travel cost of the route is relatively reasonable, and residents are more likely to choose this route.
3.3.2. Importance Degree of Routes Calculation
According to the above indicator system, the model of the importance degree of route
is modeled as Equation (19).
where
,
,
are the weights of mode importance, demand importance and cost importance respectively. The entropy weight method is also used to calculate the weight of each indicator. A high value of
indicates a more important route. The ranking of route importance can be obtained by ranking
from largest to smallest.
3.4. Identification of Passenger Corridors
The identification of passenger corridors in the metropolitan area should consider regional planning and the importance degree of routes. Implementing regional planning can make the identification of passenger corridors more suitable for the evolution of urban development, resulting in a qualitative, macroscopic, and recessive outcome. Identifying corridors based on their importance degree better meets the realistic demands, resulting in a quantitative, microscopic, and explicit outcome. This paper classifies passenger corridors in the metropolitan area as primary corridors and secondary corridors. The primary corridor involves implementing passenger corridors in urban agglomerations. The secondary corridors take the primary corridor as a framework and serves to collect and distribute corridors within the metropolitan area. Together, the primary corridor and secondary corridors work to form the metropolitan area’s passenger corridor system. The final passenger corridors are obtained by superimposing the results of corridor identification based on regional planning and route importance degree.
3.4.1. Corridor Identification Analysis Based on Regional Planning
According to the metropolitan area’s regional planning, passenger corridors can be qualitatively identified. These corridors refine and complement the superior corridors. The components of superior passenger corridors in the region, such as those corridors determined by urban agglomeration and country, should be implemented as the primary passenger corridors first. Furthermore, the formation and development of passenger corridors involve not only transportation but also other aspects of society, the economy, the population, and culture. Therefore, the identification of passenger corridors in the metropolitan area should be coordinated with transport locations, taking into account the development characteristics of regional development, urban space, industrial space, history, and culture, as set out in the regional plan. Corridors identified by transport location are implemented as secondary passenger corridors in the metropolitan area.
3.4.2. Corridor Identification Analysis Based on Importance Degree of Routes
According to the importance degree model of routes, passenger corridors can be quantified. The minimum spanning tree method, which is used to identify ecological corridors, can be used as a reference for identifying passenger corridors [
34,
35]. The weight of the route is determined by its importance degree, with each traffic area considered a node in order to find the maximal spanning tree. The maximum spanning tree obtained provides a preliminary identification of the corridor. The Prim algorithm is then used to identify the passenger corridors based on their ranking of importance degree. Starting at any node, the algorithm searches for the edge with the greatest weight, incorporating it into the maximal spanning tree. In cases where there are multiple edges between two nodes, the weights of these edges are compared and the edge is updated to the one with the greater weight. The specific steps for the Prim algorithm are as follows:
Step 1: Take a weighted connected graph as input. is the node set and is the edge set.
Step 2: Initialize another two sets and . x is any node in set . is an empty set.
Step 3: Repeat the following process until .
Select the edge in set with the greatest weight. Node belongs to set . Node is not an element of set and . If there are multiple edges with the same weight that meet the above conditions, any one of them can be chosen arbitrarily.
Add node to set and add edge to set .
Step 4: Set and set are the output of the algorithm and describe the maximal spanning tree.
Dynamic clustering is used to optimize the identified corridors due to the potential problem of overidentification in the passenger corridors identified by the Prim algorithm. Dynamic clustering describes the relationship between different OD to corridors and the corridors and optimizes the result based on the identified corridors. The identified passenger corridors are used as the initial centers of clustering. The clustering index is determined by selecting the midpoint coordinate of the OD pair and the positive angle with the -axis. The positional relationship of the midpoint coordinates describes the relative distance between OD and the corridor, while the positive angle describes their directional similarity. The distance between each OD and all initial centers of clustering is then calculated, and all results are classified based on the shortest distance from the initial center of clustering.
To ensure comparability between variables with different units, the spatial coordinates and directional angle used in the clustering index are normalized before calculating the Euclidean distance. Specifically, the midpoint coordinates (
x,
y) of the OD pair and the directional angle
a are transformed into dimensionless normalized values. The Euclidean distance between the two observations is then calculated using Equation (20).
where
,
,
are the midpoint coordinates of OD and the positive angle with the
x-axis of the identified corridor,
,
,
are the midpoint coordinates of OD and the positive angle with the
-axis of OD to be distinguished.
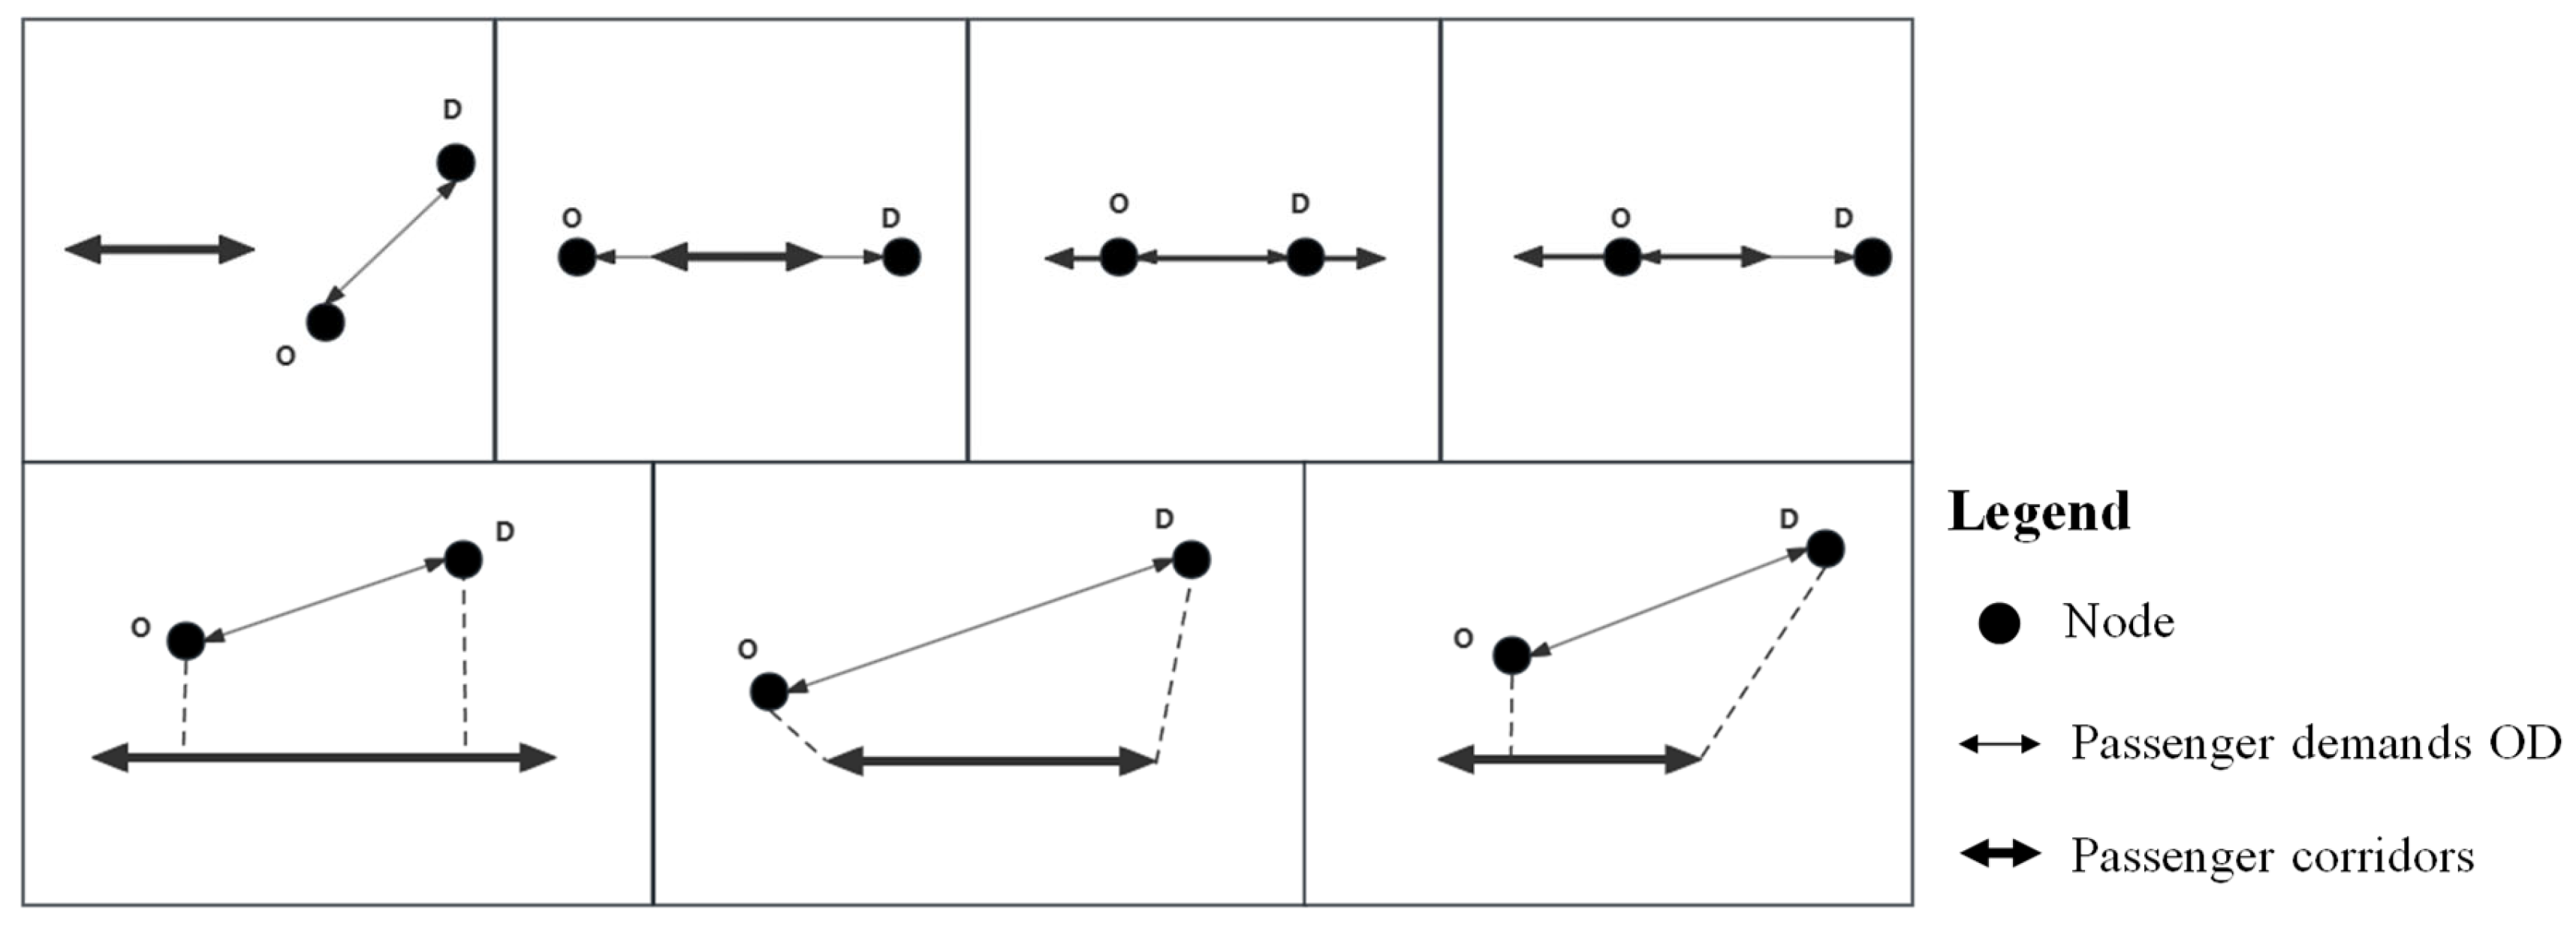
Figure 3 shows the seven possible relationships between passenger demands, OD, and passenger corridors due to the randomness of travel choices. If the projection of an OD onto a corridor is entirely external, it is considered that the OD does not use the corridor for travel. Conversely, if the OD completely encompasses a corridor, it is assumed that the OD uses the corridor for travel, and the passenger volume using the corridor is equal to the OD distribution. If the OD is collinear with the corridor but does not completely contain it, then only the collinear part is used. The OD distribution is required for the used part. If the OD and the corridor are not collinear, but all the projections fall inside the corridor, it is considered that the OD uses only part of the corridor, which is the projection of the OD inside the corridor. If all of the OD projection falls outside the corridor, it must pass through the entire corridor. If one end of the OD projection is inside the corridor and the other end is outside, it is a combination of the previous two cases. Transport time can be calculated using Equation (21).
where
is the transport time using corridor
,
is the transport time without using corridors,
is the usable length of corridor
,
and
are the distance from O and D to the corridor,
is the average transportation speed without using corridors,
is the average transportation speed using corridors.
As passengers may use corridors at random, the Logit model is used to calculate the transportation volume of corridor usage, as shown as Equation (22).
where
is the transportation volume using corridors,
is the transportation volume without using corridors,
is the number of corridors.
If the passenger demand for some corridors is too low, it indicates that those corridors are overidentified and the clustering center with relatively low demands needs to be removed. Conversely, if demand is too high, it means that the corridors are not fully identified, and the route needs to be increased to create a new clustering center. When there are no anomalies in passenger demand, the identified corridors can be used as the optimization result.
4. Case Study
4.1. Research Area and Multilayer Network Construction
The development of new towns has led to the spatial restructuring of many cities. Suzhou, one of the most important central cities in the Yangtze River Delta urban agglomeration, is a prime example. The Suzhou Industrial Park, the Wujiang District and other areas have experienced rapid development due to their proximity to Shanghai. The spatial structure of the region, in terms of work and residential spaces, has undergone significant changes. Although the CBD has the strongest job attraction, the development of the surrounding area has led to residential spaces moving outward. This leads to a large-scale commuter flow of residents entering the CBD during the day and leaving at night, leading to urban problems such as traffic congestion and long-distance commuting. Therefore, it is important for Suzhou to correctly identify passenger corridors and optimize the facilities within them.
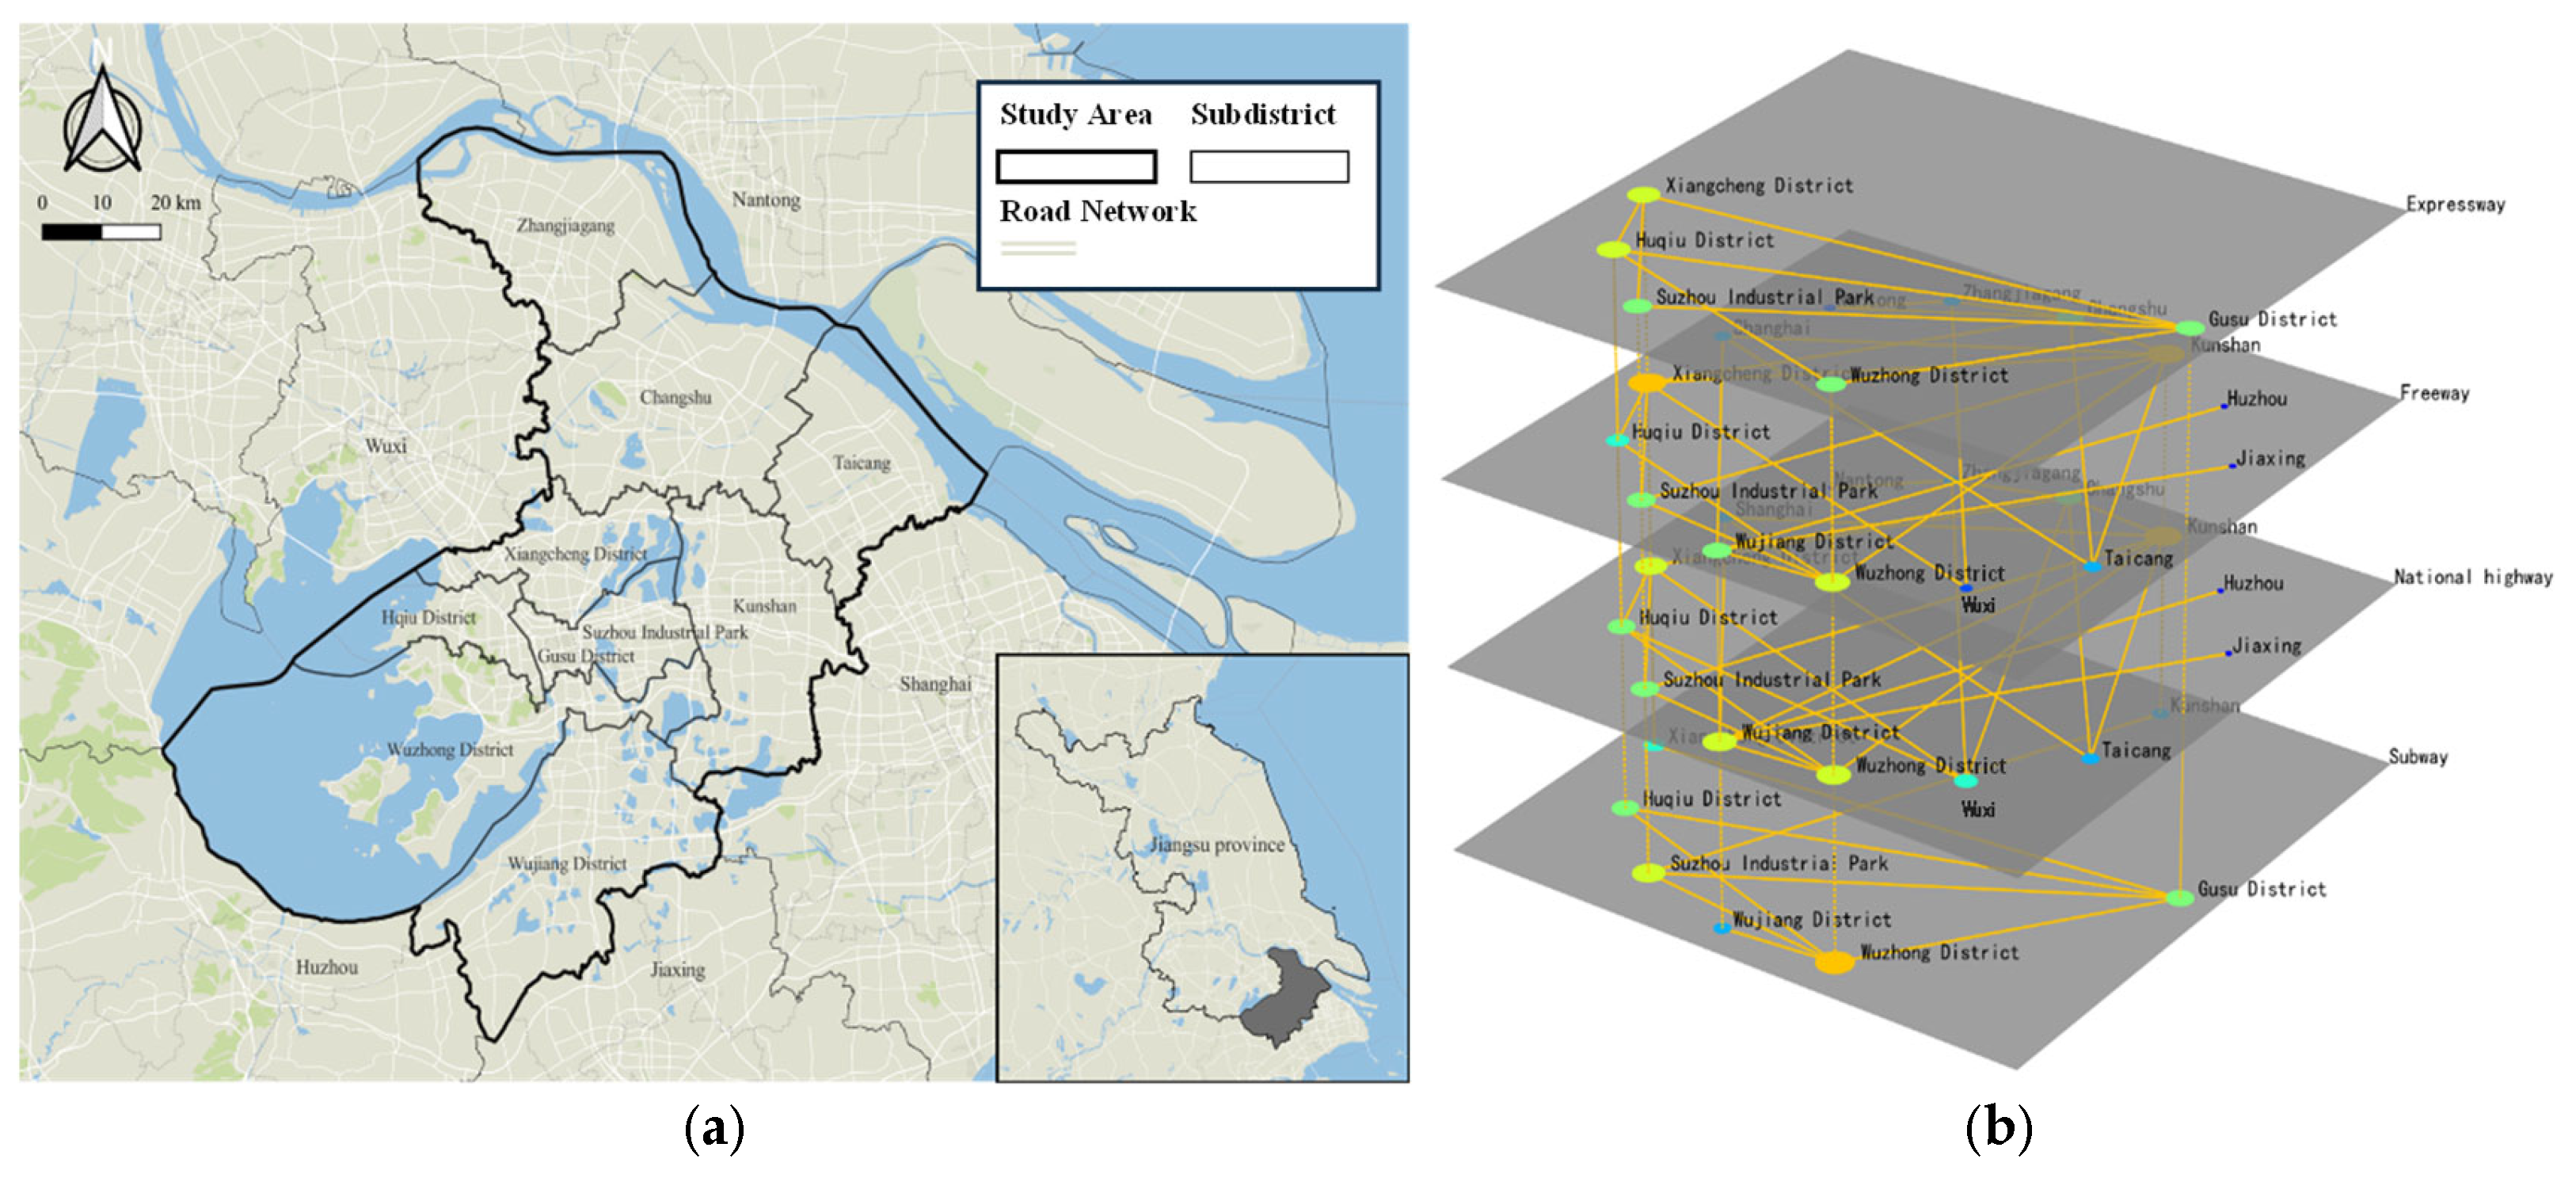
This paper selects nine administrative regions in Suzhou as Suzhou metropolitan area and includes Wuxi, Shanghai, Nantong, Jiaxing and Huzhou in the influence area to identify the passenger corridors by the method proposed above.
Figure 4 displays the multilayer network created using the administrative regions and the surrounding cities as nodes, with road and railway data obtained from OSM. Apart from Gusu District, the other regions are connected to their adjacent regions via freeways and national highways. Xiangcheng District, Gusu District, Huqiu District, Wuzhong District and Suzhou Industrial Park are connected by expressways. The subway system comprises Line 1, Line 2, Line 3, Line 4, Line 5 and Line 11.
4.2. Importance Degree of Passenger Corridors
In light of the impact of the COVID-19 pandemic on residents’ travel in recent years, the 2020 statistical yearbook for each city was selected as the data source. The transportation network data were obtained from OpenStreetMap (2019). Travel times for highways were estimated using route travel time information from Baidu Maps, while travel times for rail-based transportation modes were derived from the official timetables provided by China Railway and the Suzhou Metro Company. The social and economic indicators of each node are sorted out (see
Table 2), and the degree centrality of each node, betweenness of each node and connection line are calculated based on the established multilayer network. The entropy weight method is then used to calculate the weight of each indicator, and the importance degree of nodes in different layers belonging to the same administrative region is added to obtain the comprehensive importance ranking result of nodes.
Table 3 shows the ranking results, excluding cities within the influence area, such as Shanghai and Wuxi.
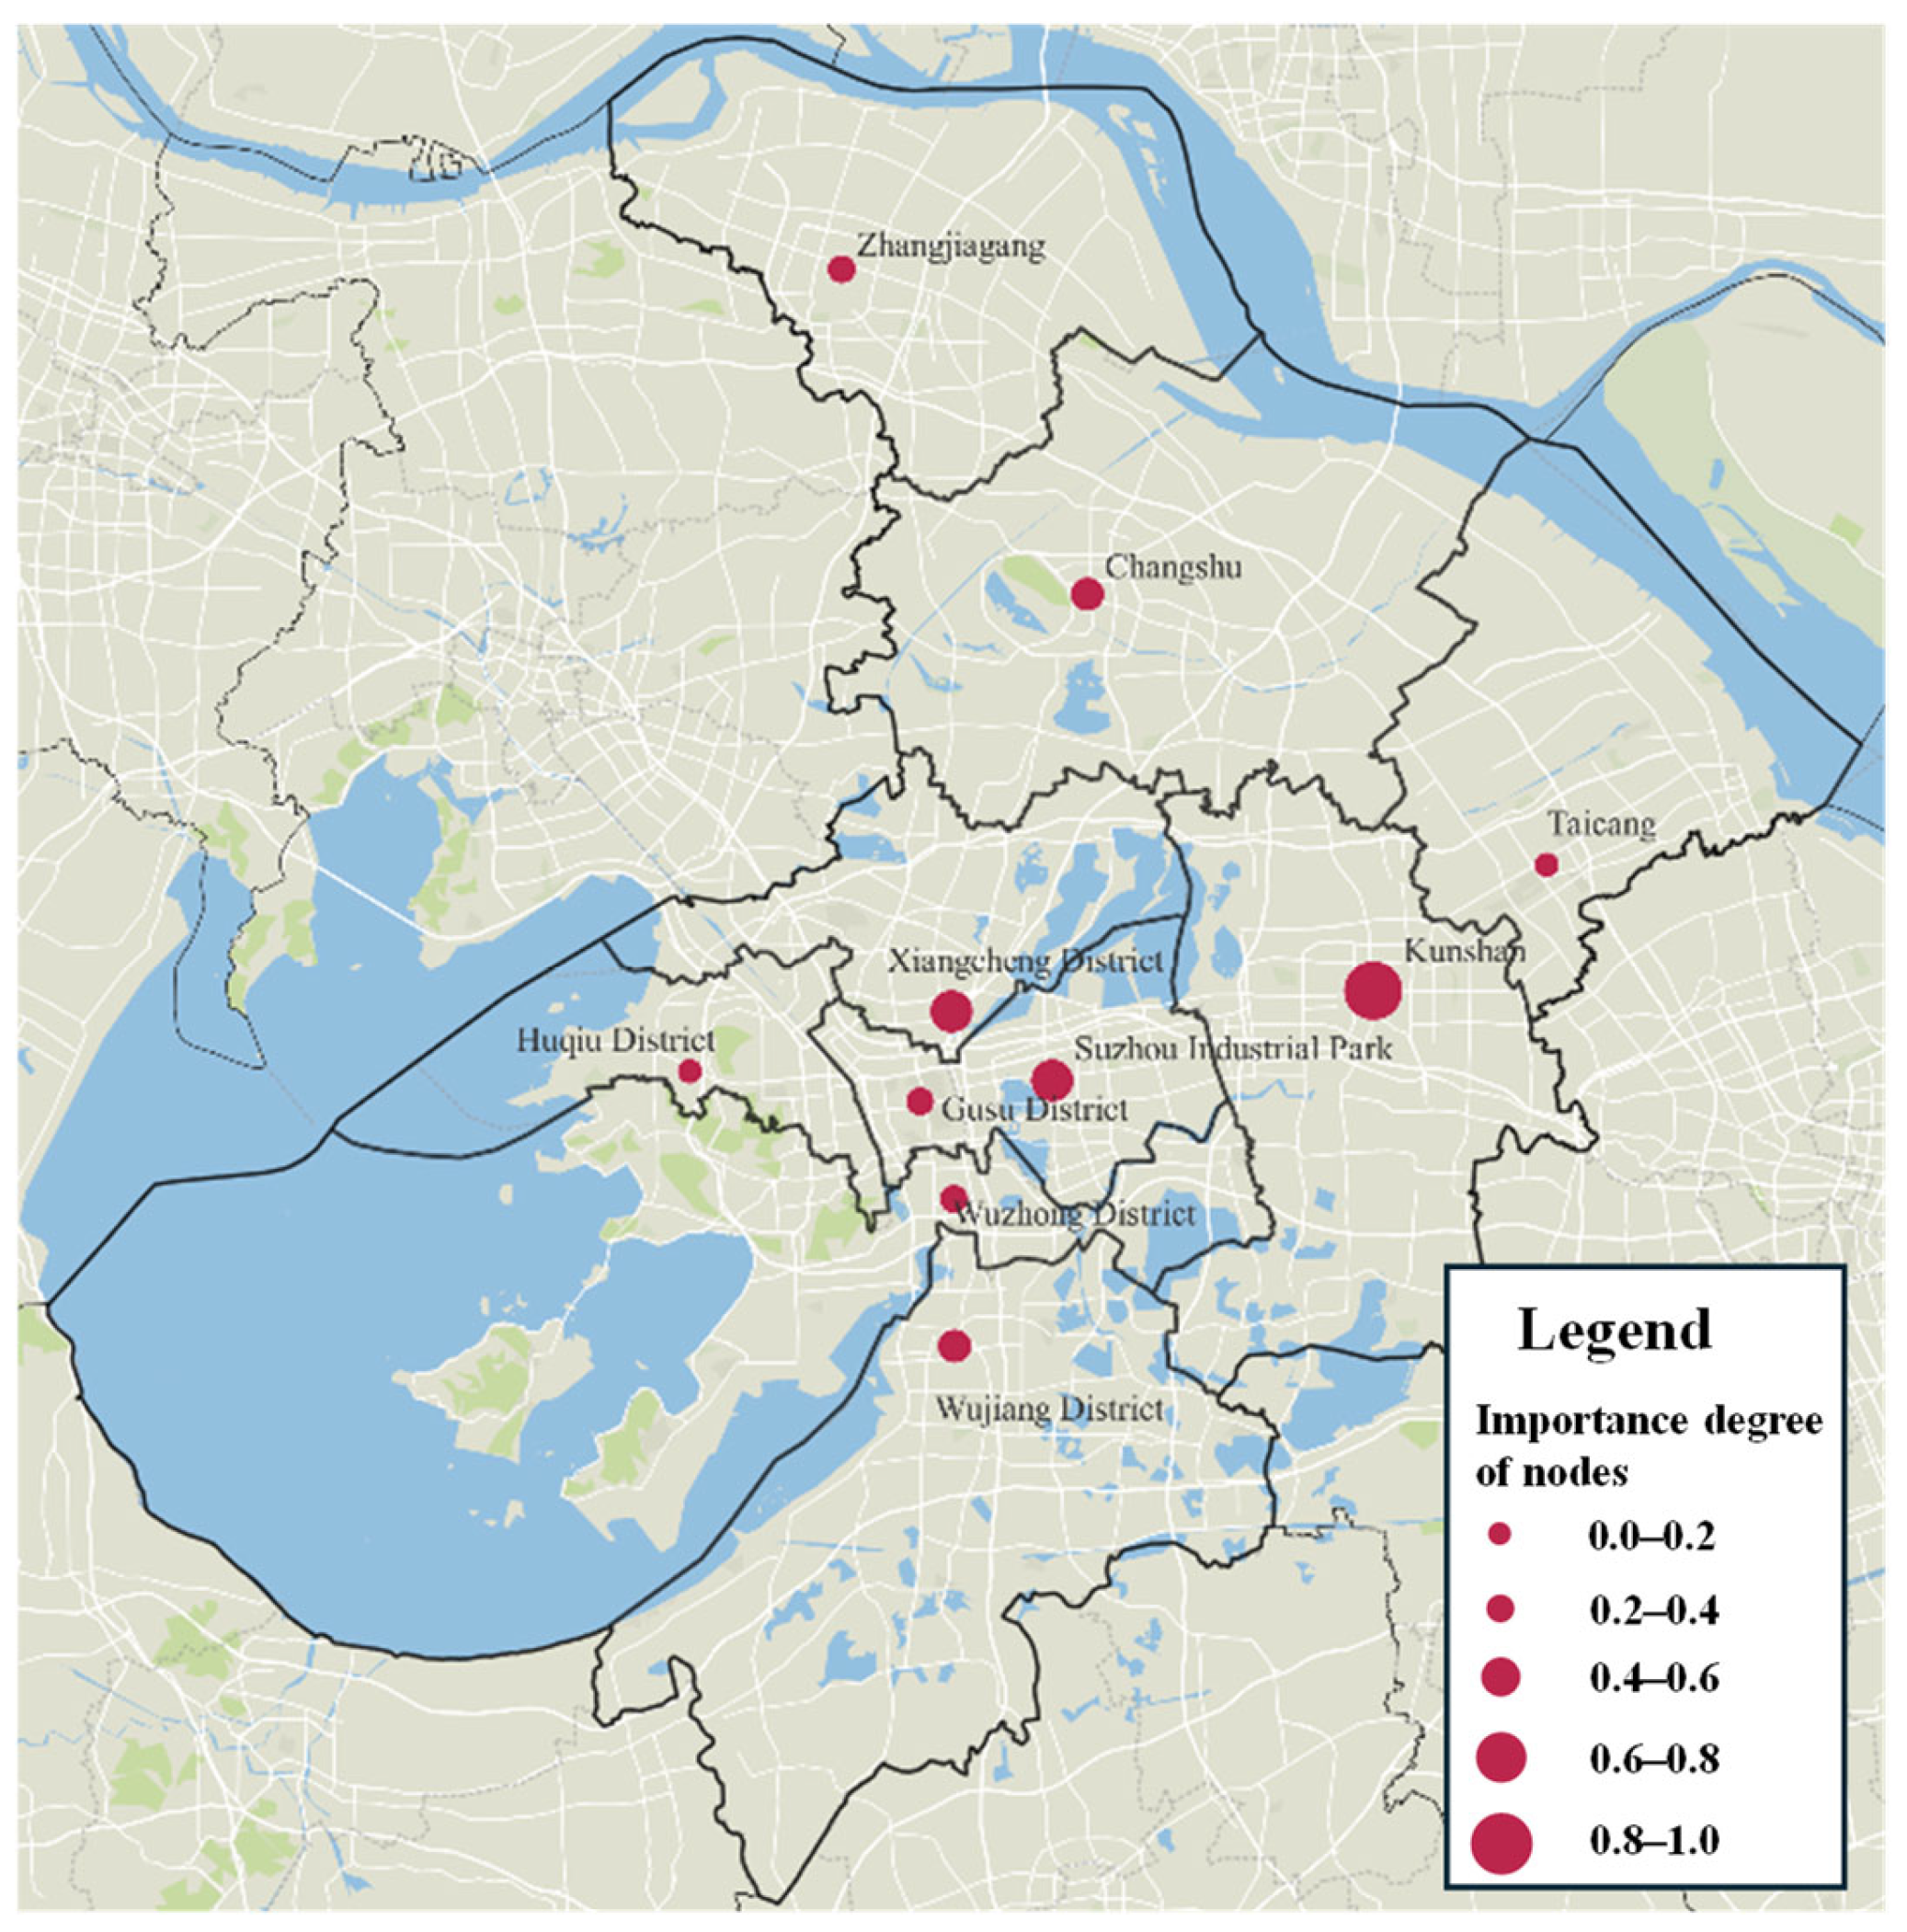
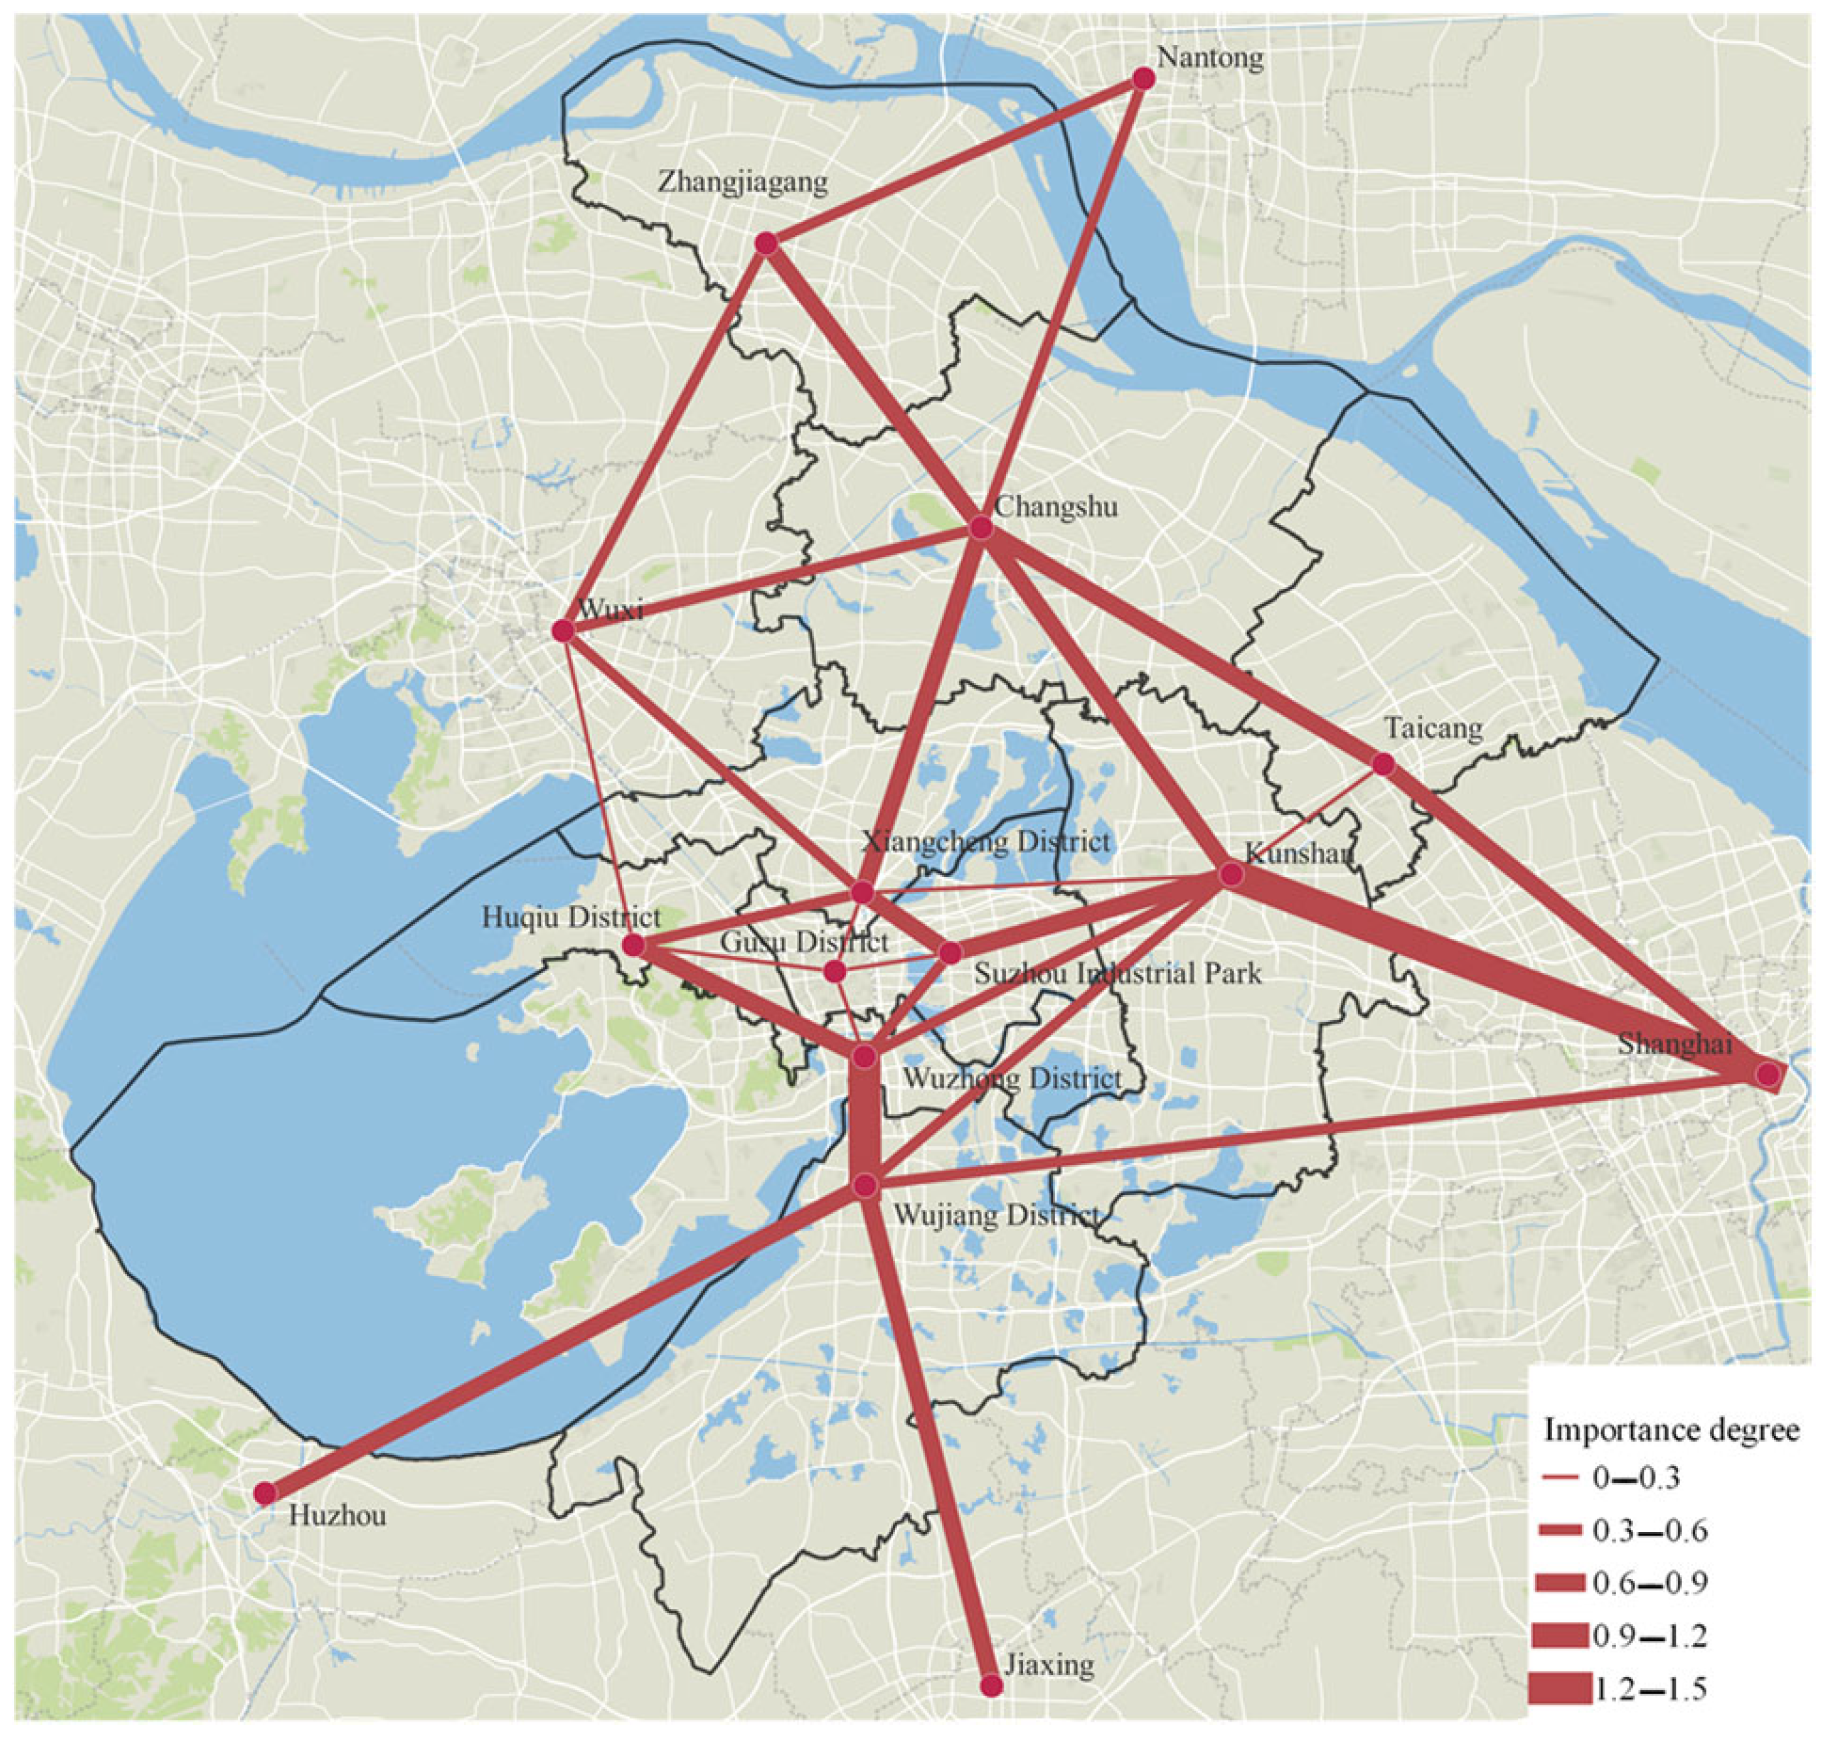
Figure 5 shows the results of the importance degree in QGIS.
The three nodes with the highest importance degree are Kunshan, Suzhou Industrial Park and Xiangcheng District. Kunshan is well-placed for spatial development situation, connecting with Shanghai to the east, integrating with the CBD of Suzhou to the west, and linking with Taicang to the north. It is a strategic fulcrum connecting Shanghai and Suzhou. Both the permanent resident population at the end of the year and GDP were ranked first. Suzhou Industrial Park is the new city center of Suzhou, boasting advanced manufacturing clusters and high-level modern service industries. Its GDP is second only to Kunshan in the Suzhou metropolitan area. Xiangcheng District is planned to become the new transportation center. While the population and GDP are not exceptional, the spatial situation and the location of the Suzhou North Railway Station also generate significant passenger demand.
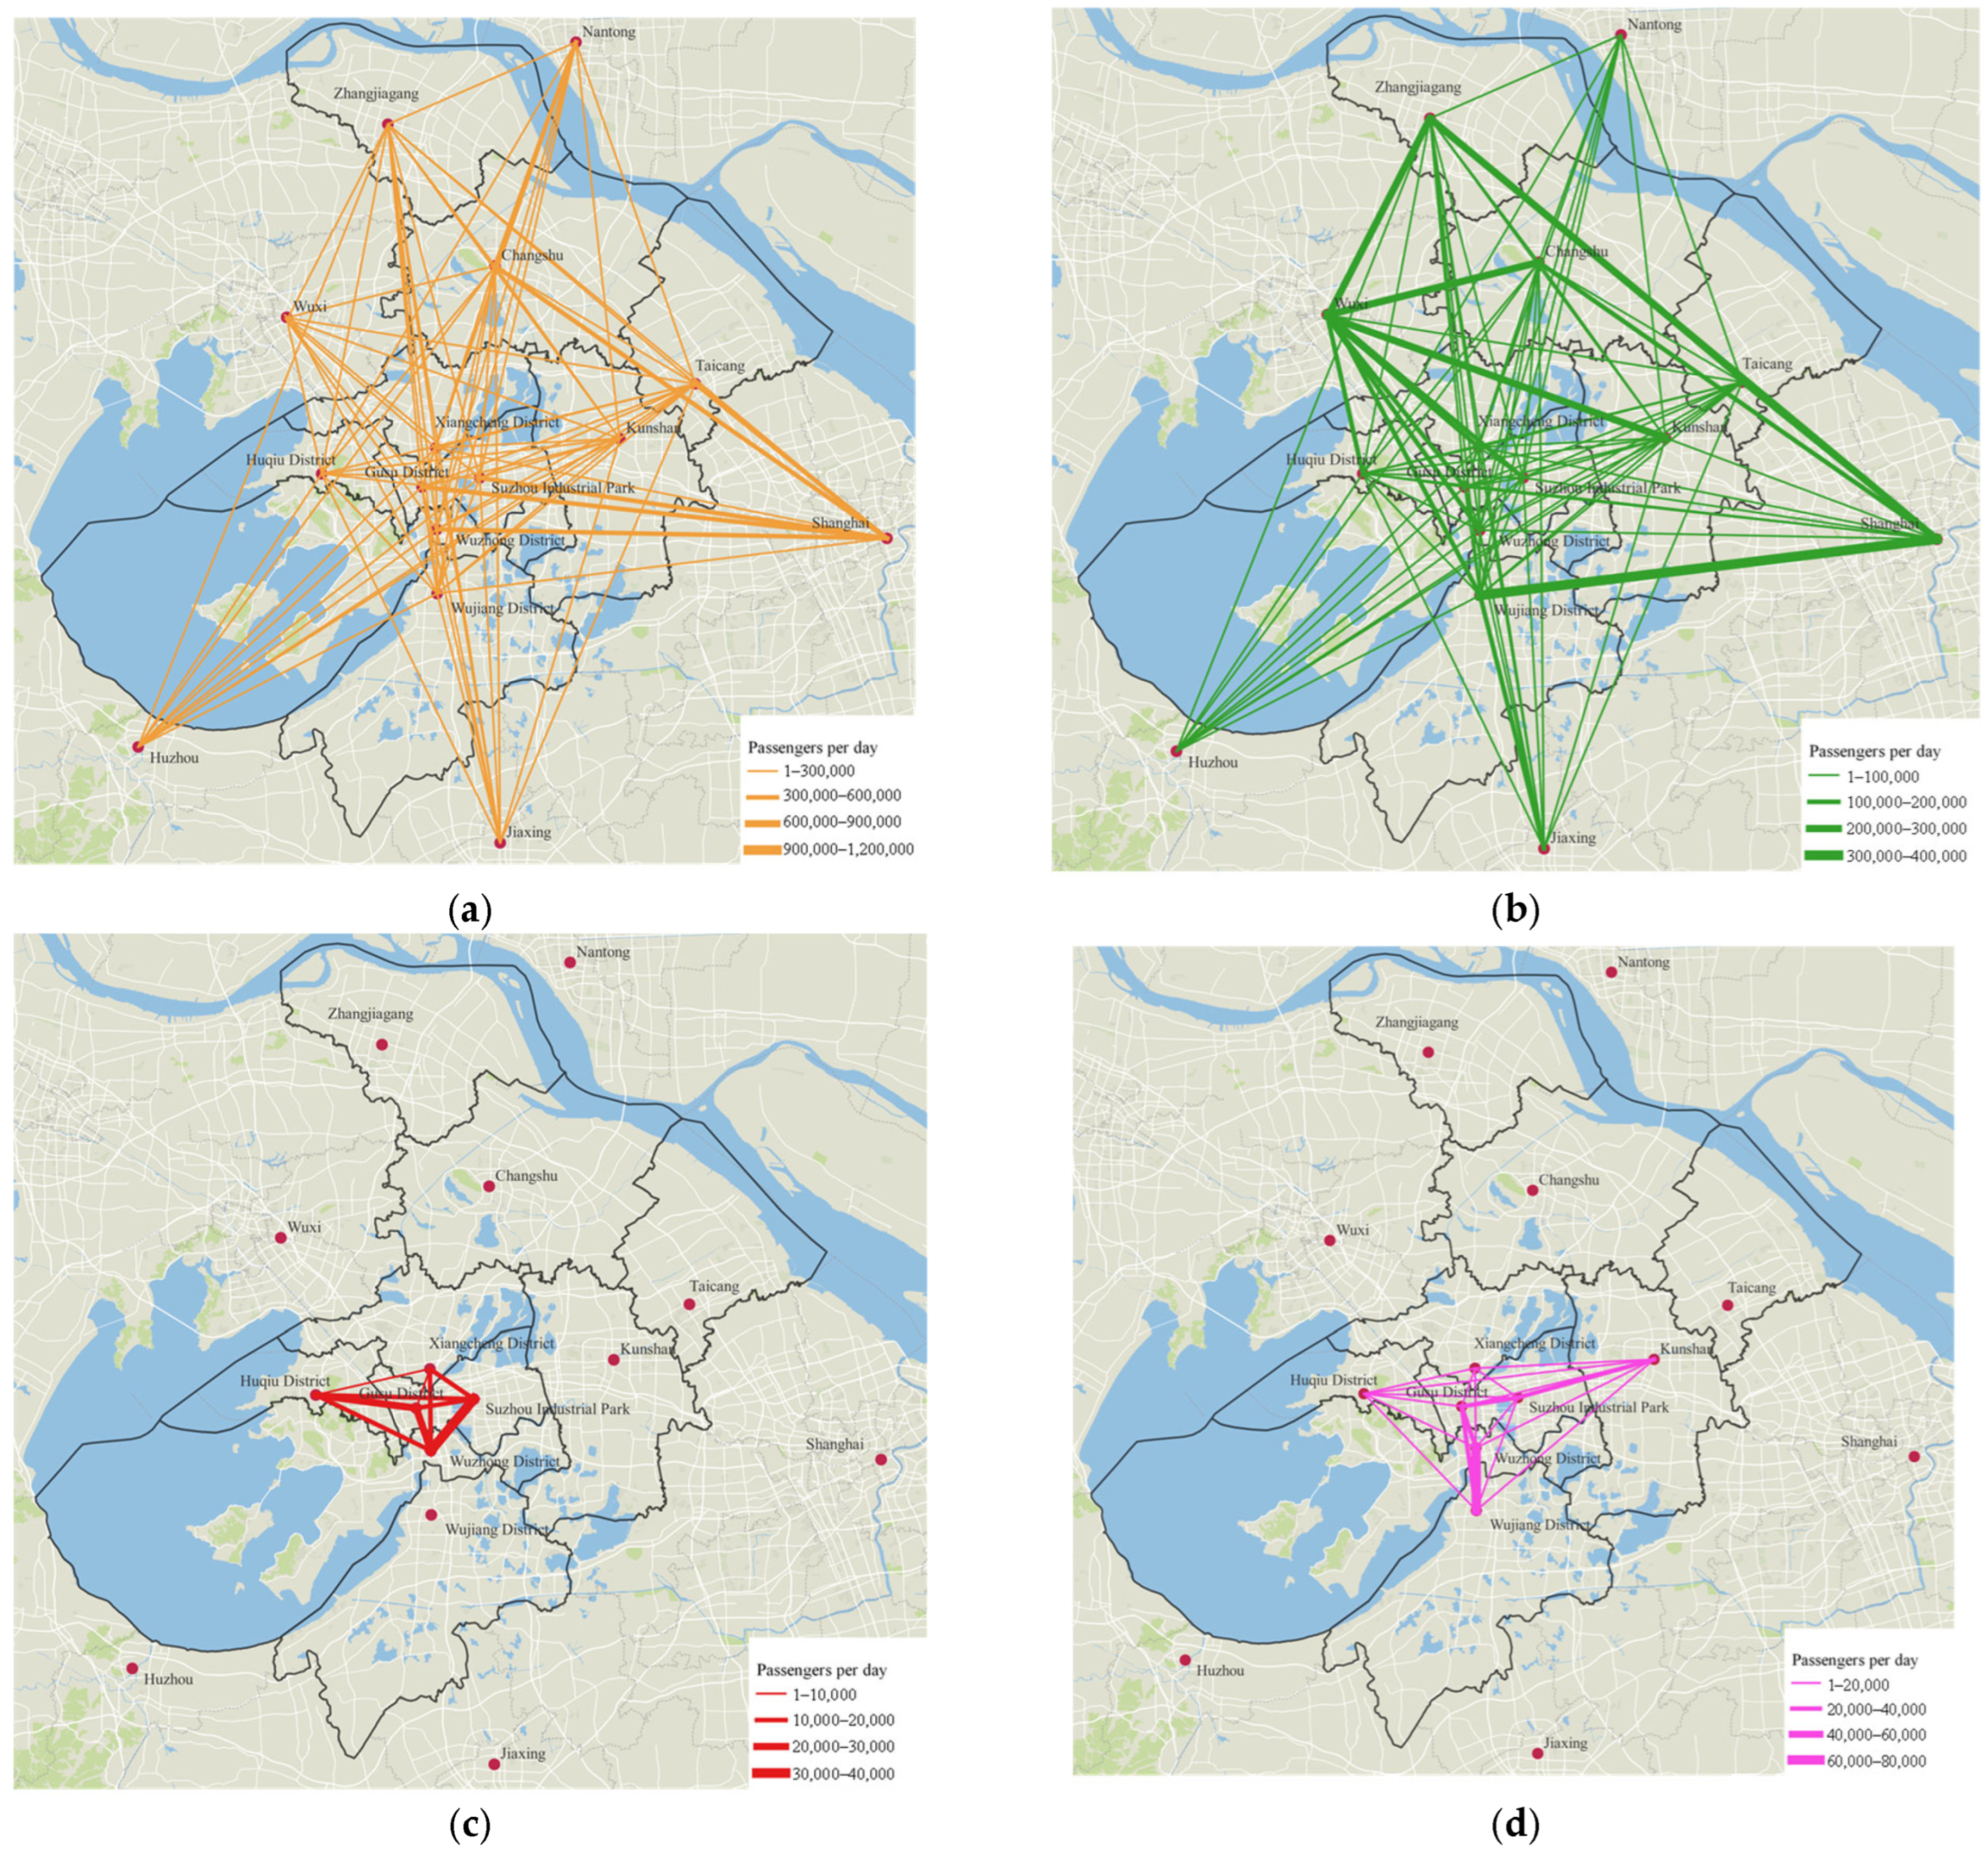
Figure 6 shows the predicted OD distribution of passenger volume in 2035, according to the forecast of the population in land space planning. These results will be used to identify passenger corridors.
Based on the calculated importance degree of nodes, the betweenness of connection lines, and the predicted OD distribution, the mode importance, demand importance and cost importance of each connection line and route are calculated. Since the connection lines in the multilayer network are directional, the importance degree of routes between the same nodes is summed. The ranking of the importance degree of routes is presented in
Table 4 and
Figure 7.
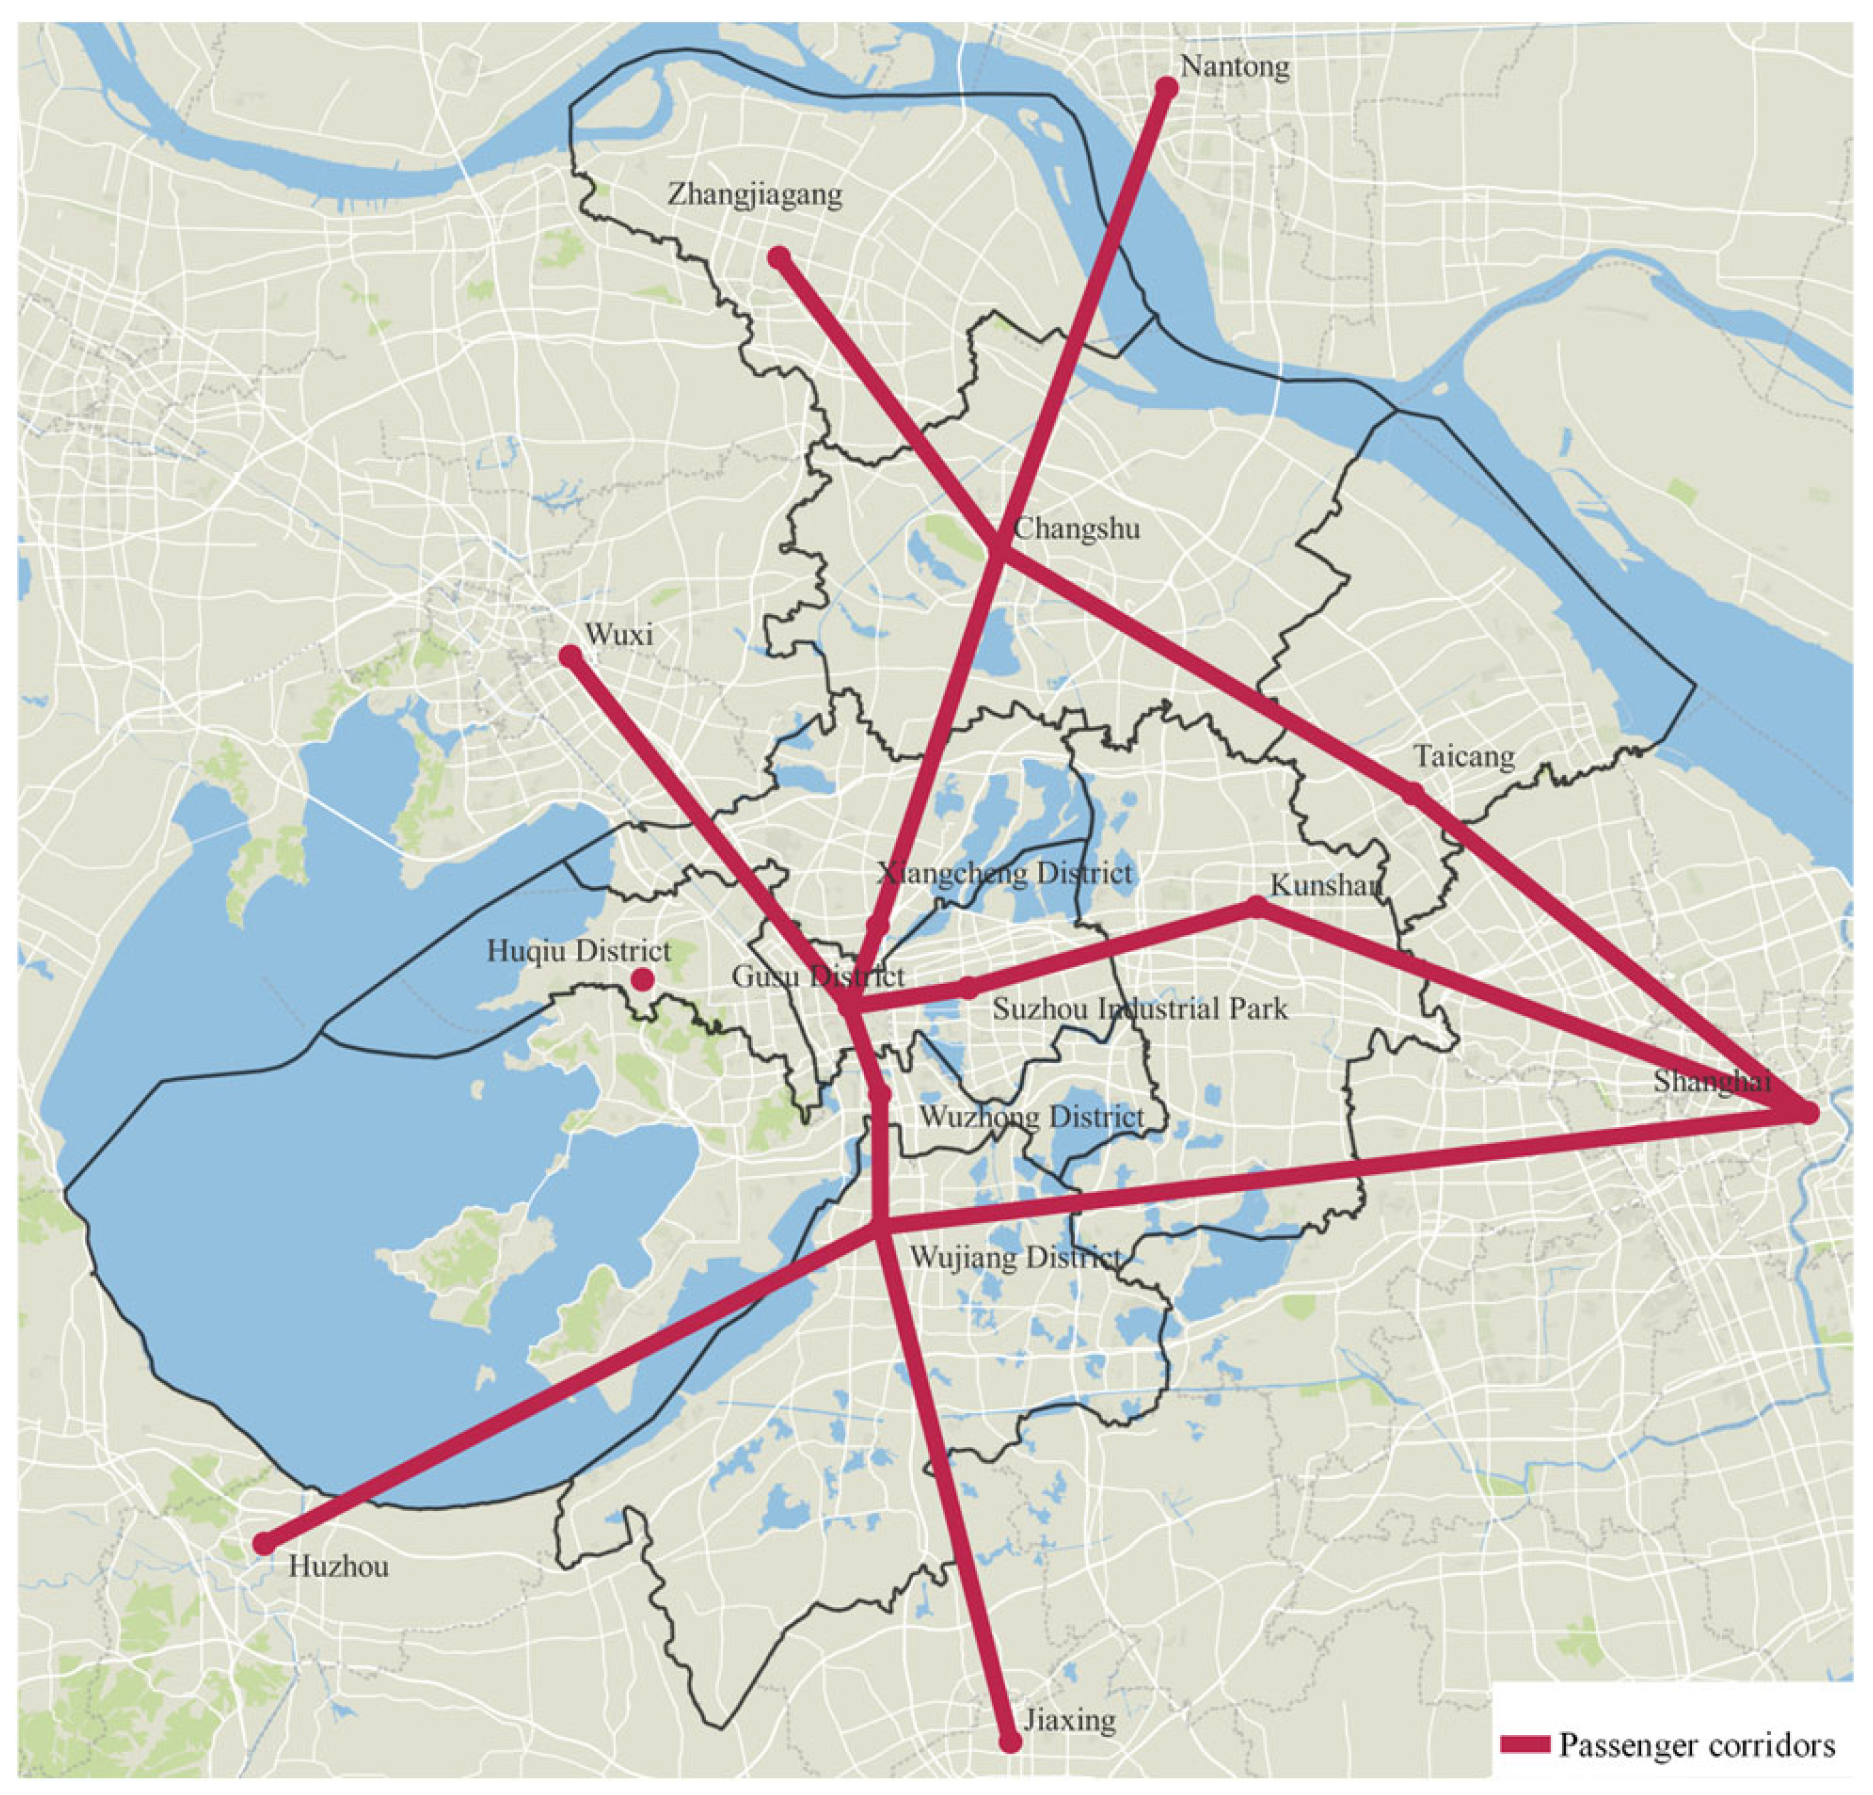
The route connecting Shanghai and Kunshan has the highest importance degree. It serves as a major route linking Shanghai and the Suzhou metropolitan area, facilitating a large number of through trips. The routes between Zhangjiagang, Changshu, Taicang and Kunshan form the primary east–west corridors in the northern part of the Suzhou metropolitan area. These routes cover multiple economic and technological development zones, as well as high-tech industrial development zones, generating significant commuting demand. The route connecting Wuzhong District and Wujiang District has a high importance degree as it is the main route connecting Suzhou with Huzhou and Jiaxing. Xiangcheng District and Suzhou Industrial Park, both of which are nodes within the CBD, are connected by expressways and subways, resulting in low average travel costs. This route is also significant because it connects the CBD with Kunshan and Shanghai.
4.3. Identifying the Passenger Corridors in the Suzhou Metropolitan Area
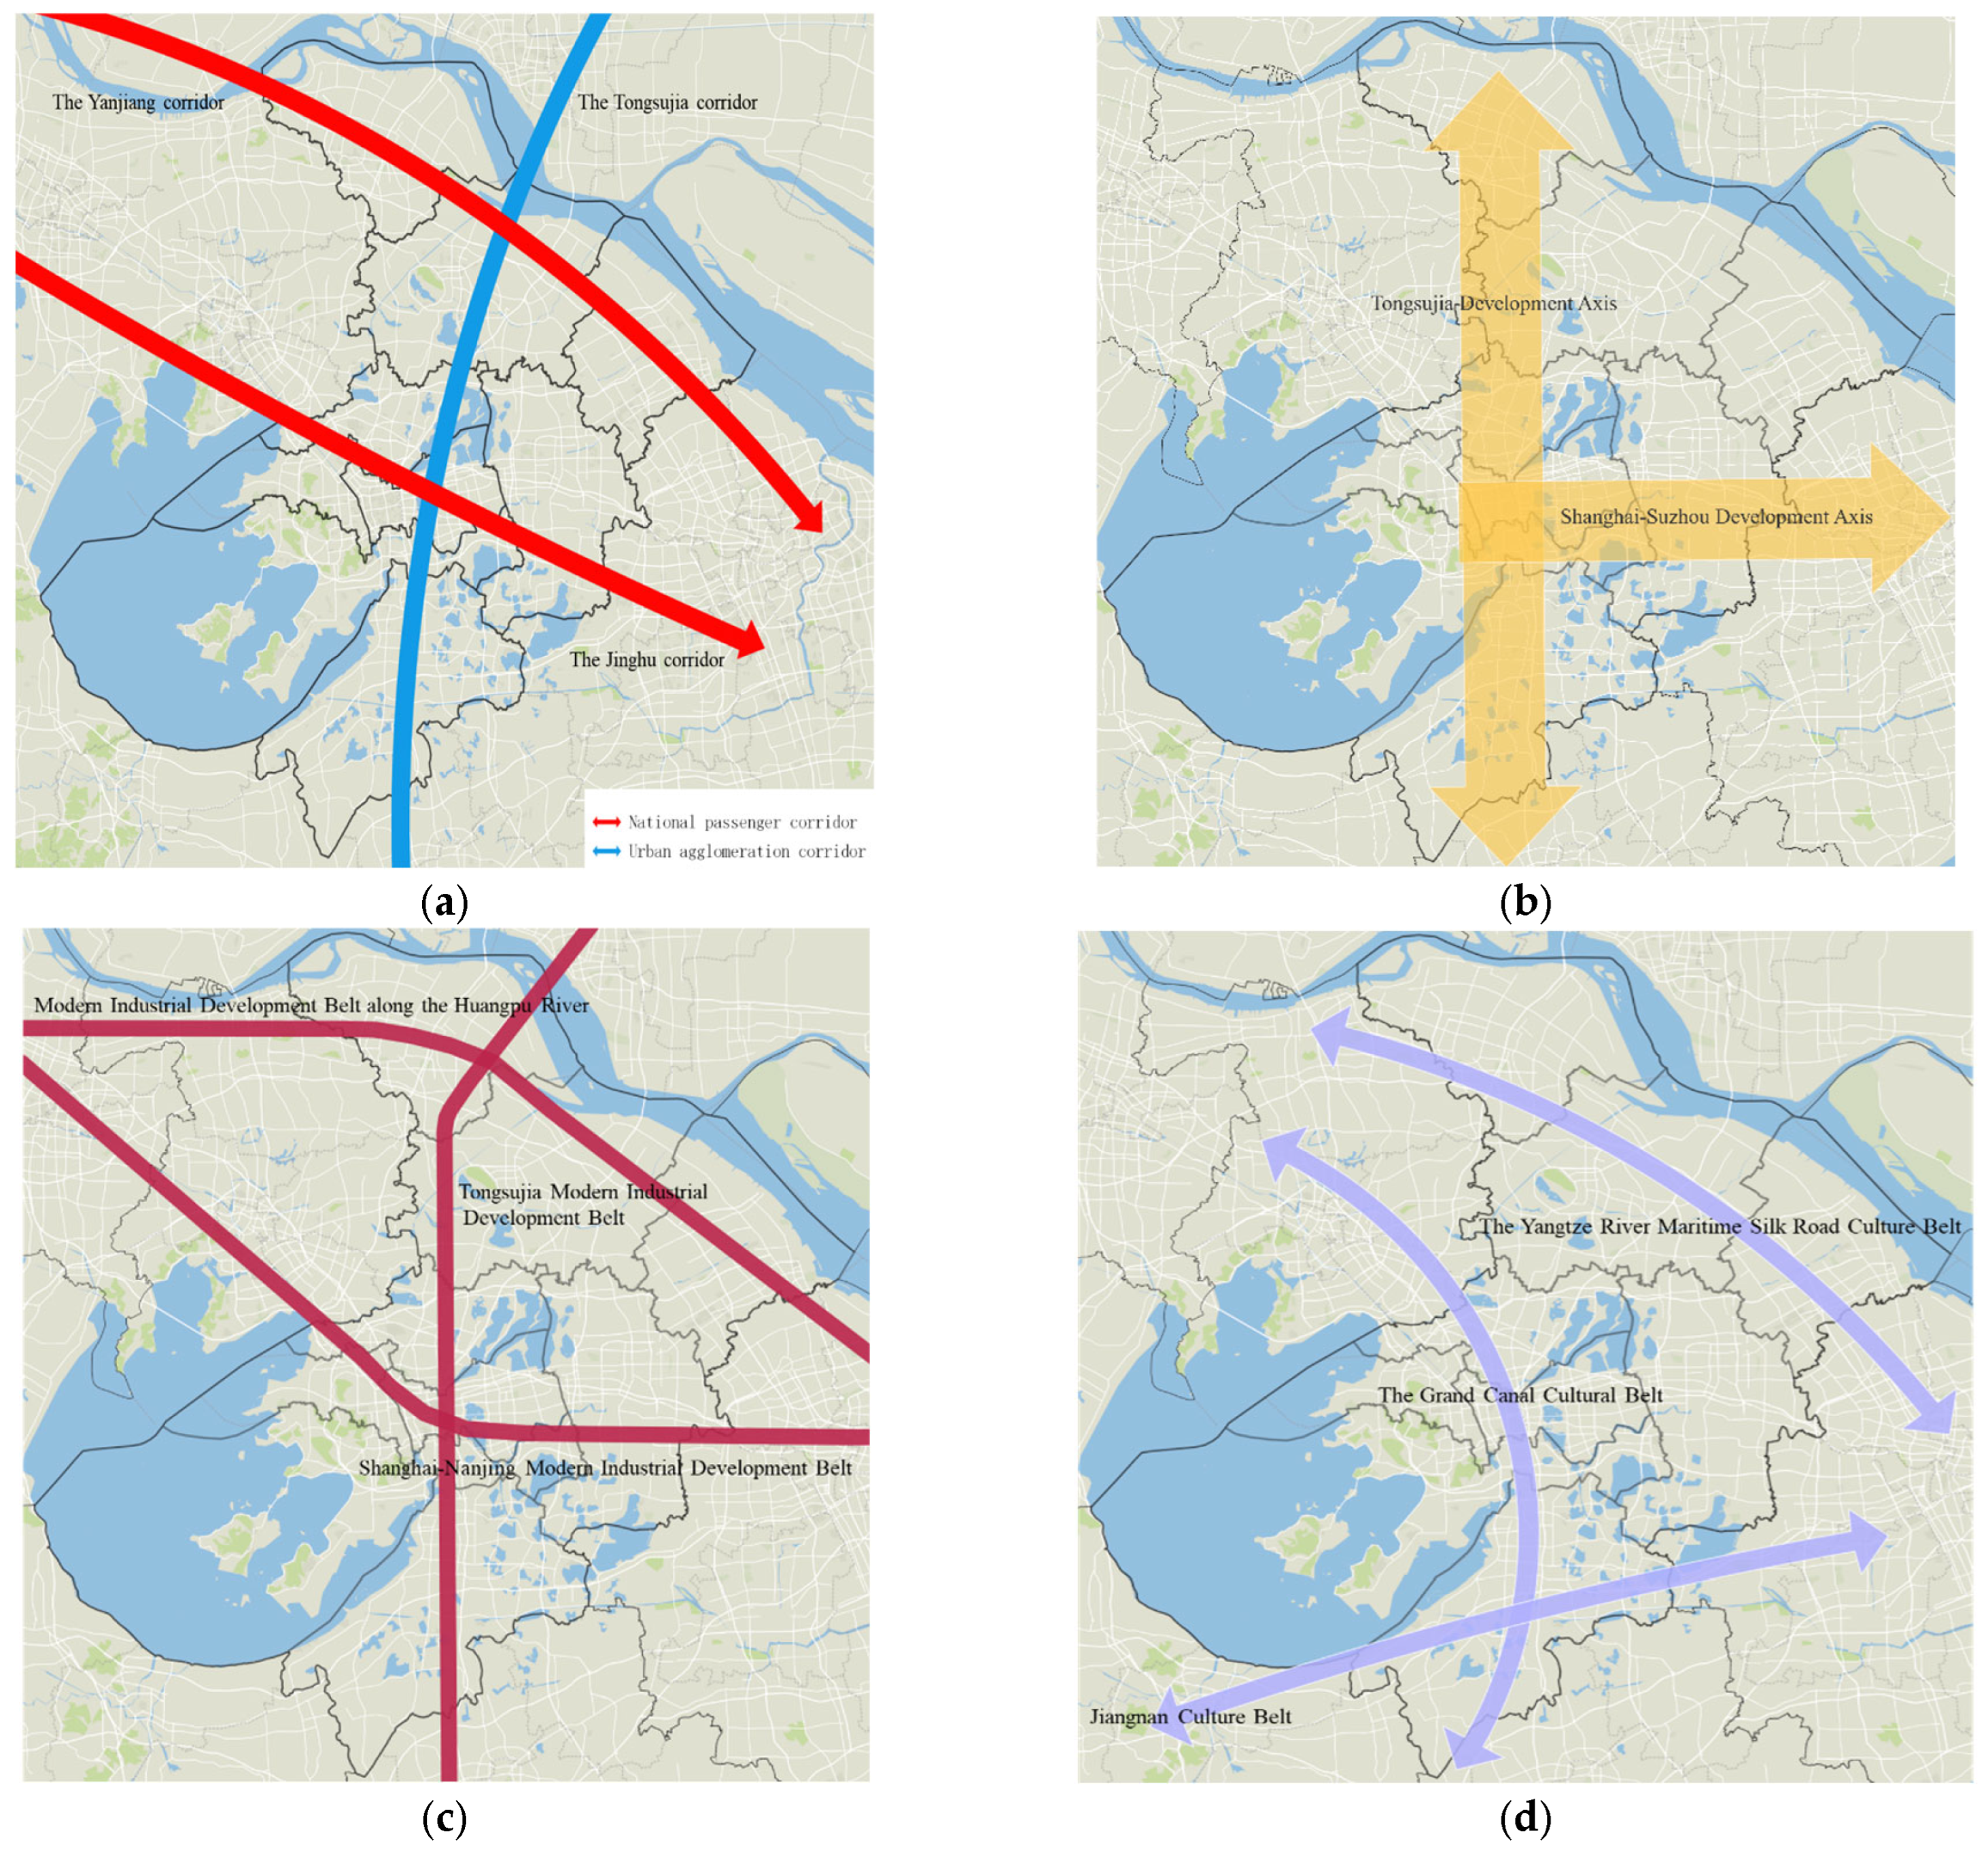
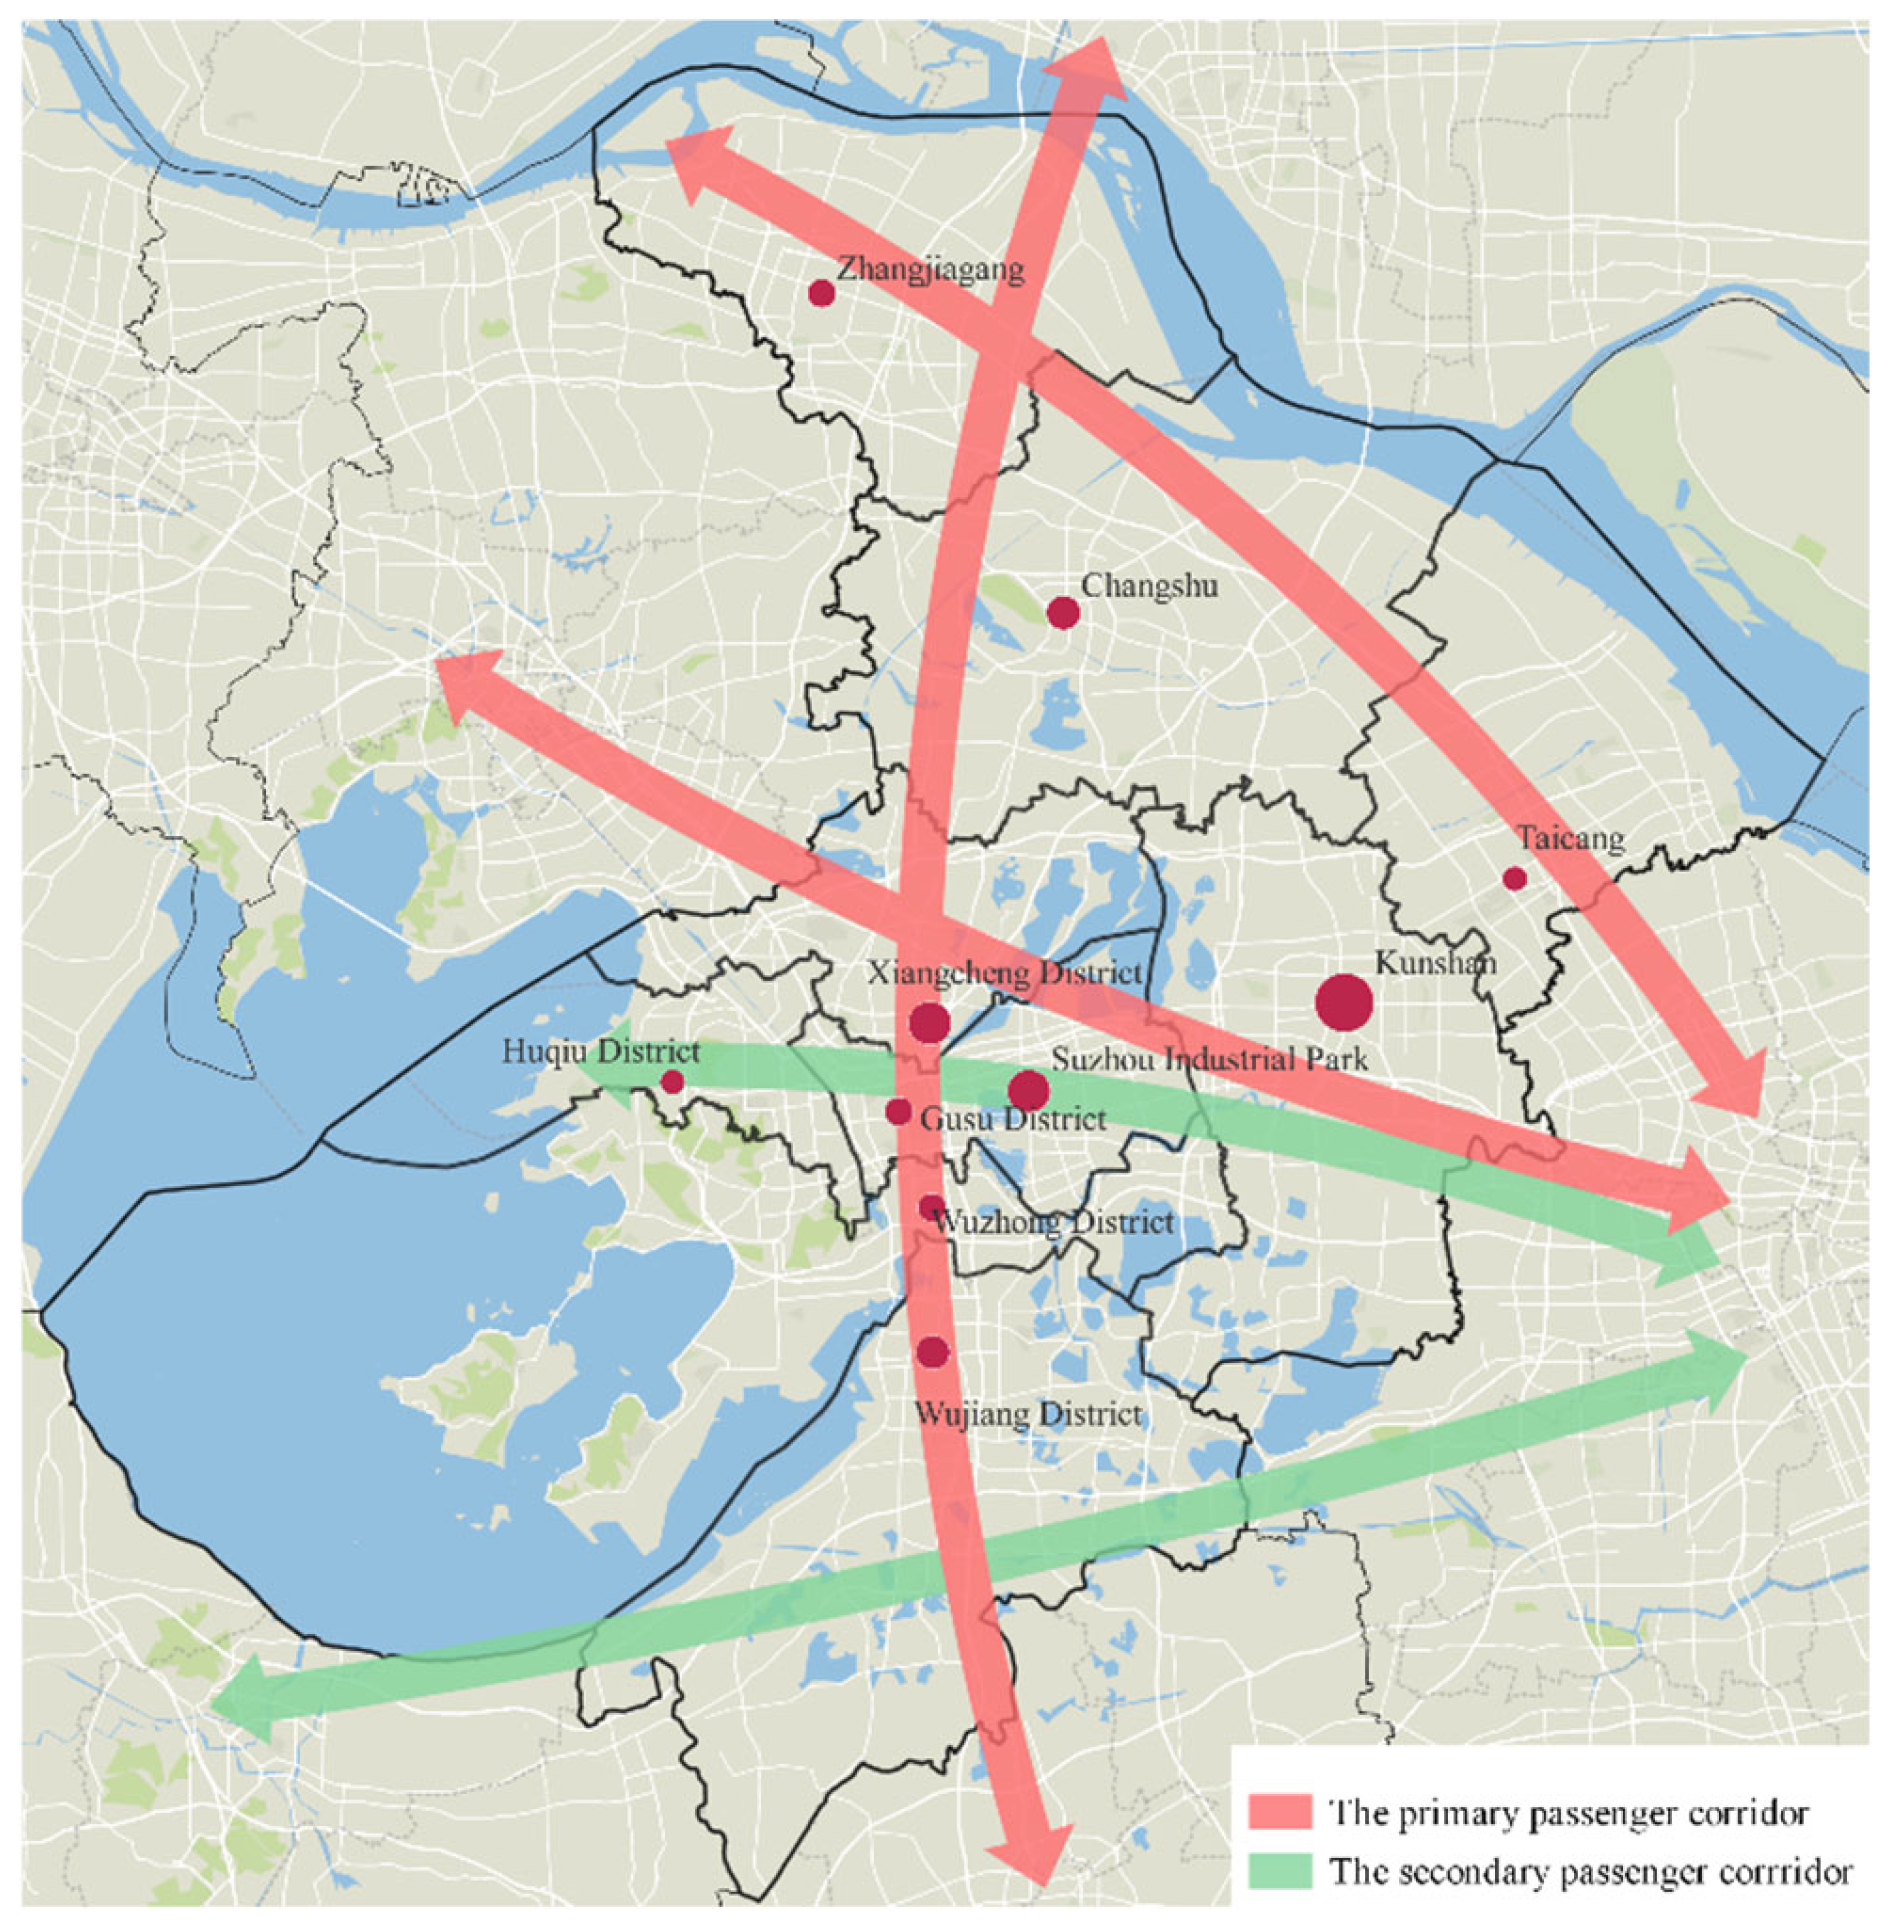
In national planning, the primary axis from the Beijing–Tianjin–Hebei region to the Yangtze River Delta and the primary axis from the Yangtze River Delta to the Cheng-Yu area both cross the Suzhou metropolitan area. These two primary axes are also reflected in the planning of Jiangsu Province. The Jinghu corridor, which runs from Beijing and goes to Shanghai via Suzhou, supports the north–south economic development of China. The Yanjiang corridor, which starts in Shanghai and goes to Wuhan via Taicang, Changshu, and Zhangjiagang, drives the economic development along the Huangpu River. The Tongsujia corridor, which starts in Nantong and goes to Jiaxing via Suzhou, forms part of the passenger corridors in the Yangtze River Delta urban agglomerations. It facilitates the cross-river integration development of Suzhou and Nantong. As depicted in
Figure 8a, these three corridors serve as the primary passenger corridors in the Suzhou metropolitan development area.
The Suzhou metropolitan area has an urban spatial layout consisting a central core and two axes. The urban core comprises Gusu District, Wuzhong District, Huqiu District, and Suzhou Industrial Park. The two axes are the Suzhou–Shanghai development axis and the Tongsujia development axis. This layout improves connectivity between Suzhou, Shanghai, Nantong, and Jiaxing. Suzhou has established three industrial development belts to create an independent innovation system that adapts to modern industry and high-quality economic development. Additionally, to strengthen the culture core, three historical and cultural belts have been proposed to connect Suzhou and Changshu, both of which are national historical and cultural cities, as well as four cultural tourist attractions.
Figure 8 provides a detailed spatial layout. Passenger corridors based on regional planning, as shown in
Figure 9, can be obtained by considering superior corridors and traffic locations comprehensively.
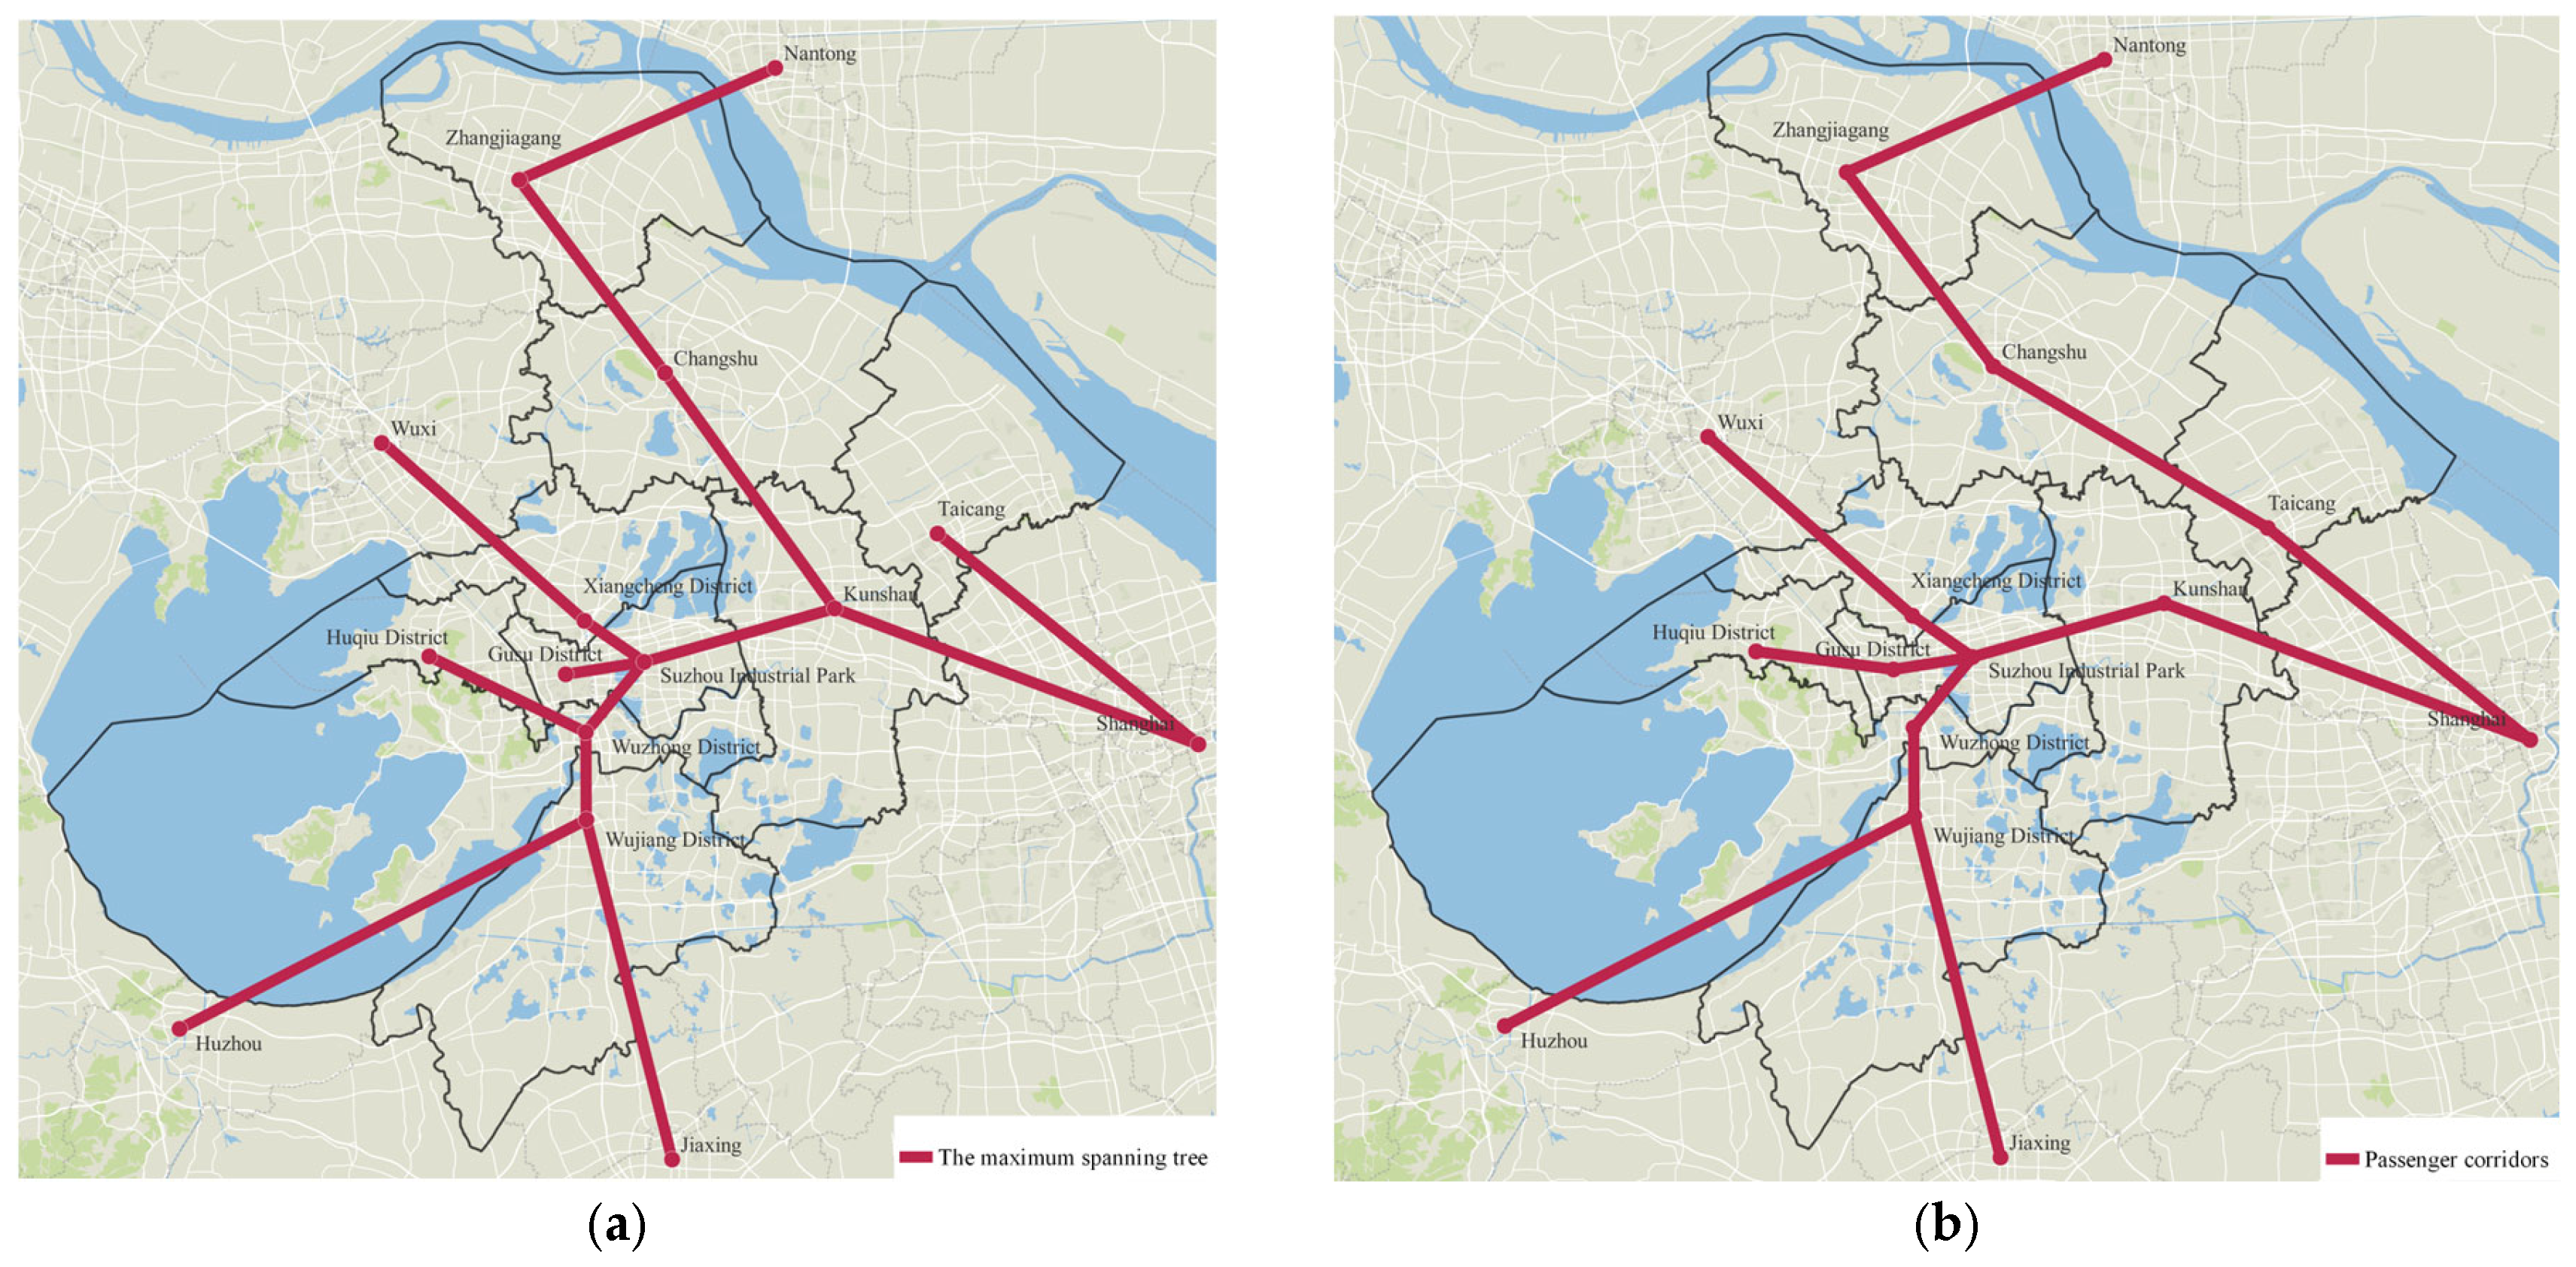
The Prim algorithm is used to find the maximum spanning tree based on the calculated importance degree of routes, with the importance degree acting as the weight, as shown in
Figure 10a.
Figure 10b shows how passenger corridors based on the importance degree of routes can be obtained by optimizing the maximum spanning tree through dynamic clustering.
The final identification of passenger corridors can be obtained by combining the aforementioned two results. The parts of the superior corridors in the Suzhou metropolitan area are identified as the primary passenger corridors, while the remaining identified corridors serve as the secondary corridors.
Table 5 shows the final identification result of the passenger corridors in the Suzhou metropolitan area, consisting of three transverse corridors and two longitudinal corridors.
Figure 11 shows the functional orientation of each corridor.
5. Discussion
The model was applied to the Suzhou metropolitan area. The weight of each indicator of route importance degree was calculated using the entropy weight method, with , and The results show that demand importance has the greatest impact on the importance degree of routes while mode importance also has an impact that cannot be ignored. Therefore, evaluating the importance of routes based solely on the demand or the importance degree of nodes may not accurately identify passenger corridors. Consequently, transport planners should consider the multimodal facility configuration when planning corridors and pay more attention to optimizing passenger transport in multimodal corridors. This would improve the intensive utilization of facilities and the convenience of transfers. Such multimodal coordination could reduce the need for redundant infrastructure investment, encourage the use of public transport, and lower energy consumption and emissions related to transportation in metropolitan areas.
The passenger corridors identified through a combination of regional planning and the importance degree of routes show a high degree of consistency with the existing transportation development framework of the Suzhou metropolitan area, reflecting the new restructuring characteristics of the Suzhou metropolitan area. Transverse corridors one and two strengthen the trans-meridional connection of the Suzhou metropolitan area, supporting the through transportation demand from Shanghai to Wuxi, as well as commuting demand between the new center Suzhou Industrial Park and the CBD. Longitudinal corridor two strengthens the connection between the CBD, Nantong and Jiaxing, forming an important longitudinal transportation backbone. Lengthways corridor one strengthens connections to the northern part of the metropolitan area, providing the basis for development alongside the river. Transverse corridor three strengthens the southern part of the metropolitan area. The identified corridors can cover the entire metropolitan area and support the interregional travel demand within it. This can also strengthen connections with surrounding cities, particularly Shanghai, promoting the development of urban integration. This will enable Suzhou to integrate more effectively into the Yangtze River Delta urban agglomerations. The case study demonstrates that the importance degree model and identification method can be applied in practice.
6. Conclusions
The reconstruction of spatial patterns in the metropolitan area introduces new characteristics that cause a series of traffic problems, such as traffic congestion. This paper studies the methods of identifying passenger corridors in the metropolitan area in order to better meet passenger demands, promote the integrated development of urban spaces and transportation systems, and enable the intensive use of facilities. A multilayer network is employed to reflect the characteristics of various passenger transportation modes, constructing an importance degree model of routes based on the transportation modes, passenger demand, and transportation costs. A method for grading corridors is also proposed. The primary passenger corridor is the implementation of superior passenger corridors, while the secondary passenger corridor collects and distributes traffic using the primary corridor as its skeleton. The passenger corridors are identified in combination with regional planning and the importance degree of routes, and the model is verified using the Suzhou metropolitan area as a case study. The proposed model considers the multimodal and synergetic characteristics of passenger corridors, providing a research basis for researching the optimization of facility configuration within the comprehensive traffic network. The identification results can also provide the government with theoretical support for prioritizing corridor development, optimizing the configuration of transportation facilities, and improving multimodal connectivity in the region. Notably, the primary corridors identified in this study align with major regional development axes, while the secondary corridors augment the existing network, enhancing connectivity between pivotal urban nodes. Furthermore, the proposed corridor identification framework can support sustainable metropolitan development by directing infrastructure investment towards high-demand corridors, improving transport efficiency, and facilitating the integration of transportation planning with compact land use development and low-carbon mobility strategies.
The present study has one limitation. In corridor identification analysis based on regional planning, the superior corridors as the primary corridors are determined by the quality of the passenger corridor. However, identifying the corridors qualitatively according to the urban development characteristics, such as industrial space and urban space, is subjective. Different planners may produce different identification results. Future research will quantify the transport locations and other development characteristics as indicators. Sensitivity analysis and ablation experiments will also be used to evaluate the robustness of the proposed model under different indicator weighting schemes and combinations of indicators. The constructed importance degree model of routes will be further improved to make the identification results of passenger corridors in the metropolitan area more scientific and reliable. Secondly, while the proposed multilayer network-based method provides a useful framework for identifying passenger transport corridors, further research is required to compare its results with those obtained using alternative corridor identification approaches in order to further evaluate its robustness and applicability. Additionally, the introduction of quantitative evaluation indicators is intended to facilitate a comparison between the proposed method and alternative approaches to corridor identification.
Author Contributions
Conceptualization, X.S.; methodology, X.S.; software, L.J.; validation, X.S.; formal analysis, X.S.; investigation, Q.J.; resources, Q.J.; data curation, Q.J.; writing—original draft preparation, X.S.; writing—review and editing, Q.J.; visualization, C.Q.; supervision, X.G.; project administration, X.G.; funding acquisition, X.S. All authors have read and agreed to the published version of the manuscript.
Funding
This research was funded by the project High-Quality Integrated Development of Transportation in the Yangtze River Delta (Policy and Planning Category, No. 032414-185).
Institutional Review Board Statement
Not applicable.
Informed Consent Statement
Not applicable.
Data Availability Statement
The original contributions presented in this study are included in the article. Further inquiries can be directed to the corresponding author.
Acknowledgments
Xiucheng Guo and teachers of Southeast University are appreciated for providing helpful suggestions on this research. The anonymous referees whose comments on the earlier version led to significant improvements are also appreciated.
Conflicts of Interest
The authors declare no conflicts of interest.
References
- Gu, Y.R.; Li, M.; Zheng, L.; Huang, H.L. Backwash-Spread Effects of Transportation Corridors on the Development of City Groups. J. Urban Plan. Dev. 2018, 144, 04018028. [Google Scholar] [CrossRef]
- Ogrodnik, D. Nodes and Corridors of Metropolitan Structure Development. Identification and Parametrization Issues On Example of Krakow. In IOP Conference Series-Materials Science and Engineering; IOP Publishing Ltd.: Bristol, UK, 2018; Volume 471, p. 112045. [Google Scholar]
- Malavenda, G.A.; Musolino, G.; Rindone, C.; Vitetta, A. Residential Location, Mobility, and Travel Time: A Pilot Study in a Small-Size Italian Metropolitan Area. J. Adv. Transp. 2020, 2020, 8827466. [Google Scholar] [CrossRef]
- Li, A.J.; Wang, D.A.; Peng, Q.Y.; Wang, L.S. Path-Based Approach for Expanding Rail Transit Network in a Metropolitan Area. J. Adv. Transp. 2022, 2022, 7637298. [Google Scholar] [CrossRef]
- Alonso, B.; Munoz, J.C.; Ibeas, A.; Moura, J.L. A congested and dwell time dependent transit corridor assignment model. J. Adv. Transp. 2016, 50, 1925–1941. [Google Scholar] [CrossRef][Green Version]
- Yin, W.C.; Zhang, Y.Q. Identification Method for Optimal Urban Bus Corridor Location. Sustainability 2020, 12, 7167. [Google Scholar] [CrossRef]
- Li, Z.H.; Xu, H.; Qiu, S.Y.; Liu, J.; Yang, K.R.; Wu, J.H. Dynamic Optimization of Bus Line Schedule in Commuter Corridor Based on Bus IC Card Data. J. Adv. Transp. 2022, 2022, 7064061. [Google Scholar] [CrossRef]
- Romero, C.; Monzon, A.; Alonso, A.; Julio, R. Potential demand for bus commuting trips in metropolitan corridors through the use of real-time information tools. Int. J. Sustain. Transp. 2022, 16, 314–325. [Google Scholar] [CrossRef]
- Yang, Y.D.; Liu, J.; Shang, P.; Chen, X.C.; Cao, J.J. Temporal and Spatial Evolution of Passenger Flow in an Urban Rail Transit Network During Station Closure. IEEE Access 2021, 9, 29623–29640. [Google Scholar] [CrossRef]
- Wang, J.; Zhou, L.S.; Yue, Y.X.; Tang, J.J.; Bai, Z.X. Optimizing High-Speed Railroad Timetable with Passenger and Station Service Demands: A Case Study in the Wuhan-Guangzhou Corridor. J. Adv. Transp. 2018, 2018, 4530787. [Google Scholar] [CrossRef]
- Li, J.; Li, Z.; Qi, X. A review of multilayer networks-based interregional transportation networks analysis. Chaos Solitons Fractals 2025, 192, 115993. [Google Scholar] [CrossRef]
- Orozco, L.G.N.; Alessandretti, L.; Saberi, M.; Szell, M.; Battiston, F. Multimodal urban mobility and multilayer transport networks. arXiv 2021, arXiv:2111.02152. [Google Scholar] [CrossRef]
- Ippolito, N.; Cats, O. Multi-modal and multi-layer robustness analysis of the European rail and air networks. Sci. Rep. 2024, 14, 26950. [Google Scholar] [CrossRef] [PubMed]
- Du, M.; Zhou, J.; Chen, A.; Tan, H. Modeling the capacity of multimodal and intermodal urban transportation networks that incorporate emerging travel modes. Transp. Res. Part E Logist. Transp. Rev. 2022, 168, 102937. [Google Scholar] [CrossRef]
- De Domenico, M.; Granell, C.; Porter, M.A.; Arenas, A. The physics of spreading processes in multilayer networks. Nat. Phys. 2016, 12, 901–906. [Google Scholar] [CrossRef]
- Zhou, D.; Gu, G.B.; Chang, M.Y.; Sun, J.Y.; Su, Y.M.; Luo, W.Z. Analysis of Influencing Factors of Guangxi Transportation Corridor Based on Principal Component Analysis. In Proceedings of the 6th International Conference on Electromechanical Control Technology and Transportation (ICECTT); SPIE: Bellingham, WA, USA, 2011; Volume 12081, p. 120812K. [Google Scholar] [CrossRef]
- Chen, M.X. Economic Spatial Connection and Evolution Trend of National Urban Agglomeration: Take Harbin-Changchun Urban Agglomeration as an Example. Econ. Geogr. 2020, 40, 99–105. [Google Scholar]
- Luo, H.N.; Qian, Y.S.; Zeng, J.W.; Wei, X.T.; Guang, X.P. An Empirical Analysis of Logistics Corridors and Regional Economic Spatial Patterns from the Perspective of Compressive Transportation between Urban Agglomerations. Land 2022, 11, 726. [Google Scholar] [CrossRef]
- Wang, Z.Z.; Chu, R.J.; Wu, W.J.; Li, Q.X.; Cai, Z.L.; Cao, N.B.; Gu, M.X. Identification and Optimization Models for a Freight-Integrated Transportation Corridor With Line Importance and Freight Communication Capability. IEEE Access 2019, 7, 11114–11126. [Google Scholar] [CrossRef]
- Xiong, Q.; Hu, J.; Kuai, J.T. Comprehensive Transportation Corridor Layout of Urban Agglomeration Based on Improved Ant Colony Algorithm. In Proceedings of the 6th International Conference on Transportation Engineering (ICTE), Chengdu, China, 20–22 September 2019; ASCE: Reston, VA, USA, 2019; pp. 77–85. [Google Scholar]
- Yakimov, M.R. Solving the Problem of Finding the Locally Optimal Placement of Corridors for the Possible Movement of Transport of Large Carrying Capacity. In 2021 Systems of Signal Synchronization, Generating and Processing in Telecommunications, Kaliningrad, Russia, 30 June–2 July 2021; IEEE: New York, NY, USA, 2021; pp. 1–5. [Google Scholar]
- Bahbouh, K.; Morency, C. Encapsulating and Visualizing Disaggregated Origin-Destination Desire Lines to Identify Demand Corridors. Transp. Res. Rec. 2014, 2430, 162–169. [Google Scholar] [CrossRef]
- Bahbouh, K.; Wagner, J.R.; Morency, C.; Berdier, C. Travel demand corridors: Modelling approach and relevance in the planning process. J. Transp. Geogr. 2017, 58, 196–208. [Google Scholar] [CrossRef]
- Wu, Y.; Lu, Y.; Huang, Z.X. Identification and optimization of transport corridors in comprehensive traffic network of urban agglomeration. J. Chang’An Univ. 2015, 35, 117–123. [Google Scholar]
- Salamati, M.; Wang, X.; Wang, J.; Zareipour, H. Optimal Routing of Wide Multi-Modal Energy and Infrastructure Corridors. ISPRS Int. J. Geo-Inf. 2022, 11, 434. [Google Scholar] [CrossRef]
- Jiang, P.; Yang, J.Q.; Fang, R.W. Bi-level programming model for optimization of urban agglomeration comprehensive transportation corridor layout. Eng. Technol. Ed. 2017, 47, 1061–1067. [Google Scholar]
- Hoffman, A.J.; Mutendera, C.; Venter, W.C. Comparing Transport Corridors Based on Total Economic Cost. J. Adv. Transp. 2023, 2023, 6336630. [Google Scholar] [CrossRef]
- Guo, W.; Zhang, Y.; You, J.X.; Hu, J.M.; Pei, X. Travel modal choice analysis for traffic corridors based on decision-theoretic approaches. J. Cent. South Univ. 2016, 23, 3028–3039. [Google Scholar] [CrossRef]
- Zhou, H.C.; Li, H.J.; Chen, X.H.; Zhu, C.F. Analysis of coupling between high-speed railway and common speed railway system in transportation corridor. In IOP Conference Series-Earth and Environmental Science; IOP Publishing: Bristol, UK, 2017; Volume 61, p. 012113. [Google Scholar]
- Su, M.; Luan, W.X.; Yuan, L.Y.; Zhang, R.; Zhang, Z.C. Sustainability Development of High-Speed Rail and Airline-Understanding Passengers’ Preferences: A Case Study of the Beijing-Shanghai Corridor. Sustainability 2019, 11, 1352. [Google Scholar] [CrossRef]
- Li, X.W.; Tian, X.Y.; Li, X.D. Multi-mode Choice Behavior for Passenger in Comprehensive Transportation Corridor. Procedia Eng. 2016, 137, 849–857. [Google Scholar] [CrossRef]
- Song, J.N.; Chen, F.; Wu, Q.Q.; Liu, W.Y.; Xue, F.Y.; Du, K. Optimization of Passenger Transportation Corridor Mode Supply Structure in Regional Comprehensive Transport Considering Economic Equilibrium. Sustainability 2019, 11, 1172. [Google Scholar] [CrossRef]
- Liao, Y. Research on the Coordination Model of Passenger Transportation Mode in the Intercity Comprehensive Transportation Corridor. Math. Probl. Eng. 2022, 2022, 6528089. [Google Scholar] [CrossRef]
- Luo, Y.H.; Wu, J.S. Linking the minimum spanning tree and edge betweenness to understand arterial corridors in an ecological network. Landsc. Ecol. 2021, 36, 1549–1565. [Google Scholar] [CrossRef]
- Pomianowski, W.; Solon, J. Modelling patch mosaic connectivity and ecological corridors with GraphScape. Environ. Model. Softw. 2020, 134, 104757. [Google Scholar] [CrossRef]
| Disclaimer/Publisher’s Note: The statements, opinions and data contained in all publications are solely those of the individual author(s) and contributor(s) and not of MDPI and/or the editor(s). MDPI and/or the editor(s) disclaim responsibility for any injury to people or property resulting from any ideas, methods, instructions or products referred to in the content. |