Article

Effects of Microalgae (Chlorella ZJ and Anabaena azotica) Application on Soil Carbon and Nitrogen Fractions in a Degraded Purple Soil: A Laboratory Incubation Study

1
Key Laboratory of Low-Grade Energy Utilization Technologies and Systems of Ministry of Education, Chongqing University, Chongqing 400044, China
2
National-Regional Joint Engineering Research Center for Soil Pollution Control and Remediation in South China, Guangdong Key Laboratory of Integrated Agro-Environmental Pollution Control and Management, Institute of Eco-Environmental and Soil Sciences, Guangdong Academy of Sciences, Guangzhou 510650, China
3
Guangdong Energy Group Science and Technology Research Institute Co., Ltd., Guangzhou 510630, China
*
Authors to whom correspondence should be addressed.
Sustainability 2026, 18(8), 4057; https://doi.org/10.3390/su18084057
Submission received: 20 March 2026 / Revised: 15 April 2026 / Accepted: 16 April 2026 / Published: 19 April 2026
(This article belongs to the Special Issue Land Degradation, Nutrient Management, and Ecological Restoration)

Abstract

Enhancing soil nutrient content is fundamental to the ecological restoration of degraded soils. The application of microalgae represents a sustainable approach for soil remediation, as it contributes to environmental CO2 sequestration while recycling nutrients into degraded ecosystems. Through a 105-day laboratory incubation experiment, this study investigated the impact of applying a mixed microalgal suspension containing active/inactive Chlorella ZJ and Anabaena azotica on the C and N fractions of an alkaline, degraded purple soil. The results showed that both active and inactive microalgae treatments (AM and IM) significantly decreased soil pH and increased soil moisture content (SMC). The AM treatment notably increased the proportion of large soil aggregates and enhanced soil structure. Both treatments significantly enhanced soil C and N fractions: dissolved organic carbon/nitrogen (DOC/DON) increased by 6.41/5.81 times (AM) and 4.22/4.76 times (IM) that of the control (without microalgae application); total organic carbon (TOC) rose by 147.07% (AM) and 138.73% (IM); and the contents of coarse particulate and mineral-associated organic C and N were also significantly elevated. Total nitrogen (TN) significantly increased only under the AM treatment. Soil C and N mineralization capacities were enhanced by 1.01–1.34 times and 7.56–8.43 times that of the control, respectively, indicating a more pronounced stimulation of N mineralization. Fluorescence analysis revealed that both AM and IM treatments increased the complexity and humification of dissolved organic matter. The application of microalgae significantly improved the soil structure and chemical characteristics of the degraded soil and enhanced the C/N pools, thereby creating favorable conditions for soil restoration.

1. Introduction

Soil degradation is a serious global environmental problem that undermines land productivity, ecosystem services, and sustainable agricultural development [1]. Statistics indicate that degraded soils cover approximately 24% of the global land area, equivalent to about 35 million km2. In China, it is estimated that degraded soil accounts for approximately 40% of the total land area, primarily due to water and soil loss, salinization, declining soil fertility, and acidification [2,3]. The main causes of soil degradation include erosion, compaction, salinization, nutrient depletion, contamination, and soil sealing. Among the various factors contributing to soil degradation, the rapid depletion of nutrients is a critical one, as it directly results in soil impoverishment and leads to biodiversity loss and a decline in land productivity [3,4]. Therefore, exploring effective pathways to enhance soil nutrients and fertility, such as applying biological/chemical fertilizers or implementing crop rotation, has become a central task for restoring degraded lands and ensuring food security [5,6]. This endeavor is critical for the long-term stability of ecosystems and also directly influences the sustainable development prospects of human society.
Microalgae are a group of microscopically small and structurally simple autotrophic organisms characterized by high photosynthetic efficiency and a rapid growth rate. Some species or groups also have strong environmental adaptability, enabling them to be widely distributed in diverse environments such as soils, oceans, rivers, and lakes, and even to survive in extreme conditions, including polar regions, arid lands, and saline-alkali soils [7]. Complementing this adaptability, microalgae are rich in essential nutrients (N, P, trace elements) and bioactive compounds (polysaccharides, plant hormones), which confer the ability to enhance soil fertility and stimulate plant growth. Microalgae-based biofertilizers have emerged as a promising approach for improving both the quality and quantity of soil C and N. Zhang et al. [8] conducted a 40-day field experiment on a silt loam soil under a subtropical monsoon climate and reported that a total application of 0.2–0.8 g dry weight of microalgae per m2 over the experimental period increased the soil TOC content by 70–81%. They further demonstrated that microalgae continuously secrete extracellular polysaccharides predominantly composed of glucose, and upon cell death, intracellular polysaccharides are rapidly released into the environment. These polysaccharides constitute a significant component of dissolved organic matter. Song et al. [9] conducted a 60-day experiment under a subtropical climate on an acidic soil and reported that microalgae-based fertilizer increased DOC and DON in a continuous-cropping soil of potted tomato by 231.3% and 403.4%, respectively. To date, numerous studies have investigated the effects of microalgae as biofertilizers on total soil C and N contents [8,9,10,11]. However, research focusing on the dynamics of labile and functionally distinct C and N fractions, such as DOC/N and POC/N, in microalgae-amended soils remains limited. This limitation is primarily due to the fact that conventional chemical analysis methods often cannot characterize the compositional features and dynamic transformations of specific organic components (e.g., proteins, humic substances) at the microscale. Despite these challenges, these labile fractions are critically important as they represent the most bioavailable and dynamic pools in soil, driving short-term nutrient cycling and microbial activity, and serving as sensitive indicators of soil organic matter dynamics [12,13]. Therefore, a knowledge gap exists regarding the in-depth mechanisms by which microalgae influence the turnover of C/N fractions in soils.
Soil C and N are fundamental elements for maintaining soil fertility and ecosystem functioning. Soil C, predominantly existing in the form of organic matter, enhances soil physical properties by promoting aggregate formation and acts as an energy source for microbial activities [14]. Soil N is a fundamental building block of living organisms and a key component in synthesizing proteins, nucleic acids, and chlorophyll, thus playing a direct role in regulating plant growth [15]. The increase in C and N in soil can stimulate microbial activities, thereby facilitating nutrient cycling and utilization. The chemical forms of C and N significantly govern their transformation pathways and bioavailability in soil. For example, DOC and DON are highly active components within the soil C and N pools, primarily derived from plant litter, root exudates, microbial metabolites, and the composition of organic matter (e.g., humus) under natural conditions [16]. Research has shown that the exogenous addition of DOC and DON can rapidly activate soil microorganisms and stimulate their metabolic activity, thereby enhancing the functional diversity and stability of the microbial community structure [17]. In addition, increasing C and N availability in soil enhances the production of extracellular polymeric substances (EPS) by microorganisms, which facilitates the formation of soil aggregates and thereby creates a favorable environment for plant growth [18,19].
Nutrient deficiency is a major obstacle to the recovery of degraded soils. Utilizing microalgae for soil restoration can enhance the potential of vegetation recovery. As a unicellular green alga, Chlorella ZJ is considered one of the most promising species for C fixation owing to its high photosynthetic efficiency and the absence of toxin secretion [20]. Anabaena azotica fixes atmospheric N through its heterocysts, where the nitrogenase enzyme catalyzes the reduction of N2 to NH3. The produced ammonia is subsequently utilized for the biosynthesis of N-containing compounds, such as amino acids [21]. The combined application of these two microalgae as biofertilizers can effectively leverage their complementary roles in improving soil fertility and boosting C sequestration. However, the application of these microalgae for the remediation of degraded soils in Southern China remains largely unexplored.
The Nanxiong Basin (1.8 × 10³ km2), situated in northern Guangdong Province, China, was selected for this study due to its extensive distribution of red bed landforms. The predominant soil type is purple soil, which suffers from severe nutrient depletion. Consequently, vegetation is extremely sparse and the soil is highly infertile, leading the area to be designated as the ‘Red Desert’ [22]. This study’s objective was to evaluate the efficacy of two microalgae species, Chlorella ZJ and Anabaena azotica, in enhancing C and N transformation and accumulation in the severely degraded purple soil, thereby assessing its potential for soil remediation. Special attention was given to the effects of microalgae fertilization on distinct soil C and N fractions. Furthermore, EEM-FRI analysis was employed for the detailed characterization of the complex components of DOM. This method can differentiate and semi-quantify specific fluorescent moieties (e.g., protein-like, humic-like substances) that are often indiscernible to conventional chemical analysis, thereby providing insights into the material composition and transformation pathways of labile organic matter at the microscale. The findings of this research will provide critical theoretical support and practical references for the application of microalgae in degraded soil restoration.

2. Materials and Methods

2.1. Microalgae Suspension Culture

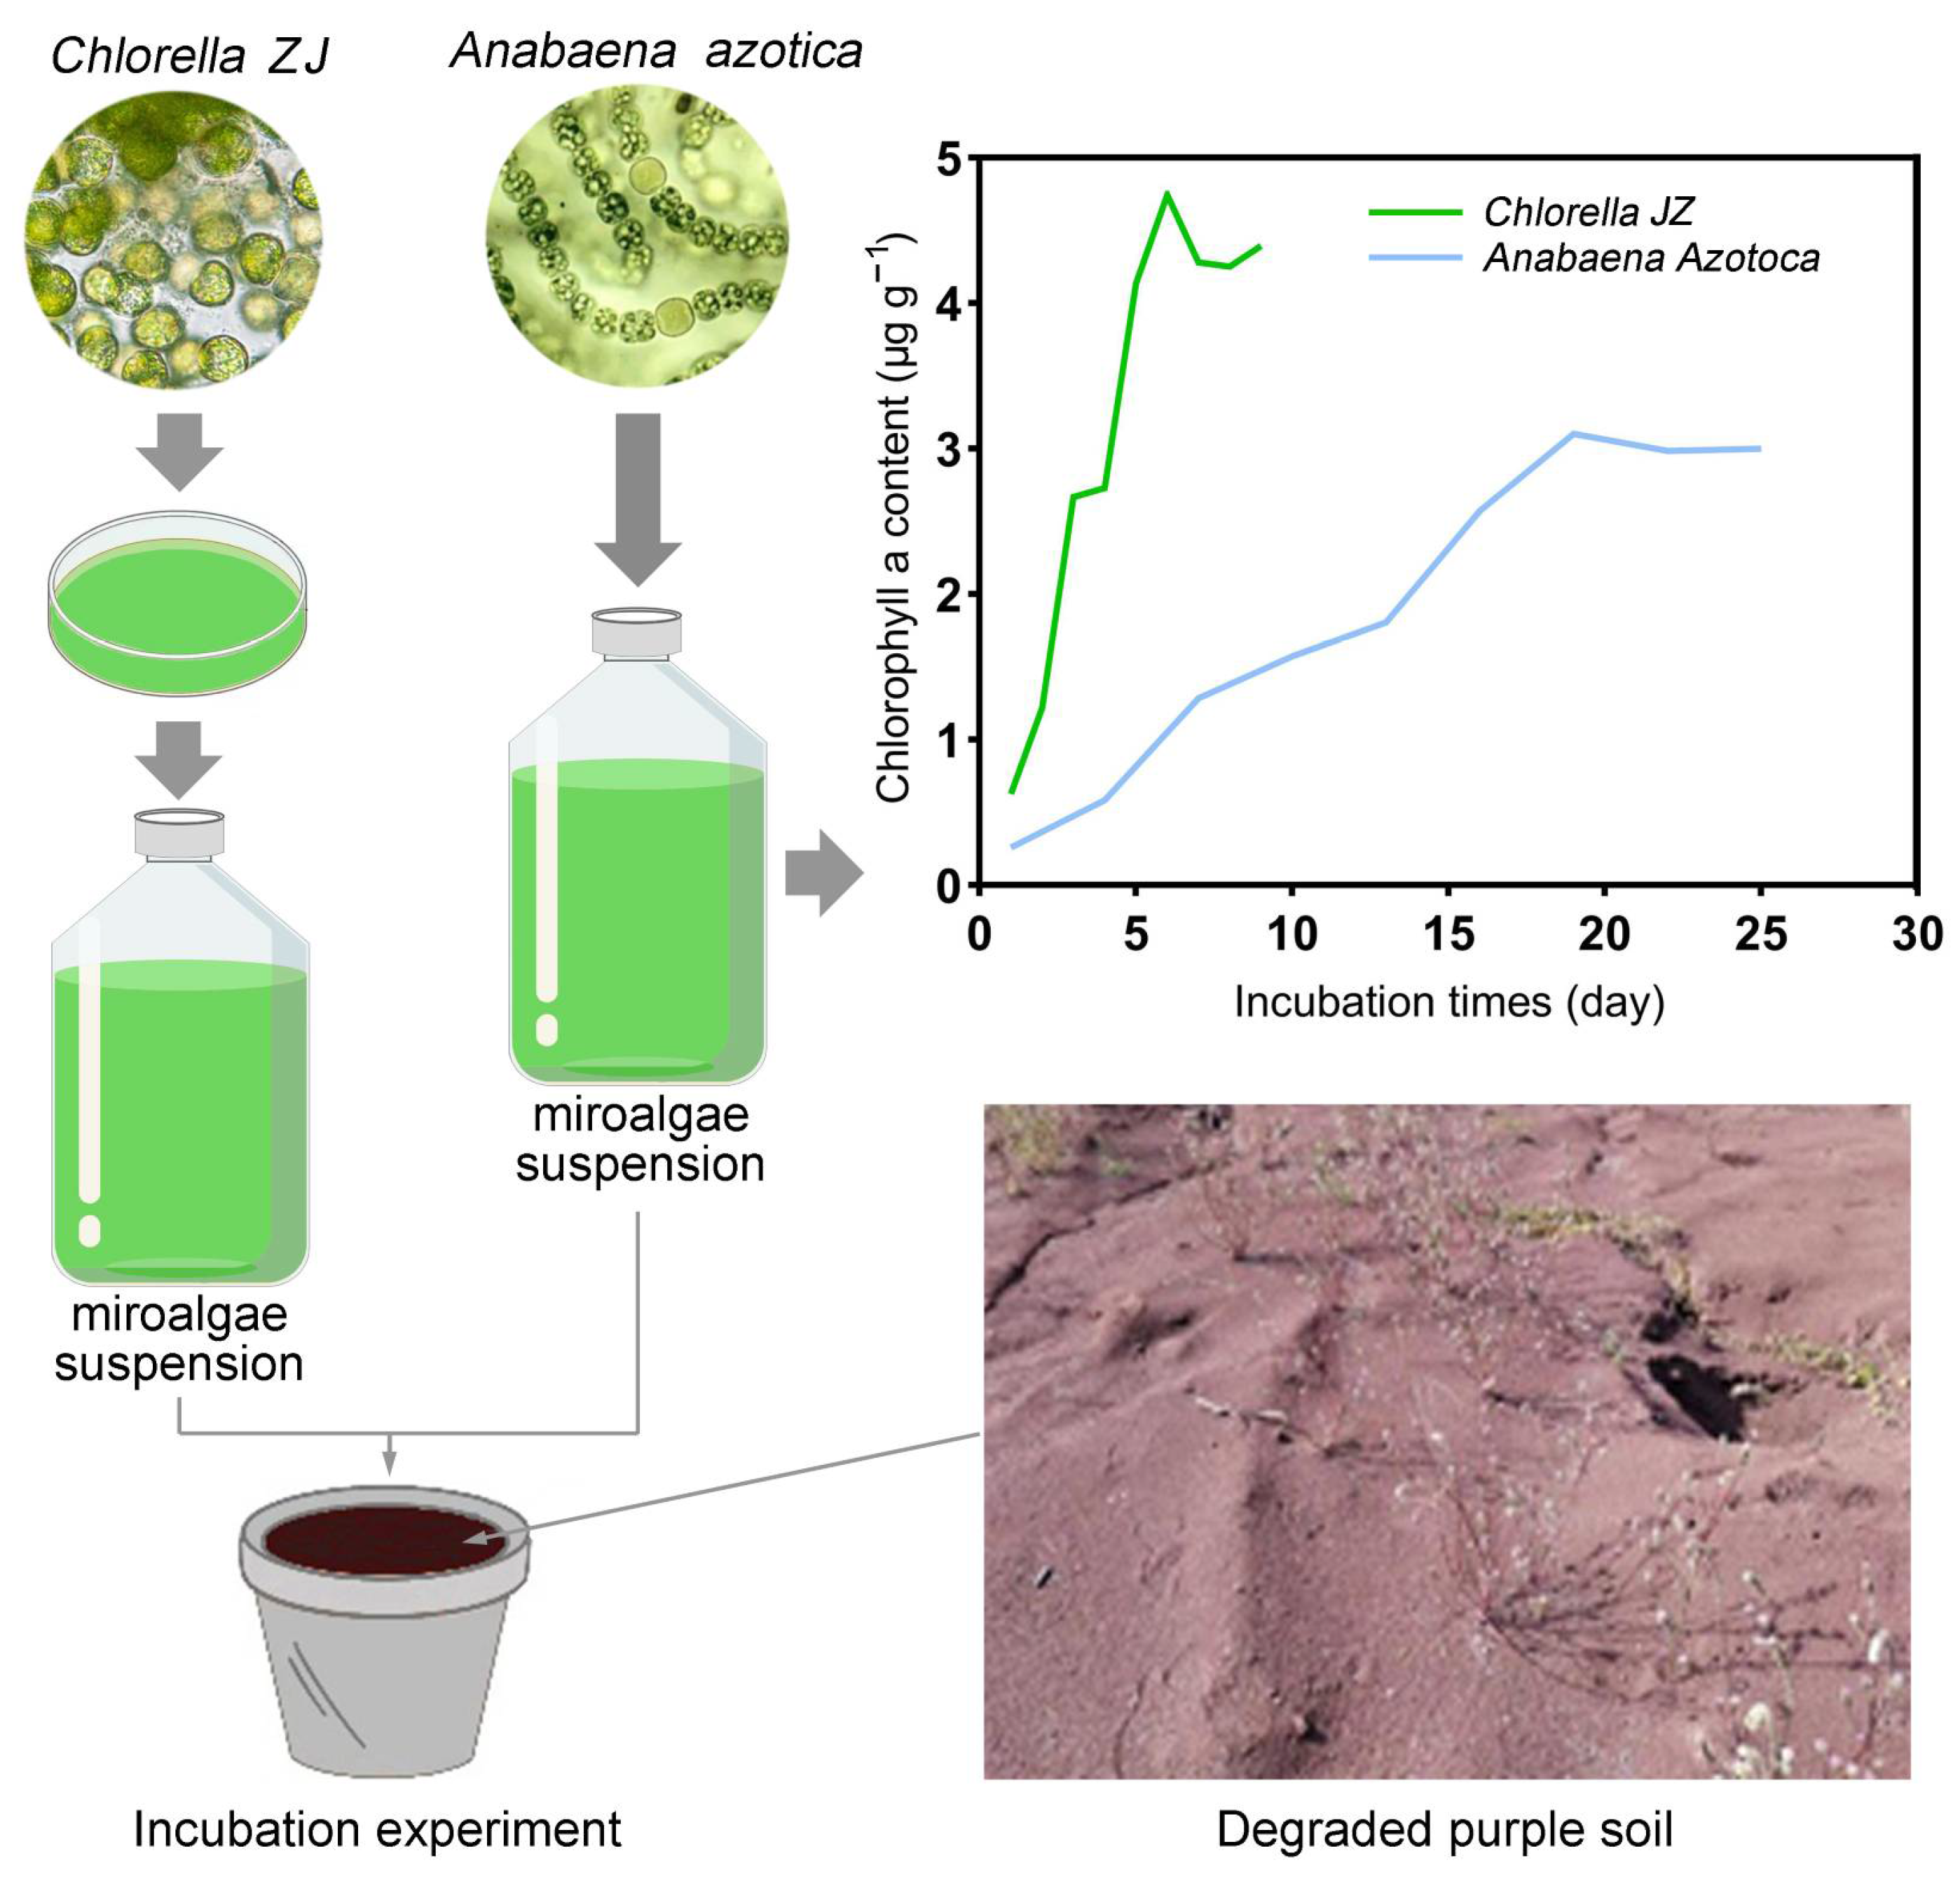
Two microalgae species, Chlorella ZJ and Anabaena azotica, were selected as soil amendments. Chlorella ZJ and Anabaena azotica were inoculated and cultivated using TAP-2 and BG-11 culture media, respectively (Table 1). Inoculation of both microalgae species was performed at an initial density of 1 × 10⁷ cells mL−1, with the inoculum constituting 5% (v/v) of the fresh medium. After 4–5 days of cultivation in a Petri dish, the Chlorella ZJ suspension was transferred into 1.25 L plastic bottles, each containing 1 L of fresh media. The bottles were sealed and subsequently incubated for another 4–5 days under illumination of approximately 130 μmol photons m−2 s−1 PAR (photosynthetically active radiation). The cultures were thoroughly mixed twice each day throughout the incubation period. Cultivation of Anabaena azotica was conducted in 1 L bottles with weekly batch inoculations (20 bottles per batch). During the cultivation period, the cultures were aerated for 12 h daily by bubbling them with air and maintained under natural light. The temperature for both microalgae species was controlled between 25 and 30 °C. We adopted correspondingly different culture protocols based on the distinct growth modes and physiological requirements of the two microalgae, and in reference to the existing literature [23,24]. The algal culture in the bottles was used directly for the subsequent experiments. The chlorophyll a content in the microalgae was determined during the incubation period using an ethanol extraction method [25]. After cultivation, the algal dry weight and cell density of both microalgal cultures reached 0.8–1.0 g L−1 and 107–108 cells mL−1, respectively. The nutrient content in Chlorella ZJ (based on cell dry weights) was as follows: C 531 g kg−1, N 64 g kg−1, P 6.35 g kg−1, and K 1.75 g kg−1. In Anabaena azotica, the nutrient content was C 417 g kg−1, N 85 g kg−1, and 5.9 P g kg−1, and K 5.4 g kg−1. Figure 1 illustrates the microalgae fertilizer production process and the dynamics of the chlorophyll a content for the two microalgae species during growth.

2.2. Soil Collection

Soil samples for this study were obtained from a barren site in Nanxiong City, Guangdong Province, China (25°07′ N, 114°18′ E). The sampling points are located in a southern subtropical monsoon climate zone (average temperature = 19.7 °C, annual precipitation = 1550 mm). The soil was classified as Entisols, derived from the intense weathering of sandy shale, and was characterized by a sandy texture, low nutrient content, and poor aggregate structure [26]. Surface soil samples (0–20 cm depth) were collected in December 2023. The soil was air-dried at room temperature and then ground and sieved through a 1 cm screen for the subsequent soil incubation experiments. A portion of the soil was further sieved through a 2 mm screen to determine basic physicochemical properties, including electrical conductivity (EC), pH, bulk density (BD), particle size distribution, and C/N fractions such as TOC, TN, DOC, DON, sodium adsorption ratio (SAR), and exchangeable sodium percentage (ESP). The basic properties of the soil are presented in Table 2.

2.3. Soil Incubation Experiments

The sieved soil (<1 cm) was packed into pots (20 cm in diameter × 12 cm in height) at the natural soil bulk density, with each pot containing 1.5 kg of soil. The incubation experiment was conducted in a greenhouse from February to June 2024, for a total of 105 days. Throughout the experiment, the temperature varied naturally between 22 °C and 32 °C. Our preliminary studies have shown that the microalgae species used in this experiment exhibit good growth and metabolic activity within 25–35 °C. Moreover, this temperature range can, to some extent, reflect the actual climatic conditions of the degraded purple soil sampling site (Nanxiong), where the monthly mean temperature from February to June ranges from approximately 12 °C to 30 °C. Three treatments were established: (1) Active microalgae (AM): Each pot was amended with 20 mL of the active Chlorella ZJ suspension and 20 mL of the active Anabaena azotica suspension, corresponding to an application rate of 21.3–26.7 mg dry weight of microalgae per kg of soil. (2) Inactivated microalgae (IM): Each pot was amended with 20 mL of the inactivated Chlorella ZJ suspension and 20 mL of the inactivated Anabaena azotica suspension. The microalgae were inactivated by autoclaving at 121 °C and 0.105 MPa for 30 min with two cycles. A viability test was performed using the fluorescein diacetate/propidium staining method, confirming complete inactivation. (3) Control (CK): Each pot received an equivalent volume (40 mL) of deionized water. Each pot was irrigated with 50 mL of pure water once per week to maintain soil moisture and support microalgae survival. Considering the differential roles of the two microalgae in C and N fixation, as well as their actual application in soil restoration practices, both microalgae were applied together to the soil (treatments AM and IM). Each treatment was repeated three times. A separate medium-only control (sterile culture medium without microalgae) was not included because the IM treatment already served as an appropriate control to distinguish the effect of algal biomass from that of medium-derived nutrients. Both AM and IM treatments contained the same residual culture medium after algal cultivation (before inactivation). Thus, the comparison between the two groups could reflect the effect of algal biological activity, while the comparison between inactivated microalgae and CK reflects the combined effect of algal biomass and residual medium nutrients. Adding a fresh medium-only control would not accurately represent the actual medium conditions in the algae-treated groups, as the nutrient composition of the culture medium was likely to differ substantially from that of the initial medium.
During the incubation period, the pH, SMC, DOC, and DON content of the soil, as well as chlorophyll a from biological soil crusts, were measured on days 15, 45, and 105. At the end of the 105-day incubation, soils were sampled from the 0–8 cm layer of each pot and analyzed for indicators including aggregate composition, TOC, TN, C/N fractions (coarse particulate organic carbon/total nitrogen (CPOC/TN), fine particulate organic carbon/total nitrogen FPOC/TN, and mineral-associated organic carbon/total nitrogen (MAOC/TN)), and C/N mineralization capacity. Additionally, for the analysis of DOM components, soil samples were taken separately from the surface (0–2 cm) and subsurface (2–8 cm) layers in each pot.

2.4. Analytical Methods

2.4.1. Soil Property and C/N Fraction Analysis

Soil pH was determined using a pH meter (S210, Mettler-Toledo International Inc., Columbus, OH, USA) after mixing the soil with deionized water at a 1:2.5 (w/v) ratio [27]. The soil moisture content and bulk density were determined using the oven-drying method [28]. The soil electrical conductivity (EC) was measured using a conductivity meter (DDSJ-308F, INESA Scientific Instrument Co., Ltd., Shanghai, China). The soil SAR value was determined by measuring the exchangeable Ca2+, Mg2+ and Na+ contents using an atomic adsorption spectrophotometer (TAS-990, Persee Inc., Beijing, China) and was calculated using the following equation [29]:
S A R = N a + ( C a 2 + + M g 2 + ) / 2
where SAR is the sodium adsorption ratio ((mmol kg−1)0.5); Na+, Ca2+, and Mg2+ are the concentrations of exchangeable Na+, Ca2+, and Mg2+ in the soil (mmol kg−1).
The soil ESP was calculated using the following equation:
E S P = 100 × N a + C E C
where ESP is the exchangeable sodium percentage (%); Na+ is the content of exchangeable Na+ (mmol kg−1); CEC is the cation exchange capacity (mmol kg−1).
The soil aggregate composition was determined using the wet-sieving method, which separated the soil into four different fractions: >2 mm (large macro-aggregates), 0.25–2 mm (small macro-aggregates), 0.053–0.25 mm (large micro-aggregates), and <0.053 mm (small micro-aggregates) [30]. Chlorophyll a was extracted from the soil crust using absolute ethanol, with the mixture first heated in an 80 °C water bath for 5 min and then left to stand for 24 h. The content was subsequently determined using a spectrophotometer.
Total organic carbon (TOC) and total nitrogen (TN) were quantified using the potassium dichromate external heating method [31] and the Kjeldahl digestion method [32], respectively. Soil total organic carbon (TOC) and soil organic nitrogen (SON) were fractionated into three classes based on particle size using the sodium hexametaphosphate dispersion method: particulate organic matter (>250 μm), fine particulate organic matter (53–250 μm), and mineral-associated organic matter (<53 μm) [33]. Fresh soil samples were shaken with deionized water (1:5, w/v) at 25 °C for 30 min to extract DOC. The resulting extracts were then analyzed using a TOC analyzer (TOC-V cph, SHIMADZU, Kyoto, Japan). DON was extracted from the soil with 2 M KCl at 25 °C for 1 h, using a soil:solution ratio of 1:10 (w/v). Following filtration, the extract was analyzed for total soluble N using an automatic intermittent chemical analyzer (SC 200, AMS Alliance, Frépillon, France).

2.4.2. Three-Dimensional Fluorescence Spectrometer Analysis

On days 15, 45, and 105 of the incubation period, soil water-extractable organic matter was obtained from fresh soil following the same extraction method as for DOC. The extracts were vacuum-filtered and subsequently analyzed using a Horiba FluoroMax-4 spectrometer (Horiba, Kyoto, Japan) to characterize the components of DOM. To quantify the contributions of different fluorescent components, the EEM spectra were divided into five regions representing distinct fluorophore types: region I, tyrosine-like substances; region II, tryptophan-like substances; region III, fulvic acid-like substances; region IV, microbial byproducts; and region V, humic acid-like substances. By calculating the fluorescence integral within each region, the temporal variations of different DOM components during the incubation period were quantitatively assessed. The relative abundance of different fluorescent components was quantified using the regional integration method as follows [34]:
Φ i , n = M F I ( λ e x λ e m ) d λ e x d λ e m
Φ T , n = Φ i , n
P i , n = Φ i , n Φ T , n × 100 %
where Φi,n is the normalized excitation-emission area volume of region i (au nm2); Φi is the excitation-emission area volume of region i (au nm2); λex is the excitation wavelength (nm); λexm is the emission wavelength (nm); I(λexλex) is the fluorescence intensity at each excitation-emission wavelength pair (au); Pi,n is the percentage of the normalized area volumes of a given fluorescent region i relative to the total area volumes; and MFi is the multiplication factor. The information of the five fluorescent integration regions is listed in Table 3.

2.4.3. Soil C/N Mineralization Rate Analysis

The C mineralization capacity of the soils after incubation was determined using a 7-day alkali absorption and titration method [35]. Specifically, 20.0 g of the fresh soil sample was placed in a 500 mL incubation flask, and its moisture was adjusted to 60% of the field capacity. To trap the released CO2 during incubation, a 25 mL beaker containing 10 mL NaOH (0.5 mol·L−1) was placed at the bottom of the flask. The flask was then sealed and incubated in the dark at 25 °C. The NaOH solution was replaced every 24 h, and the absorbed CO2 was quantified by titrating the alkali against 0.2 mol L−1 HCl using phenolphthalein as the indicator. The volume of the consumed HCl was recorded to calculate the CO2 release rate under different treatment conditions as follows:
C M R = ( V 0 V ) × C × 12 2 × m × t
where CMR denotes the C mineralization rate (mg kg−1 d−1); V0 denotes the volume of HCl (ml) consumed in the control treatment; V denotes the volume of HCl (mL) consumed in different treatments; C denotes the concentration of the HCl standard solution (g mmol−1); 12 represents the atomic mass of C (g mol−1); 2 denotes the conversion coefficient from H to C (moles of H+ consumed per mole of CO2 produced); m denotes the mass of the soil sample (kg); and t represents the incubation period (d).
The soil net N mineralization capacity was determined using a 7-day aerobic incubation method [36]. Specifically, during the incubation, 10 g of fresh soil was sampled daily and extracted with 50.00 mL of a 2 mol L−1 KCl solution by shaking for 1 h. After centrifugation, the concentrations of N H 4 + -N and nitrate N O 3 -N in the supernatant were measured using a Smartchem 170 discrete analyzer. The soil net N mineralization rate was calculated as follows:
N M R = ( ( N H 4 + N ) t + 1 + ( N O 3 N ) t + 1 ) ( N H 4 + N ) t + ( N O 3 N ) t t t + 1 t t
where NMR represents the net N mineralization rate (mg kg−1 day−1); N H 4 + -N represents the ammonium N content (mg kg−1); ( N O 3 -N)t represents the nitrate N content at time t; t represents the incubation duration in days; and tt+1tt represents the interval between two consecutive sampling periods (days).

2.4.4. Data Processing

A one-way ANOVA was performed to compare the differences in soil properties and C/N fraction indicators among the different treatments (AM, IM, and CK). Pearson correlation analysis was used to examine the relationships between soil properties and C/N fraction indicators. Origin 2021 (Origin Lab Inc., Northampton, MA, USA) and GraphPad Prism 9.0 (GraphPad Software Inc., Solana Beach, CA, USA) were employed for all statistical analyses and graphical presentations.

3. Results

3.1. Variations in Soil Properties

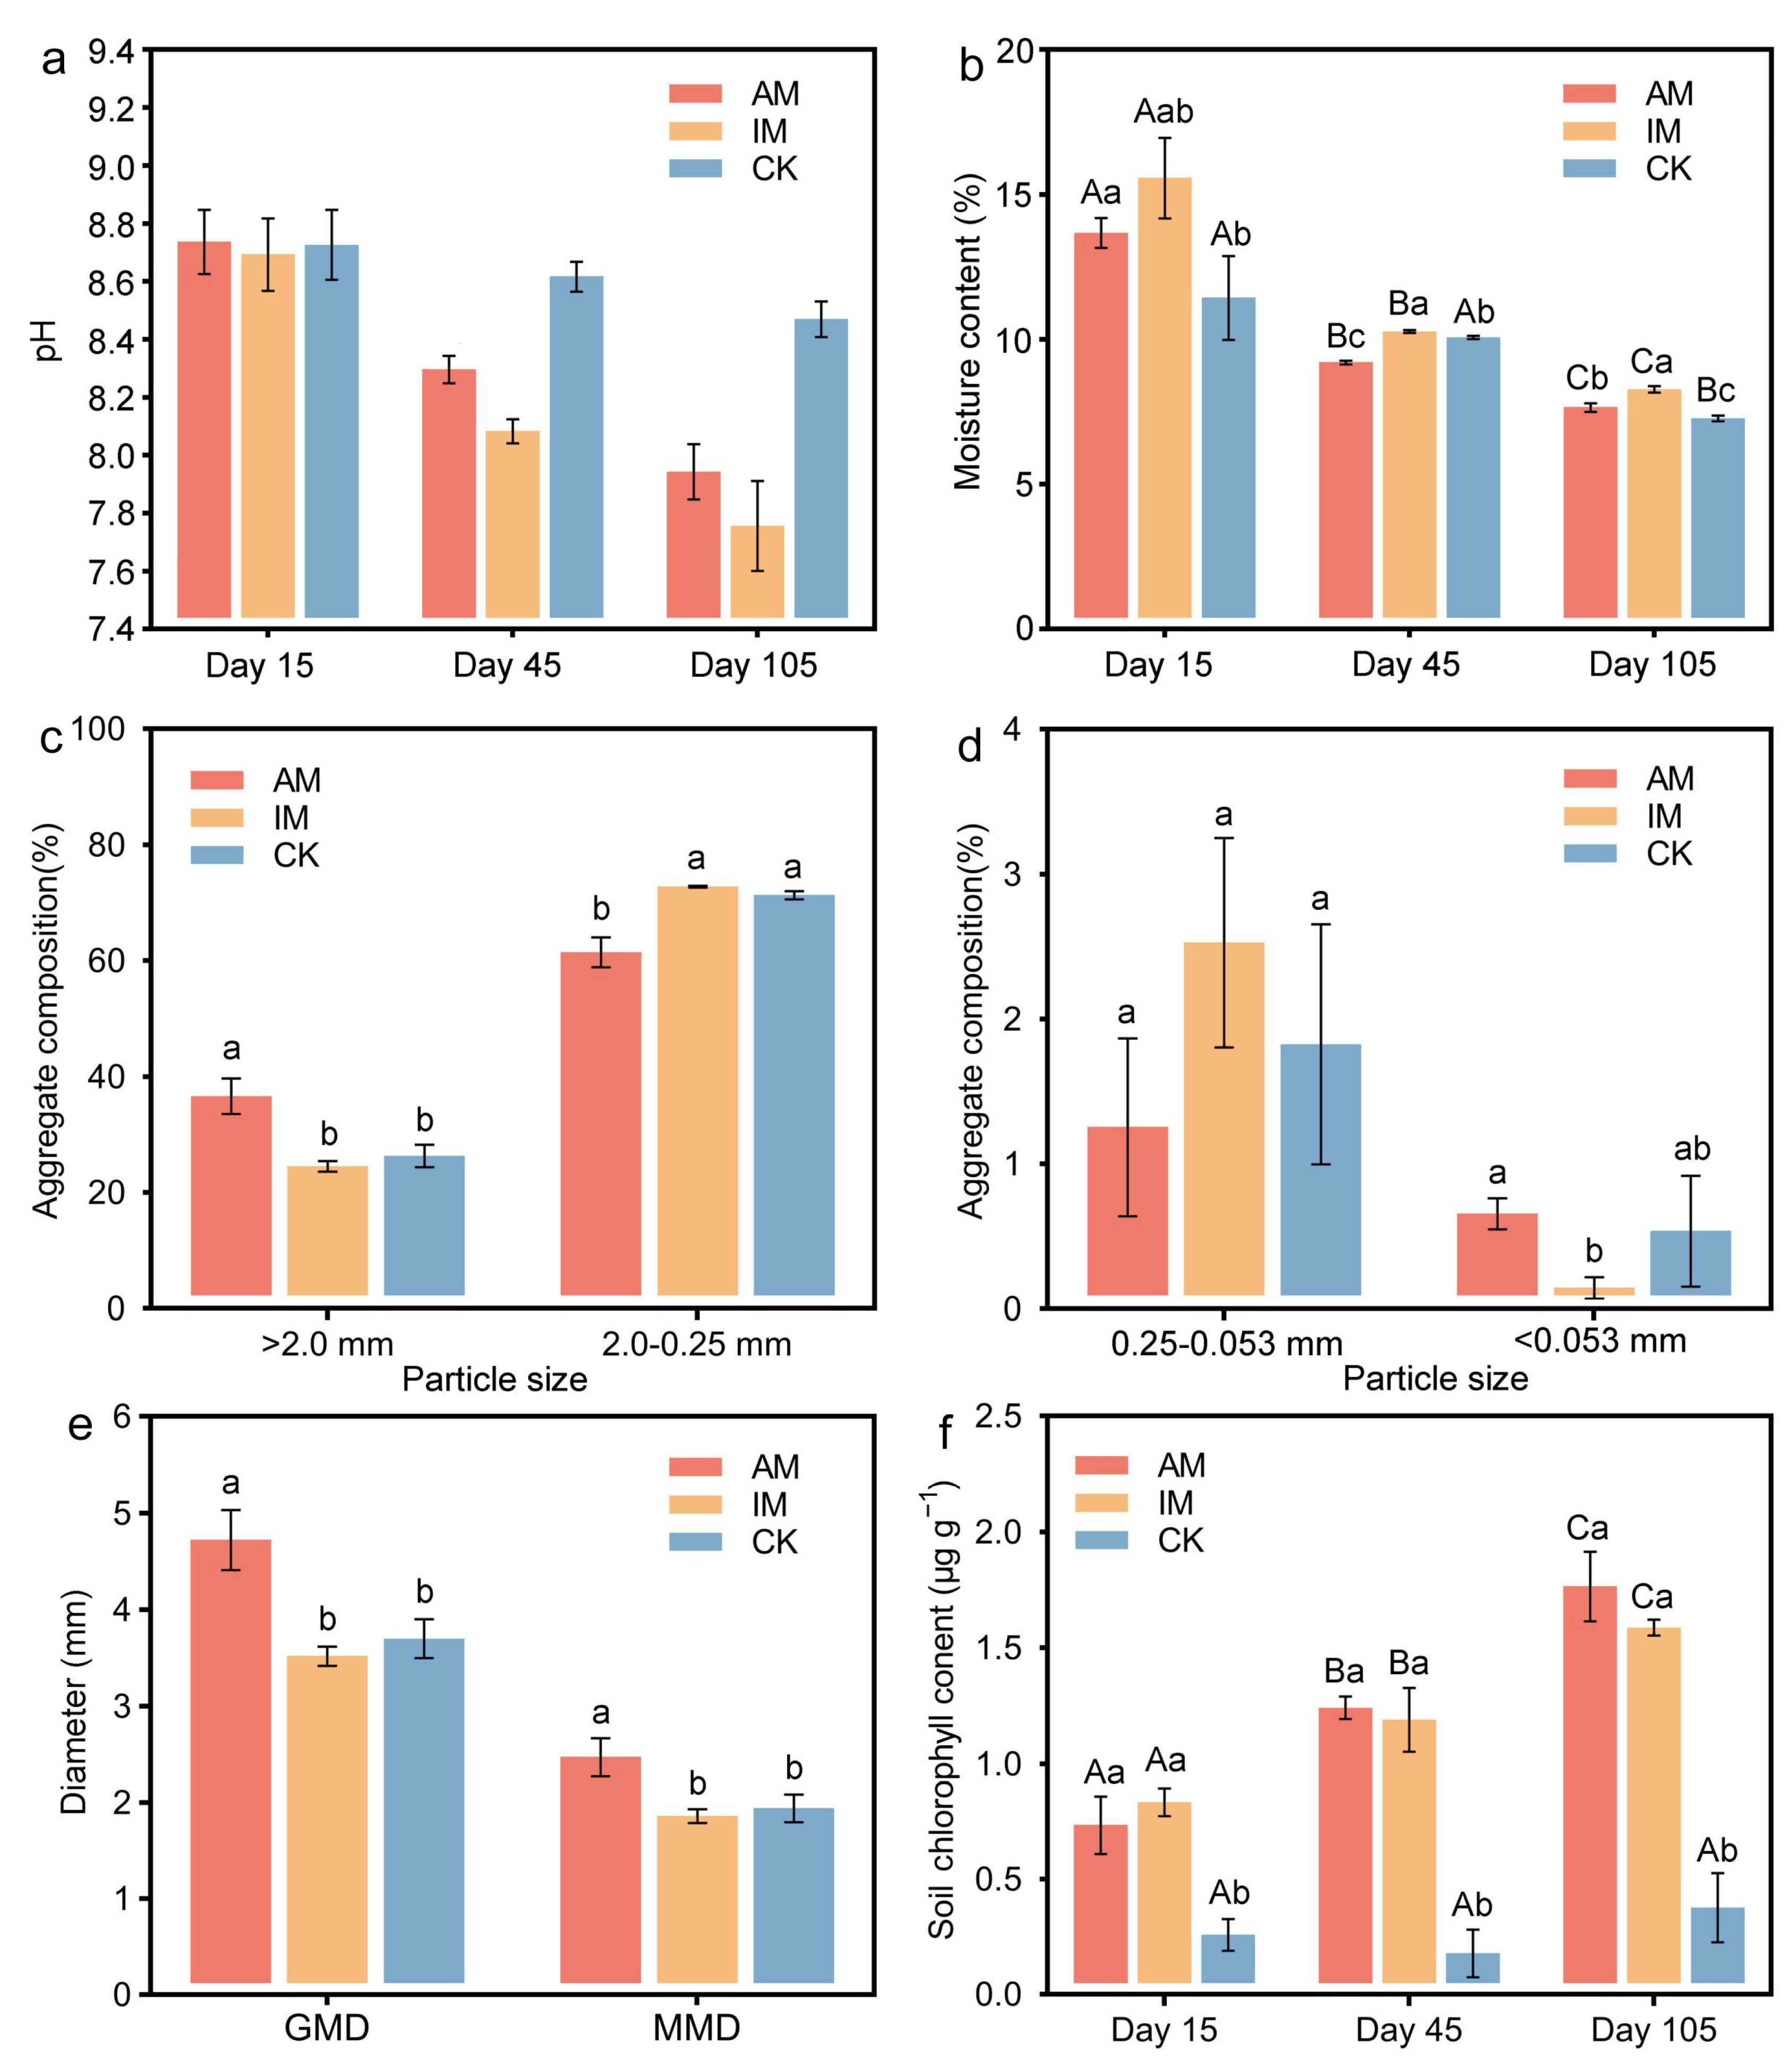
No significant difference in soil pH was observed among the treatments after the initial 15 days of incubation (p > 0.05; Figure 2a). Thereafter, the influence of both active and inactivated microalgae became progressively evident as the incubation progressed. By the end of the 105 days of incubation, the pH values in the AM and IM treatments were significantly decreased by 0.52 and 0.71 units, respectively, compared with the control treatment (pH = 8.47; p < 0.05).
The soil moisture content in all treatments also showed a continuous decreasing trend over time. The IM treatment consistently maintained the highest moisture level, which was significantly greater than that of the CK (p < 0.05; Figure 2b). The proportion of large macro-aggregates in the AM treatment (36.63 ± 3.10%) was significantly higher than that in the IM treatment (24.52 ± 0.93%) and the CK (26.31 ± 1.92%) (p < 0.05; Figure 2c). In contrast, a significant reduction in small micro-aggregate proportion was observed under the IM treatment (p < 0.05; Figure 2d). Furthermore, significantly greater GMD (4.72 ± 0.31 mm) and MMD (2.47 ± 0.20 mm) were observed in the AM treatment relative to both the IM treatment (GMD: 3.52 ± 0.10 mm; MMD: 1.86 ± 0.07 mm) and the CK (GMD: 3.70 ± 0.20 mm; MMD: 1.94 ± 0.14 mm) (p < 0.05; Figure 2e).
Throughout the 105-day incubation, soil chlorophyll a content increased steadily in both microalgae-treated soils, maintaining significantly higher levels than the CK (p < 0.05). By day 105, this enhancement was most pronounced, with AM and IM treatments showing 5.28-fold and 4.69-fold increases relative to the control, respectively (Figure 2f). These results indicate a significant stimulating effect on indigenous soil algae by nutrients released from the decomposed inactivated microalgal biomass.

3.2. Variations in DOC, DON, C/N Fraction, TOC, TN, and C/N Mineralization Capacity

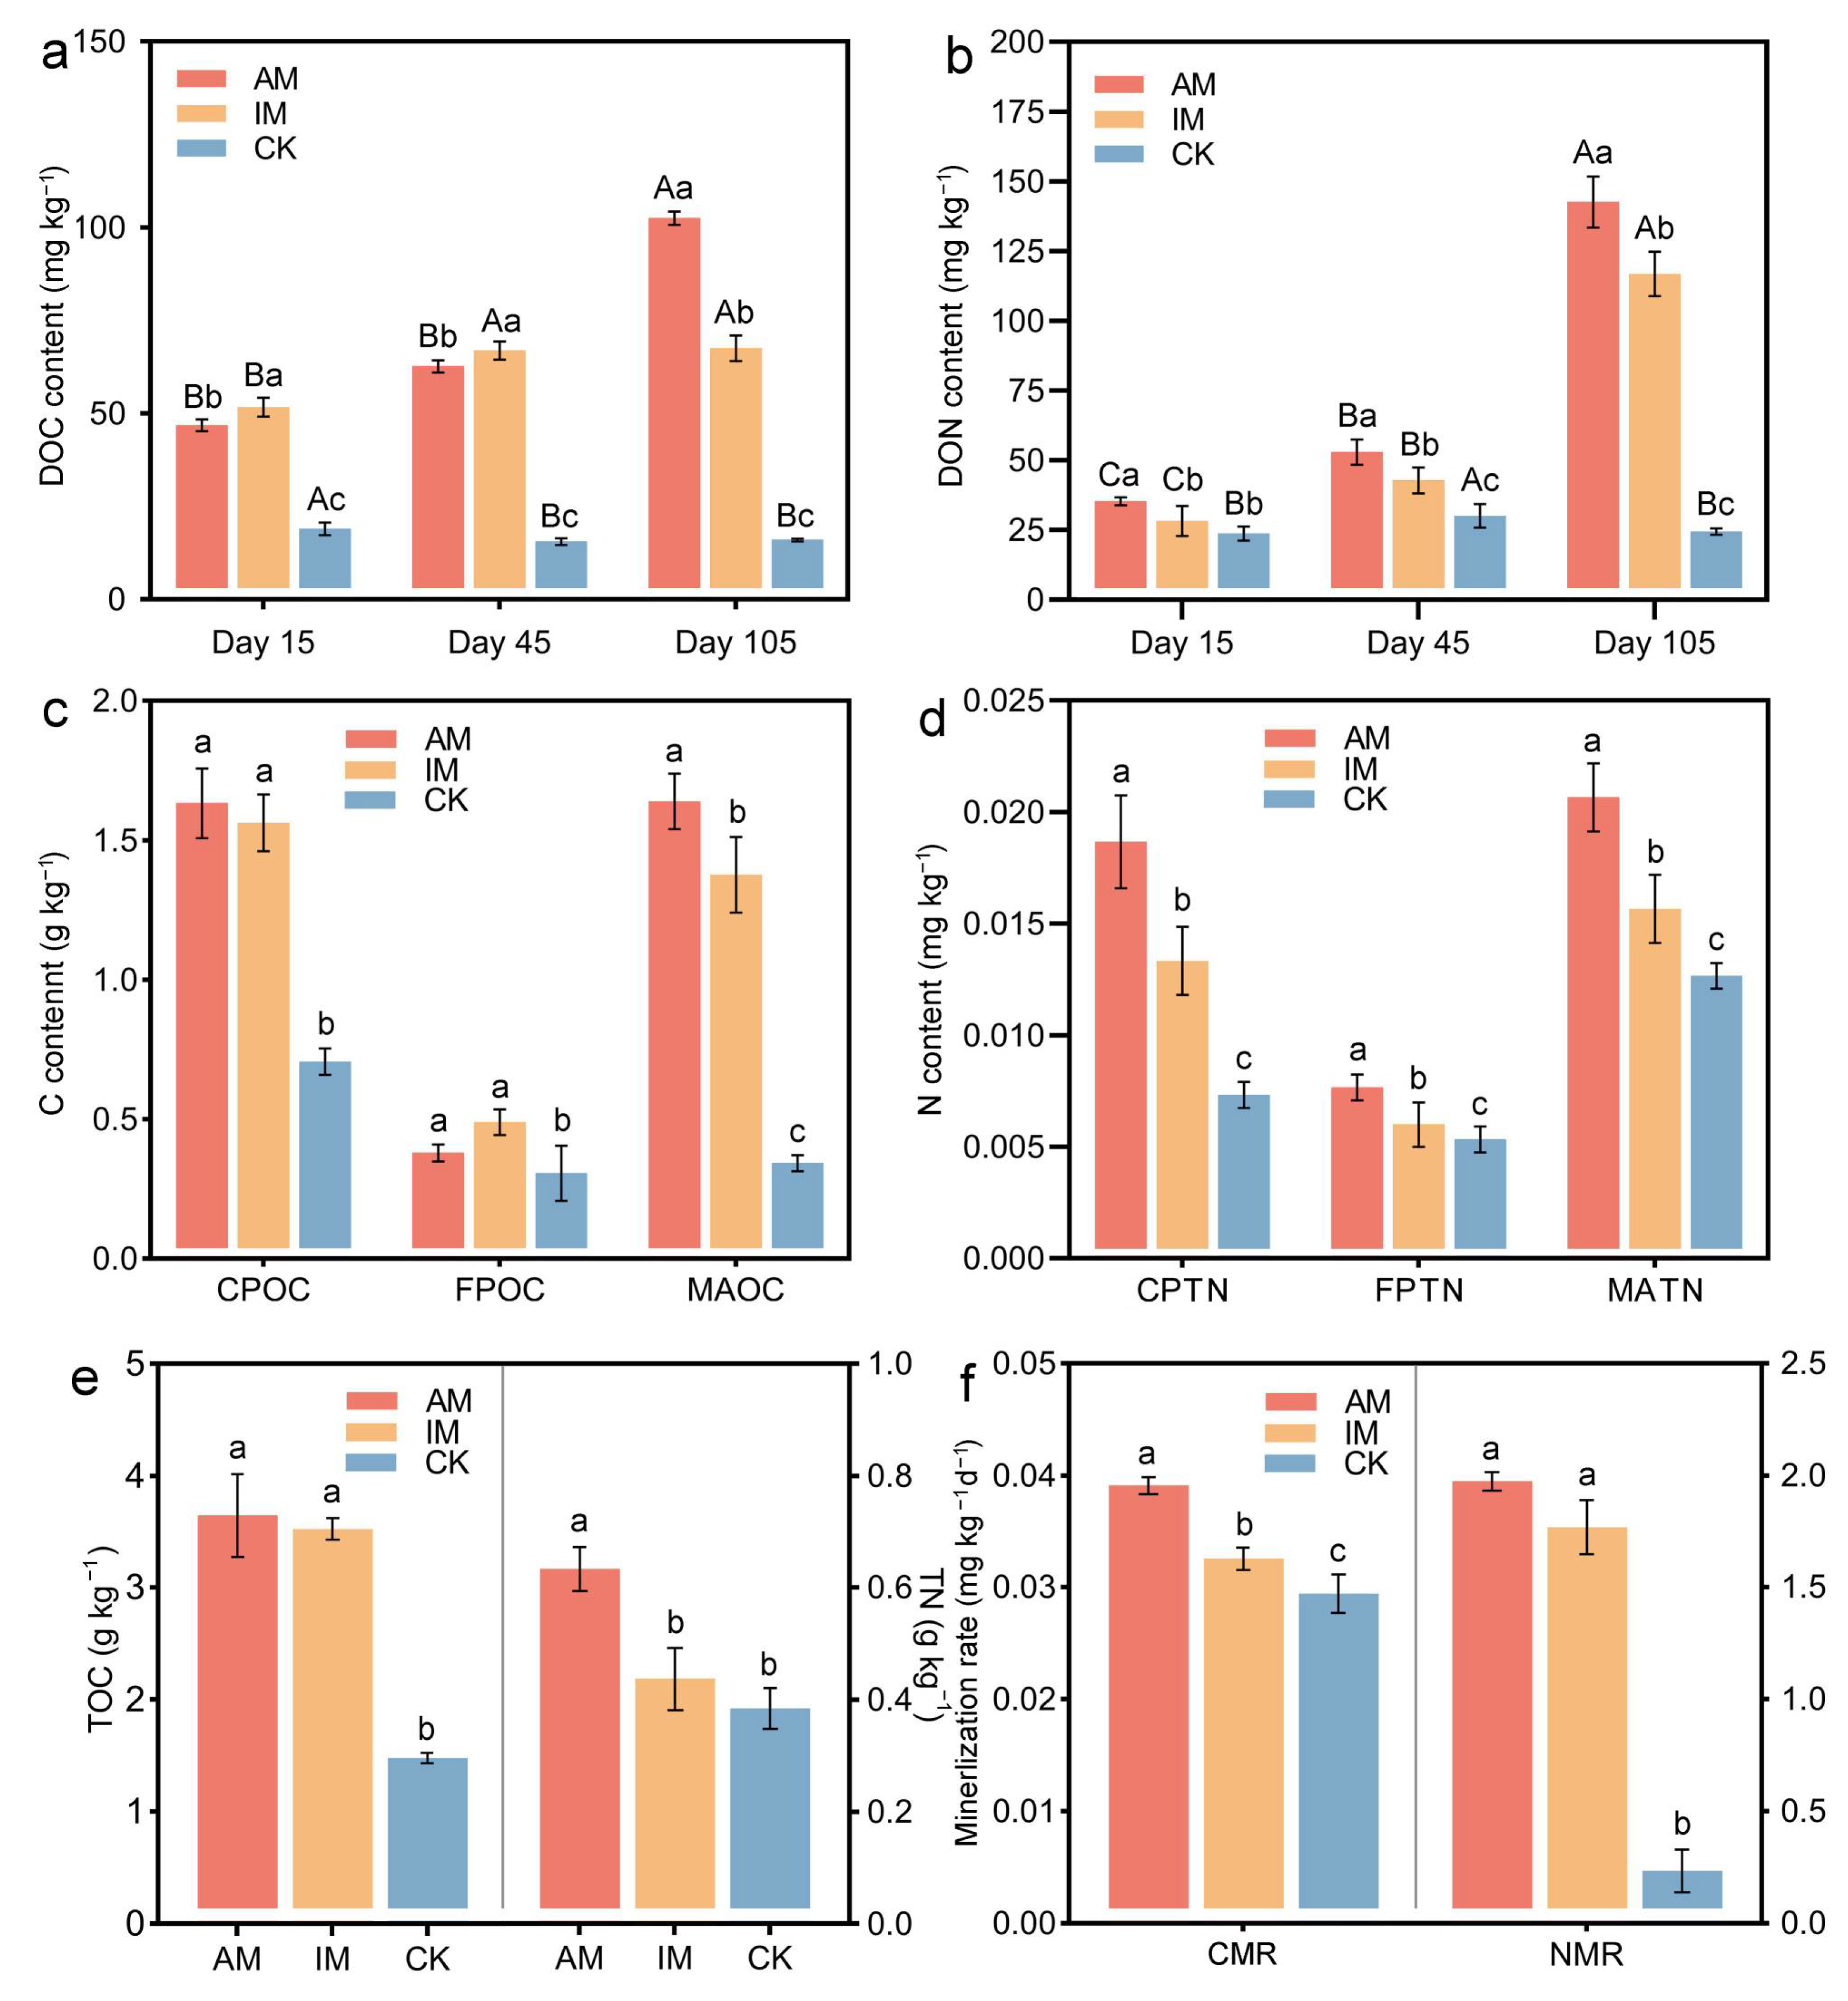
The application of both active and inactivated microalgae significantly increased the soil DOC content (p < 0.05; Figure 3a). By the end of the incubation (day 105), the DOC content in the AM and IM treatments was 6.41 and 4.22 times higher than that in the CK, respectively. Additionally, DOC levels in the AM treatment exhibited a sustained and significant increase over the entire incubation (p < 0.05), while those in the IM treatment showed no notable variation after day 45 (p > 0.05). Similar to DOC, DON in both the AM and the IM treatments showed a continuous increasing trend over the incubation period (Figure 3b). After 105 days of incubation, the DON contents in the AM and IM treatments reached 5.81 and 4.76 times those measured in the CK, respectively. In contrast, the increase in DON was more pronounced during the later stages of the incubation compared with that of DOC. Specifically, by day 105, the DOC content in the AM and IM treatments had increased to 1.63 and 1.08 times that of day 45, respectively, while the corresponding increases for DON were substantially greater, reaching 2.69 and 2.72 times. Over the entire 105-day period, the DON content in the AM treatment remained significantly higher than that in the IM treatment and the CK, whereas for DOC, such a difference was observed only on day 105.
The analysis of different C fractions revealed that both AM and IM treatments significantly increased the contents of CPOC and MAOC compared with the CK (p < 0.05). However, no significant treatment effects on FPOC were detected (p > 0.05; Figure 3c). The distribution of N across different fractions consistently followed the order: AM > IM > CK (p < 0.05; Figure 3d). After 105 days of incubation, both AM and IM treatments significantly increased soil TOC content (p < 0.05; Figure 3e), with increases of 147.07% and 138.73% compared to the CK, respectively. Assuming an 8 cm soil depth as the influence zone, the AM and IM treatments increased the TOC storage by 226.38 ± 34.40 g m−2 and 213.54 ± 5.91 g m−2, respectively. The AM treatment also significantly enhanced the soil TN content (p < 0.05), with a 64.70% increase relative to the control, whereas the IM treatment had no significant effect on the TN content (p > 0.05). A significant enhancement in soil C and N mineralization capacity was also observed in both the AM and IM treatments (p < 0.05; Figure 3f). Moreover, the increase was much more pronounced for net N mineralization, which exhibited a 7.56- to 8.43-fold increase over the control, compared with only a 1.10- to 1.34-fold increase for C mineralization.

3.3. Organic Matter Component Characteristics

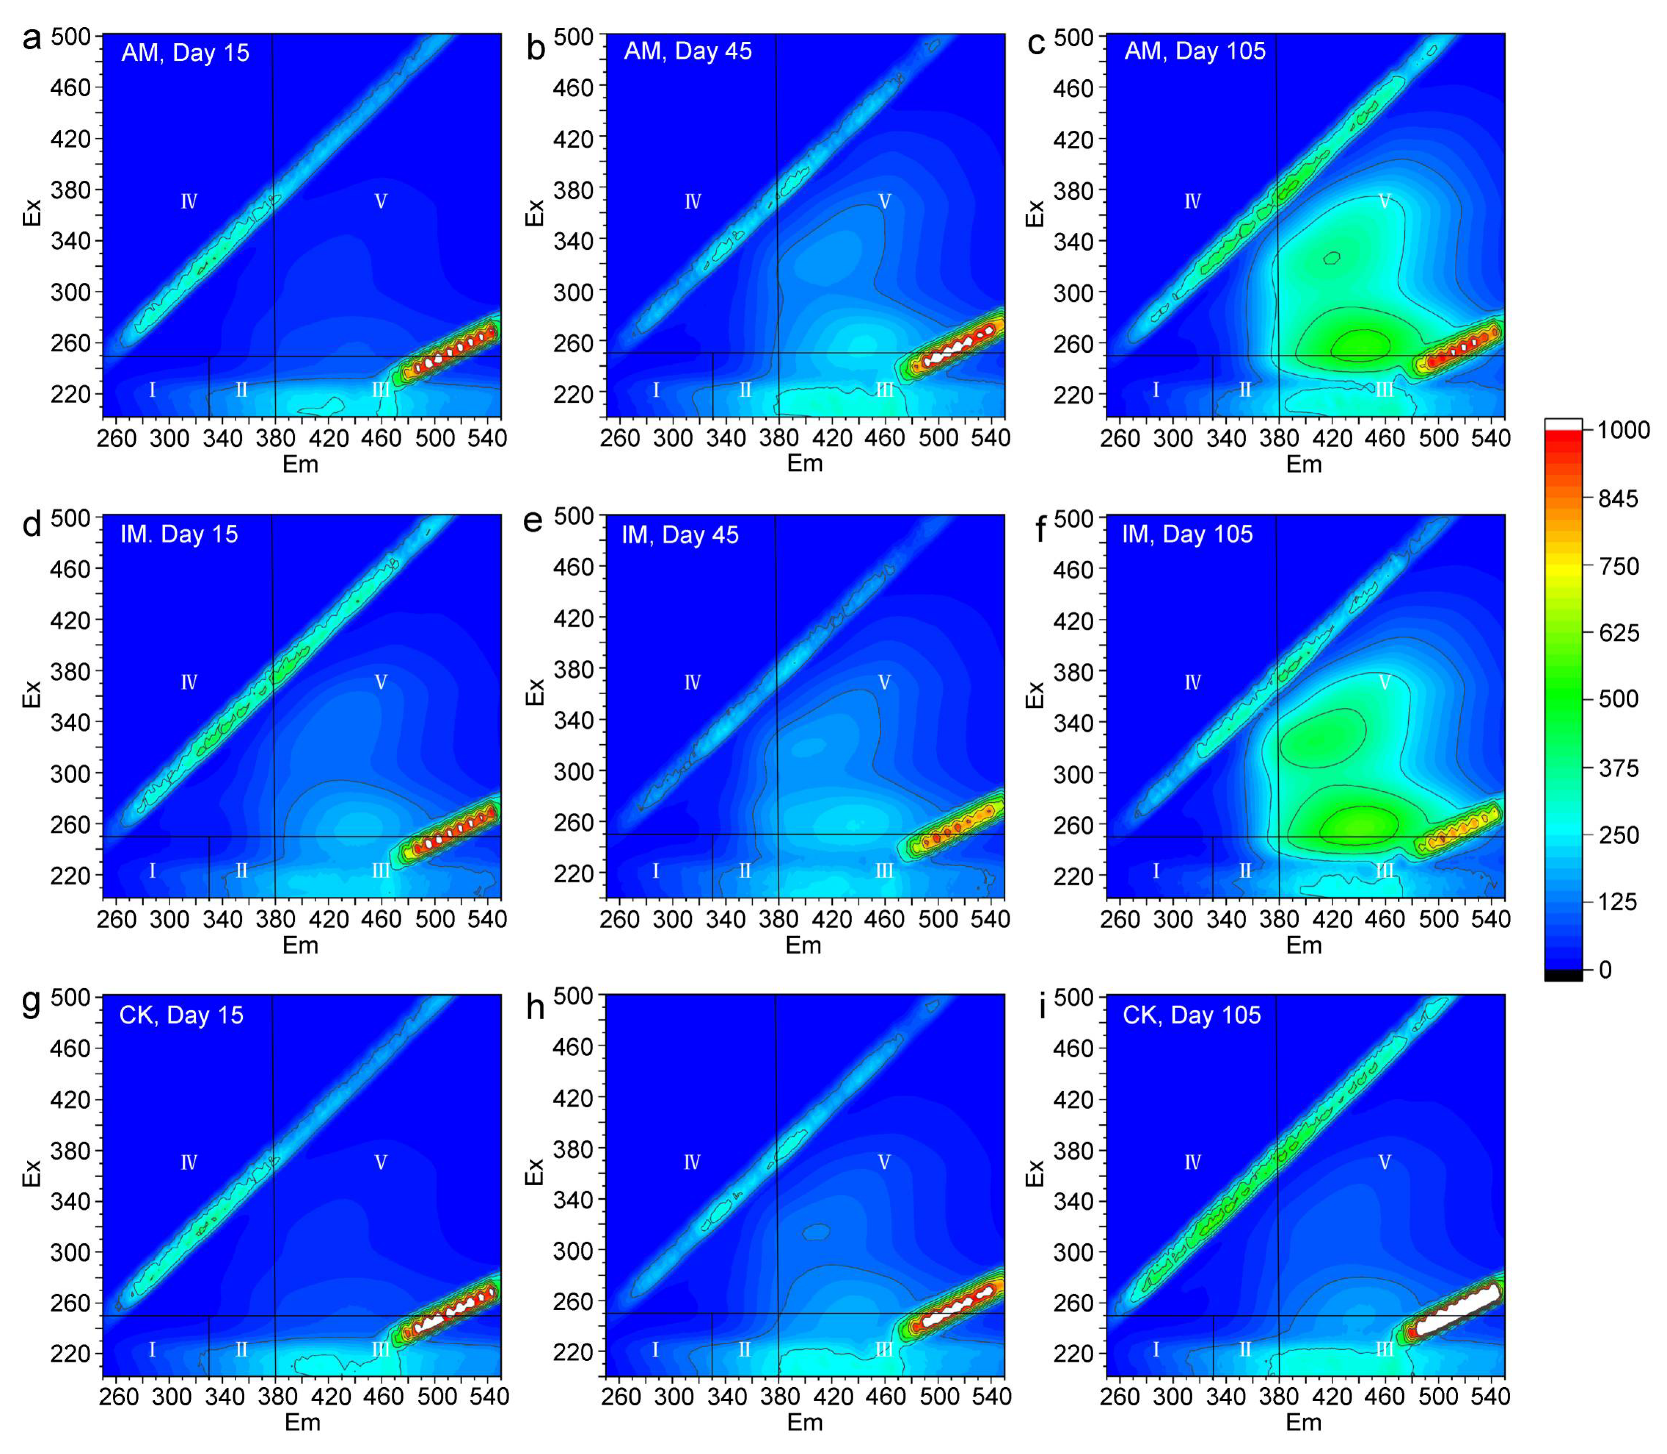
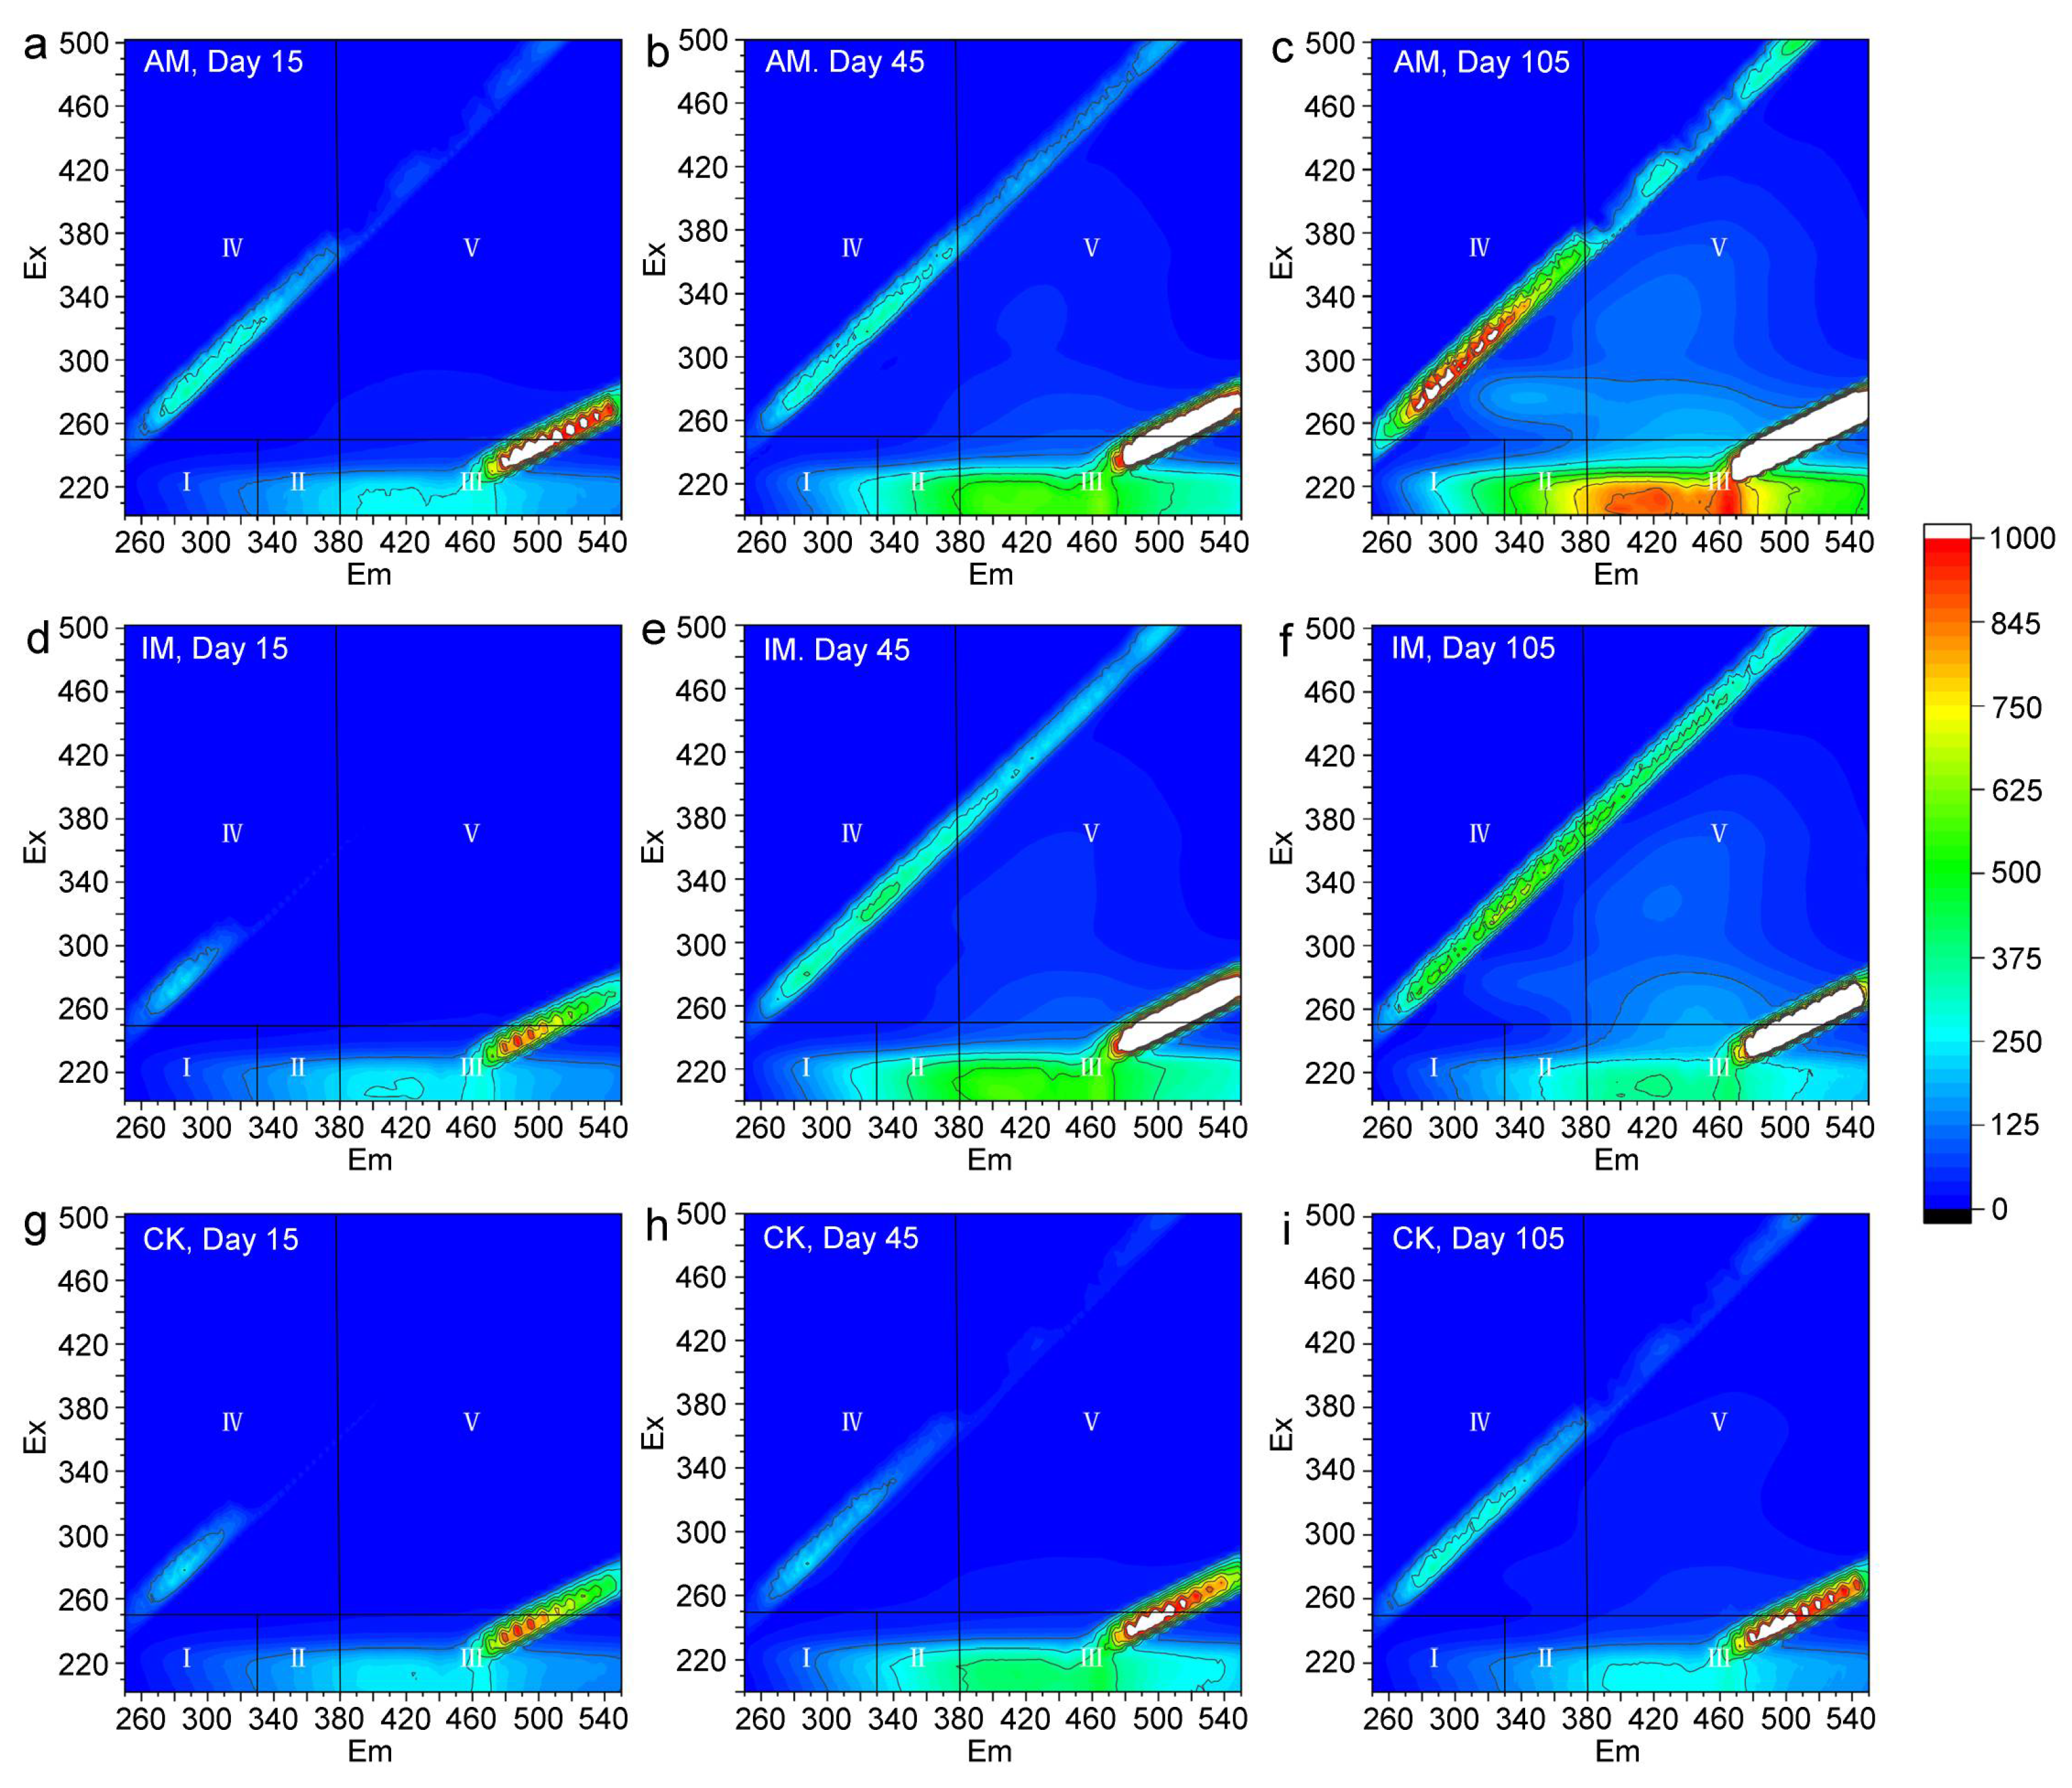
Three-dimensional fluorescence spectroscopy analysis revealed that the fluorescence spectral characteristics of DOM in the 0–2 cm soil layer were relatively similar between both active and inactivated microalgae treatments. On day 15, yellow-green fluorescence signals were predominantly concentrated in region III (the humic acid-like region) and adjacent areas (Figure 4a,d), indicating the presence of a certain amount of complex organic matter derived from algal metabolism. By day 45, the fluorescence signals had intensified and spread over a broader spectral range, indicating an increase in the complexity of DOM (Figure 4b,e). On day 105, a distinct high-intensity fluorescence zone emerged in regions III and V (the fulvic acid-like fluorescence region), demonstrating a significant advancement in the humification degree of DOM (Figure 4c,f). In contrast, in the control soils, DOM fluorescence signals remained consistently confined to low-intensity blue to blue-green regions throughout the incubation period, with only a very weak fluorescence signal observed in region III (Figure 4g–i).
In the subsurface soil layer (2–8 cm), the fluorescence characteristics of DOM in both the AM and IM treatments were generally consistent with those in the surface layer (0–2 cm) on days 15 and 45 (Figure 5a,b,d,e). However, by day 105, the yellow-green to orange fluorescence region (region III) in the AM treatment had expanded further, whereas the intensity of the high fluorescence signals within region III declined compared with day 45 in the IM treatment (Figure 5c,f). Throughout the incubation, fluorescence signals in the CK treatment remained similar to those in the surface soil, confined mainly to low-intensity blue regions, with only very weak fluorescence detectable in region III (Figure 5g–i).
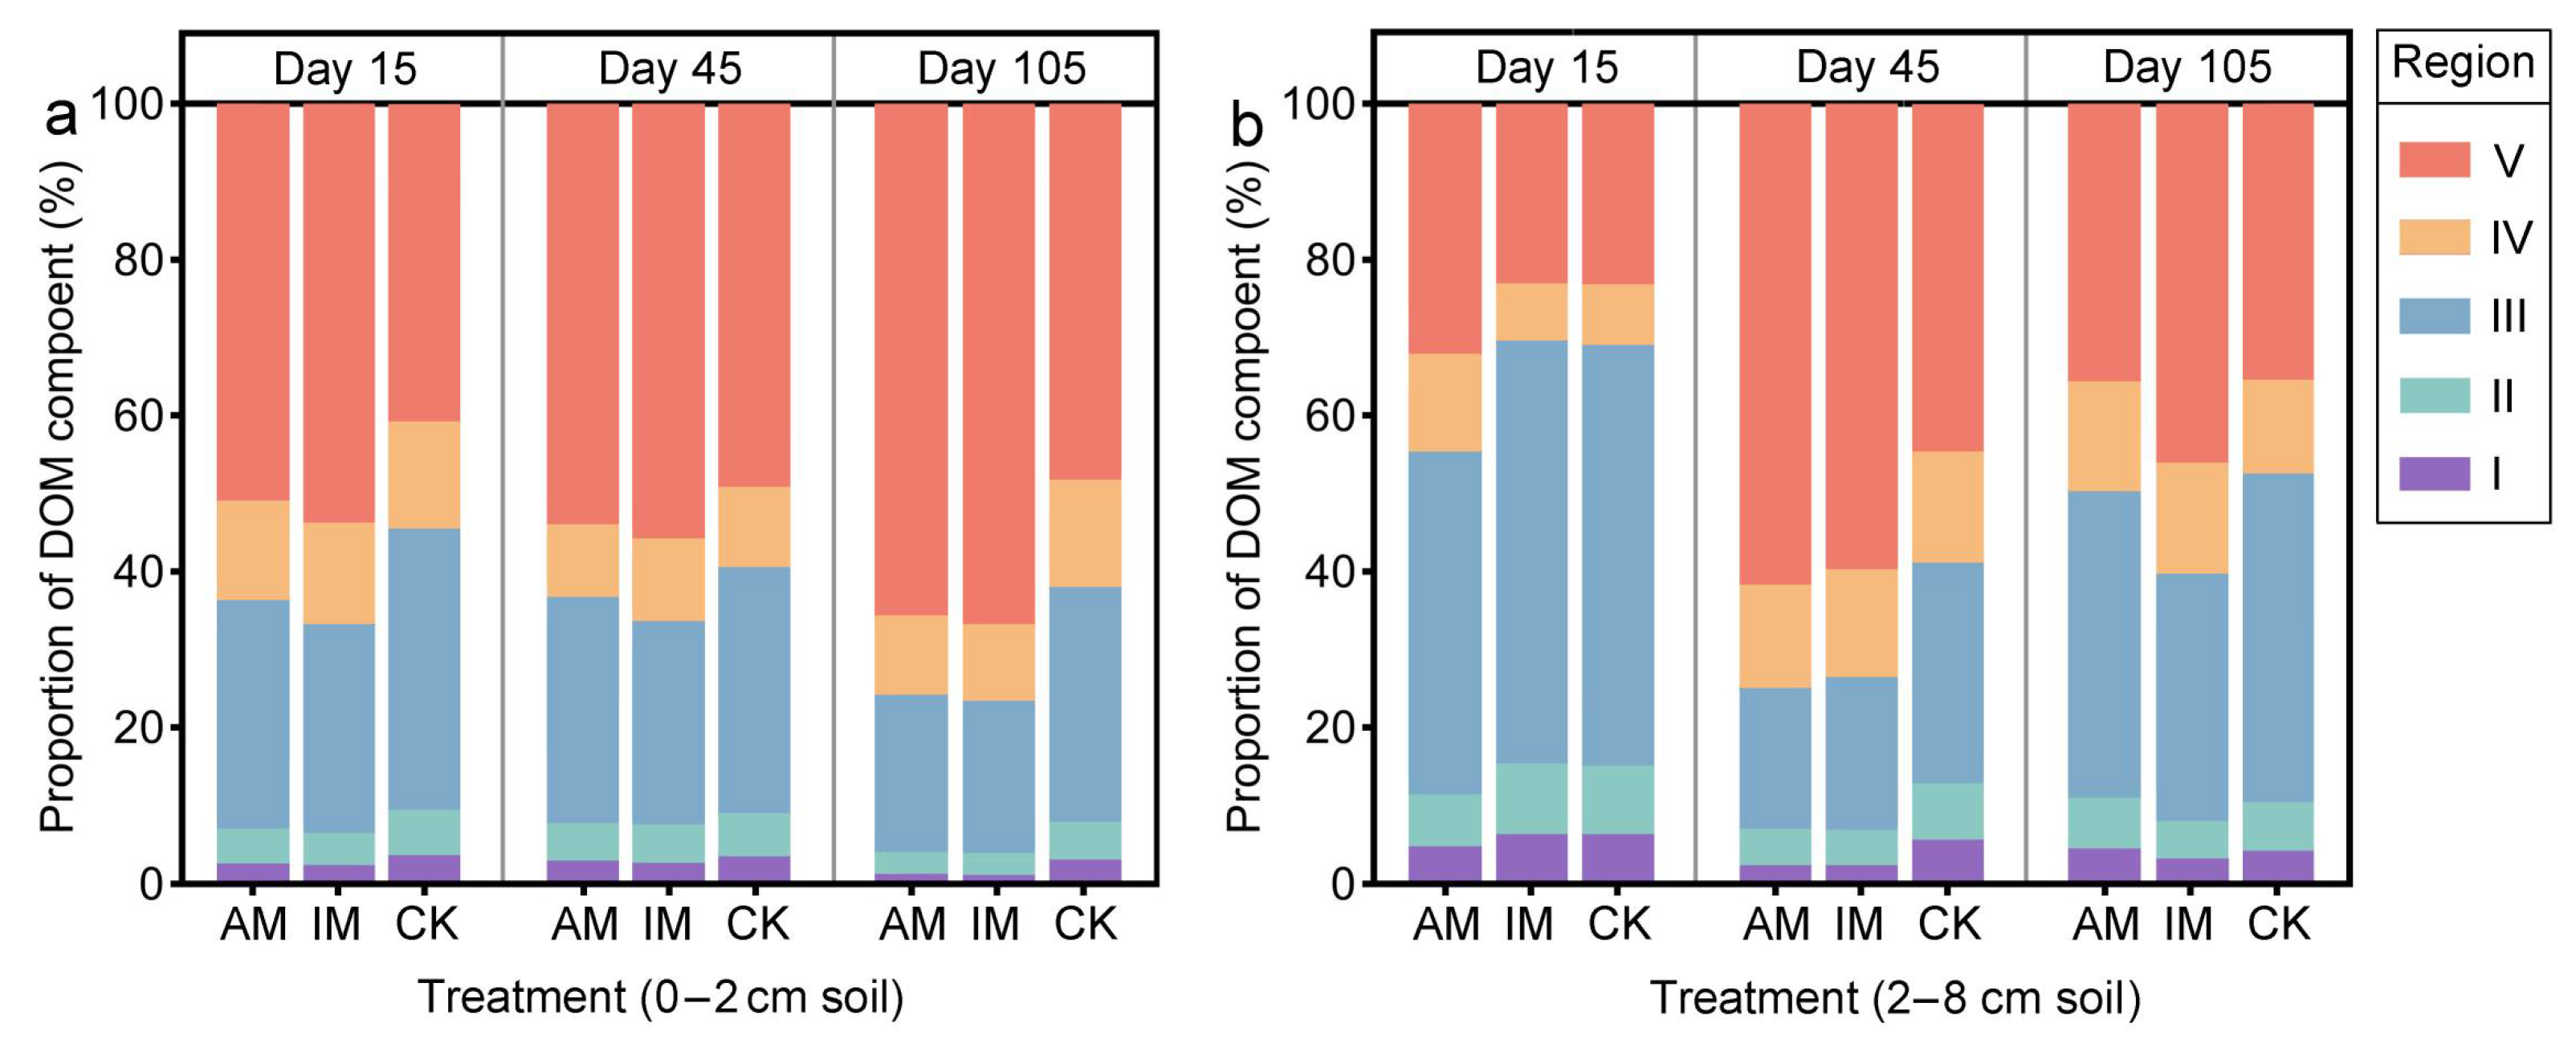
The relative abundances of different fluorescent components were quantified using the regional integration method (Figure 6a,b). The results showed that in the 0–2 cm and 2–8 cm soil layers, the proportions of components in region V were the highest, followed by region III, and both were significantly higher than those in other regions (p < 0.05). Compared with the CK (I: 3.10–3.71%; IV: 10.43–13.82%; V: 40.77–48.29%), both AM and IM treatments reduced the proportions of components in regions I (AM: 1.28–2.97%; IM: 1.16–2.65%) and IV (AM: 9.49–12.83%; IM: 9.79–13.05%), while increasing those in region V (AM: 50.91–65.70%; IM: 53.74–63.78%) within the 0–2 cm soil layer. With increasing incubation time, the proportions of components in regions I and IV generally decreased, whereas the proportion in region V continuously increased. These changes were more pronounced on day 105 than on day 45. In the 2–8 cm layer, the proportions of components in regions I–III (26.47–69.91%) were generally higher, while those in region V (22.94–61.71%) were relatively lower compared with the surface layer (I–III: 23.43–45.40%; V: 40.77–66.78%). Throughout the incubation, regions I and II showed an overall decreasing trend in proportion. Region III decreased initially and then increased, whereas region V showed an opposite pattern, increasing first and then decreasing.

3.4. Relationship Between C/N and Soil Properties

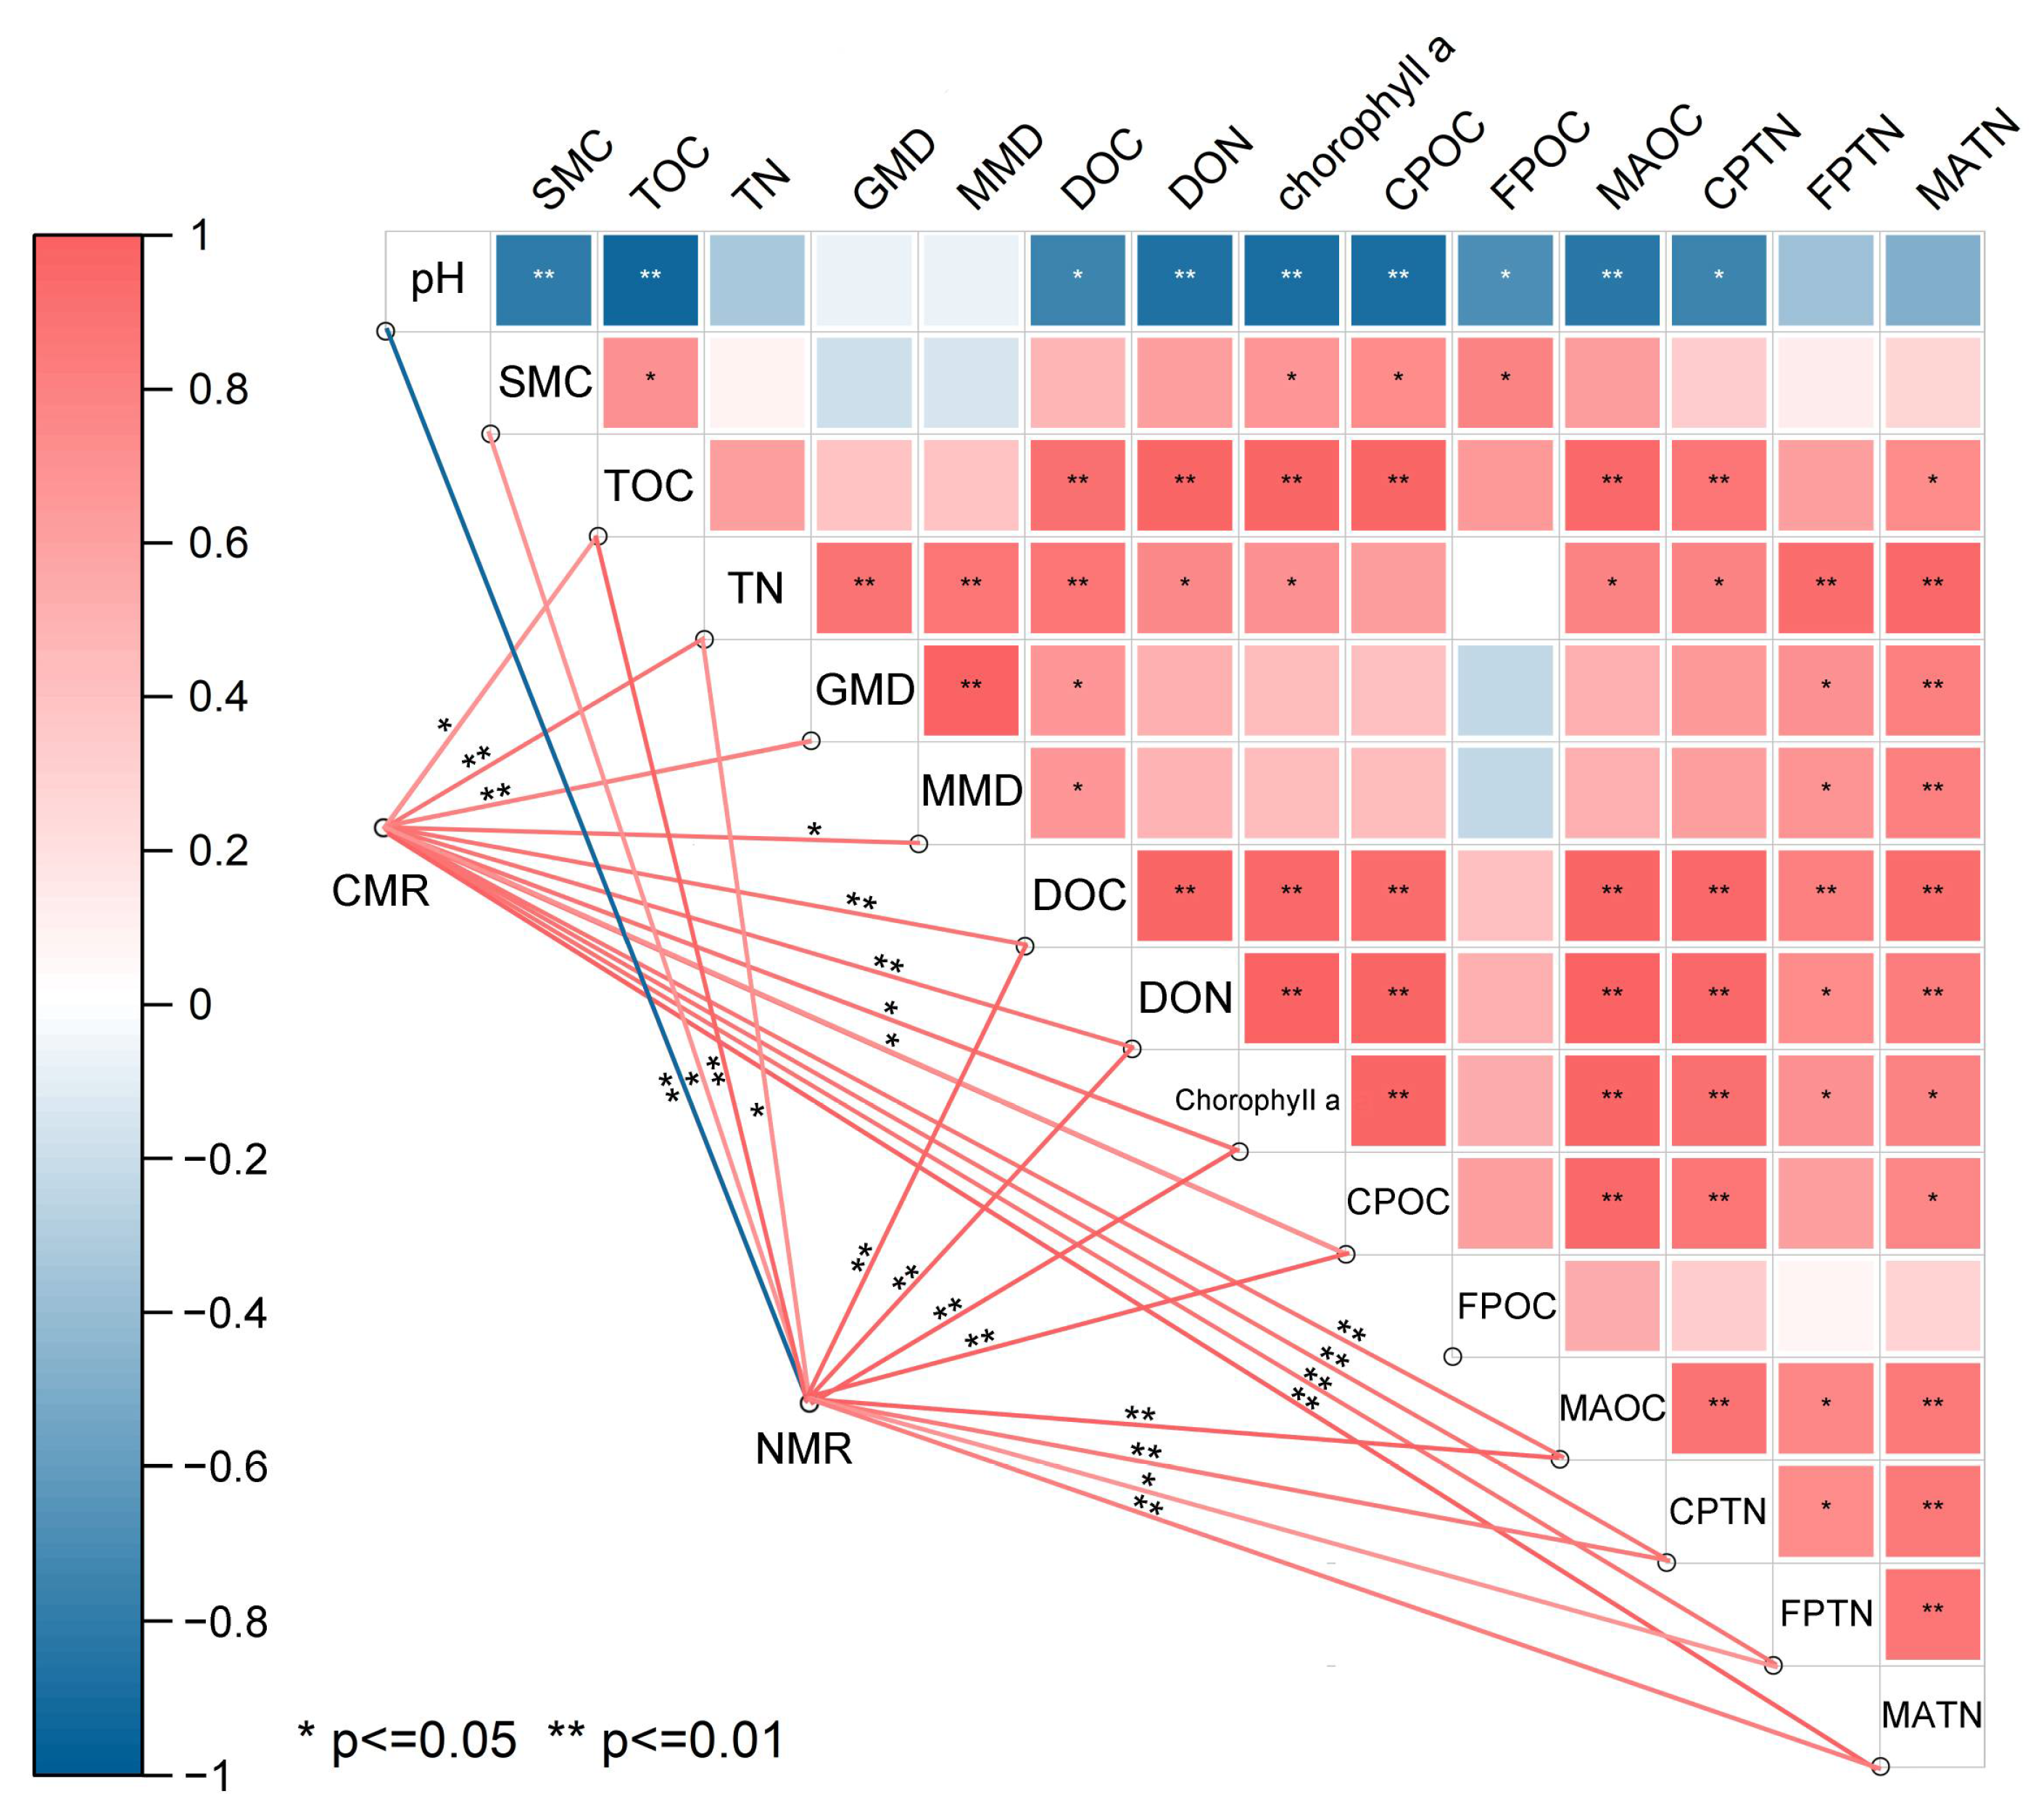
The CMR was highly significantly positively correlated with TN, GMD, DOC, DON, MAOC, CPTN, FPTN, and MATN (p < 0.01) and significantly positively correlated with TOC, MMD, chlorophyll a, and CPOC (p < 0.05) (Figure 7). The NMR showed a highly significant negative correlation with pH (p < 0.01). Positive correlations were observed with multiple parameters: highly significant with TOC, DOC, DON, chlorophyll a, CPOC, MAOC, CPTN, and MATN (p < 0.01) and significant with SMC, TN, and FPTN (p < 0.05). pH exhibited a highly significant negative correlation with SMC, TC, DON, chlorophyll a, CPOC, and MAOC (p < 0.01) and a significant negative correlation with DOC, FPOC, and CPTN (p < 0.05). SMC was significantly positively correlated with TC, chlorophyll a, CPOC, and FPOC (p < 0.05). Highly significant positive correlations were observed among TOC, DOC, and MAOC (p < 0.01). Chlorophyll a was highly significantly positively correlated with TC, DOC, DON, CPOC, MAOC, and CPTN (p < 0.01). Significant positive correlations were also observed with TN, FPTN, and MATN (p < 0.05). Significant correlations were also observed among the different N form indicators (TN, DON, CPTN, FPTN, MATN, and NMR). Highly significant positive correlations were found between TN and FPTN/MATN; DON and CPTN/MATN/NMR; CPTN and MATN/NMR; and MATN and FPTN/NMR (p < 0.01). Except for FPOC, which showed no significant correlations with other indicators, highly significant or significant positive correlations were consistently observed among the different C and N form indicators, including TC with TN and TC with FPTN.

4. Discussion

4.1. Effects of Microalgae Application on Soil Properties

Previous research has indicated that microalgae can reduce the pH of alkaline soils, which is closely associated with the effect of EPS secreted by microalgae [37]. For example, Song et al. [9] and Li et al. [10] both conducted potting experiments and found that the application of microalgal fertilizers led to a significant decrease in soil pH in potted tomato. In this study, after 105 days of incubation, compared with the CK (8.47 ± 0.06), both AM (7.94 ± 0.09) and IM (7.75 ± 0.16) treatments significantly reduced soil pH. Microalgal EPS are high-molecular-weight compounds composed of polysaccharides, proteins, lipids, and nucleic acids [38]. These compounds contain acidic functional groups, including carboxyl and sulfate groups, which can directly release protons into the soil solution. The released H+ then neutralizes OH ions, thereby reducing the pH of the alkaline soil [39]. Inactivated microalgae may influence soil pH through two other potential pathways: directly via the release of organic substances during cell lysis and indirectly by regulating soil microbial activity. The released polysaccharides, proteins, and other compounds provide carbon and nitrogen sources for microorganisms. The generation of metabolic acidic substances during microbial decomposition of these organic materials was likely responsible for the pH decrease observed in the IM treatment. The higher initial input of labile organic matter in the IM treatment (Figure 3a) likely stimulated the growth of indigenous soil algae only (Figure 2f), whereas in the AM treatment, the exogenous microalgae remained alive and kept growing throughout the entire incubation period. These differences in initial organic input, microbial biomass, and community structure may explain the distinct patterns of soil pH change. In contrast, the decrease in pH was more pronounced in the IM treatment, indicating a likely stronger effect of the release and decomposition of intracellular organic substances.
Active microalgae primarily promoted the formation of large aggregates through the continuous secretion of EPS. In contrast, inactivated microalgae mainly enhanced soil particle adhesion by releasing binding substances during cell lysis, which, in conjunction with EPS produced by soil microbial activity, preferentially led to the formation of small macro-aggregates (2–0.25 mm) and large micro-aggregates (0.25–0.05 mm) (Figure 2c,d). Although the AM treatment resulted in a higher number of large macro-aggregates and greater MWD and GMD, the moisture content was lower in the AM treatment compared with the IM treatment. This reduction might be attributed to the water consumption by active microalgae growth, which partially offsets the water retention benefits from structural improvements. Nevertheless, both AM and IM applications significantly contributed to soil structural amelioration, which holds profound implications for the restoration of the degraded soil. This improvement facilitates water infiltration and retention, thereby creating more favorable moisture conditions for microbial communities and plant root development. Moreover, the stabilized aggregate structure enhances soil resistance to erosion and reduces nutrient loss. For example, simulated rainfall experiments conducted on loess slopes demonstrated that although algal crusts increased runoff by 21.64%, they effectively reduced sediment yield by 94.6% [40]. Notably, even after the crusts were disrupted, a significant reduction in sediment yield (16.18%) was still observed. Wu et al. [41] reported that under a typical continental monsoon climate in Inner Mongolia, China, soil moisture content increased with crust age on aeolian sandy soil and salt meadow soil, which contrasts with our results. This difference may be due to their longer experimental duration (0–7 years) and field-based conditions, whereas our study was conducted over several months under controlled indoor conditions. Over longer time scales, microalgae in the soil become well-established, improve soil structure, and enhance soil moisture retention; in contrast, during the early stages of colonization, microalgae growth may instead consume soil moisture, leading to a temporary decline in water content.

4.2. Effects of Microalgae on Soil C and N Accumulation

Microalgae (Chlorella ZJ) fix atmospheric CO2 directly via photosynthesis, converting it into their own biomass components, such as polysaccharides and lipids. They also secrete substantial amounts of EPS, thereby introducing active organic carbon into the soil matrix [42,43]. Correlation analyses further revealed highly significant positive relationships between soil chlorophyll a content and TOC, DOC, and MAOC. These findings suggest that microbial biomass, along with microalgae metabolic products and residues, might be important contributors to newly formed soil C. Beyond directly elevating organic carbon, the input of microalgae stimulated microbial activities, which converted labile C into more stable microbial biomass C via the “microbial carbon pump” effect [44]. This shift toward stabilization was supported by the results of three-dimensional fluorescence spectroscopy analysis, which revealed a marked increase in the humification degree of SOM after 105 days of incubation, confirming the role of microalgae in forming more complex and stable organic compounds. Furthermore, organic matter accumulation promoted the formation of large macro-aggregates, within which a portion of the organic C was associated with mineral particles. These physical and chemical protection mechanisms are critical for the long-term stability of SOC.
Similar to C accumulation, the diazotrophic microalgae Anabaena azotica could directly convert atmospheric N into ammonium and other bioavailable forms, which were subsequently assimilated into amino acids, proteins, and other essential biomolecules, thereby increasing the soil N content. However, after inactivation, the IM treatment lost its N-fixing capacity, resulting in only a very small increase in soil N after incubation, with values approaching those of the CK (Figure 3e). This discrepancy might be attributed to the ability of indigenous soil microorganisms to efficiently utilize nutrients released from inactivated microalgae and convert them into stable organic C forms, even in the absence of active microalgae. In contrast, biological N fixation in soil relies more strongly on the functional activity of specific N-fixing microorganisms [45]. Although the IM treatment supplied an initial amount of nitrogen through the added biomass, the inherent N-fixing capacity of the indigenous soil microbial community remained limited.

4.3. Influences of Microalgae on the Potential of Soil C and N Transformation

Microalgae application, whether active or inactivated, significantly increased the pools of both labile C and N (DOC, DON, POC, and PON) and stable C and N (MAOC and MAON) (Figure 3). As previously discussed, this phenomenon was primarily attributed to the series of soil biochemical processes triggered by the input of microalgal biomass. Microalgal cells, regardless of their activity, constituted a rich source of organic matter, and their addition directly supplied substantial amounts of readily decomposable DOC, DON, POC, and PON to the soil. Moreover, the formation of MAOC and MAON is primarily driven by DOC and DON, as their development largely depends on the diffusion of DOM into mineral matrices [46]. Furthermore, these exogenous organic inputs strongly stimulated the growth and activity of indigenous soil microorganisms. Following microbial cell death, microbial residues (e.g., cell wall fragments and metabolic byproducts) could form strong associations with soil mineral surfaces via hydrogen bonding, ionic interactions, and other forces, owing to their specific chemical composition and physical structure. These processes efficiently stabilized MAOC and MAON in the soil. At the early stage of incubation, the IM treatment exhibited an even higher DOC content than the AM treatment. This difference likely resulted from the immediate lysis of algal cells caused by the inactivation process, which rapidly released a large amount of intracellular soluble compounds (e.g., sugars, proteins, and organic acids) into the soil, causing a pronounced peak in the DOC pool. In contrast, active microalgae not only utilized DOC for their own growth but also stimulated the native soil microorganisms, enhancing DOC consumption and consequently leading to lower net DOC accumulation in the early stage.
It is noteworthy that observable differences were found in the dynamics of soil C and N transformations (Figure 3a,b). The DOC content in both the AM and the IM treatments increased continuously throughout the 105-day incubation, whereas DON showed a considerably smaller relative increase on days 15 and 45 compared with C, followed by a marked rise on day 105. This phenomenon could be attributed to the differences in microbial utilization and transformation pathways for C and N [47]. During the initial incubation phase, microorganisms rapidly assimilated abundant readily degradable organic C sources (e.g., carbohydrates) in the soil. Metabolic byproducts from these activities accumulated in the soil as DOC, leading to its sustained increase. In contrast, although N-containing substrates such as proteins were introduced, they were strongly immobilized by microorganisms in the early stage, being incorporated into microbial biomass for growth and anabolic processes. Only in the later incubation stage, following the succession of microbial communities, was the earlier assimilated N mineralized and released in forms associated with microbial residues, as reflected by the pronounced increase in DON content.
Furthermore, after 105 days of incubation, the effects of the IM and AM treatments on soil N mineralization were more pronounced than those on C mineralization (Figure 3f). Microbial growth consumed labile organic C, leaving DOC predominantly composed of chemically stable and biologically less available components (e.g., complex extracellular polymeric substances or partially recalcitrant cellular constituents), which were not readily decomposed to CO2 in the short term. The accumulation of DON in the soil primarily originated from microalgal residues and the re-release of assimilated N from earlier microbial activities. This stage was characterized by intense mineralization, during which substantial amounts of organic N were rapidly converted into inorganic forms through microbial processes.

4.4. Environmental Implications

Based on the results of this study, the application of both active and inactivated microalgae demonstrated significant potential for soil amelioration. Compared with traditional soil amelioration methods, the effectiveness of microalgae fertilizer in enhancing soil nutrients may be relatively lower. For example, a study on amendments applied to cultivated purple soil (which contained a higher baseline nutrient content) in the same region reported that the net increases in TOC and TN achieved by organic materials (e.g., bio-organic fertilizer) were 3.95–13.21 g kg−1 and 0.13–0.86 g kg−1, respectively. In our study, however, the corresponding values were substantially lower, ranging from 2.56–2.60 g kg−1 for TOC and 0.018–0.036 g kg−1 for TN [48]. Nevertheless, the microalgae amendment offers distinct advantages that extend beyond mere nutrient enhancement. The microalgae used in this study were a byproduct of an integrated biorefinery process. Specifically, they were cultivated to capture CO2 from power plants; the resulting biomass was utilized to produce high-value health products, while the residual algal liquid was applied for soil amelioration. The cost of this residual microalgal liquid gives it a price advantage over traditional chemical fertilizers, as it is often regarded as a waste liquor.
Microalgae can simultaneously enhance the content of both labile and stable fractions of C and N in the degraded purple soil. Moreover, the temporal discrepancy in the transformation of C and N fractions during the remediation process highlights the need to design rational nutrient management strategies to synergistically improve utilization efficiency and mitigate environmental risks. Although microalgae application significantly enhanced the C and N contents in degraded purple soil, the initial levels were so low that the final contents remained relatively low and were still classified as ‘poor’ according to Chinese soil standards [49]. Therefore, relying solely on microalgae remediation is unlikely to achieve a fundamental improvement in soil quality within a short timeframe. Future research should focus on long-term and systematic studies to explore synergistic remediation approaches that integrate microalgae with phytoremediation and/or organic amendments (e.g., compost). In addition, while significant improvements in soil nutrients were observed in this controlled incubation study, the effectiveness under real field conditions may vary due to complex environmental factors, such as climate variability, soil heterogeneity, and microbial competition. Further validation via field-scale trials and long-term experiments is needed to assess the scalability and practical feasibility of applying microalgae for restoration in degraded soil ecosystems.

5. Conclusions

This study demonstrates that the application of both active and inactivated microalgae effectively ameliorates the physicochemical properties of degraded purple soil and enhances soil organic carbon and nitrogen accumulation. Microalgae significantly reduced soil pH, improved moisture retention and aggregate structure, and substantially increased soil C and N pools (including both labile and stable fractions). These enhancements were likely attributable to their effects on soil microbial metabolism and the contribution of cellular products. Soil amended with active microalgae exhibited increasing complexity and humification in its DOM over the incubation period. However, despite observing significant improvements in nutrient status, the absolute contents of C and N in the treated soil remained at relatively low levels. Moreover, it should be acknowledged that these findings are based on a short-term laboratory incubation. Further research is needed to explore the long-term effects of microalgae and their combined application with other remediation technologies. Furthermore, to gain a deeper mechanistic understanding, studies at the micro-scale (e.g., molecular level) are essential to elucidate the specific biochemical processes governing carbon and nitrogen transformations mediated by microalgae.
In conclusion, this study provides a viable and effective pathway that can be considered for a sustainable, integrated approach to addressing environmental challenges. From a socioeconomic perspective, utilizing microalgae that capture CO2 (e.g., from the exhaust gas of power plants) for soil remediation creates a synergistic circular model: it transforms the cost and C liability of emissions treatment into a valuable soil amendment, potentially reducing dependency on synthetic fertilizers and lowering remediation costs. Our work elucidates the specific pathways through which microalgae enhance soil C and N pools, validating their role not only in C sequestration but also in improving soil health and fertility. By bridging C capture with soil restoration, this research demonstrates a practical and closed-loop strategy that contributes to climate change mitigation and land degradation neutrality, aligning with integrated sustainable development goals.

Author Contributions

Conceptualization, B.H. and X.J.; methodology, J.C. (Jiong Cheng); software, J.C. (Jun Cheng); validation, J.C. (Jiong Cheng), J.C. (Jun Cheng), T.Z. and L.C.; investigation, X.Z.; data curation, X.J.; writing—original draft preparation, X.Z.; writing—review and editing, J.C. (Jiong Cheng), B.H., and X.J.; visualization, X.Z.; supervision, X.J.; funding acquisition, X.Z., B.H., and X.J. All authors have read and agreed to the published version of the manuscript.

Funding

This study was supported by the National Key Research and Development Program of China (2024YFB4106505), the Guangdong Basic and Applied Basic Research Foundation (2025A1515010758), the National Natural Science Foundation of China (42177343 and 42577403), and the Guangdong Foundation for Program of Science and Technology Research (Grant No. 2023B1212060044).

Data Availability Statement

Data are contained within the article.

Conflicts of Interest

Author Tiancheng Zhou was employed by the company Guangdong Energy Group Science and Technology Research Institute Co., Ltd. The remaining authors declare that the research was conducted in the absence of any commercial or financial relationships that could be construed as a potential conflict of interest.

Abbreviations

AbbreviationFull term
AMactive microalga
IMinactive microalga
SMCsoil moisture content
DOCdissolved organic carbon
DONdissolved organic nitrogen
DOMdissolved organic matter
TOCtotal organic carbon
TNtotal nitrogen
POCparticulate organic carbon
CPOCcoarse particulate organic carbon
FPOCfine particulate organic carbon
MAOCmineral-associated organic carbon
SONsoil organic nitrogen
PTNparticulate total nitrogen
CPTNcoarse particulate total nitrogen
FPTNfine particulate total nitrogen
MATNmineral-associated total nitrogen
EPSextracellular polymeric substances
BDbulk density
ECelectrical conductivity
SARsodium adsorption ratio
ESPexchangeable sodium percentage
CMRC mineralization rate
NMRnet N mineralization rate
CKcontrol

References

  1. Li, R.; Hu, W.; Jia, Z.; Liu, H.; Zhang, C.; Huang, B.; Yang, S.; Zhao, Y.; Zhao, Y.; Shulka, M.J.; et al. Soil degradation: A global threat to sustainable use of black soils. Pedosphere 2025, 35, 264–279. [Google Scholar] [CrossRef] [Scilit]
  2. Ball, B.C.; Batey, T.; Munkholm, L.J. Field assessment of soil structural quality—A development of the Peerlkamp test. Soil Use Manag. 2007, 23, 329–337. [Google Scholar] [CrossRef] [Scilit]
  3. Karlen, D.L.; Rice, C.W. Soil degradation: Will humankind ever learn? Sustainability 2015, 7, 12490–12501. [Google Scholar] [CrossRef] [Scilit]
  4. Lal, R. Restoring soil quality to mitigate soil degradation. Sustainability 2015, 7, 5875–5895. [Google Scholar] [CrossRef] [Scilit]
  5. Hussain, S.; Hussain, S.; Guo, R.; Sarwar, M.; Ren, X.; Krstic, D.; Aslam, Z.; Zulifqar, U.; Rauf, A.; Hano, C.; et al. Carbon sequestration to avoid soil degradation: A review on the role of conservation tillage. Plants 2021, 10, 2001. [Google Scholar] [CrossRef] [Scilit]
  6. Diop, M.; Chirinda, N.; Beniaich, A.; El Gharous, M.; El Mejahed, K. Soil and water conservation in Africa: State of play and potential role in tackling soil degradation and building soil health in agricultural lands. Sustainability 2022, 14, 13425. [Google Scholar] [CrossRef] [Scilit]
  7. Song, X.; Bo, Y.; Feng, Y.; Tan, Y.; Zhou, C.; Yan, X.; Ruan, R.; Cheng, P. Potential applications for multifunctional microalgae in soil improvement. Front. Environ. Sci. 2022, 10, 1035332. [Google Scholar] [CrossRef] [Scilit]
  8. Zhang, S.; Wang, L.; Wei, W.; Hu, J.; Mei, S.; Zhao, Q.; Tsang, Y. Enhanced roles of biochar and organic fertilizer in microalgae for soil carbon sink. Biodegradation 2018, 29, 313–321. [Google Scholar] [CrossRef] [Scilit]
  9. Song, X.; Liu, J.; Feng, Y.; Zhou, C.; Li, X.; Yan, X.; Cheng, P. Microalgae-based biofertilizers improve fertility and microbial community structures in the soil of potted tomato. Front. Plant Sci. 2024, 15, 1461945. [Google Scholar] [CrossRef] [Scilit] [PubMed]
  10. Li, C.; Liang, Y.; Miao, Q.; Ji, X.; Duan, P.; Quan, D. The influence of microalgae fertilizer on soil water conservation and Soil improvement: Yield and quality of potted tomatoes. Agronomy 2024, 14, 2102. [Google Scholar] [CrossRef] [Scilit]
  11. Zhang, Z.; Xu, M.; Fan, Y.; Wang, H. Using microalgae to reduce the use of conventional fertilizers in hydroponics and soil-based cultivation. Sci. Total Environ. 2024, 912, 169424. [Google Scholar] [CrossRef] [Scilit] [PubMed]
  12. Diederich, K.M.; Ruark, M.D.; Krishnan, K.; Arriaga, F.J.; Silva, E.M. Increasing labile soil carbon and nitrogen fractions require a change in system, rather than practice. Soil Sci. Soc. Am. J. 2019, 83, 1733–1745. [Google Scholar] [CrossRef] [Scilit]
  13. Rothlisberger-Lewis, K.L.; Foster, J.L.; Hons, F.M. Soil carbon and nitrogen dynamics as affected by lipid-extracted algae application. Geoderma 2016, 262, 140–146. [Google Scholar] [CrossRef] [Scilit]
  14. Lange, M.; Eisenhauer, N.; Sierra, C.A.; Bessler, H.; Engels, C.; Griffiths, R.I.; Mellado-vázquez, P.G.; Malik, A.A.; Roy, J.; Scheu, S.; et al. Plant diversity increases soil microbial activity and soil carbon storage. Nat. Commun. 2015, 6, 6707. [Google Scholar] [CrossRef] [Scilit]
  15. Van Groenigen, J.W.; Huygens, D.; Boeckx, P.; Kuyper, T.W.; Lubbers, I.M.; Rütting, T.; Groffman, P.M. The soil N cycle: New insights and key challenges. Soil 2015, 1, 235–256. [Google Scholar] [CrossRef] [Scilit]
  16. Li, M.; Wang, J.; Guo, D.; Yang, R.; Fu, H. Effect of land management practices on the concentration of dissolved organic matter in soil: A meta-analysis. Geoderma 2019, 344, 74–81. [Google Scholar] [CrossRef] [Scilit]
  17. Montaño, N.M.; García-Oliva, F.; Jaramillo, V.J. Dissolved organic carbon affects soil microbial activity and nitrogen dynamics in a Mexican tropical deciduous forest. Plant Soil 2007, 295, 265–277. [Google Scholar] [CrossRef] [Scilit]
  18. Gautam, A.; Guzman, J.; Kumar, S. Manure and inorganic fertilization impacts on soil nutrients, aggregate stability, and organic carbon and nitrogen in different aggregate fractions. Arch. Agron. Soil Sci. 2022, 68, 1261–1273. [Google Scholar] [CrossRef] [Scilit]
  19. Oliva, R.L.; Khadka, U.B.; Camenzind, T.; Dyckmans, J.; Joergensen, R.G. Constituent of extracellular polymeric substances (EPS) produced by a range of soil bacteria and fungi. BMC Microbiol. 2025, 25, 298. [Google Scholar] [CrossRef] [Scilit]
  20. Pirt, S.J.; Lee, Y.K.; Richmond, A.; Pirt, M.W. The photosynthetic efficiency of Chlorella JZ biomass growth with reference to solar energy utilisation. J. Chem. Technol. Biot. 1980, 30, 25–34. [Google Scholar] [CrossRef] [Scilit]
  21. Bothe, H.; Schmitz, O.; Yates, M.G.; Newton, W.E. Nitrogenases and hydrogenases in cyanobacteria. In Bioenergetic Processes of Cyanobacteria: From Evolutionary Singularity to Ecological Diversity; Springer: Dordrecht, The Netherlands, 2011; pp. 137–157. [Google Scholar]
  22. Chen, J.; Yu, S.; Fu, J.; Xu, G.; Yu, B.; Lai, X.; Hu, S.; Zhang, K.; Liu, J. Soil quality characteristics and influencing factors of different land use in the red bed landform region of south China: Taking nanxiong basin as an example. Ecol. Environ. 2022, 31, 918. [Google Scholar]
  23. Schreiber, C.; Schiedung, H.; Harrison, L.; Briese, C.; Ackermann, B.; Kant, J.; Schrey, S.D.; Hofmann, D.; Singh, D.; Ebenhöh, O.; et al. Evaluating potential of green alga Chlorella vulgaris to accumulate phosphorus and to fertilize nutrient-poor soil substrates for crop plants. J. Appl. Phycol. 2018, 30, 2827–2836. [Google Scholar] [CrossRef] [Scilit]
  24. Parthiban, J.; Jambulingam, R. Enhancing the biodiesel production potential of Synechococcus elongatus and Anabaena cyanobacterial strain isolated from saline water using different media composition and organic carbon sources. Sustainability 2023, 15, 870. [Google Scholar] [CrossRef] [Scilit]
  25. Qin, H.; Li, S.; Li, D. An improved method for determining phytoplankton chlorophyll a concentration without filtration. Hydrobiologia 2013, 707, 81–95. [Google Scholar] [CrossRef] [Scilit]
  26. Si, F.; Chen, B.; Wang, B.; Li, W.; Zhu, C.; Fu, J.; Yu, B.; Xu, G. Soil Quality Assessment and Influencing Factors of Different Land Use Types in Red Bed Desertification Regions: A Case Study of Nanxiong, China. Land 2024, 13, 1265. [Google Scholar] [CrossRef] [Scilit]
  27. Sonmez, S.; Buyuktas, D.; Okturen, F.; Citak, S. Assessment of different soil to water ratios (1:1, 1:2.5, 1:5) in soil salinity studies. Geoderma 2008, 144, 361–369. [Google Scholar] [CrossRef] [Scilit]
  28. Zhou, W.; Song, C.; Sun, X.; Liu, Z.; Ni, X.; Shen, K.; Wang, Y.; Tian, L. Design of high-efficiency soil-returning liquid fertilizer deep-application furrow openers for improving furrowing performance in cold regions of Northeast China. Agriculture 2022, 12, 1286. [Google Scholar] [CrossRef] [Scilit]
  29. Suarez, D.L.; Wood, J.D.; Lesch, S.M. Effect of SAR on water infiltration under a sequential rain–irrigation management system. Agric. Water Manag. 2006, 86, 150–164. [Google Scholar] [CrossRef] [Scilit]
  30. Elliott, E.T. Aggregate Structure and Carbon, Nitrogen, and Phosphorus in Native and Cultivated Soils. Soil Sci. Soc. Am. J. 1986, 50, 627–633. [Google Scholar] [CrossRef] [Scilit]
  31. Nelson, D.W.; Sommers, L.E. Total carbon, organic carbon and organic matter. In Methods of Soil Analysis, Part 3, Chemical Methods; Soil Science Society of America Book Series; Sparks, D.L., Page, A.L., Helmke, P.A., Loeppert, R.H., Eds.; Soil Science Society of America: Madison, WI, USA, 2001; pp. 961–1010. [Google Scholar]
  32. Lu, R.K. Methods of Soil and Agrochemical Analysis; China Agricultural Science and Technology Press: Beijing, China, 2000. (In Chinese) [Google Scholar]
  33. Cambardella, C.; Elliott, E. Methods for physical separation and characterization of soil organic matter fractions. In Soil Structure/Soil Biota Interrelationships; Elsevier: Amsterdam, The Netherlands, 1993; pp. 449–457. [Google Scholar]
  34. Chen, W.; Westerhoff, P.; Leenheer, J.A.; Booksh, K. Fluorescence excitation− emission matrix regional integration to quantify spectra for dissolved organic matter. Environ. Sci. Technol. 2003, 37, 5701–5710. [Google Scholar] [CrossRef] [Scilit] [PubMed]
  35. Angers, D.A.; Recous, S. Decomposition of wheat straw and rye residues as affected by particle size. Plant Soil 1997, 189, 197–203. [Google Scholar] [CrossRef] [Scilit]
  36. Robertson, G.P.; David, C.C.B.; Caroline, S.B.; Philip, S. Standard Soil Methods for Long-Term Ecological Research; Oxford University Press: New York, NY, USA, 1999. [Google Scholar]
  37. Gonçalves, J.; Freitas, J.; Fernandes, I.; Silva, P. Microalgae as biofertilizers: A sustainable way to improve soil fertility and plant growth. Sustainability 2023, 15, 12413. [Google Scholar] [CrossRef] [Scilit]
  38. Xiao, R.; Zheng, Y. Overview of microalgal extracellular polymeric substances (EPS) and their applications. Biotechnol. Adv. 2016, 34, 1225–1244. [Google Scholar] [CrossRef] [Scilit]
  39. Stevenson, F.J.; Cole, M. Cycles of Soil: Carbon, Nitrogen, Phosphorus, Sulfur, Micronutrients, 2nd ed.; John Wiley and Sons: New York, NY, USA, 2000. [Google Scholar]
  40. Xu, H.H.; Zhang, B.Q.; Wang, J.F.; Wang, B. Effects of typical biological crusts on slope runoff and sediment load in Loess Plateau region. Bull. Soil Water Conserv. 2020, 40, 8–13. (In Chinese) [Google Scholar]
  41. Wu, Y.; Rao, B.; Wu, P.; Liu, Y.; Li, G.; Li, D. Development of artificially induced biological soil crusts in fields and their effects on top soil. Plant Soil 2013, 370, 115–124. [Google Scholar] [CrossRef] [Scilit]
  42. Ramakrishnan, B.; Maddela, N.R.; Venkateswarlu, K.; Megharaj, M. Potential of microalgae and cyanobacteria to improve soil health and agricultural productivity: A critical view. Environ. Sci. Adv. 2023, 2, 586–611. [Google Scholar] [CrossRef] [Scilit]
  43. Hu, J.; Guo, H.; Xue, Y.; Gao, M.; Zhang, S.; Tsang, Y.; Li, J.; Wang, L. Using a mixture of microalgae, biochar, and organic manure to increase the capacity of soil to act as carbon sink. J. Soil. Sediments 2019, 19, 3718–3727. [Google Scholar] [CrossRef] [Scilit]
  44. Marks, E.A.; Montero, O.; Rad, C. The biostimulating effects of viable microalgal cells applied to a calcareous soil: Increases in bacterial biomass, phosphorus scavenging, and precipitation of carbonates. Sci. Total Environ. 2019, 692, 784–790. [Google Scholar] [CrossRef] [Scilit] [PubMed]
  45. Xu, Y.; Wang, T.; Li, H.; Ren, C.; Chen, J.; Yang, G.; Han, X.; Feng, Y.; Ren, G.; Wang, X. Variations of soil nitrogen-fixing microorganism communities and nitrogen fractions in a Robinia pseudoacacia chronosequence on the Loess Plateau of China. Catena 2019, 174, 316–323. [Google Scholar] [CrossRef] [Scilit]
  46. Xu, Z.; Tsang, D.C.W. Mineral-mediated stability of organic carbon in soil and relevant interaction mechanisms. Eco. Environ. Health 2024, 3, 59–76. [Google Scholar] [CrossRef] [Scilit] [PubMed]
  47. Geisseler, D.; Horwath, W.R.; Joergensen, R.G.; Ludwig, B. Pathways of nitrogen utilization by soil microorganisms–a review. Soil Biol. Biochem. 2010, 42, 2058–2067. [Google Scholar] [CrossRef] [Scilit]
  48. Wang, J.; Zhan, Z.; Xie, Y.; Qiu, M.; Ke, Y. Effects of organic materials application on available nutrient contents in tobacco growing soils. Chin. Tob. Sci. 2009, 30, 31–35. (In Chinese) [Google Scholar]
  49. Zhang, Z.; Jiao, J.; Chen, T.; Chen, Y.; Lin, H.; Xu, Q.; Cheng, Y.; Zhao, W. Soil nutrient evaluation of alluvial fan in the middle and lower reaches of Lhasa River Basin. J. Plant Nutr. Fertil. 2022, 28, 2082–2096. [Google Scholar]
Figure 1. Production process of microalgae fertilizer and the dynamics of chlorophyll a.
Sustainability 18 04057 g001
Figure 2. pH (a), soil moisture content (b), macro–aggregate composition (c), micro–aggregate composition (d), aggregate index (e), and soil algae chlorophyll a content (f) of the incubated soils. AM: active microalgae; IM: inactivated microalgae; CK: control. Different uppercase letters indicate statistically significant differences among different incubation times within the same treatment; different lowercase letters indicate statistically significant differences among different treatments at the same incubation time (p < 0.05).
Sustainability 18 04057 g002
Figure 3. DOC (a), DON (b), C fractions (c), N fractions (d), TOC and TN (e), and C/N mineralization rate (f). AM: active microalgae; IM: inactivated microalgae; CK: control. Different uppercase letters indicate statistically significant differences among different incubation times within the same treatment; different lowercase letters indicate statistically significant differences among different treatments at the same incubation time (p < 0.05).
Sustainability 18 04057 g003
Figure 4. Fluorescence characteristics of surface soil (0–2 cm) DOM under different treatments: activated microalgae (AM) on day 15 (a), 45 (b), and 105 (c); inactivated microalgae (IM) on day 15 (d), 45 (e), and 105 (f); and control (CK) on day 15 (g), 45 (h), and 105 (i). Region I, tyrosine-like substances; Region II, tryptophan-like substances; Region III, fulvic acid-like substances; Region IV, microbial byproducts; Region V, humic acid-like substances.
Sustainability 18 04057 g004
Figure 5. Fluorescence characteristics of subsurface soil (2–8 cm) DOM under different treatments: activated microalgae (AM) on day 15 (a), 45 (b), and 105 (c); inactivated microalgae (IM) on day 15 (d), 45 (e), and 105 (f); and control (CK) on day 15 (g), 45 (h), and 105 (i). Region I, tyrosine-like substances; Region II, tryptophan-like substances; Region III, fulvic acid-like substances; Region IV, microbial byproducts; Region V, humic acid-like substances.
Sustainability 18 04057 g005
Figure 6. Relative abundances of different fluorescent components in (a) 0–2 cm soil and (b) 2–8 cm soil. AM: activated microalgae; IM: inactivated microalgae; CK: control.
Sustainability 18 04057 g006
Figure 7. Correlations between C/N mineralization rates and soil property indicators.
Sustainability 18 04057 g007
Table 1. Composition of TAP-2 and BG-11 culture media.
TAP-2 Culture MediumBG-11 Culture Medium
No.ComponentConcentrationNo.ComponentConcentration
1Tris-HCl2.42 g L−11K2HPO40.04 g L−1
2CH3COONa2 g L−12MgSO4·7H2O0.075 g L−1
3NH4Cl0.375 g L−13CaCl2·2H2O0.036 g L−1
4K2HPO40.04 g L−14Ferric citrate0.006 g L−1
5MgSO4·7H2O0.075 g L−15A5 trace element solution *1 mL L−1
6CaCl2·2H2O0.036 g L−1
7Na2CO30.02 g L−1
8Ferric citrate0.006 g L−1
9A5 trace element solution *1 mL L−1
* The A5 trace element solution was composed of H3BO3 2.86 g L−1, MnCl2·4H2O 1.81 g L−1, ZnSO4·7H2O 0.222 g L−1, Na2MoO4·2H2O 0.39 g L−1, CuSO4·5H2O 0.079 g L−1, and Co(NO3)2·6H2O 0.0494 g L−1.
Table 2. Basic properties of the test soil.
pHBD
g cm−3
EC
µS cm−1
TOC
g kg−1
TN
g kg−1
DOC
mg kg−1
DON
mg kg−1
SAR
(mmol−1)0.5
ESP
%
Particle Size Distribution (%)
Sand (2–0.02 mm)Silt (0.02–0.002 mm)Clay (<0.002 mm)
8.721.30103.41.510.3218.817.61.744.2475.6920.353.96
Note: BD—bulk density; EC—electrical conductivity; TOC—total organic carbon; TN—total nitrogen; DOC—dissolved organic carbon; DON—dissolved organic nitrogen; SAR—sodium adsorption ratio; ESP—exchangeable sodium percentage.
Table 3. Information of the five fluorescent integration regions.
RegionType of Organic Matter RepresentedExcitation WavelengthEmission Wavelength
Ityrosine-like substances200–250200–330
IItryptophan-like substances200–250330–380
IIIfulvic acid-like substances200–250380–500
IVmicrobial byproducts250–400200–380
Vhumic acid-like substances250–400380–500
Disclaimer/Publisher’s Note: The statements, opinions and data contained in all publications are solely those of the individual author(s) and contributor(s) and not of MDPI and/or the editor(s). MDPI and/or the editor(s) disclaim responsibility for any injury to people or property resulting from any ideas, methods, instructions or products referred to in the content.