Article

Effect of Perceived Value of Smart Governance on City Demographic Sustainability: Youth Retention in Busan


1
International Design School for Advanced Studies, Hongik University, Seoul 04068, Republic of Korea
2
World Design Organization, Montreal, QC H2Y 2H6, Canada
*
Author to whom correspondence should be addressed.
Sustainability 2026, 18(8), 4055; https://doi.org/10.3390/su18084055
Submission received: 12 March 2026 / Revised: 16 April 2026 / Accepted: 17 April 2026 / Published: 19 April 2026
(This article belongs to the Section Sustainable Urban and Rural Development)

Abstract

This study explored how smart governance can foster city demographic sustainability by shaping youth retention intention in developed cities. In the case of Busan, South Korea, a structural model was constructed and tested to link the dimensions of perceived value of smart governance (PV)—including Accessibility and Efficiency of Public Services (PV-A), Transparency and Information Accessibility of Governance (PV-T), Participation and Responsiveness (PV-P), Career Development and Innovation Support (PV-C), and Contribution to Urban Quality of Life (PV-Q)—with perceived demographic sustainability (PDS) and youth retention intention (YRI). On the basis of 939 valid questionnaires, confirmatory factor analysis and a structural equation model were used to test the measurement validity, model fitting, and mediating effects. Consequently, all the dimensions of smart governance had a positive effect on youth retention intention (YRI), with all path coefficients statistically significant at p < 0.001, and perceived demographic sustainability (PDS) partially mediated the effects of each dimension on youth retention intention (YRI), with indirect effects significant at p < 0.05. Among the dimensions, PV-T had the strongest effect, with a standardized coefficient of β = 0.283 at p < 0.001, followed by PV-P (β = 0.185, p < 0.001) and PV-Q (β = 0.167, p < 0.001), while PV-A and PV-C showed comparatively weaker but still statistically significant effects. In view of governance orientation and cognitive mechanism, this study provides empirical support for demographic sustainability design in smart cities.

1. Introduction

Sustainable urban development is currently reliant on the ability to attract and retain skilled young people [1]. Besides environmental and economic dimensions, the long-term stability of demographic structure has been a key indicator for sustainable urban development [2]. According to existing studies, urban competitiveness lies not only in economic performance and material conditions but also in how governance capability, the institutional environment, and quality of life shape individual development [3]. Thus, youth retention intention is a key observational variable for urban sustainability [4,5]. In terms of population mobility, youth, including early-stage employees, are the most active migrants, with their residence usually based on their comprehensive assessment covering governance quality, job prospects, and living conditions, rather than a single policy factor [6,7,8]. This migration pattern is not driven by a single policy factor but results from a combination of economic opportunities, institutional conditions, and perceived urban attractiveness. Existing studies suggest that young people tend to evaluate cities based on employment prospects, quality of life, and long-term development potential rather than isolated policy incentives [9]. Therefore, it is very practical to analyze youth retention mechanisms in a specific city.
The demographic sustainability of Busan is closely related to the continuous outflow of young people [10]. Although Busan remains a large city and port in South Korea, a large proportion of its young population keeps migrating to the capital of Seoul, which reflects young people’s cautious attitude towards Busan in terms of career opportunities and future development [11]. According to national statistics, young people aged 20–34 mostly migrate to the capital region, highlighting the significant spatial concentration in South Korea [12,13]. At the city level, the latest statistics show that the proportion of young households in Busan has decreased to less than one-fifth of local total households, and the cross-regional mobility of the youth is much higher than that of the elderly [14,15]. In accordance with such a trend, regional mobility studies indicated that people in their 20s and 30s are the most active migrants in South Korea, thus highlighting the importance of youth retention intention on the sustainability agenda of Busan [16,17].
In this situation, the smart city strategy is regarded as a policy instrument for fostering demographic sustainability [18]. The data-driven framework of public services and smart governance has been integrated into the urban management system to enhance urban operational efficiency, public services, and environmental governance [19,20]. However, early smart-city strategies were criticized for their excessive technological input because they failed to make clear that technological progress can convert into residents’ “perceived value” [21,22]. According to relevant studies, only when governance mechanisms can effectively link technological systems with residents’ daily lives, career expectations, and long-term development visions will smart-city initiatives truly promote sustainable urban development [23].
Accordingly, the smart governance policy framework has regarded residents’ perceived value as the core of urban sustainable development [24,25]. The OECD pointed out that regional or urban attractiveness depends on whether governance frameworks can convert technological and institutional capabilities into tangible and verifiable benefits [26]. According to empirical research, only when smart governance aligns with young people’s expectations regarding public services, job opportunities, and future development will smart governance have a material effect on youth retention intention [27]. Thus, smart governance does not directly shape youth migration with a single policy intervention but indirectly affects young people’s intentions of long residence and career planning in a city by affecting their perceptions of urban development opportunities, institutional capabilities, and demographic prospects [28,29].
Despite numerous relevant studies, there are two major gaps in the existing literature. First, although the outflow of young people has been a core challenge of many cities [30,31], few studies have analyzed the effect of smart governance on youth retention intention by surveying young people who have experienced city life or will leave the city. Second, concerning whether smart governance can enhance urban attractiveness and youth retention intention by enhancing resident-perceived value, existing empirical evidence remains insufficient [32]. Third, existing studies have rarely examined the cognitive mechanism linking smart governance perception and youth retention intention [33], particularly the role of perceived demographic sustainability as an intermediate metric of a city’s future demographic vitality and long-term development prospects [34].
To cover those gaps, As the second-largest city in South Korea and a major port city, Busan has experienced a continuous outflow of young population to the capital region, making it a representative case of demographic imbalance among developed cities. The coexistence of advanced urban infrastructure and persistent youth migration provides a suitable context for examining how smart governance influences demographic sustainability and youth retention. This study focusing on Busan (South Korea), explored the perceived value of smart governance in the process of youth retention and re-attraction. As a developed port city with long-term structural challenges such as population aging and youth outflow, Busan is a typical research context for testing whether governance-oriented smart-city strategies can relieve the pressure of demographic unsustainability [35,36]. In this study, “youth” was defined as early-stage employees aged 20–40, including higher-education graduates and young professionals, whose residence intentions are particularly sensitive to governance quality, public services, and urban habitability [37]. By focusing on perceived value rather than technological deployment, this study was designed to further analyze how smart governance supports social and demographic sustainability in the developed city.

2. Literature Review and Hypotheses

2.1. Youth Mobility and Urban Attractiveness in Developed Cities

Generally, the research on urban attractiveness covers two development scenarios: one is emerging cities that try to attract new residents, and the other is developed cities that strive to retain or re-attract young people [38,39,40]. In developed cities, the youth outflow is closely related to structural economic transformation, job market differentiation, and long-term demographic changes [41]. Rather than policies for immigration, youth retention is more reliant on a comprehensive assessment covering urban life experiences, career constraints, and future opportunities [42].
According to studies on South Korean migration, the youth, including early-stage professionals, are the most active migrants, particularly in large cities with highly concentrated spatial patterns [43]. For developed cities, such mobility presents continuous migration into major economic centers, indicating structural differences among cities in job prospects, innovation ecosystems, and social mobility opportunities [44,45].
Notably, youth migration is driven not only by objective economic indicators, but more by the subjective assessment of urban development paths, including whether a city can provide long-term stable career and life prospects. Therefore, recent studies reveal that the attractiveness of developed cities lies in whether their governance systems can deliver credible signals about development paths and social opportunities.

2.2. Smart Governance and Perceived Value

Along with youth mobility research, the research on smart cities has been shifting from “technology centralism” to “governance orientation” [18,21]. Early smart-city projects mainly focused on digital infrastructure construction, system efficiency improvement, and technological innovation, while subsequent studies have revealed that such paths are not sufficient for solving the demographic sustainability problems of developed cities [46].
In current studies, smart governance is deemed a comprehensive framework that integrates digital technology with institutional capabilities, public services, information transparency, and citizen participation mechanisms [23]. From this perspective, governance quality is not an exogenous variable that directly drives individual behaviors, but it indirectly affects residents’ judgments on their quality of life and development prospects by shaping their perceptions of urban system accessibility, fairness, and responsiveness [24,25].
In recent years, “perceived value” has been used as an important analytical dimension to assess the effectiveness of smart governance. This research path shifts the focus from objective system performance to residents’ subjective assessment of whether smart governance brings practical benefits [47]. According to existing studies, smart governance can improve sustainable urban development only when residents are aware of substantial improvements in public service accessibility, participation opportunities, and future security [48]. This perceived value is crucial to youth mobility, because youth are highly sensitive to whether a city can support their long-term career development and social integration. Some prior studies [23,26] further suggest that certain governance dimensions, especially those related to career development opportunities and institutional transparency, may exert stronger influences on individuals’ urban evaluation and long-term residence decisions. Based on this perspective, this study further examines the relative strengths of different governance dimensions within the proposed analytical framework.

2.3. Demographic Sustainability Challenge of Developed Cities

With economic transformation and demographic restructuring, developed cities face a series of challenges related to demographic sustainability [47,48]. According to studies on demographic decline and urban aging, there is a mutually reinforcing negative cycle between youth outflow and demographic decline, leading to a decline in innovation, increase in fiscal pressure, and reduction in social vitality [49]. Thus, it is very difficult for traditional urban development strategies regarding infrastructure investment and industrial upgrading to fundamentally reverse declining demographic trends.
According to the literature on urban transformation, technological modernization and material capital input alone cannot overcome the deep constraints imposed by structural demographic changes [50]. In comparison, governance approaches to achieving higher social inclusiveness, stronger job-market adaptability, and more participation opportunities are regarded as key institutional conditions for youth retention [51].
In such research, smart governance is regarded as a potential path for relieving demographic risks in developed cities [28,29]. However, disagreement on the effectiveness is still seen among existing empirical studies: some argue that governance-oriented smart-city strategies can enhance residents’ perception of life quality, while others warn that digital measures cannot relieve deeper structural constraints [21]. Such disagreement highlights the necessity of empirical studies in specific cities, to test whether and how smart governance affects young people’s judgment on the urban future and their residence intention.

2.4. Research Gap and Hypotheses in the Busan Case

In the research framework above, Busan is a typical case that faces a continuous outflow of young people and is carrying out smart-city and revitalization strategies [33,34]. As South Korea’s second-largest city and important port, Busan has put smart governance on its development agenda in order to enhance its attractiveness and governance through digital services and institutional innovation [35,36].
However, existing studies mostly focus on technological deployment, industrial transformation, and macroeconomic performance, with insufficient empirical analysis of how youth understand the governance measures [21,22]; in particular, there is a lack of research based on “perceived value” to test how smart governance affects young people’s confidence in urban demographic prospects and how such confidence affects their retention or re-migration intention [23,24].
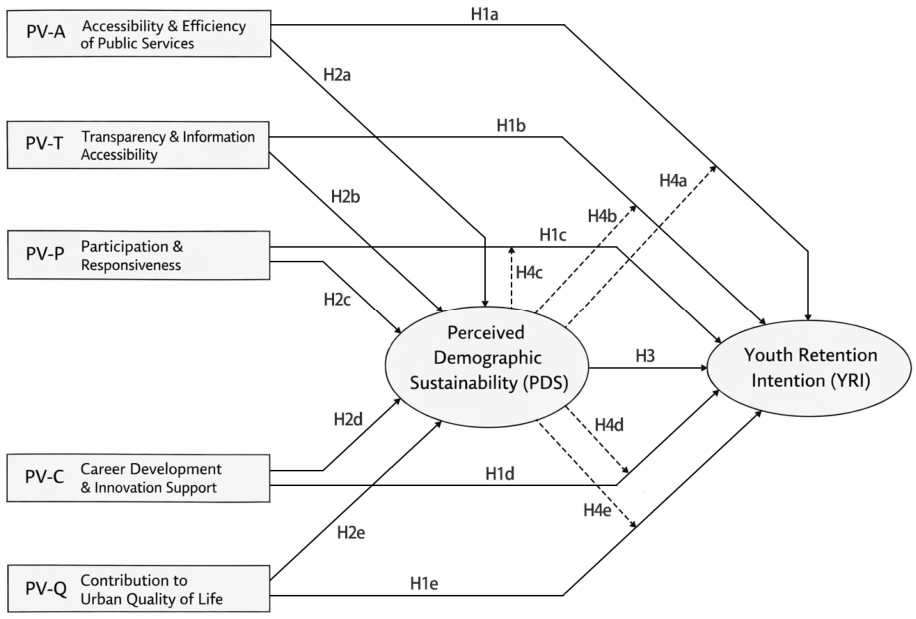
In view of such a literature gap, it is necessary to put perceived governance, demographic sustainability, and youth retention into a unified analytical framework [25,26], and it is also necessary to reveal how smart governance functions in developed cities through structured quantitative measurement and mechanism-oriented analysis [23,28]. Accordingly, the hypothesized research framework of this study is presented in Figure 1, and the following hypotheses are proposed:
Based on the above theoretical arguments, smart governance dimensions are expected to influence youth retention intention both directly and indirectly through perceived demographic sustainability. Thus, this study proposed the following hypotheses:
Effects of Governance Dimensions on Youth Retention Intention:
H1a. 
Accessibility and Efficiency of Public Services (PV-A) has a significant positive effect on youth retention intention (YRI).
H1b. 
Transparency and Information Accessibility (PV-T) has a significant positive effect on YRI.
H1c. 
Participation and Responsiveness (PV-P) has a significant positive effect on YRI.
H1d. 
Career Development and Innovation Support (PV-C) has a significant positive effect on YRI.
H1e. 
Contribution to Urban Quality of Life (PV-Q) has a significant positive effect on YRI.
Effects of Governance Dimensions on Perceived Demographic Sustainability:
H2a. 
Accessibility and Efficiency of Public Services (PV-A) has a significant positive effect on perceived demographic sustainability (PDS).
H2b. 
Transparency and Information Accessibility (PV-T) has a significant positive effect on PDS.
H2c. 
Participation and Responsiveness (PV-P) has a significant positive effect on PDS.
H2d. 
Career Development and Innovation Support (PV-C) has a significant positive effect on perceived demographic sustainability (PDS).
H2e. 
Contribution to Urban Quality of Life (PV-Q) has a significant positive effect on PDS.
H3. 
Perceived demographic sustainability (PDS) has a significant positive effect on youth retention intention (YRI).
Mediating Role of Perceived Demographic Sustainability:
H4a. 
Perceived demographic sustainability (PDS) mediates the relationship between Accessibility and Efficiency of Public Services (PV-A) and youth retention intention (YRI).
H4b. 
PDS mediates the relationship between Transparency and Information Accessibility (PV-T) and YRI.
H4c. 
PDS mediates the relationship between Participation and Responsiveness (PV-P) and YRI.
H4d. 
PDS mediates the relationship between Career Development and Innovation Support (PV-C) and YRI.
H4e. 
PDS mediates the relationship between Contribution to Urban Quality of Life (PV-Q) and YRI.
Some prior studies suggest that different governance dimensions may have unequal influences on perceptions and behavioral intentions. Based on this perspective, the following hypotheses are proposed:
H5. 
Among the five governance dimensions, Career Development and Innovation Support (PV-C) exhibits the strongest positive effect on youth retention intention (YRI).
H6. 
Among the five governance dimensions, Accessibility and Efficiency of Public Services (PV-A) exhibits the strongest positive effect on perceived demographic sustainability (PDS).

3. Research Methods

3.1. Target Population and Sampling

The target population hereof is higher-educated young people, aged 20–40 and in their early career stage, including college graduates, young professionals, and junior researchers [41,42]. This group mainly consists of individuals who have received higher education and are either entering or have recently entered the labor market, representing a key demographic segment with high mobility and sensitivity to urban opportunities and governance conditions [8,41]. This group is usually in a critical stage of career path and residence intention, and their perceptions of governance quality, public services, job opportunities, and urban habitability are highly sensitive concerning whether to settle down in a city for a long time [26,41].
This study, by non-probability sampling, collected data through online questionnaires and specific dissemination to youth in Busan [52], based on voluntary anonymous participation to reduce social desirability bias and responding stress [53]. Before starting the questionnaire, all respondents were informed of the purpose of the study, the voluntary nature of participation, and the anonymous handling of the data. No personally identifiable information was collected. The questionnaire was distributed through online platforms and social media networks targeting young residents in Busan, including university networks and professional communities. Given the difficulty of obtaining a complete sampling frame of young residents in Busan, non-probability sampling was considered an appropriate approach for this study [54]. In the stage of data cleaning, the samples with missing information, consistent responding patterns, or inconsistent logic were eliminated, and finally, N = 939 valid questionnaires were retained for subsequent analyses. The sample size exceeds the recommended minimum requirement for structural equation modeling, ensuring sufficient statistical power for subsequent statistical analyses [55].

3.2. Questionnaire Design and Variable Measurement

The questionnaire was developed based on established scales from prior studies and adapted to the context of smart governance and urban sustainability. All items were measured using a five-point Likert scale. The survey was administered online to young residents in Busan through widely used online communication and community platforms among Korean youth (e.g., KakaoTalk and Everytime). To ensure data quality, responses with missing values, excessively short completion times, uniform answering patterns, or inconsistent responses across related items were identified and removed during the data cleaning process.
The perceived value of smart governance is defined as a multidimensional latent construct that reflects the respondents’ subjective assessment on the effectiveness of urban governance services and institutional arrangements in daily life and development expectations [23,24]. Based on relevant literature, this construct includes five dimensions: Accessibility and Efficiency of Public Services (PV-A), which reflect the extent to which urban services are conveniently and efficiently delivered in daily life [26]; Transparency and Information Accessibility (PV-T), which capture the visibility, openness, and clarity of governance information and policy processes [23]; Participation and Responsiveness (PV-P), which indicate the degree to which citizens can engage in governance and receive timely feedback from authorities [25]; Career Development and Innovation Support (PV-C), which represent career development and innovation opportunities provided by urban governance [31]; and Contribution to Urban Quality of Life (PV-Q), which reflects the overall improvement of living conditions and urban attractiveness brought by governance practices [39]. These dimensions are selected, based on prior literature, to capture the core governance-related factors that are most directly relevant to individuals’ daily experiences and long-term development expectations, while also ensuring a parsimonious and analytically tractable framework. Other aspects, such as data privacy or digital inclusion, while important, are not the primary focus of this study, which centers on governance functions that are closely associated with urban attractiveness and retention-related decision-making. The measurement items for these constructs were adapted from established studies on smart governance, urban governance perception, and public service evaluation.
Youth retention intention refers to an individual’s long-term willingness to remain, develop, and invest in a specific urban context, reflecting both behavioral intention and future-oriented expectations [41]. Existing studies indicate that such intention is shaped not only by economic opportunities but also by institutional environment, quality of life, and perceived development prospects [9,26]. Therefore, youth retention intention can be understood as a comprehensive cognitive evaluation of urban attractiveness rather than a simple migration decision. Youth retention intention is used to measure respondents’ behavioral tendency to live and develop in Busan in the medium and long term. The measurement includes the intention to pursue a career in Busan, the plan to live in Busan in the medium and long term, and the possibility of migrating to other cities or regions (reverse question). The items were adapted from previous studies on migration intention and urban retention intention [41].
The perceived demographic sustainability indicates respondents’ subjective judgments on the future demographic vitality, age structure balance, and attractiveness to the youth, highlighting their expectations for the city’s demographic prospects rather than objective statistical indicators. This construct comprises six items covering the assessments of long-term demographic stability, youth gathering capability, and social vitality sustainability [47,48]. All items were measured using a five-point Likert scale ranging from 1 (strongly disagree) to 5 (strongly agree). The detailed measurement items and construct definitions used in this study are presented in Appendix A (Table A1).

3.3. Data Analysis Methods

This study used SPSS 26.0 and AMOS 26.0 for data processing and analysis, with the process divided into three stages [56].
First, descriptive statistical analysis was conducted with SPSS to summarize the demographic characteristics of the samples and the mean values and standard deviations of the main variables. In addition, Cronbach’s α coefficient was used to test every construct and the internal consistency reliability of the total scale [57].
Second, exploratory factor analysis (EFA) was used to preliminarily test the potential structure of the scale, and the data suitability was assessed through the KMO test and Bartlett sphericity test [58]. EFA was conducted as a preliminary step to examine the underlying factor structure of the adapted measurement items before confirmatory analysis. On that basis, confirmatory factor analysis (CFA) was conducted with AMOS to test the convergence validity and discriminant validity of the measurement model, including standardized factor loading, average variance extraction (AVE), and combination reliability (CR) [59].
In addition, a structural equation model (SEM) was constructed to test all the PV dimensions and the hypothesized path relationship between PDS and YRI. SEM was employed to examine the hypothesized relationships among smart governance dimensions, perceived demographic sustainability, and youth retention intention [60]. The overall adaptability of the model was assessed using many fitting indicators (χ2/df, RMSEA, SRMR, GFI, NFI, IFI, TLI), and the Bootstrap method (5000 resampling) was used to test the mediating effect of PDS between governance perception and youth retention intention. The statistical significance level was set to 0.05 [61].
Finally, an artificial neural network (ANN) analysis was conducted to complement the SEM results and capture potential nonlinear relationships among variables. A multilayer perceptron model with one hidden layer was applied, and the dataset was divided into training (70%) and testing (30%) subsets to ensure robustness. The relative importance of predictors was assessed based on normalized importance values, following prior studies on hybrid SEM–ANN approaches [62].

4. Research Results

4.1. Sample Characteristics and Descriptive Statistics

This study covered a total of 939 valid samples, and their demographic structure showed that the respondents were mostly young people in early stages of their careers. Among them, people aged 25–29 made up the highest percentage (54.21%), followed by those aged 30–34 (26.62%), the two accounting for 80.83%, indicating that the samples fit the young workforce researched herein. Regarding the gender percentages, males made up 59.11%, slightly more than females (40.89%). The demographic characteristics of the sample are presented in Table 1.
In terms of educational background, respondents with a bachelor’s degree or above accounted for 57.29% of the sample, indicating a relatively high educational level. Regarding occupation status, full-time employees accounted for 54.95%, followed by part-time or freelance employees (22.90%), while students and the unemployed accounted for 7.99% and 13.84%, respectively, indicating that the samples featured job market participation.
Regarding length of residence, most of the respondents lived in Busan for 1–6 years (69.44%), with similar percentages between 1 and 3 years and 4–6 years, indicating that the samples were both stable and mobile to a certain extent. Overall, the sample structure indicated the youth retention intention and development expectations in Busan, allowing us to analyze the relationship between perceived smart governance and perceived demographic sustainability.

4.2. Measurement Model Testing: Reliability and Validity

The reliability and validity statistics of the constructs are presented in Table 2.

4.2.1. Internal Consistency and Construct Reliability

This study, by using Cronbach’s α coefficient and combination reliability (CR), tested the internal consistency and construct reliability of the scale. The Cronbach’s α value was 0.922 for the total scale (27 items), indicating the extreme-high internal consistency of the overall measurement tool.
The α values for all the latent constructs ranged from 0.752 to 0.895, all greater than the recommended threshold of 0.70. Therein, “youth retention intention (YRI)” (α = 0.895) and “perceived demographic sustainability (PDS)” (α = 0.893) showed excellent reliability, while the other five dimensions had α values greater than 0.75, indicating that all the dimension scales were stable and statistically consistent.
The CR values of all the constructs ranged from 0.754 to 0.895, meeting the assessment criterion of greater than 0.70, proving the reliability of the latent variable measurement structure.

4.2.2. Convergent Validity and Discriminant Validity

The convergent validity and discriminant validity of the scale were tested by confirmatory factor analysis. The standardized factor loadings of all the measurement items ranged from 0.684 to 0.822 on the corresponding latent constructs, all greater than the recommended 0.60, indicating that every item could effectively reflect its latent constructs.
The average variance extraction (AVE) of all the constructs ranged from 0.505 to 0.623, all greater than the threshold of 0.50, indicating good convergent validity of the scale.
Discriminant validity was tested with the Fornell–Larcker criterion. As a result, the AVE square root of every construct (ranging from 0.711 to 0.789) was greater than the correlation coefficients between it and other constructs (ranging from 0.184 to 0.549), indicating that every latent construct was statistically discriminative, and that the constructs were theoretically correlated with each other, without obvious overlapping. The discriminant validity results based on the Fornell–Larcker criterion are presented in Table 3.

4.2.3. Measurement Model Fitting

Before the measurement model was constructed, exploratory factor analysis (EFA) was first performed to test the latent structure of the scale. The KMO value was 0.910, and the Bartlett sphericity value was significant (p < 0.001), indicating that the sample data was suitable for factor analysis. In line with the criterion of an eigenvalue greater than 1, a total of seven common factors were extracted, and the rotated cumulative variance explanation was 69.854%, indicating that the factor structure can well summarize the information of original variables.
Further, the measurement model was tested overall by confirmatory factor analysis. The standardized load and validity indicators met their recommended criteria, indicating that the measurement model was structurally adaptable for the benefit of subsequent structural model analysis.

4.3. Structural Model and Hypothesis Testing

4.3.1. Model Fitting and Overall Structural Relationship

A structural equation model was constructed in AMOS 26.0, and the hypothesis paths between latent variables were also tested. Before entering the model, it was confirmed by skewness and kurtosis tests that every variable met an approximately normal distribution and was applicable to the maximum likelihood estimation.
The overall fitting indicators of the model indicated its good adaptability. The ratio between chi-square and freedom (χ2/df) was 4.043, which was acceptable; the root mean square error of approximation (RMSEA) was 0.057, and the standardized root mean square residual (SRMR) was 0.039, both below the recommended threshold of 0.08. As for value-added fitting indicators, the GFI was 0.910, NFI was 0.906, IFI was 0.928, and TLI was 0.916, all greater than the assessment criterion of 0.90. Overall, the model and the sample data fit each other in support of the structural framework linking smart governance dimensions, PDS, and YRI. These results further confirm the accuracy and robustness of the proposed model. The satisfactory model fit indices, together with the statistically significant path relationships, indicate that the model provides a reliable representation of the relationships among the constructs.
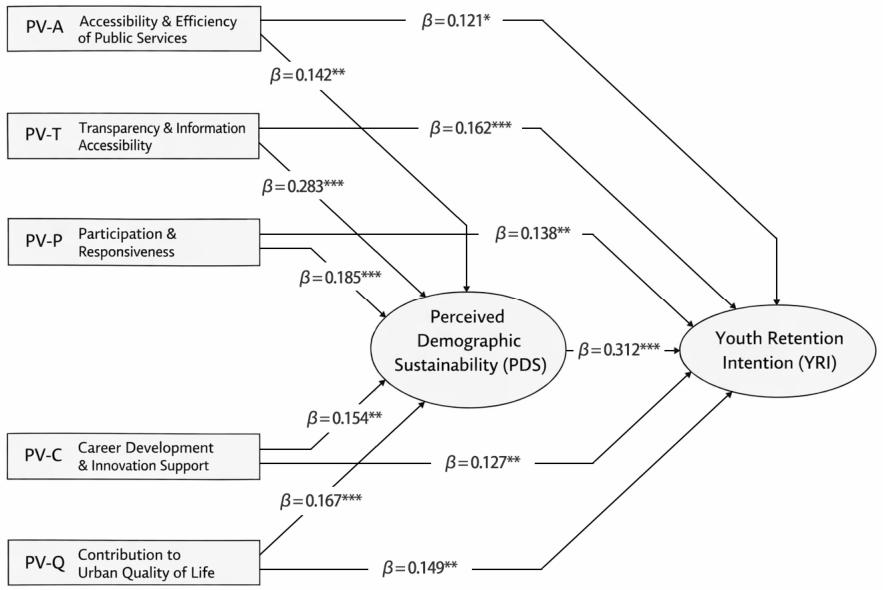
In addition, the path coefficient of perceived demographic sustainability (PDS) to youth retention intention (YRI) was significantly positive (standardized β = 0.312, p < 0.001), indicating that young people’s cognition about the urban demographic structure and long-term development prospects can significantly enhance their behavioral tendencies of long-term residence and development in the city, supporting hypothesis H3. The structural equation model with standardized path coefficients is presented in Figure 2.

4.3.2. Direct Effects of Governance Dimensions

According to the path analysis result, the five dimensions of smart governance had significant positive effects on perceived demographic sustainability (PDS) and youth retention intention (YRI) (p < 0.01), thus supporting H1a–H1e and H2a–H2e.
In the path of perceived demographic sustainability (PDS), “Transparency and Information Accessibility” (PV-T) showed the strongest effect (standardized β = 0.283, t = 6.535, p < 0.001), followed by “Participation and Responsiveness” (standardized β = 0.185, t = 4.542, p < 0.001) and “Contribution to Urban Quality of Life” (standardized β = 0.167, t = 3.879, p < 0.001), respectively. The effects of “Accessibility and Efficiency of Public Services” and “Career Development and Innovation Support” were relatively weak, but they still reached the level of statistical significance. Therefore, H6 was not supported.
In the path of youth retention intention (YRI), “Transparency and Information Accessibility” (PV-T) also showed the strongest positive effect (standardized β = 0.162, t = 3.981, p < 0.001), indicating that the visibility and disclosure of institutional information play a key role in shaping young people’s intention of long-term retention. Therefore, H5 was not supported. The other dimensions (PV-A, PV-P, PV-C, PV-Q) also had a significant positive effect on YRI (p < 0.01), thus providing further support for H1a–H1e. The standardized path coefficients and hypothesis testing results are presented in Table 4.

4.3.3. Mediating Effect of Perceived Demographic Sustainability

By the Bootstrap method (5000 resampling), this study tested the mediating effect of perceived demographic sustainability (PDS) between each governance dimension (PV-A, PV-T, PV-P, PV-C, PV-Q) and youth retention intention (YRI). As a result, none of the 95% confidence intervals for indirect effects included zero, and the effect values ranged from 0.034 to 0.070, indicating the statistical validity of the mediating effect, supporting H4a–H4e.
Therein, “Transparency and Information Accessibility” (PV-T) had the strongest indirect effect by means of PDS (effect value = 0.070), and its total effect on youth retention intention (YRI) was the greatest (0.224) among the five dimensions. In contrast, the indirect effect of “Career Development and Innovation Support” (PV-C) was relatively weak (effect value = 0.034), but it was still at the level of significance.
The results indicate that governance dimensions influence youth retention intention both directly and indirectly through perceived demographic sustainability, confirming a partial mediation mechanism. The mediating effects of perceived demographic sustainability were further tested using the bootstrap method with 5000 resamples. The results are presented in Table 5.

5. Discussion

5.1. Theoretical Significance and Academic Contribution

The primary theoretical contribution of this study is that “perceived demographic sustainability” was integrated into the mechanism between smart governance and youth retention intention, and thus, an analytical framework was constructed on the basis of cognitive mediation. Existing studies mostly explained the social effect of smart cities as the direct result of residents’ satisfaction or behavioral intentions based on governance performance [23,24], while this study indicated that youth retention intention is more reliant on young people’s cognitions of long-term urban demographic structure and social vitality, providing a new way to understand the effect of urban governance on social sustainability [47,48].
Second, this study validated the institutional functions of smart governance in a developed city, besides the technical tool attribute of smart governance [21,22]. It was found that Transparency and Information Accessibility plays a key role in youth confidence and retention intention, indicating that the core value of smart governance is not limited to service efficiency enhancement but rather lies in institutional visualization and information disclosure that deliver “credible signals” about urban development paths and opportunities to youth [43]. This result suggests that, compared with service efficiency or living convenience, the visibility, credibility, and interpretability of governance information play a more decisive role in shaping young people’s confidence in the future development of the city [26]. In other words, young people are more sensitive to whether they can understand and anticipate urban development trajectories than to immediate service improvements, which explains the relatively stronger influence of PV-T compared to other dimensions. From this perspective, the research on smart cities can be upgraded from the “technology system assessment” to the theoretical level of “institutional signals and social expectation shaping”.
Third, by comparing the effect intensity of different governance dimensions, this study revealed the differentiated responses of the youth to governance mechanisms. Although Career Development and Innovation Support had a significant effect on youth retention intention, its intensity was lower than that of institutional dimensions such as Transparency and Participation and Responsiveness. Thus, in the developed cities under the pressure of structural transformation, young people are more concerned about whether the institutional environment can provide a stable and predictable development framework, besides short-term opportunities or policy incentives.

5.2. Dialog with Existing Studies

The findings of this study complement the literature on youth migration and urban attractiveness. Existing studies stressed the decisive roles of job opportunities, salary levels, and industrial structure in youth migration, while this study indicated that those factors can be “filtered” and “explained” by the youth with the cognitive framework of institutional environment and governance capability. In other words, institutional credibility and information transparency shaped by smart governance can play an amplifying or buffering role in young people’s assessments of economic opportunities and social mobility [9,26].
Regarding the research on smart cities, some studies hold a cautious attitude towards the use of technology-oriented paths to solve demographic structural challenges, holding that digital measures cannot relieve in-depth economic and social constraints [21,22]. This study did not deny the importance of structural factors but, rather, in view of the cognitive mechanism, explained that governance-oriented digital strategies can reshape young people’s confidence in the urban future and thereby indirectly affect their migration intention. This finding provided empirical support for the argument of “whether smart governance has the potential of social transformation” [28].

5.3. Policy Implications and Practical Significance

At the policy level, this study indicated that developed cities should, in response to youth outflow and population aging, shift their smart-city strategies from technology input to a comprehensive policy framework that is focused on governance credibility and institutional transparency. Specifically, despite the importance of service improvement, youth will not be confident in long-term urban development without a clear, open, and verifiable information disclosure mechanism [26].
Second, this study highlighted the role of Participation and Responsiveness in shaping perceived demographic sustainability. To enhance young people’s recognition of the urban future, local governments should not only provide digital service platforms but also offer participatory approaches that can influence policy making and project prioritization, to show that young people’s opinions are listed on the urban agenda [25].
Furthermore, despite its weak effect, Career Development and Innovation Support is indispensable in the smart governance system. Policy design should integrate an innovation ecosystem with a transparency mechanism, showing the correlation between young people’s career paths and urban long-term strategies, to enhance their intention of local long-term retention [31].

5.4. Research Constraints and Future Research Directions

This study has several limitations that should be acknowledged. Despite new perspectives at theoretical and empirical levels, this study is subject to some constraints.
First, the sample includes a relatively high proportion of highly educated respondents, which may influence the sensitivity to certain governance dimensions such as Transparency and Information Accessibility. Therefore, the findings should be interpreted with caution when generalizing to broader populations with more diverse educational and occupational backgrounds.
Second, the use of non-probability sampling may limit the generalizability of the findings. The cross-sectional nature of the data cannot capture the dynamic evolution between perceived governance and retention intention, and potential reverse causality between perception and behavioral intention cannot be fully ruled out, given the cross-sectional nature of the data. In addition, as the data are based on self-reported measures, common method bias may exist, although procedural remedies such as anonymous participation and careful questionnaire design were adopted to reduce this risk. Future research may adopt longitudinal or panel data, or apply more rigorous analytical approaches, to further validate the causal relationships and mediating mechanisms across different periods and policy stages.
Third, this study focused on the situation of Busan only. Although Busan is typical enough, smart governance may have different social implications in different countries or institutional environments [23,25]. Future research may, by cross-city or cross-national comparisons, test the applicability of the mechanisms or frameworks hereof in different governance systems and development stages.
Finally, future research may, by combining objective demographic data and job market indicators with residents’ subjective perceptions, construct a multi-level model that can systematically reveal the interactions among institutional arrangements, structural conditions, and individual cognitions, to provide further explanations of urban demographic sustainability mechanisms [47,48].

6. Conclusions

This study looked at Busan, a typical developed city in South Korea; constructed and empirically tested a structural model linking smart governance dimensions; perceived demographic sustainability, and youth retention intention as the core path; and systematically analyzed the direct and indirect effects of multidimensional governance mechanisms in youth demographic sustainability. The results are enlightening in both theory and practice.
First, this study confirmed that smart governance dimensions have significant positive effects on youth retention intention. Whether in terms of Accessibility of Public Services, Transparency and Information Accessibility, Participation and Responsiveness, Career Development and Innovation Support, or Contribution to Urban Quality of Life, the subjective assessment by youth of urban governance can directly enhance youth’s intentions of long residence and career development in the city. Specifically, all governance dimensions showed statistically significant effects on youth retention intention (p < 0.01), indicating that governance-related perceptions play a robust role in shaping behavioral intentions. Thus, youth retention intention was not only a response to economic opportunities or material conditions but also embedded in their judgments on the institutional environment and governance capabilities.
Second, this study found that perceived demographic sustainability (PDS) had a significant mediating effect between smart governance dimensions and youth retention intention (YRI). The path from PDS to YRI was significantly positive (β = 0.312, p < 0.001), confirming its key role as an intermediary mechanism. Smart governance not only directly affected the behaviors of the youth by improving their daily life experiences but also indirectly guided their retention and mobility by shaping their expectations on long-term urban demographic vitality, social structure stability, and development prospects. This finding expanded the explanatory framework of the “technology–service–behavior” linear logic, introducing demographic structure expectations and social sustainability cognition into the governance path.
Third, in the comparison among governance dimensions, Transparency and Information Accessibility had the strongest comprehensive effect, not only significantly affecting perceived demographic sustainability (PDS) but also directly affecting youth retention intention (YRI). In contrast, although Efficiency of Public Services and Contribution to Urban Quality of Life were also important, their effects were more reflected in the improvement of daily experiences. This result indicated that, in a developed city, credible institutions and “visible” development paths may be stronger than service performances in affecting young people’s confidence in the urban future.
Based on the above findings, the findings suggest that urban governance should shift from a primary focus on service efficiency to enhancing the transparency and interpretability of governance processes. For example, Singapore has strengthened citizen engagement by providing open data access and clearly communicating long-term development strategies [63], while Barcelona has improved public trust through digital governance platforms that make policy processes and urban data more visible to citizens [64]. These practices indicate that making governance more visible and understandable can play a more critical role in strengthening youth retention than solely improving functional service delivery.
In summary, this study, in terms of cognition and expectation, revealed the inherent mechanism that smart governance affected young people’s long retention and career planning by shaping their judgment of demographic sustainability. This finding not only enriches the theoretical framework concerning the relationship between smart cities and demographic sustainability but also empirically supports urban digital transformation that is oriented to smart governance. Future research may further explore how different governance contexts influence youth retention mechanisms, particularly through cross-city or cross-national comparisons. It would also be valuable to examine how changes in governance policies over time affect perceived demographic sustainability and retention intention.

Author Contributions

Y.P.: conceptualization, methodology, data curation, formal analysis, visualization, writing—original draft, writing—review and editing, supervision. K.N.: conceptualization, methodology, supervision, writing—review and editing. K.-C.P.: validation, resources, supervision, writing—review and editing. All authors have read and agreed to the published version of the manuscript.

Funding

This research received no external funding.

Institutional Review Board Statement

This study is waived for ethical review as it does not involve identifiable personal information or sensitive data, in accordance with the Article 15 of the Bioethics and Safety Act of South Korea and Article 13 of its Enforcement Rule.

Informed Consent Statement

Informed consent for participation was obtained from all subjects involved in the study.

Data Availability Statement

The data presented in this study are available from the corresponding authors on request.

Acknowledgments

The authors would like to thank Ken Nah and Ki-Cheol Pak for their guidance and support in the preparation of this paper.

Conflicts of Interest

The authors declare that they have no conflicts of interest.

Appendix A

Table A1. Measurement items, theoretical sources, and associated hypotheses.
ConstructCodeMeasurement ItemReference
Accessibility and Efficiency of Public Services (PV-A)PV-A1Public services in this city are easily accessible through digital or smart platforms.[23,26]
PV-A2Smart governance has improved the efficiency of public service delivery.[23,28]
PV-A3Government services can be obtained conveniently and quickly in daily life.[23,26]
Transparency and Information Accessibility (PV-T)PV-T1Government information and policy updates are easily accessible to the public.[23,25]
PV-T2Smart governance improves the transparency of urban governance and public decision-making.[23,24]
PV-T3I can clearly understand urban development plans and policies through public information channels.[24,26]
Participation and Responsiveness (PV-P)PV-P1The city provides opportunities for citizens to participate in public affairs and decision-making.[25]
PV-P2Government departments respond effectively to citizens’ suggestions and feedback.[23,25]
PV-P3I feel that citizens’ voices can influence urban governance decisions.[25,28]
Career Development and Innovation Support (PV-C)PV-C1The city provides sufficient support for career development and innovation activities.[31,40]
PV-C2Urban governance policies encourage innovation and entrepreneurial opportunities for young people.[31,40]
PV-C3The innovation environment in this city is favorable for long-term professional development.[40]
Contribution to Urban Quality of Life (PV-Q)PV-Q1Smart governance contributes to improving the overall quality of urban life.[26,39]
PV-Q2Digital governance initiatives make daily life in the city more convenient and comfortable.[23,26]
PV-Q3Smart city development enhances the attractiveness of the city as a place to live.[39,40]
Perceived Demographic Sustainability (PDS)PDS1I believe this city has the potential to attract and retain young people in the future.[47,48]
PDS2The demographic structure of the city is likely to remain balanced in the long term.[47,48]
PDS3The city will continue to maintain social vitality through a stable young population.[47,48]
PDS4The long-term development prospects of the city’s population are positive.[47,48]
PDS5The city has the capacity to sustain its demographic vitality in the future.[47,48]
PDS6The future demographic development of the city is sustainable.[47,48]
Youth Retention Intention (YRI)YRI1I intend to continue living in this city for a long period of time.[6,41]
YRI2I plan to develop my career in this city.[6,41]
YRI3I prefer to stay in this city rather than move to another city.[6,41]
YRI4I am willing to build my future life in this city.[6,41]
YRI5I would recommend this city as a place for young people to live and work.[6,41]
YRI6I am unlikely to migrate to another city in the near future.[6,41]

References

  1. United Nations Human Settlements Programme (UN-Habitat). World Cities Report 2020: The Value of Sustainable Urbanization; UN-Habitat: Nairobi, Kenya, 2020. [Google Scholar]
  2. OECD. Measuring the Attractiveness of Regions; OECD Publishing: Paris, France, 2022. [Google Scholar]
  3. Florida, R. Cities and the creative class. City Community 2003, 2, 3–19. [Google Scholar] [CrossRef] [Scilit]
  4. Glaeser, E.L. Triumph of the City; Penguin Press: New York, NY, USA, 2011. [Google Scholar]
  5. OECD. Rethinking Regional Attractiveness in the New Global Environment; OECD Publishing: Paris, France, 2023. [Google Scholar]
  6. Lee, E.S. A theory of migration. Demography 1966, 3, 47–57. [Google Scholar] [CrossRef] [Scilit]
  7. Coulter, R.; van Ham, M.; Findlay, A.M. Re-thinking residential mobility: Linking lives through time and space. Prog. Hum. Geogr. 2016, 40, 352–374. [Google Scholar] [CrossRef] [Scilit]
  8. Faggian, A.; McCann, P. Human Capital and Regional Development; Edward Elgar: Cheltenham, UK, 2017. [Google Scholar]
  9. Storper, M. Keys to the City; Princeton University Press: Princeton, NJ, USA, 2013. [Google Scholar]
  10. Statistics Korea. Population and Housing Census: Population Distribution and Migration Trends; Statistics Korea: Daejeon, Republic of Korea, 2024. [Google Scholar]
  11. Busan Metropolitan City. Busan Urban Master Plan 2040; Busan Metropolitan Government: Busan, Republic of Korea, 2023.
  12. Korean Statistical Information Service (KOSIS). Youth Migration Statistics by Region. Available online: https://kosis.kr/statHtml/statHtml.do?orgId=101&tblId=DT_1YL21201 (accessed on 9 March 2026).
  13. Korean Statistical Information Service (KOSIS). Youth Population by Age and Region. Available online: https://kosis.kr/statHtml/statHtml.do?orgId=101&tblId=DT_1B040A3 (accessed on 9 March 2026).
  14. Korean Statistical Information Service (KOSIS). Single-Person Households by Age and Region. Available online: https://kosis.kr/statHtml/statHtml.do?conn_path=I2&language=en&orgId=101&tblId=DT_1BPA001 (accessed on 9 March 2026).
  15. Busan Metropolitan City. Busan Youth Panel Survey Report 2023; Busan Metropolitan Government: Busan, Republic of Korea, 2024.
  16. Ma, K.R.; Kang, E.T.; Kwon, O.K. Migration behavior of students and graduates under regional dualism in Korea. Ann. Reg. Sci. 2017, 58, 191–208. [Google Scholar] [CrossRef] [Scilit]
  17. Kim, H.; Yang, J. Analysis of Changes in Human Capital Characteristics in Occupational Mobility of College Graduates. Korea Spat. Plan. Rev. 2024, 121, 43–58. [Google Scholar]
  18. Nam, T.; Pardo, T.A. Conceptualizing smart cities with dimensions of technology, people, and institutions. In Proceedings of the 12th Annual International Conference on Digital Government Research, College Park, MD, USA, 12–15 June 2011; pp. 282–291. [Google Scholar]
  19. Caragliu, A.; Del Bo, C.; Nijkamp, P. Smart cities in Europe. J. Urban Technol. 2011, 18, 65–82. [Google Scholar] [CrossRef] [Scilit]
  20. Chourabi, H.; Nam, T.; Walker, S.; Gil-Garcia, J.R.; Mellouli, S.; Nahon, K.; Pardo, T.A.; Scholl, H.J. Understanding smart cities: An integrative framework. In Proceedings of the 2012 45th Hawaii International Conference on System Science, Maui, HI, USA, 4–7 January 2012; pp. 2289–2297. [Google Scholar]
  21. Hollands, R.G. Will the real smart city please stand up? City 2008, 12, 303–320. [Google Scholar] [CrossRef] [Scilit]
  22. Kitchin, R. The real-time city? Big data and smart urbanism. GeoJournal 2014, 79, 1–14. [Google Scholar] [CrossRef] [Scilit]
  23. Meijer, A.; Bolívar, M.P.R. Governing the smart city: A review of the literature on smart urban governance. Int. Rev. Adm. Sci. 2016, 82, 392–408. [Google Scholar] [CrossRef] [Scilit]
  24. Bolívar, M.P.R.; Meijer, A.J. Smart governance: Using a literature review and empirical analysis to build a research model. Soc. Sci. Comput. Rev. 2016, 34, 673–692. [Google Scholar] [CrossRef] [Scilit]
  25. Pereira, G.V.; Parycek, P.; Falco, E.; Kleinhans, R. Smart governance in the context of smart cities: A literature review. Inf. Polity 2018, 23, 143–162. [Google Scholar] [CrossRef] [Scilit]
  26. OECD. Rethinking Regional Attractiveness for Resilient and Competitive Places; OECD Publishing: Paris, France, 2025. [Google Scholar]
  27. Nguyen, T.T. The Impact of Place Attractiveness and Social Supports on Internal Return Migration. J. Asian Financ. Econ. Bus. 2020, 7, 305–314. [Google Scholar] [CrossRef] [Scilit]
  28. Mora, L.; Deakin, M.; Reid, A. Strategic principles for smart city development: A multiple case study analysis of European best practices. Technol. Forecast. Soc. Change 2019, 142, 70–97. [Google Scholar] [CrossRef] [Scilit]
  29. Bibri, S.E.; Krogstie, J. Smart sustainable cities literature review. Sustain. Cities Soc. 2017, 31, 183–212. [Google Scholar] [CrossRef] [Scilit]
  30. Rodríguez-Pose, A. The revenge of the places that don’t matter. Camb. J. Reg. Econ. Soc. 2018, 11, 189–209. [Google Scholar] [CrossRef] [Scilit]
  31. Moretti, E. The New Geography of Jobs; Houghton Mifflin Harcourt: Boston, MA, USA, 2012. [Google Scholar]
  32. OECD. Regional Attractiveness Compass; OECD Publishing: Paris, France, 2026. [Google Scholar]
  33. Callinan, N. Exploring the effects of demographic transitions in Korea on migrant worker usage. J. Ind. Distrib. Bus. 2020, 11, 7–16. [Google Scholar] [CrossRef] [Scilit]
  34. Park, B.; Hong, C.Y. Fostering a young city in Busan. Asia Study 2025, 28, 225–250. [Google Scholar] [CrossRef] [Scilit]
  35. Busan Metropolitan City. Busan Smart City Plan (2024–2028); Busan Metropolitan Government: Busan, Republic of Korea, 2024.
  36. Busan Metropolitan City. Smart City Vision and Strategy; Busan Metropolitan Government: Busan, Republic of Korea, 2020.
  37. Busan Metropolitan City. Busan Youth Policy Implementation Plan 2025; Busan Metropolitan Government: Busan, Republic of Korea, 2025.
  38. Florida, R. The Rise of the Creative Class; Basic Books: New York, NY, USA, 2002. [Google Scholar]
  39. Clark, T.N.; Lloyd, R.; Wong, K.K.; Jain, P. Amenities drive urban growth. J. Urban Aff. 2002, 24, 493–515. [Google Scholar] [CrossRef] [Scilit]
  40. Storper, M.; Scott, A.J. Rethinking human capital, creativity and urban growth. J. Econ. Geogr. 2009, 9, 147–167. [Google Scholar] [CrossRef] [Scilit]
  41. Faggian, A.; McCann, P.; Sheppard, S. Human capital, higher education and graduate migration. Urban Stud. 2007, 44, 2511–2528. [Google Scholar] [CrossRef] [Scilit]
  42. Venhorst, V.; van Dijk, J.; van Wissen, L. Spatial flexibility of highly educated graduates. Tijdschr. Econ. Soc. Geogr. 2011, 102, 571–588. [Google Scholar]
  43. Rodríguez-Pose, A.; Ketterer, T.D. Institutional change and regional development. Reg. Stud. 2020, 54, 974–986. [Google Scholar] [CrossRef] [Scilit]
  44. Heo, N. Investigating the distribution of university alumni populations within South Korea and Taiwan based on data from the LinkedIn advertising platform. Cities 2023, 140, 104440. [Google Scholar] [CrossRef] [Scilit]
  45. Zeithaml, V.A. Consumer perceptions of price, quality, and value. J. Mark. 1988, 52, 2–22. [Google Scholar] [CrossRef] [Scilit]
  46. Sweeney, J.C.; Soutar, G.N. Consumer perceived value: The development of a multiple item scale. J. Retail. 2001, 77, 203–220. [Google Scholar] [CrossRef] [Scilit]
  47. Bongaarts, J. Human population growth and demographic transition. Philos. Trans. R. Soc. B 2009, 364, 2985–2990. [Google Scholar] [CrossRef] [Scilit]
  48. Lee, R.; Mason, A. Fertility, human capital and economic growth. Eur. J. Popul. 2010, 26, 159–182. [Google Scholar] [CrossRef] [Scilit]
  49. Seo, J.; Yoon, S.; Kim, J.; Kwon, K. Regional Youth Population Prediction Using LSTM. Sustainability 2025, 17, 6905. [Google Scholar] [CrossRef] [Scilit]
  50. Mora, L.; Bolici, R.; Deakin, M. The first two decades of smart city research: A bibliometric analysis. J. Urban Technol. 2017, 24, 3–27. [Google Scholar] [CrossRef] [Scilit]
  51. Oh, J.; Li, M.; Jung, J. Response to shrinking cities: Cultural urban regeneration. Cities 2024, 155, 105447. [Google Scholar] [CrossRef] [Scilit]
  52. Dillman, D.A.; Smyth, J.D.; Christian, L.M. Internet, Phone, Mail, and Mixed-Mode Surveys: The Tailored Design Method; Wiley: Hoboken, NJ, USA, 2014. [Google Scholar]
  53. Podsakoff, P.M.; MacKenzie, S.B.; Lee, J.Y.; Podsakoff, N.P. Common method biases in behavioral research. J. Appl. Psychol. 2003, 88, 879–903. [Google Scholar] [CrossRef] [Scilit] [PubMed]
  54. Etikan, I.; Musa, S.A.; Alkassim, R.S. Comparison of convenience sampling and purposive sampling. Am. J. Theor. Appl. Stat. 2016, 5, 1–4. [Google Scholar] [CrossRef] [Scilit]
  55. Bentler, P.M.; Chou, C.P. Practical issues in structural modeling. Sociol. Methods Res. 1987, 16, 78–117. [Google Scholar] [CrossRef] [Scilit]
  56. Hair, J.F.; Black, W.C.; Babin, B.J.; Anderson, R.E. Multivariate Data Analysis, 8th ed.; Pearson: London, UK, 2019. [Google Scholar]
  57. Nunnally, J.C.; Bernstein, I.H. Psychometric Theory, 3rd ed.; McGraw-Hill: New York, NY, USA, 1994. [Google Scholar]
  58. Kaiser, H.F. An index of factorial simplicity. Psychometrika 1974, 39, 31–36. [Google Scholar] [CrossRef] [Scilit]
  59. Fornell, C.; Larcker, D.F. Evaluating structural equation models with unobservable variables. J. Mark. Res. 1981, 18, 39–50. [Google Scholar] [CrossRef] [Scilit]
  60. Kline, R.B. Principles and Practice of Structural Equation Modeling; Guilford Press: New York, NY, USA, 2016. [Google Scholar]
  61. Preacher, K.J.; Hayes, A.F. Asymptotic and resampling strategies for assessing indirect effects. Behav. Res. Methods 2008, 40, 879–891. [Google Scholar] [CrossRef] [Scilit]
  62. Leong, L.Y.; Hew, T.S.; Tan, G.W.H.; Ooi, K.B. Predicting the determinants of the NFC-enabled mobile credit card acceptance: A neural networks approach. Expert Syst. Appl. 2020, 40, 560–569. [Google Scholar] [CrossRef] [Scilit]
  63. Ministry of Digital Development and Information. Smart Nation 2.0: A Thriving Digital Future for All; Government of Singapore: Singapore, 2024. Available online: https://file.go.gov.sg/smartnation2-report.pdf (accessed on 16 April 2026).
  64. Ajuntament de Barcelona. Mesura de Govern: Barcelona Digital City Plan (2017–2020); Barcelona City Council: Barcelona, Spain, 2017. Available online: https://bcnroc.ajuntament.barcelona.cat/jspui/bitstream/11703/115020/1/LE_MesuradeGovern_EN.pdf (accessed on 16 April 2026).
Figure 1. Hypothesized research model. Solid lines represent hypothesized direct relationships, whereas dashed lines denote indirect effects mediated by perceived demographic sustainability (PDS).
Sustainability 18 04055 g001
Figure 2. Structural equation model with standardized path coefficients. Note: Standardized path coefficients are reported. * p < 0.05, ** p < 0.01, *** p < 0.001.
Sustainability 18 04055 g002
Table 1. Demographic characteristics of the sample.
VariableDistribution (%)
Age20–24 (9.37), 25–29 (54.21), 30–34 (26.62), 35–40 (9.80)
GenderMale (59.11), Female (40.89)
EducationHigh school or below (9.05), Junior college (33.65),
Bachelor (39.83), Master (10.54), Doctoral or above (6.92)
EmploymentFull-time employee (54.95), Part-time/freelance (22.90), Student (7.99), Unemployed/job seeking (13.84), Other (0.32)
Residence length in Busan<1 year (7.56), 1–3 years (36.32), 4–6 years (33.12),
7–10 years (12.99), >10 years (10.01)
Table 2. Reliability and validity statistics.
ConstructItemCronbach’s αCRAVE
Accessibility and Efficiency of Public Services (PV-A)30.7520.7540.505
Transparency and Information Accessibility (PV-T)30.8080.8090.586
Participation and Responsiveness (PV-P)30.8320.8320.623
Career Development and Innovation Support (PV-C)30.7850.7860.552
Contribution to Urban Quality of Life (PV-Q)30.8240.8250.611
Perceived Demographic Sustainability (PDS)60.8930.8930.582
Youth Retention Intention (YRI)60.8950.8950.587
Note: Cronbach’s α = internal consistency reliability; CR = composite reliability; AVE = average variance extracted.
Table 3. Discriminant validity (Fornell–Larcker).
ConstructPV-APV-TPV-PPV-CPV-QPDSYRI
PV-A0.711
PV-T0.2650.766
PV-P0.3770.30.789
PV-C0.1840.3270.2510.743
PV-Q0.1850.4220.3030.3920.781
PDS0.3080.450.3850.3340.40.763
YRI0.3420.4640.4150.3790.4410.5490.766
Note: Diagonal elements (bold) represent the square roots of the average variance extracted (AVE). Off-diagonal elements represent the correlations among constructs. PV-A = Accessibility and Efficiency of Public Services; PV-T = Transparency and Information Accessibility; PV-P = Participation and Responsiveness; PV-C = Career Development and Innovation Support; PV-Q = Contribution to Urban Quality of Life; PDS = perceived demographic sustainability; YRI = youth retention intention.
Table 4. Structural path coefficients and hypothesis testing.
HypothesisPathStandardized βt-Valuep-Value
H1aPV-A → YRI0.1212.984<0.01
H1bPV-T → YRI0.1623.981<0.001
H1cPV-P → YRI0.1383.214<0.01
H1dPV-C → YRI0.1273.006<0.01
H1ePV-Q → YRI0.1493.475<0.01
H2aPV-A → PDS0.1423.316<0.01
H2bPV-T → PDS0.2836.535<0.001
H2cPV-P → PDS0.1854.542<0.001
H2dPV-C → PDS0.1543.628<0.01
H2ePV-Q → PDS0.1673.879<0.001
H3PDS → YRI0.3127.021<0.001
Note: Standardized coefficients are reported.
Table 5. Bootstrap test of mediating effects.
PathIndirect Effect (β)Boot SE95% CI Lower95% CI UpperResult
PV-A → PDS → YRI0.0440.0120.0210.069Significant
PV-T → PDS → YRI0.070.0150.0430.101Significant
PV-P → PDS → YRI0.0580.0140.0330.086Significant
PV-C → PDS → YRI0.0340.010.0160.056Significant
PV-Q → PDS → YRI0.0520.0130.0280.079Significant
Note: Bootstrap resampling = 5000. A mediating effect is significant when the 95% confidence interval does not include zero.
Disclaimer/Publisher’s Note: The statements, opinions and data contained in all publications are solely those of the individual author(s) and contributor(s) and not of MDPI and/or the editor(s). MDPI and/or the editor(s) disclaim responsibility for any injury to people or property resulting from any ideas, methods, instructions or products referred to in the content.