1. Introduction
Inventory management constitutes one of the key functional areas of manufacturing enterprises, directly influencing the level of operational costs, the continuity of production processes, and the quality of customer service. Maintaining inventory at an inappropriate level may lead both to excessive immobilization of working capital and to the risk of production downtime resulting from material shortages [
1,
2,
3,
4]. Under conditions of increasing demand volatility, global disruptions in supply chains, and growing pressure to optimize costs, analytical methods supporting decision-making in the area of inventory management are gaining particular importance. Proper determination of inventory levels is an important element in implementing sustainable development principles. Rational resource management reduces overproduction, material losses, and inefficient use of raw materials. Contemporary approaches to inventory management increasingly incorporate circular economy principles. Their objective is to maximize resource utilization and minimize waste generation throughout the product life cycle. Well-designed inventory planning and control systems support these goals. They reduce excessive stock levels, limit material obsolescence, and improve alignment between purchasing, production, and actual demand [
5,
6,
7,
8]. In this context, inventory management has not only an economic dimension but also environmental and social significance. One of the commonly applied approaches in inventory management involves inventory classification methods, which enable the segmentation of materials according to specific economic and operational criteria. In this regard, the ABC and XYZ methods are particularly important, as they allow for the assessment of the cost significance of individual materials as well as the stability of their demand over time. The combination of both classifications in the form of the ABC/XYZ matrix makes it possible to simultaneously consider the economic value of inventories and the risk resulting from irregular consumption patterns, thereby providing a practical tool supporting the development of inventory policies [
9,
10,
11,
12]. Such an approach also promotes more responsible resource management, as it allows optimization efforts to focus on those material groups that have the greatest impact on both enterprise costs and the efficiency of raw material utilization. An important complement to inventory classification is demand forecasting, which enables the prediction of future levels of material consumption and the planning of purchasing activities in advance. However, the effectiveness of forecasts largely depends on the characteristics of the historical data, particularly the regularity of demand as well as the presence of trends and seasonality [
13,
14,
15,
16,
17]. In manufacturing practice, the structure of material consumption is often highly heterogeneous, which limits the possibility of applying uniform forecasting methods across the entire assortment. The appropriate alignment of forecasting methods with the specific characteristics of individual material groups may contribute not only to improved operational efficiency but also to the reduction of overproduction and resource waste, which is consistent with the principles of sustainable development. Therefore, an approach integrating inventory classification with the analysis of demand forecasting possibilities for individual material groups appears justified. Such an approach makes it possible not only to better understand the inventory structure within an enterprise but also to consciously select planning and inventory control methods depending on consumption characteristics [
18,
19,
20]. The integration of analytical tools in the field of inventory management can support the development of more efficient and resilient production systems, while simultaneously promoting the rational use of resources in line with the principles of sustainable development and the circular economy.
This study contributes to this research stream by presenting the practical application of ABC/XYZ classification methods and selected demand forecasting models using anonymized data from a real manufacturing enterprise. The aim of the study is to conduct a quantitative analysis of the inventory structure in a manufacturing company using the ABC and XYZ classification methods and to evaluate the possibility of forecasting demand for selected groups of materials, taking into account aspects of sustainable resource management. Such an approach supports rational material management, reduces excessive inventory levels, and minimizes raw material losses, thereby aligning with the sustainable development strategies of manufacturing enterprises. The analysis was conducted using anonymized historical data obtained from the ERP system, covering a period of 36 months and aggregated at the monthly level. Items characterized by incidental or highly irregular consumption were excluded from further analysis. Inventory segmentation was performed using the ABC method based on consumption value and the XYZ method based on the coefficient of demand variability. The results were presented in the form of an ABC–XYZ matrix. This approach enabled a multidimensional evaluation of inventory items in terms of both their economic importance and consumption dynamics. For selected representative materials, demand forecasting models were applied. Forecast accuracy was assessed using standard ex post error measures. The results showed varying levels of forecasting accuracy across segmentation classes. This confirms the value of integrating classification and forecasting methods within decision-support systems for inventory management. The scientific contribution of this study lies in demonstrating that the integration of ABC–XYZ analysis with demand forecasting can support more efficient and responsible management of material resources. It contributes to reducing excess inventory, minimizing losses, and supporting the sustainable development of manufacturing enterprises. The analyses were conducted using quantitative methods and time series models implemented in the Python 3.13.2 environment. The study does not address safety stock optimization or the dynamic analysis of logistics costs. These areas may be considered in future research.
From a sustainability perspective, the integration of ABC–XYZ classification and demand forecasting reduces environmental impact through several mechanisms. First, enhanced inventory segmentation enables the identification of high-value and high-rotation items, allowing for tighter inventory control and lower excess stock levels. This, in turn, reduces warehouse space requirements and associated energy consumption. Second, improved demand predictability mitigates the risk of overproduction and material obsolescence, thereby minimizing waste generation and the environmental burden linked to raw material extraction and processing. Finally, more accurate forecasting facilitates better alignment between supply and demand, resulting in more efficient resource utilization across the supply chain.
Despite the extensive body of literature on ABC–XYZ classification and demand forecasting, existing studies predominantly examine either inventory segmentation or forecasting models in isolation. Limited attention has been given to their integrated application, particularly in the context of operational decision-making in real industrial environments. This study addresses this gap by:
- (i)
Combining ABC–XYZ classification with a quantitative evaluation of demand forecastability;
- (ii)
Applying the approach to real industrial data from a manufacturing company;
- (iii)
Linking inventory structure analysis with sustainable resource management, particularly in terms of reducing excess inventory and associated waste.
Therefore, the novelty of this work lies not in the individual methods employed, but in their integration and empirical validation in a real-world industrial setting.
This study is grounded in the concepts of resource efficiency and lean and green operations. From this perspective, inventory optimization enhances sustainability by minimizing waste, reducing unnecessary resource consumption, and improving material flow efficiency. ABC–XYZ classification supports the prioritization of critical resources, while demand forecasting improves the alignment between supply and demand, consistent with the principles of waste minimization and circular economy-oriented resource management.
In this context, efficient inventory management should be viewed as a foundational element of sustainable operations rather than a direct sustainability solution. By improving inventory control and reducing inefficiencies, companies create conditions that support broader sustainability objectives, including waste reduction and improved resource productivity.
2. Literature Review
Contemporary literature in the fields of logistics, operations management, and supply chain management indicates that inventory management constitutes a critical area influencing the implementation of sustainable development concepts in enterprises [
21,
22,
23,
24,
25]. Traditionally, inventories were primarily viewed as a component of a company’s working capital, with their main function being to ensure the continuity of production and sales operations. In recent years, however, this perspective has expanded to include environmental and social aspects, reflecting the growing importance of sustainable supply chain management. Inventory management directly affects the utilization of natural resources, transport intensity, and the amount of generated waste. Excessive inventories lead to the inefficient use of warehouse space, increased energy consumption, and the risk of material and product obsolescence [
26,
27,
28,
29]. Conversely, insufficient inventory levels may necessitate expedited shipments, production downtime, and unplanned deliveries. Consequently, the literature emphasizes the need to balance economic efficiency with responsible resource management, which forms one of the foundations of sustainable development. In this context, the links between inventory management and the circular economy are increasingly highlighted. The circular economy aims to maximize the value of resources by keeping them in economic circulation for as long as possible. In a circular model, material flows do not end at the point of product sale but also encompass processes such as recovery, reuse, repair, refurbishment, and recycling [
30,
31,
32]. This implies that enterprises manage not only traditional inventories of raw materials and finished products but also returned products, components for refurbishment, and secondary raw materials. The literature emphasizes that effective inventory management can support the implementation of circular economy principles by reducing overproduction, minimizing material losses, and increasing resource utilization efficiency. A key role in this context is played by analytical tools that enable the identification of materials with the highest economic and operational significance. One of the most commonly used tools is the ABC method, based on the Pareto principle [
33,
34,
35]. The classification of materials according to their economic value allows management efforts to focus on inventory items that generate the largest portion of inventory costs. From the perspective of sustainable development, this approach not only optimizes costs but also promotes a more rational use of organizational resources and reduces unnecessary logistical operations. Focusing control on high-value materials also helps limit losses due to obsolescence or poor inventory management [
36,
37]. Complementing value-based analysis, the XYZ method focuses on demand variability and predictability. This analysis allows better alignment of inventory policies with the demand characteristics of individual materials [
38,
39,
40]. In terms of sustainable development, it is particularly important to reduce excessive stock for products with stable demand and to apply more flexible procurement strategies for items with high demand variability, thereby minimizing overproduction and the amount of unused materials. A particularly effective tool for supporting sustainable inventory management is the integration of both methods in the form of an ABC/XYZ matrix [
41,
42]. Combining the economic value criterion with demand variability analysis enables a more precise adaptation of inventory management strategies to the characteristics of specific material groups. The literature indicates that using this matrix can reduce both storage costs and inefficient material flows within the supply chain. As a result, enterprises can better control resource utilization and minimize the environmental impact of logistics activities. Another important factor supporting the implementation of circular economy principles is the development of modern IT technologies in warehouse and inventory management. The integration of ERP and WMS systems allows real-time monitoring of material flows, identification of inventory surpluses, and more accurate demand planning [
43,
44,
45]. Automatic identification technologies, such as barcodes or RFID, enhance the transparency of logistics processes and facilitate the tracking of product and component life cycles. From the perspective of the circular economy, it is particularly important to monitor secondary material flows and manage returns and recovery processes. The literature also highlights the growing role of warehouse automation and the use of analytical tools based on demand forecasting and data analysis. These solutions enable more precise production and material requirement planning, supporting the reduction of overproduction and waste [
46,
47,
48]. At the same time, the digitalization of logistics processes increases supply chain transparency, which is a key component of implementing sustainable development strategies in enterprises.
In summary, contemporary approaches to inventory management increasingly consider not only economic aspects but also environmental and organizational factors. The integration of classification tools, the development of information technologies, and the incorporation of circular economy principles into material flow management enable enterprises to build more efficient and sustainable logistics systems. Within this framework, the ABC and XYZ methods, as well as the ABC/XYZ matrix, serve not only as cost optimization tools but also as instruments that support rational resource management and the implementation of sustainable development strategies in modern manufacturing enterprises [
49,
50,
51,
52]. In contrast to previous studies, which typically treat ABC classification and demand forecasting as separate analytical processes, this study integrates both approaches to support more informed inventory management decisions.
An extension of the sustainable inventory management approach is the development of green logistics, which focuses on minimizing the environmental impact of logistics processes. The literature emphasizes that warehouse logistics and inventory management are key areas influencing the level of greenhouse gas emissions in manufacturing and distribution enterprises. These emissions stem from material transportation, energy consumption in storage facilities, operation of handling equipment, and maintaining excessive inventory levels that require additional storage space. Therefore, rational inventory level planning and optimization of warehouse processes can contribute to reducing energy consumption, decreasing the number of transport operations, and lowering CO
2 emissions across the supply chain [
53,
54,
55]. In practice, enterprises are increasingly implementing solutions such as energy-efficient lighting systems, warehouse process automation, the use of renewable energy, and transport route optimization, all of which help reduce the carbon footprint of logistics operations.
From the perspective of the circular economy, the integration of logistics activities with resource recovery and reuse processes is particularly important. Green logistics encompasses not only the optimization of material flows from suppliers to customers but also the development of reverse logistics, which enables the recovery of value from products at the end of their life cycle [
56,
57,
58]. In this context, an inventory management system should also account for secondary material flows, components designated for refurbishment, and products returned by customers [
59,
60,
61]. Proper planning of these processes helps to reduce the consumption of primary raw materials, minimize waste, and increase resource utilization efficiency within the enterprise. The literature emphasizes that the integration of green logistics, circular economy principles, and modern inventory management tools contributes to the development of more resilient and sustainable supply chains, in which economic objectives are achieved in parallel with minimizing the environmental impact of business operations [
62].
Consequently, a significant research gap can be identified in the insufficient linkage between inventory segmentation methods and demand forecasting with the concept of sustainable resource management in manufacturing enterprises. Existing studies rarely examine how the integration of these tools can support not only economic efficiency but also the reduction in excessive resource consumption, minimization of material losses, and improvement of the environmental performance of logistics processes. Addressing this research gap requires an analysis of how the combination of inventory segmentation (e.g., using the ABC/XYZ matrix) and demand forecasting methods can facilitate more rational inventory planning and thereby contribute to the implementation of sustainable development principles in manufacturing enterprises. For this reason, the present article focuses on evaluating the role of these tools as components of an inventory management system that supports efficient resource utilization while mitigating the negative environmental impacts of production and logistics activities.
Although numerous studies have addressed ABC and XYZ classification methods, as well as demand forecasting techniques, there remains a research gap in integrating these approaches for simultaneous inventory segmentation and a forecastability assessment. Previous studies have largely focused on:
- -
Optimizing inventory levels using ABC analysis;
- -
Improving forecasting accuracy using statistical or AI-based models;
- -
Applying XYZ classification to assess demand variability.
However, few studies combine these dimensions into a unified decision-support framework, particularly in the context of sustainable inventory management. This gap justifies the approach adopted in this study.
While prior studies have emphasized the operational benefits of ABC/XYZ classification and demand forecasting, their role in supporting environmental sustainability has received less attention. In particular, the mechanisms through which improved inventory control contributes to reduced energy consumption, lower material waste, and decreased carbon emissions remain insufficiently explored. This study addresses this gap by explicitly linking inventory optimization with sustainability outcomes.
3. Materials and Methods
3.1. Scope and Structure of Data
The objective of the study was to identify the inventory structure using the ABC and XYZ methods, integrate them in the form of an ABC/XYZ matrix, and evaluate the feasibility of demand forecasting for selected material groups. The analysis was conducted in the context of sustainable resource management, where inventory optimization contributes to reducing excessive stock levels, minimizing material losses, and achieving more efficient use of raw materials. The research methodology encompassed a set of analytical procedures aimed at assessing the inventory structure and variability of material demand. The analyses were conducted based on historical data on material consumption and warehouse operations. The research process included the following steps:
ABC classification—assigning materials to classes based on their consumption value.
XYZ demand variability analysis—assigning materials to classes based on the coefficient of variation.
Integration of ABC and XYZ classifications—constructing the ABC/XYZ matrix, enabling the identification of material groups with different economic significance and demand dynamics.
Selection of representative materials—for further forecasting analyses and an evaluation of demand forecasting models.
The applied methodology enables a comprehensive assessment of the inventory structure, supports demand forecasting, and promotes rational resource management and waste reduction, which are crucial for the sustainable development of manufacturing enterprises. The analyses were based on ERP (Enterprise Resource Planning) data covering several hundred active material items used in production processes. The source data included daily records of receipts, issues, consumption, and unit prices, which allowed for the calculation of the consumption value. For the purposes of analysis, the data were aggregated at the monthly level, which reduced short-term variability and facilitated the analysis of medium-term demand. The data covered a period from 2022, taking into account the introduction or withdrawal of certain materials. The dataset was prepared as a monthly time series, ensuring completeness and continuity for the purposes of demand forecasting. All data for 2025 represent forecasted values generated for analytical purposes and do not correspond to actual observed consumption.
3.2. ABC and XYZ Classification Criteria
Inventory segmentation was conducted using the classical ABC method, based on the annual consumption value of materials, and the XYZ method, which relies on the coefficient of demand variability. The annual consumption value was calculated as the product of the cumulative material consumption over the period analyzed and its unit price. Material items were then ranked in descending order of value, allowing for the identification of materials of critical economic significance. Assignment of materials to classes A, B, and C was performed according to widely accepted thresholds:
Class A included items accounting for approximately 70–80% of the total consumption value;
Class B represented the next 15–25%;
Class C comprised the remaining 5–10%.
This approach highlights critical materials for enterprise operations, supporting efficient resource management and waste minimization, in line with sustainable development principles. The XYZ classification was based on the analysis of demand variability over time. For this purpose, the coefficient of variation (CV) was calculated as the ratio of the standard deviation of monthly consumption to its mean value. Materials were assigned to classes X, Y, and Z according to the following thresholds:
Class X—low demand variability (CV ≤ 0.50);
Class Y—moderate variability (0.50 < CV ≤ 1.00);
Class Z—high demand instability (CV > 1.00).
The results of the ABC and XYZ classifications were combined in a 3 × 3 matrix, enabling the simultaneous assessment of both the economic significance of materials and the predictability of their consumption. This matrix formed the basis for the selection of representative inventory items for further forecasting analyses, supporting rational and sustainable inventory planning decisions. For materials with short time series, covering fewer than 12 months of observations, only the ABC/XYZ classification was applied, and the automatic construction of forecasting models was omitted.
3.3. Forecasting Methods and Tools
Demand forecasting was conducted using the Python environment, specifically leveraging the pandas and numpy libraries for data processing and plotly for results visualization. This approach enabled reproducible analyses and a flexible comparison of results across material groups identified in the ABC/XYZ matrix, supporting rational and sustainable inventory decisions [
3]. The analyses applied time series models tailored to the characteristics of the data:
ETS (error trend seasonality)—for series exhibiting a stable level, trend, or seasonality;
Prophet—an additive regression model allowing flexible modeling of trends and seasonal components;
ARIMA (autoregressive integrated moving average)—for series with significant temporal dependencies, after assessing stationarity using the augmented Dickey–Fuller (ADF) test. If the stationarity hypothesis was rejected, appropriate differencing was applied.
The dataset was divided into training and test sets, and forecast accuracy was evaluated using the MAE (mean absolute error) and the MAPE (mean absolute percentage error). The MAE allows straightforward interpretation and is robust to outliers, while the MAPE provides a relative measure of forecast error. Both metrics were interpreted simultaneously, enabling a reliable assessment of forecasting performance and supporting sustainable inventory management decisions.
3.4. Input Data
The empirical study presented the process of data preparation, time series processing, and material classification using the ABC and XYZ methods, and the preparation of data for demand forecasting models for selected material groups. The applied approach enables rational and sustainable inventory management, supporting the reduction in excessive stock levels, the minimization of material losses, and a more efficient use of raw material resources in a manufacturing enterprise [
3]. Due to the large volume of records, reaching several tens of thousands of observations,
Table 1 presents only sample listings for 10 items. The full ABC/XYZ classification analysis was conducted on the complete dataset, while demand forecasting was performed for selected materials that met the quality criteria of the time series. The source data were stored in CSV (Comma-Separated Values) format, allowing further processing and analysis in the Python 3.13.2 environment.
Table 1 presents example input data summaries.
3.5. Preprocessing and Preparing Data for Analysis
Prior to the analysis, data preprocessing was conducted to ensure consistency, completeness, and statistical correctness, which is essential for reliable ABC/XYZ classification and demand forecasting. This approach supports sustainable inventory management by minimizing the risk of excessive stock levels and material waste. The missing monthly material consumption values were replaced with the average of the remaining observations, and the missing unit prices were substituted with the average for the respective material group. For time series containing extreme values or missing data, limited interpolation procedures were applied, preserving the structure of trends and demand variability. To eliminate materials of marginal analytical significance, items for which the total number of ordered units over the entire period was less than 10 were excluded from further analysis. This allowed the focus to remain on economically significant and statistically stable materials, supporting efficient and responsible resource management. The processed data were saved in CSV format, enabling further analysis in the Python 3.13.2 environment, as well as the preparation of tabular summaries and visualizations [
3]. The effects of preprocessing are illustrated in
Table 2 and
Table 3, which present sample processed data and a comparison of selected statistics before and after filtering procedures. All transformed datasets were saved again in CSV format, allowing their continued use in Python for analytical purposes, tabular summaries, and visualization of results.
The significant reduction in the number of analyzed products after preprocessing resulted from the application of a filter that eliminated material items with incidental consumption, which did not have substantial relevance from the perspective of inventory management analysis.
The dataset used in this study covers the period from 2022 to 2025. The analysis was conducted retrospectively using historical data collected from the enterprise. All references to future periods (e.g., 2025) refer to forecasted values generated for analytical purposes rather than actual observed data. This clarification ensures consistency in the interpretation of temporal references throughout the study.
4. Results
4.1. ABC Analysis
Before conducting the analysis, the data were organized and verified to ensure consistency and accuracy, forming the foundation for a reliable assessment of the inventory structure and supporting sustainable resource management. Materials were ranked in descending order according to their annual consumption value, after which their percentage share of the total consumption value and cumulative share were calculated. Based on this, items were assigned to classes A, B, and C according to the Pareto principle:
Class A—materials with a dominant share of the consumption value;
Class B—materials with moderate economic significance;
Class C—items with the least impact on total inventory value.
The adopted classification thresholds correspond to standards in the literature and inventory management practice. The ABC analysis enables concentration of control and management efforts on cost-critical materials, which largely determine the level of capital tied in inventory and the risk of production downtime. Materials with a low consumption value can be managed using simplified procedures, supporting efficient and sustainable resource utilization. In this study,
Table 4 presents example results for ten materials for illustrative purposes. The full classification covered all the active material items of the enterprise, with aggregated results shown in
Table 5. The analysis revealed the following distribution:
Class A—40.62% of items, accounting for 84.93% of the consumption value,
Class B—21.09% of items, generating 10.01% of the consumption value,
Class C—38.28% of items, contributing only 5.06% of the consumption value.
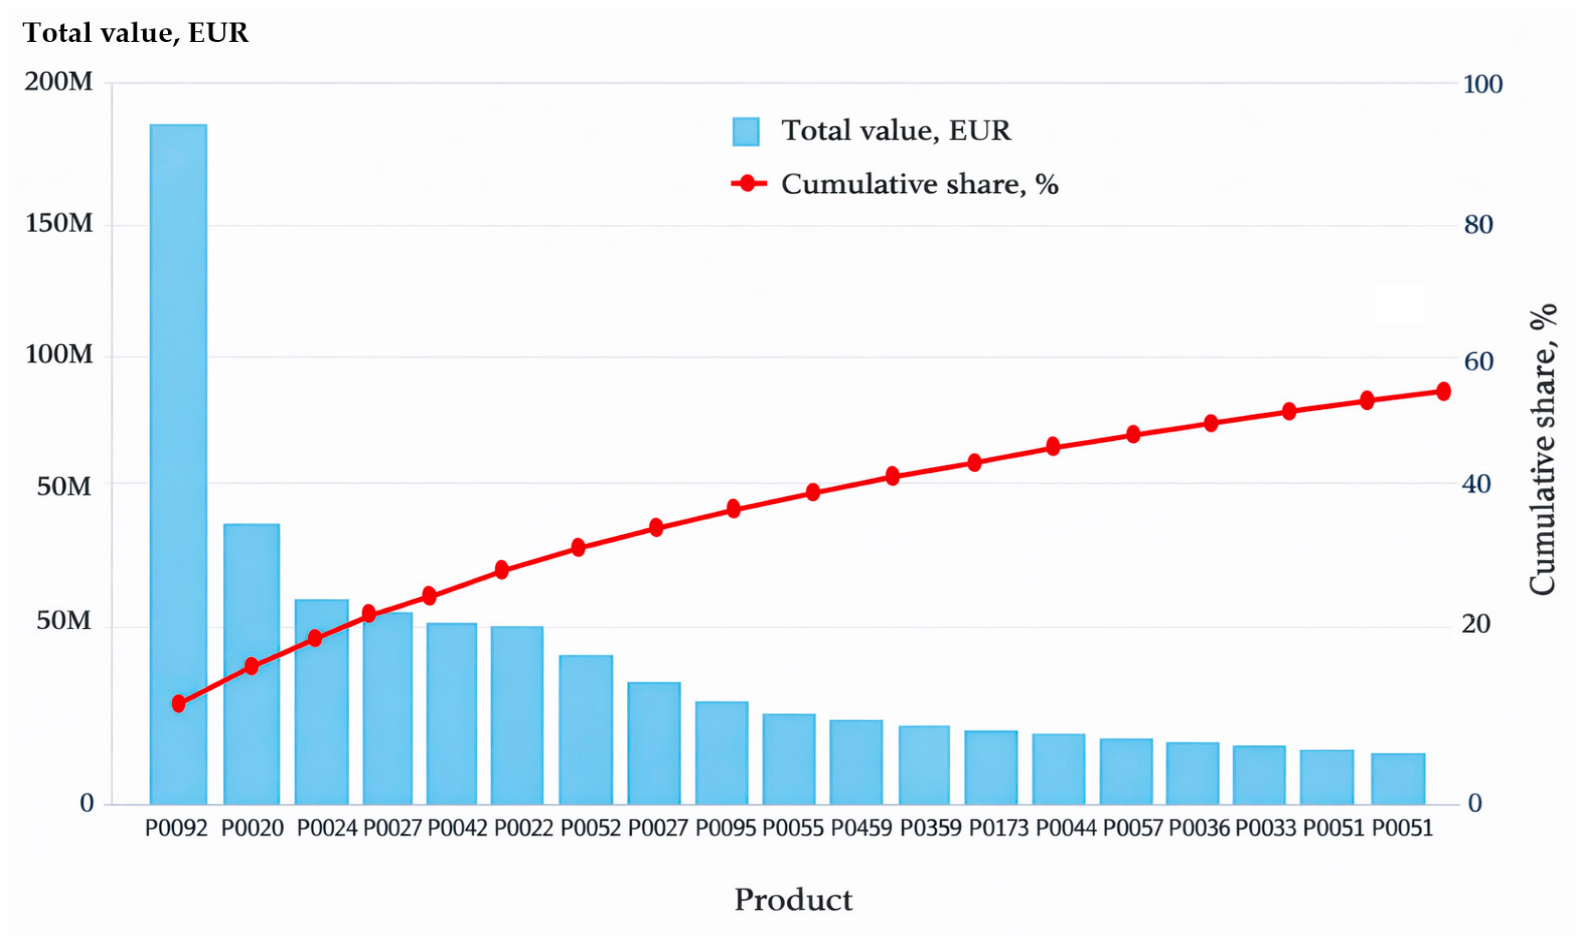
The high concentration of costs in Class A indicates areas where effective inventory planning and control can significantly influence rational and sustainable resource management within the enterprise. Additionally, the Pareto chart (
Figure 1) illustrates the annual consumption value of individual materials and their cumulative share. This visualization allows for the rapid identification of economically critical items and serves as a practical tool supporting purchasing decisions and inventory policy [
3]. For clarity, the chart presents the 20 materials with the highest consumption value.
The ABC analysis that was conducted provides the foundation for the subsequent stages of the study, particularly for the assessment of demand variability using the XYZ method and the construction of the ABC/XYZ matrix (
Table 4 and
Table 5), which enables the simultaneous evaluation of the economic significance of materials and the stability of their consumption.
Table 4.
Examples of ABC analysis results for selected materials.
Table 4.
Examples of ABC analysis results for selected materials.
| ID Product | Total Value [EUR] | ABC Class |
|---|
| P0092 | 45,558,532 | A |
| P0012 | 16,873,169 | A |
| P0240 | 12,769,754 | A |
| P0264 | 2,120,440 | A |
| P0078 | 1,594,925 | B |
| P0062 | 1,584,142 | B |
| P0263 | 1,492,415 | B |
| P0048 | 744,604 | C |
| P0213 | 710,133 | C |
| P0056 | 521,159 | C |
Table 5.
The ABC analysis statistics for the full data set.
Table 5.
The ABC analysis statistics for the full data set.
| ABC Class | Number
Products | Total
Value [EUR] | Share %
Values | Share %
Products |
|---|
| A | 52 | 278,150,377 | 84.93 | 40.62 |
| B | 27 | 32,770,343 | 10.01 | 21.09 |
| C | 49 | 16,586,777 | 5.06 | 38.28 |
4.2. XYZ Analysis
The XYZ analysis, complementing the ABC classification, was performed to assess the variability of demand and the predictability of material consumption, which is crucial for sustainable inventory management and reducing excess storage. In the first stage, the average monthly consumption, standard deviation and coefficient of variation (CV), defined as the ratio of the standard deviation to the average consumption value, were calculated for each material item. On this basis, the materials were assigned to three classes:
X—materials with stable and predictable wear;
Y—materials with moderate variability, often showing a trend or seasonality;
Z—items with irregular and difficult to forecast demand.
The adopted classification thresholds (X: CV ≤ 0.50; Y: 0.50 < CV ≤ 1.00; Z: CV > 1.00) are consistent with the common literature practice, which ensures the comparability of the results and their usefulness in the practice of sustainable resource management. The CV coefficient was calculated based on monthly consumption quantities, which allows for an assessment of the stability of demand regardless of the level of unit prices. The paper presents sample XYZ classification results for ten materials (
Table 6 and
Table 7) for illustrative purposes. The full classification included all materials from the examined data set, creating the basis for integration with the ABC classification and building an ABC/XYZ matrix supporting effective and sustainable inventory management decisions.
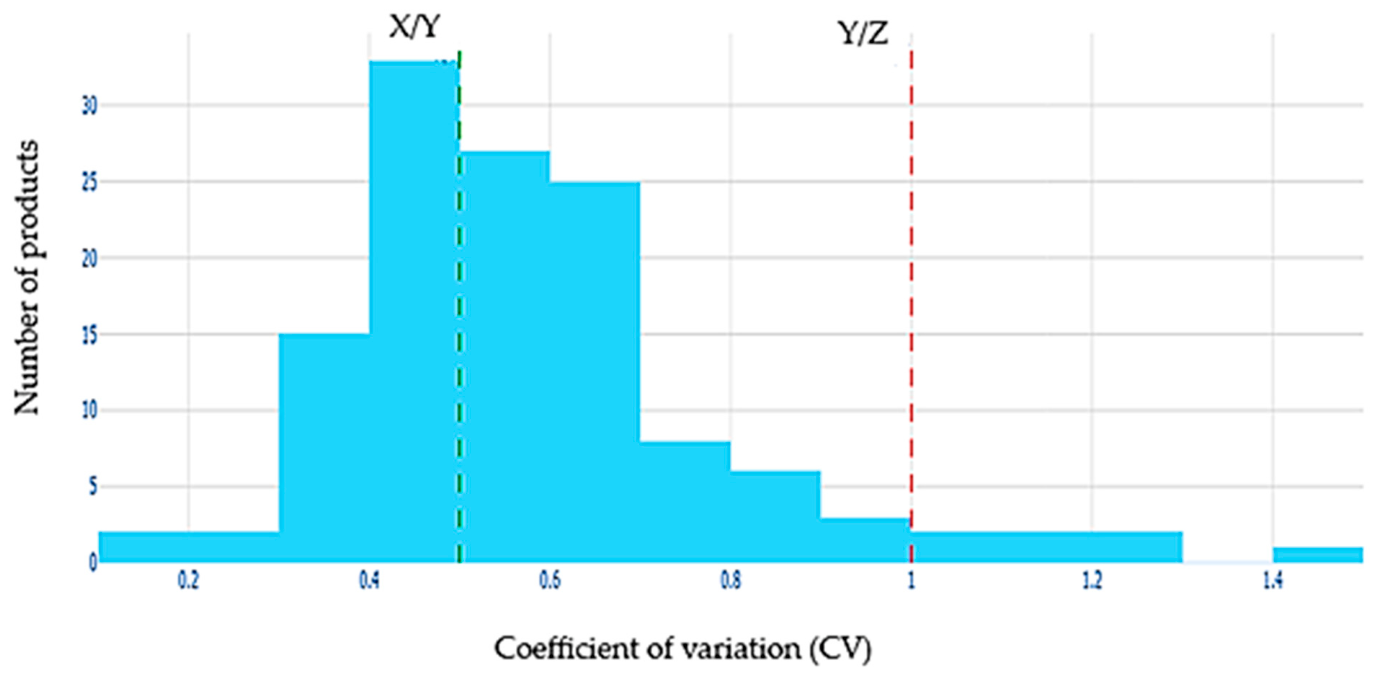
To support the visualization of the variability distribution in consumption, a histogram of the coefficients of variation (CV) was prepared and is presented in
Figure 2. The figure enables the assessment of the structure of materials within the individual classes X, Y, and Z, and allows for the identification of items characterized by the highest demand unpredictability, which require particular attention in order planning and in determining safety stock levels.
The XYZ analysis is an essential step in the construction of the ABC/XYZ matrix, allowing for the simultaneous assessment of the economic importance of materials and the stability of their consumption. Integrating ABC and XYZ classification results enables the development of differentiated inventory management strategies tailored to both economic value and demand characteristics.
4.3. ABC/XYZ Matrix
The ABC/XYZ matrix is developed through the integration of the results of ABC classification, which determines the economic importance of materials, with XYZ classification, which accounts for demand variability. This approach enables the simultaneous evaluation of two key aspects of inventory management: the cost impact of individual materials and the risk resulting from irregular consumption patterns [
3]. The integration of ABC and XYZ classifications allows for the formulation of more precise replenishment strategies and forecasting policies, thereby supporting balanced resource utilization and minimizing excessive inventory levels. The matrix takes the form of a 3 × 3 table, in which the rows correspond to the ABC classes and the columns correspond to the XYZ classes. Individual cells of the matrix are denoted by combinations of letters, such as AX, BY, or CZ, and each segment reflects a unique combination of economic importance and demand stability. Such an approach makes it possible to identify critical materials and to select appropriate inventory management strategies for specific assortment groups. The ABC and XYZ classifications were performed on the same filtered dataset of materials, ensuring consistency of assignments within the matrix.
Table 8 presents an example of an ABC/XYZ matrix for ten materials, illustrating the allocation of items to the respective segments. The complete matrix includes all materials in the analyzed dataset, forming a tool that supports rational and balanced inventory planning as well as the optimization of working capital utilization.
Table 9 shows aggregate segment assignment statistics for the full dataset.
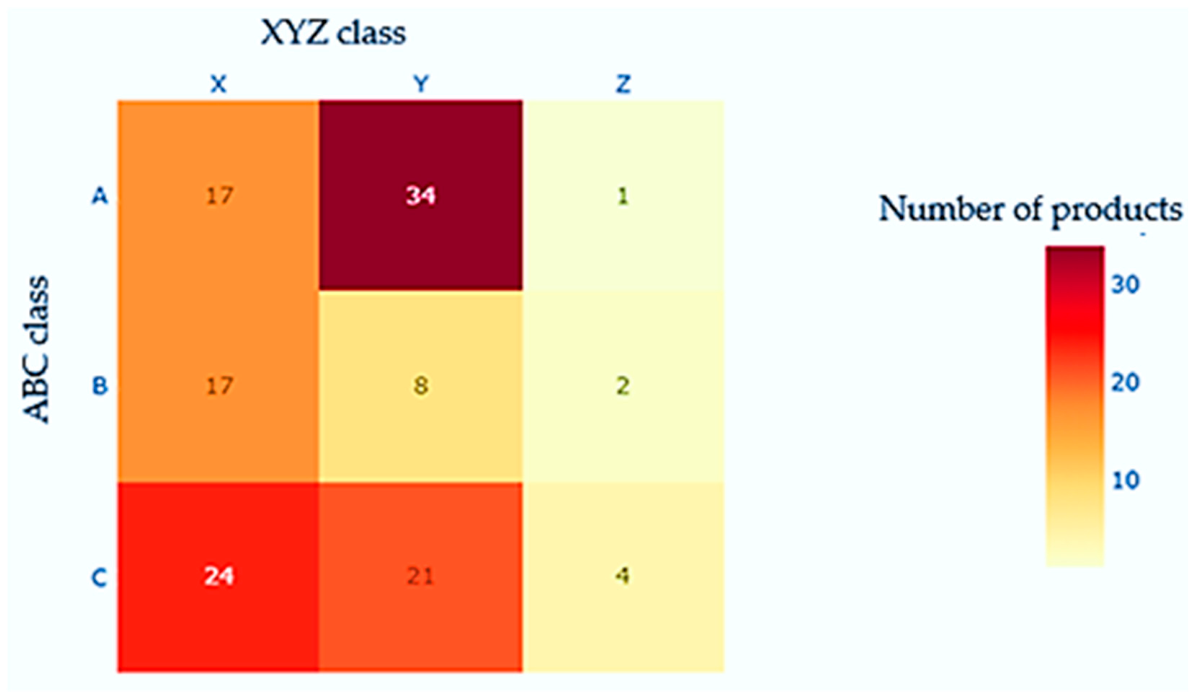
To visually present the distribution of materials within the ABC/XYZ matrix, a heatmap chart was developed (
Figure 3). This graphical representation enables the rapid identification of matrix segments containing materials with high economic importance or significant demand variability [
3]. Such a presentation of the data supports balanced inventory management by facilitating the prioritization of control activities, the planning of safety stock levels, and the selection of appropriate forecasting methods for specific material groups. At the same time, it contributes to reducing excessive inventory levels and promotes the rational use of organizational resources.
The application of the ABC/XYZ matrix enables a better alignment of inventory policies with the specific characteristics of individual materials, reducing costs associated with inventory holding while minimizing the risk of production downtime. The matrix also serves as a starting point for further forecasting analyses, enabling the selection of representative items for demand forecasting models according to their material classification.
4.4. Selecting Representatives for Forecasting
Materials representing different segments of the ABC/XYZ matrix were selected for predictive analysis, which makes it possible to assess the effectiveness of forecasting models in the context of varying economic significance and consumption predictability. Initially, a group of ten materials was considered, but ultimately, four items were qualified for the construction of the models, for which the time series were sufficiently complete and continuous. The basic selection criterion was the number of non-zero observations in the monthly series. Materials with numerous months of zero consumption were excluded because classic time series models (e.g., ARIMA, exponential smoothing methods) require a relatively stable data structure. Artificial zero padding could distort trends, seasonality, and demand variability. The selected materials belonged to different segments of the ABC/XYZ matrix, which allows for a comparison of forecasting effectiveness for items with different economic importance and degree of consumption predictability, supporting rational and sustainable inventory planning. These materials do not constitute a new data set, but are part of a previously classified matrix, which ensures consistency of the entire research process and direct use of classification results in forecasting. Limiting the number of materials analyzed to four items was a compromise between the representativeness of the matrix segments and the readability and detailed presentation of the results, enabling an in-depth analysis of the quality of forecasts without excessively expanding the empirical part of the work.
4.5. Demand Forecasting
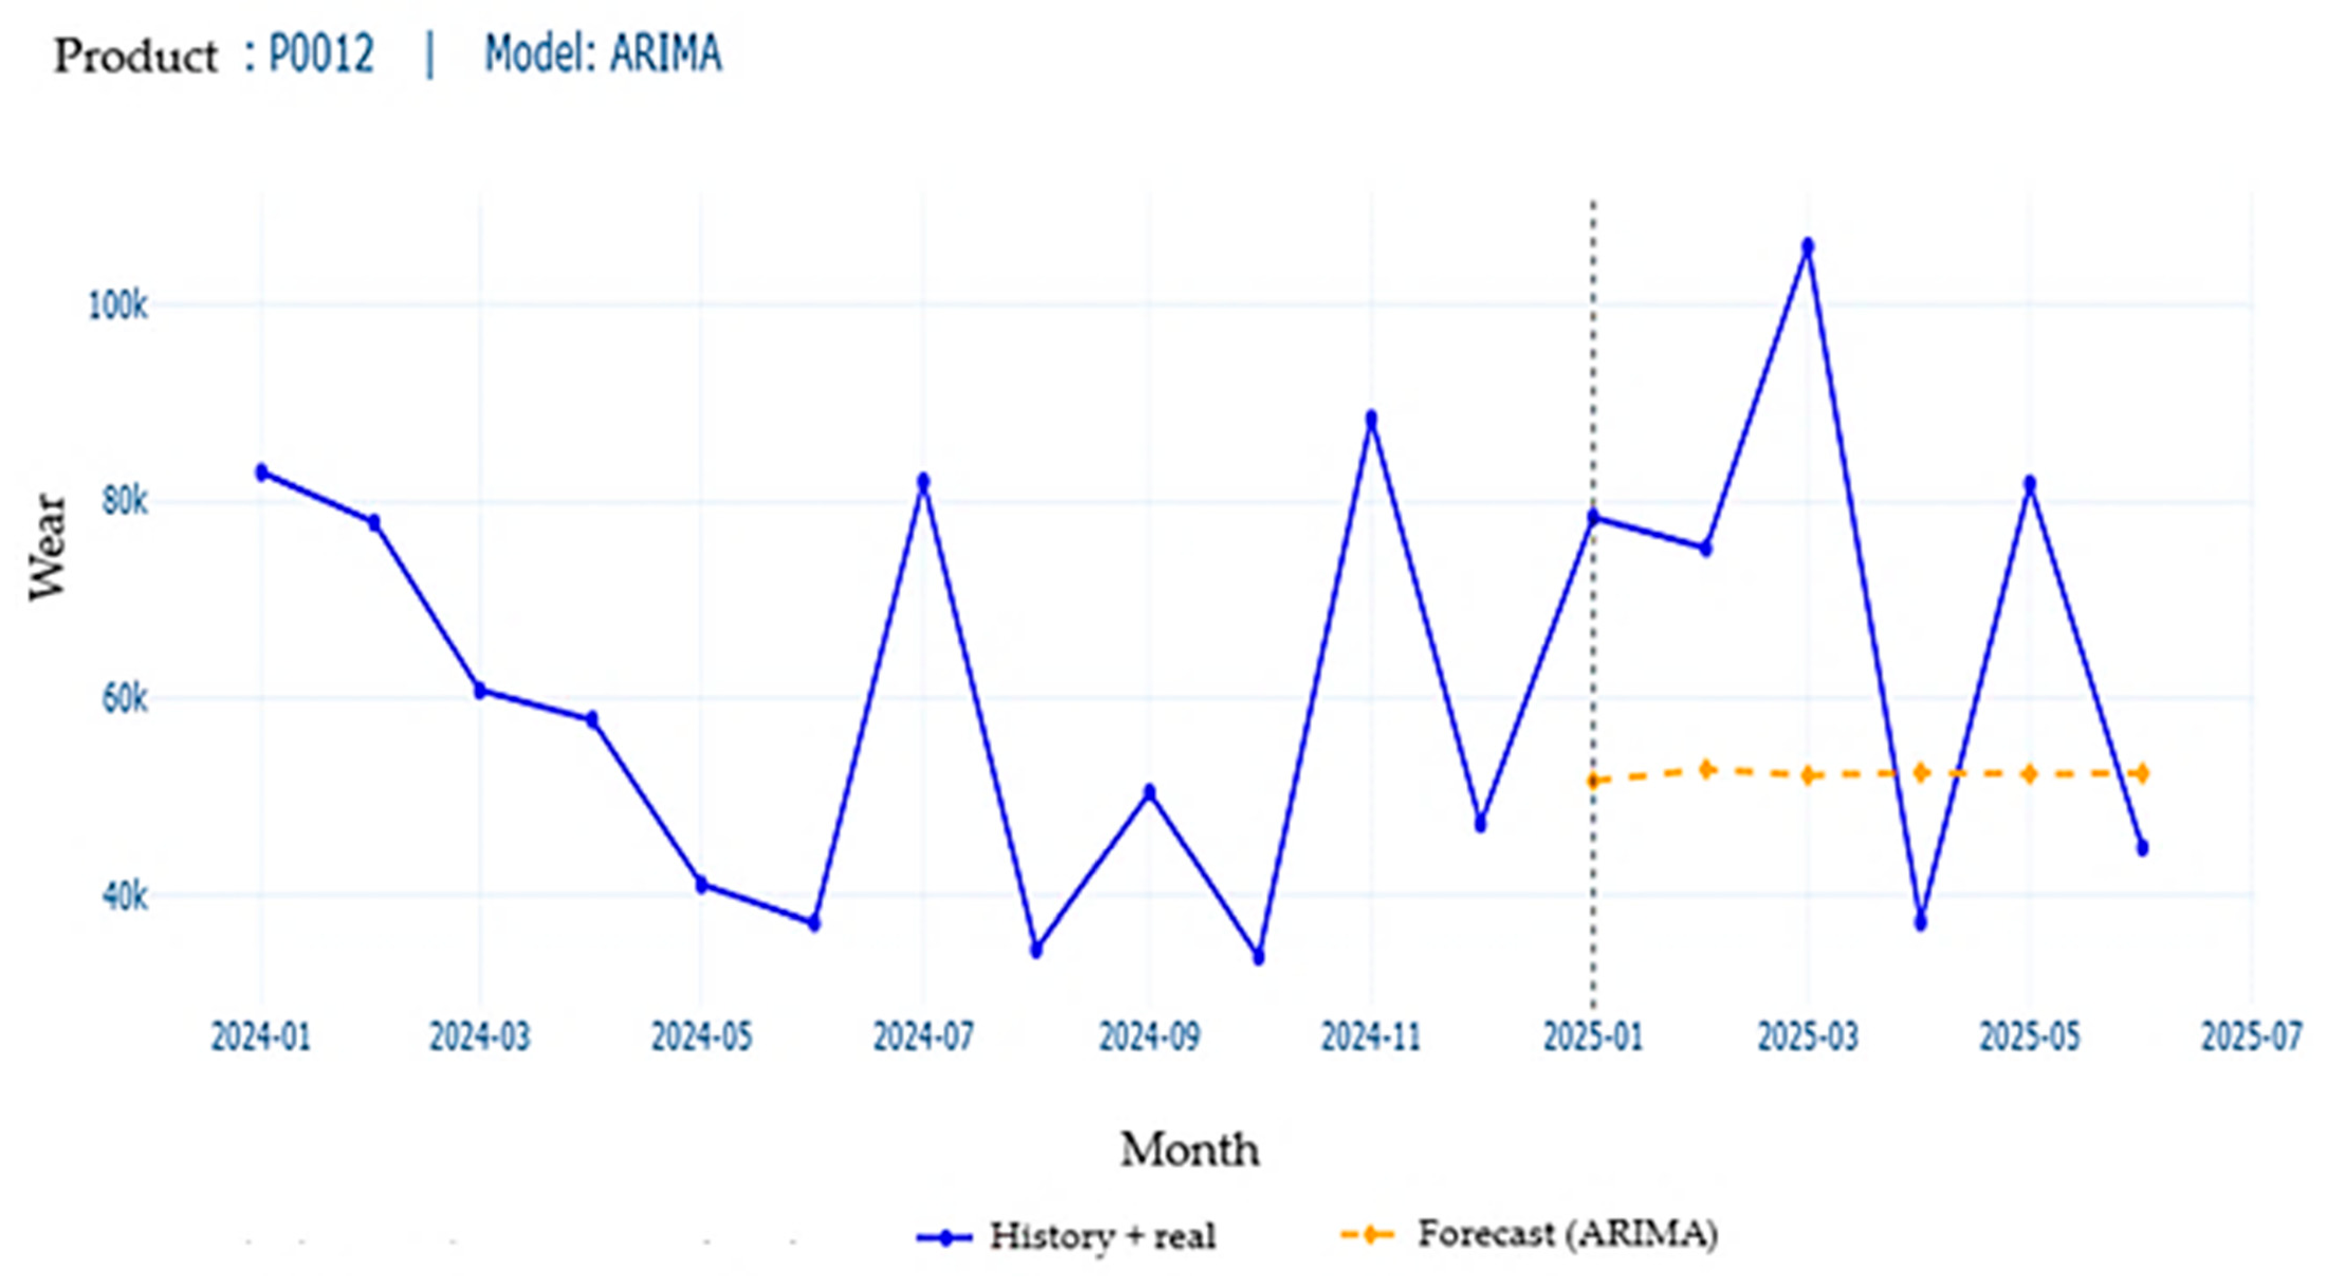
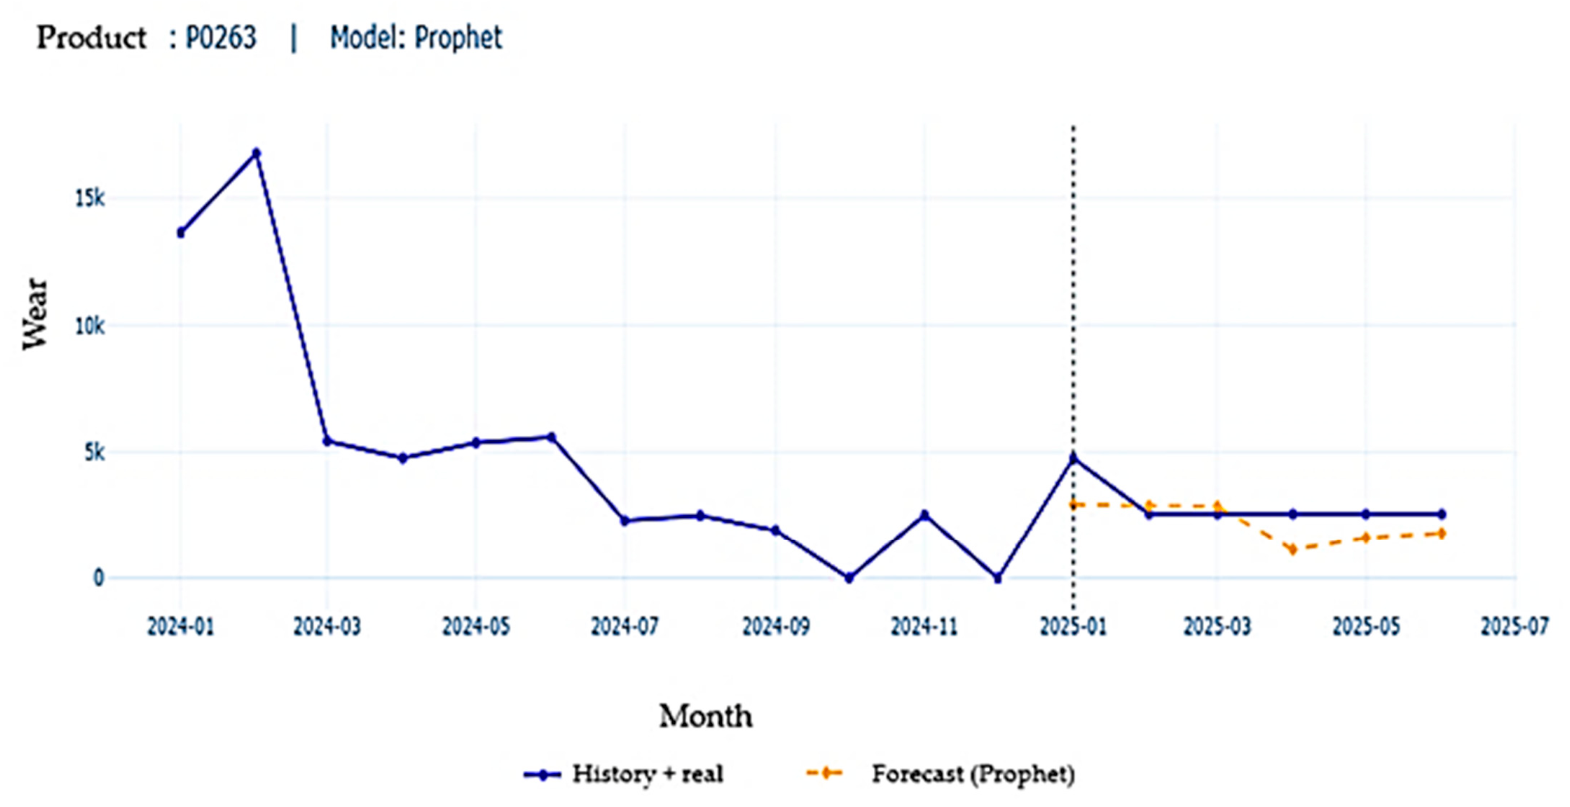
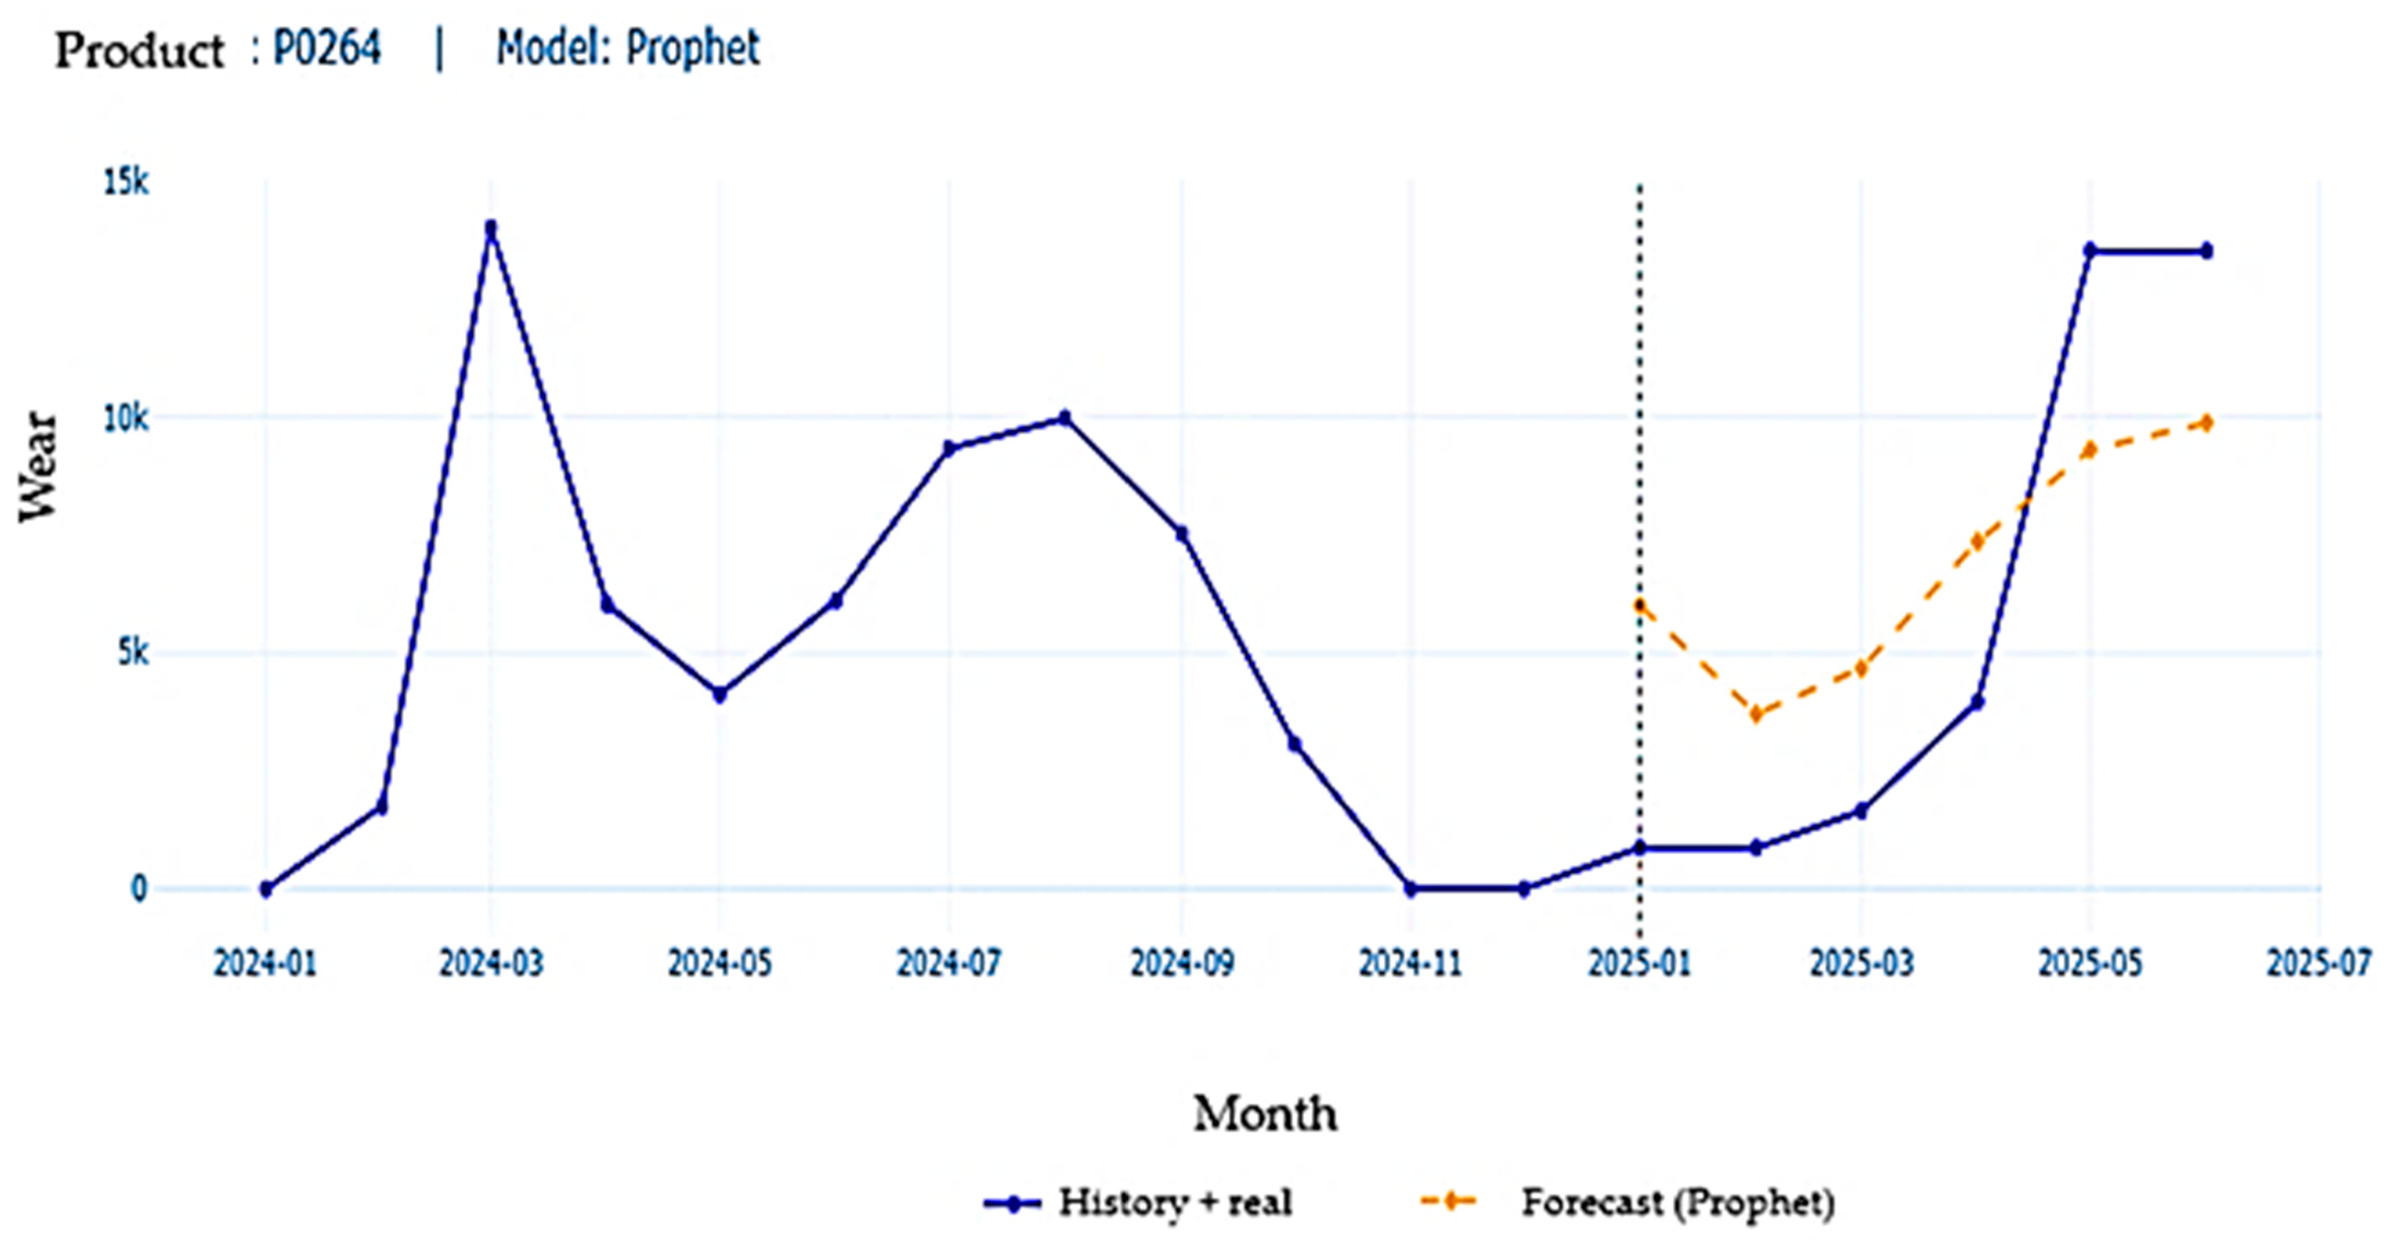
The aim of demand forecasting was to compare the effectiveness of selected time series models for materials with varying demand stability in the context of rational and sustainable inventory management. Predictions were made for four materials representing different segments of the ABC/XYZ matrix (
Table 8). Forecast models were built for each item based on monthly time series covering at least 24 months of historical data. The aggregation of data at the monthly level enabled the identification of trends, seasonality, and demand variability. For the sake of visual clarity, the work presents data from the last 12 months of 2024 and forecasts for the first six months of 2025. The data was divided into a training set, used to estimate model parameters, and a test set covering six months, used to assess the quality of forecasts. A naive model was used as a reference point, and the selected ones were used for forecasting time series models: exponential smoothing (ETS), ARIMA, and Prophet. The selection of the model for individual materials depended on the characteristics of the time series, in particular the stability of consumption, the presence of trends, and the demand irregularities. The quality of the forecasts was assessed using standard error measures: the mean absolute error (MAE) and the mean absolute percentage error (MAPE), calculated from the data from the test set. The analysis of the results allowed us to identify materials for which forecasts are highly accurate, as well as items with a higher risk of error, typical of materials with irregular demand.
Table 10 shows the historical consumption of selected materials in 2024, while
Table 11 and
Table 12 present historical, forecast, and actual consumption data in the first half of 2025, respectively. Analyses prepared in this way support sustainable decisions regarding inventory planning, optimizing the level of storage, and limiting the waste of resources.
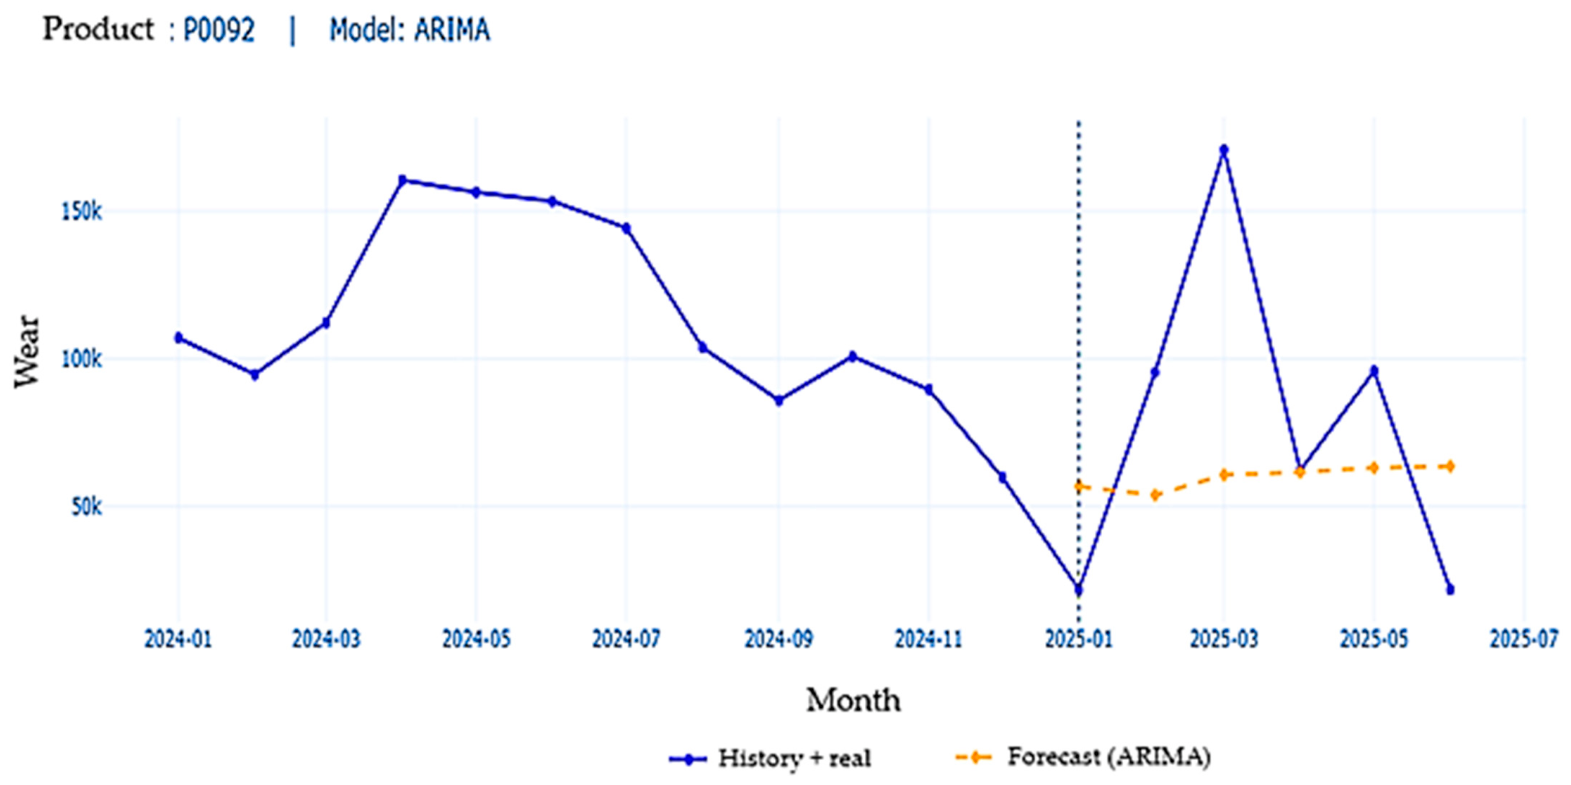
A particularly noteworthy case is item P0092 (AX category), for which the MAPE reaches 82%, despite its classification as a high-value and theoretically stable-demand item. This discrepancy suggests that the assumption of demand stability may not fully capture underlying dynamics. A closer examination of the time series indicates the presence of irregular fluctuations and potential outliers, which may have significantly influenced the forecasting accuracy. In particular, large deviations in individual periods can disproportionately increase the MAPE values, even when the overall demand patterns appear relatively stable. This finding highlights that ABC/XYZ classification, while useful, should not be treated as a definitive indicator of forecastability. Instead, additional diagnostic analysis is required to identify structural breaks, seasonal irregularities, or external disruptions affecting demand.
The selection of four materials for forecasting analysis was intentional and aimed at representing different ABC/XYZ categories. This approach allows for an illustrative comparison of forecasting performance across distinct inventory segments, although it limits the generalizability of the results.
For certain materials, particularly those classified in the Z and AZ categories, the MAPE values reached relatively high levels. This was primarily attributable to the irregular nature of the demand and the occurrence of periods with very low or zero consumption, which tends to inflate the relative percentage error. Under such conditions, the MAPE loses much of its stability and interpretive value. Consequently, the evaluation of forecast performance was complemented by an analysis of the MAE as well as a visual inspection of the fit between the forecasts and the observed data. The results obtained confirm that classical time series models exhibit limited effectiveness when forecasting materials characterized by highly variable demand, a finding consistent with observations reported in the existing literature. In practical inventory management, more suitable approaches for such materials may include rule-based decision frameworks, safety stock policies, or event-driven forecasting methods. In this context, classical statistical models should be regarded primarily as indicative tools that support rational and sustainable decision-making, rather than as precise predictive instruments. The forecasts together with the corresponding actual consumption values are presented in
Figure 4,
Figure 5,
Figure 6 and
Figure 7, which illustrate the four analyzed items [
3]. This graphical representation enables a qualitative assessment of forecast performance, facilitates the identification of periods with significant deviations, and allows for a comparison of consumption dynamics across different segments of the ABC/XYZ matrix, thereby supporting informed and sustainable inventory planning.
A visual comparison of the forecasts with the observed consumption indicated that the models adequately capture the underlying trends for materials with stable demand (classes X and AX). In contrast, for materials characterized by irregular demand patterns (classes Z, AZ, and BZ), the forecasts exhibit relatively high error levels. In practical terms, this suggests the need to implement additional inventory buffers or to update forecasts more frequently, which aligns with the principles of sustainable warehouse management. The forecasting process not only enables the estimation of future consumption levels but also provides practical support for inventory-related decision-making, including the determination of reorder points, the optimization of order quantities, and the planning of safety stock levels. The forecast results, therefore, serve as a starting point for further analysis, in which the effectiveness of the applied methods and their practical relevance in the context of rational and sustainable inventory management will be evaluated.
5. Discussion
The obtained results are consistent with the findings reported in previous studies on inventory classification, which indicate that a relatively small proportion of items (group A) accounts for the majority of inventory value, while demand variability significantly affects inventory control strategies. Similar observations were reported in studies where ABC–XYZ analysis was applied in manufacturing environments, confirming the usefulness of combining value-based and variability-based classifications.
The purpose of the discussion is to evaluate the inventory structure of the analyzed enterprise in light of the ABC/XYZ classification performed and to assess the quality and practical usefulness of demand forecasts for selected groups of materials, with particular emphasis on sustainable resource management. Within the study, the obtained results were compared with the theoretical assumptions presented in the literature review, allowing for the identification of areas in which the applied methods provide the greatest practical benefits, particularly in terms of rationalizing inventory levels, reducing excessive stockholding, and supporting the efficient use of working capital. The analysis of the results also makes it possible to identify limitations of the applied approach, such as the limited effectiveness of classical forecasting models in the case of materials characterized by irregular demand patterns. Furthermore, it enables the formulation of potential directions for improvement in inventory management and demand planning, aimed at enhancing both the efficiency and sustainability of warehouse processes.
5.1. Interpretation of Results
The results of the ABC/XYZ analysis enable a detailed evaluation of the inventory structure of the enterprise examined, taking into account both economic importance and demand stability. The obtained findings confirm patterns commonly reported in recent studies, where a relatively small number of items classified as group A account for a dominant share of the total inventory value [
46,
58]. This concentration highlights the need for systematic monitoring and the application of advanced planning tools, as also emphasized in recent inventory optimization research.
The XYZ classification further reveals significant differentiation in demand variability across material groups. Consistent with recent studies, materials of high economic importance are predominantly associated with X and Y classes, indicating relatively stable or moderately variable demand [
60,
63]. Such a structure supports the application of classical forecasting methods and facilitates more accurate safety stock determination, contributing to more efficient and sustainable inventory management.
At the same time, the presence of Z-class materials, characterized by highly irregular demand patterns, reflects challenges also identified in the recent literature concerning low-demand predictability and forecasting limitations. These items are associated with an increased risk of forecasting errors and potential overstocking, which necessitates the implementation of more flexible inventory control strategies, including adaptive safety stock policies.
The combined ABC/XYZ matrix provides a more comprehensive decision-support framework by integrating value-based and variability-based classifications. In particular, AX materials represent the most critical segment due to their high economic importance and stable demand. The relatively low forecast errors observed for this group confirm the suitability of classical time series models, which is consistent with the findings from recent inventory forecasting studies [
60,
64].
In contrast, materials classified as AY and AZ, despite their high economic relevance, exhibit increased demand variability, leading to higher forecast errors. This observation aligns with recent research indicating that forecast accuracy decreases as demand variability increases and that hybrid or adaptive approaches may be required in such cases [
60,
64]. In the case of AZ materials, the limited predictability suggests that forecasting results should be treated primarily as supportive inputs rather than precise planning tools. Consequently, more flexible replenishment policies and dynamic safety stock adjustments are required to mitigate the risk of excessive inventory and resource inefficiencies.
The forecasting results further confirm the limited applicability of classical quantitative models for materials characterized by irregular demand, particularly within CZ and selected BZ groups. High error indicators, especially the MAPE, demonstrate significant discrepancies between predicted and actual demand values. Similar limitations have been discussed in recent studies, which recommend the use of alternative approaches, such as machine learning models, qualitative forecasting methods, or order-driven planning strategies in such contexts [
60,
64].
Overall, the integration of ABC/XYZ classification with demand forecast evaluation provides a more comprehensive perspective on inventory management. Compared to approaches focusing solely on classification or forecasting, the proposed framework enables the identification of both high-priority materials and segments exposed to elevated uncertainty. This supports more informed decision-making aimed at optimizing inventory levels, improving operational efficiency, and reducing resource waste, thereby contributing to more sustainable inventory management practices.
These findings are consistent with recent studies, which indicate that demand variability significantly affects forecasting accuracy and inventory performance. However, compared to previous research, the results highlight the importance of combining classification methods with forecasting to better capture context-specific dynamics.
5.2. Forecasting Performance and ABC/XYZ Classification Consistency
The analysis of forecasting performance across ABC/XYZ categories reveals both expected patterns and notable deviations. In general, items classified as AX exhibit lower forecast errors, confirming their suitability for classical forecasting models. However, exceptions such as item P0092 demonstrate that even high-value and theoretically stable-demand items may exhibit substantial forecast inaccuracies.
These deviations can be attributed to factors such as irregular demand spikes, external disruptions, or insufficient model adaptation to underlying demand patterns. This finding suggests that inventory classification should be complemented with additional time series diagnostics to improve forecasting reliability.
For categories characterized by higher variability, such as AZ, BZ, and CZ, the observed high forecast errors are consistent with the existing research. In such cases, reliance on quantitative models alone may be insufficient, and hybrid approaches combining statistical methods with expert judgment should be considered.
Overall, the results indicate that while ABC/XYZ classification provides a useful framework for segmenting inventory, its effectiveness in guiding forecasting strategies depends on the quality and stability of underlying demand patterns.
5.3. Identification of Problems and Potential Improvements
The analysis of the ABC/XYZ classification results alongside demand forecasting enabled the identification of key inventory management challenges within the examined enterprise, which are not apparent when relying solely on simple quantitative or value-based measures. These challenges pertain both to the inventory structure and to the limitations of the forecasting methods applied to specific material segments. The first significant issue is the high variability of demand for certain economically important materials, particularly those in the AZ category. Despite their substantial impact on inventory value, these materials exhibit irregular consumption patterns, increasing the risk of forecasting errors and complicating the precise planning of safety stock levels. In practice, this can lead both to periodic shortages of critical materials and to excessive capital being tied up in stock, which limits the efficient and sustainable use of enterprise resources. Another problem is the limited effectiveness of classical time series models for materials with unstable and sporadic consumption, typical of the CZ class and some BZ-class items. High forecast error values, particularly the MAPE, indicate the low predictability of these series. Using purely quantitative forecasts for such materials without additional control mechanisms or expert input may result in erroneous planning decisions and inefficient inventory management. The analysis also revealed significant differences in forecast quality across the ABC/XYZ matrix segments. Materials in the AX class and parts of the AY exhibited relatively low forecast errors, whereas the remaining segments demonstrated substantially lower forecast accuracy. A lack of differentiated inventory planning based on material classification may lead to a uniform warehouse policy that fails to account for actual demand risk and variability. An additional limitation is the overreliance on model-based forecasts for materials with short consumption histories or periods of zero demand interrupted by sporadic large orders. In such cases, quantitative forecasts may not reflect actual production needs, potentially leading to resource inefficiencies and excessive stock levels. Regarding potential improvements, the study highlights the need for a more differentiated inventory management approach, tailored to the material’s ABC/XYZ classification. It is advisable to limit the use of quantitative forecasts for highly variable materials and to make broader use of qualitative methods or production schedule-based planning. For stable and economically significant materials, inventory policies can be further refined by precisely aligning planning parameters with forecast results, thereby supporting rational, efficient, and sustainable inventory management. This finding is consistent with recent studies (2023–2025), which indicate that demand variability significantly reduces forecasting accuracy, particularly for Z-class items.
5.4. Assessment of the Suitability of Methods in the Context of the Examined Enterprise
The conducted analyses enabled an assessment of the practical utility of the applied inventory classification and demand forecasting methods within the context of the examined manufacturing enterprise. The results indicate that ABC classification, XYZ classification, and their combination in the form of the ABC/XYZ matrix constitute effective tools supporting inventory management decisions, although their effectiveness is strongly influenced by the characteristics of the data and the specific features of individual material groups. The ABC analysis proved particularly valuable for identifying materials that account for the largest share of inventory value. The strong concentration of costs in a relatively small number of items confirms the usefulness of this method as a tool for prioritizing control and procurement activities. From a sustainability perspective, it enables the efficient allocation of organizational resources, reducing unnecessary capital immobilization and limiting excessive stock levels. The XYZ classification provided essential insights into the stability and predictability of demand, which are not visible when evaluating materials solely based on consumption value. The use of the coefficient of variation allowed for a clear distinction between materials with stable demand and those with irregular or incidental consumption. In practice, this enables the differentiation of inventory planning approaches, the selection of appropriate forecasting models, and the minimization of overstocking risk—a key aspect of sustainable resource management. The greatest practical value was demonstrated by combining both classifications in the form of the ABC/XYZ matrix, which allows for the simultaneous assessment of the economic importance of materials and the risk associated with demand instability. The matrix clearly identifies segments that require intensive monitoring and those for which simplified management procedures are sufficient. In the context of sustainability, this facilitates the optimization of inventory levels while simultaneously reducing waste and minimizing excessive capital commitment. The evaluation of forecasting methods showed that classical time series models, such as exponential smoothing and ARIMA models, are effective primarily for materials with stable and regular consumption patterns. For these items, relatively low forecast error metrics were obtained, confirming the suitability of these methods for precise inventory planning and the determination of reorder points. Conversely, for materials with high demand variability, forecasts exhibited substantial errors, limiting their operational usefulness and indicating the need to supplement quantitative data with qualitative or expert-based approaches. In the context of the studied organization, quantitative forecasts should serve as a decision-support tool rather than the sole source of planning information. For materials with irregular consumption, it is recommended to apply qualitative methods, production schedules, and the experience of logistics and procurement personnel. This approach supports sustainable resource management by reducing surpluses, optimizing inventory levels, and minimizing unnecessary capital immobilization. This finding is consistent with recent studies (2023–2025), which indicate that demand variability significantly reduces forecasting accuracy, particularly for Z-class items.
In conclusion, the applied classification and forecasting methods demonstrate high practical utility within the context of the examined enterprise, provided they are used consciously and selectively. Their primary value lies in the structuring of the material assortment, the identification of risk areas, and the rationalization of inventory management activities, thereby providing a solid foundation for developing improvements that support sustainable development and effective inventory management.
5.5. Suggestions for Improvements
Based on the conducted classification analyses and demand forecasting results, recommendations for improving inventory management in the examined manufacturing enterprise were formulated. The proposed measures take into account both the economic significance of individual materials and the variability and predictability of their consumption, thereby promoting the sustainable use of resources. First, it is recommended to differentiate inventory policies according to the ABC/XYZ matrix segments. Materials with high economic importance and stable demand should be managed using precise planning methods based on quantitative forecasts and regular inventory monitoring. In this segment, time series forecasts can provide a reliable basis for determining reorder points and optimal order quantities, which helps to reduce excessive stockholding and supports the efficient management of working capital. For materials with high value but moderate or high demand variability, it is recommended to combine quantitative forecasts with production schedule analysis and the expert knowledge of logistics personnel. In such cases, it is also advisable to implement increased safety stock levels or flexible supplier agreements, enabling a rapid response to demand fluctuations and minimizing the risk of production downtime, while simultaneously limiting inventory surpluses. Materials with low economic significance, particularly those with highly irregular consumption, should be managed using simplified procedures, such as maintaining minimal stock levels or placing orders only in response to actual production needs. This approach helps to minimize unnecessary capital immobilization and reduce potential resource waste, supporting the objectives of sustainable development. Equally important is the systematic use of ABC/XYZ classification results as a tool for operational decision-making. Regular updates of the classification, for example, on a quarterly or semi-annual basis, allow for the ongoing adjustment of inventory policies to reflect changes in demand structure and material consumption values. Such an approach enhances the relevance of analyses and reduces the risk of decisions based on outdated information.
In terms of forecasting, it is recommended to selectively use time series methods adapted to the characteristics of individual materials. Monitoring the quality of forecasts using error measures and periodic verification of their accuracy allows for the identification of materials for which quantitative forecasts can support the decision-making process and for which the use of qualitative methods or expert approaches is advisable. An additional organizational benefit may be the integration of the analyses carried out with the ERP system, enabling the automation of the calculation of ABC/XYZ classifications and the generation of demand forecasts. Automation increases data consistency, reduces manual work, and supports conscious, analytical inventory management in the spirit of sustainable development. The proposed improvements can be implemented gradually, using existing data and analytical tools, without the need for large investments in new IT systems. Their implementation can contribute to reducing inventory holding costs, improving production continuity, and increasing operational efficiency, which at the same time supports the long-term goals of sustainable resource management in the enterprise.
Compared to previous studies, the proposed approach provides a more comprehensive view by linking inventory classification with demand predictability and sustainability considerations. This allows for more informed decision-making, particularly in reducing overstocking and minimizing resource waste.
The results demonstrate that integrating ABC–XYZ analysis with demand forecasting can significantly improve inventory efficiency, especially in environments characterized by variable demand patterns. From a sustainability perspective, improved inventory classification and forecasting contribute to reducing excess stock, minimizing waste, and lowering storage-related energy consumption.
From a managerial perspective, priority should be given to improving forecasting accuracy for high-value items with significant forecast errors, particularly in the AY and AZ categories. These segments represent the highest risk in terms of both financial impact and inventory inefficiencies. Investments in advanced forecasting methods, data integration, and supplier collaboration should therefore be concentrated in these areas.
In contrast, for low-value and highly irregular items (CZ category), simplified control strategies and order-based planning may be more cost-effective than investing in complex forecasting models.
5.6. Limitations and Transferability
This study has several limitations that should be acknowledged. First, the empirical analysis is based on a single manufacturing company, which may limit the generalizability of the results. Second, the forecasting analysis was conducted for a limited number of representative materials, which may not fully reflect the variability observed across all inventory items.
Despite these limitations, the proposed framework can be adapted to other industrial contexts. Future research should focus on applying the approach to larger datasets and different industries to validate its robustness and scalability. Additionally, integrating more advanced forecasting techniques or machine learning methods could further improve predictive performance.