Article

Soil Compaction in Montado Mediterranean Ecosystem: Dolomitic Limestone Application, Sheep Grazing Management and Tree Effects


1
MED—Mediterranean Institute for Agriculture, Environment and Development and CHANGE–Global Change and Sustainability Institute, School of Sciences and Technology, University of Évora, Mitra, Ap. 94, 7006-554 Évora, Portugal
2
Departamento de Expresión Gráfica, Escuela de Ingenierías Industriales, Universidad de Extremadura, Avenida de Elvas s/n, 06006 Badajoz, Spain
3
Escuela de Ingenierías Agrarias, Universidad de Extremadura, Avenida Adolfo Suárez, S/N, 06007 Badajoz, Spain
*
Author to whom correspondence should be addressed.
Sustainability 2026, 18(8), 3962; https://doi.org/10.3390/su18083962
Submission received: 23 February 2026 / Revised: 6 April 2026 / Accepted: 15 April 2026 / Published: 16 April 2026

Abstract

Extensive animal production systems based on dryland pastures in Mediterranean regions have low profit margins. Improvements in soil fertility or grazing management and stocking rates are recognized strategies for reversing this situation and to ensure long-term agricultural sustainability. This article aims to assess whether this strategy of possible intensification of sheep production has a significant impact on soil compaction, which is a manifestation of soil functionality degradation resulting from trampling. An experimental design with four treatments was implemented (with and without dolomitic limestone application; continuous grazing with low stocking rates, CG-LSR, and deferred grazing with high stocking rates, DG-HSR). The study involved cone index (CI, in kPa) measurements (48 sampling areas, 12 in each treatment) on eight dates during two annual pasture/grazing cycles (2023/2024 and 2024/2025). Other soil parameters, the presence of trees and grazing preferences were also monitored and correlated with CI. The main results showed: (i) significantly higher soil compaction under CG-LSR than under DG-HSR; (ii) a negative and significant effect of soil moisture content (SMC) on CI (r = −0.381; p < 0.05); (iii) a significant CI increase in preferential grazing areas, but only in the topsoil layer (0–10 cm) and with a very weak correlation coefficient (r = 0.172; p < 0.05); and (iv) no significant differences in CI under and outside tree canopy areas (UTC and OTC, respectively) for the depth range of 0–30 cm. These results are good indicators of the desired and sustainable intensification of extensive livestock grazing systems.

1. Introduction

Livestock grazing is one of the most significant land uses on Earth and an important biotic process affecting plant and animal communities and ecosystem functions [1]. In the Mediterranean basin it covers an estimated area of 850,000 square kilometers, occupying areas characterized mostly by unfavorable climatic and soil conditions [2]. Pasture productivity and biomass availability are negatively influenced by edaphic–climatic conditions as the predominant physical and chemical soil characteristics (coarse texture, low fertility, acidity, or toxicity of some nutrients) and a trend for a gradual decrease in rainfall [3]. These constraints determine the common practice of reduced animal stocking rates, characteristic of low-input production systems [4]. Consequently, these extensive animal production systems based on dryland pastures in southern regions of the Iberian Peninsula (Portugal and Spain) have low profit margins.
In order to reverse this situation several actions, such as the correction of soil pH, improvements in soil fertility or changes in grazing management and stocking rates, are possible. The growth potential of grassland can be achieved by correcting soil pH through liming [3]. As a consequence, supplementary feeding can be reduced, decreasing the greenhouse gas emissions associated with cropping [5] and increasing the efficiency and sustainability of grazing livestock production [3].
Soil management is a decisive factor of sustainable agriculture as it aims to optimize soil health, productivity, and long-term sustainability [6].
Silvopastoral systems are recognized as efficient generators of fundamental environmental benefits, such as pasture quality improvement and providing thermal comfort and animal welfare [7]. Grazing is the most prevalent land use in grasslands but, when inadequately managed and under certain environmental conditions, can have negative effects [8]. For example, soil degradation can be accelerated by overgrazing [9]. Soil compaction is a tangible manifestation of this soil degradation [10]. The impact of livestock grazing on the loss of soil functionality resulting from trampling varies, on the one hand, with factors such as stocking density or grazing duration, and on the other hand, with soil moisture and clay contents that alter soil compressibility and plasticity [9]. This is widely attributed to the combined effects of reducing vegetation cover and degrading soil’s physical attributes, including macroporosity, permeability, infiltration, bulk density and structural aggregation [9]. Heavy grazing may reduce soil functionality in fine-textured soils, particularly when wet, but does not affect coarser soils [11]. Grazing effects also vary among different herbivore species. Due to their greater body mass and greater hoof area, cattle create deeper hoof imprints in damp soils than sheep or goats, causing more damage [8].
Since grazing pressure is gauged by the capacity of a pasture to support grazing without inducing degradation, it provides an integrative perspective on livestock–ecosystem interactions [12]. The spatial, temporal and seasonal variations (e. g. conditioning the use of the pasture based on forage palatability) makes livestock grazing a highly dynamic and variable process [12]. Given this complex context, it is essential to have tools that allow us to assess whether the soil, as a support subsystem, maintains the fertility and functionality that guarantees the sustainability of the Montado ecosystem. For balancing the trade-offs in livestock productivity and other ecosystem services, there are promising opportunities for smart farming technologies to deliver timely and precise information about the dynamic soil–plant–animal system that can enable farmers to improve their grazing management and to use the potential of grassland more efficiently [5].
Over the last two decades, the concept of Precision Agriculture, PA (or Livestock Precision Farming, LPF), has appeared in numerous published works demonstrating the advantages of using sensors (proximal or remote) associated with georeferencing systems based on Global Navigation Satellite Systems (GNSSs) to represent the spatial variability in agricultural fields at the level of soil, crops or even animal grazing patterns and grazing intensity. New technologies and information systems, previously developed in engineering sciences, are continuously proposed and used by grassland researchers and farmers. However, the evaluation of the economic and ecological benefits of these technologies’ use is still challenging, especially to those who have to make on-farm decisions [13]. The demonstration of technologies that enable the evaluation of management strategies that contribute to the enhancement of the Montado ecosystem and support decisions that improve returns for agricultural managers will be fundamental to the sustainability of extensive animal production.
In the present study, a set of research questions are proposed, which are intended to be answered through the research conducted. They are: (a) Do higher stocking rates significantly increase soil compaction under sheep grazing, and is this effect influenced by the prior application of dolomitic limestone? (b) Do preferred grazing areas exhibit higher levels of soil compaction, and if so, to what depth does this effect extend? And (c) does animal trampling have a significantly different impact on soil compaction in areas beneath tree canopies compared to open areas?

2. Materials and Methods

2.1. Experimental Field

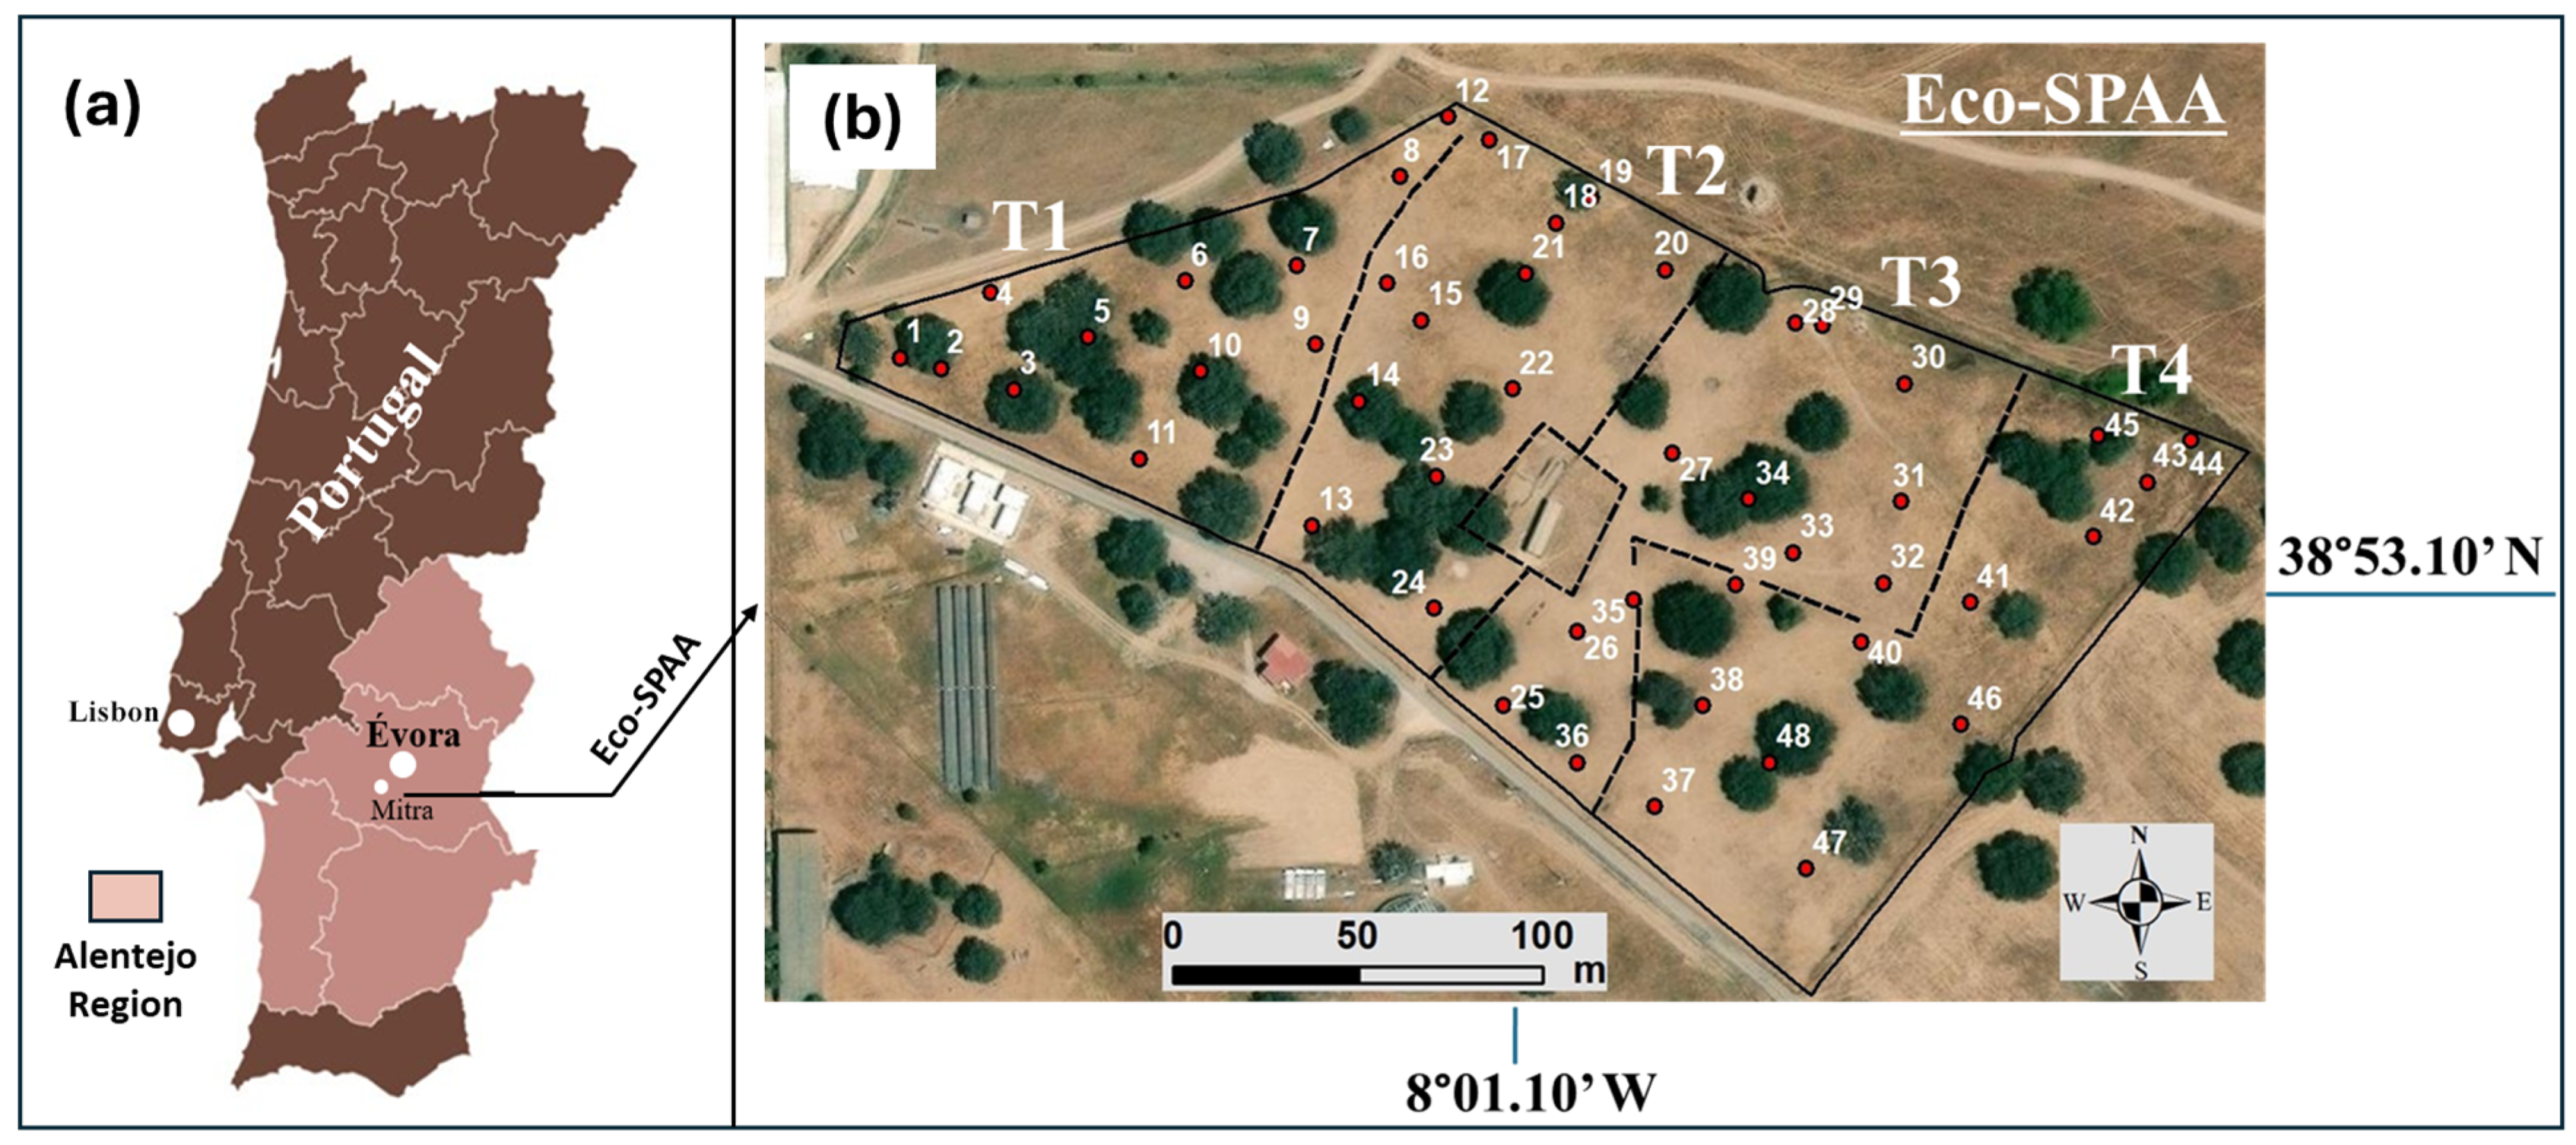
The experimental trials were conducted at the ‘Eco-SPAA’ field, with an approximate area of 4 ha, located at Mitra farm, Évora, Alentejo region (Southern Portugal; 38°32.2 N; 8°01.1 W; Figure 1). According to the IUSS (International Union of Soil Sciences) classification [14], the predominant soil of the field is designated Dystric Cambisol, a soil with a slightly acidic pH. This area, under Montado of holm oaks (Quercus rotundifolia Lam.), is part of a project that seeks to evaluate a possible intensification of the “White Merino” sheep production system based on improved pastures through the application of dolomitic limestone, grazing management and animal stocking rates. Although this experimental field has been used since 2015 in various research projects to monitor sheep grazing, in the year prior to the experiment (2022/2023) the plot was left to rest, with no animals grazing there.
The experimental field is subdivided by fences into four subplots (T1 to T4), each with an area of approximately 1 ha. In each of these subplots, there are 12 sampling areas marked with a central stake and georeferenced (a total of 48 sampling areas).
A different treatment was implemented in each subplot:
T1—Continuous grazing (CG) with low stocking rate (LSR, 7 sheep ha−1);
T2—Deferred grazing (DG) with high stocking rate (HSR, 18 sheep ha−1);
T3—Application of dolomitic limestone (2-ton ha−1) and DG-HSR;
T4—Application of dolomitic limestone (2-ton ha−1) and CG-LSR.
The average height of the pasture (h, in cm) was used as a decision criterion for the removal and re-entry of animals in deferred grazing plots (T2 and T3): (i) removal when h ≤ 5; (ii) re-entry when h ≥ 10.

2.2. Monitoring Period Schedule

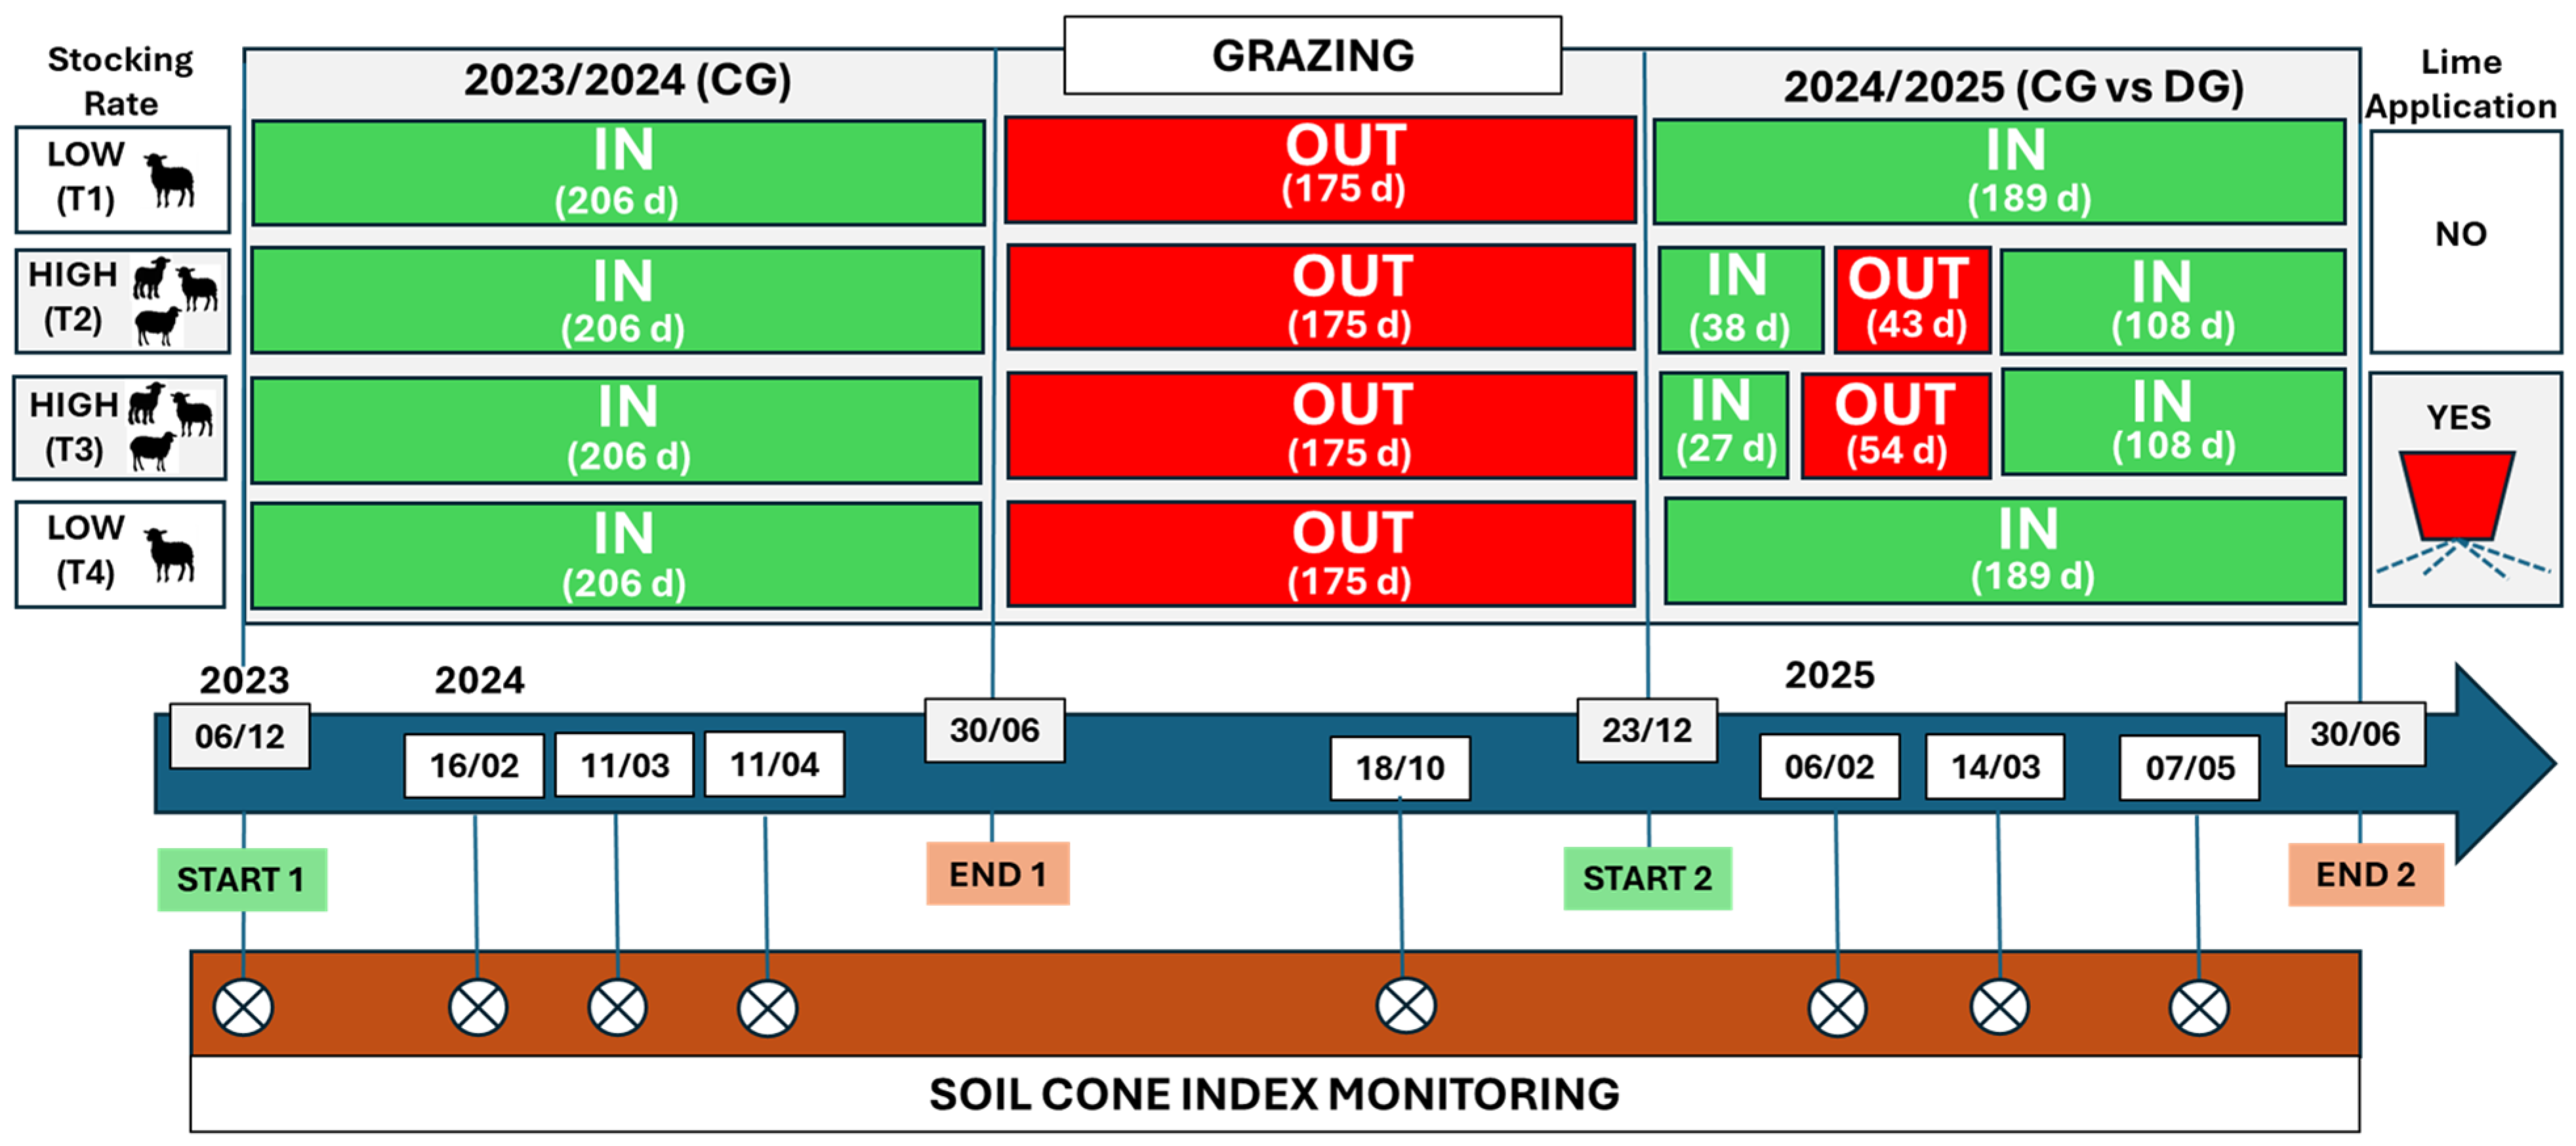
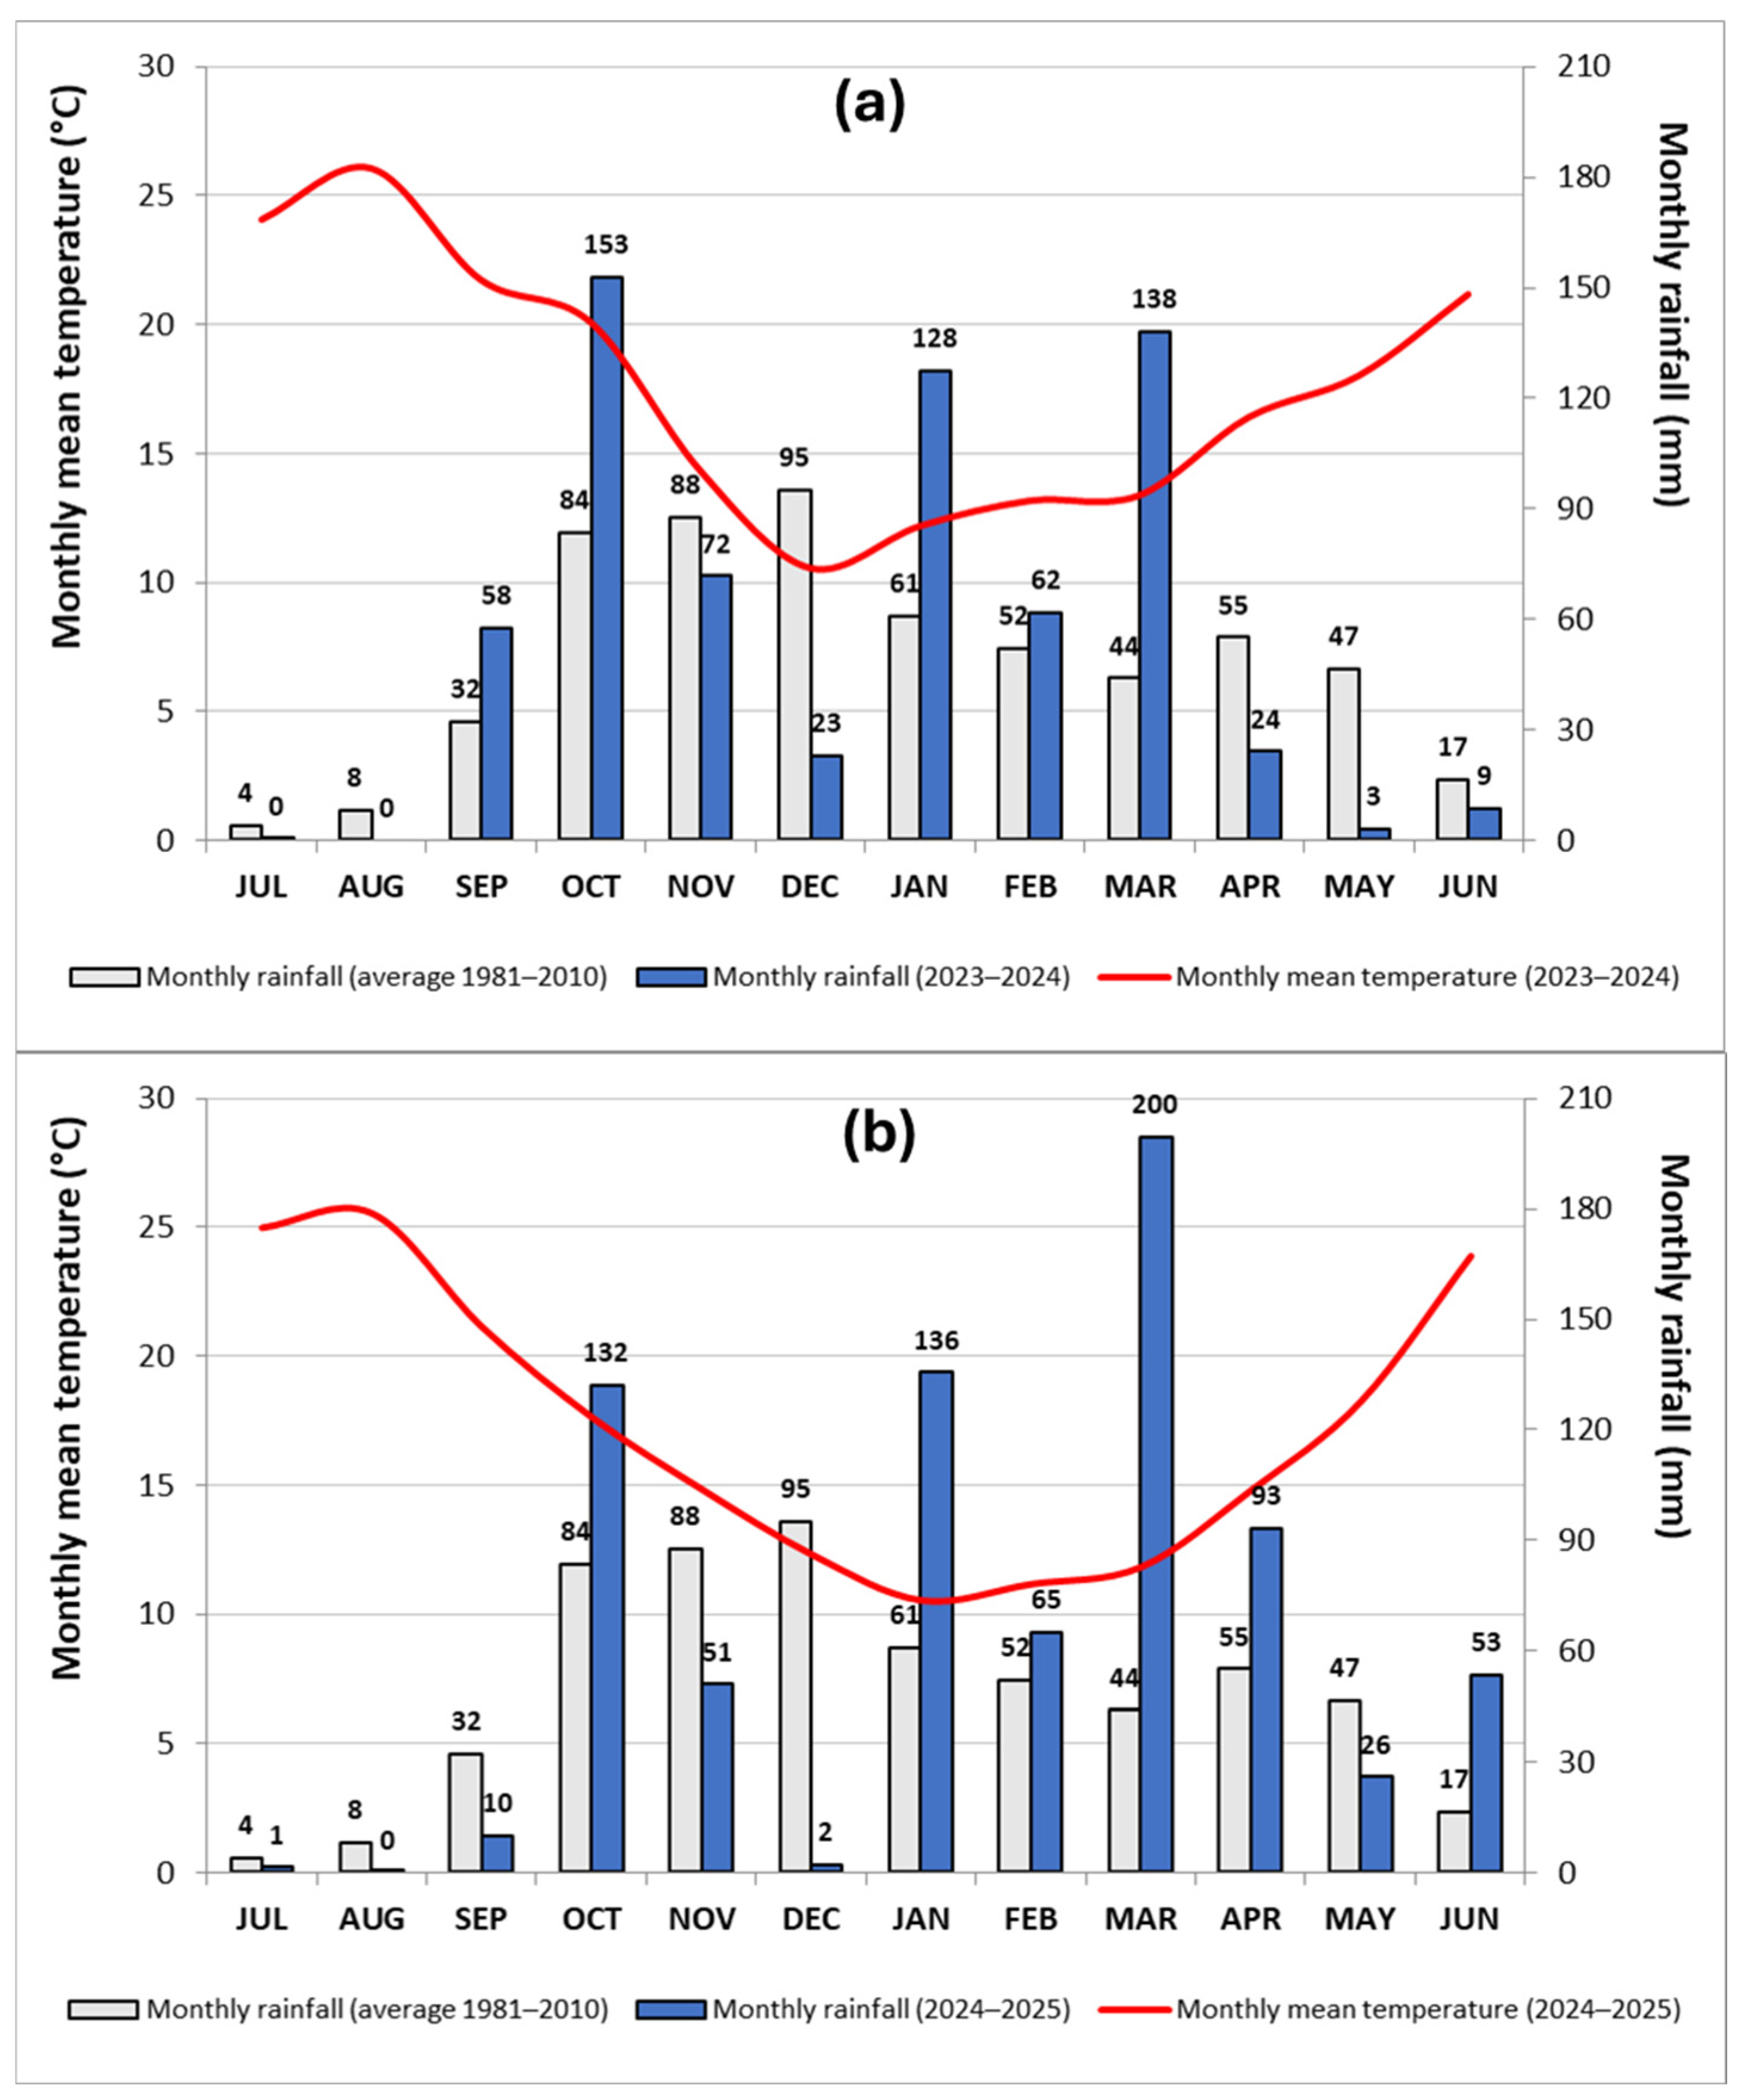
The work described in this article involved two pasture production cycles: 2023/2024 and 2024/2025. In the first cycle, the animals began grazing in the field on 6 December 2023 (Figure 2) and left on 30 June 2024. In the second cycle, the animals entered the experimental field on 23 December 2024 and left on 30 June 2025. The evolution of temperature and precipitation distribution in these two vegetative cycles is shown in Figure 3. The pattern of average air temperature remained stable during both growing seasons (Figure 3a,b), with evident seasonal characteristics, reaching maximum values of approximately 26 °C in mid-summer (August), gradually decreasing to around 11 °C in winter (December/January) and gradually rising again throughout the spring and summer months. Monthly rainfall distribution also shows a common pattern in both growing seasons, with the highest rainfall occurring in October, January and March, and with accumulated annual values (668.3 mm in 2023/2024, Figure 3a; and 769. 3 mm in 2024/2025, Figure 3b) much higher than the historical records for the 1981–2010 thirty-year period (585.3 mm). It can be said that the years under study were relatively rainy. The year 2024/2025 also stands out for the fact that precipitation in June reached 53 mm. In view of this evolution in precipitation and the consequent ability of the pasture to recover its height, in the first growing cycle (2023/2024) the animals remained in the four experimental subplots (CG) throughout the growing cycle (Figure 2). In the 2024/2025 growing cycle, the height of the pasture in plots T2 and T3 reached values ≤ 5 cm, so they remained without grazing animals between February and March (43 days in the case of T2 and 54 days in the case of T3).

2.3. Soil and Pasture Monitoring

In June 2023 a survey of the soil’s apparent electrical conductivity (ECa) was carried out using an EM38 electromagnetic induction sensor (Geonics Ltd., Mississauga, ON, Canada). This sensor, equipped with a GNSS antenna, was pulled by an ATV at an average speed of 6 km h−1, making successive passages spaced 5 m apart. The ECa measurements were registered continuously every second. The topsoil data (0–0.375 m) were used in this study. The spatial altimetric and ECa maps were created using the ordinary point Kriging algorithm.
Following this survey, soil samples were collected at the 48 sampling areas at 0–30 cm depth using a gouge auger and a hammer. These soil samples were inserted in plastic bags, air-dried, and analyzed for particle-size distribution (texture: sand, silt, and clay content) using a sedimentograph (Sedigraph 5100, manufactured by Micromeritics, Norcross, GA, USA), after passing the fine components through a 2 mm sieve. Soil particle sizes were classified according to USDA standards into three main textural separates based on diameter: clay (<0.002 mm), silt (0.002–0.05 mm), and sand (0.05–2.0 mm). The fine soil (fraction with diameter < 2 mm) was characterized in terms of pH, organic matter content (OMC) and cationic exchange capacity (CEC). These fine components were analyzed using the following methods [15]: (i) for pH in 1:2.5 (soil:water) suspension, using the potentiometric method; (ii) the OMC was measured by combustion and CO2 measurement, using an infrared detection cell; (iii) the CEC was measured by the neutral ammonium acetate method.
To measure the soil’s resistance to penetration (Cone Index, CI, in kPa) an electronic cone penetrometer “FieldScout SC 900” (Spectrum Technologies, Aurora, IL, USA), equipped with an ultrasonic depth sensor, was used in the 48 sampling areas on eight dates throughout the experimental period (Figure 2): one prior to the animals entering the experimental plots (6 December 2023), to assess the pre-trial soil condition; three during the 2023/2024 growing season (16 February 2024, 11 March 2024 and 11 April 2024); one in the period between grazing cycles (18 October 2024); and three during the 2024/2025 growing season, the first when the animals were in the DG left plot T3 (6 February 2025), the second before the animals re-entered the DG plots (14 March 2025) and the last during the final grazing period (7 May 2025). In this study the CI data were organized into four depth classes: 0–10 cm; 10–20 cm; 20–30 cm; and 0–30 cm.
To reduce sampling errors, all measurements were always performed by the same operator. On each sampling date, three measurements were taken with the cone penetrometer in each of the 48 sampling areas, one in the center and the other two diagonally (NW and SE orientation), about 1 m away from the center. Simultaneously, to determine soil moisture content (SMC), a soil sample was collected at 0–30 cm depth using a gouge auger and a hammer. In the laboratory, each soil sample was weighed, dried at 105 °C for 48 h, and then weighed again to establish the SMC, in % of mass.
The monitoring of the evolution of average pasture height to verify the conditions for the removal/return of animals to the DG plots (T2 and T3) was always carried out by an experiment technician (three measurements in each sampling area) using an electronic measuring stick, every two weeks throughout the experimental period.

2.4. Grazing Monitoring

To analyze whether animals’ preferred grazing/resting areas would have an impact on soil compaction, during the first year (2023/2024), the animal presence or absence near each sampling point and in each plot was monitored simultaneously by four pre-trained observers (one observer for each treatment), with the aid of binoculars, according to the protocol described in Carreira et al. [16]. Monitoring took place over four days (from sunrise to sunset; about 12 h per day) between March and June 2024 (10 March 2024, 10 April 2024, 13 May 2024 and 12 June 2024). Observations were made every 10 min. During each observation, the sampling areas where the animals were found were recorded. Statistical analyses of data on animal locations in the pasture were carried out using IBM SPSS 25. Kriged maps showing the spatial distributions of animals (animal density) on each date were generated. Raster maps were obtained with a spatial resolution of 1 m2.

2.5. Statistical Data Analysis

2.5.1. Descriptive Analysis and Spatial Representation

A descriptive statistical analysis, including means, standard deviation (SD), coefficient of variation (CV), and range, were conducted for each data set of soil and sensor parameters.
The maps representing the spatial variability in altimetry, soil variables at depth 0–30 cm (ECa, sand, silt, clay, OM, pH, CEC, SMC and CI) and grazing density were carried out through geostatistical analyses with the “Geostatistical Analyst” extension of ArcGIS software (version 10.5, ESRI, Inc., Redlands, CA, USA). Kriged maps were generated using the ArcMap module of ArcGIS.

2.5.2. Limitations of the Experimental Design and Statistical Approach

It is important to recognize an inherent limitation of this study: the experimental design does not include true replicates of the treatments, as each treatment was implemented on a single plot with 4 treatments (T1 to T4), with 12 sampling points on each. This structure, known as pseudo-replication, is common in studies conducted under real field conditions involving extensive livestock management, where spatial replication of treatments is unfeasible for logistical and management reasons. In our case, the need to maintain continuous and homogeneous areas for grazing (continuous or deferred) and the application of dolomite prevented the random allocation of multiple replicates per treatment without compromising the integrity of livestock management.
To address this limitation, a linear mixed model with plots as the random effect was used. This approach models the correlation between measurements within each plot and provides statistically valid tests for the fixed effects (lime, grazing, depth, date, and their interactions). This approach allows for correcting the degrees of freedom and controlling spatial variability through the inclusion of soil covariates (texture, organic matter, pH, CEC). The consistency of the results across the eight sampling dates and between depths reinforces the robustness of the conclusions, suggesting that the observed patterns are not an artifact of point spatial variability.
Therefore, although the results should be interpreted as solid indicators rather than definitive proof in the classical sense of experimental design, we consider that the approach adopted is methodologically rigorous within the limitations of research in extensive animal production systems at real scale.

2.5.3. Inferential Analysis

The IBM SPSS Statistics package for Windows (version 28.0, IBM Corp., Armonk, NY, USA) was used for all statistical analyses.
To account for the hierarchical structure of the data (12 sampling points within each experimental plot), a linear mixed model (LMM), based on orthogonal planned contrasts implemented in a univariant general linear model, was applied to the CI data (dependent variable). Plot was included as a random effect. The fixed effects (study factors) were lime application (two levels: with/without), grazing management/stocking rate (two levels: CG-LSR and DG-HSR), depth (three levels: 0–10, 10–20, 20–30 cm) and date (eight sampling dates). All relevant interactions among fixed effects were included in the model, which allowed us to test the specific hypotheses of the factorial design while controlling the effect of the rest of the variables.
For the factor “depth” (three levels), post hoc pairwise comparisons were performed using Tukey’s HSD when the assumption of homoscedasticity was met (Levene’s test p > 0.05), or Dunnett’s T3 when variances were unequal. Dunnett’s T3 is a post hoc test specifically designed for unequal variances and should not be confused with Dunnett’s test for comparisons against a control group.
In addition to the main mixed model analysis, three secondary analyses were performed: (i) a Pearson correlation analysis between CI and soil parameters; (ii) a Pearson correlation analysis between animal grazing preferences (accumulated presence records) and CI values across depths and sampling dates; and (iii) a separate mixed model comparing CI under tree canopy (UTC) vs. outside tree canopy (OTC) areas, using the 12 UTC sampling points and the 12 closest OTC sampling points as paired comparisons.
All statistical tests were two-tailed, and significance was set at α = 0.05.
To assess the potential relationship between CI (depth = 0–30 cm) and soil parameters determined at the beginning of the experimental study, a relative CI value (RCI) was calculated (Equation (1)) for each of the 48 sampling areas and on each monitoring date. This RCI, expressed on each monitoring date as a percentage of the maximum value obtained across all 48 sampling points, makes it possible to assess which areas of the experimental field had the highest CI values and whether this pattern showed any systematic trend between sampling dates.
R C I = C I n × 100 / C I M a x
where CIn is the mean values of CI (depth 0–30 cm) on each date and in each sampling area; and CIMax is the maximum CI value on each date, from the set of 48 sampling areas.
The regression analysis of the effect of preferred grazing areas on the CI was carried out between the accumulated data on grazing preferences across four monitoring dates and the CI data, in each depth (0–10 cm, 10–20 cm and 20–30 cm) on each of the eight CI sampling dates. In each correlation analysis 384 values were compared (n = 48 × 8).
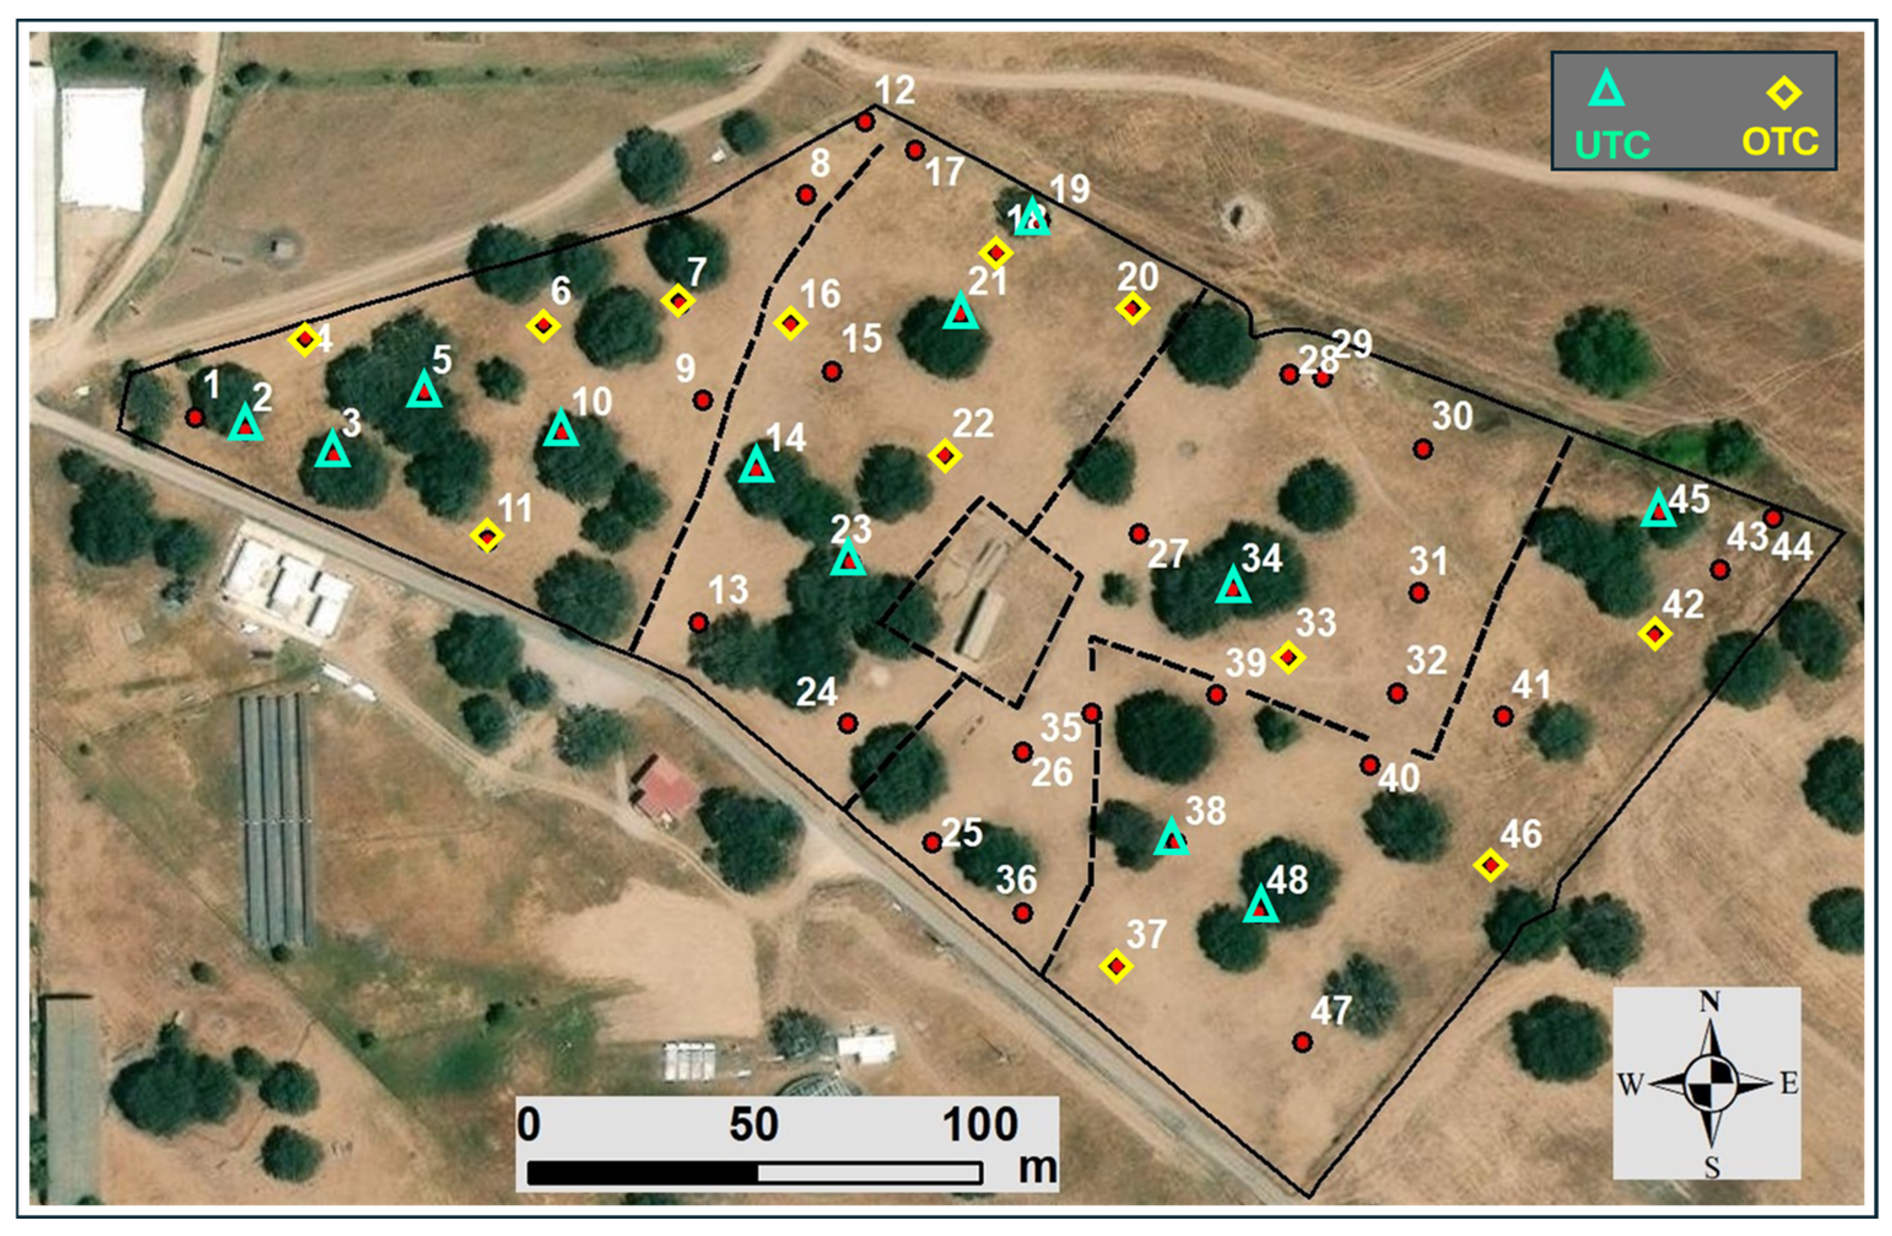
To analyze the effect of trees on soil compaction, it was considered that, of the 48 sampling areas, 12 are under the effect of tree canopy (4 in subplot T1; 4 in subplot T2; 1 in subplot T3 and 3 in subplot T4; Figure 4). A comparison was made between the 12 UTC monitoring areas and the 12 sampling areas closest to them but located outside the effect of the tree canopy (direct comparison, in pairs, UTC vs. OTC).

3. Results

3.1. Soil Characteristics of Experimental Field and Correlation with CI

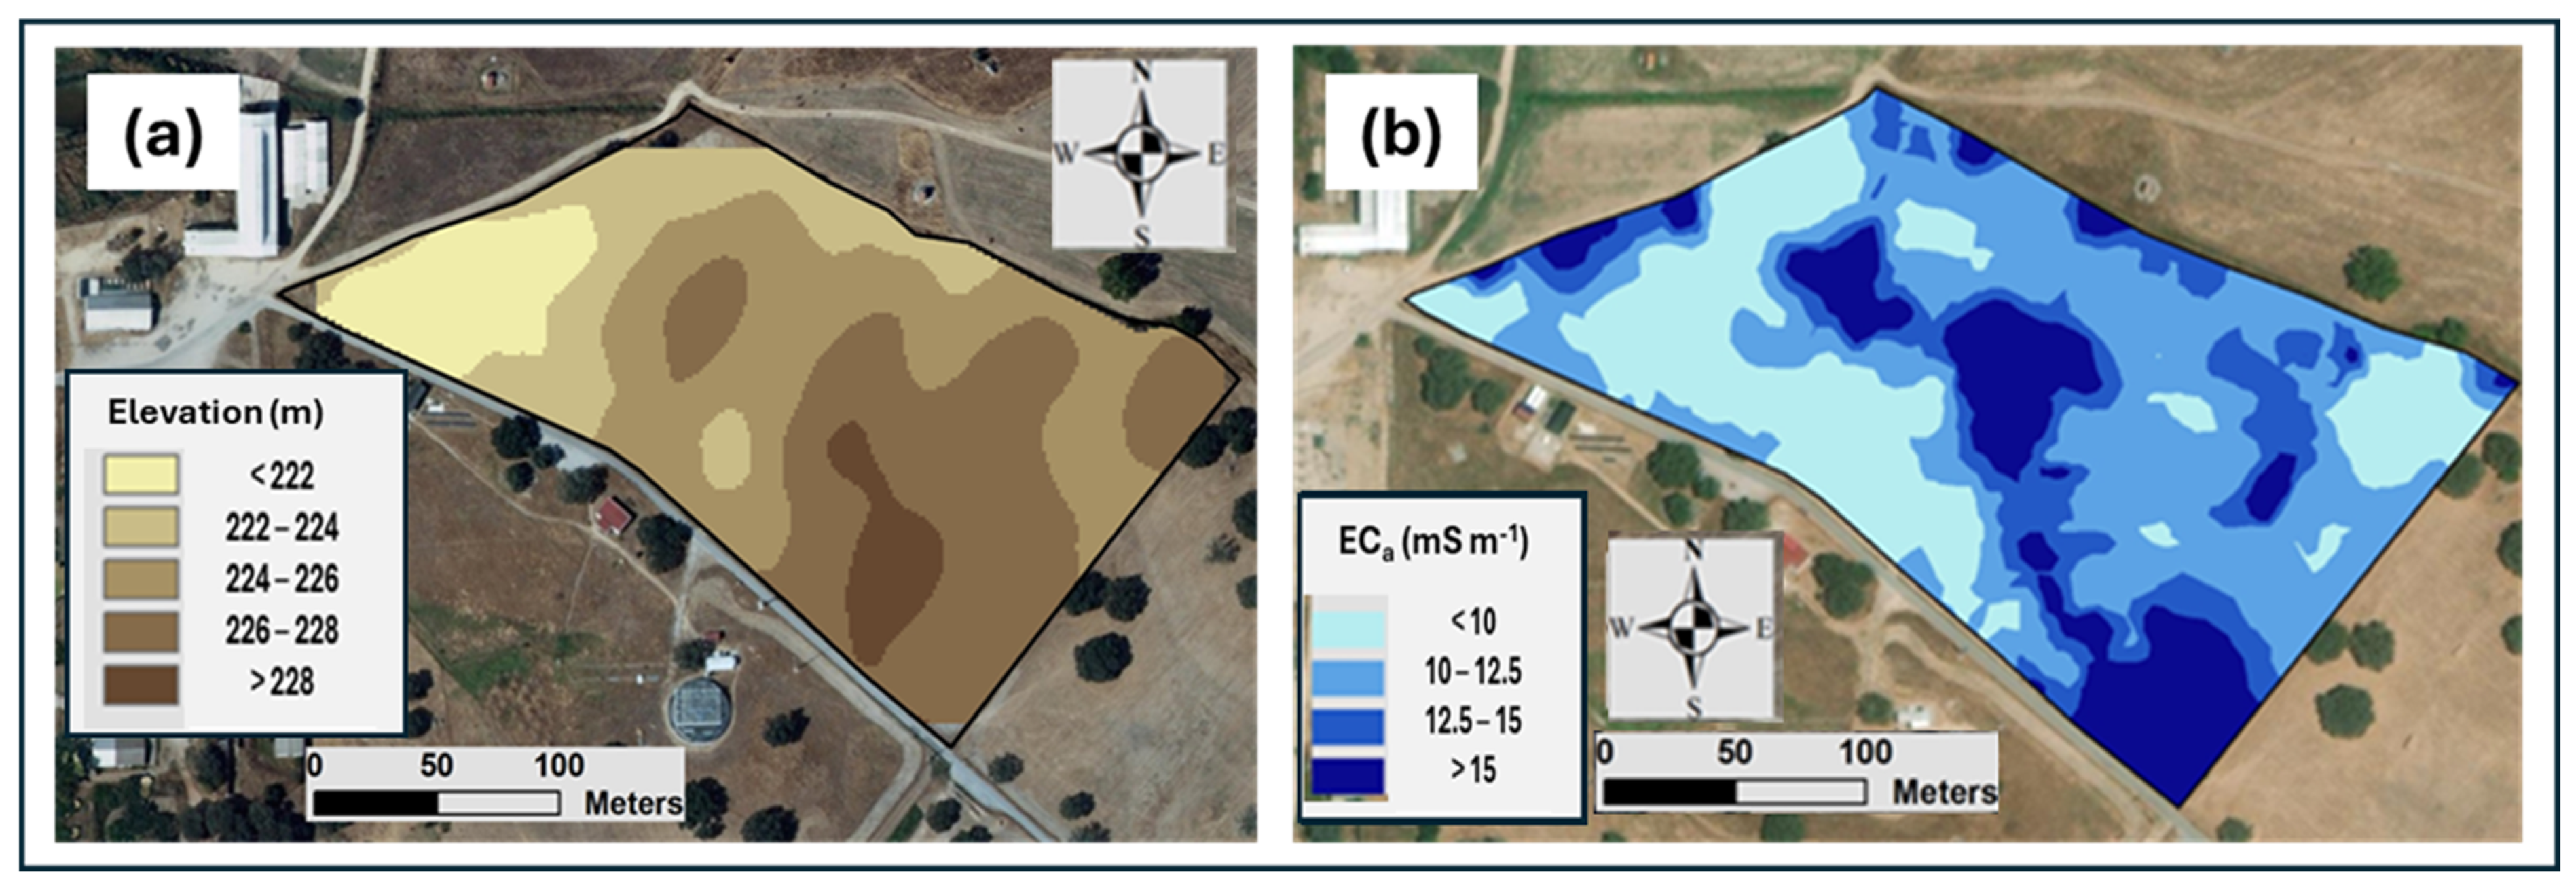
Figure 5 shows the altimetric (a) and soil’s apparent electrical conductivity (b) maps of the experimental field in June 2023. The characteristic undulating relief of the landscape associated with the Montado ecosystem is evident. The ECa of the experimental field (mean = 12.2 ± 4.6 mS m−1, range between 4.7 and 36.5 mS m−1) shows the spatial variability inherent to the soils of this region.
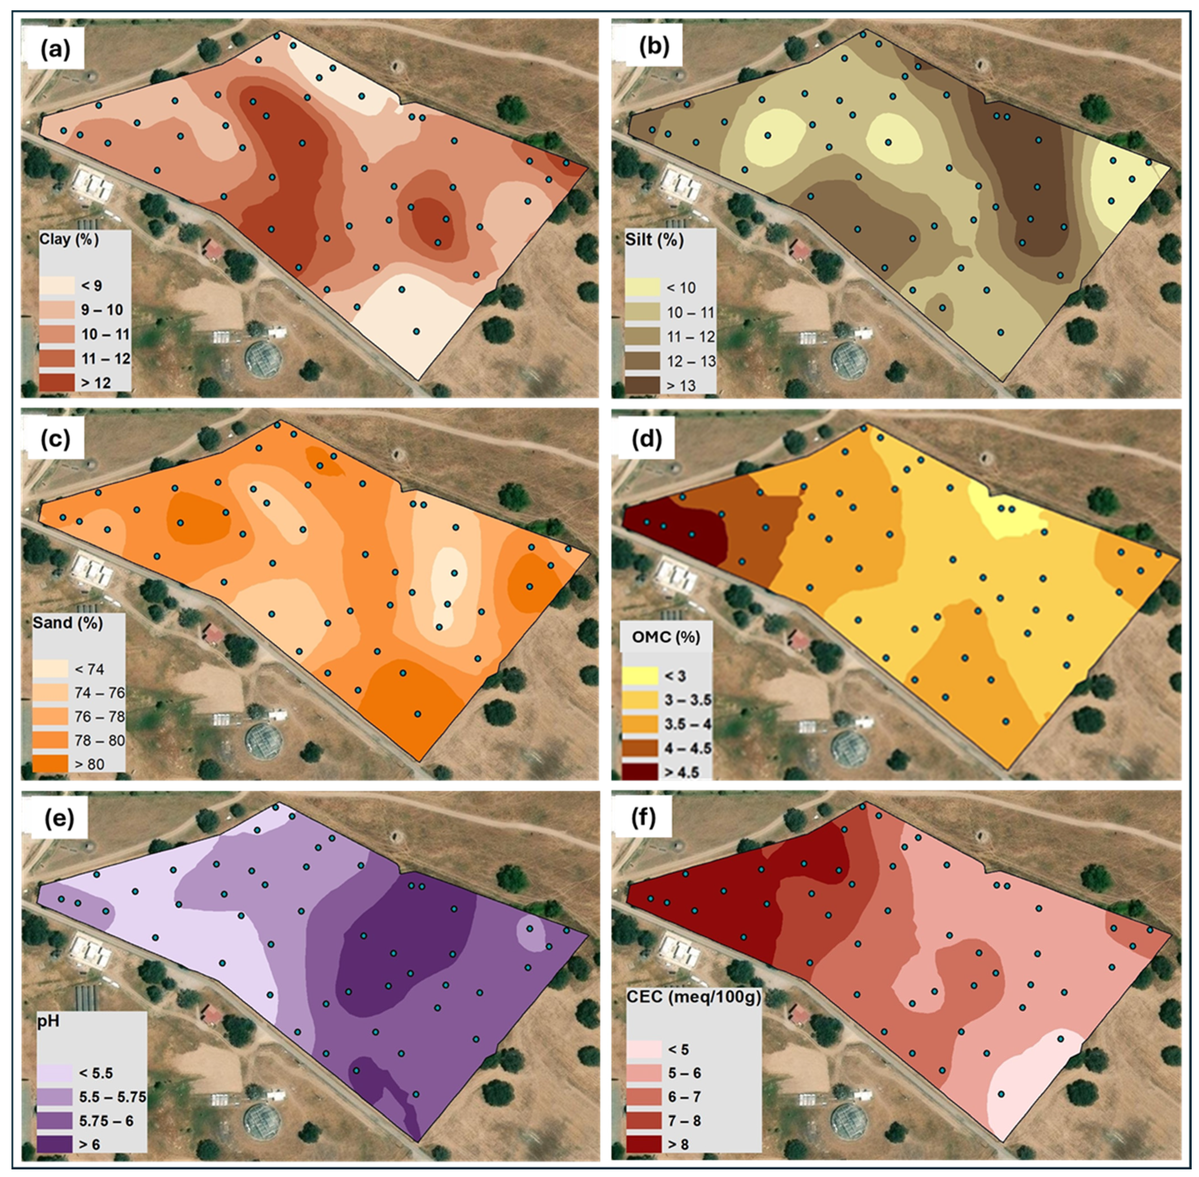
Soil parameters of the experimental field (0–30 cm depth) are presented in Table 1. It is a sandy loam soil (USDA standards) with high spatial variability, especially in clay (CV = 24%), OMC (CV = 27%) and CEC (CV = 67%). The average OMC is relatively high (mean = 3.7%; with a significantly higher value in T1 = 4.5%, compared with the areas of the other treatments) and the pH is slightly acidic (mean = 5.7 ± 0.4), with lower values in plots not treated with dolomitic limestone (T1 and T2: mean = 5.5 ± 0.2) and values close to neutrality in plots where dolomitic limestone was applied (T3 and T4: mean = 6.0 ± 0.4). Figure 6 illustrates the spatial distribution maps of soil parameters (sand, silt, clay, OMC, pH and CEC). These maps show that the highest OMC and CEC values were recorded in the western part of the experimental field, corresponding to the T1 area. This is also the area with the highest tree density (Figure 4), which may explain this spatial variability in CEC and OMC.
Pearson’s correlation coefficients between RCI and soil parameters (depth = 0–30 cm), on each date are presented in Table 2. The weak correlation coefficients, which are only occasionally statistically significant and have no stable pattern, indicate that other factors are potentially responsible for variations in soil compaction.
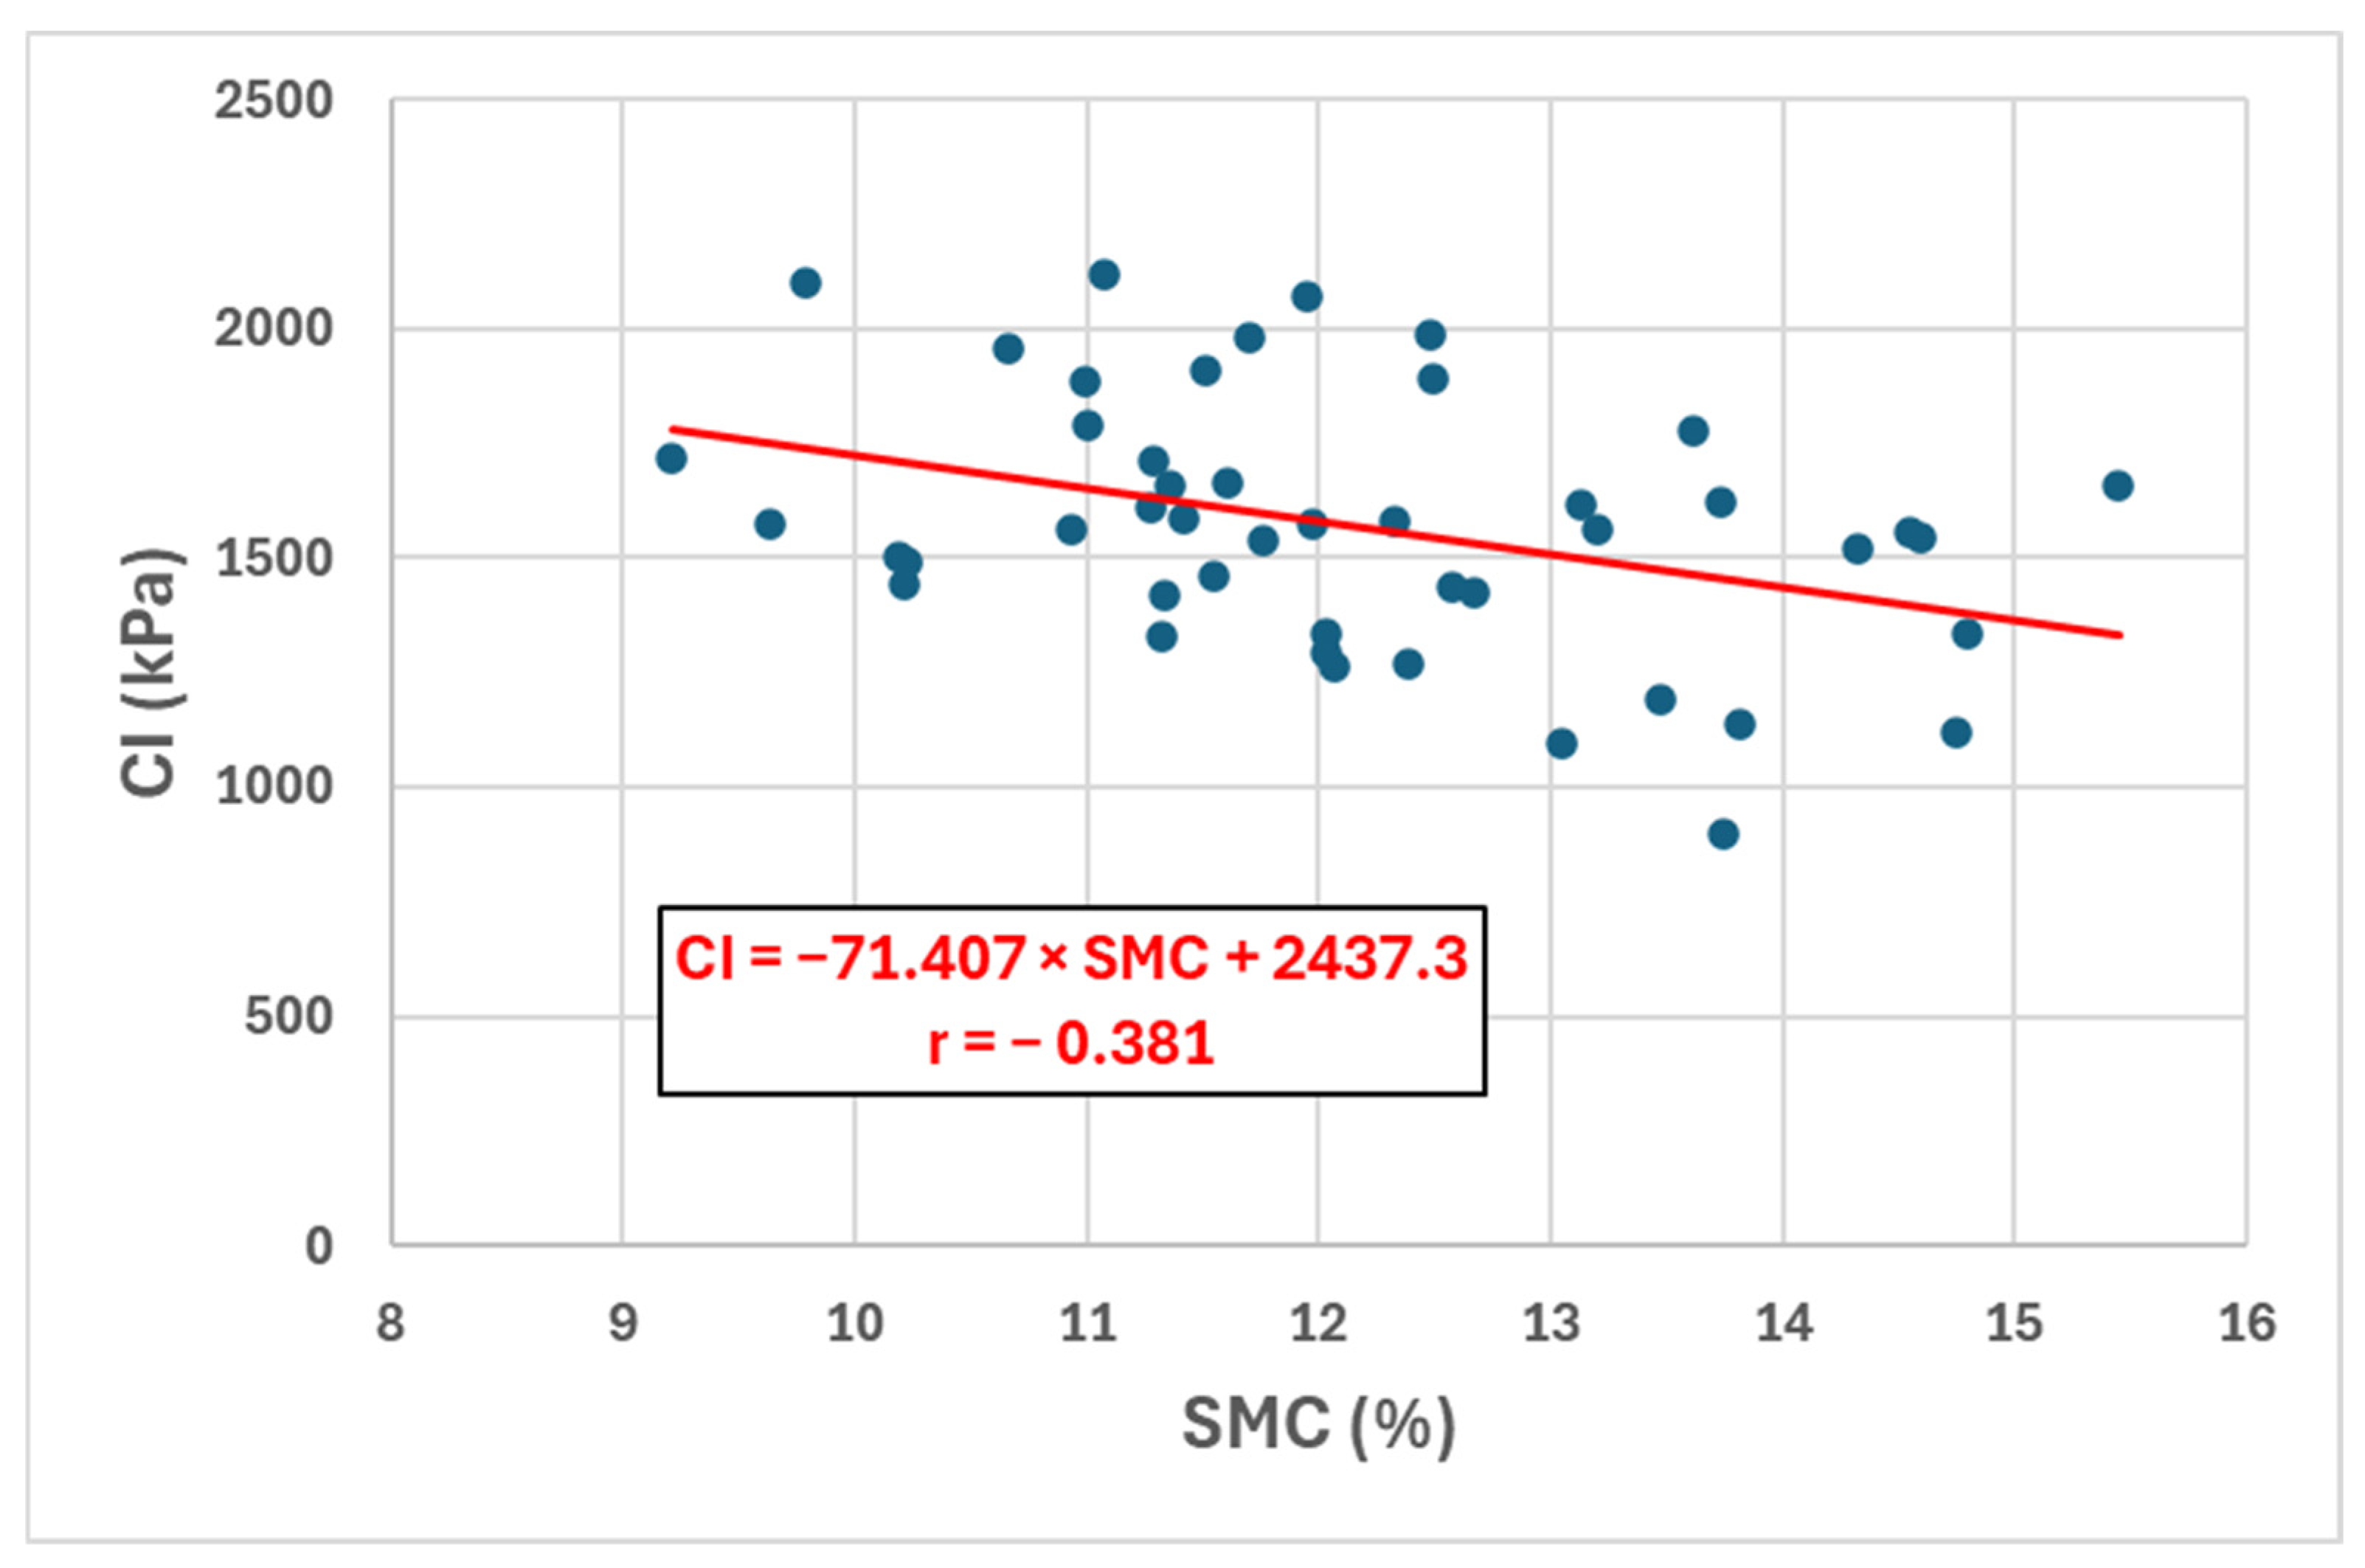
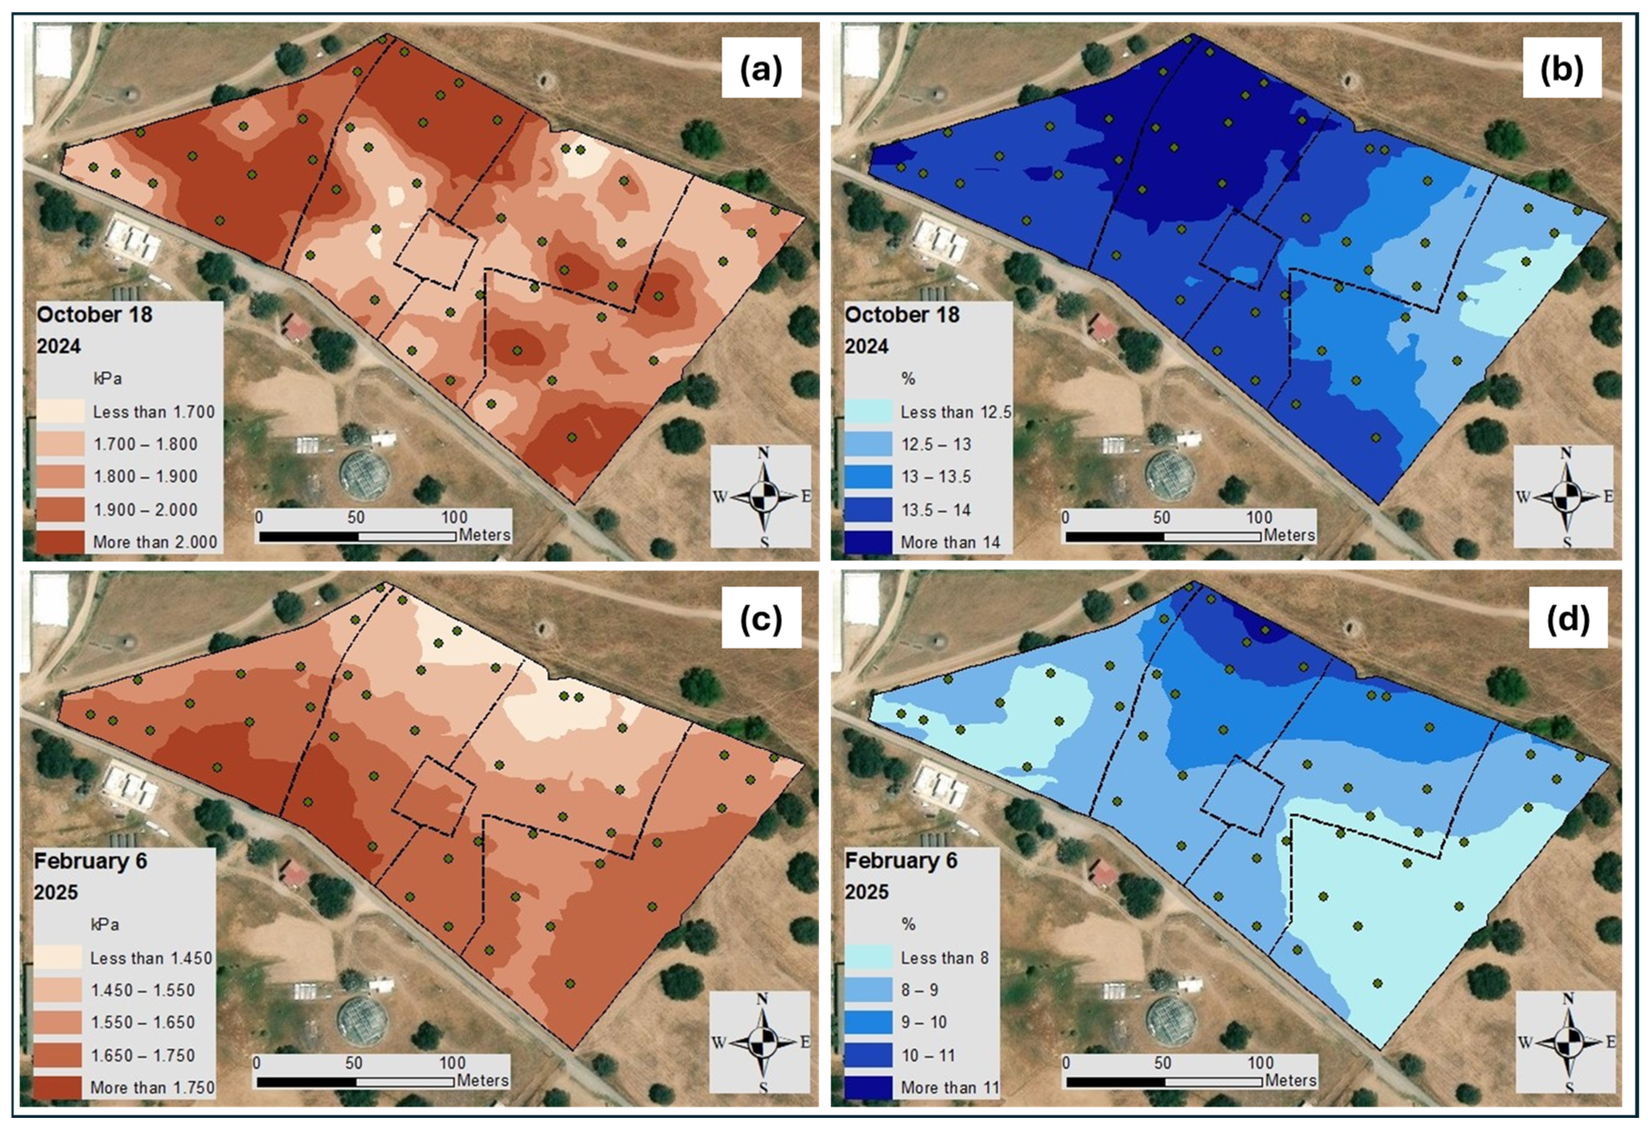
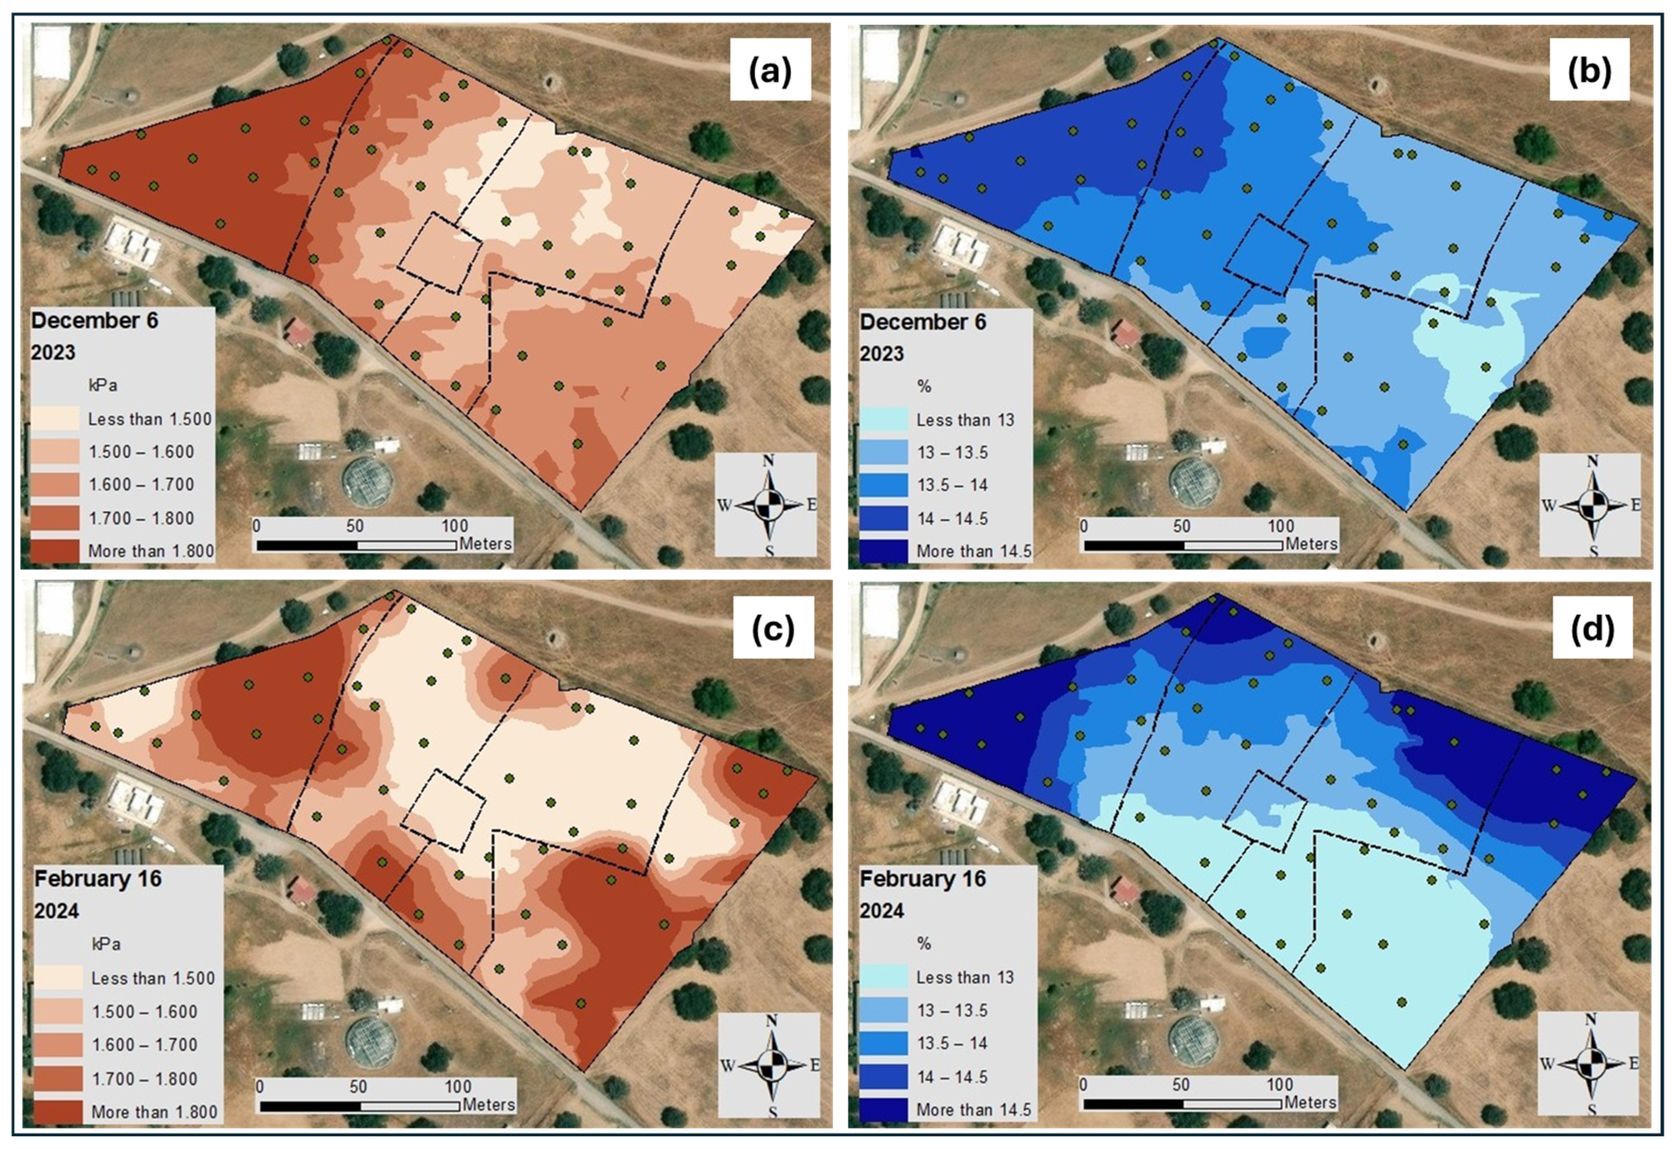
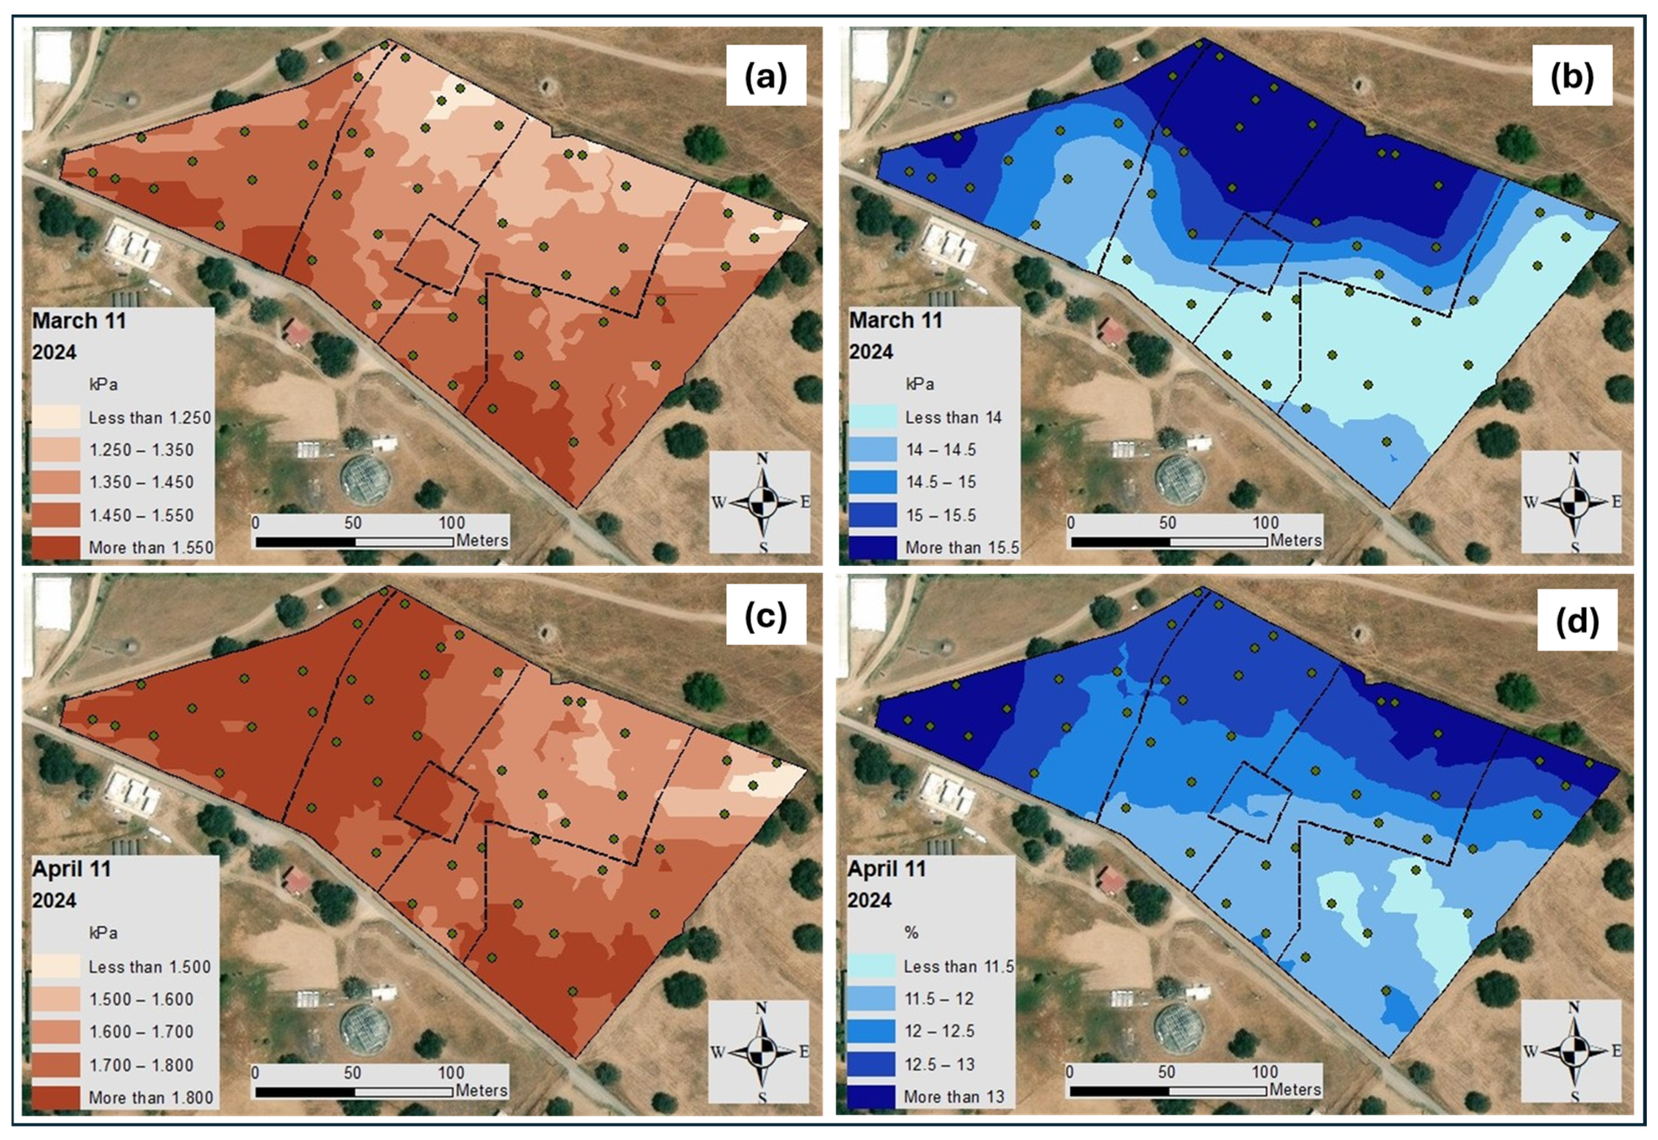
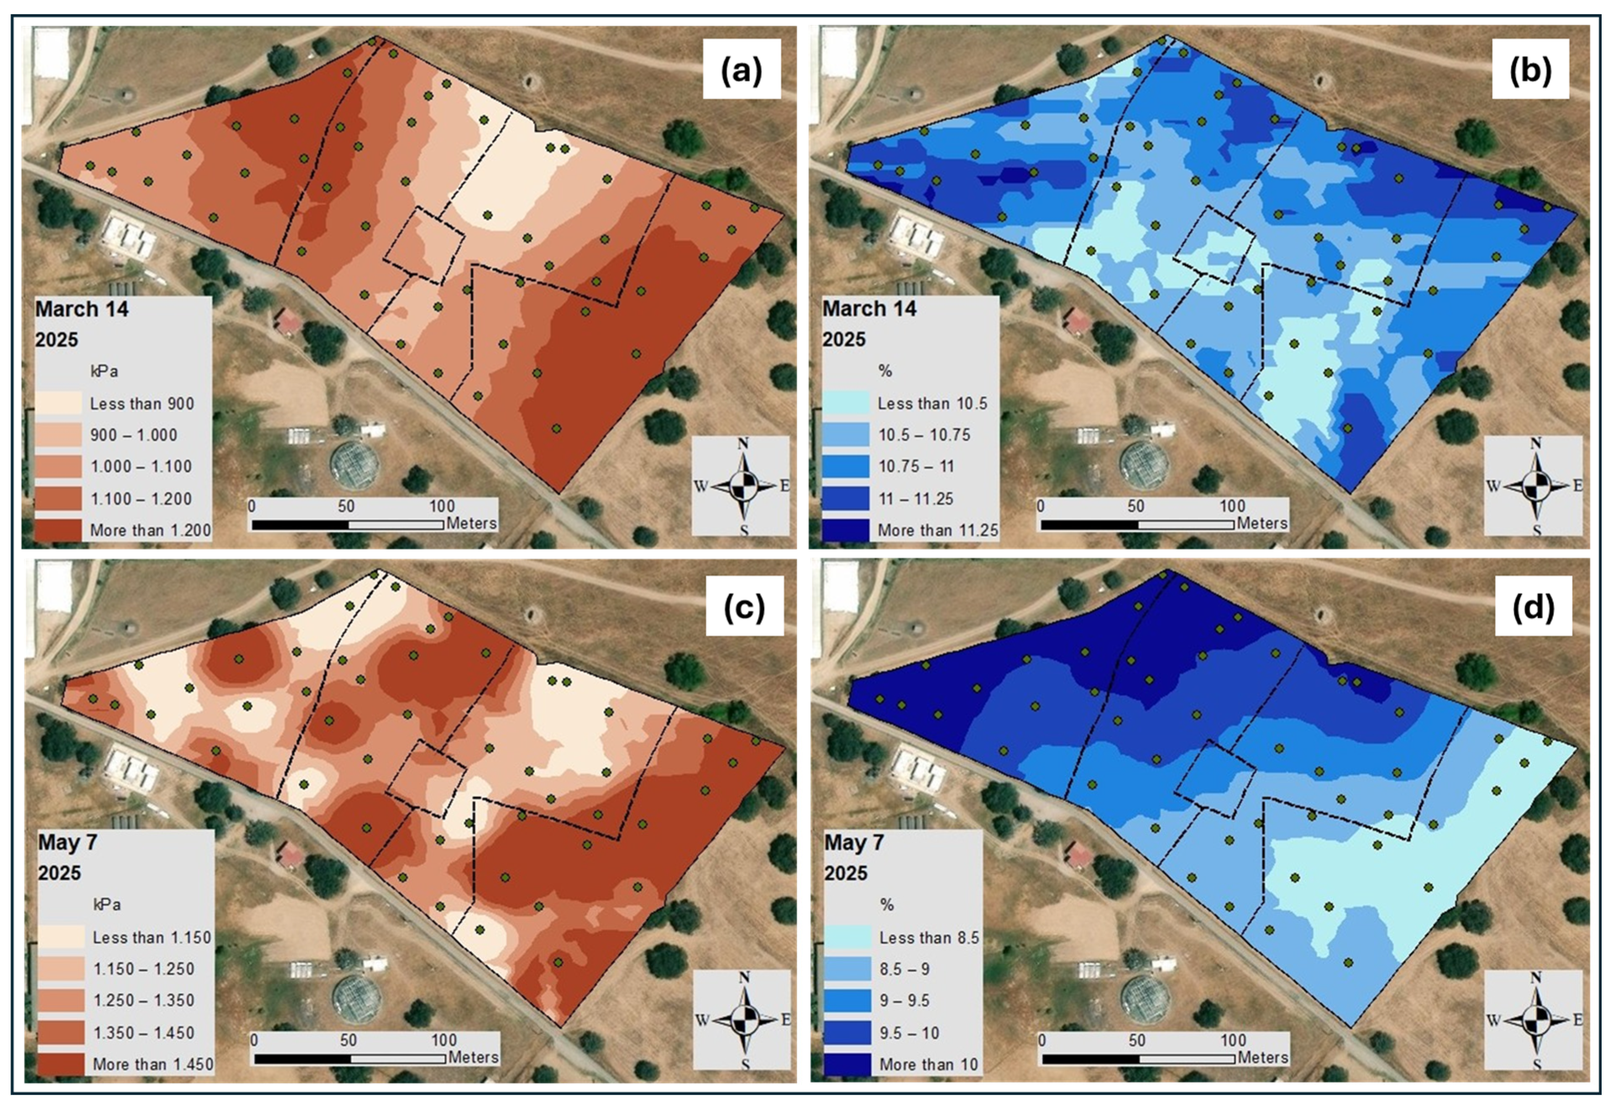
The only parameter that showed the same trend across all dates was SMC (negative correlation with CI). The regression analysis between SMC and CI (depth 0–30 cm), mean of all monitoring dates, for each of the 48 sampling areas showed a negative and significant correlation (r = −0.381; p < 0.05; Figure 7). Figure 8, Figure 9, Figure 10 and Figure 11 show the spatial variability in CI and SMC (depth 0–30 cm) in the experimental field over the eight sampling dates.

3.2. Main Experimental Design: Lime Application and Grazing Management

The results of inferential and descriptive application of the complete LMM (CI as dependent variable) are presented in Table 3 and Table 4. It is possible to highlight: (i) a significant main effect of grazing (F = 4.365; p = 0.037), with higher CI in the CG-LSR plots; (ii) a highly significant effect of depth (F = 21.879; p < 0.001), with CI increasing as depth increases (CI20–30 > CI10–20 > CI0–10); and (iii) a significant interaction “grazing × depth” (F = 6.464; p = 0.002). The main effect of lime application was not significant (F = 2.197; p = 0.139) and the interaction “lime application × grazing” also did not show statistical significance (F = 1.689; p = 0.195). The spatial variability in the CI (Table 4) is evidenced by the wide range of observed values (155 to 5934 kPa) and respective CV (40–56%).
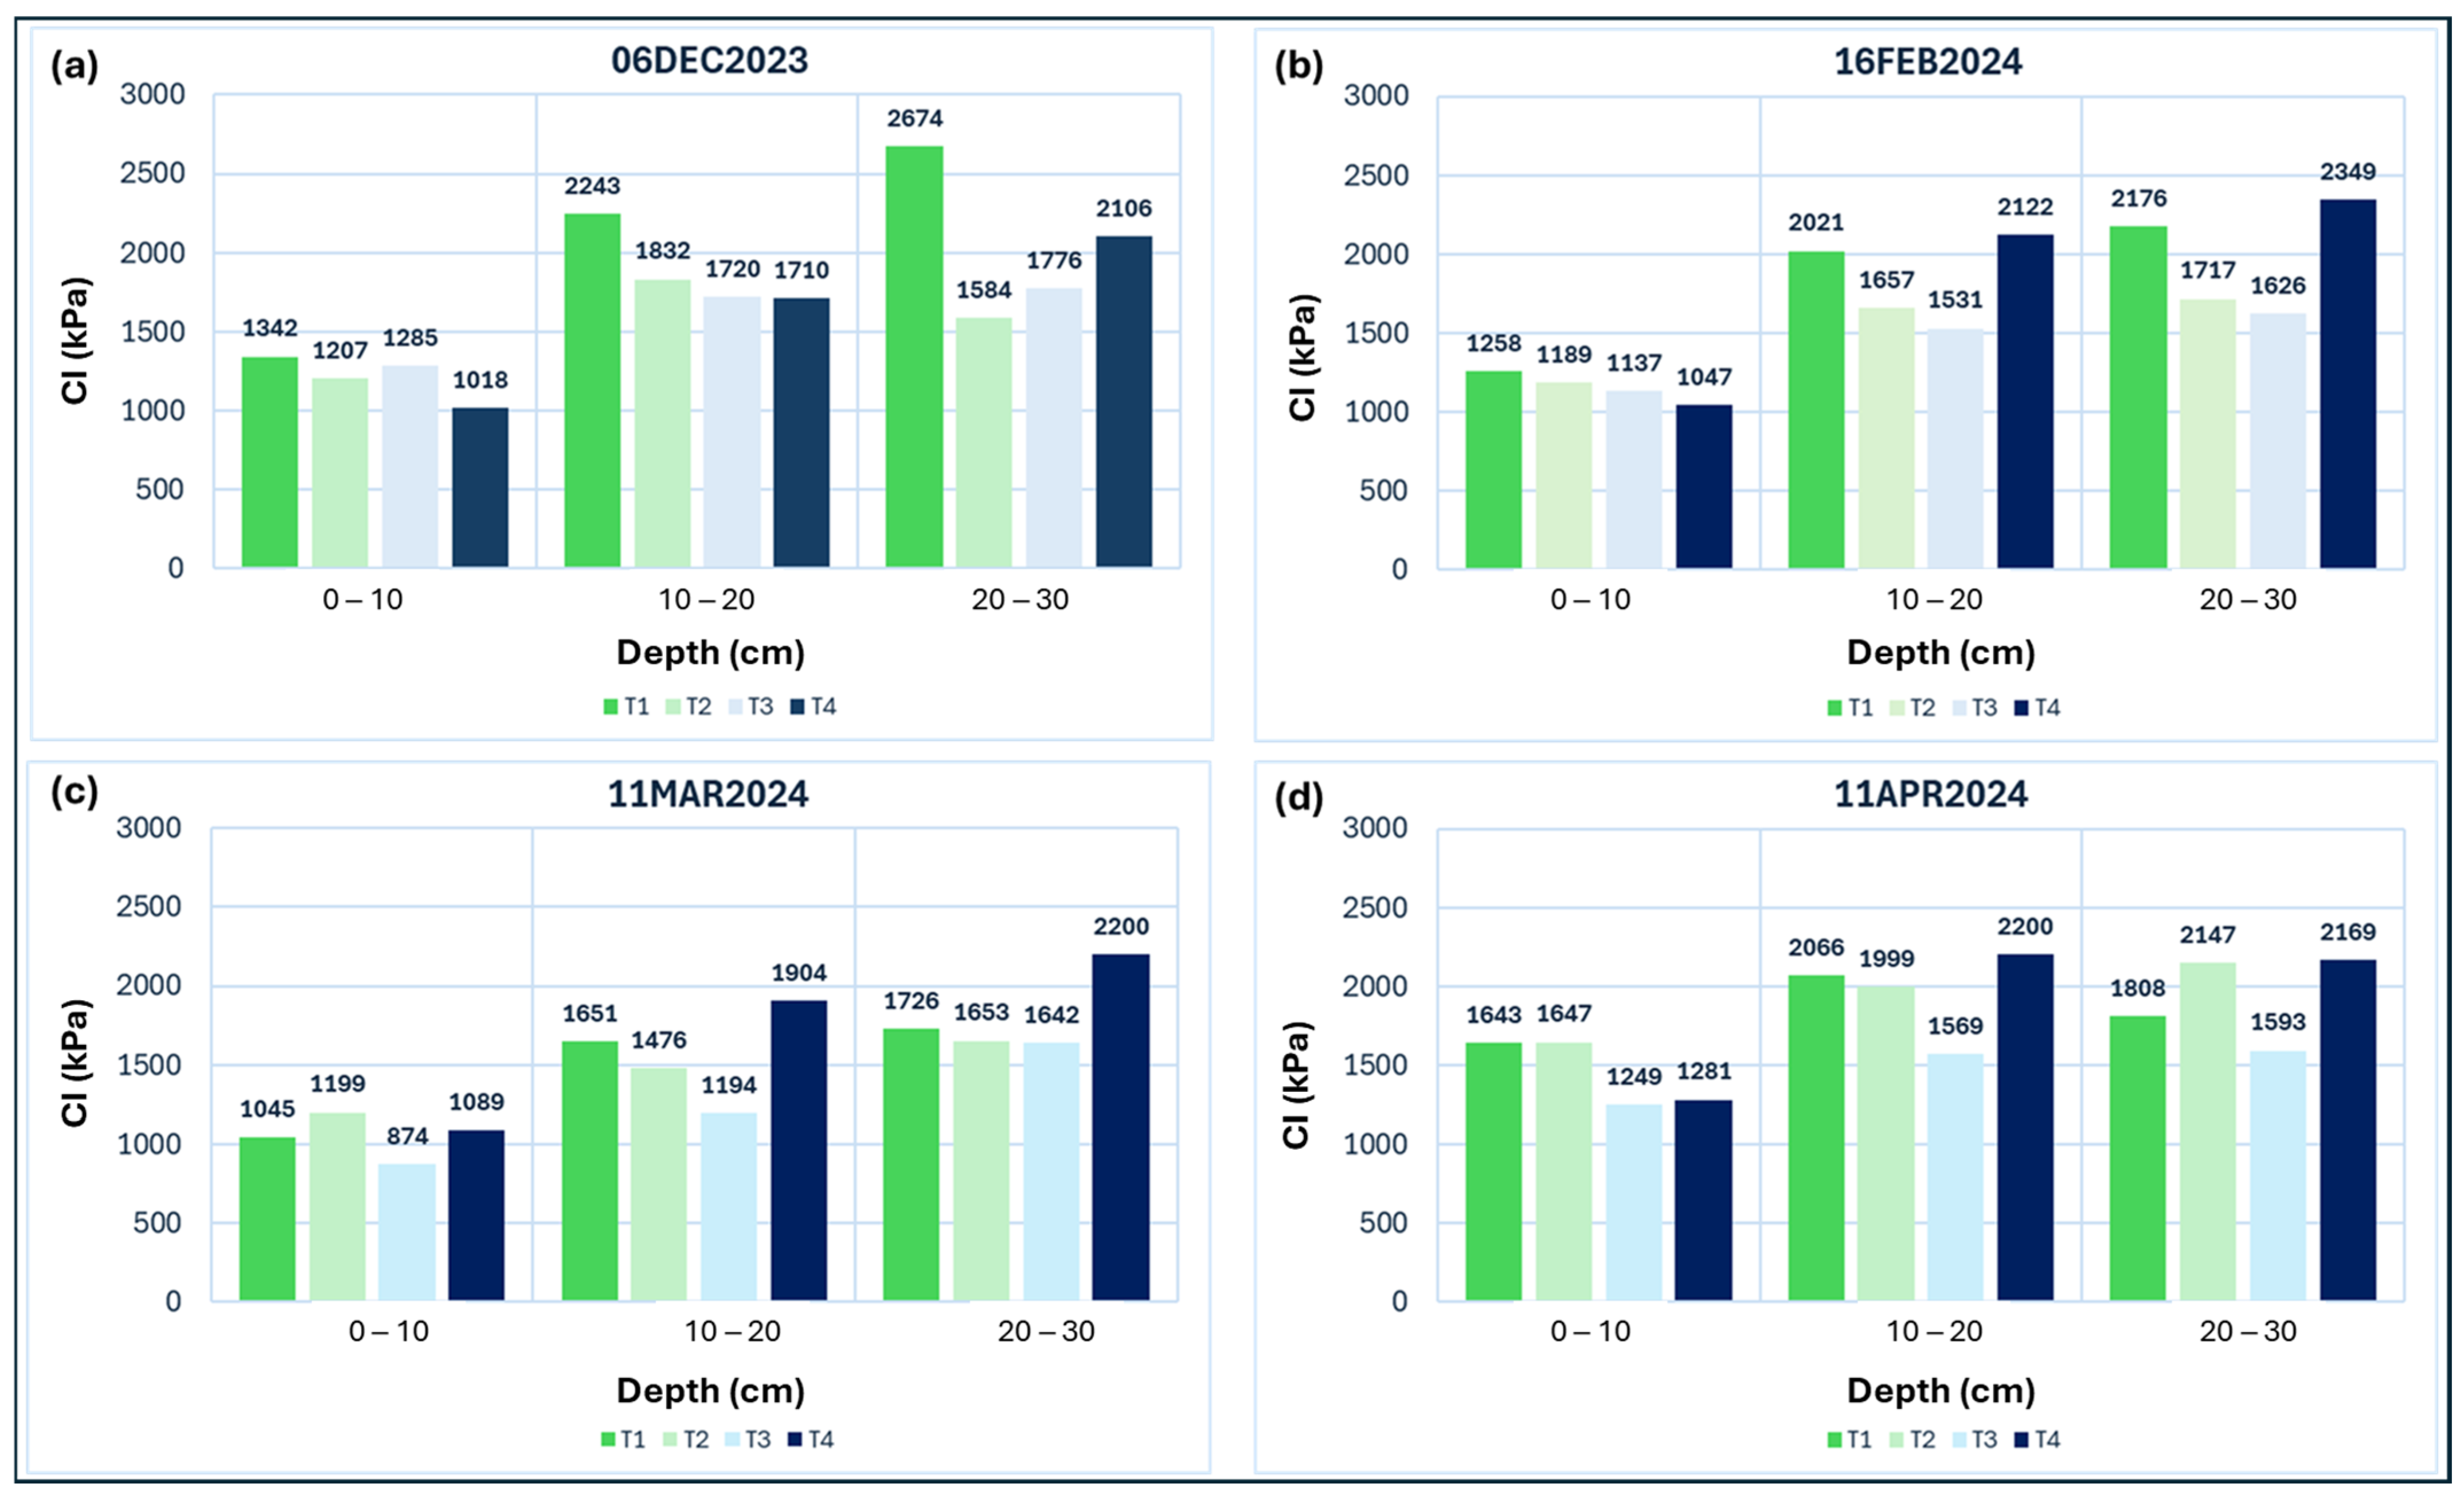
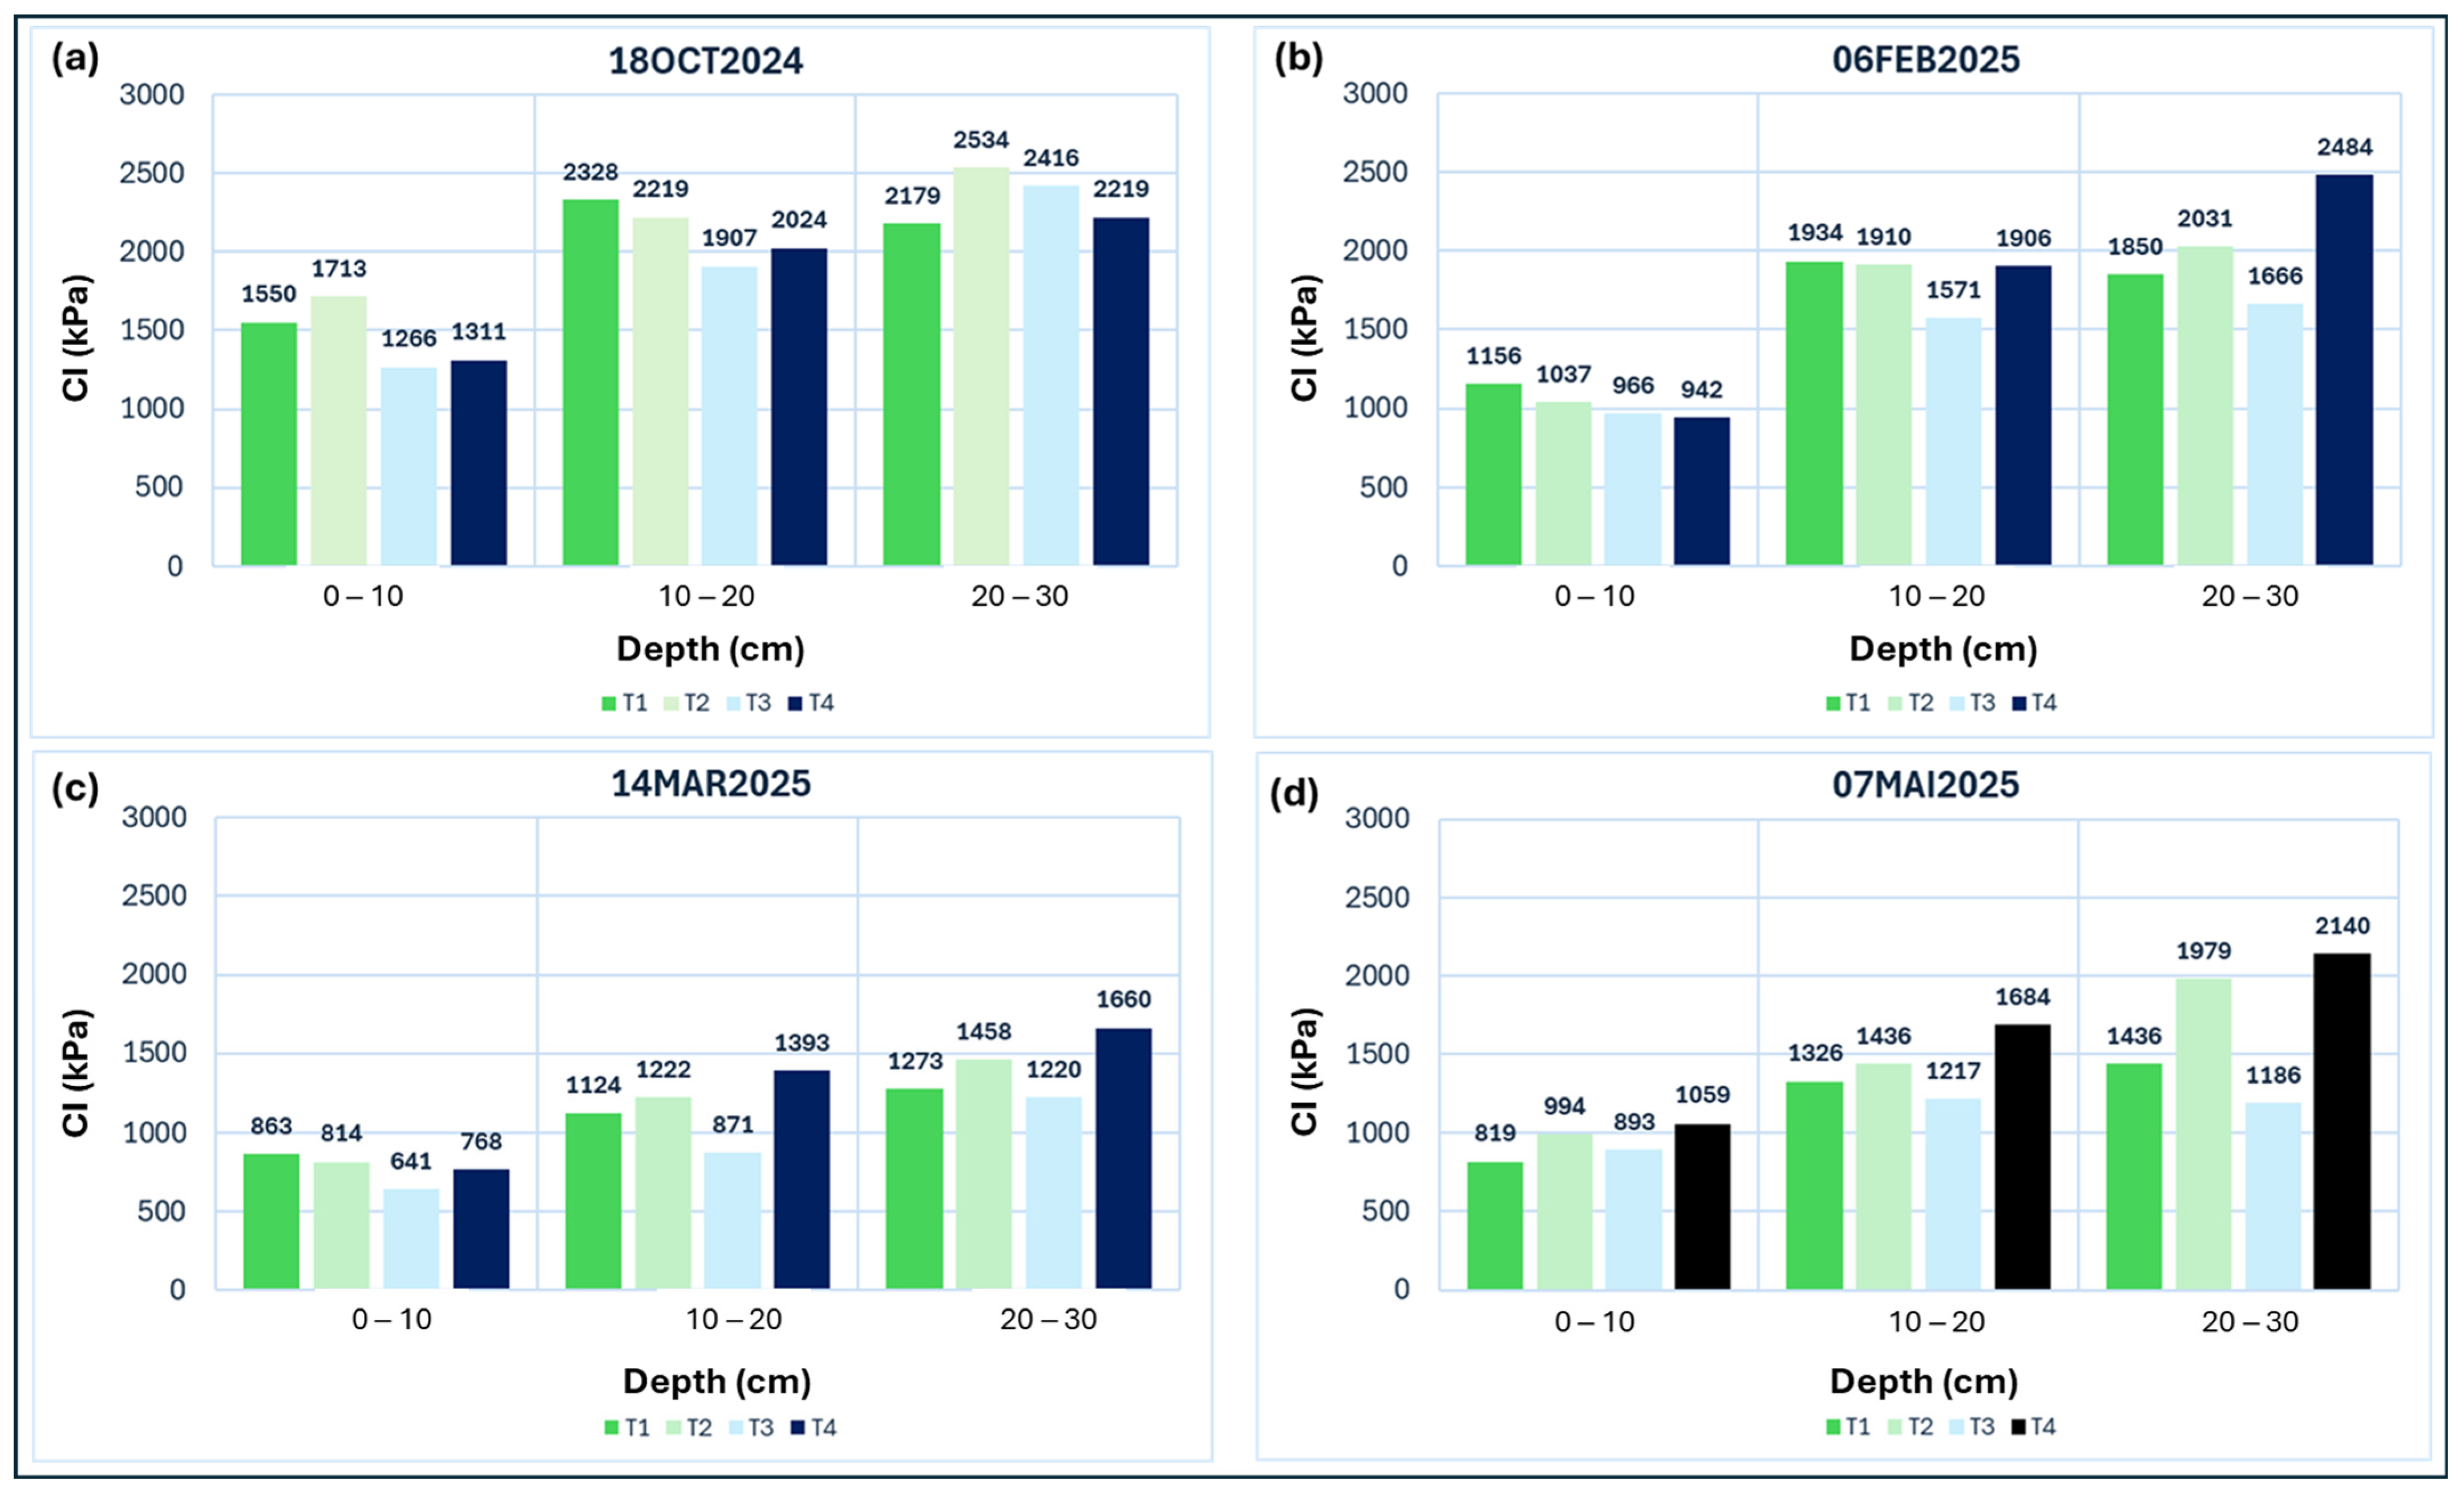
The descriptive analysis of CI in each depth interval considered (0–10 cm; 10–20 cm; and 20–30 cm) for the different treatments (T1 to T4), on the eight dates of monitoring are presented in Figure 12 and Figure 13.

3.3. Grazing Preferences’ Effect on Soil Cone Index

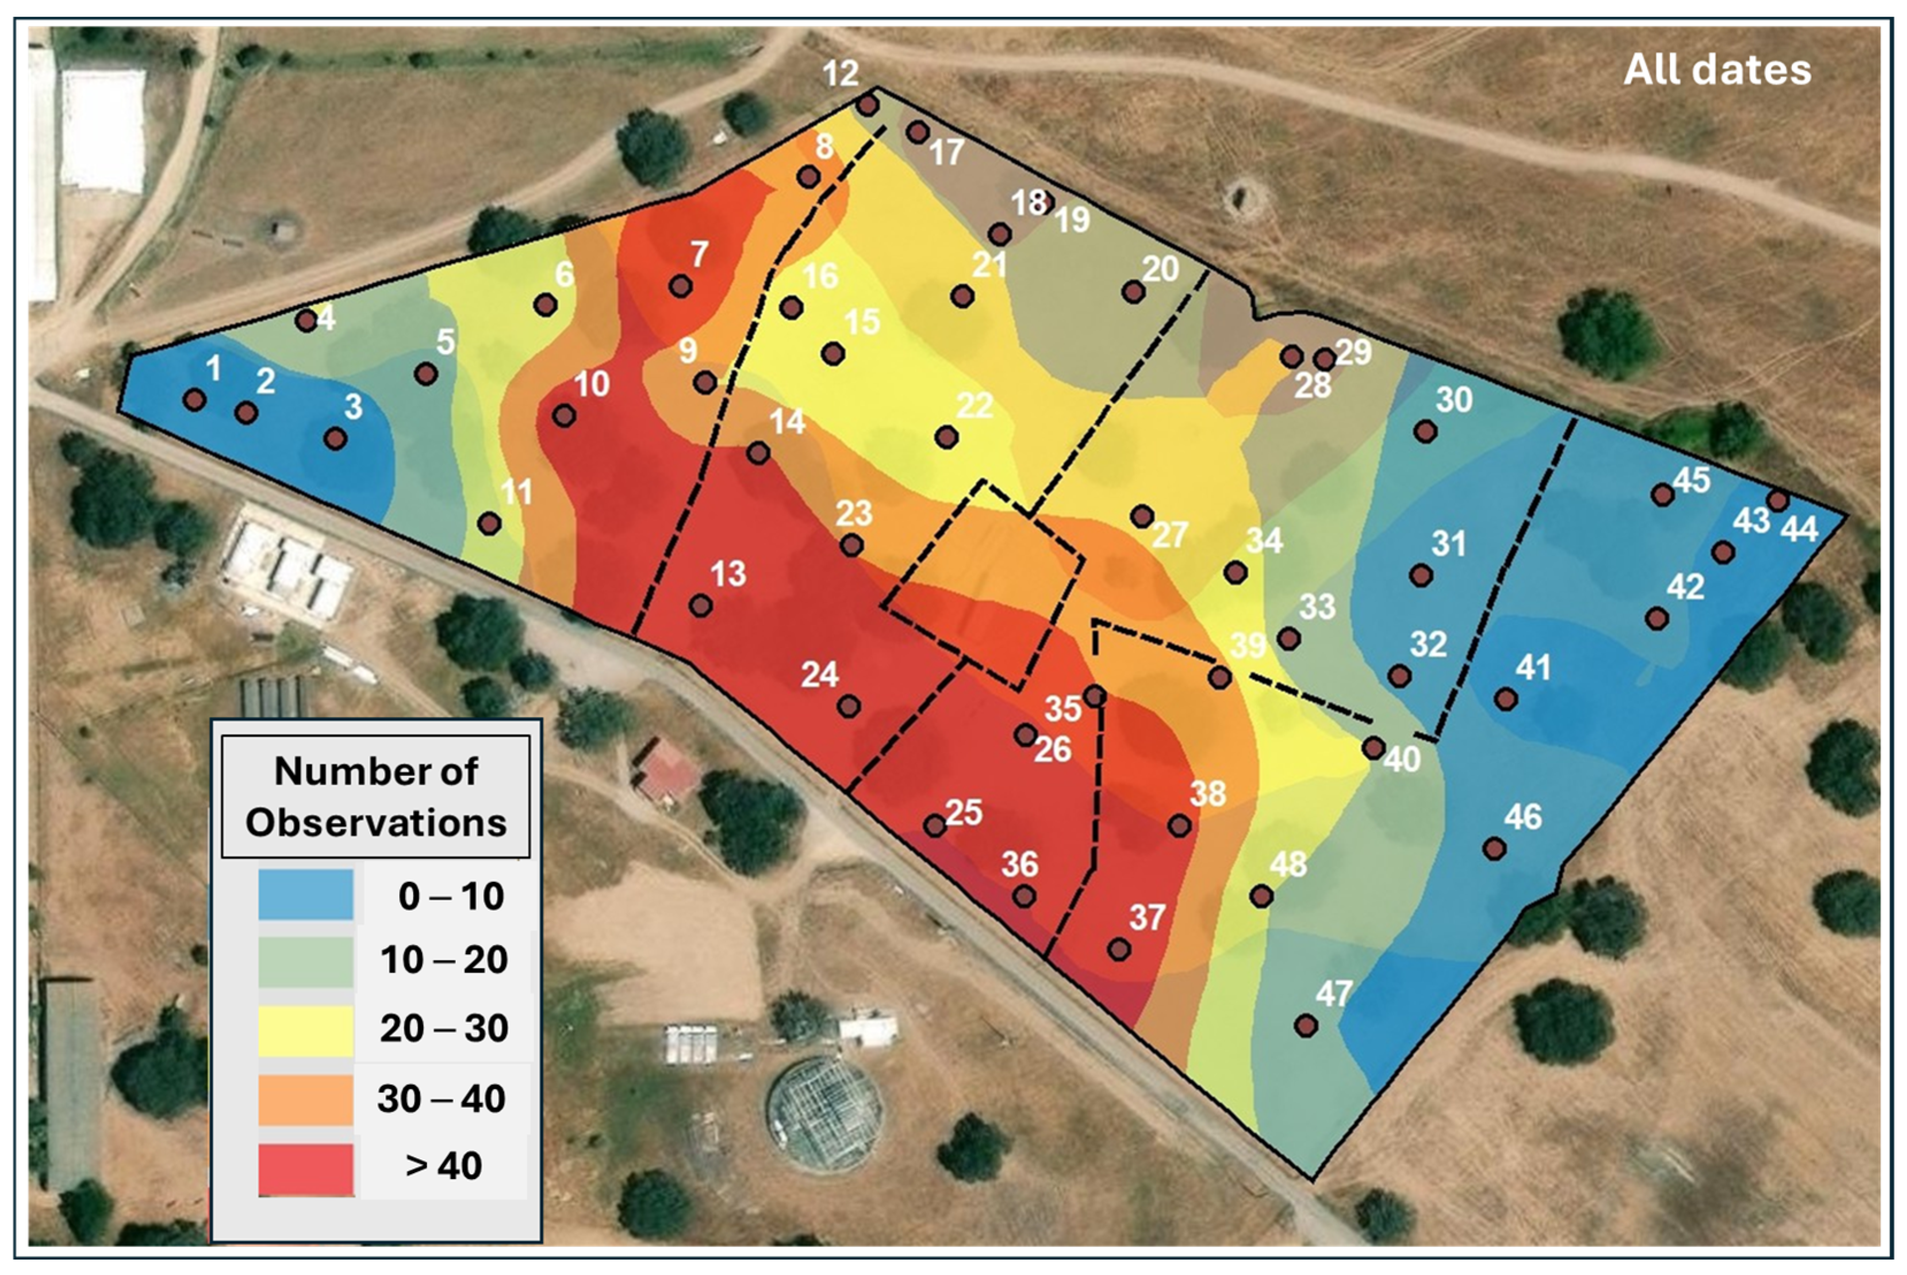
Figure 14 shows the preferential areas of animal grazing, the mean records of animal presence across four monitoring dates during the spring 2024 (between March and June). This average grazing density information was correlated with the CI values obtained in the 48 sampling areas of the experimental field, on each of the eight CI monitoring dates for each depth (Table 5). A low but significant correlation (r = 0.172; p < 0.05) was found between soil compaction and the animals’ preferred grazing areas in the topsoil (0–10 cm).

3.4. Tree Effect on Soil Cone Index

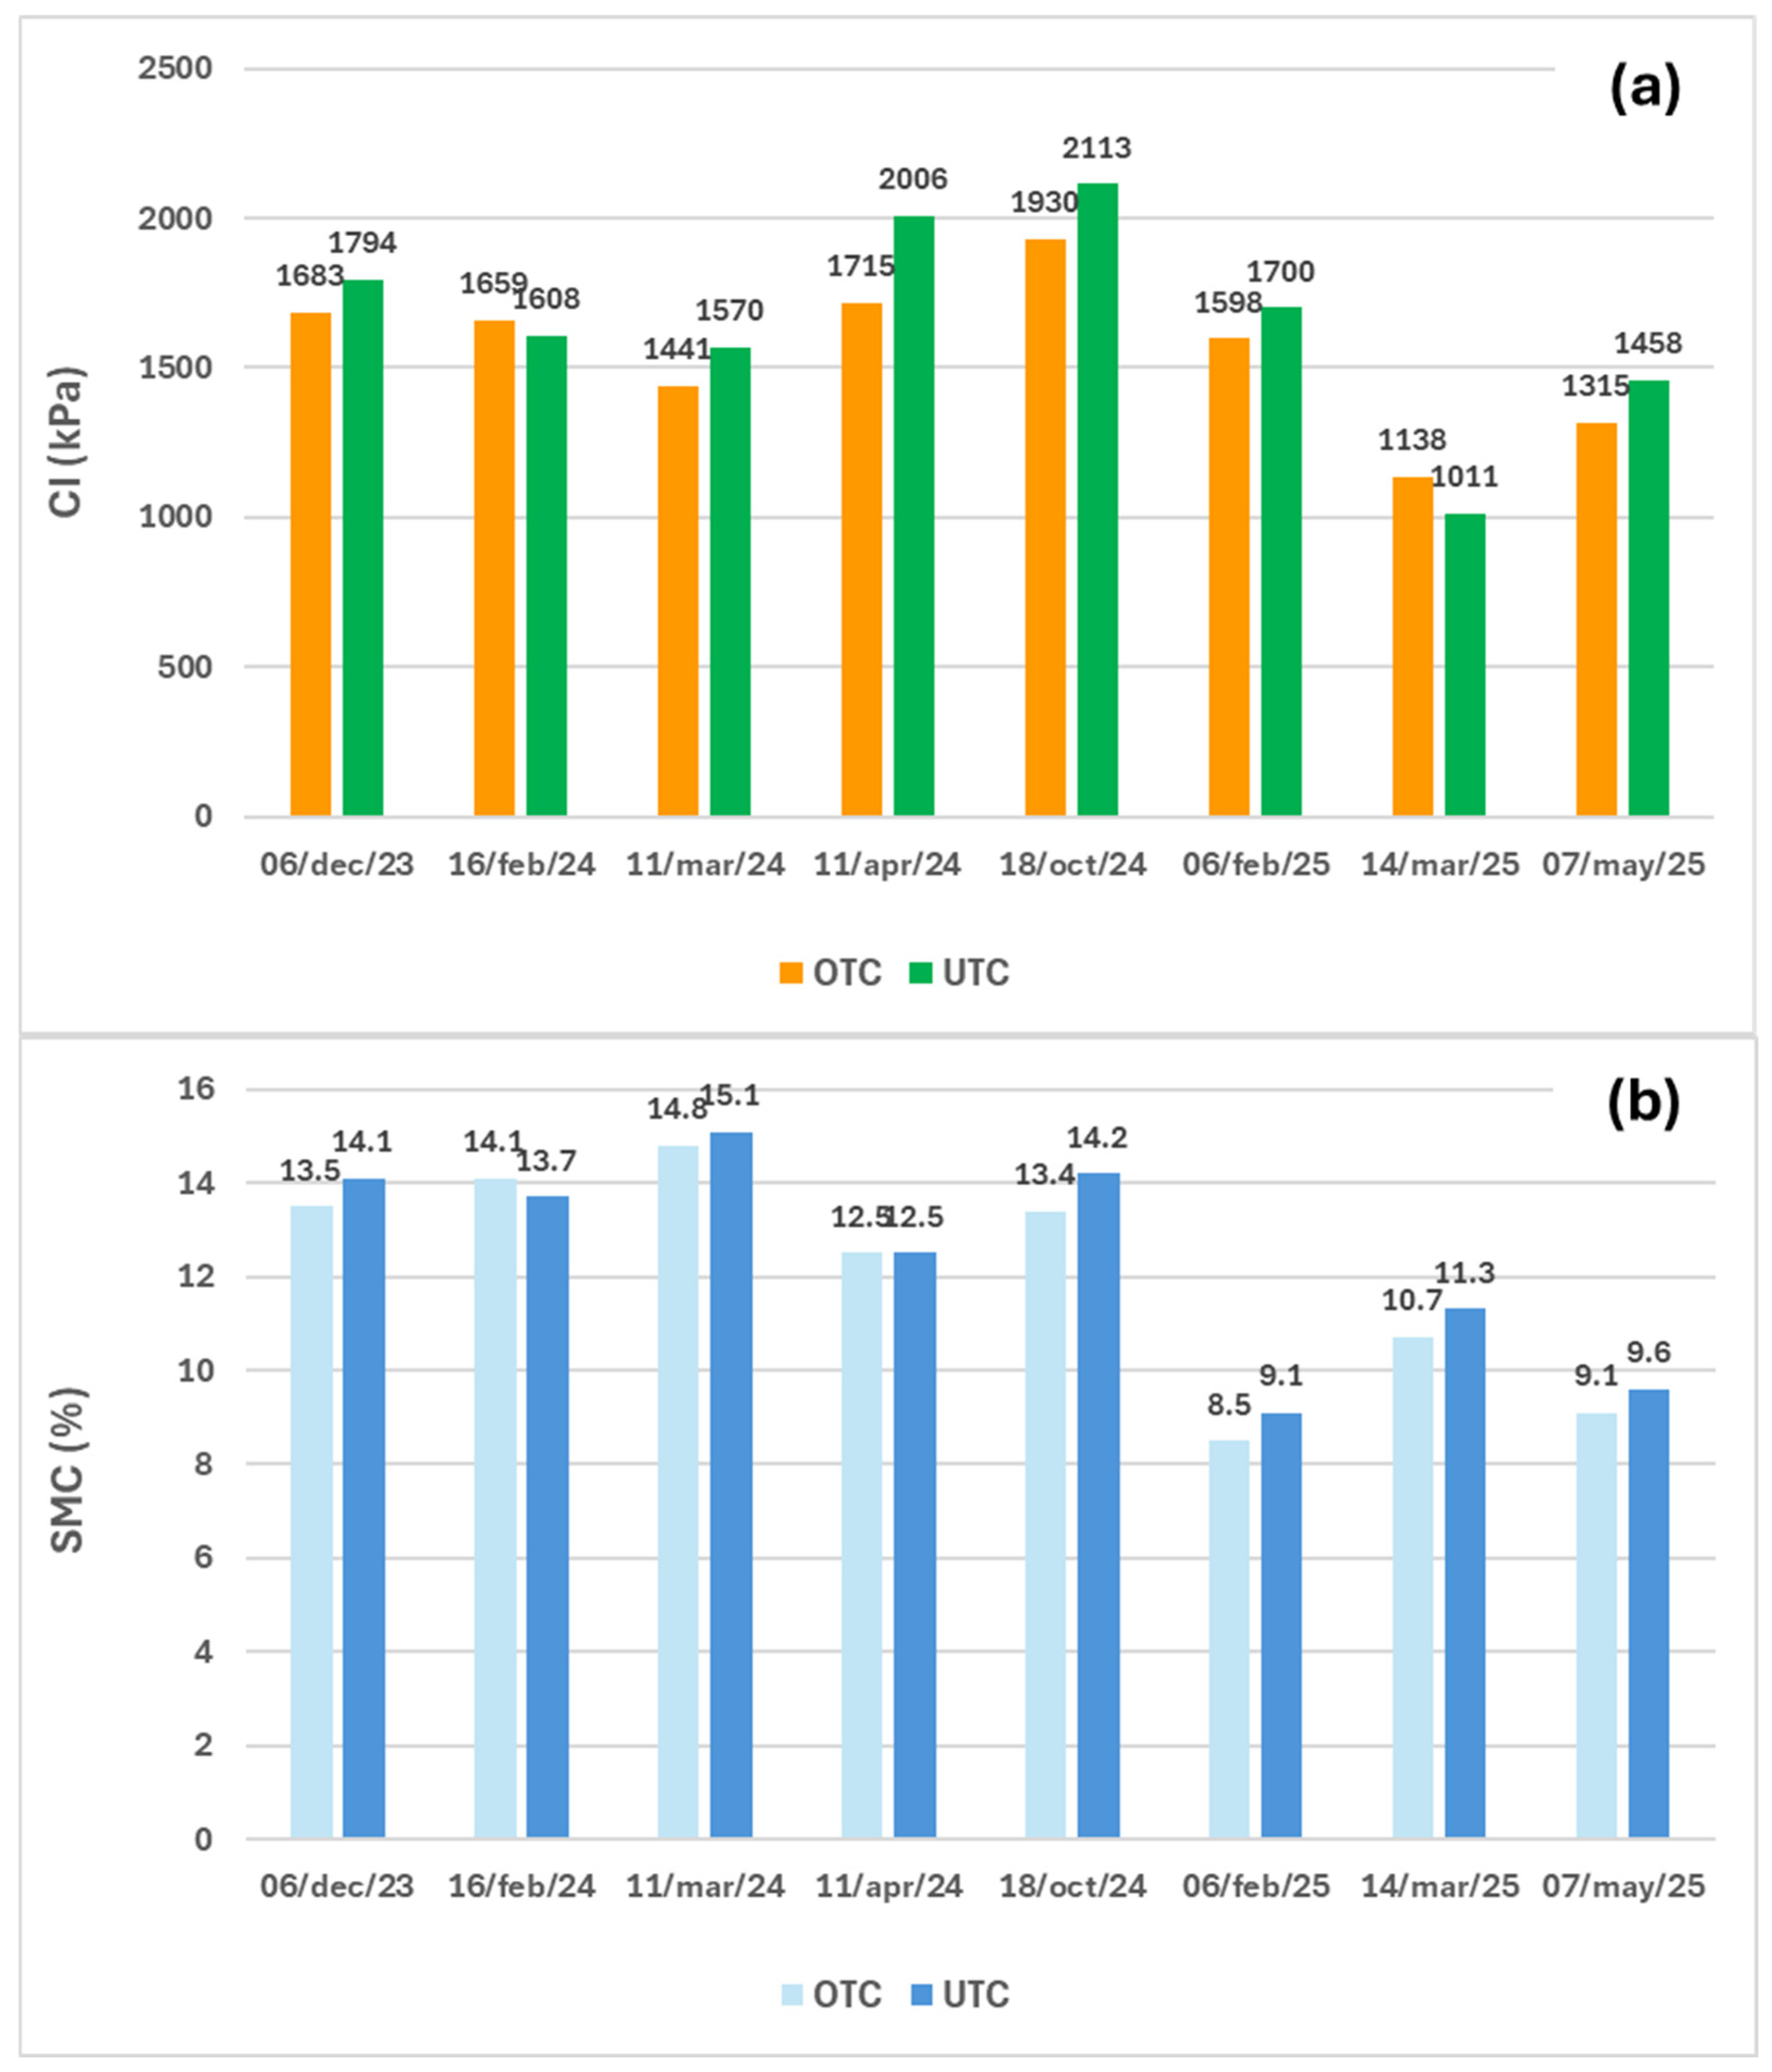
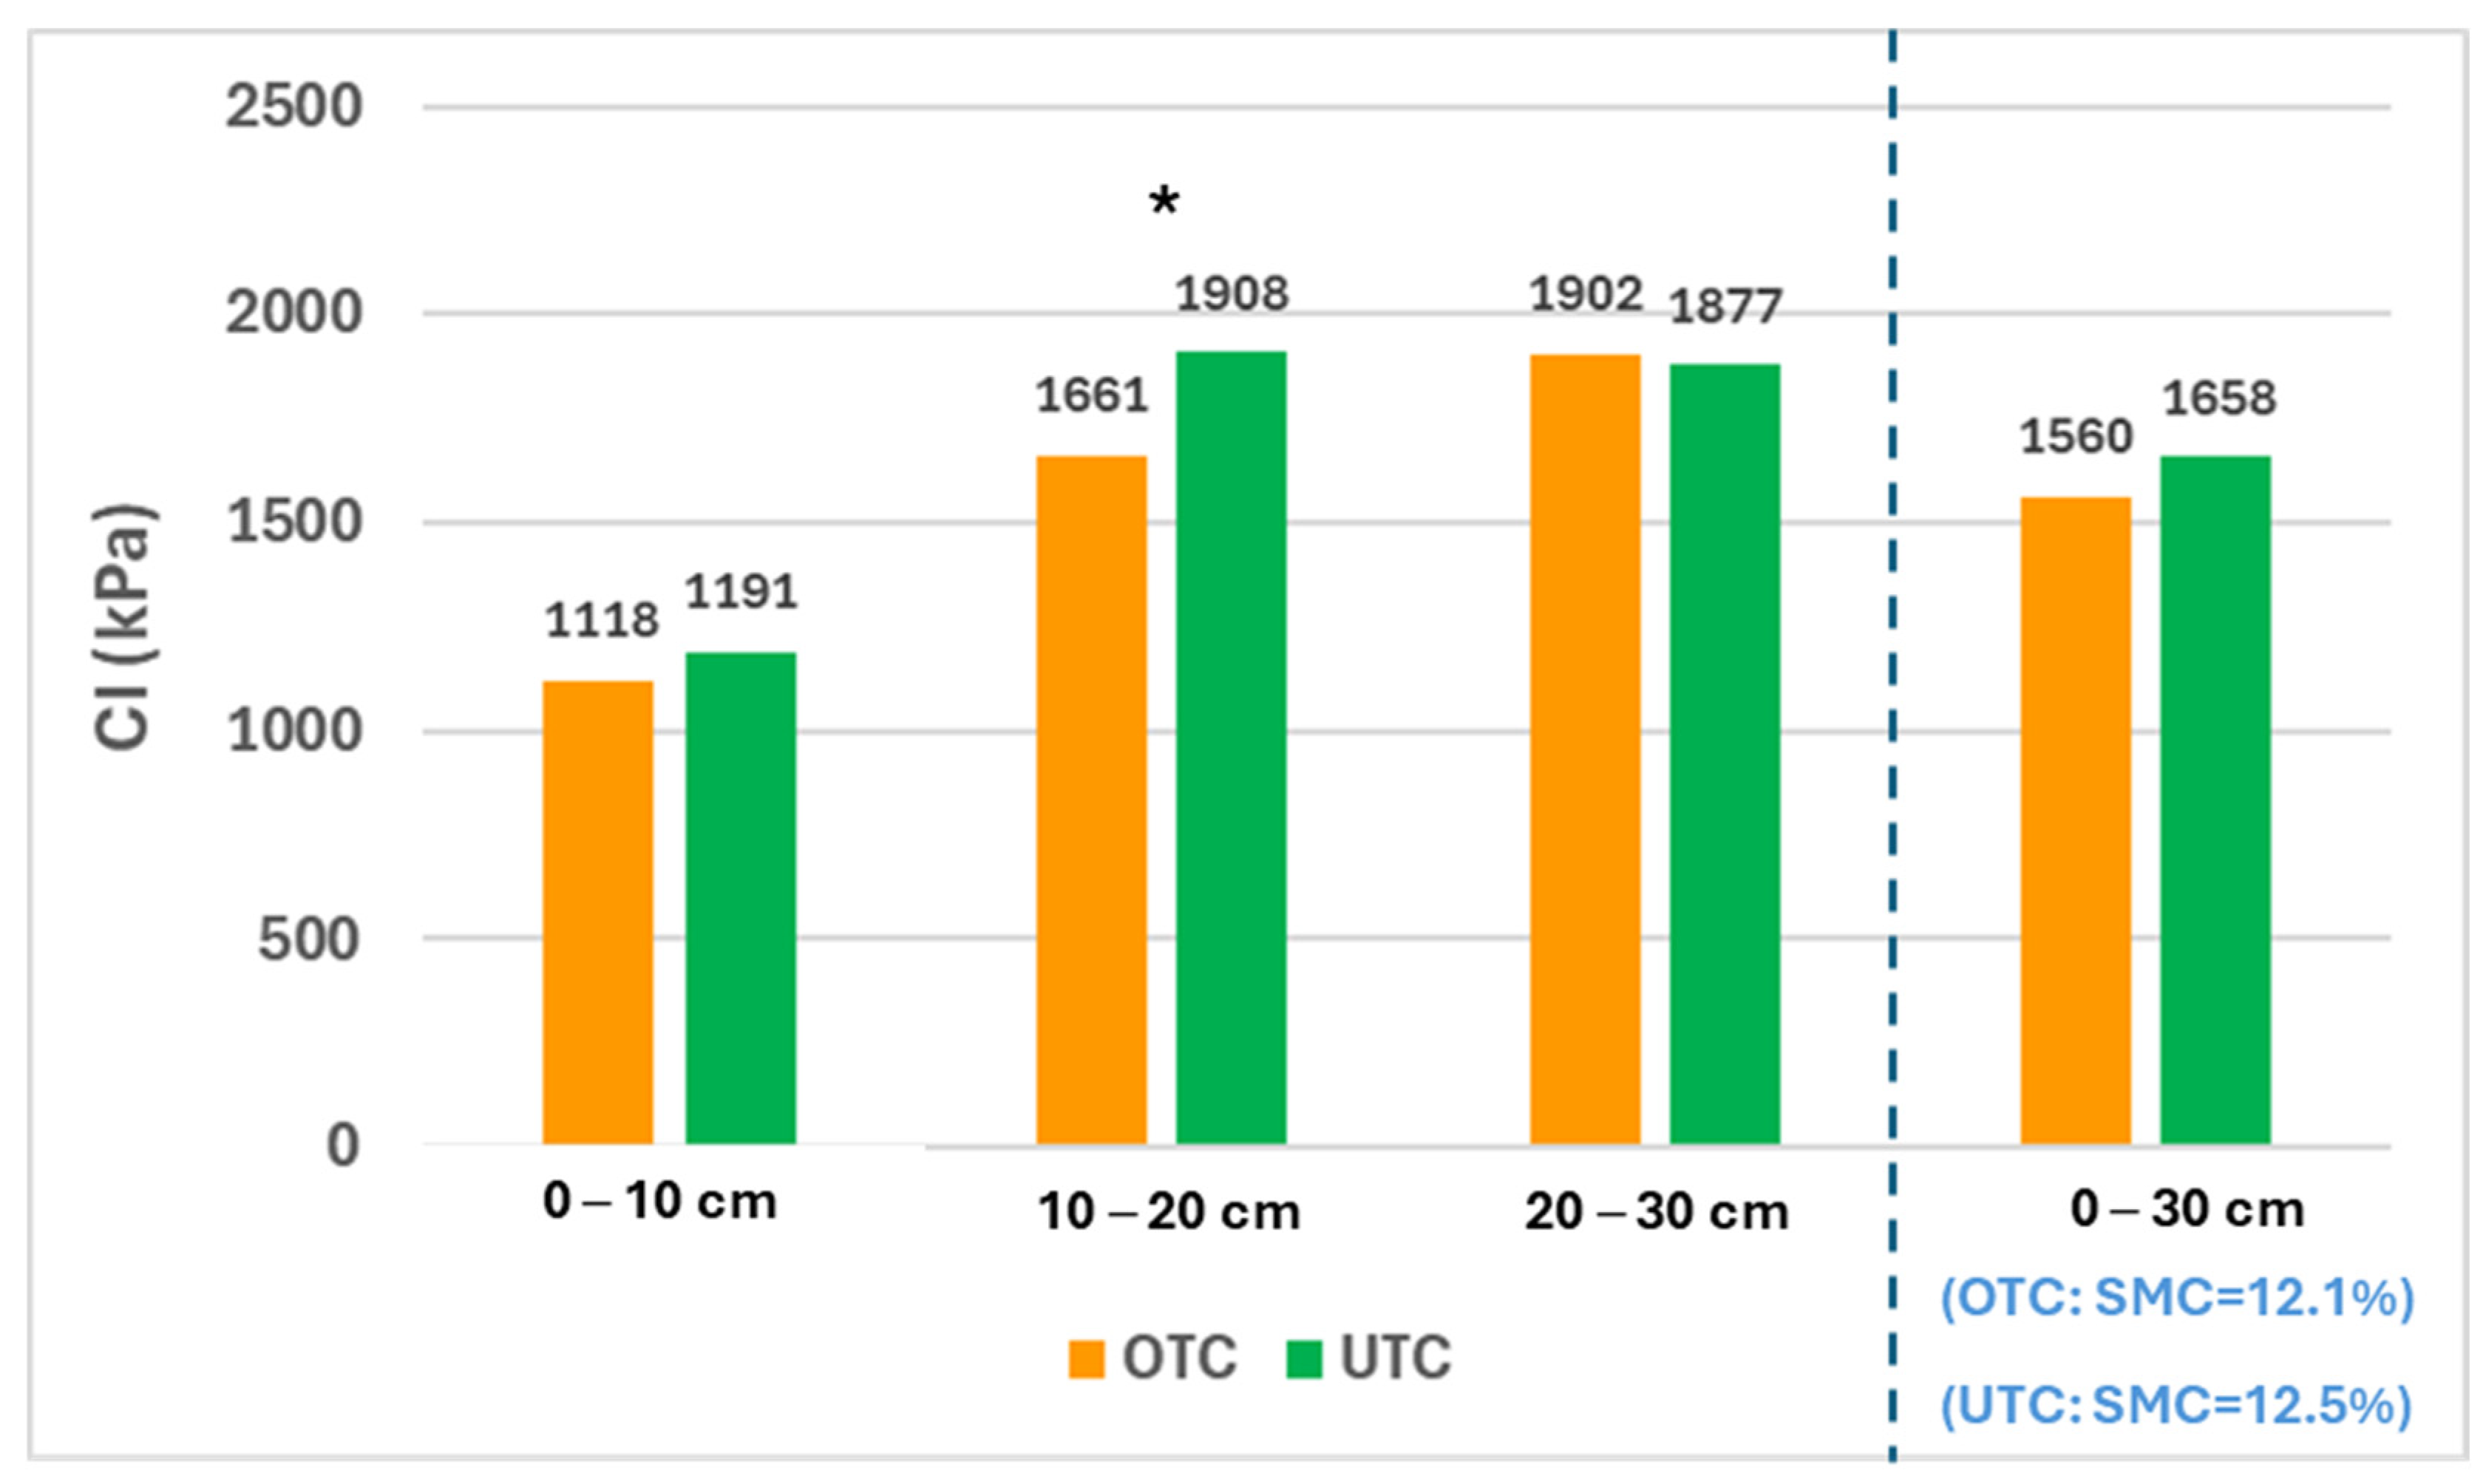
The separate mixed model applied to evaluate trees’ effect on soil compaction showed no significant differences from 0 to 30 cm depth (Figure 15a). Although comparisons do not show significant differences, there is a general trend towards higher UTC values. The tree canopy’s effect on SMC was also not significant on any of the eight sampling dates (Figure 15b). However, differentiating by depth (Figure 16), there are significant differences in compaction between 10 and 20 cm depth (F = 8.413; p = 0.004), with grater compaction UTC.

4. Discussion

The hypothesis raised in this study is based on the widespread reference to increased soil compaction, with negative consequences for soil functionality, when considering the use of higher animal stocking rates per unit of grazing area (biotic load) [8,9,17]. The impact of livestock trampling varies with several factors, including animal parameters (species, stocking density or grazing duration), or soil characteristics (moisture, clay contents, among others) [9]. Grazing impacts also differ depending on herbivore species. In comparison with sheep, cattle exert greater pressure on moist soils due to their higher body weight and larger hoof size, producing deeper hoof marks and leading to more substantial damage [8]. Heavy grazing does not affect coarser soils but may reduce soil functionality in the case of fine-textured soils, particularly when wet [11]. Accurately regulating the stocking density across a farm’s grazing land also entails controlling livestock movement and managing their access to particular paddocks or grazing sections at specific times [5]. A study by Serrano et al. [18] on monitoring cattle grazing with GNSS collars on a nearby plot of sandy loam soil showed a significant increase in CI in areas of higher grazing density. However, another study conducted at the same time with sheep grazing under similar conditions did not record significant differences in CI between CG with LSR and DG with HSR [19]. This variation between studies is probably attributable to site-specific factors linked to differences in environmental conditions or in grazing management practices [8].
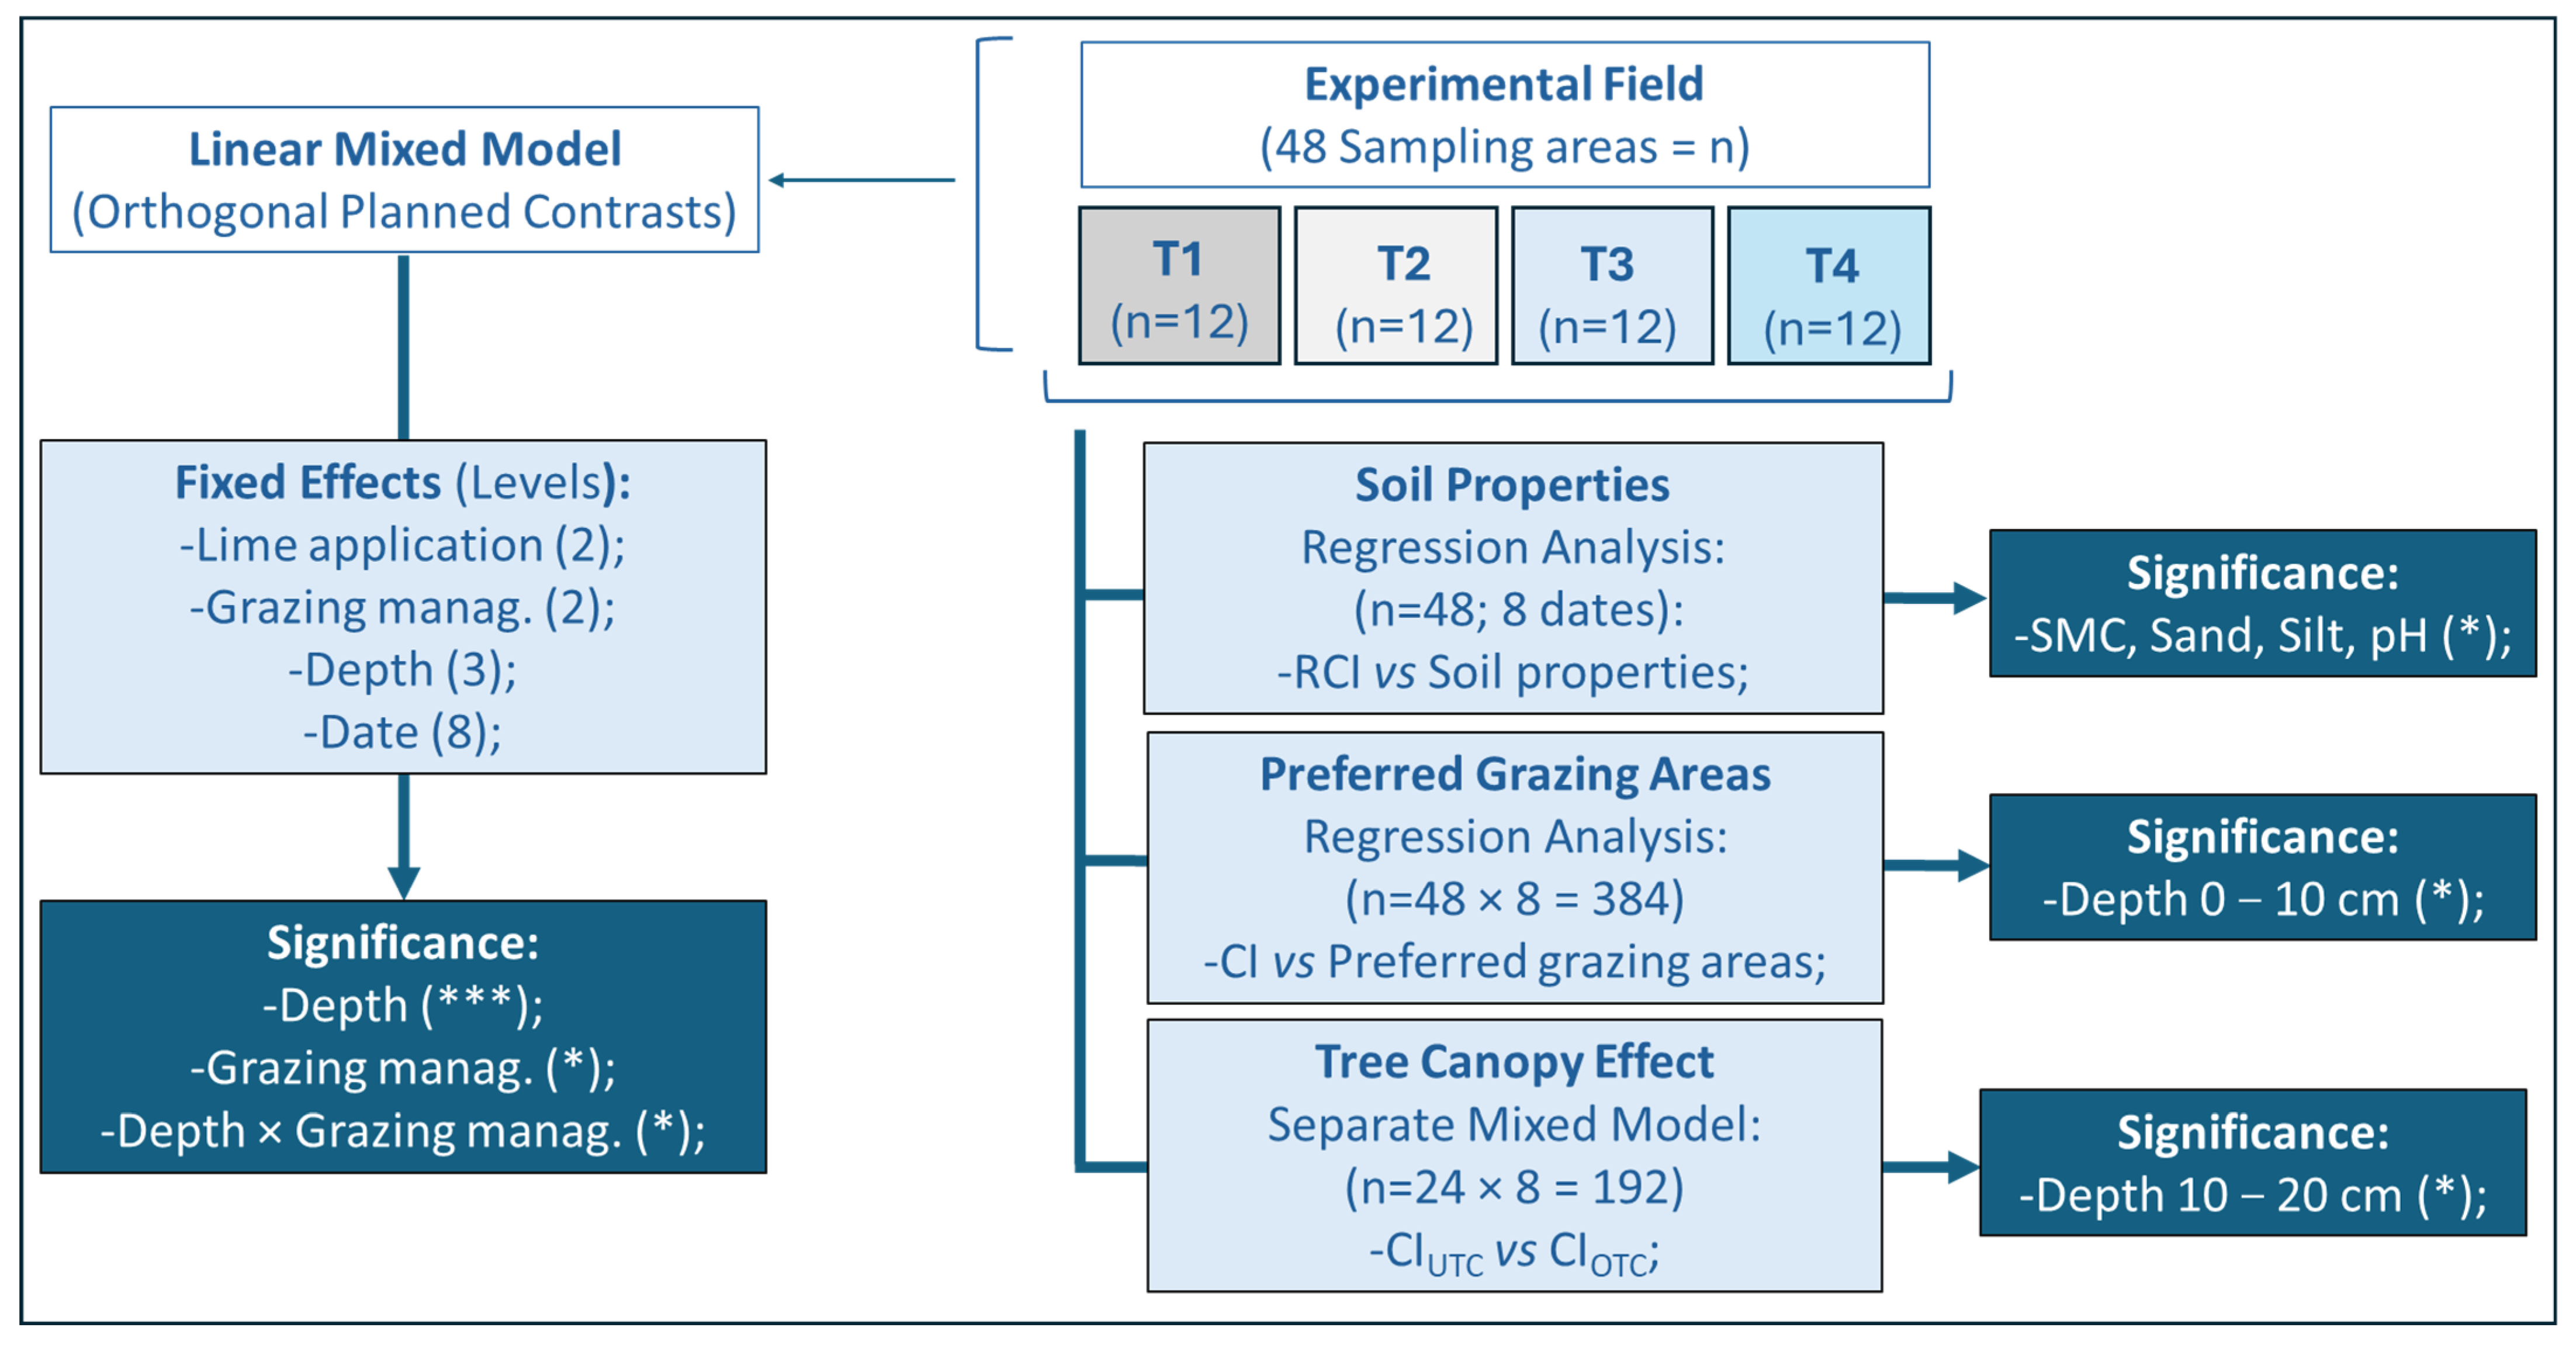
Figure 17 summarizes, schematically, the significant results obtained in the various statistical analyses carried out in this study.

4.1. Soil’s Spatial Variability: Correlation with Soil Cone Index

Soils are inherently spatially heterogeneous, and many of their properties vary across both space and time, exerting a strong influence on agricultural and environmental processes, including plant–water–soil interactions [20]. This is the starting point for implementing PA approaches.
In this study, the spatial variability in soil properties, especially clay (CV = 24%), OM (CV = 27%), CEa (CV = 38%), and CEC (CV = 67%), reflects the origin of this soil (Cambisol derived from granite), the influence of the undulating terrain [21], the presence of trees [22,23] and several decades of sheep grazing [24]. The concave areas of these undulating terrains tend to accumulate greater moisture content [21], which influences parameters such as ECa [20] and CI [25].
Several published studies have referred to this spatial variability in soil parameters especially associated with the silvopastoral systems [22,23,26], where grazing is one of the main determinants [24]. Understanding the impacts of grazing on ecosystem functioning, especially in soil and pasture, may help improve the prediction of future grassland dynamics [27] and support management decisions.
The main cause of degradation in pasture soils is compaction, frequently driven by livestock trampling and the reduction in forage vegetation [28]. The rate of soil degradation by livestock trampling (compaction severity) is controlled by physical, chemical and biological soil properties [28,29], namely soil texture, plant litter accumulation (organic matter content), soil moisture content, stocking density (animals per unit area), grazing duration [30], animal weight and stocking management [31]. The vulnerability of a soil to compaction under a given moisture condition and applied energy level also depends on its clay content [32]. According to Mayerfeld et al. [25], silt loams can be more susceptible to compaction than clayey soils and are usually more susceptible to compaction than coarse-textured soils. The process of soil compaction is highly affected by the soil’s water content [32]. Under wet conditions, in clayey soils, soil compaction is very important [33], since SMC and soil’s clay content alter soil compressibility and plasticity [9]: compaction can be highly increased by grazing when soils are wet and, additionally, heavy clay soils are more prone to degradation (greater susceptibility to compaction) than sandy soils [30].
The weak correlation coefficients between RCI and soil parameters such as texture, organic matter, pH or CEC registered in this study indicate that, in this field, other factors are potentially responsible for variations in soil compaction.
The negative and significant correlation between SMC and CI (Figure 7) reinforces the direct link between low moisture levels and increased soil compaction [34]. This inverse pattern is widely supported in the literature [9,19,28] and can be attributed to the increased role of adhesive forces between the soil and the penetrometer; at lower soil moisture content (SMC), these forces become even more influential [28]. The findings also confirm that SMC and penetration resistance (CI) are reliable indicators for estimating soil’s load-bearing capacity, providing useful information for decision-making on the adoption of new management practices in pasture soils [28]. Although significant, this relationship between CI and SMC has a low correlation coefficient (r = −0.381; p < 0.05; Figure 7). The maps of spatial variability in CI and SMC (depth 0–30 cm) show very different patterns in the experimental field over the eight sampling dates (Figure 8, Figure 9, Figure 10 and Figure 11), with the highest CV, on each date, in the CI measurements (40–56%). Measurements of CI are highly influenced by intrinsic (for instance, soil moisture, texture and structure) and extrinsic (for instance, management system) soil factors and, consequently, coefficients of variation are usually high [35]. This dynamic variation, both spatial and temporal, in CI and SMC confirms the complexity of factors that determine soil compaction.

4.2. Lime Application and Grazing Management

Table 3 and Table 4 show the results of inferential and descriptive application of the complete LMM, where the following can be highlighted: (i) a significant main effect of grazing, with higher CI in the CG-LSR plots; (ii) a highly significant effect of depth, with CI increasing as depth increases; (iii) a significant interaction “grazing × depth”. The main effect of lime application and the interaction “lime application × grazing” were not significant.
Although the average values of CI recorded in this study do not exceed 2000 kPa, a threshold commonly recognized as limiting for root growth [34], the wide range of the observed values (155 to 5934 kPa; CV of 40–56%; Table 4) confirms the high spatial and temporal variability in the intrinsic and extrinsic soil and management factors [35]. These high CI values, under certain circumstances (depth, soil moisture content, soil texture, etc.), can hinder root penetration and have a negative effect on pasture development, particularly if they occur during critical periods, such as winter, when the cold promotes greater root development than vegetative growth.
The importance of liming for crop production is generally acknowledged. However, grassland liming is often overlooked, particularly in situations where overall profitability is low [3]. It is important to emphasize that soil acidification is a natural process that decreases grass productivity by lowering soil base saturation and nutrient availability, while increasing the solubility of metals such as aluminum (Al), iron (Fe) and manganese (Mn), which can be toxic to grasses [3]. Liming grassland delivers several advantages, such as significant increases in grass biomass production, the nodulation of legumes and nitrogen (N) symbiotic fixation [3] and greater soil coverage [36]. The combined effects of soil’s degrading physical properties and reducing vegetation cover increase the potential impact on soil compaction of livestock grazing [9]. Moreover, the animal-carrying capacity for specific pasture areas is increased by the positive impact on productivity and vegetative cover [28]. The permanent presence of a layer of vegetation between the animals’ hooves and the ground cushions the impact of grazing, reducing the potential compaction [37].
Significant differences were also identified between the CG-LSR and DG-HSR plots, with higher CI in the CG-LSR plots (Table 4), which is in line with the results obtained by He et al. [27], having concluded that CG and trampling from livestock tends to increase soil compaction when compared to rotational/deferred grazing. According to Lai and Kumar [17], the alternation between periods of grazing and rest has been shown to be more effective at mitigating soil compaction than simply adjusting animal stocking rates. Natural processes that contribute to the recovery of compacted soils include precipitation; wetting and drying cycles, and related soil cracking; freeze–thaw cycles; and bioturbation, such as root growth and decomposition and earthworm burrowing [32]. In this case, possible reasons for increased natural recovery in physical conditions during the short period without grazing include root growth and cracking and the activity of soil fauna [38].
Although some studies on silvopastoral systems focus solely on the impact of grazing on soil structure near the surface [31,37,39], the differences in CI at depths greater than 15 cm observed in other studies suggest that investigations of soil compaction due to animal trampling should extend to at least 30 cm depth, especially in soils considered to be susceptible to compaction [25]. In this study, significant differences were identified between the three depths considered (0–10 cm, 10–20 cm and 20–30 cm), with CI increasing with depth (CI20–30 > CI10–20 > CI0–10; Table 3). This is a common pattern based on soil structure, given that the deeper soil layers support the more superficial layers [29]. Several studies refer to this increase in soil compaction with depth [18,19,40,41]. According to Sharrow et al. [37], usually deeper soil layers are slower to recover from compaction and this difference may have practical implications.
These global results show that intensification resulting from higher animal densities, accompanied by improvements in soil fertility (correction of acidity with the application of dolomitic limestone), had no negative impact on soil compaction.

4.3. Grazing Preferences’ Effect on Soil Cone Index

The long-term effects of livestock grazing on soil’s physical properties are complex, reflecting the balance between compaction and recovery processes in both grazed and ungrazed areas [37]. Given this complexity of interactions in silvopastoral systems, the net effects of grazing on soil compactness remain unclear and difficult to predict [42]. While cattle grazing is strongly associated with soil compaction [8,17,19,38], there is no consensus on the impact of sheep grazing on soil compaction. Sheep generally exert a lower impact on soil compaction than cattle due to their smaller body weight relative to their hoof contact area, which results in reduced ground pressure [17,31,38]. In contrast, cattle, owing to their greater mass and larger hooves, tend to produce deeper imprints in moist soils and can also cause more significant damage to vegetation [8]. As mentioned previously, a study by Serrano et al. [18] monitoring cattle grazing with GNSS collars showed a significant increase in CI in areas of higher grazing density, in contrast to what was observed with sheep [19].
In this study, after confirmation that the treatments DG/HSR did not cause greater soil compaction, the secondary analysis based on the observation of sheep grazing patterns in the experimental field (areas of greater and lesser preference throughout the pasture’s vegetative cycle, Figure 1) showed no correlation with soil compaction at 10–20 cm and 20–30 cm depths (Table 5). However, a very low but positive and significant correlation (r = 0.172; p < 0.05) was found between soil compaction and the animals’ preferred grazing areas in the topsoil (0–10 cm). Several studies have shown that the impact of grazing occurs primarily in the surface layers. For example, Drewry et al. [38] report that the greatest impact of grazing animals on soil structure occurs within the upper 5 cm of the soil profile. Similarly, Sharrow et al. [37] found that most hoof-induced compaction is restricted to the near-surface soil layer (top 5–10 cm), whereas Roesch et al. [31] showed that trampling effects may extend through the topsoil to depths of approximately 20 cm.
The natural recovery of compacted soils is a gradual process that depends on factors such as soil type, compaction intensity and climatic conditions [32]. It is driven by processes including precipitation, wetting–drying cycles, soil cracking, freeze–thaw action, and biological activity [32,37]. However, both physical and biological mechanisms become less effective with increasing soil depth, reducing the potential for recovery in deeper soil layers [37]. According to Nawaz et al. [32] rapid natural amelioration of physically deteriorated topsoil to about 5 cm is possible but the natural rejuvenation process is very slow below 15 cm, which can take several years.

4.4. Tree Effect on Soil Cone Index

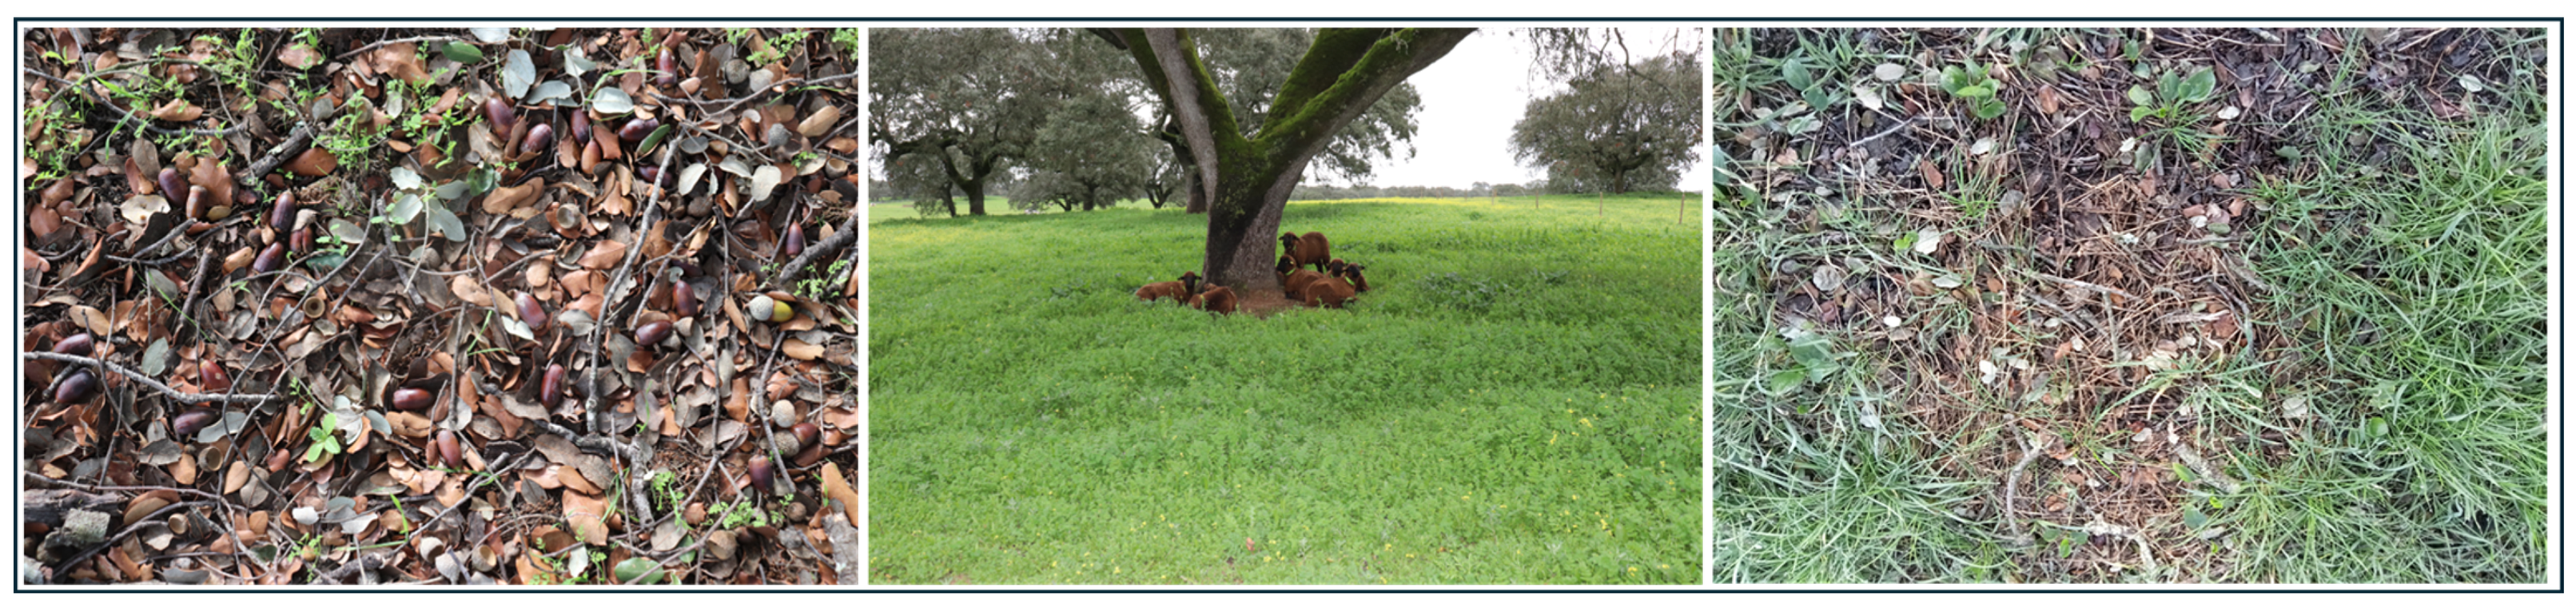
According to Sharrow et al. [37], the relative contribution of livestock trampling and tree roots to soil compaction in silvopastoral systems is not clear because it can be difficult to separate these effects on soil’s physical properties. Nevertheless, the effect of tree roots on soil compaction is expected at greater depths [23]. On the other hand, the presence of a persistent organic layer (resulting from animal litter, tree branches and leaves, etc.; Figure 18) at UTC areas can insulate the soil surface, change its dynamics and reduce direct hoof impact. Moreover, it could strongly promote pore formation through the activity of soil organisms feeding at the surface [42].
The separate mixed model applied to evaluate the tree canopy effect on CI (0–30 cm depth; Figure 15 and Figure 16) does not show significant differences between UTC and OTC. However, when differentiating by depth, there are significant differences in compaction to 10–20 cm depth (F = 8.413; p = 0.004), with greater compaction UTC (Figure 16). This trend (higher CI values in UTC areas) is common to almost all dates (Figure 15).
The presence of tree roots and the tendency of animals to remain in UTC areas, where they seek shelter during periods of heavy autumn–winter rainfall, may help explain the higher levels of compaction observed in these zones [23]. Likewise, Sharrow et al. [37] reported increased soil penetration resistance in areas close to trees within sheep-grazed silvopastoral systems, suggesting that soil compaction tends to be concentrated in these locations. Regarding topsoil compaction (0–20 cm depth, where grass roots typically develop [24]), very similar patterns of soil penetration resistance were observed in both UTC and OTC areas, indicating the previously mentioned favorable compensation (isolation) of the surface layer by debris (animal waste and tree leaves) which usually forms in these UTC areas.

4.5. Future Research Directions

Future research will certainly be linked to the concept of precision agriculture (PA) or precision livestock farming (PLF) and sustainability. PA within the topic of livestock technology entails the strategic use of information technology, satellite positioning data, and sensors [43] with the aim of increasing the efficiency of production factors, the productivity, and ensuring the sustainability of this activity [36].
Recently, there has been a growing number of studies and technological solutions in animal monitoring, including the use of GNSS collars [18,44,45]. These devices enable the collection of data for multiple purposes, including identifying feeding patterns, tracking areas of pasture, categorizing the plants consumed, estimating the amount of nutrients consumed [45] or preferred grazing areas and, potentially, areas most vulnerable to soil compaction [18].
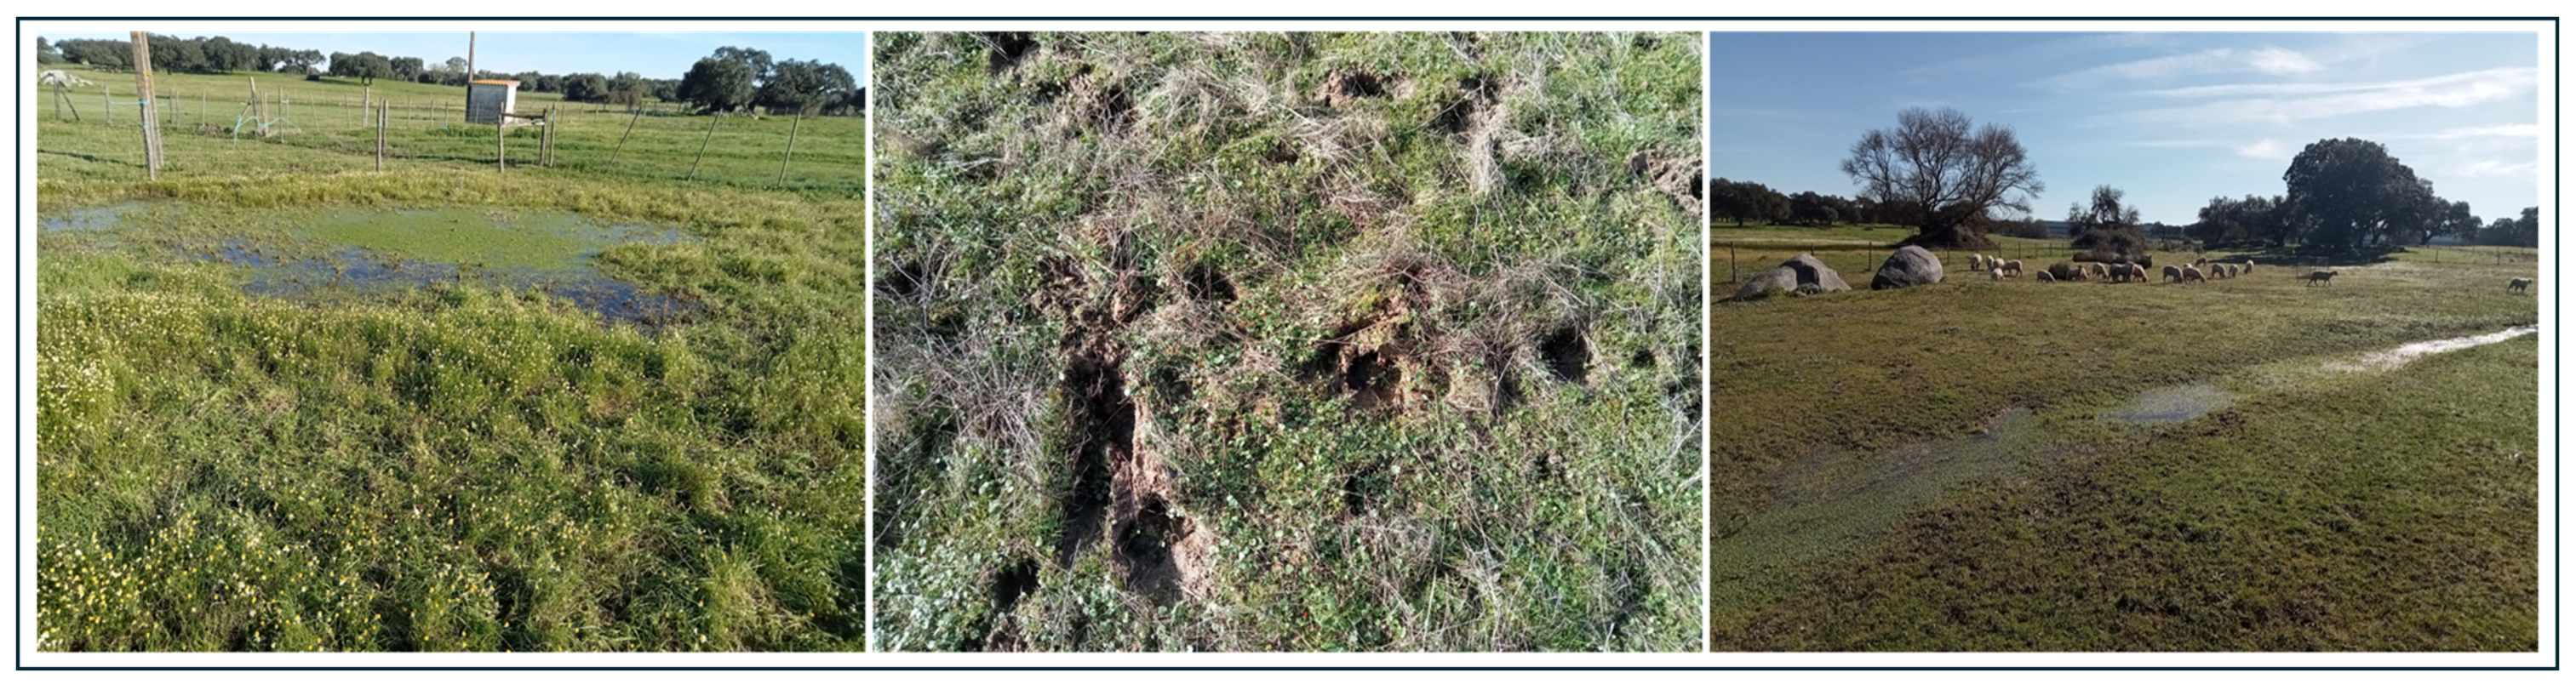
In the specific case of soil compaction caused by animal trampling, dynamic management based on technological incorporation that involves the use of virtual fencing (VF) is inevitable. VF is a digital tool (using GNSS, sensors, and communication devices) that allows farmers to create dynamic boundaries for controlling animal allocation without setting any physical fence posts and wires, optimizing grazing patterns, preventing over- or undergrazing, and ensuring grasslands’ potential in a sustainable way [5]. Precise spatiotemporal management of animal movement and grazing behavior enables us to direct livestock at specific times to the most productive paddocks and keep them away from areas [5] that are vulnerable to surface erosion or compaction [9], especially during periods of higher precipitation (Figure 19).
The soil structure of the experimental field in this study is representative of that normally used in extensive grazing (shallow, stony, sandy, or sandy loam, etc.). Nevertheless, it would be important to extend this study to other fields to assess the impact of deferred grazing and relatively high biotic loads, compared to traditional practices based on CG and LSR.
Another aspect that should be evaluated in future studies is the impact of mixed grazing of different species (e.g., cattle and sheep), simultaneously or in succession, on soil compaction and also on pasture quality and productivity. Niu et al. [8] reported that ecosystem functions decline as grazing intensity and duration increase, with the reduction being more pronounced under mixed grazing (sheep and cattle together) than when either herbivore grazes alone.
It will also be important to evaluate the impact of grazing and, consequently, animal trampling, on the soil’s functional capacity, namely the soil’s biological activity. Soil aggregate stability and porosity is reduced by livestock trampling, suppressing the soil’s microbial activity and plant regrowth rates [8]. According to Nwaogua et al. [46], future studies comparing CG and DG should carefully assess changes in soil microbial communities, as these serve as indicators of the long-term sustainability of grassland ecosystems [8].

5. Conclusions

The research work carried out in the present study allows the following conclusions to be drawn:
(a)
The effects of sheep grazing on soil compaction are more linked to the intrinsic properties of the soil than to grazing pressure itself and are good indicators of the desired and sustainable intensification of extensive livestock grazing systems in the Montado Mediterranean ecosystem.
(b)
Soil compaction serves as a reliable indicator for estimating soil load-bearing capacity, thereby supporting informed decision-making regarding the implementation of new management practices in pasture soils.
(c)
Improvements in soil fertility, achieved through the correction of acidity by applying dolomitic limestone, has no adverse effect on soil compaction.
(d)
Preferential grazing areas tend to experience slightly higher soil compaction, particularly in the shallow soil layers (up to 10 cm depth); however, soils in these zones recover rapidly.
(e)
There are no differences in soil compaction in areas beneath tree canopies compared to open areas for the depth range of 0–30 cm.
It is important that future research advances the evaluation of grazing pressure and the definition of sustainable grazing and rest periods to preserve soil health and functionality, with special attention to the soil microbiome. The current progress in the emerging PA technologies can make an important contribution for setting up a data-driven decision support, with potential to promote sustainable grazing management by providing sophisticated knowledge, confidence and control of grazing.

Author Contributions

Conceptualization, J.S. and A.P.; methodology, J.S., S.S., E.C., F.J.M., L.L.P., R.C. and A.P.; software, J.S.; validation, J.S. and S.S.; formal analysis, J.S., F.J.M. and L.L.P.; investigation, J.S. and E.C.; data curation, J.S.; writing—original draft preparation, J.S.; writing—review and editing, J.S., S.S. and F.J.M.; visualization, J.S., S.S. and F.J.M.; supervision, J.S.; project administration, J.S., R.C. and A.P.; funding acquisition, J.S. and R.C. All authors have read and agreed to the published version of the manuscript.

Funding

This work was funded by the project “SUMO—Montado Sustainability” (Ref.PRR-C05 i03-I000066), investment supported by the PRR—Recovery and Resilience Plan and European Funds Next Generation EU and by National Funds through FCT (Foundation for Science and Technology) under the Project UIDB/05183/2025.

Institutional Review Board Statement

The animal study protocol was approved, by the body responsible for animal welfare (ORBEA) at the University of Évora, on 11 July 2019 (Project identification code: “Eco-SPAA-GD/24922/2019/P1”).

Informed Consent Statement

Not applicable.

Data Availability Statement

The original contributions presented in this study are included in the article. Further inquiries can be directed to the corresponding author.

Acknowledgments

This work was supported by MED—Mediterranean Institute for Agriculture, Environment and Development through the projects UIDB/05183/2020 and UIDP/05183/2020 (https://doi.org/10.54499/UIDB/05183/2020; https://doi.org/10.54499/UIDP/05183/2020, accessed on 12 October 2020), and by CHANGE—Global Change and Sustainability Institute through the project LA/P/0121/2020 (https://doi.org/10.54499/LA/P/0121/2020, accessed on 12 October 2020).

Conflicts of Interest

The authors declare no conflicts of interest.

Abbreviations

The following abbreviations are used in this manuscript:
AlAluminum
CECCationic Exchange Capacity
CGContinuous Grazing
CICone Index
CO2Carbon dioxide
DGDeferred Grazing
ECaSoil’s Apparent Electrical Conductivity
FeIron
GNSSGlobal Navigation Satellite System
hAverage height of the pasture
HSRHigh Stocking Rate
IUSSInternational Union of Soil Sciences
LPFLivestock Precision Farming
LSRLow Stocking Rate
NNitrogen
NW Northwest
OMCOrganic Matter Content
OTCOutside Tree Canopy
PAPrecision Agriculture
RCIRelative Cone Index
SDStandard Deviation
SE Southeast
SMCSoil Moisture Content
T1Treatment 1
T2Treatment 2
T3Treatment 3
T4Treatment 4
USDAUnited States Department of Agriculture
UTCUnder Tree Canopy
VFVirtual Fences

References

  1. Eldridge, D.J.; Poor, A.G.B.; RuIz-Colmenero, M.; Letnic, M.; SolIveres, S. Ecosystem structure, function, and composition in rangelands are negatively affected by livestock grazing. Ecol. Appl. 2016, 26, 1273–1283. [Google Scholar] [CrossRef] [Scilit]
  2. Psyllos, G.; Hadjigeorgiou, I.; Dimitrakopoulos, P.G.; Kizos, T. Grazing land productivity, floral diversity, and management in a semi-arid Mediterranean landscape. Sustainability 2022, 14, 4623. [Google Scholar] [CrossRef] [Scilit]
  3. Abdalla, M.; Espenberg, M.; Zavattaro, L.; Lellei-Kovacs, E.; Mander, U.; Smith, K.; Thorman, R.; Damatirca, C.; Schils, R.; ten-Berge, H.; et al. Does liming grasslands increase biomass productivity without causing detrimental impacts on net greenhouse gas emissions? Environ. Pollut. 2022, 300, 118999. [Google Scholar] [CrossRef] [Scilit] [PubMed]
  4. Bernabucci, G.; Evangelista, C.; Girotti, P.; Viola, P.; Spina, R.; Ronchi, B.; Bernabucci, U.; Basiricò, L.; Turini, L.; Mantino, A.; et al. Precision livestock farming: An overview on the application in extensive systems. Ital. J. Anim. Sci. 2025, 24, 859–884. [Google Scholar] [CrossRef] [Scilit]
  5. Horn, J.; Isselstein, J. How do we feed grazing livestock in the future? A case for knowledge-driven grazing systems. Grass Forage Sci. 2022, 77, 153–166. [Google Scholar] [CrossRef] [Scilit]
  6. Ntsomboh-Ntsefong, G.; Mbi, K.T.; Seyum, E.G. Advancements in soil science for sustainable agriculture: Conventional and emerging knowledge and innovations. Acad. Biol. 2024, 2, 1–18. [Google Scholar] [CrossRef] [Scilit]
  7. Santos, F.C.; Junior, N.K.; Almeida, R.G.; Filho, M.R.A.; Vilela, L.; Castro, R.V.O.; Rocha, A.L.P.F.; Silveira, M.C.T. Intensification of pasture-based livestock systems: Environmental benefits, forage availability, nutritional value and Nellore cattle performance. Agrofor. Syst. 2025, 99, 80. [Google Scholar] [CrossRef] [Scilit]
  8. Niu, W.; Ding, J.; Fu, B.; Zhao, W.; Eldridge, D. Global effects of livestock grazing on ecosystem functions vary with grazing management and environment. Agric. Ecosyst. Environ. 2025, 378, 109296. [Google Scholar] [CrossRef] [Scilit]
  9. Donovan, M.; Monaghan, R. Impacts of grazing on ground cover, soil physical properties and soil loss via surface erosion: A novel geospatial modelling approach. J. Environ. Manag. 2021, 287, 112206. [Google Scholar] [CrossRef] [Scilit]
  10. Carrera, A. Uncovering soil compaction: Performance of electrical and electromagnetic geophysical methods. Soil 2024, 10, 843–857. [Google Scholar] [CrossRef] [Scilit]
  11. Dorner, J.; Dec, D.; Feest, E.; Vasquez, N.; Diaz, M. Dynamics of soil structure and pore functions of a volcanic ash soil under tillage. Soil Tillage Res. 2012, 125, 52–60. [Google Scholar] [CrossRef] [Scilit]
  12. Shi, Y.; Gao, J.; Brierley, G.; Li, X.; He, J.-S. Estimating grazing pressure from satellite time series without reliance on total production. Remote Sens. 2025, 17, 3781. [Google Scholar] [CrossRef] [Scilit]
  13. Schellberg, J.; Verbruggen, E. Frontiers and perspectives on research strategies in grassland technology. Crop Pasture Sci. 2014, 65, 508–523. [Google Scholar] [CrossRef] [Scilit]
  14. IUSS Working Group WRB. World Reference Base for Soil Resources. International Soil Classification System for Naming Soils and Creating Legends for Soil Maps, 4th ed.; International Union of Soil Sciences (IUSS): Vienna, Austria, 2022; 234p. [Google Scholar]
  15. AOAC. Official Methods of Analysis of AOAC International, 18th ed.; AOAC International: Arlington, VA, USA, 2005. [Google Scholar]
  16. Carreira, E.; Serrano, J.; Shahidian, S.; Infante, P.; Paniagua, L.L.; Moral, F.; Paixão, L.; Gomes, C.P.; deCastro, J.L.; de Carvalho, M.; et al. Sustainable intensification of the Montado ecosystem: Evaluation of sheep stocking methods and dolomitic limestone application. Sustainability 2025, 17, 363. [Google Scholar] [CrossRef] [Scilit]
  17. Lai, L.; Kumar, S. A global meta-analysis of livestock grazing impacts on soil properties. PLoS ONE 2020, 15, e0236638. [Google Scholar] [CrossRef] [Scilit] [PubMed]
  18. Serrano, J.; Marques, J.; Shahidian, S.; Carreira, E.; Marques da Silva, J.; Paixão, L.; Paniagua, L.L.; Moral, F.; Ferraz de Oliveira, I.; Sales-Baptista, E. Sensing and mapping the effects of cow trampling on the soil compaction of the Montado Mediterranean ecosystem. Sensors 2023, 23, 888. [Google Scholar] [CrossRef] [Scilit] [PubMed]
  19. Serrano, J.; Carreira, E.; Shahidian, S.; de Carvalho, M.; Marques da Silva, J.; Paniagua, L.L.; Moral, F.; Pereira, A. Impact of deferred versus continuous sheep grazing on soil compaction in the Mediterranean Montado ecosystem. AgriEngineering 2023, 5, 761–776. [Google Scholar] [CrossRef] [Scilit]
  20. Corwin, D.L.; Scudiero, E. Field-scale apparent soil electrical conductivity. Soil Sci. Soc. Am. J. 2020, 84, 1405–1441. [Google Scholar] [CrossRef]
  21. Marques da Silva, J.R.; Peça, J.O.; Serrano, J.M.; Carvalho, M.J.; Palma, P.M. Evaluation of spatial and temporal variability of pasture based on topography and the quality of the rainy season. Precis. Agric. 2008, 9, 209–229. [Google Scholar] [CrossRef] [Scilit]
  22. Benavides, R.; Douglas, G.B.; Osoro, K. Silvopastoralism in New Zealand: Review of effects of evergreen and deciduous trees on pasture dynamics. Agrofor. Syst. 2009, 76, 327–350. [Google Scholar] [CrossRef] [Scilit]
  23. Serrano, J.; Shahidian, S.; da Silva, J.M.; Paixão, L.; Carreira, E.; Pereira, A.; Carvalho, M. Climate changes challenges to the management of Mediterranean Montado ecosystem: Perspectives for use of precision agriculture technologies. Agronomy 2020, 10, 218. [Google Scholar] [CrossRef] [Scilit]
  24. Efe Serrano, J. Pastures in Alentejo: Technical Basis for Characterization, Grazing and Improvement; Universidade de Évora—ICAM: Évora, Portugal, 2006; pp. 165–178. (In Portuguese) [Google Scholar]
  25. Mayerfeld, D.; Kruger, E.; Gildersleeve, R.; Rickenbach, M. Impacts of different grazing approaches on woodland ecosystem properties. Agrofor. Syst. 2022, 96, 527–540. [Google Scholar] [CrossRef] [Scilit]
  26. Schellberg, J.; Hill, M.J.; Roland, G.; Rothmund, M.; Braun, M. Precision agriculture on grassland: Applications, perspectives and constraints. Eur. J. Agron. 2008, 29, 59–71. [Google Scholar] [CrossRef] [Scilit]
  27. He, M.; Pan, Y.; Zhou, G.; Barry, K.E.; Fu, Y.; Zhou, X. Grazing and global change factors differentially affect biodiversity-ecosystem functioning relationships in grassland ecosystems. Glob. Change Biol. 2022, 28, 5492–5504. [Google Scholar] [CrossRef] [Scilit]
  28. Benevenute, P.A.N.; Morais, E.G.; Souza, A.A.; Vasques, I.C.F.; Cardoso, D.P.; Sales, F.R.; Severiano, E.C.; Homem, B.G.C.; Casagrande, D.R.; Silva, B.M. Penetration resistance: An effective indicator for monitoring soil compaction in pastures. Ecol. Indic. 2020, 117, 106647. [Google Scholar] [CrossRef] [Scilit]
  29. Pentos, K.; Pieczarka, K.; Serwata, K. The relationship between soil electrical parameters and compaction of sandy clay loam soil. Agriculture 2021, 11, 114. [Google Scholar] [CrossRef] [Scilit]
  30. Reichert, J.M.; Suzuki, L.E.; Reinert, D.J. Compactação do solo em sistemas agropecuários e florestais: Identificação, efeitos, limites críticos e mitigação. Tópicos Ciência Solo 2007, 5, 49–134. (In Portuguese) [Google Scholar]
  31. Roesch, A.; Weisskopf, P.; Oberholzer, H.; Valsangiacomo, A.; Nemecek, T. An approach for describing the effects of grazing on soil quality in life-cycle assessment. Sustainability 2019, 11, 4870. [Google Scholar] [CrossRef] [Scilit]
  32. Nawaz, M.F.; Bourrié, G.; Trolard, F. Soil compaction impact and modelling. A review. Agron. Sustain. Dev. 2013, 33, 291–309. [Google Scholar] [CrossRef] [Scilit]
  33. van Klink, R.; Schrama, M.; Nolte, S.; Bakker, J.P.; WalliesDeVries, M.F.; Berg, M.P. Defoliation and soil compaction jointly drive large-herbivore grazing effects on plants and soil arthropods on clay soil. Ecosystems 2015, 18, 671–685. [Google Scholar] [CrossRef] [Scilit]
  34. Donkor, N.T.; Gedir, J.V.; Hudson, R.J.; Bork, E.W.; Chanasyk, D.S.; Naeth, M.A. Impacts of grazing systems on soil compaction and pasture production in Alberta. Can. J. Soil Sci. 2002, 82, 1–8. [Google Scholar] [CrossRef] [Scilit]
  35. Pias, O.H.C.; Cherubin, M.R.; Basso, C.J.; Santi, A.L.; Molin, J.P.; Bayer, C. Soil penetration resistance mapping quality: Effect of the number of subsamples. Acta Sci. 2018, 40, e34989. [Google Scholar] [CrossRef] [Scilit]
  36. Serrano, J.; Matono, P.; Carreira, E.; Shahidian, S.; Moral, F.J.; Paniagua, L.L.; Charneca, R.; Pereira, A.; Belo, A. Pasture floristic composition as an indicator of soil pH correction and sheep stocking rate in Montado ecosystem. Environments 2025, 12, 385. [Google Scholar] [CrossRef] [Scilit]
  37. Sharrow, S. Soil compaction by grazing livestock in silvopastures as evidenced by changes in soil physical properties. Agrofor. Syst. 2007, 71, 215–223. [Google Scholar] [CrossRef] [Scilit]
  38. Drewry, J.J.; Cameron, K.C.; Buchan, G.D. Pasture yield and soil physical property responses to soil compaction from treading and grazing—A review. Soil Res. 2008, 46, 237–256. [Google Scholar] [CrossRef] [Scilit]
  39. Narantsetseg, A.; Kang, S.; Ko, D. Livestock grazing and trampling effects on plant functional composition at three wells in the desert steppe of Mongolia. J. Ecol. Environ. 2018, 42, 13. [Google Scholar] [CrossRef] [Scilit]
  40. Duarte, T.F.; Silva, T.J.A.; Bonfim-Silva, E.M.; Fenner, W. Resistance of a Red Latosol to penetration: Comparison of penetrometers, model adjustment, and soil water content correction. Eng. Agr. 2020, 40, 462–472. [Google Scholar] [CrossRef] [Scilit]
  41. Autovino, D.; Coppola, A.; De Mascellis, R.; Farzamian, M.; Basile, A. An in-situ methodology to separate the contribution of soil water content and salinity to EMI-based soil electrical conductivity. Soil 2026, 12, 37–54. [Google Scholar] [CrossRef] [Scilit]
  42. Greenwood, K.L.; McKenzie, B.M. Grazing effects on soil physical properties and consequences for pastures: A review. Aust. J. Exp. Agric. 2001, 41, 1231–1250. [Google Scholar] [CrossRef] [Scilit]
  43. Vlaicu, P.A.; Gras, M.A.; Untea, A.E.; Lefter, N.A.; Rotar, M.C. Advancing livestock technology: Intelligent systemization for enhanced productivity, welfare, and sustainability. AgriEngineering 2024, 6, 1479–1496. [Google Scholar] [CrossRef] [Scilit]
  44. Serrano, J.; Shahidian, S.; Marques da Silva, J.; Sales-Baptista, E.; Ferraz de Oliveira, I.; Lopes de Castro, J.; Pereira, A.; Cancela de Abreu, M.; Machado, E.; Carvalho, M. Tree influence on soil and pasture: Contribution of proximal sensing to pasture productivity and quality estimation in montado ecosystems. Int. J. Remote Sens. 2018, 39, 4801–4829. [Google Scholar] [CrossRef] [Scilit]
  45. Soares, G.; Pedreiras, P.; Xavier, W.; Gonçalves, P.A. Smart collars for sheep: Leveraging machine learning for improved pasture management. In Proceedings of the CSRF 2024 the First International Conference on Sustainable and Regenerative Farming, Valencia, Spain, 17–21 November 2024. [Google Scholar]
  46. Nwaogu, C.; Chukwudi, M.A.O.; Diagi, B.E.; Diagi, D.O.; Ojiaku, A.A.; Mgbeahuruike, L.U.; Unegbu, R.N.; Abdullahi, K.I.; Ameh, Y.A.; Edo, F.A.; et al. Effect of sheep grazing systems on soil, yield, and species diversity in an agricultural watershed, Nigeria. Environ. Chall. 2025, 21, 101318. [Google Scholar] [CrossRef] [Scilit]
Figure 1. Experimental field location: (a) Alentejo region in Portugal; (b) treatments (T1, T2, T3 and T4) and 48 sampling areas.
Sustainability 18 03962 g001
Figure 2. Chronogram of field tests: grazing management and soil cone index monitoring.
Sustainability 18 03962 g002
Figure 3. Thermo-pluviometric diagram of Meteorological Station of Mitra (Évora, Portugal): comparison of reference values of precipitation (monthly average of the period 1981–2020) with the period between July 2023 and June 2024 (a), and with the period between July 2024 and June 2025 (b).
Sustainability 18 03962 g003
Figure 4. Sampling areas considered under tree canopy (UTC) and outside tree canopy (OTC).
Sustainability 18 03962 g004
Figure 5. Altimetric (a) and soil’s apparent electrical conductivity (b) maps.
Sustainability 18 03962 g005
Figure 6. Maps of spatial variability in soil parameters: (a) clay; (b) silt; (c) sand; (d) organic matter content (OMC); (e) pH; (f) cationic exchange capacity (CEC).
Sustainability 18 03962 g006
Figure 7. Relation between soil cone index (CI, in kPa) and soil moisture content (SMC, in %) (depth 0–30 cm), mean of all monitoring dates, for each of the 48 sampling areas.
Sustainability 18 03962 g007
Figure 8. Maps of spatial variability in soil cone index (CI, in kPa) and soil moisture content (SMC, in %) (depth 0–30 cm) on 6 December 2023 (a,b) and 16 February 2024 (c,d).
Sustainability 18 03962 g008
Figure 9. Maps of spatial variability in soil cone index (CI, in kPa) and soil moisture content (SMC, in %) (depth 0–30 cm) on 11 March 2024 (a,b) and 11 April 2024 (c,d).
Sustainability 18 03962 g009
Figure 10. Maps of spatial variability in soil cone index (CI, in kPa) and soil moisture content (SMC, in %) (depth 0–30 cm) on 18 October 2024 (a,b) and 6 February 2025 (c,d).
Sustainability 18 03962 g010
Figure 11. Maps of spatial variability in soil cone index (CI, in kPa) and soil moisture content (SMC, in %) (depth 0–30 cm) on 14 March 2025 (a,b) and 7 May 2025 (c,d).
Sustainability 18 03962 g011
Figure 12. Cone index (CI, in kPa) in each treatment and in each depth, on the monitoring dates: 6 December 2023 (a); 16 February 2024 (b); 11 March 2024 (c) and 11 April 2024 (d).
Sustainability 18 03962 g012
Figure 13. Cone index (CI, in kPa) in each treatment and in each depth, on the monitoring dates: 18 October 2024 (a); 6 February 2025 (b); 14 March 2025 (c) and 7 May 2025 (d).
Sustainability 18 03962 g013
Figure 14. Preferential areas of animal grazing (mean of the four monitoring dates during the spring 2024).
Sustainability 18 03962 g014
Figure 15. Cone index (in kPa; (a)) and soil moisture content (SMC, in %; (b)) at 0–30 cm depth, between outside tree canopy (OTC) and under tree canopy (UTC), on each monitoring date.
Sustainability 18 03962 g015
Figure 16. Inferential analysis of soil moisture content (SMC, in %) and soil cone index (CI, in kPa) at 0–30 cm depth, between outside tree canopy (OTC) and under tree canopy (UTC). Presented is the discrimination of CI analysis for depth layer. *—Correlation significant at the 0.05 level (separate mixed model).
Sustainability 18 03962 g016
Figure 17. Schematic representation of the main results obtained in this study. T1, T2, T3 and T4—treatments; manag.—management; CI—cone index; RCI—relative cone index; SMC—soil moisture content; UTC—under tree canopy; OTC—outside tree canopy; *—significant at the 0.05 level; ***—significant at the 0.001 level.
Sustainability 18 03962 g017
Figure 18. Surface organic layer, typical of areas under tree canopy.
Sustainability 18 03962 g018
Figure 19. Areas flooded after heavy rainfall, vulnerable to compaction by animal trampling.
Sustainability 18 03962 g019
Table 1. Descriptive analysis of soil parameters (0–30 cm depth) in June 2023.
TreatmentSoil ParameterMean ± SDCV (%)Range
Sand (%)77.9 ± 3.24.170.5–84.7
Silt (%)11.5 ± 2.118.17.7–18.6
AllClay (%)10.5 ± 2.523.85.6–17.5
(Sandy loam)OMC (%)3.7 ± 1.027.42.3–6.7
pH5.7 ± 0.46.95.1–6.7
CEC (cmol kg−1)7.5 ± 5.066.74.4–30.6
Sand (%)79.2 ± 1.62.176.2–82.0
Silt (%)11.0 ± 1.412.78.1–13.6
T1Clay (%)9.8 ± 1.212.58.0–11.5
(Sandy loam)OMC (%)4.5 ± 1.227.02.5–6.5
pH5.5 ± 0.23.85.2–5.8
CEC (cmol kg−1)12.0 ± 8.772.64.9–30.6
Sand (%)77.5 ± 2.93.773.3–82.0
Silt (%)11.3 ± 1.614.68.2–14.5
T2Clay (%)11.2 ± 3.632.46.2–17.5
(Sandy loam)OMC (%)3.5 ± 0.618.12.7–4.5
pH5.5 ± 0.24.35.2–5.8
CEC (cmol kg−1)6.6 ± 1.421.24.4–9.3
Sand (%)76.0 ± 3.03.970.5–80.5
Silt (%)13.0 ± 2.519.19.8–18.6
T3Clay (%)11.0 ± 1.614.48.2–13.3
(Sandy loam)OMC (%)3.0 ± 0.414.62.3–3.8
pH6.1 ± 0.46.15.3–6.7
CEC (cmol kg−1)5.7 ± 0.813.44.8–7.2
Sand (%)79.1 ± 4.05.171.5–84.7
Silt (%)10.7 ± 2.119.47.7–14.3
T4Clay (%)10.1 ± 2.827.95.6–14.8
(Sandy loam)OMC (%)3.9 ± 1.026.92.6–6.7
pH5.9 ± 0.46.45.1–6.4
CEC (cmol kg−1)5.9 ± 1.118.34.5–8.2
SD—standard deviation; CV—coefficient of variation; OMC—organic matter content; CEC—cationic exchange capacity.
Table 2. Correlation coefficients (r) between relative cone index (RCI, in %) and soil parameters (depth = 0–30 cm).
RCI (Date)SandSiltClayOMCpHCECSMC
Date 1 (6 December 2023)0.1000.087−0.2000.104−0.251 *0.192−0.145
Date 2 (16 February 2024)0.122−0.230 *0.0360.226 *−0.275 *0.022−0.126
Date 3 (11 March 2024)0.107−0.225 *0.0510.078−0.089−0.052−0.313 *
Date 4 (11 April 2024)0.207−0.147−0.1410.200−0.343 *0.075−0.398 *
Date 5 (18 October2024)0.302 *−0.119−0.286 *−0.140−0.217 *−0.216 *−0.189
Date 6 (6 February 2025)0.271 *−0.275 *−0.1170.329 *−0.210 *0.157−0.495 *
Date 7 (6 December 2025)0.118−0.120−0.0500.080−0.193−0.099−0.174
Date 8 (7 May 2025)0.079−0.1640.0360.086−0.0650.040−0.259 *
All Dates (Mean)0.268 *−0.234 *−0.1460.189−0.343 *0.028−0.381 *
OMC—organic matter content; CEC—cationic exchange capacity; SMC—soil moisture content; *—correlation significant at the 0.05 level.
Table 3. Results of the linear mixed model (LMM) for cone index (CI): fixed effects of lime application, grazing management, depth, date, and their interactions.
EffectFDf.Sig.
Adjusted model5.88210.000
Intercept60.8010.000
Lime application2.2010.139 ns
Grazing/SR4.3710.037
Depth21.8820.000
Date2.5920.076 ns
Lime application × Grazing1.6910.195 ns
Lime application × Depth0.1120.899 ns
Lime application × Date1.1210.291 ns
Grazing/SR × Depth6.4620.002
Grazing/SR × Date1.0220.360 ns
F—F statistics; Df.—degrees of freedom; Sig.—significance; SR—stocking rate; ns—not significant.
Table 4. Descriptive and inferential analysis of soil cone index (CI, in kPa): comparison for each of the four factors (lime application; grazing management and stocking rates; depth and date).
FactorLevelMean ± SDCV (%)Rangep
Lime
Application
No 1628 ± 793 48.7172–59340.139 ns
Yes 1536 ± 783 51.0155–5589
Grazing/
Stocking Rate
CG-LSR 1671 ± 867 a51.9155–59340.037
DG-HSR 1493 ± 691 b46.3172–5210
Depth0–10 cm1134 ± 492 c43.4172–3139
10–20 cm1718 ± 706 b41.1414–48210.000
20–30 cm1896 ± 902 a47.6155–5934
Date6 December 20231708 ± 842 49.3224–5934
16 February 20241648 ± 740 44.9302–4657
11 March 20241470 ± 818 55.6155–5589
11 April 20241782 ± 719 40.3396–36910.076 ns
18 October 2024972 ± 800 40.6517–5210
6 February 20251621 ± 743 45.8414–4464
14 March 20251109 ± 595 53.7172–3637
7 May 20251347 ± 716 53.2172–4171
SD—standard deviation; CV—coefficient of variation; p—probability (main effect); CG—continuous grazing; DG—deferred grazing; LSR—low stocking rate; HSR—high stocking rate; ns—not significant; different lowercase letters in each factor indicate significant differences between treatments according to Dunnett’s T3 or Tukey’s test (p < 0.05).
Table 5. Correlation matrix between grazing density and soil cone index (CI, in kPa) for each depth (n = 384).
DepthFactorParametersGrazing DensityCI
0–10 cmGrazing densityr10.172 **
Sig. (bilateral) 0.001
CIr0.172 *1
Sig. (bilateral)0.001
10–20 cmGrazing densityr10.0291
Sig. (bilateral) 0.570
CIr0.02911
Sig. (bilateral)0.570
20–30 cmGrazing densityr1−0.081
Sig. (bilateral) 0.113
CIr−0.0811
Sig. (bilateral)0.113
CI—cone index; r—Pearson’s correlation coefficient; **—correlation significant at the 0.01 level. *—correlation significant at the 0.05 level.
Disclaimer/Publisher’s Note: The statements, opinions and data contained in all publications are solely those of the individual author(s) and contributor(s) and not of MDPI and/or the editor(s). MDPI and/or the editor(s) disclaim responsibility for any injury to people or property resulting from any ideas, methods, instructions or products referred to in the content.