Article

Predicting Urban Textile Waste Generation: An Agent-Based and Panel Econometric Approach

Department of Engineering for Industrial Systems and Technologies, University of Parma, Parco Area delle Scienze 181/A, 43124 Parma, PR, Italy
*
Author to whom correspondence should be addressed.
Sustainability 2026, 18(8), 3961; https://doi.org/10.3390/su18083961
Submission received: 2 March 2026 / Revised: 6 April 2026 / Accepted: 14 April 2026 / Published: 16 April 2026

Abstract

The growing environmental impact of textile consumption has intensified the need for efficient post-consumer waste collection systems capable of supporting circular economy transitions. Designing effective logistics systems for textile waste is therefore crucial, and their proper dimensioning requires accurate forecasts of collected volumes. However, textile waste flows are highly heterogeneous and strongly influenced by behavioural factors, making reliable forecasting particularly challenging. This study investigates whether urban textile waste collection can be effectively predicted by combining stable bin-level heterogeneity with time-varying socio-spatial and behavioural indicators. Using panel data generated by a hybrid simulation model for the municipality of Parma, we implemented a fixed-effects econometric framework and compared its performance with traditional benchmarks, including seasonal means and Holt–Winters exponential smoothing. The results demonstrate that incorporating structural heterogeneity across collection points, together with behaviour-related dynamics, enhances prediction accuracy and significantly outperforms traditional univariate time-series approaches, both at the aggregate level (R2 ≈ 0.81) and at the bin level (MAE ≈ 25). These findings also support the robustness and generalizability of the proposed panel-data econometric framework, which shows strong potential for application in other urban settings characterized by similar structural and behavioural features.

1. Introduction

The textile and fashion industry is widely recognized as one of the most environmentally impactful industrial systems worldwide, due to its intensive use of water and energy, high greenhouse gas emissions, and increasing volumes of waste generated along the supply chain [1,2,3]. In recent decades, the widespread adoption of fast and ultra-fast fashion business models has further amplified these impacts, driven by accelerated production cycles, shortened product lifetimes, and rapidly evolving consumption patterns [4]. As a result, textile products are increasingly discarded after short use phases, placing growing pressure on waste management systems and slowing progress towards circular economy objectives [5].
In parallel, the sector has undergone a profound digital transformation, often referred to as Fashion 4.0, driven by the adoption of Industry 4.0 technologies such as the Internet of Things (IoT), Big Data analytics, Artificial Intelligence (AI), and digital platforms [6,7]. These technologies have significantly reshaped product development, marketing strategies, and consumer interaction, primarily enhancing flexibility, responsiveness, and market reach within upstream and midstream stages of the textile supply chain [7]. The literature extensively documents how digitalization has contributed to improving efficiency and resilience in textile production and distribution, particularly in response to systemic disruptions such as the COVID-19 pandemic.
Despite these advances, sustainability challenges increasingly emerge downstream, especially at the post-consumer stage [8]. This issue is especially pressing in the EU, where textiles rank among the most environmentally burdensome consumption categories, combining high resource intensity with relatively low reuse and recycling rates [9]. Consequently, the transition from a linear to a circular textile economy has become a strategic priority, as reflected in EU policy initiatives promoting reuse, repair, and fibre-to-fibre recycling [10].
Achieving these circular ambitions, critically depends on the capacity to intercept textile products at their end of life, making waste collection systems a pivotal, but often fragile, component of circular textile supply chains. Textile waste, in fact, presents specific challenges compared to other waste fractions: disposal patterns are highly heterogeneous and shaped by consumption habits, socio-demographic factors, and behavioural dynamics. In urban contexts, these characteristics translate into spatially uneven and temporally volatile waste flows, which complicate planning and operational decision-making for local authorities [11,12]. As cities play a central role in implementing circular economy strategies, understanding and anticipating textile waste collection dynamics has become increasingly relevant for sustainable urban governance. Addressing the scale and complexity of textile waste generation and collection in urban environments requires access to highly granular, temporally resolved, and spatially explicit data. Such data are essential for capturing the combined effects of socio-spatial structures, behavioural responses, and service-level configurations that drive textile disposal patterns [13]. However, in practice, these data are often incomplete, unavailable, or collected at levels of aggregation that are insufficient to support predictive analysis and scenario-based planning. This creates an impasse, as the lack of fine-grained data constrains the applicability of conventional regression-based forecasting models, undermining their ability to accurately capture and predict the underlying dynamics. To overcome this deadlock, a common and effective approach is to adopt simulation modelling, which enables the generation of synthetic and realistic datasets capable of reproducing plausible waste generation and collection dynamics [14,15]. When properly calibrated and theoretically grounded, simulation models can generate consistent and controllable data that reflect underlying behavioural and spatial dynamics [16].
Despite this potential, a critical gap remains as there is still a lack of robust and interpretable modelling frameworks capable of effectively leveraging such data, whether empirical or simulated, to systematically identify, quantify, and predict the key drivers of textile waste generation across heterogeneous urban contexts. This study addresses this gap by proposing a predictive framework based on Fixed-Effects (FE) estimation applied to data generated through HyTex (Hybrid Textile), a hybrid (i.e., agent-based and discrete-events) simulation model, which replicates urban textile waste collection dynamics while explicitly accounting for socio-spatial heterogeneity and behavioural awareness indicators.
By leveraging on this predictive framework, this study aims to support more proactive and evidence-based decision-making in municipal waste management systems. To this end, it addresses the following research questions:
RQ1. To what extent can the total amount of potentially recyclable textile waste be predicted, by combining stable bin-level heterogeneity with behavioural indicators?
RQ2. What advantages does a FE model, incorporating both bin-level heterogeneity and behavioural indicators, offer over traditional benchmark models?
The remainder of the manuscript is structured as follows. Section 2 reviews the relevant theoretical background; Section 3 presents the HyTex simulation model and its main components; Section 4 describes the data structure, the adopted predictive framework, and the associated diagnostic analyses; Section 5 reports the results of the benchmarking analysis conducted to assess model performance; Section 6 discusses the findings; finally Section 7 concludes by summarizing the key results, acknowledging the study’s limitations, and outlining directions for future research.

2. Background and Research Gap

2.1. Textile Supply Chain and Urban Waste Management

Recent contributions in the sustainability and circular fashion literature emphasize the growing diffusion of strategies such as repair, upcycling, participatory design, and localized production models, often embedded within place-based and regional innovation ecosystems [17]. These approaches reflect an important shift toward circularity within the textile supply chain, particularly at the design, production, and consumption stages. Nevertheless, the operational management of post-consumer textile flows, especially collection and sorting, remains comparatively underexplored and is largely delegated to municipal systems.
Empirical evidence from the fashion sector highlights a persistent gap between sustainability awareness and concrete operational practices. For instance, an interesting survey conducted in the Italian fashion industry shows that companies are generally well informed about sustainability issues and express a strong willingness to support greener supply chains [18]. However, the same study also highlights that the actual adoption of circular practices remains uneven, with reverse logistics and end-of-life management receiving comparatively limited attention in both strategic and operational decision-making. This misalignment implies that, despite upstream sustainability initiatives, a substantial share of responsibility for managing textile waste is effectively shifted downstream, toward urban waste management systems.
At the urban level, textile waste collection represents a particularly complex challenge. Unlike other waste fractions, textile waste is characterized by strong temporal variability, spatial heterogeneity, and a high dependence on voluntary citizen participation. Disposal volumes fluctuate due to seasonal effects, neighbourhood characteristics, and consumption habits, thereby complicating planning and operational optimization for local authorities and service providers [13]. Indeed, a growing body of literature highlights persistent inefficiencies in textile waste collection systems, including bin saturation, unbalanced routes, and uneven service levels, which not only reduce operational performance, but also undermine environmental outcomes by diverting potentially recyclable materials into mixed waste streams [19]. Most importantly, these inefficiencies may trigger a self-reinforcing cycle that further deteriorates overall system performance. Poor service quality may discourage citizen participation, triggering negative behavioural feedback loops that exacerbate existing inefficiencies. This dynamic is widely documented in the literature, which consistently highlights the importance of accounting for human behaviour in textile waste management systems. In this regard, a growing body of research that textile waste management outcomes cannot be fully understood without considering both socio-spatial and behavioural dimensions (see for example the comprehensive literature review by Ribeiro-Rodrigues and Bortoleto [20]). Hence, accessibility to collection infrastructure, distance to bins, perceived service reliability, and social interactions within neighbourhoods jointly shape disposal decisions, generating localized participation patterns that challenge uniform, one-size-fits-all collection strategies [20].

2.2. Predictive Gap in Textile Waste Collection

Despite the growing relevance of textile waste collection for urban sustainability, the existing literature remains relatively limited and lacks systematic analyses that explicitly attempt to predict textile waste collection quantities using predictors that can be realistically obtained from available real-world data sources. Indeed, most of the works dealing with urban waste prediction have predominantly concentrated on mixed municipal solid waste or recyclable fractions such as paper, glass, and plastics, often relying on aggregate socio-economic indicators or time-series extrapolations at the city or regional level [21,22,23]. While these approaches provide valuable insights, they are not directly transferable to textile waste streams, which are characterized by higher behavioural sensitivity, stronger socio-spatial heterogeneity, and voluntary participation dynamics that are rarely captured by conventional predictors [20].
The limited number of studies focusing on textile waste prediction is likely attributable to the data-related and modelling challenges discussed in the previous subsection. These issues are even more pronounced in several EU countries, particularly in Italy, which serves as the reference context of this study, where separate textile waste collection is still at an early stage of diffusion. In these contexts, in fact, collection services are often outsourced by municipal companies to small local operators, such as cooperatives or limited liability firms, which frequently lack the technological and organizational capacity to systematically monitor and record collected quantities at the level of individual bins or neighbourhoods. As a result, high-resolution empirical datasets suitable for training and validating conventional forecasting models are rarely available, thereby limiting the feasibility of purely data-driven prediction approaches [19]. Due to these issues, most contributions adopt descriptive, diagnostic, or policy-oriented approaches, focusing on consumption patterns, recycling technologies, or behavioural determinants, rather than on the development of predictive models for collection volumes [24,25]. Also, existing predictive efforts generally rely on relatively standard modelling approaches. For instance, [12] proposes a behavioural model to estimate end-of-life textile flows, while [26] shows that variables such as gender, age, education level, and household size significantly influence attitudes and practices related to textile recycling. Only recently have more innovative modelling approaches begun to emerge. For instance, in [27], a Gradient Boosting model is used to forecast weekly municipal solid waste generation, including textile, across New York City by integrating historical collection data with socio-economic, land-use, and weather datasets. Similarly, in [28] different machine learning models to estimate textile waste in a production process, allowing waste rates to vary based on multiple operational parameters rather than being fixed. However, although interesting, the focus of these works is only marginally on textile waste or extend beyond urban collection contexts to include industrial waste streams.
Given these gaps in the literature, this study addresses the limited exploration of whether textile waste collection dynamics can be reliably predicted using stable and observable regressors grounded in real-world socio-spatial and behavioural characteristics. Specifically, we investigate the extent to which a regression-based econometric model, integrated with a discrete-event simulation framework, can support reliable forecasting in contexts where granular historical data are scarce or unavailable. In this sense, the challenge lies in identifying structurally informative predictors capable of capturing underlying dynamics and enabling robust predictions despite data limitations.

2.3. Contextualization

The predictive model developed in this study is framed within the evolving European regulatory context of textile waste management and the socio-spatial characteristics of medium-sized urban systems, with specific reference to the Italian case. In recent years, the European Union has significantly strengthened its policy approach to textile sustainability, recognizing textiles as a priority sector within the Circular Economy Action Plan [29]. A key milestone is the revision of the Waste Framework Directive (Directive 2018/851/EU), which mandates Member States to implement separate collection systems for textile waste [3]. This regulatory shift redefines textile waste from a marginal and poorly monitored fraction into a structured component of municipal waste management systems, with important implications for planning, infrastructure, and data availability. However, in countries such as Italy, the implementation of these regulatory frameworks remains in a transitional phase. Textile waste collection systems are often fragmented and partially outsourced to local operators, resulting in heterogeneous service levels and limited availability of high-resolution data. This context makes Italy a particularly relevant case for exploring predictive approaches based on structurally observable socio-spatial and behavioural variables, rather than relying exclusively on detailed historical datasets.
From a territorial perspective, the empirical setting of this study can be framed within the category of medium-sized Italian cities, characterized by moderate population density, mixed urban morphology, and significant socio-economic heterogeneity. In such contexts, waste management systems typically combine centralized planning with localized operational constraints, while collection services are often outsourced by municipal companies to small local operators, such as cooperatives or limited liability firms, which frequently lack the technological and organizational capacity to systematically monitor and manage collection processes at a fine-grained level. Within this framework, citizen participation plays a crucial role in shaping collection outcomes. However, no specific incentives are typically in place for separate textile waste collection. Citizens are generally free to dispose of textile waste either through unsorted municipal collection (typically door-to-door) or by using dedicated collection bins, where materials may be reintroduced into secondary markets, downcycled, or incinerated depending on their condition. The only indirect incentive stems from the variable component of the waste fee, which depends on the volume of unsorted waste generated; however, this mechanism provides only a weak incentive for textile separation.
As discussed in the previous Sections, addressing the inherent complexity of textile waste collection systems requires modelling approaches capable of capturing both structural and behavioural dynamics. To this end, the proposed predictive framework integrates a hybrid simulation model, combining discrete-event and agent-based modelling, with regression-based econometric techniques. The former is employed to represent socio-spatial and behavioural processes, while the latter is used to identify and quantify the key drivers of waste generation. This combined approach is consistent with the Prism of Sustainability [30], which conceptualizes sustainable systems as the outcome of interactions among environmental, economic, social, and institutional dimensions. Within this perspective, textile waste collection is understood as a socio-technical system in which outcomes emerge from the interplay between infrastructure efficiency, economic constraints, governance mechanisms, and citizen behaviour. By integrating simulation and econometric modelling, the proposed framework captures these interdependencies, overcoming the limitations of purely data-driven approaches and enabling more robust predictions in contexts characterized by data scarcity and systemic complexity.

3. Method: HyTex Model

In two previous works, we developed HyTex, a comprehensive hybrid simulation framework designed to model urban textile-waste collection systems.
The first study [31] laid out the core components and methodological foundations of the model, detailing how it integrates agent-based simulation and discrete-event simulation to capture both behavioural and operational dynamics. The goal was to reproduce the system by explicitly accounting for both citizens’ behavioural dynamics and potential policy-driven incentive mechanisms.
In the second study [19], the model was calibrated and applied to a real-world context, the municipality of Parma (Italy), with the dual objective of assessing its performance and identifying potential improvements to the existing logistic system. The calibration relied on operational data provided by the municipal waste operator, Iren S.p.A., updated to the end of 2025. In addition, both spatial and behavioural inputs were grounded in evidence from a survey administered to more than 1500 respondents within the Italian context [32]. Through this application, the model was effectively validated, as it accurately reproduced the historical outcomes of the baseline scenario. For this reason, in the present article we consider the model’s results to be reliable and robust.

3.1. Core Components and Structure

The HyTex model is built around three key entities, namely: citizens, bins and collection trucks, as explained next.
Citizens are represented as autonomous agents with individual behavioural profiles. According to the regulatory framework governing the collection and disposal of textile waste (described in Section 2.3), each citizen generates textile waste and, once a certain quantity has accumulated at home, decides whether to dispose of it in the general waste stream or to recycle it. In the latter case, the citizen must physically deposit the textile waste in the designated collection bins. This decision is influenced by factors such as propension to engage in sustainable behaviours, called Green Awareness (GAw), proximity to collection bins, and the perceived quality of the service level. No additional incentive mechanisms are considered in this analysis because, as detailed in Section 2.3, the only economic signal available is the variable component of the waste fee, linked to the volume of unsorted waste, which exerts a negligible influence on citizens’ disposal behaviour.
Bins are static entities that serve as the interface between citizens and the collection infrastructure. They have fixed capacities and may become full over time, a condition that directly affect citizens’ disposal choices.
Collection Trucks are dynamic entities that collect waste from bins according to predefined routes and schedules. Their operational performance, such as collection frequency and travel distances, affects the overall efficiency of the system.
In addition to these actors, a fourth agent, namely the System Manager, acts as a coordinating entity. It oversees bin servicing operations, implements policy-driven incentive mechanisms, and monitors overall system performance, thereby orchestrating the interaction among the other agents.

3.2. Behavioural Dynamics

The model’s strength lies in its ability to simulate the dynamic feedback loop between citizen behaviour and service quality. Rather than treating agent attributes as fixed, the simulation captures how GAw evolves over time based on individual experiences. Positive interactions, such as consistently finding available bins, act as a reinforcement mechanism for sustainable behaviour. Conversely, negative experiences, such as encountering overflows, trigger a decay in engagement, potentially shifting agents toward general waste disposal. In addition, the model incorporates a social interaction effect at the neighbourhood level. Citizens do not update their behaviour solely based on personal experience, but also in response to the observed behaviour of other residents within the same area. As a result, pro-environmental practices may spread through local social influence, while low participation can generate negative spillovers, further affecting individual disposal choices.

3.3. Model Settings

Spatially, the municipality of Parma (i.e., the case study considered) was discretized using a grid of nodes spaced 250 m apart, with each node representing a city block to which citizens can be assigned and where collection bins may be located. In terms of population, a total of 160,000 citizens were considered, incorporating both individual and household-level agents to represent behavioural dynamics at different social scales. Behavioural archetypes were initially distributed geographically, with a majority of “eco-citizens” located in the city centre (60%) and a predominance of “non-eco-citizens” in suburban area (60%), in line with our previous studies. However, this spatial distribution is not static; indeed, as the simulation proceeds, social interaction mechanisms can gradually reshape the composition of the neighbourhoods.
Concerning the physical infrastructure, it is formed by 145 bins (180 kg capacity) placed on the grid based on their actual GPS position, and two trucks (1000 kg capacity), operates on six weekly routes to meet demand. By spanning a seven-year horizon and incorporating historical waste peaks in May and November (associated with seasonal wardrobe changes), the model captures long-term behavioural trends and system resilience. For a full technical description of these parameters, the interested readers are referred to [19,31], where the model is fully described, validated and tested.

3.4. Outputs and Applications

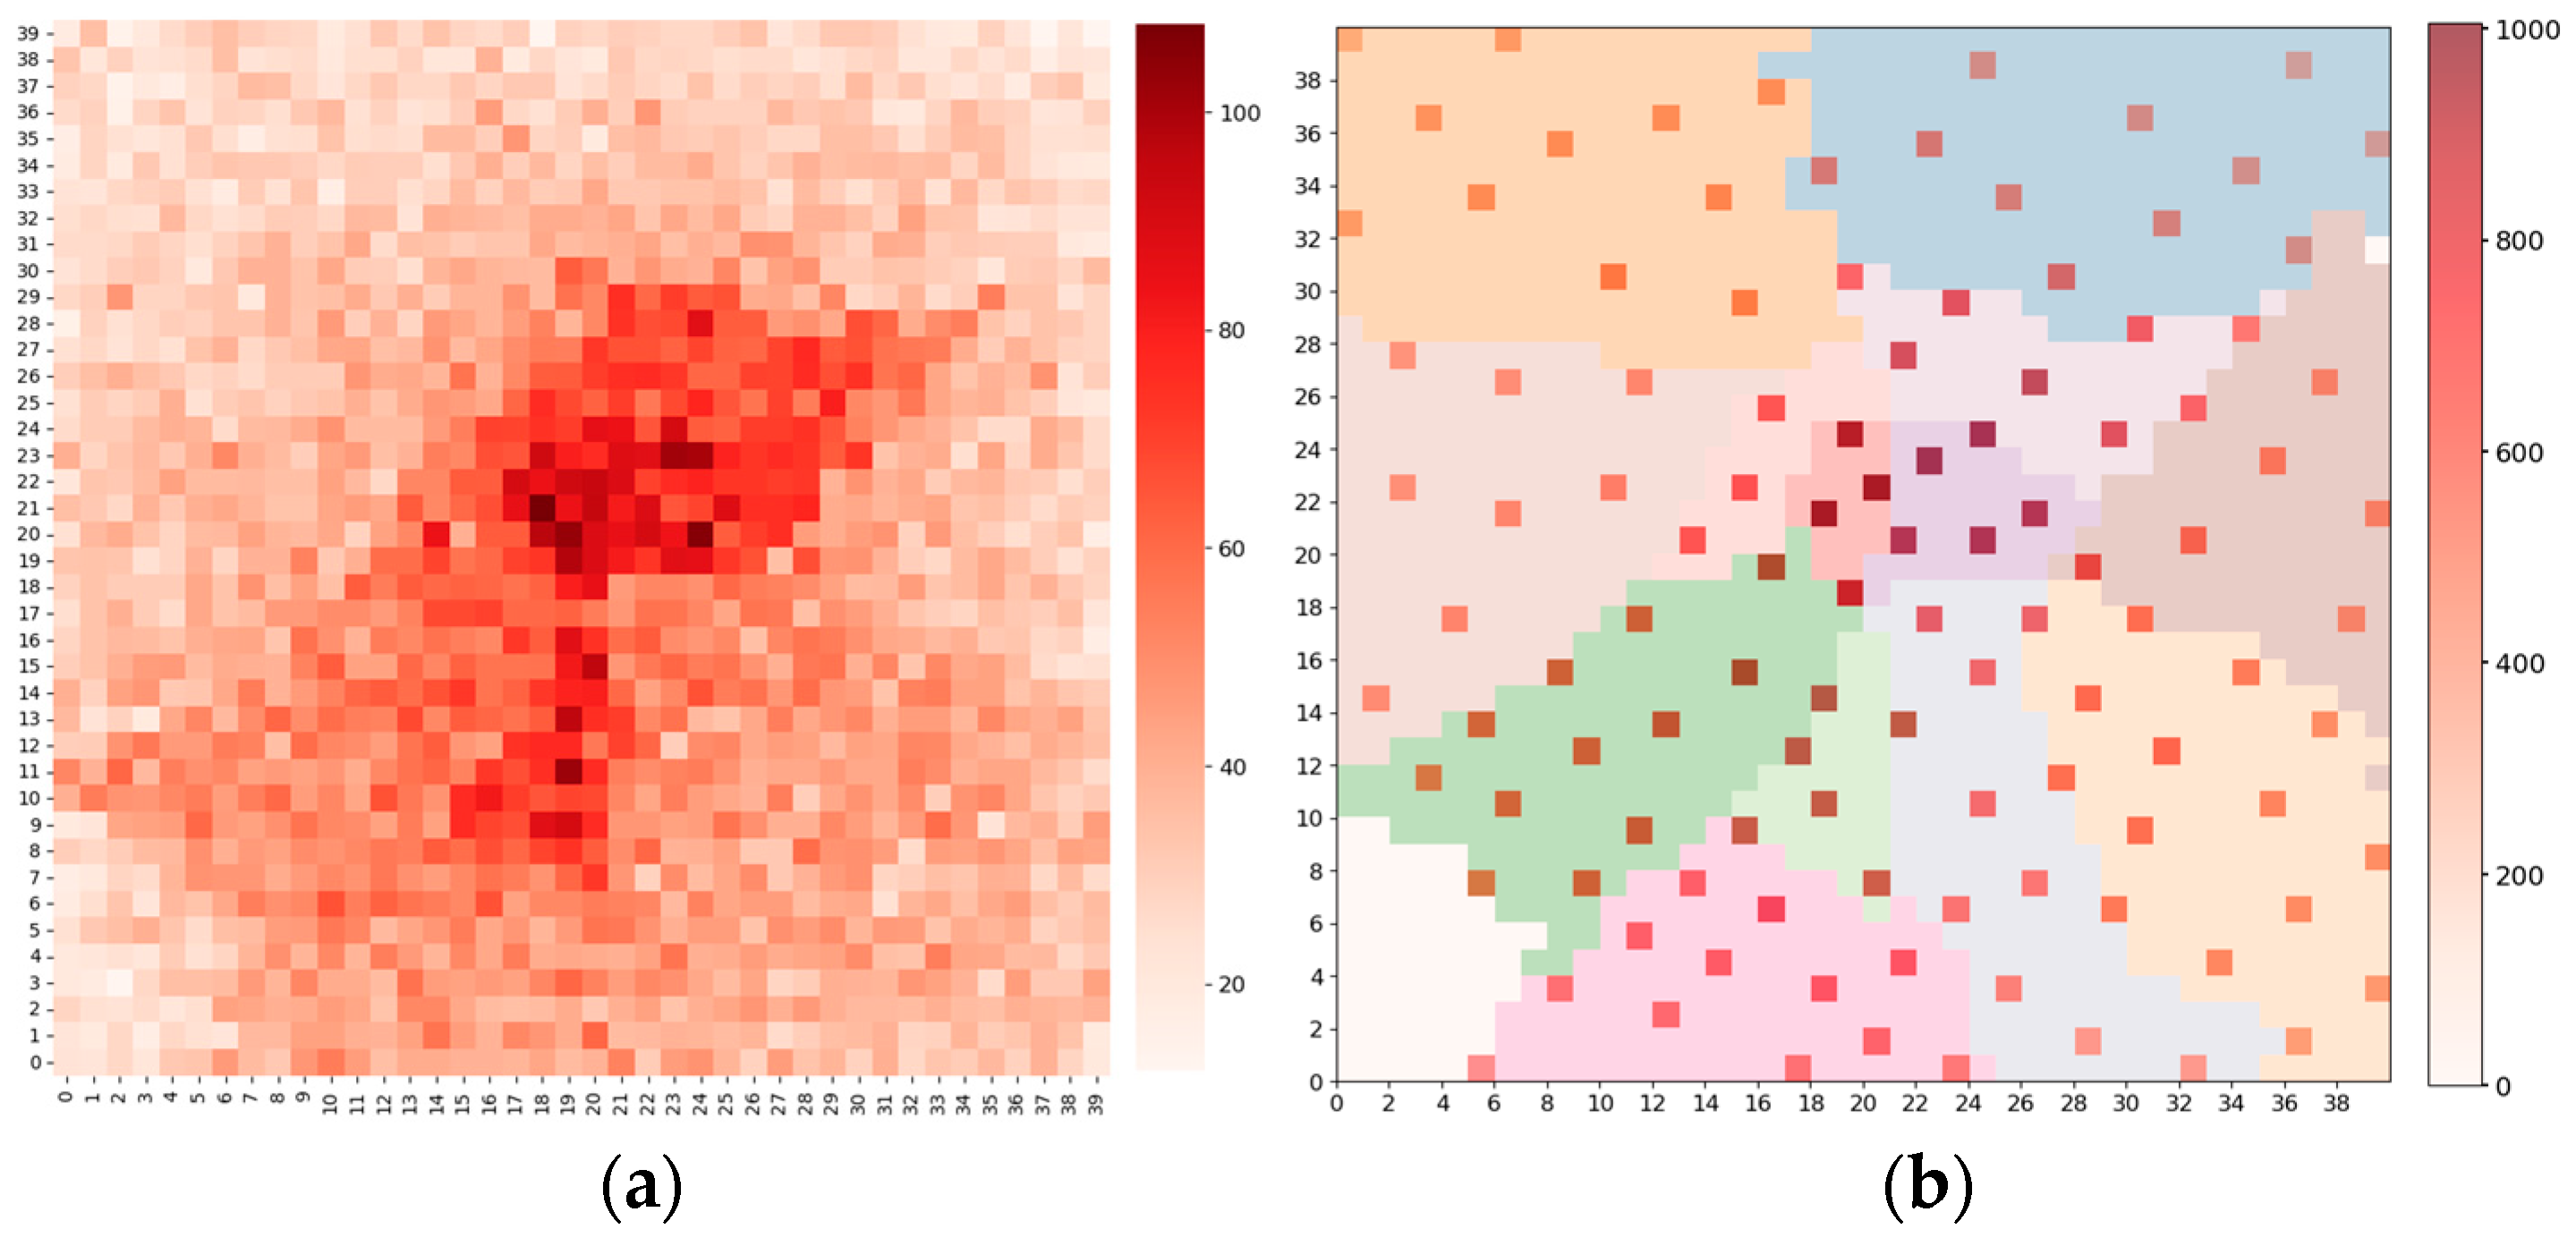
Figure 1a,b illustrate an example of the simulation output. Specifically, Figure 1a shows the monthly quantities of textile waste generated at each node, which drive citizens’ disposal decisions, namely whether to use mixed waste or recycle through nearby collection bins. Figure 1b, in contrast, presents the spatial distribution of collection bins across the network of nodes, together with the quantities delivered to each bin. In both figures, quantities are represented using a red colour gradient, where darker shades correspond to higher volumes.
These outputs are crucial for understanding the system’s evolution over time, as the quantities delivered directly influence the dimensioning and operational performance of the collection system. System performance, in turn, influences GAw, shaping subsequent disposal behaviour and delivered volumes. This feedback loop defines the behavioural dynamics that ultimately determine textile waste generation and collection patterns over time.
HyTex produces a broad range of outputs, including behavioural indicators (e.g., changes in GAw), operational metrics (e.g., bin saturation rates and truck utilisation), and environmental outcomes (e.g., volume of recycled versus lost textile waste). These outputs provide actionable insights for policymakers and waste management operators. HyTex offers a robust and flexible tool for understanding the interplay between citizen behaviour and collection service performance, supporting the design of more efficient and sustainable urban waste-management systems.

3.5. Predictive Model: Selection Rationale

The model adopted in this study is explicitly designed for predictive purposes rather than for causal inference. Indeed, the primary objective is to assess whether textile waste collection quantities can be anticipated by exploiting stable heterogeneity across collection bins and observable socio-spatial and behavioural regressors. Hence, a Fixed Effects (FE) model is employed, as it allows us to control for time-invariant, unobserved characteristics at the bin level (e.g., urban density of the surrounding neighbourhoods, accessibility conditions, etc.) that systematically influence textile disposal behaviour but are not directly observed in the data [33,34].
This choice is particularly appropriate in data-scarce environments, where the availability of high-resolution empirical data is limited and where unobserved contextual factors may strongly influence observed outcomes [35]. By exploiting stable bin-level heterogeneity, the model aims to identify predictive patterns that are robust to short-term demand fluctuations, thereby aligning the methodological approach with the research gap identified in the previous sections and with recent applications of predictive analytics in urban systems [21].

4. Prediction Through Fixed Effects

The objective of the predictive model is to forecast the potential weekly volume of textile waste (kg) that may be recycled by citizens (hereafter, Potential kg). Accordingly, this chapter investigates the drivers of Potential kg and develops a predictive framework based on a FE specification [36].
Please note that the term Potential is used intentionally. The potentially recycled amount coincides neither with the total textile waste generated by citizens nor with the actual quantity deposited in the collection bins. It differs from the total generated waste because the decision to recycle (i.e., to use dedicated collection bins rather than dispose of textile waste in the undifferentiated stream) is behaviorally driven and primarily influenced by citizens’ GAw. As a result, the total amount of textile waste generated constitutes an upper bound to the potentially deposited quantity (i.e., generated ≥ potential).
At the same time, the potentially recycled amount also differs from the quantity effectively deposited in the bins due to operational constraints. Not all waste that citizens intend to recycle can be successfully deposited, as capacity limitations (e.g., full bins) or other service inefficiencies may prevent disposal and divert waste to alternative streams. Hence, the potentially deposited amount represents an upper bound to the effectively recycled quantity (i.e., potential ≥ deposited).
Focusing on the prediction of Potential kg is therefore crucial from a system-planning perspective, since this variable represents the amount of waste that could be intercepted under stable operational conditions, abstracting from short-term inefficiencies in the collection system. Although this dependent variable is not directly determined by service performance, it remains indirectly influenced by it, through behavioural feedback mechanisms, as citizens may adjust their GAw in response to perceived service quality. For these reasons, we believe that Potential kg constitutes the most appropriate target variable for designing and optimizing collection strategies aimed at maximizing material recovery.

4.1. Econometric Background

Econometrics provides a set of quantitative tools for analysing relationships between variables and for generating predictions based on observed data [33,37]. While originally developed within the field of economics, econometric methods have progressively evolved into a general-purpose analytical framework for studying complex systems in which outcomes depend on the interaction of multiple observable and unobservable factors. These approaches are now widely applied beyond traditional economic settings, including urban systems, public services, energy, transportation, and environmental management.
In the context of urban systems and public services, econometric approaches are increasingly used to support evidence-based decision-making, particularly when policymakers must operate under uncertainty and data constraints [35,38]. Unlike purely descriptive analyses, econometric models allow the explicit integration of multiple explanatory factors and the assessment of their predictive relevance within a coherent analytical framework [39].
This integrative capacity makes econometric analysis especially valuable in urban sustainability research, where complex outcomes often emerge from the interaction between infrastructure, individual behaviour, and local environmental conditions [21]. By allowing socio-spatial, behavioural, and contextual variables to be combined within a unified framework, these approaches are particularly well suited to analysing and predicting waste collection dynamics, in which heterogeneity across locations and over time plays a central role.

4.2. Panel Data: Overview

The data analysed in this study fall within the category of panel data, which combine cross-sectional and temporal dimensions by observing multiple units over time [40]. Formally, panel data models enable the separation of time-varying effects from unit-specific characteristics that remain stable over time [33]. Equation (1) represents their standard structure:
y i t = α i +   β x i t + u i t
where
i = 1 , , N indexes the cross-sectional units;
t = 1 , , T indexes time periods;
y i t is the dependent variable (for unit i and time t );
α i is the stochastic effect (of unit i ), unobserved and constant over time;
x i t is the vector of regressors (for unit i and time t );
β is the vector of common coefficients;
u i t is the idiosyncratic error (for unit i and time t ).
In the present case, the units of analysis are individual textile waste collection bins, observed across multiple time periods. A panel-data approach is therefore essential, as it enables us to capture both temporal dynamics and persistent cross-sectional differences among collection points, such as structural variations in accessibility, surrounding urban density, or local recycling culture. Accounting for this heterogeneity is crucial for isolating the effect of the primary regressors on citizens’ recycling attempts, ultimately providing richer insights than those obtainable from purely cross-sectional or purely time-series datasets [41]. The complete panel dataset and the corresponding model implementation code, developed in Python, are provided as Supplementary Materials.

4.3. Panel Data: Structure

The panel data structure organises observations by N cross-sectional units (bins) observed over T time periods (weeks). Specifically, the panel consists of N = 145 bins, identified through their (x, y) coordinates within the model grid, observed over T = 158 weeks defined according to ISO standards. The first 105 weeks are used for model estimation (training period), and the remaining 53 weeks constitute the forecasting horizon for out-of-sample validation (testing period).
In addition to the bin ( i ) and week ( w t ) identifiers, each unit includes the following observed variables:
Potential kg ( y i t ). Dependent variable of the model, representing the cumulative quantity citizens attempted to recycle at bin i during week t .
Generated kg ( g i t ). Total volume of waste generated by citizens assigned to bin i at week t .
Average GAw ( G i t ) . Continuous variable ranging from 0 to 1, measuring the average propensity for sustainable behaviour (i.e., individual GAw) in week t, among all citizens assigned to bin i . This value is not fixed over time: behavioral dynamics within the simulation affect individual GAw levels, which in turn modify the weekly average observed at the bin level. We refer the reader to the description of the GAw in [19,31] and summarized in Section 3.2.
It is important to clarify that by “citizens assigned to a bin” we refer to the individuals most likely to dispose of their textile waste in that specific bin. In the HyTex simulation, disposal behavior follows a distance-based mechanism: although the final choice of bin is stochastic, the probability of selecting a given bin decreases with the distance from the citizen’s residence. Accordingly, citizens are operationally assigned based on spatial proximity. Specifically, citizens assigned to bin i are those residing in the nodes for which bin i represents the nearest collection point, thus defining its primary catchment area according to a nearest-neighbor criterion within the spatial network.
Hence, the result is a five-column table yielding a total of 22,910 observations, as summarised by Table 1. Dataset is balanced, presenting exactly one row per entity, and time.

4.4. Model Selection and Specification

First, we conducted an F-test for poolability to assess whether the panel structure was statistically justified. The results (F = 7.12, p < 0.001) reject the null hypothesis of homogeneous intercepts across cross-sectional units, indicating that a pooled OLS specification would be inappropriate and supporting the adoption of a panel data framework.
Next, we evaluated whether the entity-level effects should be treated as random or fixed. Model choice between FE and Random Effects (RE) [42] was evaluated using two complementary specification checks. For the FE analysis we chose the Panel OLS estimator [43], while for the RE we adopted the well-known Random Effects estimator. First, we implemented the Hausman test [33,37] using unadjusted covariance matrices, so that inference follows the standard χ2 reference distribution. The test strongly rejects the RE exogeneity assumption (χ2 = 1951.59, p < 0.001), suggesting that the RE estimator is inconsistent. Second, as a robustness check under heteroskedasticity and within-bin dependence, we estimated a correlated RE model (Mundlak) by augmenting the RE specification with the entity means of time-varying covariates and testing their joint significance [44]. The Mundlak/CRE joint Wald test is likewise highly significant (Wald = 698.13, p < 0.001).
Since both Hausman and Mundlak tests indicate that unobserved entity traits are correlated with the predictors, the FE model specified in Equation (2) was selected as the final one.
y i t = α i + β 1 g i t + β 2 c i t + β 3 s i n 2 π w t 52 + β 4 c o s 2 π w t 52 + β 5 s i n 4 π w t 52 + β 6 c o s 4 π w t 52 + u i t
where
y i t is the total potentially recyclable textile waste (kg) that citizens attempt to deposit in bin i in week t, before accounting for system inefficiencies or capacity constraints;
g i t is the total textile waste (kg) generated in week t by citizens associated with bin i ;
c i t = g i t · G i t   is the Interaction effect of the generated waste g i t and the average GAw G i t ;
α i denotes bin Fixed Effects (one intercept per bin), capturing all unobserved time-invariant bin-specific characteristics specific to each bin (e.g., location, accessibility, neighbourhood features) as mentioned in Section 3.5;
w t { 1 , , 52 } denotes the ISO week of the year, common to all bins at time t ;
u i t is the idiosyncratic error term.
It is important to note that, to capture the behavioural mechanism underlying textile waste collection, we specify a model in which the generated quantity g i t enters both linearly and through an Interaction effect c i t with the GAw. This formulation reflects the idea that the potentially recyclable volume depends not only on how much waste is generated, but also on the proportion of that waste that citizens choose to deposit in collection bins, a proportion that is shaped by behavioural awareness.
Formally, the marginal effect of the generated waste on the collected quantity is given by Equation (3):
y i t g i t = β 1 + β 2 G i t
The interaction coefficient β 2 captures how behavioural awareness (GAw) modifies the responsiveness of collected waste to generated waste. Specifically, the term β 1   β 2 G i t can be interpreted as an awareness-adjusted collection rate, i.e., the share of generated waste that is effectively deposited in bins. In fact, while β 1 represents the baseline collection response when awareness is zero, β 2 measures how this response changes with awareness. A positive β 2 implies that higher awareness increases the proportion of generated waste that is properly disposed of, whereas a negative value would indicate the opposite. In brief, this implies that the average GAw G i t modulates the share of generated waste that is ultimately collected. In practical terms, for a given increase in generated waste, the corresponding increase in collected waste will be larger in contexts where awareness is higher.
We are aware that including c i t introduces some collinearity between this term and g i t ; yet it does not bias the estimated coefficients, as its only effect is to inflate the standard error. We consider this issue (which is of limited impact, as discussed in the following Section) to be acceptable compared to adopting a purely linear specification. Indeed, a purely additive specification would unrealistically assume that G i t shifts collected kilograms by a constant amount independently of the generated volume, while a model including only the interaction effect would impose the restrictive assumption that no waste is collected when G i t equals zero. Also, by including both the linear and interaction effect, the model allows for a baseline collection rate that is subsequently adjusted by behavioural awareness, providing a more structurally consistent representation of the decision process. This specification is also consistent with a behavioural interpretation in which awareness does not directly generate waste but rather influences the fraction of generated waste that individuals choose to properly dispose of.
We conclude by noting that Equation (2) incorporates seasonal dynamics through a Fourier representation based on the weekly time index w t . Specifically, the sine and cosine terms capture the first two harmonics of a periodic signal with annual frequency. Since the data are observed at a weekly frequency, seasonality is modelled at the same temporal resolution. The use of 52 in the denominator reflects the annual cycle expressed in weeks, while the second pair of sine and cosine terms allow for more flexible intra-annual seasonal patterns beyond a simple sinusoidal shape. From an interpretative perspective, the first harmonic captures the main annual cycle in textile disposal behaviour, while the second captures shorter-term intra-annual fluctuations. In this way, the model can represent multiple seasonal peaks within the year. The magnitude of these coefficients reflects the intensity of seasonal variations in terms of Potential kg, while their sign and phase determine the timing of those peaks. Overall, this harmonic specification provides a parsimonious and smooth representation of demand seasonality without introducing a full set of weekly dummy variables.

4.5. Model Diagnostic

Following the model specification, we conducted a set of diagnostic checks. All diagnostics are computed on the training period only (Year 1–2) using in-sample FE residuals. Specifically, we test for (i) heteroskedasticity, (ii) within-entity serial correlation, (iii) cross-sectional dependence, (iv) multicollinearity and (v) stationarity.
  • Heteroskedasticity. Breusch–Pagan and White tests reject homoskedasticity (LM and F versions: p < 0.001). Groupwise variance heteroskedasticity across bins is also detected (χ2 (151) = 706.69, p < 0.001).
  • Serial correlation (within-entity). A Wooldridge-style test on differenced FE residual indicates serial dependence (ρ = −0. 505, p < 0.001).
  • Cross-sectional dependence. Pesaran’s CD test rejects cross-sectional independence (CD = 19.96, p < 0.001), with an average residual correlation of approximately 0.026.
  • Multicollinearity. Variance inflation factors are close to unity for the control variables (seasonal sine/cosine terms), indicating no multicollinearity concerns for the temporal components. As expected, the primary regressors (i.e., g i t and the interaction effect c i t ) exhibit collinearity, reflected in moderately elevated VIF values (approximately 8.73). However, these values remain below conventional thresholds of concern, and the condition number (950.6) stays within commonly accepted diagnostic limits (≈1000). Overall, while some degree of multicollinearity is present, it does not appear to compromise the stability or interpretability of the estimated coefficients.
  • Stationarity. A Fisher-combined Augmented Dickey–Fuller test rejects the unit-root null for the key series (stat = 6589.1, p < 0.001), confirming the data is stationary and suitable for regression in levels.

Robustness Considerations

To address the detected heteroskedasticity and within-bin serial correlation, we utilize one-way cluster-robust standard errors (clustered by bin). While the primary coefficients remain directionally stable, the condition number (950.6) points to the presence of non-negligible multicollinearity, albeit still below commonly cited critical thresholds. Their statistical significance is therefore sensitive to the variance inflation inherent in clustered estimation. Consequently, we place greater emphasis on the sign, magnitude, and robustness of the estimates across alternative specifications, rather than relying exclusively on conventional p-value thresholds.

5. Results

In this section, we present the results of the proposed FE model and assess its performance against a set of benchmark specifications. Comparing the model to alternative approaches is essential not only to quantify potential predictive gains, but also to understand whether such improvements arise from explicitly modeling temporal dynamics, controlling for unobserved heterogeneity, or exploiting aggregate relationships among variables. To this end, we consider two benchmark models representing different forecasting philosophies, one naïve and one more structured.
Seasonal Mean. A simple reference model based exclusively on historical seasonal patterns. This specification provides a minimal-structure baseline, allowing us to evaluate the incremental value added by more sophisticated modeling choices. Seasonal averages are computed using both weekly and monthly aggregations.
Holt–Winters (HW) Exponential Smoothing. The method proposed by Winters [45] is widely used for forecasting time series with seasonal components. It offers a dynamic framework that incorporates both trend and seasonality through adaptive smoothing. Compared to the seasonal mean, the HW approach responds more effectively to recent changes in the data, providing a flexible yet relatively parsimonious alternative.
We first report the results obtained from the two seasonal mean specifications. We then compare the performance of the HW benchmark and the proposed FE model, evaluating both in-sample fit and out-of-sample forecasting accuracy.

5.1. Naïve Benchmark, the Seasonal Mean

The seasonal mean was computed as a benchmark for the main model over the same test horizon, using data aggregated at both weekly and monthly frequencies. Table 2 summarizes its performance. As expected, both benchmarks provide a simple but informative lower bound: they match total volumes (aggregated on all 145 bins) reasonably well, but their explanatory power at the row and bin level remains limited. The monthly seasonal mean performs slightly better in terms of R2, largely due to the smoothing introduced by coarser aggregation, yet this comes at the cost of substantially higher Symmetric Mean Absolute Percentage Error (sMAPE) on total volumes, indicating weaker responsiveness to short-term variation. Its performance deteriorates at more granular levels of variability, confirming its role as a simple baseline against which the FE model can demonstrate its added value.

5.2. Holt–Winters Benchmark

To benchmark the predictive performance of the Fixed Effects (FE) specification, we employ a seasonal Holt–Winters (HW) exponential smoothing model as a structured time-series reference. While HW is not claimed to be the optimal model for these data, it provides a parsimonious and widely recognised forecasting framework against which the added value of the panel-econometric approach can be assessed.
To identify the most appropriate model structure, a systematic model selection procedure was conducted, by considering additive versus multiplicative structures, the inclusion or exclusion of a trend component, and different seasonal periodicities. For each candidate specification, parameter tuning was performed automatically at the bin level. In particular, the smoothing parameters and seasonal coefficients were internally optimized by the statistical library employed (statsmodels v0.14.6 for Python v3.13.5), ensuring a data-driven calibration for each model.
Based on this assessment, the final specification adopts a 26-week seasonal frequency, a multiplicative seasonal formulation, and no trend component. This configuration ensures the presence of four complete seasonal cycles in the estimation window and provides a stable representation of seasonal dynamics across units in the panel and delivers the strongest predictive performance among the evaluated alternatives.
As reported in Table 3, predictive performance improves relative to the naïve benchmark; however, it remains modest, especially at the bin level, with low per-bin R2 values, especially for the macro mean (0.343). This issue reflects the heterogeneity of bin-specific dynamics and the challenge of modelling sparse or erratic series. Nonetheless, the aggregate forecast over the test period (1,578,986 kg) closely approximates the observed total (1,559,294 kg), with a sMAPE of 5.18% on weekly totals.
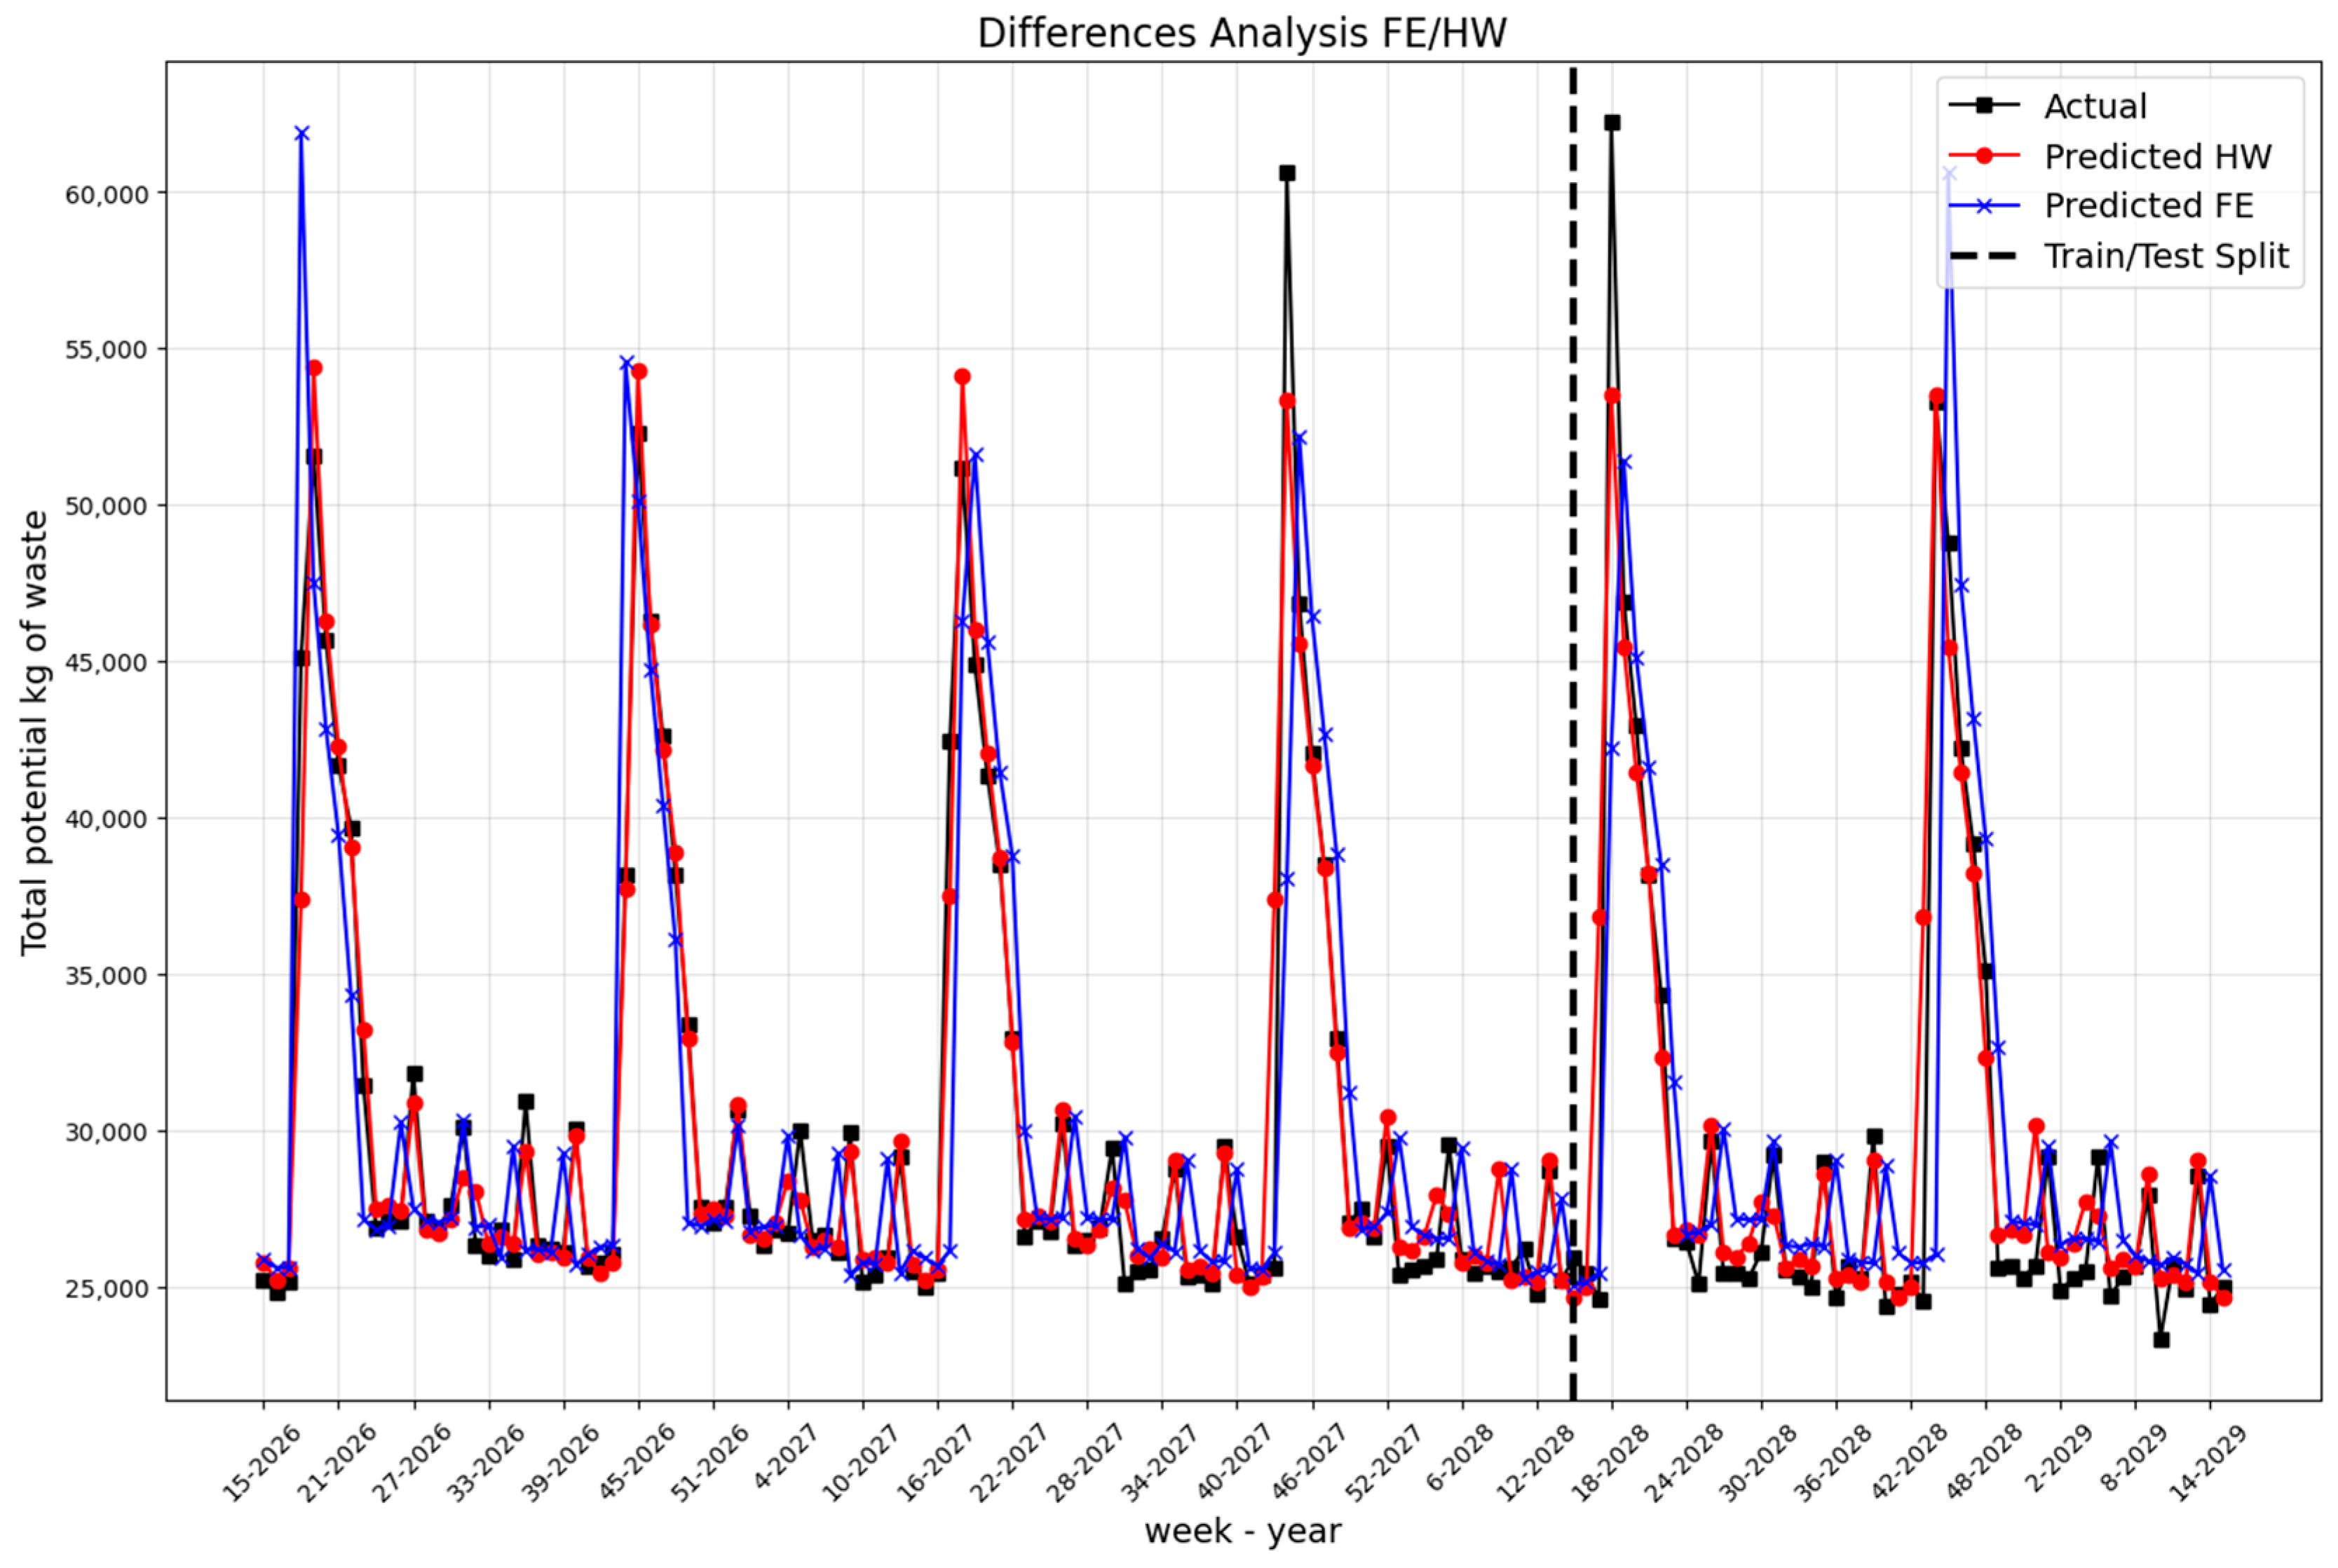
Data confirms that a simple forecasting approach such as HW is unable to accurately capture the pronounced peaks and valleys induced by the high variability of data (see Figure 2 in the next section). While the model struggles to anticipate abrupt fluctuations, these deviations are largely driven by behavioural variability in citizen disposal habits rather than structural seasonality. Peaks and troughs often reflect episodic events, such as household cleanouts or atypical usage patterns, introducing variability that cannot be captured by standard time-series models. Indeed, the seasonal component is captured with reasonable fidelity, as highlighted by the alignment between predicted and observed values in bins exhibiting stable rhythms. The forecasted curve tends to follow the general trajectory of the actual data, even when local deviations occur. This suggests that, despite behavioural noise, the model maintains a coherent representation of the underlying seasonal structure. In line with this, the global row-level R2 reaches 0.635 on the test set, indicating that the model can explain a substantial share of the overall variance despite localized irregularities.

5.3. FE Performances

In this section, we report the predictive performance of the FE model of Equation (2), whose parameters were estimated using the PanelOLS class from the linearmodels Python library, Estimations rely on the within estimator, which removes time-invariant characteristics of each bin during the estimation process. This approach ensures that the coefficients associated with the exogenous variables are identified exclusively from within-bin temporal variation.
The estimated coefficients are detailed in Table 4. As shown, both the coefficient associated with the generated quantity and that of the interaction effect are statistically significant.
The coefficient associated with the generated quantity is positive but markedly smaller than one. This indicates that, in the absence of behavioural awareness (i.e., when G i t 0 ), only a limited share of generated waste is directly translated into collected waste at the bin level. This result is consistent with the idea that, without environmental awareness, a substantial portion of textile waste is either improperly disposed of or diverted to alternative channels.
By contrast, the coefficient of the interaction effect between generated waste and GAw is positive and sizeable. This implies that behavioural awareness significantly increases the marginal effect of generated waste on collected waste, effectively raising the proportion of waste that is correctly directed to collection bins. In other words, GAw acts as a scaling factor that enhances the efficiency of the collection process.
More formally, since the marginal effect of generated waste on collected waste is given by β 1 + β 2 G i t , the positive sign of both coefficients ensures that higher waste generation always leads to higher collected quantities, while the magnitude of β 2 indicates that this relationship strengthens as awareness increases.
From a quantitative perspective, the estimated value of β 1 (0.0785) suggests that, in a fully unaware population, only about 7.85% of generated textile waste is collected. This can be interpreted as a baseline collection rate driven by structural factors such as bin availability or habitual disposal behaviour. The relatively large magnitude of β 2 (1.1158) indicates that awareness plays a dominant role in shaping disposal behaviour: even moderate increases in GAw lead to substantial improvements in the share of waste being properly collected. In practical terms, for every additional ton of generated waste, the minimum expected collected amount is approximately 78 kg in a fully non-environmentally oriented population (i.e., G i t = 0 ), and this amount increases progressively with higher levels of awareness (e.g., 29.5 kg, 57.4 kg, 85.3 for a GAw of 0.25, 0.5, and 0.75, respectively). This highlights that behavioural factors, rather than purely logistical constraints, are a key driver of collection performance.
The model’s predictive performance (evaluated using standard metrics) is presented in Table 5. As shown, predictive performance improves, relative to the HW benchmarks, especially at the bin level, with the macro-mean of the per bin R2 that increases from 0.343 to 0.642. Naturally, the difference is less pronounced at the aggregated level with the global R2 that increases from 0.958 to 0.981; yet, in predictive terms, the improvement remains substantial, as confirmed by the sMAPE value that decreases from 5.18% to 3.94%.
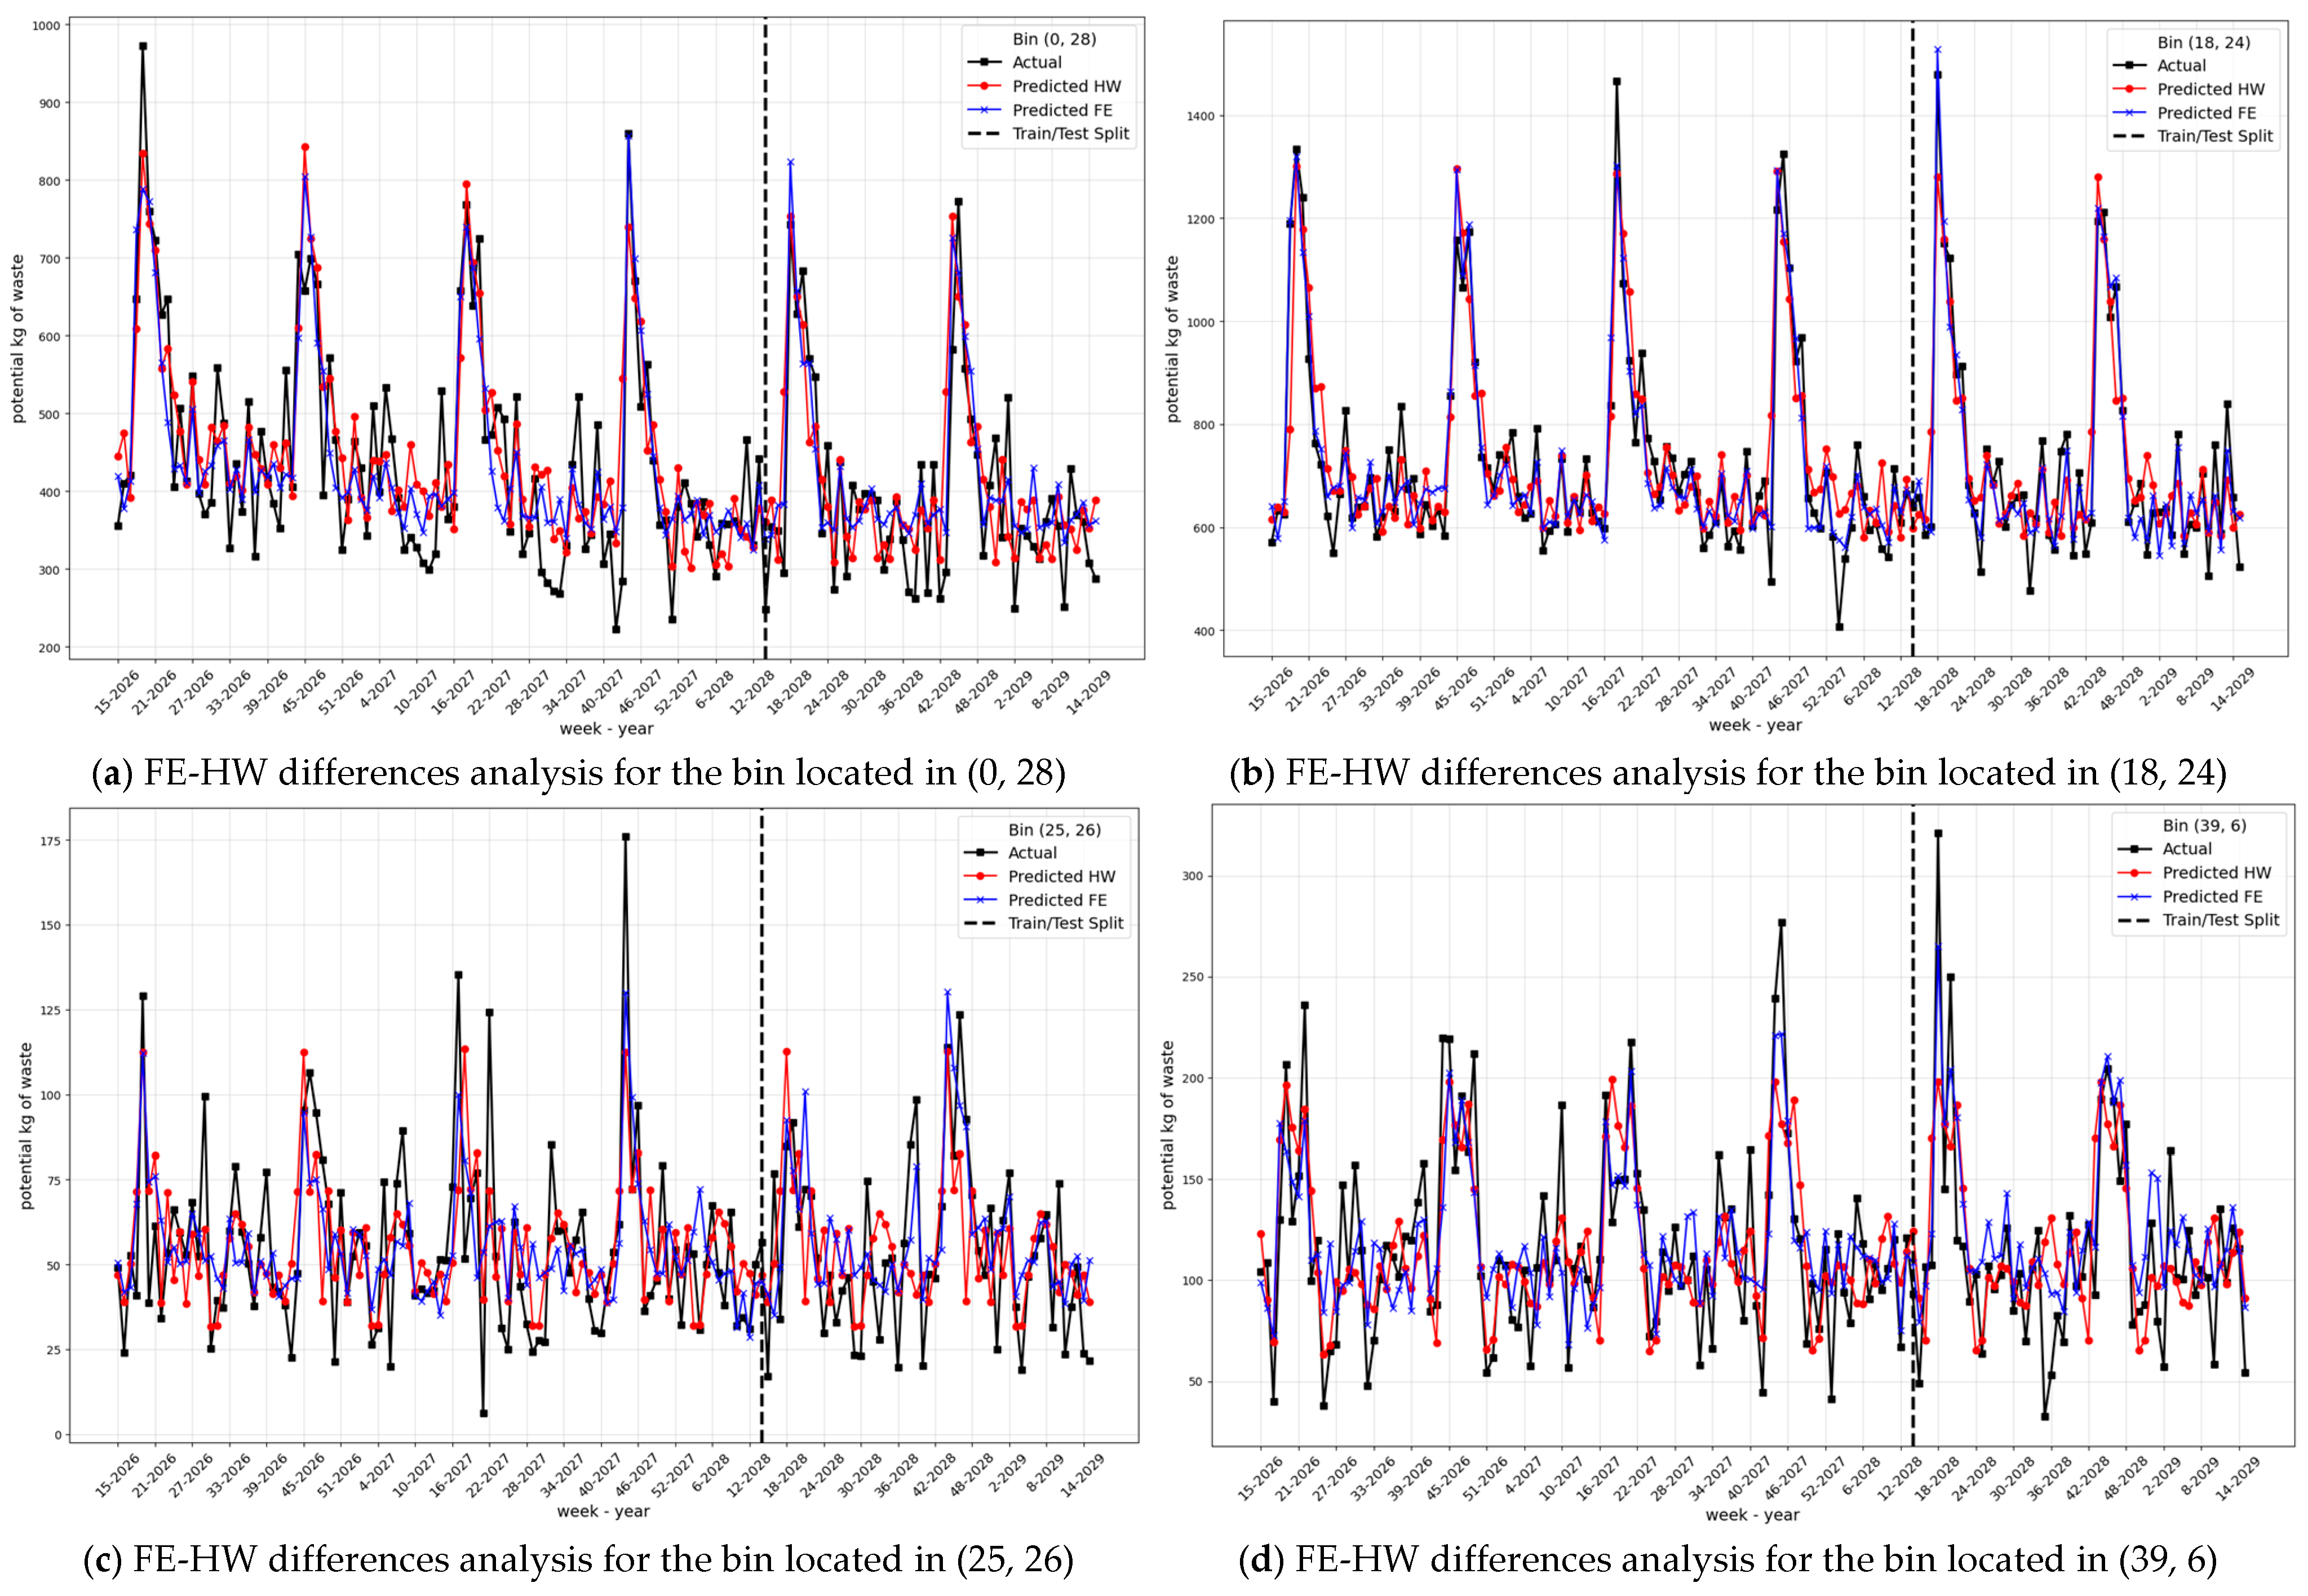
The results highlighted by the performance metrics are further corroborated by the graphical analysis of Figure 2, showing that the aggregated performances of both FE and HW are quite similar, yielding accurate and stable demand forecasts. However, when the analysis is conducted at the individual-bin level, as reported by Figure 3a–d, HW model’s performance declines markedly, revealing a greater difficulty in capturing local variability. This pattern reflects an inherent structural limitation of the method. The dataset exhibits substantial heterogeneity, whereas HW is a traditional forecasting technique tailored to relatively homogeneous and stable historical time series. Consequently, the model struggles to represent emerging dynamics driven by heterogeneous, agent-based behaviours, which reduces its ability to adapt to abrupt changes in the underlying process.
Figure 2. Comparison between FE and HW benchmark considering the quantity of all bins. The vertical dashed line denotes the transition between the training period (Years 1–2) and the testing period (Year 3).
Sustainability 18 03961 g002
Figure 3. Comparison between FE and HW benchmark on a bin-level considering 4 bins as sample.
Sustainability 18 03961 g003
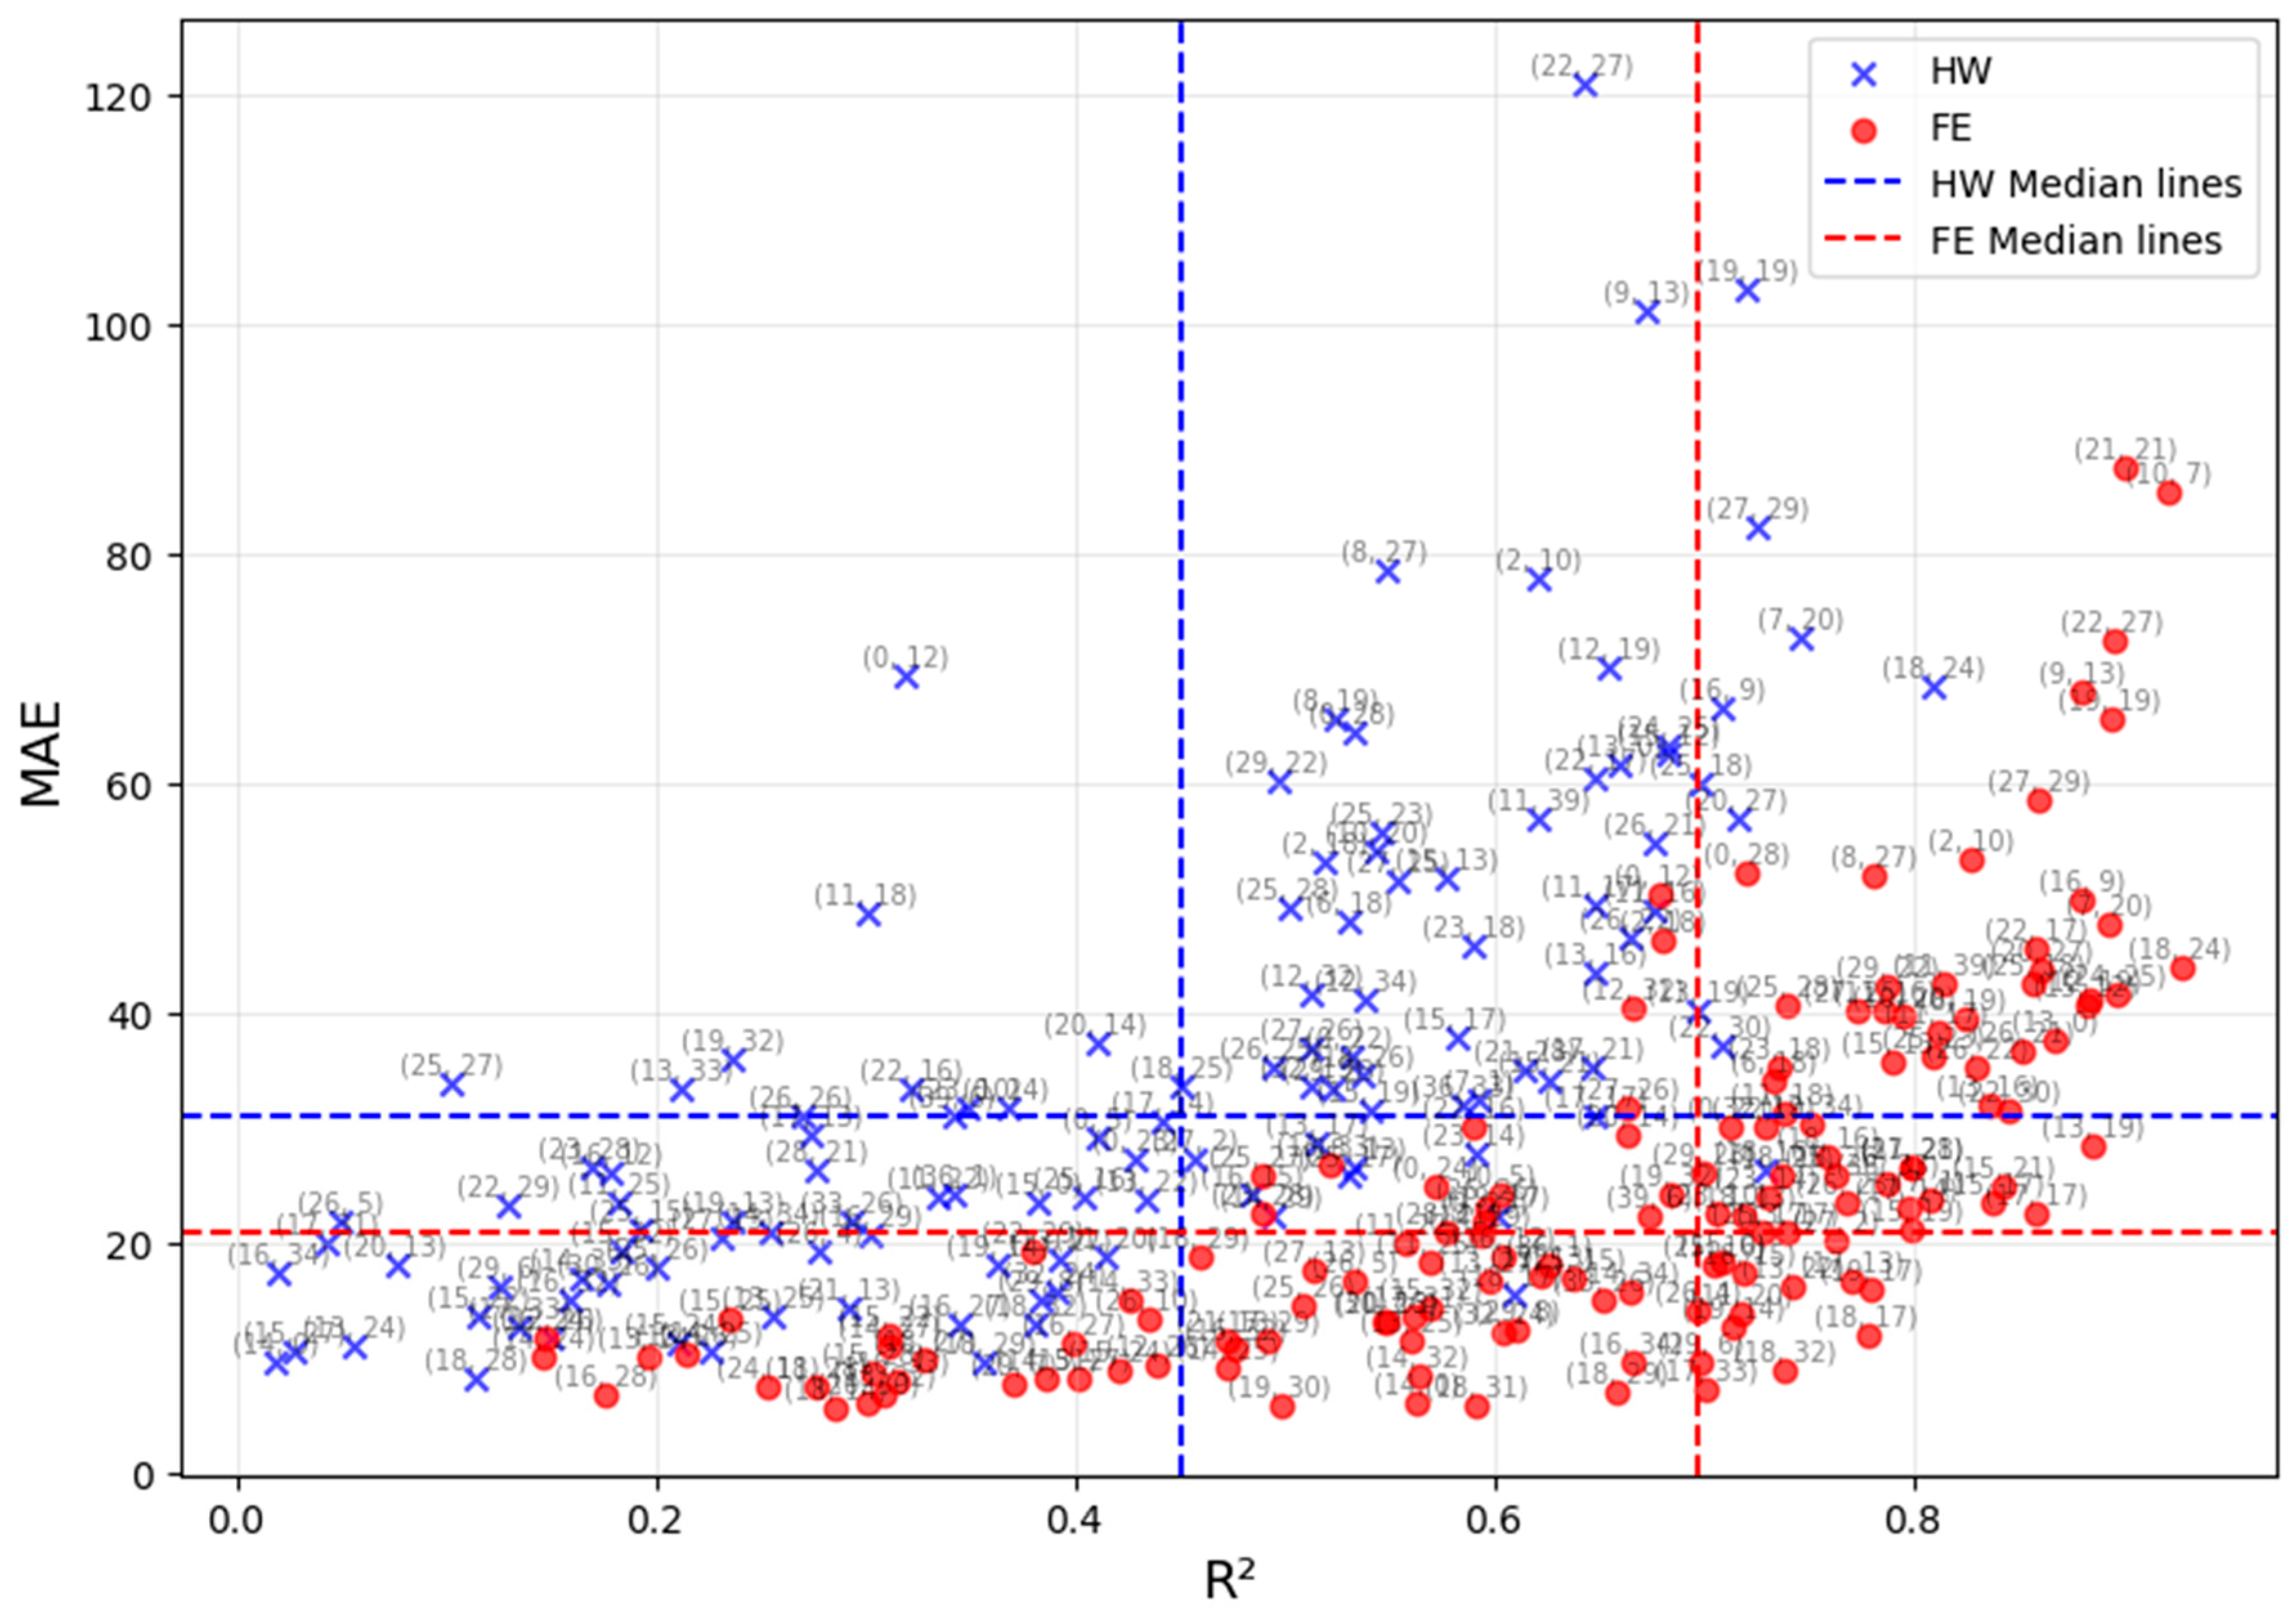
Lastly, Figure 4 illustrates a scatter plot presenting a comparison between the HW benchmark (in blue) with our FE model (in red) in terms of performances. Each point corresponds to a bin, whose coordinates are reported above in grey. As the FE model demonstrates clear statistical superiority over the HW benchmark, clustering significantly closer to the ideal bottom-right quadrant of the matrix, meaning that FE model consistently predicts both higher R2 and lower MAE across bins.
The FE model nearly doubles the explanatory power of the HW approach, achieving a median R2 of 0.81 compared to 0.48. Furthermore, the FE model significantly reduces predictive error (MAE ≈ 25 vs. ≈34), while maintaining a much tighter distribution that indicates greater reliability and consistency across all data bins.
These findings therefore underscore the importance of time-varying exogenous signals over simple auto-regressive properties. Indeed, the significant performance of delta suggests that waste generation is not merely a function of time, but a response to stochastic disposal events that univariate models cannot capture.

6. Discussion

6.1. Results Summary

The results of this study demonstrate that the proposed fixed-effects (FE) framework, applied to data generated through the HyTex simulation model, achieves strong and stable predictive performance in modelling urban textile waste collection. The model explains a substantial share of the observed variability both at the aggregate level and, more importantly, at the individual-bin level, where heterogeneity and behavioural dynamics are most pronounced.
With respect to RQ1, the findings provide a clear and affirmative answer. Urban textile waste collection can be effectively predicted when stable bin-level heterogeneity and time-varying socio-spatial and behavioural indicators are jointly incorporated into the predictive framework. The FE specification successfully isolates persistent, time-invariant characteristics of each collection point (such as accessibility, neighbourhood structure, and baseline participation culture) while simultaneously leveraging dynamic signals, including generated quantities and the Green Awareness (GAw) index. This combination proves essential in contexts where waste flows are shaped not only by structural infrastructure but also by evolving behavioural responses. The high explanatory power observed at the bin level confirms that textile waste generation is not governed solely by temporal regularities; instead, it emerges from localized and behaviour-sensitive dynamics that require models capable of controlling for heterogeneity.
Regarding RQ2, the comparison with traditional forecasting benchmarks highlights the structural advantages of the FE approach over univariate time-series methods. While the Holt–Winters (HW) benchmark captures aggregate seasonal patterns with reasonable accuracy, its performance deteriorates substantially at the individual-bin level.
This divergence reflects a fundamental methodological difference: HW relies exclusively on the historical trajectory of the dependent variable, whereas the FE model incorporates exogenous behavioural and operational regressors. The substantial increase in bin-level R2 and the consistent reduction in predictive errors indicate that modelling entity-specific heterogeneity is not merely a statistical refinement but a decisive factor in improving forecasting performance in heterogeneous urban systems. In other words, the predictive gains observed are attributable to the integration of behavioural and socio-spatial signals rather than to temporal smoothing alone. More broadly, the results underscore the importance of integrating behavioural modelling and econometric prediction in urban sustainability contexts. Textile waste collection systems are characterized by voluntary participation, spatial fragmentation, and fluctuating engagement levels. In such environments, models that explicitly account for heterogeneity and time-varying behavioural signals outperform purely autoregressive frameworks.

6.2. Practical Applicability and External Validity

Concerning the practical applicability of the model, its immediate transferability to different urban contexts cannot be assumed a priori. However, the modelling approach is grounded in structural mechanisms that are not unique to the case study, namely: persistent heterogeneity across collection points, and behaviour-driven variation in disposal decisions. These mechanisms are widely documented in urban waste management systems and provide a basis for conditional generalizability. Furthermore, the modelling framework has been deliberately designed so that its key predictors are, in principle, estimable in real-world applications. In particular, the two main regressors (i.e., the potential generated quantity and the behavioural indicator GAw, from which the combined effect c i t is derived), have been selected to ensure consistency between the simulated environment and plausible empirical settings, thereby enhancing the model’s external validity. In fact, the quantity of generated textile waste can be reasonably approximated by waste management operators as the sum of the amounts collected in dedicated textile bins and the volume disposed of in the residual waste stream. Although some measurement error may arise, such data are typically available through routine collection records and waste audits, making this variable empirically tractable. By contrast, GAw represents a latent behavioural trait and is inherently more difficult to observe directly; nevertheless, it can be proxied through structured surveys, questionnaire-based instruments, or composite indicators capturing citizens’ propensity toward sustainable behaviours. While such measures inevitably involve some approximation, they provide a feasible pathway for translating simulation inputs into observable real-world variables.
Notwithstanding these considerations, full transferability would require context-specific calibration, since the relative importance of behavioural, infrastructural, and seasonal drivers is inherently context-specific. In particular, applying the framework to a new urban setting would entail collecting or estimating the relevant data, re-running the simulation model to reflect local socio-spatial and behavioural conditions, and subsequently re-estimating the econometric relationships.

7. Conclusions, Limits and Future Research Directions

7.1. Main Findings

This study investigated whether urban textile waste collection can be effectively predicted by combining socio-spatial heterogeneity and behavioural dynamics within a fixed-effects (FE) econometric framework. Leveraging synthetic yet highly structured data generated by the Hybrid Textile simulation model, we demonstrate that textile waste collection demand can be anticipated with high accuracy (R2 ≈ 0.81; MAE ≈ 25) when bin-level recorded quantities are integrated with time-varying behavioural signals.
The main contribution of this work lies in highlighting the critical role of socio-spatial and behavioural regressors in explaining and predicting textile waste flows. The proposed FE model substantially outperforms traditional univariate time-series benchmarks such as Holt–Winters, showing that textile waste dynamics cannot be adequately captured by seasonal or historical patterns alone. Instead, behavioural factors, proxied by GAw, emerge as essential drivers of collection outcomes, without which reliable estimation would not be achievable. By explicitly controlling for time-invariant bin characteristics and incorporating dynamic behavioural indicators, the FE approach captures both structural and stochastic components of demand that remain inaccessible to purely autoregressive models.

7.2. Practical Implications

From a methodological perspective, the study contributes to the literature by demonstrating the suitability of panel-data econometrics for modelling behaviour-sensitive waste streams, particularly when combined with simulation-based data generation. Also, from a managerial and policy standpoint, these findings underscore the importance of actively monitoring and influencing behavioural drivers such as GAw. Municipal waste managers could use predictive frameworks of this type to dynamically allocate collection resources, anticipate bin saturation risks, and optimize routing schedules at a granular spatial scale. More importantly, the explicit inclusion of behavioural indicators enables the identification of areas with low participation, supporting targeted interventions aimed at increasing citizens’ environmental awareness and engagement. In this sense, policies designed to enhance GAw, such as information campaigns, nudging strategies, or community-based initiatives, may have a direct and measurable impact on system performance, and consequently on sustainability. Specifically, improving participation in separate textile collection increases the quantities properly intercepted, thereby reducing disposal in residual waste streams and landfill, while simultaneously enhancing opportunities for reuse, recycling as secondary raw materials, or energy recovery through controlled incineration. Furthermore, simulation-informed predictive models can support scenario analysis, allowing policymakers to assess the effects of infrastructure expansion, incentive schemes, or service adjustments prior to implementation. By improving both the accuracy of predictions and the understanding of underlying behavioural mechanisms, such approaches can enhance the responsiveness and effectiveness of textile waste collection systems, strengthen downstream recycling processes, and ultimately support the transition toward more circular urban systems.

7.3. Limitations and Future Research Directions

Despite these contributions, some limitations must be acknowledged. First, the empirical analysis relies on data generated by the Hybrid Textile simulation model rather than on observed real-world longitudinal collection records. Although the simulation is calibrated on a real municipal context and incorporates realistic behavioural and operational mechanisms, it inevitably abstracts from institutional, cultural, and organizational complexities present in actual systems. Consequently, the estimated coefficients should be interpreted primarily as a proof of concept rather than as directly transferable quantitative effects. Second, the analysis focuses on a single municipal context, which limits the external validity of the findings across different demographic, infrastructural, and institutional settings. As discussed in Section 6.2, the proposed framework should not be interpreted as directly transferable across contexts without appropriate calibration, since the relative importance of behavioural, infrastructural, and seasonal drivers is inherently context-specific. At the same time, the modelling approach is grounded in structural mechanisms that are not unique to the case study. Therefore, while full transferability cannot be assumed, the framework can be operationalized in real-world applications through a structured procedure, which could be organized in three steps. First, bin-level panel data can be reconstructed by combining collection records (deposited quantities), residual waste audits (to approximate generated waste), and spatial data (to define bin catchment areas). Second, behavioural indicators analogous to GAw can be approximated using survey-based measures, participation rates, or proxy variables capturing user behaviour, such as how frequently bins are used or the level of contamination in collected materials. Third, the econometric model can be re-estimated using these inputs, allowing the identification of context-specific coefficients while preserving the structure of the specification. Building on this implementation, future research should validate the proposed framework using real-world longitudinal datasets in order to further assess its external validity and scalability across different urban contexts. Such validation would allow testing the stability of the estimated coefficients, or at least the robustness of the behavioural effect captured by GAw.
In addition, machine learning approaches could be integrated to explore potential nonlinearities and interaction effects that may not be fully captured by the econometric specification. Further research could also extend the framework to other waste fractions, such as plastics or organic waste, to assess whether behaviour-driven predictive structures are specific to textile streams or represent a broader feature of voluntary recycling systems. Finally, linking predictive accuracy to measurable environmental outcomes, such as avoided emissions, increased recycling rates, or improved material recovery, would strengthen the connection between forecasting performance and sustainability impact, thereby reinforcing the strategic value of predictive analytics within circular economy governance.

Supplementary Materials

The full code of both the Holt–Winters benchmark and the Fixed Effects model is available on git-hub at: https://github.com/Nicolosi-D-P/Predicting_Urban_Textile_Waste_Generation (accessed on 12 April 2026). The dataset comprising the panel data for our forecast analysis (i.e., seasonal mean, Holt–Winters and Fixed Effects) can be downloaded at: https://doi.org/10.17632/vj9txr4cgz (accessed on 12 April 2026).

Author Contributions

Conceptualization, F.Z., F.M. and A.P.; Methodology, F.Z. and F.M.; Software, F.Z. and D.P.N.; Validation, F.M.; Formal analysis, D.P.N.; Investigation, F.M.; Data curation, D.P.N.; Writing–original draft, F.M., D.P.N. and B.P.; Writing–review & editing, F.Z., B.P. and A.P.; Visualization, D.P.N. and B.P.; Supervision, F.Z. and A.P. All authors have read and agreed to the published version of the manuscript.

Funding

This research was funded by the European Union and the Italian Ministry of University and Research through the project SusTex: Sustainable Textile, Id 2022X2788M, Grant number D53D23011410006.

Institutional Review Board Statement

Not applicable.

Informed Consent Statement

Not applicable.

Data Availability Statement

The raw data supporting the conclusions of this article will be made available by the authors on request.

Conflicts of Interest

The authors declare no conflict of interest.

References

  1. Moazzem, S.; Crossin, E.; Daver, F.; Wang, L. Environmental impact of apparel supply chain and textile products. Environ. Dev. Sustain. 2022, 24, 9757–9775. [Google Scholar] [CrossRef] [Scilit]
  2. Muthu, S.S. Assessing the Environmental Impact of Textiles and the Clothing Supply Chain; Woodhead Publishing: Cambridge, UK, 2020. [Google Scholar]
  3. Castellano, D.; Mercogliano, N.; Moroni, F.; Romagnoli, G.; Viola, A. From Linear to Circular: Proposing a Model for Textile Supply Chain Transition. In Proceedings of the Summer School Francesco Turco, Otranto, Italy, 11–13 September 2024. [Google Scholar]
  4. Bick, R.; Halsey, E.; Ekenga, C.C. The global environmental injustice of fast fashion. Environ. Health 2018, 17, 92. [Google Scholar] [CrossRef] [Scilit]
  5. Moroni, F.; Viola, A.; Gallo, M.; Romagnoli, G.; Zammori, F. Do We Really Need Simulation for a Transition Towards Circular Supply Chain Management? A Possible Answer from Scientific Literature. IFIP Adv. Inf. Commun. Technol. 2024, 727, 414–428. [Google Scholar] [CrossRef] [Scilit]
  6. Frank, A.G.; Dalenogare, L.S.; Ayala, N.F. Industry 4.0 technologies: Implementation patterns in manufacturing companies. Int. J. Prod. Econ. 2019, 210, 15–26. [Google Scholar] [CrossRef] [Scilit]
  7. Bottani, E.; Falcomer, M.T.B.; Monferdini, L. Evolution of Industry 4.0 in the Fashion Sector: A Comparative Analysis Before and After COVID-19. Procedia Comput. Sci. 2025, 253, 2889–2898. [Google Scholar] [CrossRef] [Scilit]
  8. Özen, İ.; Bahtiyari, M.İ.; Demiryürek, O.; Shirvanimoghaddam, K.; Ramakrishna, S.; Naebe, M. Sustainable Production Applications on Textile-to-Textile Recycling of Pre-consumer Textile Waste in Light of Emerging Trends. Fibers Polym. 2025, 26, 4691–4714. [Google Scholar] [CrossRef] [Scilit]
  9. Bour, A.; Christensen, T.B.; Hunka, A.D.; Palmqvist, A.; Skjold, E.; Syberg, K. Implications of circular textile policies for the future regulation of hazardous substances in textiles in the European Union. Sci. Total Environ. 2023, 896, 165153. [Google Scholar] [CrossRef] [Scilit]
  10. Ghisellini, P.; Cialani, C.; Ulgiati, S. A review on circular economy: The expected transition to a balanced interplay of environmental and economic systems. J. Clean. Prod. 2016, 114, 11–32. [Google Scholar] [CrossRef] [Scilit]
  11. Wojnowska-Baryła, I.; Bernat, K.; Zaborowska, M.; Kulikowska, M. The Growing Problem of Textile Waste Generation—The Current State of Textile Waste Management. Energies 2024, 17, 1528. [Google Scholar] [CrossRef] [Scilit]
  12. Nencková, L.; Pecáková, I.; Sauer, P. Disposal behaviour of Czech consumers towards textile products. Waste Manag. 2020, 106, 71–76. [Google Scholar] [CrossRef] [Scilit]
  13. Fontaine, L.; Legros, R.; Frayret, J.M. Sustainability and Environmental Performance in Selective Collection of Residual Materials: Impact of Modulating Citizen Participation Through Policy and Incentive Implementation. Resources 2024, 13, 151. [Google Scholar] [CrossRef] [Scilit]
  14. Meng, X.; Wen, Z.; Qian, Y. Multi agent-based simulation for household solid waste recycling behavior. Resour. Conserv. Recycl. 2018, 128, 535–545. [Google Scholar] [CrossRef] [Scilit]
  15. Walzberg, J.; Sethuraman, S.; Ghosh, T.; Uekert, T.; Carpenter, A. Think before you throw! An analysis of behavioral interventions targeting PET bottle recycling in the United States. Energy Res. Soc. Sci. 2023, 100, 103116. [Google Scholar] [CrossRef] [Scilit]
  16. Moroni, F.; Gallo, M.; Romagnoli, G.; Zammori, F. License to Simulate: When Agent-Based Models Are More Fiction Than Function. Appl. Sci. 2025, 15, 7486. [Google Scholar] [CrossRef] [Scilit]
  17. Devetak, T.; Pavko Čuden, A. Sustainable Fashion in Slovenia: Circular Economy Strategies, Design Processes, and Regional Innovation. Sustainability 2025, 17, 8890. [Google Scholar] [CrossRef] [Scilit]
  18. Tebaldi, L.; Brun, A.; Bottani, E. Evidences on sustainability issues in the Fashion Supply Chain: An empirical study in Italy. Sustain. Prod. Consum. 2022, 33, 651–663. [Google Scholar] [CrossRef] [Scilit]
  19. Zammori, F.; Romagnoli, G.; Nicolosi, D.P.; Moroni, F. Hybrid Simulation of Textile Waste Collection in the city of Parma: Modelling citizen behaviour and system logistics and policy incentives. Procedia Comput. Sci. 2025, 274, 731–741. [Google Scholar] [CrossRef] [Scilit]
  20. Ribeiro-Rodrigues, E.; Bortoleto, A.P. A systematic review of agent-based modeling and simulation applications for analyzing pro-environmental behaviors. Sustain. Prod. Consum. 2024, 47, 343–362. [Google Scholar] [CrossRef] [Scilit]
  21. Beigl, P.; Lebersorger, S.; Salhofer, S. Modelling municipal solid waste generation: A review. Waste Manag. 2008, 28, 200–214. [Google Scholar] [CrossRef] [Scilit] [PubMed]
  22. Kolekar, K.A.; Hazra, T.; Chakrabarty, S.N. A review on prediction of municipal solid waste generation models. Procedia Environ. Sci. 2016, 35, 238–244. [Google Scholar] [CrossRef] [Scilit]
  23. Abbasi, M.; El Hanandeh, A. Forecasting municipal solid waste generation using artificial intelligence modelling approaches. Waste Manag. 2016, 56, 13–22. [Google Scholar] [CrossRef] [Scilit]
  24. Palm, D.; Elander, M.; Watson, D.; Kiørboe, N.; Salmenperä, H.; Dahlbo, H.; Rydberg, T. Towards a Nordic Textile Strategy: Collection, Sorting, Reuse and Recycling of Textiles; Nordic Council of Ministers: Copenhagen, Denmark, 2014.
  25. Sandin, G.; Peters, G.M. Environmental impact of textile reuse and recycling-A review. J. Clean. Prod. 2018, 184, 353–365. [Google Scholar] [CrossRef] [Scilit]
  26. Jäämaa, L.; Kaipia, R. The first mile problem in the circular economy supply chains Collecting recyclable textiles from consumers. Waste Manag. 2022, 141, 173–182. [Google Scholar] [CrossRef] [Scilit]
  27. Johnson, N.E.; Ianiuk, O.; Cazap, D.; Liu, L.; Starobin, D.; Doblre, G.; Ghandehari, M. Patterns of waste generation: A gradient boosting model for short term waste prediction in New York city. Waste Manag. 2017, 62, 3–11. [Google Scholar] [CrossRef] [Scilit] [PubMed]
  28. Atik, C.; Kut, A.; Birant, D.; Birol, S. Prediction of cloth waste using machine learning methods in the textile industry. In Proceedings of the 9th International Conference of Electrical and Electronics Engineering (ICEEE), Alanya, Turkey, 29–31 March 2022. [Google Scholar]
  29. European Commission. A New Circular Economy Action Plan: For a Cleaner and More Competitive Europe; COM(2020) 98; European Commission: Brussels, Belgium, 2020. [Google Scholar]
  30. Spangenberg, J.H. Environmental space and the prism of sustainability: Frameworks for indicators measuring sustainable development. Ecol. Indic. 2002, 2, 295–309. [Google Scholar] [CrossRef] [Scilit]
  31. Zammori, F.; Moroni, F.; Romagnoli, G. Modelling the Behavioural Side of Textile Waste Collection: From Individual Habits to Systemic Design. Information 2025, 16, 716. [Google Scholar] [CrossRef] [Scilit]
  32. Moroni, F.; Occhiocupo, N.; Romagnoli, G.; Tebaldi, L. Factors affecting consumer willingness to adopt sustainable practices in textile recycling. In Proceedings of the Summer School Francesco Turco, Lecce, Italy, 10–12 September 2025. [Google Scholar]
  33. Wooldridge, J.M. Econometric Analysis of Cross Section and Panel Data; MIT Press: Cambridge, MA, USA, 2010. [Google Scholar]
  34. Greene, W.H. Econometric Analysis/Limdep Users Manual; Prentice Hall: Upper Saddle River, NJ, USA, 2018. [Google Scholar]
  35. Nikolopoulou, A.; Ierapetritou, M.G. Optimal design of sustainable chemical processes and supply chains: A review. Comput. Chem. Eng. 2012, 44, 94–103. [Google Scholar] [CrossRef] [Scilit]
  36. Canay, I.A. A simple approach to quantile regression for panel data. Econ. J. 2011, 14, 368–386. [Google Scholar] [CrossRef] [Scilit]
  37. Hansen, B. Econometrics; Princeton University Press: Princeton, NJ, USA, 2022. [Google Scholar]
  38. Angrist, J.D.; Pischke, J.S. Mostly Harmless Econometrics: An Empiricist’s Companion; Princeton University Press: Princeton, NJ, USA, 2009. [Google Scholar]
  39. Hastie, T. The Elements of Statistical Learning: Data Mining, Inference, and Prediction; Springer: New York, NY, USA, 2009. [Google Scholar]
  40. Hsiao, C. Analysis of Panel Data; Cambridge University Press: Cambridge, UK, 2022. [Google Scholar]
  41. Baltagi, B.H.; Bresson, G.; Pirotte, A. Fixed effects, random effects or Hausman-Taylor?: A pretest estimator. Econ. Lett. 2003, 79, 361–369. [Google Scholar] [CrossRef] [Scilit]
  42. Hamiye Beyaztas, B.; Bandyopadhyay, S. Robust estimation for linear panel data models. Stat. Med. 2020, 39, 4421–4438. [Google Scholar] [CrossRef] [Scilit] [PubMed]
  43. Santamaría, E.C. Terrorism and tourism: Evidences from a panel OLS estimation. Rev. Econ. Financ. 2021, 19, 107–115. [Google Scholar] [CrossRef] [Scilit]
  44. Debarsy, N. The Mundlak approach in the spatial Durbin panel data model. Spat. Econ. Anal. 2012, 7, 109–131. [Google Scholar] [CrossRef] [Scilit]
  45. Winters, P.R. Forecasting sales by exponentially weighted moving averages. Manag. Sci. 1960, 6, 324–342. [Google Scholar] [CrossRef] [Scilit]
Figure 1. Example of the model evolution over time. (a) Monthly waste generated per node, shown with a red gradient reflecting quantity. (b) Monthly waste delivered to each mapped collection bin (red squares), with colour intensity proportional to volume. Neighborhood are depicted with different colours.
Sustainability 18 03961 g001
Figure 4. Scatter plot showing the performance, in terms of R2 and Mean Absolute Error (MAE), of the FE PanelOLS model (in red) compared to the HW ExponentialSmoothing function (in blue).
Sustainability 18 03961 g004
Table 1. Extract of the Panel analysed.
Bin
( i )
Week-Id
( w t )
Potential kg ( y i t )Generated kg
( g i t )
Average GAw
( G i t )
(0, 12)01—Year 1158.36685.660.240
(0, 12)
(0, 12)52—Year 4421.07662.060.333
(11, 22)01—Year 140.7136.010.301
(11, 22)
(11, 22)52—Year 375.11130.860.501
Table 2. Seasonal Means metrics.
Metric Seasonal MeansWeekly ForecastMonthly Forecast
Total kg—Actual1,647,5301,559,294
Total kg—Predicted1,628,2761,632,070
Number of Rows76851885
R2 (row-level)—Global0.950.921
Per-bin R2—macro mean0.2150.406
Per-bin R2—variance-weighted0.6050.522
Per-bin R2—volume-weighted0.5020.511
RMSE (row-level)58.62315.5
MAE (row-level)36.7167.7
sMAPE (totals)5.79%18.75%
Table 3. HW using Exponential-Smoothing—main metrics (Year 1–3).
HW MetricTraining PeriodTesting Period
Total kg—actual3,176,1721,559,294
Total kg—predicted3,186,1951,578,986
Number of Rows15,2257685
R2 (row-level)—Global0.970.958
Per-bin R2—macro mean0.5590.343
Per-bin R2—variance-weighted0.780.656
Per-bin R2—volume-weighted0.710.574
RMSE (row-level)42.554.7
MAE (row-level)26.833.6
sMAPE (weekly totals)2.24%5.18%
Table 4. FE on train data—Coefficients (one-way clustered SE).
Variableβ-Coefficientp-Value95% CI
Generated kg ( g i t )0.0785 (0.027)<0.003 **[0.026, 0.131]
Interaction effect ( c i t )1.1158 (0.048)<0.001 ***[1.021, 1.211]
1st Harmonic (Sin)−1.317 (0.275)<0.001 ***[−1.857, −0.777]
1st Harmonic (Cos)−0.747 (0.354)<0.003 **[−1.442, −0.052]
2nd Harmonic (Sin)0.038 (0.454)0.933[−0.853, 0.925]
2nd Harmonic (Cos)5.063 (0.665)<0.001 ***[3.760, 6.367]
Note: Standard errors are in parentheses. Significance: p < 0.01 **; p < 0.001 ***.
Table 5. FE using PanelOLS—main metrics (Year 1–3).
MetricTraining PeriodTesting Period
Total kg—actual3,176,1721,559,294
Total kg—predicted3,176,1721,615,742
Number of Rows15,2257685
R2 (row-level)—Global0.9830.981
Per-bin R2—macro mean0.5970.642
Per-bin R2—variance-weighted0.8390.844
Per-bin R2—volume-weighted0.7720.790
RMSE (row-level)36.3836.84
MAE (row-level)24.2624.68
sMAPE (weekly totals)1.65%3.94%
Disclaimer/Publisher’s Note: The statements, opinions and data contained in all publications are solely those of the individual author(s) and contributor(s) and not of MDPI and/or the editor(s). MDPI and/or the editor(s) disclaim responsibility for any injury to people or property resulting from any ideas, methods, instructions or products referred to in the content.