Article

Toward Sustainable Impact of Farm Input Subsidies in Malawi: Is Integration with Climate-Smart Agriculture a Practical Solution?

by
Samson Pilanazo Katengeza
1,*,
Kumbukani Rashid
1,
Sarah Tione
1,
Stein Terje Holden
2 and
Mesfin Tilahun
2
1
Department of Agricultural and Applied Economics, Lilongwe University of Agriculture and Natural Resources, Lilongwe P.O. Box 219, Malawi
2
School of Economics and Business, Norwegian University of Life Sciences, 1432 Ås, Norway
*
Author to whom correspondence should be addressed.
Sustainability 2026, 18(8), 3929; https://doi.org/10.3390/su18083929
Submission received: 24 February 2026 / Revised: 21 March 2026 / Accepted: 26 March 2026 / Published: 15 April 2026

Abstract

Decades of traditional fertilizer subsidies have yielded modest maize productivity gains for Malawian farmers, mainly due to the twin challenges of soil degradation and intermittent weather patterns. Increasing nitrogen intake through subsidies without addressing these structural constraints has failed to close the country’s yield gap. Although climate-smart agriculture (CSA) technologies offer options for sustainable productivity growth, low and inconsistent adoption among farmers has led to insufficient evidence. Most existing studies that have examined the complementarity between CSA and inorganic fertilizers rely on experimental plot data, with limited evidence from actual farmer-managed fields. We use farm-level data collected in 2022 from 307 smallholder farmers across central and southern Malawi to investigate whether integrating CSA technologies with subsidized inorganic fertilizers enhances maize productivity. We apply the Inverse Probability Weighted Regression Adjustment (IPWRA) model to estimate the effects of CSA adoption and its integration with subsidized fertilizer. Results indicate that CSA adoption increased maize yields by 30%, confirming significant productivity gains from technologies such as mulching, agroforestry, and organic manure. However, integrating these technologies with subsidized fertilizers produced no additional yield advantage, suggesting that farmers often substitute CSA with inorganic inputs rather than combining them effectively. These findings imply that the potential synergies between CSA and subsidy programs remain unrealized under current practices. Policy reforms under Malawi’s current farm input subsidy program (FISP) should therefore emphasize extension and incentive mechanisms that promote complementary—not substitutive—use of CSA technologies and fertilizers at recommended application rates.

1. Introduction

Maize is Malawi’s dominant staple crop and the cornerstone of national food security. It is grown by 94.6% of smallholder farmers, accounts for more than 61% of the arable land under staples [1], and provides over two-thirds of the country’s caloric intake [2]. Despite its central role in food security, smallholder maize productivity in Malawi remains very low, averaging 1.5 tons/ha [1] against a potential of 10 tons/ha [3]. Decades of large-scale public expenditure on agricultural input subsidies have delivered limited gains [4], and food insecurity continues to rise [5]. Mounting evidence suggests that the effectiveness of the subsidized inputs on maize productivity is hindered by the country’s poor soil conditions, which inhibit efficient nitrogen uptake by the crop [6,7,8]. At the same time, the country continues to face recurrent weather hazards, especially in-season dry spells [9,10,11]. Such weather shocks increase agricultural production risks, causing perpetual food insecurity and poverty. Failure by farm households to adapt to such weather events worsens negative effects, inhibits investment and economic growth [12,13], and further exacerbates the dismal performance of farm input subsidies. While these subsidies remain policy options for sustainable national food self-sufficiency, the odd mismatch between national investment and national output casts doubts on their ability to achieve this national goal. Thus, increasing nitrogen intake through farm input subsidies without first addressing these structural constraints does not solve the problem of poor crop productivity.
Investing in agricultural production methods that boost farmers’ resilience against weather shocks while also addressing soil fertility issues is one important avenue to reduce negative impacts and increase crop productivity [14]. These production methods also present a great opportunity for unlocking the benefits of farm input subsidies. The National Agriculture Policy [15] identifies climate-smart agriculture (CSA) as one of the methods that addresses the twin challenges of poor soil conditions and climate change and simultaneously achieves sustainable increases in agricultural productivity and income. CSA is defined as “agriculture that sustainably increases productivity and resilience (adaptation), reduces/removes greenhouse gases (mitigation), and enhances achievement of national food security and development goals” [16]. The literature provides evidence supporting CSA technologies as effective approaches to reduce downside yield risk while also transforming and reorienting agriculture in the face of climate change challenges [17]. CSA has the capacity to increase farm productivity and incomes and reduce yield variability while enhancing farm households’ resilience to climate change [18]. Thus, while input subsidies increase nitrogen usage, CSA technologies address soil conditions and climate change challenges, thereby increasing crop–fertilizer response rates.
The common CSA technologies in Malawi can be grouped into seven categories: (1) soil management, (2) crop management, (3) water management, (4) livestock management, (5) forestry, (6) fisheries and aquaculture, and (7) energy management [19]. Practices under soil management improve soil conditions through restoration of nutrients, water, and microbial activities. These include conservation agriculture (CA), agroforestry, inorganic and organic fertilizers, and water harvesting and efficient irrigation methods (e.g., drip irrigation). Other CSA activities, such as improved crop varieties (early maturing, drought-resistant, high-yielding), intercropping, and crop diversification, are common adaptation practices.
Agroforestry, which involves trees that provide fertilizer, fruit, fuelwood, and fodder, is another important practice benefiting not only crops but also livestock. Common agroforestry legume species include Cajanus cajan, Faidherbia albida, Gliricidia sepium, Sesbania sesban, and Tephrosia vogeli. Some agroforestry shrubs are intercropped with food crops such as maize to improve soil cover, organic matter, and water infiltration and have the capacity to control soil erosion. Integrated soil fertility management (ISFM) is another important practice used to address soil loss and prevent macro- and micro-nutrient deficiencies in the soils. ISFM involves the use of agroforestry, the incorporation of organic matter (mulch, compost, crop residue, and green manure), and the use of inorganic fertilizer [19].
Empirical evidence indicates that conditioning the access of farm input subsidies to the adoption of soil fertility-improving and climate-smart technologies could be an effective way to enhance the productivity gains of input subsidies, especially in the context of declining soil fertility and intermittent rainfall patterns [14,20]. For example, refs. [21,22] reported that maize yield was, respectively, 750, 1000, and 2000 kg/ha higher in plots with inorganic fertilizer, organic fertilizer and combined inorganic and organic fertilizer compared to plots without any fertilizer. A review by [23] showed that maize yields were, respectively, 6.5 Mg/ha and 6.9 Mg/ha when inorganic fertilizer and organic fertilizer were used alone, while the integration of organic and inorganic fertilizers yielded a maximum of 7.5 Mg/ha. Household survey data [24] revealed that use of integrated soil fertility management (ISFM), where organic and inorganic fertilizers were combined, resulted in higher technical efficiency (91%) than sole usage of inorganic fertilizer (79%). A related on-farm study by [25] showed that application of organic resources, inorganic fertilizer, and integration of organic and inorganic fertilizer, respectively, increased maize yield by 60%, 84%, and 114%. In the Machinga district, Mbeya fertilizer, a local organic and inorganic soil amendment CSA technology, improved maize yield by 19% compared to the conventional farmer practices [26].
This policy option, however, raises an interesting question: to what extent can complementary CSA technologies enhance the maize productivity impacts of inorganic fertilizers? Previous studies have addressed this question using data from experimental plots [23,27,28], with very few using farmer-managed fields [25,26]. Nonetheless, an analysis of empirical data from the actual fields of smallholder farmers could provide more comprehensive evidence of the practical relationship between CSA, fertilizer subsidies, and smallholder maize productivity.
Interestingly, for Malawi, the adoption of CSA technologies among smallholder farmers is another milestone yet to be achieved [20,29,30]. In Zomba, for example, ref. [31] found only a 26% adoption rate of CSA technologies. This raises the question of whether CSA technologies are indeed effective adaptation measures in the specific context of Malawian smallholder farmers and, if so, whether the input subsidy program can be leveraged to enhance the adoption of a wider range of CSA technologies among smallholder farmers in Malawi.
Using data from smallholder farmer-managed fields, we examine the impacts of integrating CSA technologies with subsidized inorganic fertilizers on maize productivity. While most existing evidence on CSA and fertilizer complementarity comes from experimental plots [23,27,28], there is limited evidence from actual farmer-managed conditions [25,26]. This study contributes to the literature by evaluating this relationship using field-level data from smallholder farmers. The CSA technologies examined are organic manure, agroforestry, and mulching. These technologies are important in conserving soil moisture, preventing soil erosion and building soil fertility, all of which help in offsetting the twin challenges of poor soil health and prolonged heat shocks. Malawi is a relevant case for this study because the country is currently implementing a large-scale farm input subsidy program (FISP), referred to as the Affordable Input Program (AIP) by the previous government.
We test two hypotheses: H1: Adoption of the selected CSA technologies does not improve smallholder farmers’ maize productivity; and H2: Integrating the selected CSA technologies with the use of inorganic fertilizers does not improve smallholder farmers’ maize productivity.

2. Materials and Methods

2.1. Conceptual and Theoretical Framework

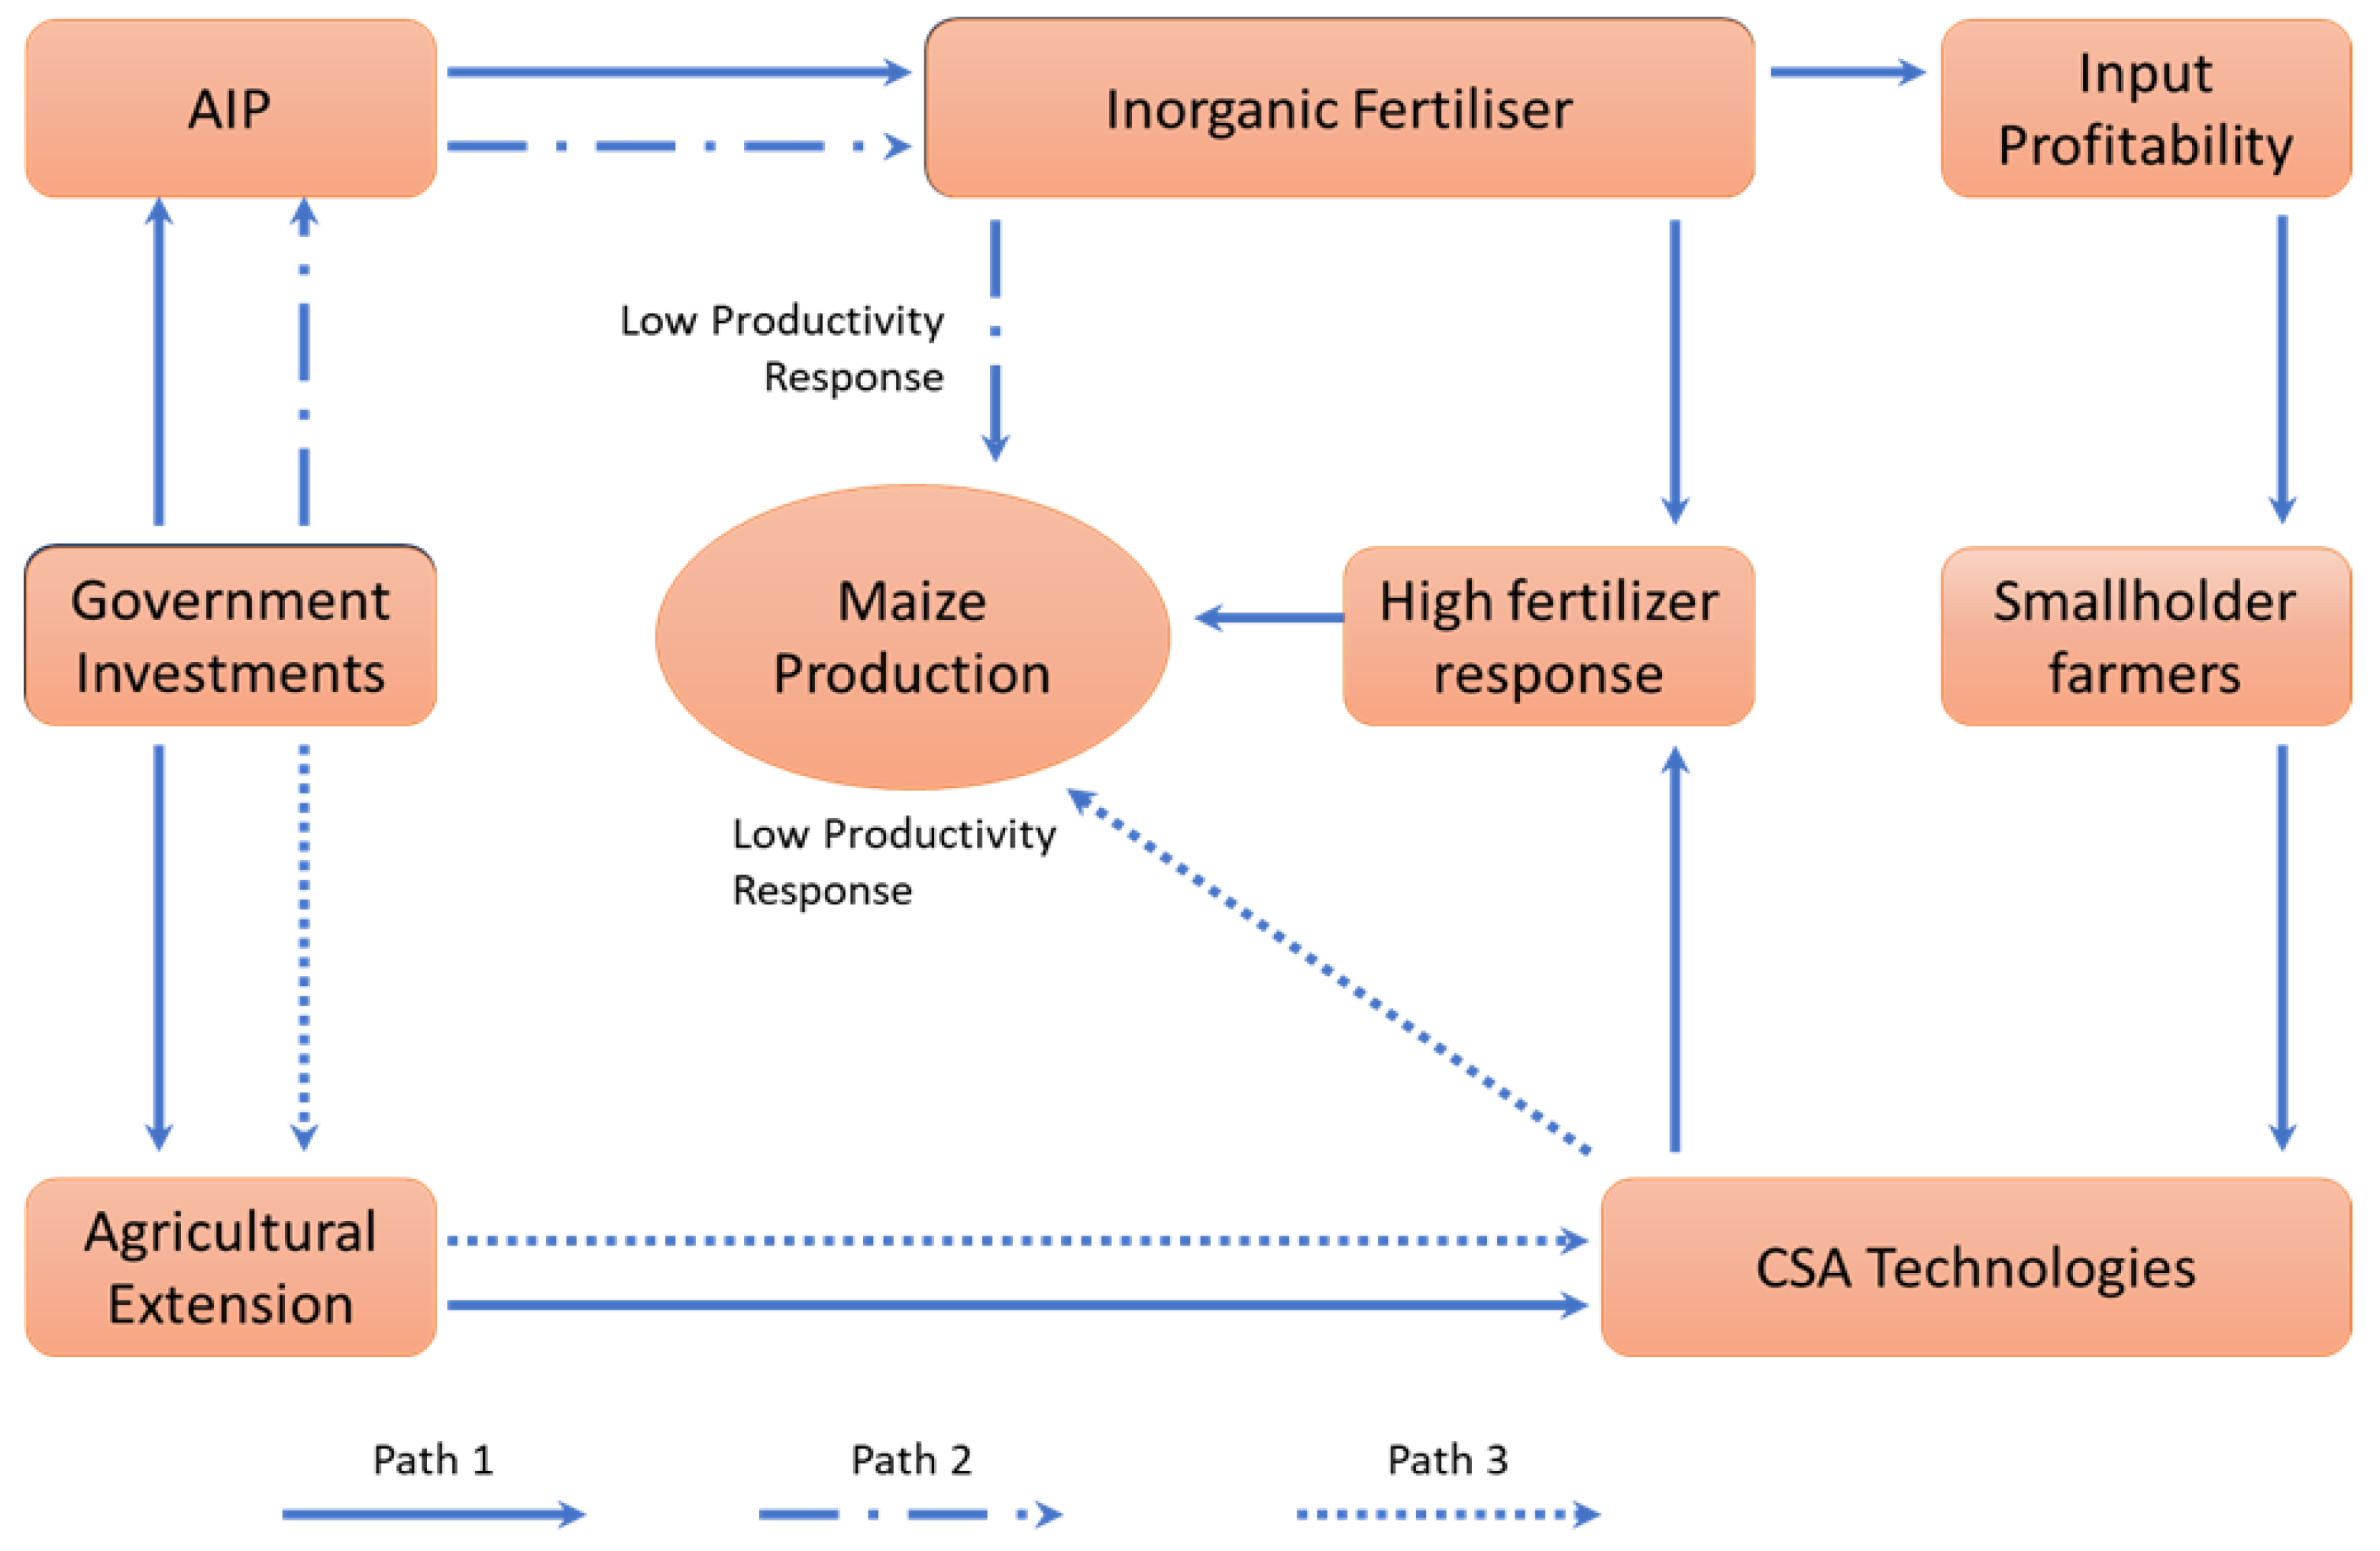
The nexus of CSA, input subsidies, and maize productivity has implications at two levels of implementation. At the macro level, it is a question of synchronizing two policy instruments that both aim at increasing smallholder maize productivity. At the micro-level, it is a question of the farmer’s decision to combine the use of inorganic fertilizers with other CSA technologies to increase their yield. At the macro level, we borrow from [20] who conceptualized government investments in inorganic fertilizer and CSA to impact maize production through three pathways (Figure 1). Generally, farmers access inorganic fertilizer through FISP, and attain their knowledge of CSA through agricultural extension services.
Path 1 depicts a scenario where the government places equal importance on investing in AIP and in agricultural extension services. On the one hand, access to subsidized inorganic fertilizers will increase farmers’ input profitability, which would effectively encourage them to explore other productivity enhancement practices such as CA, organic fertilizer, etc. [32]. On the other hand, access to readily available extension services will enhance farmers’ capacities to implement soil fertility and water retention measures, which would promote drought resilience and the efficient use of the subsidized inorganic fertilizer [33]. This mutual relationship between the subsidized fertilizer and the promoted CSA technologies would result in a corresponding increase in the farmer’s use intensity of both, thereby increasing maize production and productivity.
Path 2 depicts a scenario similar to the current reality in Malawi, where the level of investment in AIP is so large that it crowds out other agricultural development programs [32,34]. In the past decade, the Malawi government has failed to increase investments in agricultural extension services that could help in facilitating the adoption of various CSA technologies among smallholder farmers [35]. For instance, the 2023/2024 AIP accounted for over 45% of Malawi’s agriculture budget [36], whilst investment in agricultural extension services made up only 1.6% of the same [37]. While access to subsidized fertilizer may increase the input profitability of the smallholder farmer, the absence of extension services generally means that the farmer’s knowledge and uptake of complementary productivity enhancement practices will be low. Subsequently, crop responsiveness to inorganic fertilizer will be low, and the long-term benefits of the subsidized inputs will be compromised [33].
Path 3 depicts a scenario where the government invests heavily in climate change adaptation strategies with minimal investment in AIP. Whilst various CSA technologies have their own place in improving soil health and water retention, the truth remains that the soils of Malawi are too depleted of essential nutrients and require supplementary application of inorganic fertilizer [14]. For instance, a sole reliance on organic manure would not be sufficient to supply the nutrient demands of maize because manure contains comparatively small amounts of nutrients and is practically not available in the large amounts that would be required. In this scenario, farmers are less likely to realize any meaningful returns to their investment in CSA technologies, making them less likely to continue implementing the practices on their farms.
At the micro level, we analyze the farmer’s decisions based on the random utility theory, which stipulates that rational individuals make choices to attain outcomes that maximize their expected utility. Utility is a latent variable that denotes the benefits that the farmer derives from selecting a particular option. In our case, an increase in maize productivity and subsequent food security is the perceived benefit that farmers expect from adopting a set of CSA technologies.
To model the adoption decision of the i t h farmer from a sample of n farmers who have to choose from a given set of j technologies ( j = 1,2 , 3 ), namely (1) mulching, (2) agroforestry, and (3) organic manure, we first assume that the farmer attaches a utility U i j to each CSA technology. This attached utility is determined by both observable and un-observable characteristics. The observable characteristics could be attributes of the farmer, such as socioeconomic status (gender, age, education, marital status, etc.) and institutional resources (extension services, access to AIP, etc.). The un-observable characteristics could be any unmeasured aspects, such as the farmer’s subjective beliefs or other intangible particulars. Observable characteristics form the deterministic part of the model β j X i j , whilst un-observable characteristics form the stochastic part of the model i j .
The utility attached by farmer i to CSA technology j can be presented as:
U i j = β j X i j + i j
where X i j = vector of observed variables;
β j = vector of unknown coefficients to be estimated; and
i j = the stochastic error component assumed to be N ~ 0 , σ 2 .
Further, assuming that adoption is not mutually exclusive for any of the CSA technologies, the farmer will adopt the CSA technology that yields higher benefits. Therefore, the probability that farmer i will adopt technology j can be presented as:
P i 1 = P r U i 1 > U i 2 , U i 1 > U i 3   a n d   U i 1 > U i m
This probability specification yields a typical probit model, which can be estimated by maximum likelihood methods to determine whether or not the farmer adopts that particular CSA technology. In practice, however, instead of adopting a single technology, farmers are more likely to adopt a combination of CSA technologies to deal with the array of agricultural production challenges that they face. In this context, multiple-choice versions of the typical probit and logit models are employed to simulate the farmer’s decisions by taking into account interdependent and simultaneous factors to arrive at the particular technology bundle that maximizes the farmer’s expected utility [2].

2.2. Model Specification, Estimation Strategy, and Limitation

To examine the impact of farm input subsidies conditional on CSA technologies on maize productivity, we used the following model specifications:
l n Y i = α 0 + α 1 S i + α 2 I i + α 3 S I i + α i x l n X i , + α i z Z i + ε i
where Y i is maize productivity for farmer i measured by maize production per ha. S represents use of subsidized inputs, while I is use of different CSA technologies. S I is an interaction variable representing integration of subsidized fertilizer input and CSA technology. X i controls for other production inputs in natural log (i.e., labor and land), while Z i represents household and farm characteristics. ε i t is a normally distributed error term. The parameters of interest are α 1 , α 2 and α 3 .
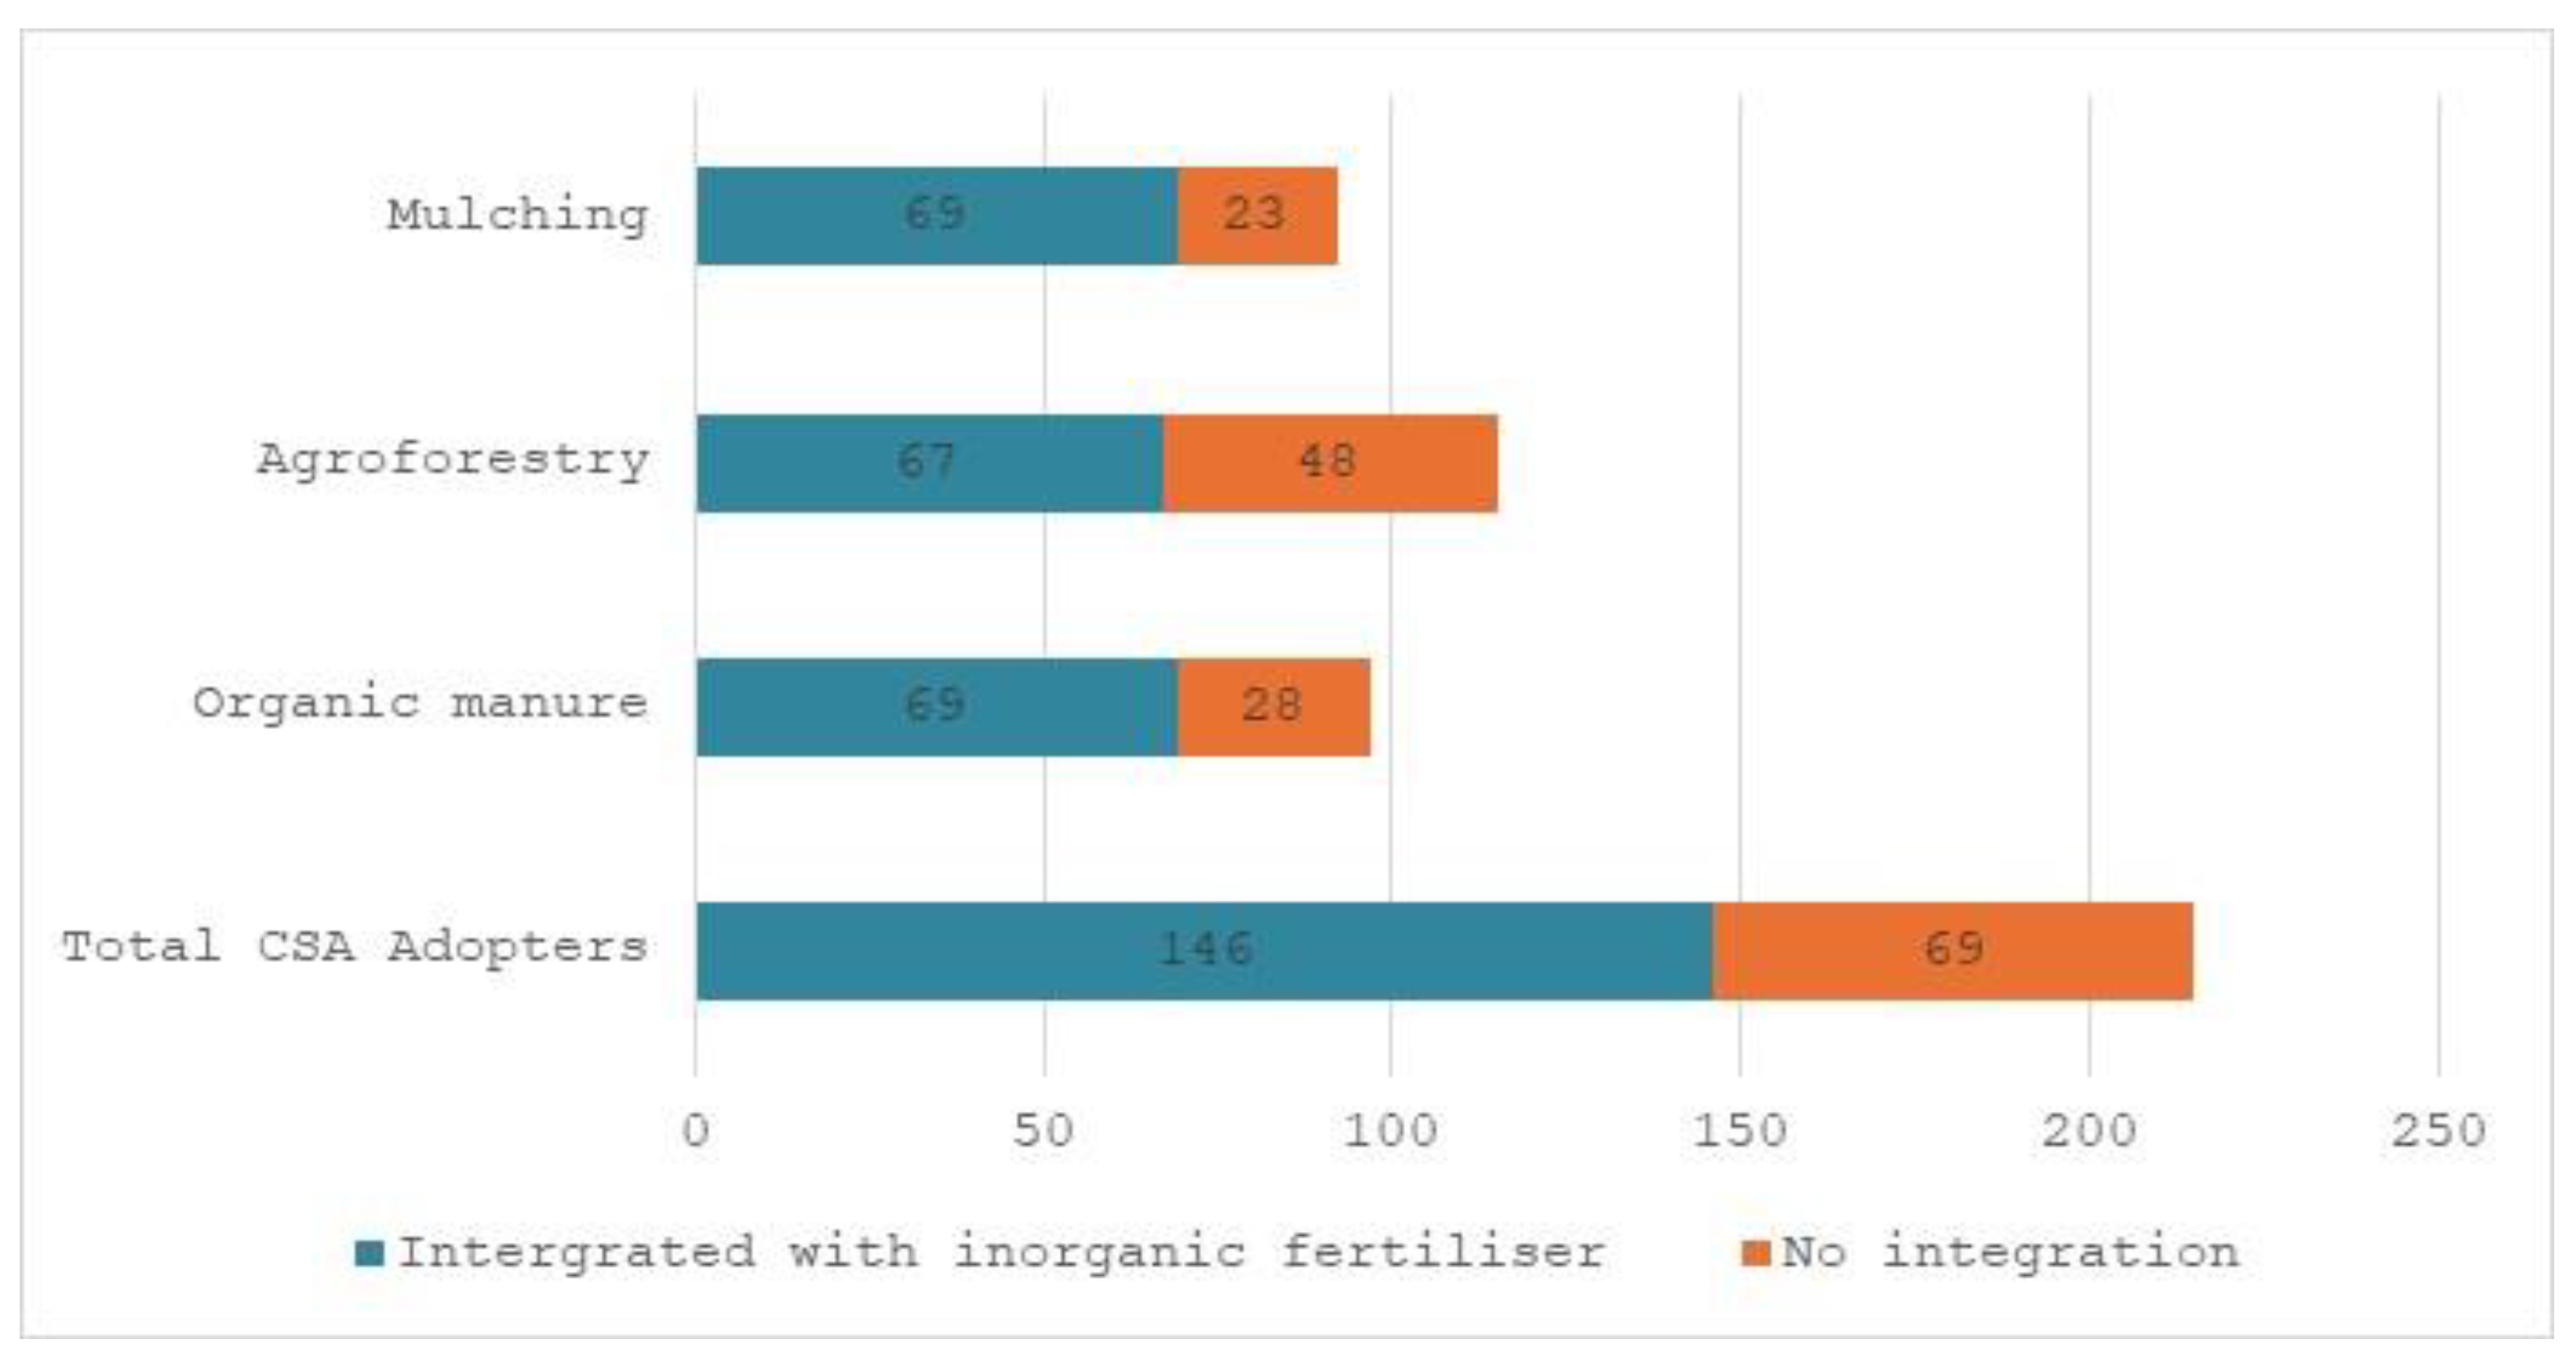
There are several options for estimating Equation (3), one of which involves using Ordinary Least Squares (OLS). OLS regression, however, would produce biased results because CSA adoption is not random. As shown in Section 2.5 below, adopters and non-adopters differ systematically in observable characteristics such as education, access to extension services, and livestock ownership. A simple OLS regression would confound these pre-existing differences with the treatment effect. To address this selection bias, we used the Inverse Probability Weighted Regression Adjustment (IPWRA) model proposed by [38]. To simplify the illustrative process, let D i represent the treatment of “CSA adoption” and “integrating CSA technologies with inorganic fertilizers”. Both cases are binary treatment problems, where D i = 1 if the farmer adopts CSA or integrates and 0 otherwise. For the integration analysis, integration is defined as the concurrent use of at least one of the selected CSA technologies (mulching, agroforestry, or organic manure) alongside inorganic fertilizer on the same maize plot. This analysis was restricted to the sub-sample of CSA adopters (n = 215), comparing those who combined CSA with inorganic fertilizer (n = 146) against those who used CSA without inorganic fertilizers (n = 69).
Following the random utility framework explained in Section 2.1, the treatment model can be presented as follows:
D i = α X i + i
where D i = treatment status = 1   if   D i   > 0   0   otherwise
X i = vector of pre-intervention characteristics;
α = vector of unknown coefficients to be estimated; and
i j = the random error component, assumed to be N ~ 0 , σ 2 .
The first step of IPWRA involves estimating the probability of being in the observed treatment group and then using the probability value to compute an inverse probability weight. To estimate the probability, i.e., parameters of the treatment model, this study employs a simple probit model specified as follows:
P ( D i = 1 ) = P ( D i > 0 ) = P ( ε i > α X i ) = 1 F ( α X i )
where F = the cumulative distribution function for the error term ε i .
Intuitively, it follows that the probability of being in the untreated group is:
P D i = 0 = 1 P D i > 0 = 1 P ε i > β X i = F ( β X i )
The inverse probability weights for each farmer are then computed as follows:
1 1 F ( α X i )   for   adopters
1 F ( α X i )   for   non-adopters
The second step of IPWRA involves using the weighted values of the farmers’ outcomes to fit two separate outcome regression models for the treated and the untreated groups and then using the models to predict the corresponding values of the unobserved potential outcomes for each farmer in either group.
The weighted regression models are specified as follows:
Y i 1 = α 1 + θ 1 X i + 11   for   adopters
Y i 0 = α 0 + θ 0 X i + 10   for   non-adopters
To estimate the parameters α 0 , α 1 , θ 0 , and θ 1 presented in Equation (7a,b) above, inverse probability weighted least squares is used as follows:
m i n α 1 θ 1 = i N y i α 1 θ 1 X i p x , θ   for   adopters
m i n α 0 θ 0 = i N y i α 0 θ 0 X i p x , θ   for   non-adopters
The final step of IPWRA computes the average treatment effects on the treated individuals (ATT) by taking the difference between Equation (8a,b):
A T T = 1 N A i N A α 1 ^ α 0 ^ θ 1 ^ θ 0 ^ X i
where N A = number of farmers in the treated group; and
α ^ and θ ^ = weighted parameters for the inverse probability models.
The IPWRA estimator, although considered doubly robust, is not free from limitations. For example, the validity of causal inferences heavily relies on selection-on-observables [39]. This implies that the estimator may suffer from unobserved heterogeneity bias [40]. Factors such as soil quality, farmer ability, and risk preferences that are not observed may influence the outcome variable, maize productivity, and the adoption variables [41]. Addressing this problem, our study included a set of observable factors such as household characteristics (e.g., age, sex, marital status, education), household assets (e.g., livestock ownership, income), farm characteristics (e.g., land size, perceived soil quality), and institutional variables (e.g., access to extension, access to AIP). These factors are commonly used as proxies for productivity and capacity differences of the farmers [42,43]. Evidence by [44] revealed that farm characteristics such as cropping systems, household characteristics (e.g., asset ownership), household size, and household composition significantly enhance crop productivity in Malawi. Reference [38] also explained that the doubly robust nature of the IPWRA estimator can still reduce the bias arising from potential model misspecification if either the treatment model or the outcome model is correctly specified.
Nevertheless, we cannot completely rule out the possibility of remaining bias due to unobserved heterogeneity. The estimated productivity effects in our study should therefore be interpreted with caution. Future research could address this limitation by using alternative methods such as panel data approaches, instrumental variables, or randomized control trials (RCTs).

2.3. Data and Data Analysis

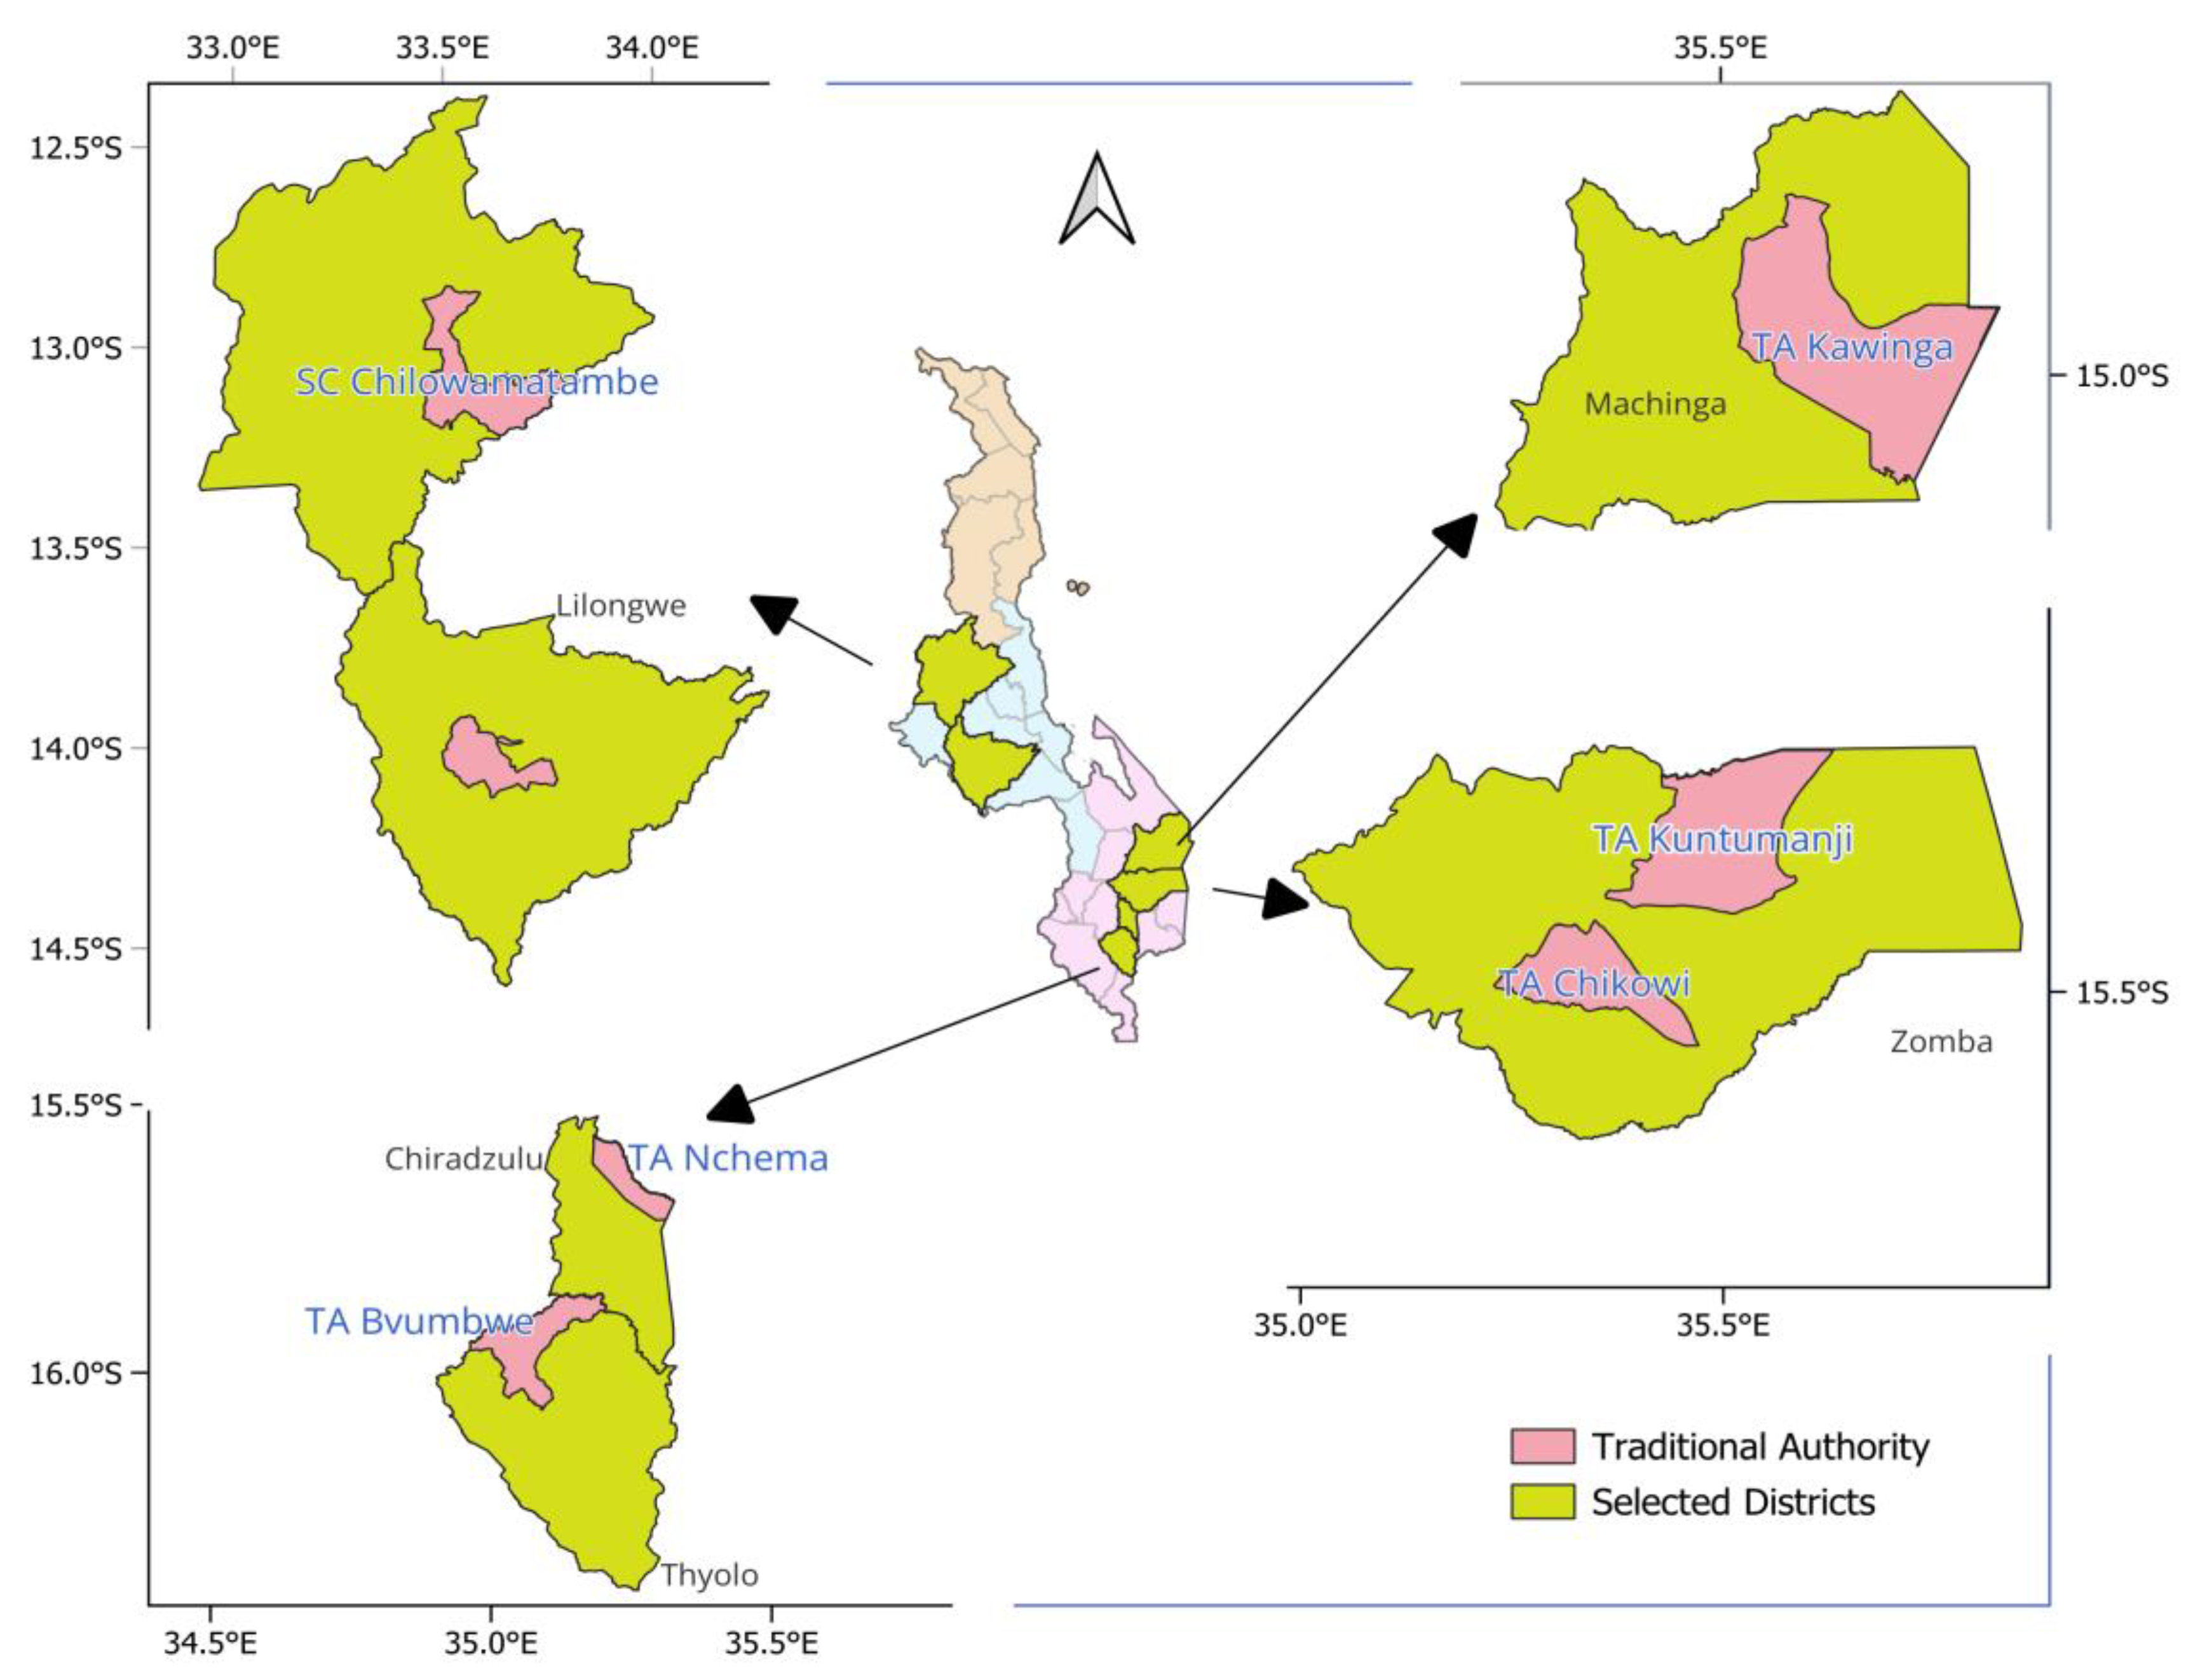
We used household survey data covering six districts in central and southern Malawi, namely Kasungu and Lilongwe in the Central Region and Chiradzulu, Machinga, Thyolo and Zomba in the Southern Region, as shown in Figure 2. The study area and the participating households were first sampled in 2006, where a random sample of 450 households was obtained using a simple random sampling technique following the second integrated household survey of 2004 (IHS2) [45]. A multi-stage sampling procedure was used to select study participants. In the first stage, purposive sampling was employed to select the six study districts, with the primary goal of capturing rainfall variations and land-use dynamics. In the second stage, simple random sampling was used to select Enumeration Areas (EAs) from the comprehensive list of EAs developed by the Malawi National Statistical Office (NSO). A total of 15 EAs were sampled from Kasungu (3), Lilongwe (3), Machinga (2), Zomba (3), Thyolo (2) and Chiradzulu (2). In the final stage, simple random sampling was used to select the 450 households.
The figure shows the map of Malawi with all the 28 districts. Districts in yellow color are the sampled ones while areas with pink colored are sampled Traditional Authorities (TA) in each district. The arrows point to the sampled districts.
Of the 450 households sampled in 2006, 378 were re-surveyed in 2009, 350 in 2012 and 2015, and 337 in 2022, resulting in five rounds of unbalanced panel data. The reduction in sample size across rounds was due to normal household attrition (relocation, death of household head, or refusal to participate in subsequent rounds). This study used only 2022 data, in which 307 households had complete records for our analysis, as shown in Table 1. Due to the addition of new variables that were not collected in earlier surveys, this paper used only the 2022 dataset, as shown in Table 1. The data were collected between June and August 2022 and have detailed farm plot information (measured by Global Positioning System (GPS)) and geo-referenced farm plots. The data were collected by the Experiments for Development of Climate-Smart Agriculture (SMARTEX) project, a Norwegian Agency for Development Cooperation (NORAD-funded collaborative research and capacity-building program being implemented jointly by the Lilongwe University of Agriculture and Natural Resources (LUANAR) and the Norwegian University of Life Sciences (NMBU). The program focused on the application of experimental methods to find climate-smart solutions for the sustainable intensification of agriculture in Malawi. The primary purpose of the project was to gain insights into the performance of CSA technologies in adverse climatic conditions.
Additionally, the research also aimed to examine access to AIP and the use of inorganic fertilizers among smallholder farmers in Malawi. Building upon SMARTEX’s survey objectives, this study specifically focused on the adoption of selected CSA technologies by maize farmers (mulching, agroforestry, and organic manure). Furthermore, the use of inorganic fertilizer, which was part of the CSA integration efforts by farmers, was not restricted to those who had access to AIP.
The data were collected using a structured digital questionnaire administered to the sampled households. The collected data included socioeconomic characteristics of farmers, such as age, gender, marital status, and education level; household characteristics like family size and food security; institutional characteristics like club membership and access to AIP; and crop production attributes, including the types of crops grown, CSA technologies implemented, the size of land allocated to each crop, the nature and sources of the inputs used, and crop yields. Crop yields were measured in kilograms (kg), and land size was measured in hectares. GPS coordinates were used to calculate land size.

2.4. Summary Statistics on AIP Access, Fertilizer Use, and CSA Adoption

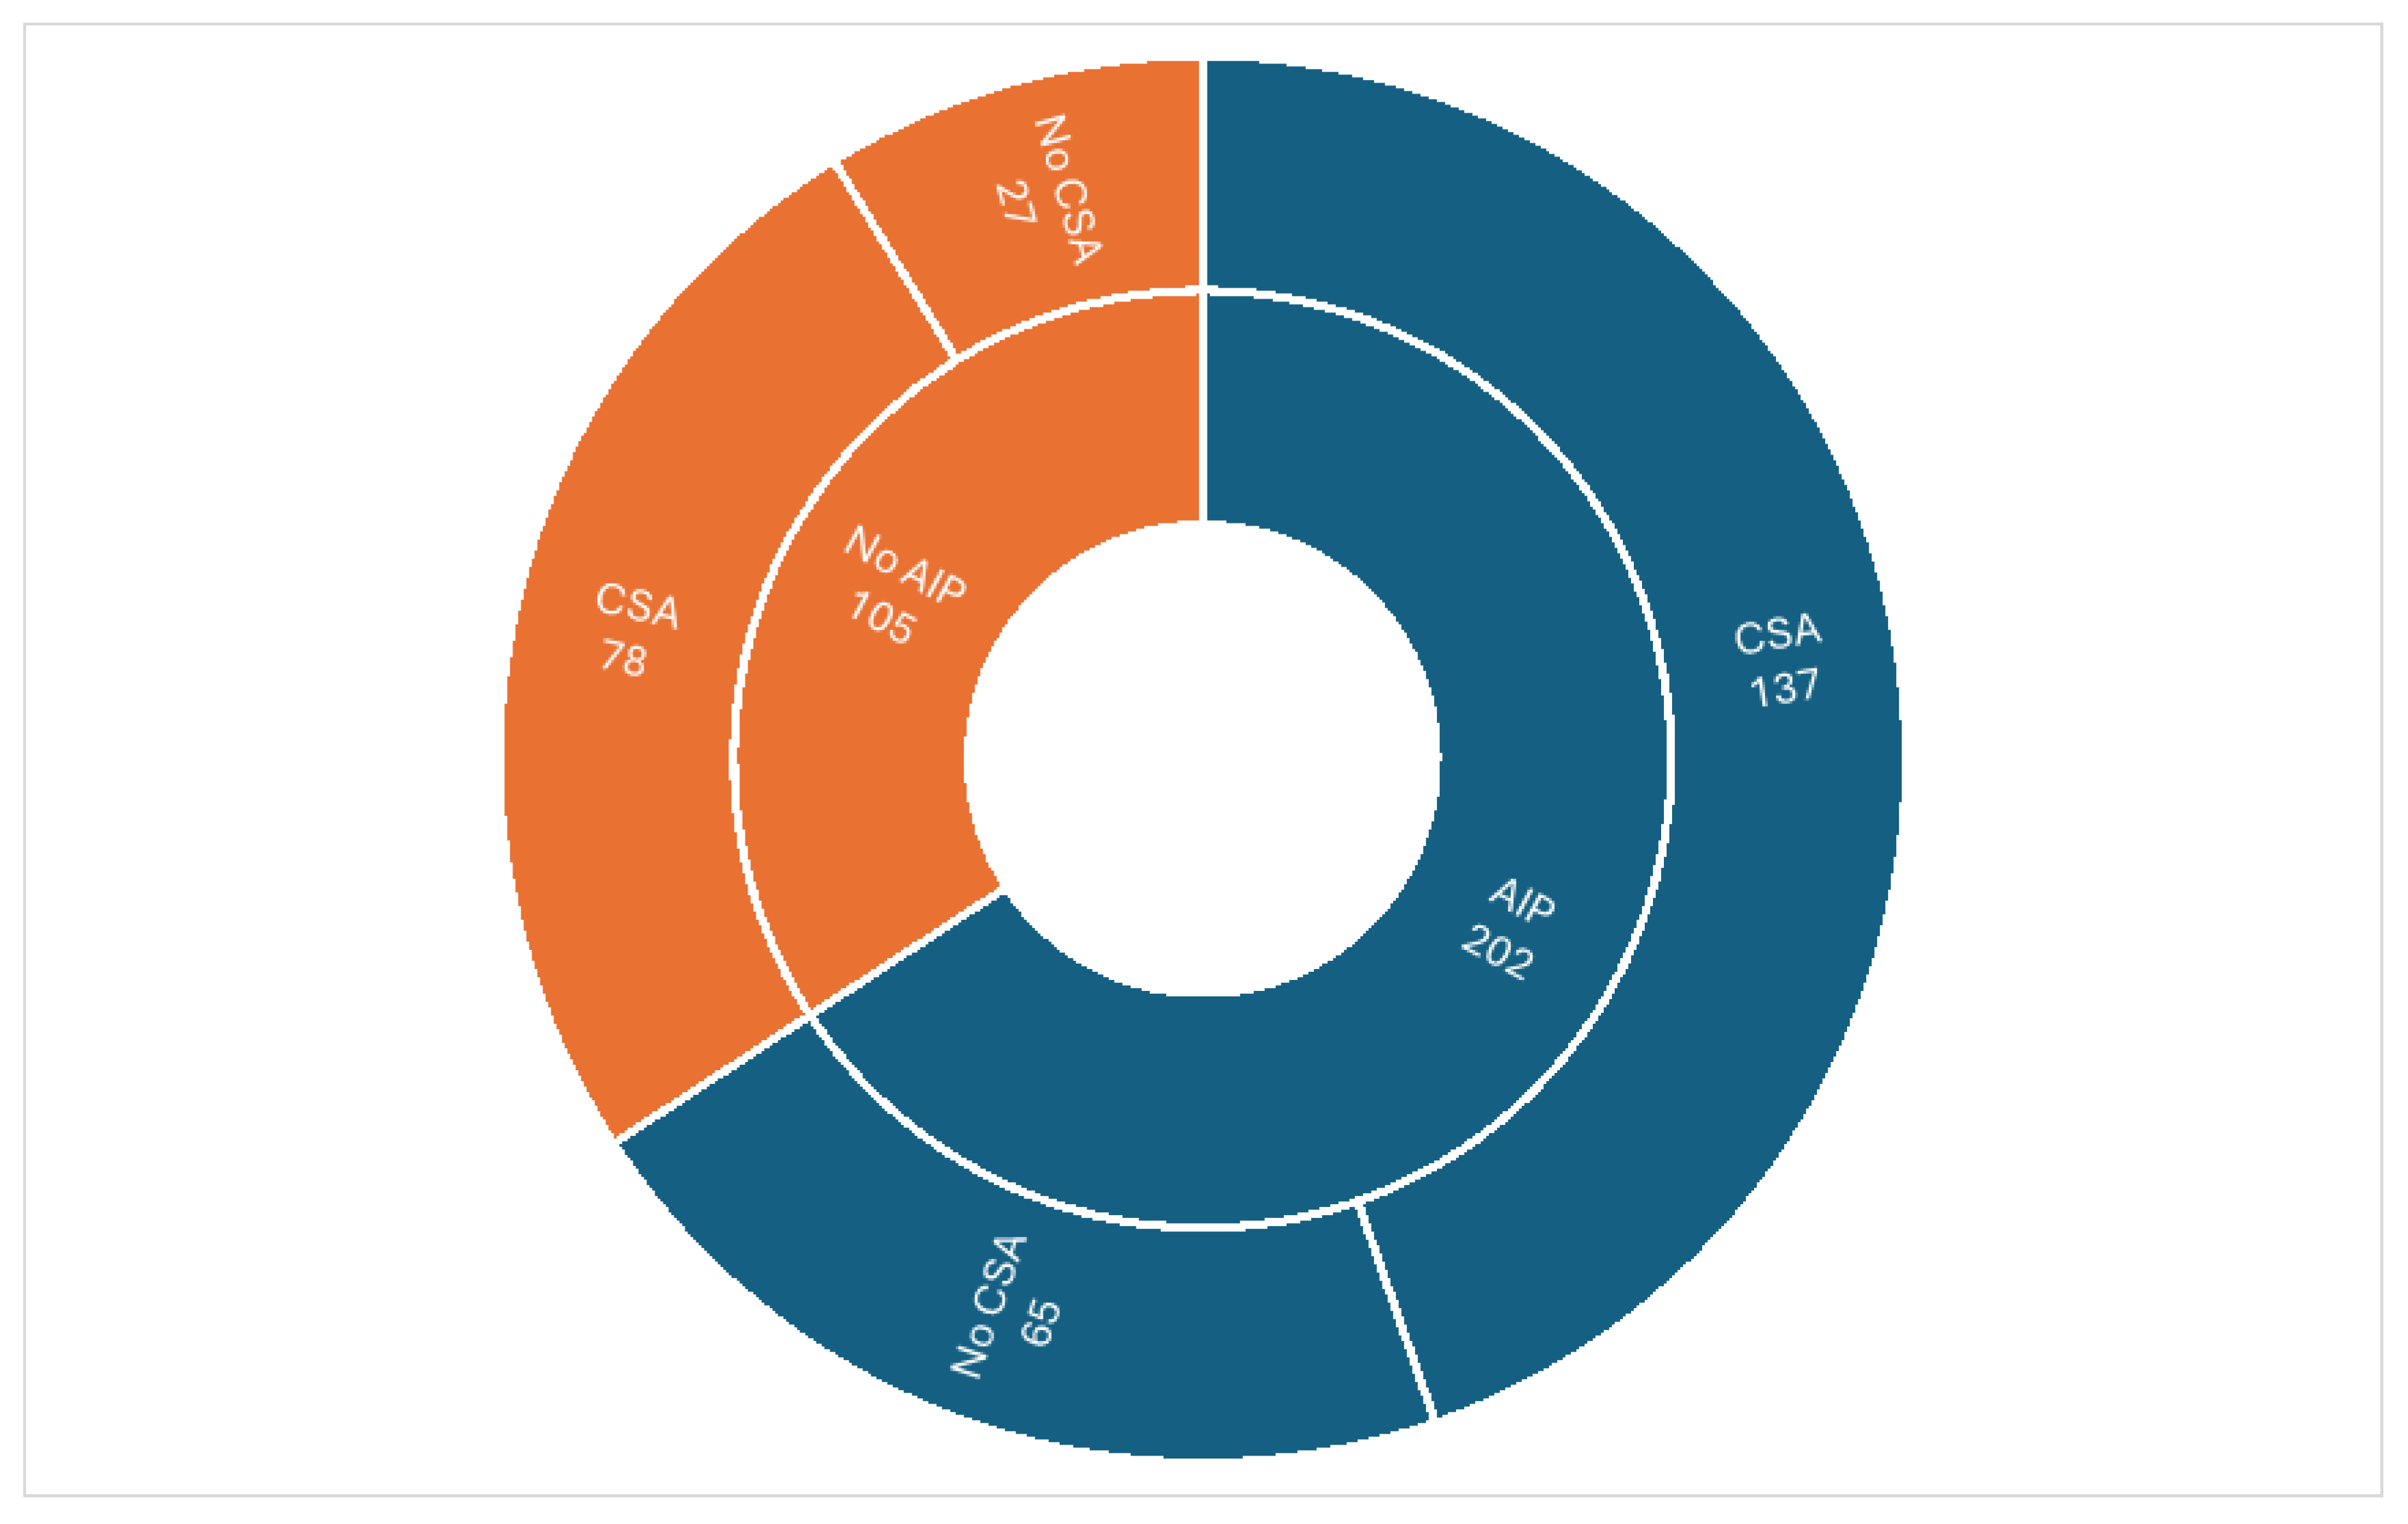
Figure 3 presents summary statistics of access to AIP inorganic fertilizer, use of inorganic fertilizer and adoption of CSA technologies. The study data were collected from 307 smallholder maize farmers, out of which 202 farmers (66%) benefited from AIP, 198 farmers (64%) applied inorganic fertilizers to their farms, and 215 farmers (70%) implemented CSA technologies on their farms. Of the 202 farmers who had access to AIP, only 135 farmers (67%) reported having actually used the fertilizer on their farms. This may reflect known challenges in coupon redemption, including low incomes, difficulties accessing redemption points, and fraudulent local arrangements [32,46]. On the contrary, out of the 105 farmers who did not benefit from AIP, around 60% said that they managed to apply fertilizer to their farms. This confirms the income differences between farmers who were identified for the subsidies and those who were not. According to [4], the selection guidelines of AIP point toward identifying low-income groups who would otherwise not be able to purchase the inputs without external support. Among the 135 farmers who accessed AIP and applied inorganic fertilizers, 98 (73%) also implemented at least one CSA technology, whilst 37 did not. There was also an extreme set of 12 households that neither accessed AIP nor used fertilizer, and they also did not implement any CSA technology on their farms.
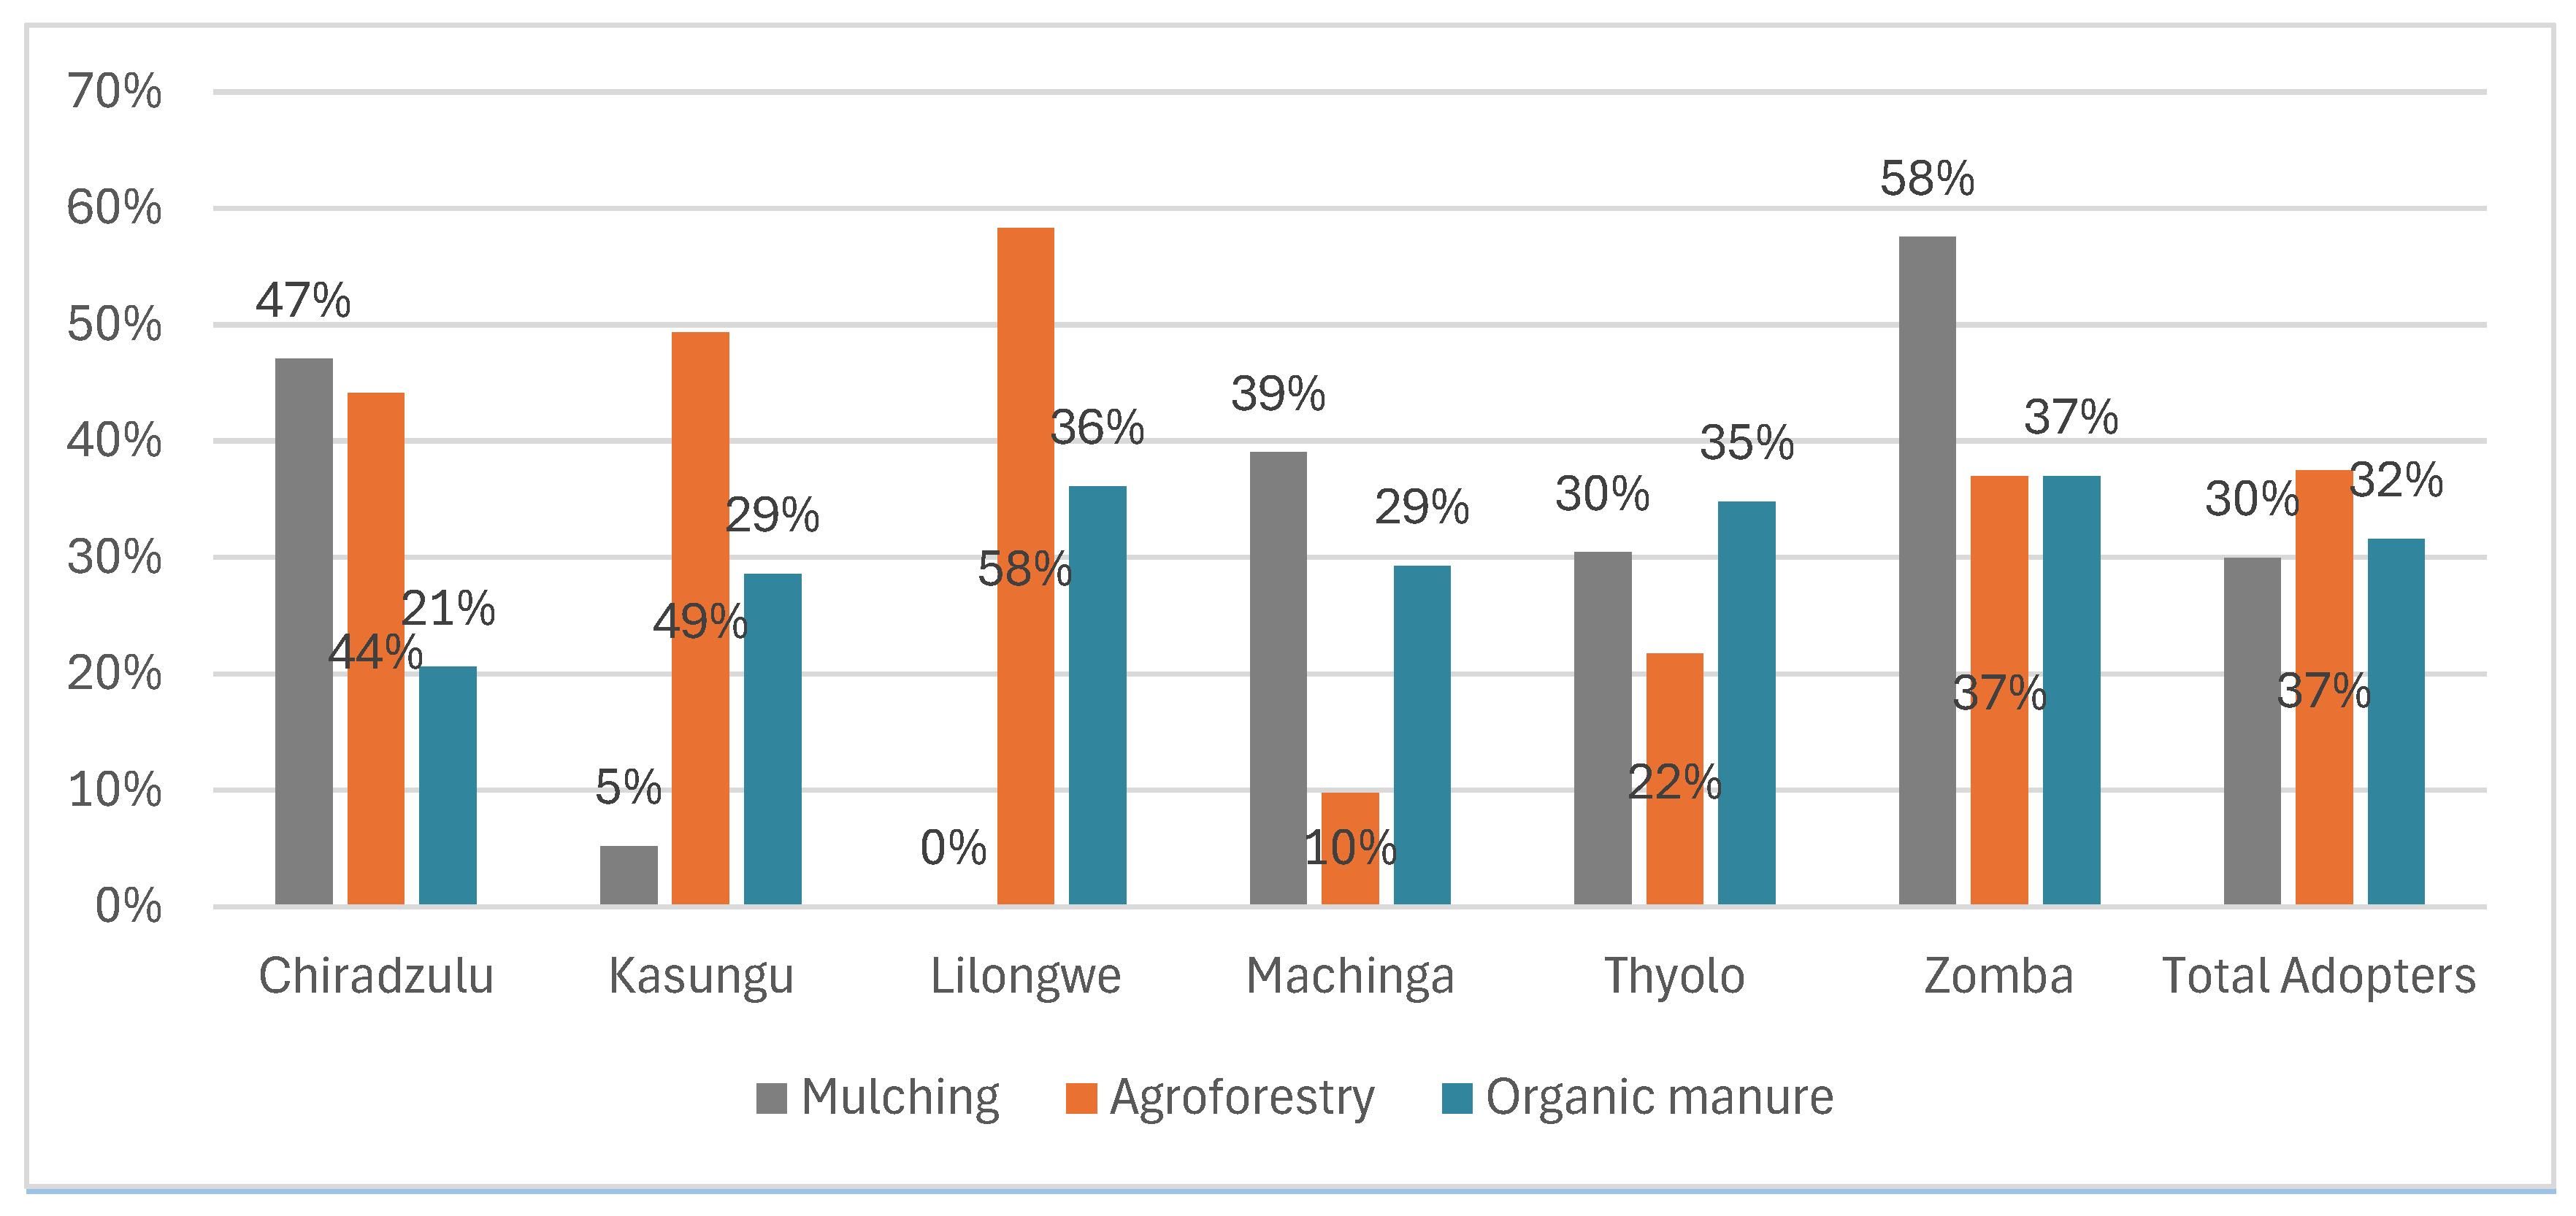
The CSA technologies reported included minimum tillage (2%), organic manure (32%), inorganic fertilizers (64%), improved maize varieties (59%), intercropping or mixed cropping (55%), cover cropping (28%), agroforestry (37%), farrow (4%), mulching (30%), pesticides (7%), terraces (6%), control bunds (15%), drainage ditches (12%), water harvest ponds (2%), sandbags (3%), and vetiver grass (14%). Of interest in this study was the use of mulching, agroforestry, and organic manure (Figure 4). A total of 215 farmers (70%) implemented at least one of the three selected technologies: mulching (30%), agroforestry (37%), and organic manure (32%). About 35% of the CSA users mixed several CSA technologies on their maize plots.
Agroforestry was the most adopted technology among the three, with the highest implementation rates in Lilongwe (58%), followed by Kasungu (49%) and Chiradzulu (44%). Common agroforestry trees used by the farmers included Acacia, Faidherbia albida (Msangu), Gliricidia Sepium, Piliostigma thonningii (Musekese) and Terminalia Sericea (Naphini). Lilongwe and Kasungu have, for the past several years, been major recipients of aid-funded agroforestry projects implemented by the World Agroforestry Centre (ICRAF), Total Land Care (TLC), and Catholic Relief Services (CRS) [47]. This may explain the high adoption rates in the three districts. Interestingly, only 10% of the farmers in Machinga practiced agroforestry. This is despite the fact that for the past 15 years, the district has hosted at least three United States Agency for International Development (USAID)-funded projects that promoted watershed treatments and agroforestry activities [48,49].
Mulching was practiced extensively among farmers in Zomba (58%), Chiradzulu (47%), and Machinga (39%). The three districts are characterized by high exposure to dry spells and are among the top priority districts for drought mitigation efforts in the Malawi National Resilience Strategy [50]. The presence of such support initiatives could influence farmers to implement CSA technologies that preserve soil moisture. Contrasting results were observed in Lilongwe, where none of the respondent farmers practiced mulching in their maize farms.
The use of organic manure was found to be common across all six surveyed districts, with slightly higher rates in Zomba (37%), Lilongwe (36%), and Thyolo (35%). The farmers reported ease of sourcing the various combinations of animal, compost, and green manure, compared to the requirements of other CSA technologies.
In Figure 5, we show that of the 215 CSA adopters, 146 farmers (68%) integrated the CSA technologies with the use of inorganic fertilizers. AIP beneficiaries made up 67% of the farmers who complemented their inorganic fertilizers with other CSA technologies. Integration with inorganic fertilizers was equally spread across the three selected technologies: mulching (69%), agroforestry (67%), and organic manure (69%). Only seven farmers (3%) implemented all three technologies in combination with inorganic fertilizers on the same plot.
Pearson chi2(2) =   2.6976   Pr = 0.0260

2.5. Socioeconomic Characteristics of CSA Adopters and Non-Adopters

Table 2 presents socioeconomic characteristics of the respondents, revealing some level of diversity between those who used CSA technologies and those who did not. Male-headed households dominated both users and non-users of CSA (64%), with a majority of the household heads being married (63%). The dominance of men in maize farming can be partially attributed to the societal pattern in Malawi, where males typically have more access to resources like land, capital, and agricultural inputs than females [51]. The mean household head age was 55 years, which was considerably higher compared to the findings of other researchers in Malawi who reported that most farmers are in their early forties [30,52,53].
The households were generally composed of five people, indicating the availability of family labor for farming tasks. A majority of the household heads had low levels of education, with the average farmer having attended only 5 years of effective schooling. CSA adopters spent significantly more time in school (5.3 years) than CSA non-adopters (4.2 years), and a higher percentage of CSA adopters (18%) had attained some level of secondary education in comparison to non-adopters (8%). Low levels of education are often associated with resistance to change and may negatively impact the farmer’s decision to adopt CSA technologies [54].
AIP access was marginally more pronounced among CSA non-practicing farmers (71%), but the difference was not statistically significant. With regard to access to extension services, however, a significantly larger number of CSA adopters (73%) registered adequate interface with extension agents compared to CSA non-adopters (61%). This, in part, explains how the CSA adopters obtain the knowledge to practice various technologies on their farms. Livestock ownership was also higher among CSA adopters (73%) in comparison to non-adopters (64%), which accounts for the widespread use of organic manure across all six surveyed districts. About 44% of the respondents confirmed having access to credit opportunities. Commonly cited sources of credit were Village Savings and Loans Associations (VSLAs) (20%), neighbors and relatives (16%), and microfinance institutions (MFIs) (2%). The credit amounts varied, averaging Malawian Kwacha (MWK) 65,000.00 from MFIs, MWK25,000 from VSLAs, and MWK11,000 from neighbors or family members.
The size of maize farms averaged 1.19 hectares, with significant differences observed across regions. In the Central Region, farm sizes averaged 2.7 hectares, whilst in the Southern Region, they averaged 0.7 hectares. The average maize yield was 757.24 kg per hectare, which is significantly lower than the national average of 1500 kg per hectare reported by [1]. The results also showed great variation in maize yield, which may be attributed to drought episodes, which were reported especially by farmers from Kasungu. The lower-than-average yields likely reflect a combination of factors: yields were self-reported by farmers, which may introduce measurement error; drought conditions were reported in parts of the study area during the 2021/2022 season; and the sample in the Southern Region is concentrated in districts that tend to have lower yields than the national average. While measurement error could affect the estimated treatment effects, the consistency between the IPWRA and PSM results suggests that the estimates are reasonably robust. Despite not being significantly different statistically, the yield was higher among CSA adopters (813 kg) than non-adopters (626 kg).
Over half of the farmers grew their maize in mixed-crop fields, which could be attributed to the small land holdings prevalent among Malawian farmers. Lastly, the average annual income was MWK238,103.96 (or MWK652.34 daily), which is far below the $2.15 poverty line. This low income, combined with the fact that 63% of the farmers were married and less than half had access to credit, implicitly indicates that the majority of the respondents live in poverty.

3. Results

3.1. CSA Adoption

We first present results on the adoption decision of CSA technologies. We first modeled a simple binary probit model for the collective set of CSA technologies, and second, a Multivariate Probit to understand the adoption decisions separately for each CSA technology. A simple binary probit was run to identify determinants of adoption for any one of the selected CSA technologies (Table 3). Overall, the model was significant at a 1% significance level, implying that the adoption of CSA technologies was jointly influenced by the variables incorporated in the model. Since our main interest is to understand how adoption decisions influence maize productivity and subsequent food security, we do not discuss in detail the determinants of adoption in this paper except for a few variables of interest, such as access to extension services and access to AIP.
We further estimated a Multivariate Probit to identify determinants of adoption for each separate CSA technology. An important step in the use of the Multivariate Probit is to test for correlations between error terms across the different adoption equations. To achieve this, we used the Breusch–Pagan test (Table 4). The Breusch–Pagan test was significant, implying that the farmer’s adoption decisions of the three CSA technologies were interrelated. Mulching and agroforestry had a negative correlation coefficient, indicating that farmers regarded the two technologies as practical substitutes. This could be attributed to the fact that both technologies perform similar functions of providing soil cover to prevent the evapotranspiration of soil moisture. By physically covering the soil, mulching also prevents it from being washed away by water or wind. Similarly, agroforestry, with its use of trees and shrubs, provides a physical barrier to soil erosion by blocking wind, and reducing the speed of water run-off. Mulching and organic manure were also regarded as substitutes by the farmers. Both methods improve soil health by decomposing over time and adding essential nutrients, improving the soil structure, and increasing the water-holding capacity of the soil.
Agroforestry and organic manure, on the other hand, had a positive correlation coefficient, implying that the farmers regarded these two technologies as having complementary attributes. The most important way in which these two technologies complement each other is through nutrient cycling. Trees in agroforestry systems draw up nutrients from deep in the soil and deposit them in their leaves. When these leaves fall and decompose, they release these nutrients back into the soil, where they are available for crops. This process is enhanced by the use of organic manure, which facilitates decomposition and contributes nutrients to the soil in the process.
Moving on to the Multivariate Probit estimates, the model was significant at 1%, implying the existence of factors in the specification affecting the individual CSA adoption decisions (Table 5). The results show that mulching was significantly influenced by whether or not the farmer planted their maize in a mixed stand. Farmers who implemented mixed cropping were 43% more likely to adopt mulching than those who planted their maize in pure stand. The adoption of agroforestry was influenced by whether the farmer owned livestock, and the quantity of the maize seed planted. Farmers who owned livestock were 11% more likely to practice agroforestry. Lastly, the use of organic manure was significantly influenced by access to AIP, ownership of livestock, and the farmer’s perception of the fertility of their soil. Farmers who benefited from AIP were 34% less likely to use organic manure on their farms. This could be because the farmers found the inorganic fertilizers to be a less tedious approach with quicker results whilst organic manure requires more time and effort and is needed in bulky quantities to supply the same amount of nutrients.

3.2. Maize Productivity Impacts of CSA Adoption

We assessed the maize productivity impacts of CSA adoption by using the Inverse Probability Weighted Regression Adjustment (IPWRA) model. The model measures the average treatment effects among treated individuals (ATT) but not the average treatment effects among untreated individuals (ATU). As such, only ATT results are discussed in this paper. Calculating ATU would require the use of endogenous switching regression (ESR) models; however, statistical tests conducted on the dataset indicated a lack of strong instruments to support the use of the ESR model. To ensure the robustness of the results, the analysis compares the IPWRA results with ATT results calculated using Propensity Score Matching (PSM) algorithms.
The first step of the IPWRA estimator computes the inverse probability weights. In this study, the probability scores are based on the Probit results presented in Table 3. To test for balance in the propensity scores of the treated and untreated individuals, the study applied the pscore-st0026_1 Stata module developed by [55], and test results confirmed satisfaction of the balancing property. We used Stata version 18. To check for sufficient common support, [56] advised that normalized differences higher than the absolute value of 0.25 could indicate potential problems. In the analysis, several variables surpassed this threshold (Table 6). Nevertheless, a misspecification test showed that the model was correctly specified (Chi (13) = 5.4841; p-value = 0.0629).
The second step of the IPWRA estimator is the outcome model, which uses the weighted values of the farmers’ outcomes from step 1 to fit two separate outcome regression models for the CSA adopters and the non-adopters (Table 7). The results of the outcome models show that the factors that affected maize productivity were different for the two groups of farmers. For instance, for CSA adopters, ownership of livestock and having good soil had a significant positive influence on maize productivity, while for CSA non-adopters, it was improvements in dietary diversity that were associated with increased maize productivity. Interestingly, among CSA adopters, access to extension services correlated with diminished maize productivity. This counterintuitive result may reflect several factors. Extension services in Malawi often target farmers who are struggling, so the negative association could reflect reverse causality rather than a harmful effect of extension. Additionally, farmers who recently adopted CSA through extension advice may still be on a learning curve and may have not yet realized the full productivity gains. The quality and content of extension advice also varies across districts and may not always translate to higher yields in the short term. On the other hand, the use of local maize varieties and membership in farmers’ clubs negatively affected maize productivity for CSA non-adopters.
The final step of IPWRA calculates the treatment effects, i.e., the maize productivity impact of adopting CSA technologies (Table 8). The results show a significant difference in the maize yield realized by the two groups of farmers. CSA adopters harvested 846.52 kg of maize per hectare whilst non-adopters harvested 592.78 kg per hectare. The raw yield difference in Table 2 is not statistically significant because the simple comparison does not account for systematic differences between adopters and non-adopters. The IPWRA model adjusts for these differences, isolating the effect of CSA adoption on yield. This difference provides strong evidence that use of CSA technologies results in higher maize yield per hectare. The ATT of 253.78 kg per hectare illustrates that, by implementing CSA technologies on their farms, CSA adopters harvested 30% more maize than they would if they had not adopted the technologies. These results align with findings from [57,58], who reported that CSA technologies positively impact crop productivity in Malawi and Zambia. The 30% yield increase is also consistent with evidence from on-farm studies in Malawi showing yield gains of 19% from local soil amendment technologies [26] and 60–114% from organic and inorganic fertilizer integration, with our lower estimate likely reflecting the conditions of farmer-managed fields as opposed to controlled trials.
As a robustness check, the study compared the IPWRA results with ATT values from six PSM algorithms (Table 9). The best matching PSM algorithm (Kernel matching algorithm with a radius of 0.1) estimates that CSA adopters harvested 817.26 kg of maize per hectare whilst CSA non-adopters harvested between 586.92 kg per hectare. These values are not very far from the IPWRA estimates of 846.52 kg and 592.78 kg per hectare for CSA adopters and non-adopters, respectively. Similarly, the PSM results estimate an ATT of 230 kg per hectare for CSA adopters, which represents a 28.18% increase. This figure mirrors the 30% increase reported by IPWRA. Such a similarity in the estimated values of the ATT indicates that the results from the IPWRA model are robust and reliable.

3.3. Maize Productivity Impacts of Integrating Inorganic Fertilizers with CSA Technologies

To assess whether integrating inorganic fertilizers from AIP on selected CSA technologies would have an additional impact on maize productivity, we ran another IPWRA model. Farmers who integrated and those who did not were identified from a subset of the data containing CSA adopters only (Table 10). The results of the selection equation show that the factors that influenced farmers’ decision to integrate CSA technologies with inorganic fertilizer were the same factors that were reported in Table 3 to have influenced their initial adoption of the selected CSA technologies. This means that the decision to integrate was significantly and positively influenced by farmers’ extension access, the quantity of seed used, and the usage of local seed varieties. Likewise, the results of outcome equations also mirror what was reported in Table 7, whereby the maize productivity of farmers who integrated CSA technologies with inorganic fertilizer was positively influenced by ownership of livestock but negatively influenced by the farmer’s access to extension services. With regard to farmers who did not integrate their CSA technologies with inorganic fertilizers, maize productivity was significantly influenced by the marital status of the farmer, with married farmers achieving higher maize productivity than their unmarried counterparts.
Moving on to the treatment effects, the final step of IPWRA calculates the ATT of integrating CSA technologies with inorganic fertilizer on maize productivity (Table 11). The estimation results show that farmers who combined CSA technologies with inorganic fertilizers harvested 847.88 kg of maize per hectare, whilst those who did not integrate, harvested 792.08 kg per hectare. Nevertheless, the ATT value of 55.80 kg per hectare was not statistically significant, implying that there was no substantial difference in maize yield between the two groups of farmers. While a 7% increase in maize productivity can be advantageous for farmers with larger plots, many smallholder farmers in Malawi typically cultivate on less than a hectare of land, which may hinder their ability to fully appreciate this minor increase.
The kernel matching algorithm with a radius of 0.1 was selected as the best model for comparing IPWRA results with those generated from PSM (results of diagnostic tests of PSM algorithms are shown in Appendix Table A2). The PSM results in Table 12 show that farmers who integrated CSA technologies with inorganic fertilizers harvested 845.95 kg of maize per hectare, whilst those who did not integrate harvested 776.27 kg per hectare. These results closely align with the values provided by the IPWRA method, which estimated 847.88 kg per hectare for farmers that chose to integrate and 792.08 kg per hectare for those that did not.
Furthermore, the PSM model estimates the ATT of integrating CSA technologies with inorganic fertilizers to be 69.68 kg per hectare, representing an 8.24% increase in maize yield for those who chose to integrate. This value is not very far from the 7% proportional ATT reported by the IPWRA method. The consistency in findings between the two models underscores the reliability of the results, suggesting that the results can be used for decision making.
This interesting result, where the integration appears to bring no additional benefits to the farmers, brings forth an interesting question about the need to understand the quantities of inorganic fertilizer and organic fertilizer applied. However, due to data limitations, we could only check the amount of inorganic fertilizer using a simple t-test. The results in Table 13 show no significant difference between the amount of inorganic fertilizer applied by the two groups.

4. Discussion

Hypothesis 1 predicted that adoption of the selected CSA technologies does not improve smallholder farmers’ maize productivity. However, results from both the IPWRA model and PSM consistently show that CSA adoption increased maize productivity by a significant 30%. Therefore, H1 was rejected. On the other hand, Hypothesis 2 stated that integrating the selected CSA technologies with the use of inorganic fertilizers does not improve smallholder farmers’ maize productivity. The empirical results show that farmers who integrated CSA technologies with inorganic fertilizers did not realize a statistically significant increase in maize productivity compared with those that did not. Therefore, the study fails to reject H2.
The CSA adoption results revealed some important factors that influenced farmers’ likelihood of using the CSA technologies. For example, the probit estimates show that access to extension services had a significant positive influence on the farmer’s CSA adoption decisions, increasing the adoption likelihood by 12.3% among farmers with access to these services compared to those without. Previous studies [53] also found that extension services play a crucial role in encouraging sustainable agricultural practices. In contrast, access to input subsidies was associated with a lower likelihood of CSA adoption, decreasing the adoption likelihood by 10.3% among beneficiaries. This finding contradicts the findings of [46], who found a positive correlation between the use of organic manure and inorganic fertilizer with subsidies. Nonetheless, our findings mirror the results reported by [57], who found that input subsidies discourage farmers from exploring sustainable agricultural practices on their farms mainly because most CSA technologies are either more labor-intensive or do not produce immediate rewards as compared to inorganic fertilizers [10]. This inverse correlation between the use of CSA technologies and subsidized inorganic fertilizer could suggest that farmers treat the two as substitutes.
Assessing whether the adoption of CSA technologies had an impact on maize productivity, we found a significant correlation. Both the IPWRA estimates and the ATT values from six PSM algorithms reported a 30% increase in maize productivity among CSA adopters compared to those who did not use the technologies. We therefore conclude that the use of mulching, agroforestry and organic manure increases maize productivity by an average of 30%. Policymakers should therefore consider targeting these three technologies for widespread adoption. This can be achieved through external incentives or conditioning of public sector resources like social protection programs (including AIP, social cash transfers, and public works programs).
Although our findings indicate that use of the selected CSA technologies significantly increased maize productivity, they also show that combining these CSA technologies with AIP inorganic fertilizer does not result in any additional gains in productivity. This could be because of the inverse relationship that was observed between access to AIP and use of CSA technologies, where farmers who used inorganic fertilizers (largely sourced through AIP) were less likely to implement complementary CSA technologies. Thus, farmers who accessed inorganic fertilizer through AIP could have thinly distributed the input on the land and also used less of the CSA technologies. Substantiating this claim, the t-test result suggested no significant difference between the quantity of inorganic fertilizer used by farmers who integrated CSA and AIP inputs and those who did not. Thus, at this rate of application, the integration was less likely to yield additional maize productivity gains.
We, however, acknowledge that our sample size of 307 households from six districts may limit the generalizability of these results to other regions of Malawi or other contexts. Future studies with larger and more geographically diverse samples would help confirm these findings. We also note that the integration analysis does not fully control for both fertilizer application intensity (kg/ha) and CSA inputs. Although the t-test revealed no significant difference in the quantity of inorganic fertilizer used by integrated and non-integrated farmers, this was not enough to provide significant evidence on why integration did not provide additional benefits. Nonetheless, our study provides an important step toward understanding why decades of public expenditure on farm input subsidies in Malawi have not yielded many gains in maize productivity. Future studies with more detailed input quantity data could address this gap. Additionally, the impact analysis aggregates the three CSA technologies into a single binary treatment, while the adoption model treats them separately. This simplification was necessary given the sample size (n = 307), which does not support reliable estimation of technology-specific treatment effects. Future studies with larger samples could estimate the individual impact of mulching, agroforestry, and organic manure on maize productivity.
In light of this information, policymakers should consider awareness initiatives aimed at providing farmers with the proper knowledge of input use and integration of different farming practices in order to maximize productivity gains. This can be achieved through targeted awareness campaigns, training programs, and field demonstrations. By doing so, farmers can gain the knowledge to make calculated decisions on how to get the most out of their limited resources. Further, partnerships amongst government entities, agricultural organizations, and research institutions can play a vital role in developing and disseminating key messages regarding CSA, thereby providing farmers with the essential knowledge needed to reach their productivity goals.

5. Conclusions and Policy Implications

We analyzed the maize productivity impacts of integrating a variety of CSA technologies with the use of inorganic fertilizers on smallholder farms. For almost twenty years, the government of Malawi has invested heavily in fertilizer subsidies with the aim of increasing smallholder maize production for sustainable food security. However, the effectiveness of the program is continuously hindered by the challenges of poor soil health and frequent dry spells. At the same time, there is mounting evidence supporting the use of CSA technologies as effective approaches to building soil health, enhancing nutrient uptake, and minimizing the negative effects of weather shocks on crop yield [59,60]. This raises the question of whether the productivity gains of AIP can be meaningfully enhanced if the use of subsidized inorganic fertilizers is complemented with other CSA technologies.
While a meta-analysis by [20] revealed an attempt by several studies to address this question using evidence from experimental plots, this study extends the literature by using data from farmer-managed fields to evaluate the practical nexus between CSA, inorganic fertilizers, and maize productivity. The CSA technologies in focus were mulching, agroforestry, and organic manure.
Empirical estimations were conducted using data from 307 smallholder maize farmers from six districts in central and southern Malawi. The maize productivity impact of adopting CSA technologies was 253.78 kg per hectare, indicating that CSA adopters were 30% more productive than non-adopters. However, the decision to integrate CSA technologies with inorganic fertilizer did not yield an advantage to adopters over non-adopters. The calculated ATT of 55.80 kg per hectare, representing a 7% increase in maize productivity, was not statistically significant. This implies that integrating CSA technologies with the use of inorganic fertilizer did not offer any additional benefits for maize productivity. This could be attributed to the inverse relationship that was observed between access to AIP and use of CSA technologies, where farmers treated the two as substitutes and not complements.
Following these findings, we make the following recommendations: (1) policymakers should consider awareness initiatives aimed at providing farmers with the proper knowledge of input use and integration with other CSA technologies. This includes developing and disseminating fertilizer recommendations customized for various soil types and ecological conditions of the country. (2) Policymakers should consider conditioning subsidy participation to CSA adoption. This could be achieved by embedding AIP into a holistic food security program that facilitates and monitors the implementation of CSA technologies as a prerequisite for accessing the subsidized inputs. We believe that this would solve the problem of farmers treating the two as substitutes rather than as complements. Finally, with respect to the findings of [1], who reported a maize productivity of 1.5 tons/ha, it is clear from our results that the country needs more studies to understand the key factors limiting maize yield in the country. Thus, future research should consider using longitudinal data and nationally representative data to further understand this complex question of low maize productivity amidst continued public expenditure in yield-enhancing programs.


Author Contributions

Conceptualization, S.P.K. and K.R.; methodology, K.R. and S.P.K., software, S.P.K.; validation, S.T., S.T.H. and M.T.; formal analysis, K.R.; investigation, S.P.K., S.T., S.T.H. and M.T.; resources, S.P.K., S.T., S.T.H. and M.T.; data curation, S.P.K. and K.R.; writing—original draft preparation, S.P.K.; writing—review and editing, K.R., S.T., S.T.H. and M.T.; visualization, S.T.H.; supervision, S.P.K.; project administration, S.P.K.; funding acquisition, S.P.K. and S.T.H. All authors have read and agreed to the published version of the manuscript.

Funding

This research was funded by the SMARTEX project, with funding from NORHED II–2021-2026/QZA-21/0182.

Institutional Review Board Statement

The 2022 SMARTEX data collection followed all the ethical standards as guided by the Declaration of Helsinki where participation was based on informed consent and participants were allowed to opt out at any time All data was properly coded to ensure privacy and confidentiality. However, the study did not apply for ethical review with any institutional review board since at the time of the study, LUANAR, the hosting institution had not yet established a research ethics review board.

Informed Consent Statement

Informed consent was obtained from all subjects involved in the study.

Data Availability Statement

The research data are available from the authors and will be shared accordingly.

Acknowledgments

This is an output of the Experiments for Development of Climate-Smart Agriculture (SMARTEX) project, the Highlands.3—Collective Approach of Research and Innovation for Sustainable Development in Highlands, and the Sustainable Food Systems for Rural Resilience and Transformation (TRANSFORM) project. The three projects were a collaboration between the Norwegian University of Life Sciences and the Lilongwe University of Agriculture and Natural Resources. Both SMARTEX and TRANSFORM were NORAD-funded Norwegian Program for Capacity Development in Higher Education and Research (NORHED) projects, while Highlands.3 was funded by the European Commission. We further acknowledge the invaluable support from LUANAR students who organized the data used in this paper, namely Wiseman Banda, Stella Kumphika and Patrick Kawaye Chinseu. The authors take full responsibility for any remaining errors.

Conflicts of Interest

The authors declare no conflicts of interest.

Appendix A

Table A1. Diagnostic tests of PSM algorithms for maize productivity impacts of CSA adoption.
Matching AlgorithmMatched Sample SizePseudo R-SquareMean BiasInsignificant Variables After Matching
Kernel (0.1)2990.0104.812
Kernel (0.25)3000.0257.811
Nearest neighbor (1)3000.03511.28
Nearest neighbor (2)3000.0075.411
Radius (0.1)3000.0135.912
Radius (0.2)3000.0288.211
Table A2. Diagnostic tests of PSM algorithms for maize productivity impacts of integrating CSA technologies with inorganic fertilizers.
Matching AlgorithmMatched
Sample Size
Pseudo
R-Square
Mean BiasInsignificant Variables After Matching
Kernel (0.1)2100.0074.610
Kernel (0.25)2100.0249.010
Nearest neighbor (1)2100.0177.710
Nearest neighbor (2)2100.0095.710
Radius (0.1)2100.0095.010
Radius (0.2)2100.0289.710

References

  1. NSO. National Census of Agriculture (NACA) 2025, Main Report; National Statistics Office: Zomba, Malawi, 2026. [Google Scholar]
  2. Kawaye, F.P.; Hutchinson, M.F. Maize, cassava, and sweet potato yield on monthly climate in Malawi. In African Handbook of Climate Change Adaptation; Springer: Berlin/Heidelberg, Germany, 2020; pp. 1–21. [Google Scholar]
  3. Anghileri, D.; Chibarabada, T.P.; Gadedjisso-Tossou, A.; Craig, A.; Li, C.; Lu, Y.; Chimimba, E.G.; Kambombe, O.; Musa, F.; Ngongondo, C. Understanding the maize yield gap in Southern Malawi by integrating ground and remote-sensing data, models, and household surveys. Agric. Syst. 2024, 218, 103962. [Google Scholar] [CrossRef]
  4. Chadza, W.; Duchoslav, J. Policy Options for Smart Subsidies in Malawi; MwAPATA Institute: Lilongwe, Malawi, 2022; Policy Research Brief No. 13. [Google Scholar]
  5. Lee, H.; Calvin, K.; Dasgupta, D.; Krinner, G.; Mukherji, A.; Thorne, P.; Trisos, C.; Romero, J.; Aldunce, P.; Barret, K. IPCC, 2023: Climate Change 2023: Synthesis Report, Summary for Policymakers. Contribution of Working Groups I, II and III to the Sixth Assessment Report of the Intergovernmental Panel on Climate Change; Lee, H., Romero, J., Eds.; IPCC: Geneva, Switzerland, 2023. [Google Scholar]
  6. Messina, J.P.; Peter, B.G.; Snapp, S.S. Re-evaluating the Malawian farm input subsidy programme. Nat. Plants 2017, 3, 17013. [Google Scholar] [CrossRef]
  7. Pauw, K.; Thurlow, J. Malawi’s Farm Input Subsidy Program: Where Do We Go from Here; International Food Policy Research Institute (IFPRI): Washington, DC, USA, 2014; Volume 18. [Google Scholar]
  8. Ricker-Gilbert, J.; Jayne, T. What are the enduring effects of fertilizer subsidy programs on recipient farm households. Evid. Malawi. Staff Pap. 2011, 9, 49. [Google Scholar] [CrossRef]
  9. Beckline, M.; Mukete, N.; Mukete, T. Impact of extreme weather events on agricultural production and household livelihoods in rural Malawi. Acad. Environ. Sci. Sustain. 2025, 2. [Google Scholar] [CrossRef]
  10. Katengeza, S.P.; Holden, S.T.; Fisher, M. Use of integrated soil fertility management technologies in Malawi: Impact of dry spells exposure. Ecol. Econ. 2019, 156, 134–152. [Google Scholar] [CrossRef]
  11. Katengeza, S.P.; Holden, S.T.; Lunduka, R.W. Adoption of drought tolerant maize varieties under rainfall stress in Malawi. J. Agric. Econ. 2019, 70, 198–214. [Google Scholar] [CrossRef]
  12. Kassie, M.; Teklewold, H.; Jaleta, M.; Marenya, P.; Erenstein, O. Understanding the adoption of a portfolio of sustainable intensification practices in eastern and southern Africa. Land Use Policy 2015, 42, 400–411. [Google Scholar] [CrossRef]
  13. Kato, E.; Ringler, C.; Yesuf, M.; Bryan, E. Soil and water conservation technologies: A buffer against production risk in the face of climate change? Insights from the Nile basin in Ethiopia. Agric. Econ. 2011, 42, 593–604. [Google Scholar] [CrossRef]
  14. Snapp, S.; Jayne, T.S.; Mhango, W.; Benson, T.; Ricker-Gilbert, J. Maize Yield Response to Nitrogen in Malawi’s Smallholder Production Systems, in Malawi Strategy Support Proram; International Food Policy Institute: Washington, DC, USA, 2014. [Google Scholar]
  15. Government of Malawi. National Agriculture Policy; Ministry of Agriculture, Irrigation and Water Development: Lilongwe, Malawi, 2024. [Google Scholar]
  16. Lipper, L.; Mann, W.; Meybeck, A.; Sessa, R. Climate-Smart” Agriculture: Policies, Practices and Financing for Foodsecurity, Adaptation and Mitigation; FAO: Rome, Italy, 2010. [Google Scholar]
  17. Lipper, L.; Thornton, P.; Campbell, B.M.; Baedeker, T.; Braimoh, A.; Bwalya, M.; Caron, P.; Cattaneo, A.; Garrity, D.; Henry, K. Climate-smart agriculture for food security. Nat. Clim. Change 2014, 4, 1068–1072. [Google Scholar] [CrossRef]
  18. FAO. Climate-Smart Agriculture Sourcebook; FAO: Rome, Italy, 2013. [Google Scholar]
  19. CIAT World Bank. Climate-Smart Agriculture in Malawi, in CSA Country Profiles for Africa Series; International Center for Tropical Agriculture (CIAT): Washington, DC, USA, 2018. [Google Scholar]
  20. Katengeza, S.P. Impact of farm input subsidies vis-à-vis climate-smart technologies on maize productivity: A tale of smallholder farmers in Malawi. In Climate Impacts on Agricultural and Natural Resource Sustainability in Africa; Springer: Berlin/Heidelberg, Germany, 2020; pp. 549–567. [Google Scholar]
  21. Holden, S.T. Fertilizer and Sustainable Intensification in Africa; Norwegian University of Life Sciences, Centre for Land Tenure Studies: Høyskoleveien, Norway, 2019. [Google Scholar]
  22. Vanlauwe, B.; Aihou, K.; Aman, S.; Iwuafor, E.; Tossah, B.; Diels, J.; Sanginga, N.; Lyasse, O.; Merckx, R.; Deckers, J. Maize yield as affected by organic inputs and urea in the West African moist savanna. Agron. J. 2001, 93, 1191–1199. [Google Scholar] [CrossRef]
  23. Munthali, M.W. Integrated soil fertility management technologies: A counteract to existing milestone in obtaining achievable economical crop yields in cultivated lands of poor smallholder farmers in Malawi. In Advances in Integrated Soil Fertility Management in Sub-Saharan Africa: Challenges and Opportunities; Springer: Berlin/Heidelberg, Germany, 2007; pp. 531–536. [Google Scholar]
  24. Tchale, H.; Sauer, J. The efficiency of maize farming in Malawi. A bootstrapped translog frontier. Cah. D’economie Sociol. Rural. 2007, 82, 33–56. [Google Scholar] [CrossRef]
  25. Vanlauwe, B.; Kihara, J.; Chivenge, P.; Pypers, P.; Coe, R.; Six, J. Agronomic use efficiency of N fertilizer in maize-based systems in sub-Saharan Africa within the context of integrated soil fertility management. Plant Soil 2011, 339, 35–50. [Google Scholar] [CrossRef]
  26. Nyagumbo, I.; Mutenje, M.; Setimela, P.; Chipindu, L.; Chisaka, A.; Simwaka, P.; Mwale, B.; Ngwira, A.; Mupangwa, W. Evaluating the merits of climate smart technologies under smallholder agriculture in Malawi. Soil Use Manag. 2022, 38, 890–906. [Google Scholar] [CrossRef]
  27. Ngwira, A.R.; Nyirenda, M.; Taylor, D. Toward sustainable agriculture: An evaluation of compost and inorganic fertilizer on soil nutrient status and productivity of three maize varieties across multiple sites in Malawi. Agroecol. Sustain. Food Syst. 2013, 37, 859–881. [Google Scholar] [CrossRef]
  28. Phiri, A.T.; Malola, K.; Mwafulirwa, S.; Simwaka, P. Improving Maize Productivity under Rain-Fed Conditions through the Combined Use of Inorganic and Organic Fertilizer in Malawi. Asian Plant Res. J. 2020, 4, 22–27. [Google Scholar] [CrossRef]
  29. Chinseu, E.; Dougill, A.; Stringer, L. Why do smallholder farmers dis-adopt conservation agriculture? Insights from Malawi. Land Degrad. Dev. 2019, 30, 533–543. [Google Scholar] [CrossRef]
  30. Katengeza, S. Climate-Smart Agriculture in Malawi: Uptake and Opportunities in the Face of Climate Change; Norwegian University of Life Sciences: Høyskoleveien, Norway, 2018. [Google Scholar]
  31. Shani, F.K.; Joshua, M.; Ngongondo, C. Determinants of smallholder farmers’ adoption of climate-smart agricultural practices in zomba, eastern malawi. Sustainability 2024, 16, 3782. [Google Scholar] [CrossRef]
  32. Lunduka, R.; Ricker-Gilbert, J.; Fisher, M. What are the farm-level impacts of Malawi’s farm input subsidy program? A critical review. Agric. Econ. 2013, 44, 563–579. [Google Scholar] [CrossRef]
  33. Ricker-Gilbert, J.; Jayne, T.S. Estimating the enduring effects of fertiliser subsidies on commercial fertiliser demand and maize production: Panel data evidence from Malawi. J. Agric. Econ. 2017, 68, 70–97. [Google Scholar] [CrossRef]
  34. Carr, S. The Challenge of Africa s Nitrogen Drought: Some Indicators from the Malawian Experience; International Food Policy Research Institute (IFPRI): Washington, DC, USA, 2014; Volume 19. [Google Scholar]
  35. Ragasa, C.; Balakasi, K.; Carrillo, L. Resilience in the Malawi Agri-Food System Amid the COVID-19 Crisis: Evidence from a 2021 Nationally Representative Household Survey; International Food Policy Research Institute (IFPRI): Washington, DC, USA, 2022. [Google Scholar]
  36. Nyirenda, Z.; Chigaru, F.; Nyondo, C.; Khonje, M.; Wineman, A.; Muyanga, M. A Rapid Assessment of the Implementation of the 2020/21 Affordable Inputs Program in Malawi; AgEcon Search: St. Paul, MN, USA, 2021. [Google Scholar]
  37. Civil Society Agriculture Network (CISANET). A 2023–2024 Financial Year Agriculture Sector, in Policy Brief.; Civil Society Agriculture Network (CISANET): Lilongwe, Malawi, 2023; pp. 1–7. [Google Scholar]
  38. Wooldridge, J.M. Econometric Analysis of Cross Section and Panel Data; MIT Press: Cambridge, MA, USA, 2010. [Google Scholar]
  39. Farrell, M.H. Robust inference on average treatment effects with possibly more covariates than observations. J. Econom. 2015, 189, 1–23. [Google Scholar] [CrossRef]
  40. Cattaneo, M.D. Efficient semiparametric estimation of multi-valued treatment effects under ignorability. J. Econom. 2010, 155, 138–154. [Google Scholar] [CrossRef]
  41. Genbäck, M.; de Luna, X. Causal inference taking into account unobserved confounding. arXiv 2017, arXiv:1712.00292. [Google Scholar] [CrossRef]
  42. Nkala, P.; Mango, N.; Zikhali, P. Conservation agriculture and livelihoods of smallholder farmers in Central Mozambique. J. Sustain. Agric. 2011, 35, 757–779. [Google Scholar] [CrossRef]
  43. Teklewold, H.; Kassie, M.; Shiferaw, B.; Köhlin, G. Cropping system diversification, conservation tillage and modern seed adoption in Ethiopia: Impacts on household income, agrochemical use and demand for labor. Ecol. Econ. 2013, 93, 85–93. [Google Scholar] [CrossRef]
  44. Kaselema, K.; Batala, P. Assessing the Impact of Crop Diversification on Crop Productivity Among Smallholder Farmers in Malawi. Preprints 2025. [Google Scholar] [CrossRef]
  45. Lunduka, R.W. Land Rental Markets, Investment and Productivity Under Customary Land Tenure Systems in Malawi; Norwegian University of Life Sciences: Høyskoleveien, Norway, 2009. [Google Scholar]
  46. Holden, S.; Lunduka, R. Do fertilizer subsidies crowd out organic manures? The case of Malawi. Agric. Econ. 2012, 43, 303–314. [Google Scholar] [CrossRef]
  47. Nkhoma, P.R. The evolution of agricultural input subsidy programs: Contextualizing policy debates in Malawi’s FISP. World Dev. Perspect. 2018, 9, 12–17. [Google Scholar] [CrossRef]
  48. Ward, P.S.; Bell, A.R.; Droppelmann, K.; Benton, T.G. Early adoption of conservation agriculture practices: Understanding partial compliance in programs with multiple adoption decisions. Land Use Policy 2018, 70, 27–37. [Google Scholar] [CrossRef]
  49. Amadu, F.O.; McNamara, P.E.; Miller, D.C. Understanding the adoption of climate-smart agriculture: A farm-level typology with empirical evidence from southern Malawi. World Dev. 2020, 126, 104692. [Google Scholar] [CrossRef]
  50. Government of Malawi. National Resilience Strategy (2018–2030); Department of Disaster Management Affairs: Lilongwe, Malawi, 2018. [Google Scholar]
  51. Olumeh, D.E.; Mithöfer, D. Impact of collective action on household welfare: Empirical evidence from baobab collectors in Malawi. Ann. Public Coop. Econ. 2024, 95, 385–411. [Google Scholar] [CrossRef]
  52. Machira, K.; Mgomezulu, W.R.; Malata, M. Understanding poverty dimensions and transitions in Malawi: A panel data approach. Res. Glob. 2023, 7, 100160. [Google Scholar] [CrossRef]
  53. Mgomezulu, W.R.; Edriss, A.-K.; Machira, K.; Pangapanga-Phiri, I. Towards sustainability in the adoption of sustainable agricultural practices: Implications on household poverty, food and nutrition security. Innov. Green Dev. 2023, 2, 100054. [Google Scholar] [CrossRef]
  54. Mgomezulu, W.R.; Machira, K.; Edriss, A.-K.; Pangapanga-Phiri, I. Modelling farmers’ adoption decisions of sustainable agricultural practices under varying agro-ecological conditions: A new perspective. Innov. Green Dev. 2023, 2, 100036. [Google Scholar] [CrossRef]
  55. Becker, S.O.; Ichino, A. Estimation of average treatment effects based on propensity scores. Stata J. 2002, 2, 358–377. [Google Scholar] [CrossRef]
  56. Imbens, G.W.; Wooldridge, J.M. Recent developments in the econometrics of program evaluation. J. Econ. Lit. 2009, 47, 5–86. [Google Scholar] [CrossRef]
  57. Pangapanga-Phiri, I.; Mungatana, E.D.; Pangapanga, L.; Nkoka, F.S. Understanding the impact of sustainable land-scape management practices on farm productivity under intensifying tropical cyclones: Evidence from Southern Malawi. Trop. Cyclone Res. Rev. 2022, 11, 265–276. [Google Scholar] [CrossRef]
  58. Khonje, M.G.; Manda, J.; Mkandawire, P.; Tufa, A.H.; Alene, A.D. Adoption and welfare impacts of multiple agricultural technologies: Evidence from eastern Zambia. Agric. Econ. 2018, 49, 599–609. [Google Scholar] [CrossRef]
  59. Bunderson, W.T.; Jere, Z.D.; Thierfelder, C.; Gama, M.; Mwale, B.M.; Ng’oma, S.W.; Museka, R.M.; Paul, J.M.; Mbale, B.; Mkandawire, O. Implementing the principles of conservation agriculture in Malawi: Crop yields and factors affecting adoption. In Conservation Agriculture for Africa: Building Resilient Farming Systems in a Changing Climate; CABI: Wallingford, UK, 2017; pp. 75–99. [Google Scholar]
  60. Steward, P.R.; Dougill, A.J.; Thierfelder, C.; Pittelkow, C.M.; Stringer, L.C.; Kudzala, M.; Shackelford, G.E. The adaptive capacity of maize-based conservation agriculture systems to climate stress in tropical and subtropical environments: A meta-regression of yields. Agric. Ecosyst. Environ. 2018, 251, 194–202. [Google Scholar] [CrossRef]
Figure 1. Conceptual framework; source: adapted from [20].
Sustainability 18 03929 g001
Figure 2. Map of Malawi showing the study area.
Sustainability 18 03929 g002
Figure 3. Distribution of farmers according to AIP, fertilizer use, and CSA adoption.
Sustainability 18 03929 g003
Figure 4. Adoption rates of the selected CSA technologies in each district.
Sustainability 18 03929 g004
Figure 5. Distribution of CSA adopters vis-à-vis integration with inorganic fertilizers.
Sustainability 18 03929 g005
Table 1. Study area and number of respondents.
TALilongweKasunguMachingaZombaThyoloChiradzuluTotal
Malili36 36
Chilowamatambe48 48
Kaomba 29 29
Kawinga 41 41
Chikowi 47 47
Kuntumanji 26 26
Bvumbwe 46 46
Ntchema 3434
Grand Total367741734634307
Table 2. Summary statistics of independent variables.
VariableMeanAdopter (n = 215)Non-Adopter (n = 92)p-Value
Male (%)64.1764.1964.130.993
Married (%)63.1964.1960.870.581
Age (years)55.2154.7956.200.429
Household size5.135.105.220.603
Education(years)5.145.304.180.039 *
Access to AIP (%)65.8063.7270.650.241
Access to extension (%)69.3873.0260.870.034 **
Access to credit (%)44.3043.2646.740.574
Own livestock (%)70.6873.4964.130.099 *
Mixed crop stand (%)55.0562.7936.960.000 ***
Land for maize (ha)1.191.201.170.865
Improved seed (%)59.8056.6767.030.092 *
Quantity of maize seed14.4515.4412.150.069 *
Yield per hectare757.24813.09626.710.156
Annual income (MWK)238,103.96230,987.50254,734.900.4623
2022 average exchange rate; 1$ = MWK 934.1089. Note: p-values are from two-sample t-tests for continuous variables and Pearson chi-squared tests for categorical (binary) variables, comparing CSA adopters and non-adopters. Significance levels: * p < 0.10, ** p < 0.05, *** p < 0.01.
Table 3. Probit estimates of the determinants of CSA adoption.
VariableProbit EstimatesMarginal Effects
Coeff.Std. ErrorCoeff.Std. Error
Constant 0.34080.6634
Access to AIP−0.3168 *0.1793−0.103 *0.056
Own livestock0.15740.18540.0540.0646
Access to extension0.3528 **0.1730.1227 **0.0617
Good soil−0.0590.165−0.01980.0552
Household size−0.0560.0456−0.01880.0153
Age−0.00340.0067−0.00110.0023
Mixed crop stand0.6482 ***0.1630.2199 ***0.0546
Club membership−0.70851.0193−0.26960.4034
Years of education0.03340.02590.01120.0087
Household Dietary Diversity Score (HDDS)−0.02290.0417−0.00770.014
Quantity of seed0.0146 ***0.00740.0049 ***0.0025
Local variety0.18650.17170.0620.0562
Log-likelihood = −165.75014; Pseudo R2 = 0.096; Prob > chi2 = 0.0005; n = 300. Dependent variable: adoption of any of the selected CSA, *** = significant at 1%, ** = significant at 5%, * = significant at 10%.
Table 4. Correlation coefficients of error terms across CSA adoption equations.
CSA TechnologyMulchingAgroforestryOrganic Manure
Mulching1.0000
Agroforestry−0.07461.0000
Organic manure−0.02840.11171.0000
Chi2(3) = 5.655; Pr = 0.0297.
Table 5. Multivariate Probit estimate of the determinants of CSA adoption.
VariableMulchingAgroforestryOrganic Manure
Coeff.MECoeff.MECoeff.ME
Constant−0.43 −0.645 0.039
(0.69) (0.64) (0.66)
Access to AIP−0.089−0.035−0.052−0.017−0.344 **0.042
(0.18)(0.00)(0.17)(0.00)(0.17)(0.01)
Own livestock−0.06−0.0240.326 *0.1180.325 *0.068
(0.20)(0.00)(0.18)(0.01)(0.19)(0.01)
Access to extension0.2130.0750.0940.0340.2620.043
(0.19)(0.01)(0.17)(0.00)(0.18)(0.01)
Good soil−0.179−0.0660.2130.077−0.276 *0.027
(0.17)(0.01)(0.16)(0.01)(0.16)(0.00)
Household size−0.03−0.009−0.065−0.024−0.009−0.015
(0.05)(0.00)(0.05)(0.00)(0.05)(0.00)
Age−0.009−0.0030.0040.001−0.004−0.003
(0.01)0.00(0.01)0.00(0.01)0.00
Mixed crop stand1.212 ***0.433−0.142−0.050.2030.017
(0.19)(0.05)(0.16)(0.01)(0.16)(0.00)
Years of education0.0150.0040.0220.0080.014−0.009
(0.03)(0.00)(0.02)(0.00)(0.03)(0.00)
HDDS−0.032−0.012−0.013−0.005−0.0550.030
(0.04)(0.00)(0.04)(0.00)(0.04)(0.00)
Quantity of seed−0.004−0.0010.014 **0.0050.0010.003
(0.01)0.00(0.01)(0.00)(0.01)0.00
Local variety0.1360.05−0.142−0.05−0.1180.108
(0.18)(0.01)(0.16)(0.01)(0.16)(0.01)
Log-likelihood = −516.2662; Prob > chi2 = 0.0000; n = 300. *** = significant at 1%, ** = significant at 5%, * = significant at 10%.
Table 6. Normalized differences in pre-treatment variables.
VariableDifference Normalized
Access to AIP0.069
Own livestock−0.094
Access to extension−0.122
Good soil0.024
Household size0.120
Age1.405
Mixed crop stand−0.258
Club membership−0.006
Years of education−0.531
HDDS−0.063
Quantity of seed−3.298
Local maize variety−0.104
Table 7. Determinants of maize productivity among CSA adopters and non-adopters.
VariableAdopters (n = 215)Non-Adopters (n = 92)
Coeff.Std. ErrorCoeff.Std. Error
Constant91.61980.89−155.91521.91
Access to AIP90.73205.7955.51132.34
Own livestock358.22 *199.58930.08104.48
Access to extension−395.69 *211.8754.94116.10
Good soil336.58 *175.00168.59 *94.97
Household size8.4545.40−14.0830.60
Age8.8310.204.676.64
Mixed crop stand−71.41197.26−34.78116.22
Club membership−391.29304.10−613.17 ***205.58
Years of education−8.6732.1512.2425.05
HDDS17.9245.1255.18 **24.90
Quantity of seed−2.414.19−2.173.31
Local maize variety−76.93175.15−218.63 *120.00
Over-identification test for covariate balance Chi(13) = 5.4841; p-value = 0.0629, *** = significant at 1%, ** = significant at 5%, * = significant at 10%.
Table 8. IPWRA estimate of the treatment effects of CSA adoption on maize productivity.
CoefficientRobust Std. Error
Adopters (n = 215)846.52 ***93.48
Non adopters (n = 92)592.78 ***60.20
ATT253.78 ***103.14
*** = significant at 1%.
Table 9. PSM estimates of treatment effects of CSA adoption on maize productivity.
Matching AlgorithmAdopterNon-AdopterATTChange (%)
Kernel (0.1)817.26586.92230.3428.18
Kernel (0.25)817.82619.29198.5324.28
Nearest neighbor (1)817.82530.79287.0335.10
Nearest neighbor (2)817.82528.15289.6735.42
Radius (0.1)817.28605.15212.1125.95
Radius (0.2)817.82622.90194.2023.75
Note: Results of diagnostic tests of PSM algorithms are shown in Appendix Table A1.
Table 10. Determinants of maize productivity among farmers who did and did not integrate CSA technologies with inorganic fertilizers.
VariableSelection Equation
(n = 215)
Integrated
(n = 146)
Non-Integrated
(n = 69)
Coeff.Std. ErrorCoeff.Std. ErrorCoeff.Std. Error
Constant0.6750.6941019.23 649.536−1103.671815.96
Access to AIP0.1590.20527.14177.349−198.687343.279
Own livestock0.1580.210508.535 ***156.254454.836289.442
Access to extension0.20 *0.209−541.129 **253.839−340.652264.196
Household size−0.1030.057−4.11950.69111.96788.908
Age−0.0110.008−1.5478.60121.32121.644
Mixed crop stand0.1970.19718.133229.94131.633296.905
Yrs. of education−0.0110.028−9.78137.1060.30938.125
Quantity of seed0.011 *0.006−0.253.1354.25513.925
Local variety 0.384 *0.197−129.68195.137248.163311.448
Married0.2560.20756.01228.174788.77 *341.82 *
Over-identification test for covariate balance Chi(11) = 7.204; p-value = 0.7823. *** = significant at 1%, ** = significant at 5%, * = significant at 10%.
Table 11. Maize productivity impacts of integrating CSA technologies with inorganic fertilizers.
CoefficientRobust Std. Error
Integrated (n = 146)847.88 ***96.76 ***
Not integrated (n = 69)792.08 ***152.57 ***
ATT55.80182.15
Change (%)6.58
*** = significant at 1%.
Table 12. PSM estimates of the treatment effects of integrating CSA technologies with inorganic fertilizers on maize productivity.
Matching AlgorithmAdopterNon-AdopterATTChange (%)
Kernel (0.1)845.95776.2769.688.24
Kernel (0.25)845.95777.1068.848.14
Nearest neighbor (1)845.95885.39−39.45−4.66
Nearest neighbor (2)845.95956.50−110.57−13.07
Radius (0.1)845.95759.0286.9310.28
Radius (0.2)845.95775.1170.848.37
Table 13. Quantity of inorganic fertilizer used by integrated and non-integrated farmers.
Group of FarmersObsMeanStd. Err.t-Test
Non-Integrated198111.01519.680
Integrated109136.47720.814
Combined307120.05514.683
Diff −25.46230.700−0.829
Disclaimer/Publisher’s Note: The statements, opinions and data contained in all publications are solely those of the individual author(s) and contributor(s) and not of MDPI and/or the editor(s). MDPI and/or the editor(s) disclaim responsibility for any injury to people or property resulting from any ideas, methods, instructions or products referred to in the content.