Article

CARYPAR: A Multimodal Decision-Support Framework Integrating Satellite Bio-Environmental Reanalysis and Proximal Edge-Intelligence for Hylocereus spp. Health Monitoring


by
Carlos Diego Rodríguez-Yparraguirre
1,
Abel José Rodríguez-Yparraguirre
2,*,
Cesar Moreno-Rojo
2,
Wendy Akemmy Castañeda-Rodríguez
3,
Iván Martin Olivares-Espino
1,
Andrés David Epifania-Huerta
4,
María Adriana Vilchez-Reyes
5,
Dany Paul Gonzales-Romero
4,
Enrique Jannier Boy-Vásquez
6 and
Wilson Arcenio Maco-Vasquez
1
1
Graduate School, Universidad Nacional de Trujillo, Trujillo 130101, La Libertad, Peru
2
Department of Agroindustry and Agronomy, Faculty of Engineering, Universidad Nacional del Santa, Nuevo Chimbote 02712, Ancash, Peru
3
Doctoral Program in Agro-Industrial Engineering, Specialization in Advanced Processing of Andean Grains and Tubers, Universidad Nacional del Santa, Nuevo Chimbote 02712, Ancash, Peru
4
Graduate School, Universidad Nacional de Barranca, Barranca 15321, Lima, Peru
5
Facultad Ciencia de la Salud, Escuela Profesional de Enfermería, Universidad Católica Los Ángeles de Chimbote, Chimbote 02804, Ancash, Peru
6
Graduate School, Universidad Privada de Trujillo, Trujillo 13001, La Libertad, Peru
*
Author to whom correspondence should be addressed.
Sustainability 2026, 18(8), 3928; https://doi.org/10.3390/su18083928
Submission received: 7 March 2026 / Revised: 6 April 2026 / Accepted: 13 April 2026 / Published: 15 April 2026
(This article belongs to the Section Sustainable Agriculture)

Abstract

Pitahaya (Hylocereus spp.) production is increasingly affected by climatic factors, as well as by phytopathogens and abiotic stress, leading to delays in agronomic interventions and reduced productivity. The objective was to design, implement, and validate a multimodal system (CARYPAR) that enables early disease detection and agile decision-making, characterized by low latency and reduced dependence on cloud connectivity. The methodology integrates climate reanalysis from NASA POWER, biophysical remote sensing variables derived from Sentinel-1/2, and proximal computer vision captured via mobile devices using a late fusion architecture and an optimized convolutional neural network, EfficientNet-V2B0, which discriminates between optimal and pathological conditions in vegetative tissues and fruit. The results of the experimental validation carried out in 160 georeferenced units achieved an overall accuracy of 80.0% and an F1 score of 0.8645 for Bad Fruit. The McNemar test and the operational agreement with agro-industrial experts yielded a Cohen’s Kappa index of κ = 0.6831, with an inference latency reduced to 22.00 ms. It is concluded that the multimodal integration of satellite bio-environmental data with edge computer vision achieves substantial agreement with agronomic expert judgment under heterogeneous field conditions (Cohen’s κ = 0.6831), supporting its role as a decision-support tool rather than a replacement for expert assessment. Therefore, its adoption can enhance real-time irrigation management and crop protection, while contributing to traceability and sustainable resource management in agricultural regions with limited connectivity.

1. Introduction

The global expansion of pitahaya (Hylocereus spp.) as a high-value therapeutic and nutritional crop has been driven by its remarkable adaptability to diverse agroecological niches across Latin America and Europe. Despite its intrinsic resilience, current production systems face critical physiological limitations; recent agronomic evidence suggests that while optimized biotic control can catalyze increases of up to 310% in shoot emergence and 100% in bud sprouting, these productivity gains remain highly volatile under fluctuating field conditions [1]. Fungal and bacterial pathogens affecting the vascular integrity of stems and cladodes represent a systemic threat, particularly because their proliferation synchronizes with specific hydrothermal thresholds. Under suboptimal management scenarios, intensified physiological stress can elevate canopy temperatures to 43 °C, triggering a precipitous yield drop from 61 to 28 t ha−1 [2]. Consequently, there is an urgent need for diagnostic frameworks that transcend traditional visual inspection by integrating biological data from multiple sources to sustain crop viability in real time.
Three major phytopathogens affecting Hylocereus spp. generate diagnostically distinct signatures that can be captured through remote sensing and environmental monitoring. Colletotrichum gloeosporioides (anthracnose) induces necrotic lesions and chlorophyll degradation, resulting in measurable reductions in NDVI relative to baseline vegetation conditions, as spectral indices are directly sensitive to chlorophyll content and plant health status [3,4]. Fusarium oxysporum (vascular wilt) alters xylem function and increases plant-level water stress, which can be inferred from atmospheric demand patterns derived from temperature and relative humidity, known to regulate vegetation dynamics and stress responses [5,6]. In contrast, Erwinia carotovora (soft rot) degrades parenchymal tissue, causing moisture loss detectable through reductions in SAR backscatter, which is sensitive to vegetation water content and structural integrity [7]. These pathogen-specific responses support the integration of NDVI, SAR-derived signals, and hydrothermal variables as complementary features for environmentally informed disease detection.
Water stress, combined with the variability of the soil-environment interface, directly conditions reproductive physiology, as well as anthesis and fruit filling in pitahaya. These factors, alongside disparities in fertilization practices, converge into systemic biological risks manifested through pest outbreaks and a higher incidence of phytosanitary diseases. Global evidence shows that agricultural powerhouses such as Vietnam have reported a 14% reduction in cultivated area due to climate change effects and the lack of robust monitoring systems for proactive management of production variables [8]. These challenges take on critical relevance in emerging production zones such as the Amazon and the Peruvian inter-Andean valleys. In these regions, microclimate heterogeneity and variable edaphic conditions amplify stress patterns at the plot scale, compromising crop adaptability in the face of adverse climatic scenarios [9]. Within this context, the development of modeling strategies based on neural networks allows for early diagnosis and agile responses to moisture fluctuations, which can range between 4.11% and 20.10% depending on the fruit’s physical properties. Such approaches strengthen agricultural ecosystem resilience through data-driven decision-making within dynamic environments [10].
Recent advances in precision agriculture have driven the development of architectures such as AGRARIAN and TomDetLeaf, which focus on sensor-based monitoring, artificial intelligence, and edge computing to support decision-making. These architectures have reduced uncertainty in crop management, particularly in tomato production, achieving accuracy rates of up to 81.8% [11,12]. However, conventional approaches still rely heavily on periodic field exploration and laboratory confirmation [8]. In the specific case of pitahaya, the early symptoms of stem-related diseases can be extremely subtle, often misinterpreted as mechanical damage or stress-induced discoloration, leading to delayed interventions and further pathogen spread [13]. Regarding pitahaya specifically, early symptoms of stem-related diseases can be extremely subtle. These signs are often misinterpreted as mechanical damage or stress-induced discoloration, which leads to delayed interventions and further pathogen spread [14]. Simultaneously, factors such as soil pH, moisture, and temperature determine pathogen development and plant susceptibility when combined with broader environmental conditions, yet they are rarely integrated into operational monitoring workflows at the farm level, a fact that significantly limits the capacity for predictive and adaptive agricultural management [15].
The emergence of computer vision and machine learning has facilitated automated plant disease recognition using image-based datasets, while low-cost Internet of Things platforms provide continuous measurements of key environmental variables [16,17]. Nevertheless, integrating these capabilities into robust, real-time assessment systems remains a central engineering challenge. This is particularly evident regarding architectural interoperability, computational efficiency, and model deployment under actual field conditions [18]. A significant limitation of many agricultural intelligence solutions is their heavy reliance on cloud computing and stable network connectivity. Such factors are often unreliable in rural contexts and introduce latency into decision-making cycles [19,20]. Consequently, edge intelligence has been proposed as an alternative paradigm that enables on-site data processing near the source. This approach favors rapid inference without the need for continuous cloud communication. Such a decentralized strategy improves system responsiveness, reduces bandwidth requirements, and strengthens operational resilience in remote agricultural environments [21].
From an operational perspective, edge systems can reduce bandwidth requirements, improve data privacy, and ensure operational continuity, while also enabling localized adaptation to specific field conditions [22]. However, implementing edge intelligence for crop health assessment involves significant constraints related to computational resources, energy consumption, model size, and the real-time integration of heterogeneous data streams [23]. These limitations necessitate optimizing architectures and applying hardware and software co-design strategies to achieve reliable implementation in constrained environments, amidst an ongoing scientific debate about whether to prioritize lightweight and efficient models or complex architectures that, while more accurate, demand high computational capacity [24]. These divergent approaches underscore the need for integrated frameworks capable of balancing accuracy, interpretability, and operational feasibility in real-world agricultural environments, where scalability, maintainability, and robustness emerge as key drivers of technology adoption [25].
Multimodal assessment, which combines visual signals with edaphic and environmental variables, is increasingly recognized as a fundamental pathway to enhance system robustness compared to single-source monitoring approaches [18,26,27]. Image-only classifiers can be compromised by lighting variability, occlusions, background noise, and phenological differences, potentially leading to false positives or failed detections under field conditions [18,27,28,29]. Conversely, strategies based solely on sensors successfully capture stress-related signals but often lack the specificity required to differentiate between diseases, nutritional imbalances, or transient environmental fluctuations [30,31]. Integrating both modalities fosters complementary reasoning, where visual patterns provide symptom-level evidence while trends in pH, moisture, and temperature offer the contextual factors driving disease development and water stress [11,32,33]. Nevertheless, multimodal fusion introduces significant methodological challenges, including the synchronization of sampling rates, missing data management, calibration drift, and the propagation of uncertainty within decision-making outcomes [34].
To address the identified limitations, this study presents CARYPAR (Computational Analytics for Resources and Yield-focused Plant Agriculture Reports), an edge intelligence framework for real-time pitahaya assessment in Ancash, Peru. By integrating automated stem rot classification with continuous monitoring of soil and environmental variables (pH, humidity, and temperature), this system strengthens operational resilience and diagnostic accuracy under heterogeneous field conditions. The objective was to design, implement, and validate this multimodal architecture to enable early disease detection and agile decision-making, with low latency and reduced cloud dependence.

2. Materials and Methods

2.1. Experimental Design and Conceptual Framework

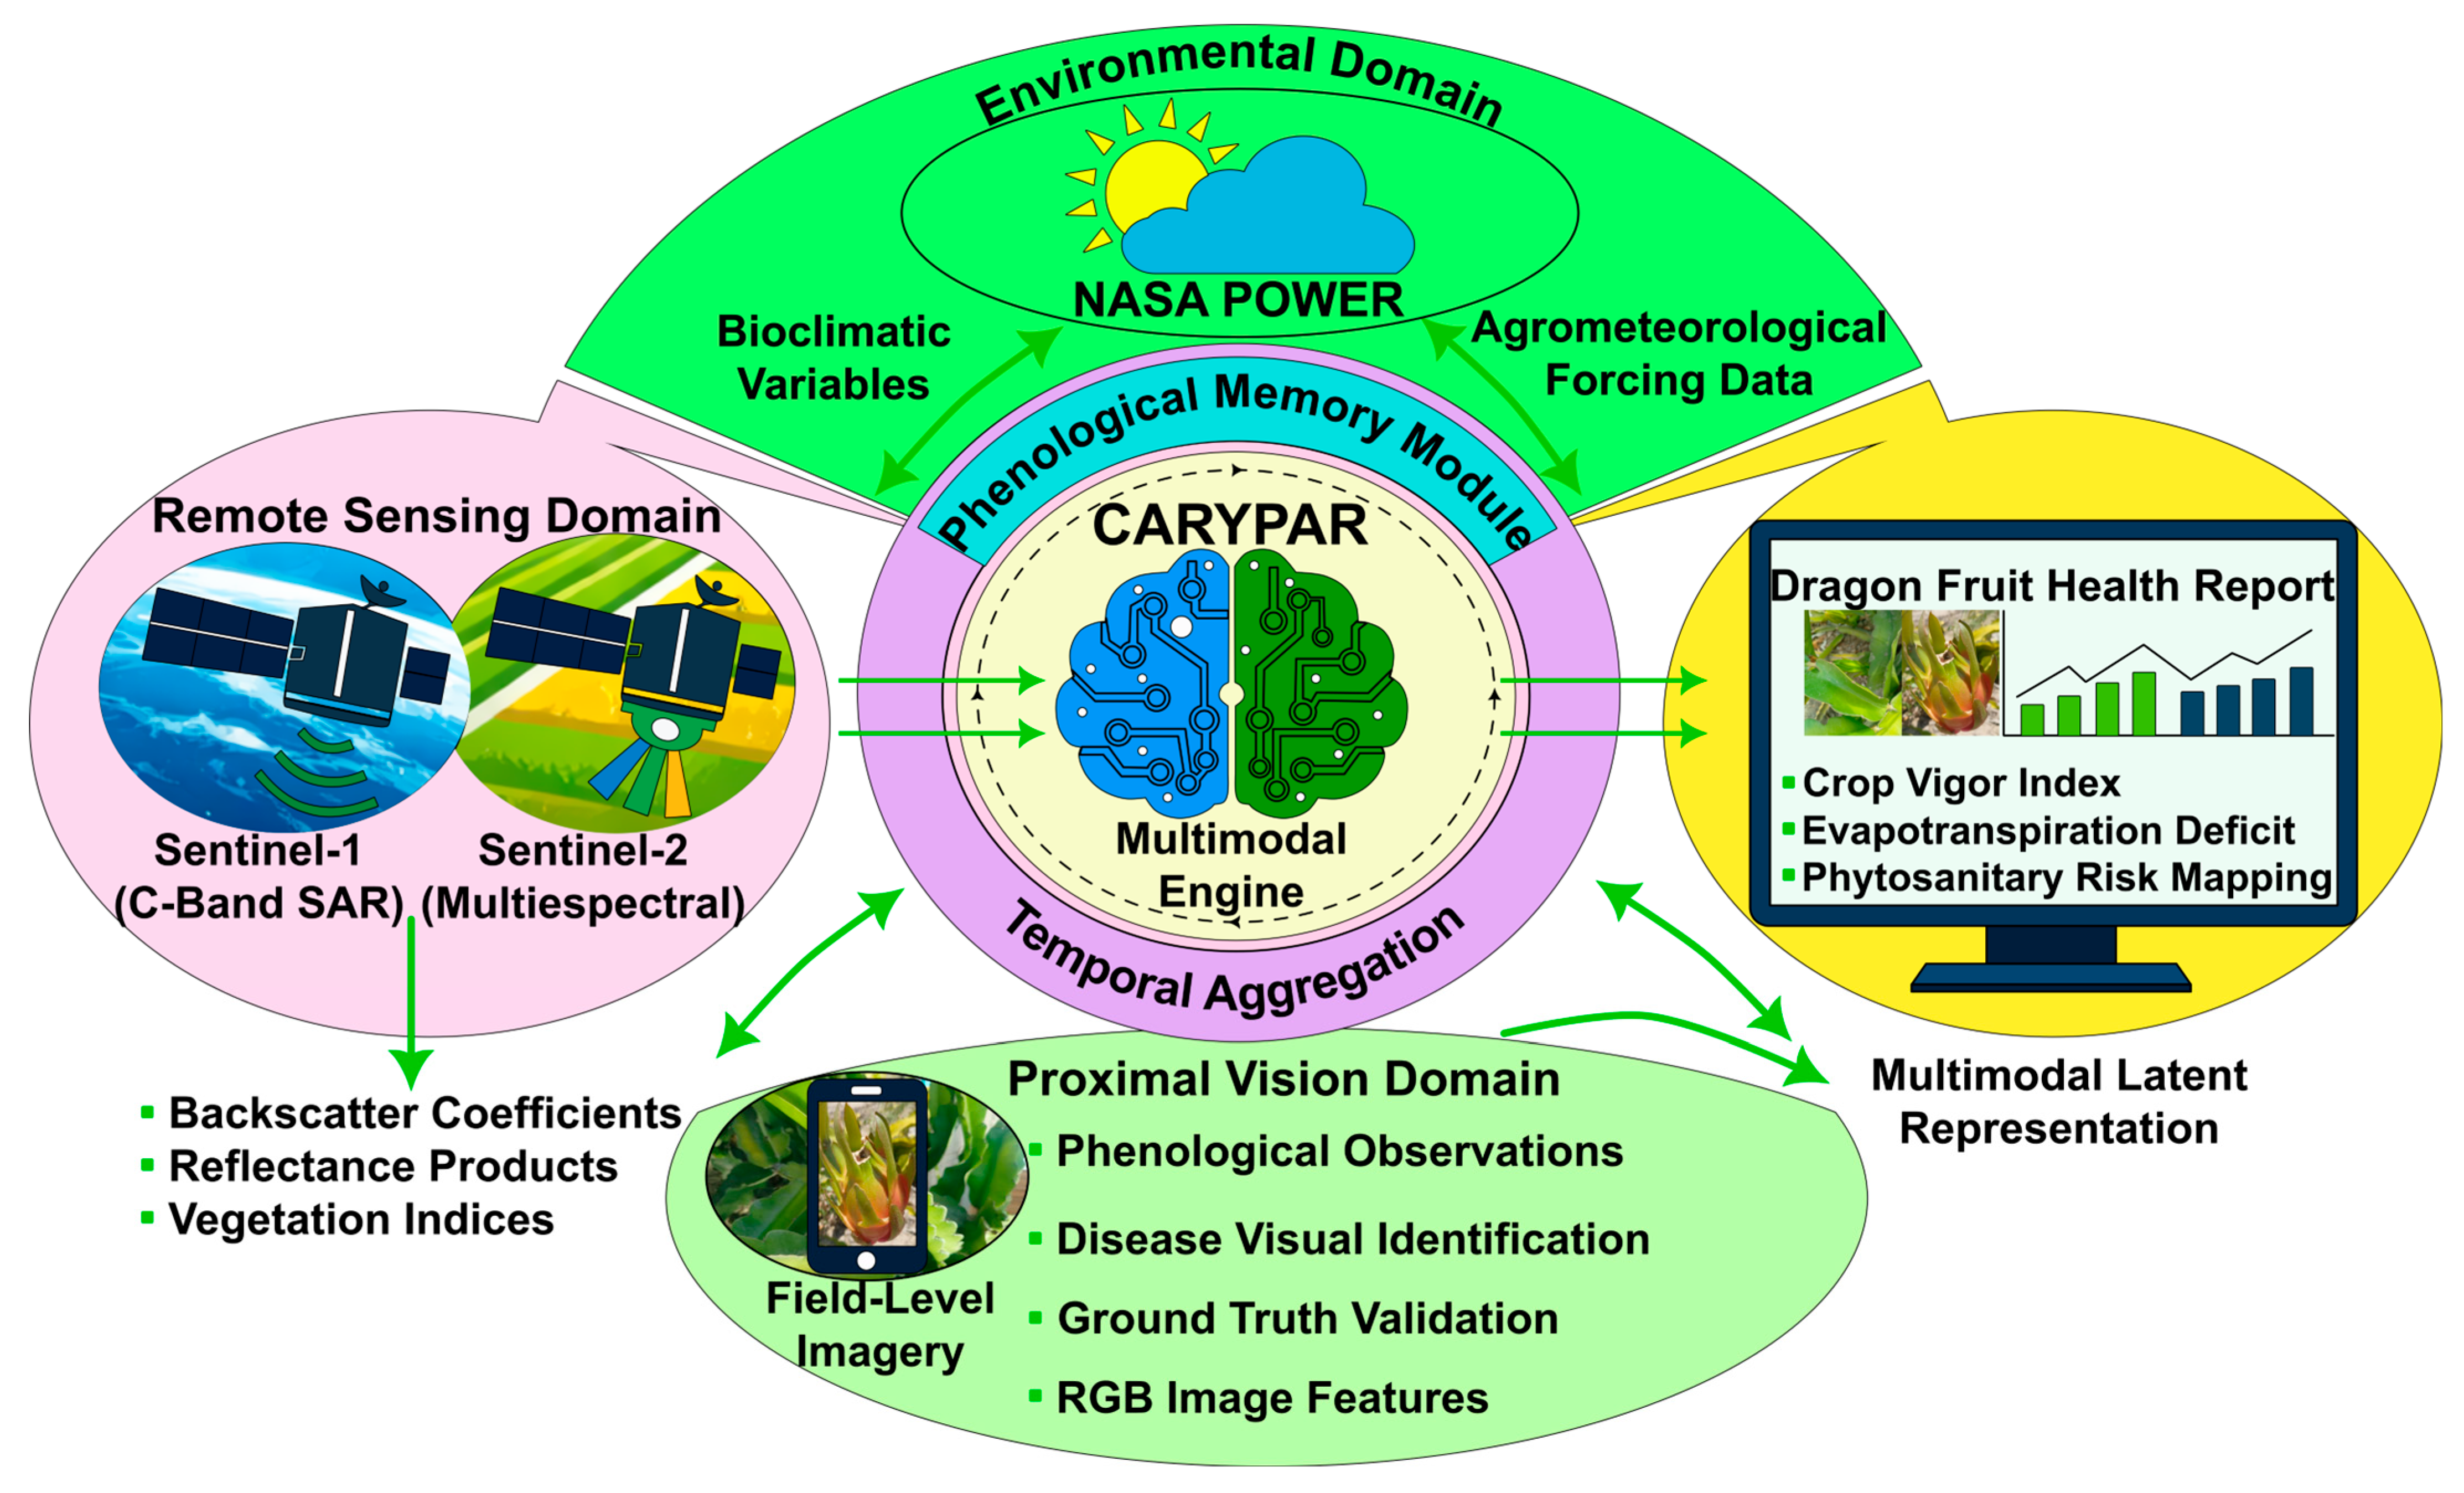
The development of the CARYPAR architecture is grounded in an applied technological research design, structured under a multimodal and multiscale data fusion paradigm (Figure 1). This conceptual framework facilitates the transition from reactive diagnostic models toward a context-aware hybrid inference system specifically tailored to the morphological attributes of Hylocereus spp. The design is governed by a logic of functional domain decoupling, which ensures that visual feature hierarchies extracted from proximal imaging are not biased by the stochastic variance of environmental datasets during the initial learning stages, thereby preserving signal integrity across both network branches.
The robustness of this framework lies in the integration of a Phenological Memory Module, where variables derived from NASA POWER (NASA Langley Research Center, Hampton, VA, USA) agrometeorological reanalysis and Sentinel satellite telemetry act as physiological preconditioners for symptoms observed in situ. Methodologically, the study is sustained by an expert arbitration protocol; edge intelligence outputs were benchmarked against professional agro-industrial diagnoses using Cohen’s Kappa coefficient to eliminate the subjectivity inherent in conventional visual inspections. Such procedural rigor ensures that the architecture achieves not only high algorithmic precision but also operational resilience in real-world field scenarios, aligning the computational load with the connectivity and energy constraints typical of developing agricultural environments. This rigorous experimental design guarantees the interpretability and robustness of the CARYPAR multimodal engine, facilitating precise diagnostics under the heterogeneous field conditions of Fundo Trisdal (Ancash, Peru).

2.2. Data Acquisition and Preprocessing

The operational efficiency of the CARYPAR multimodal engine relies on the synchronization and refinement of heterogeneous data streams originating from three distinct observational domains. The acquisition protocol was engineered to guarantee signal integrity and experimental reproducibility under variable field conditions.

2.2.1. Environmental Domain: Agrometeorological Forcing (NASA POWER)

Agroclimatic components were retrieved via the NASA POWER interface, extracting historical daily series covering the 1981–2025 period. However, for the current study, the interval from 1 January 2024 to 31 December 2025 was selected for the specific coordinates (−9.07298, −78.51598) at Fundo Trisdal (Ancash, Peru). Primary variables were transformed into water demand indicators by calculating reference evapotranspiration ( E T 0 ) using the Penman–Monteith (FAO-56) model and vapor pressure deficit (VPD). Furthermore, temporal windows of 7, 14, and 21 days were generated to capture the cumulative effects of abiotic stress on the crop.

2.2.2. Remote Sensing Domain: Satellite Processing in Google Earth Engine (GEE)

Remote sensing data were processed through an advanced GEE pipeline (Google LLC, Mountain View, CA, USA) integrating Sentinel-1 and Sentinel-2 missions. Atmospherically corrected Sentinel-2 MSI (Level-2A) imagery was utilized, applying cloud masking to derive high-relevance agronomic spectral indices such as NDVI, SAVI, and NDRE. Given the persistent cloud cover in the region, Sentinel-1 SAR (C-band) data were integrated, employing backscatter coefficients (σ0) as proxies for the structural roughness of the cladodes and canopy moisture dynamics.

2.2.3. Proximal Vision Domain: Visual Dataset Curation

The visual dataset was grounded in the specialized Dragon Fruit (Leaf and Fruit Dataset) repository (Kaggle Inc., San Francisco, CA, USA) [35], using exclusively the Data Augmentation subset, which yielded 11,024 images after verification. The class distribution comprised Bad Fruit, 921 (8.4%), Bad Leaf, 4834 (43.8%), Good Fruit, 999 (9.1%), and Good Leaf, 4270 (38.7%). The original images were acquired under uncontrolled outdoor field conditions in tropical regions of South Asia using consumer-grade smartphone cameras; acquisition parameters, including illumination, camera angle, and sensor characteristics, were neither standardized nor documented. The pronounced class imbalance between leaf- and fruit-dominated categories was mitigated through inverse-frequency class weighting ( w B F = 2.9907, w B L = 0.5702, w G F = 2.7597, w G L = 0.6454), implemented during model training. No temporal synchronization exists between the Kaggle imagery and satellite data, as the former was used exclusively for visual feature extraction within the EfficientNet-V2B0 stream. Spatial alignment applies solely to the 160 georeferenced field validation images collected at Fundo Trisdal, each associated with environmental variables at the corresponding coordinates and acquisition date.

2.2.4. Multimodal Integration and Quality Control

Multimodal synchronization in CARYPAR addresses spatial and temporal mismatches among NASA POWER reanalysis, Sentinel-1/2 imagery, and smartphone-based observations. Meteorological variables were retrieved from the NASA POWER API over a two-year period, with missing values handled by linear interpolation. Sentinel-2 Level-2A imagery was filtered using QA60 cloud masking (<20%), and the nearest cloud-free acquisition within a ±15-day window was selected. Vegetation status was characterized using NDVI derived from red and near-infrared bands.
Sentinel-1 GRD imagery was processed using dual-polarization (VV, VH), with speckle reduction via temporal averaging and Radiometric Terrain Correction applied. The 20 m SAR product was bilinearly resampled to the Sentinel-2 10 m grid using UTM Zone 18S (WGS84), enabling pixel-level co-registration. Mean backscatter values were −12.7302 dB (VV) and −22.4127 dB (VH). Variables were temporally aggregated over 24 months to represent site-level conditions and uniformly assigned to 160 field images acquired within a single plot during a four-hour window.

2.3. Multimodal Engine Architecture and Inference Logic

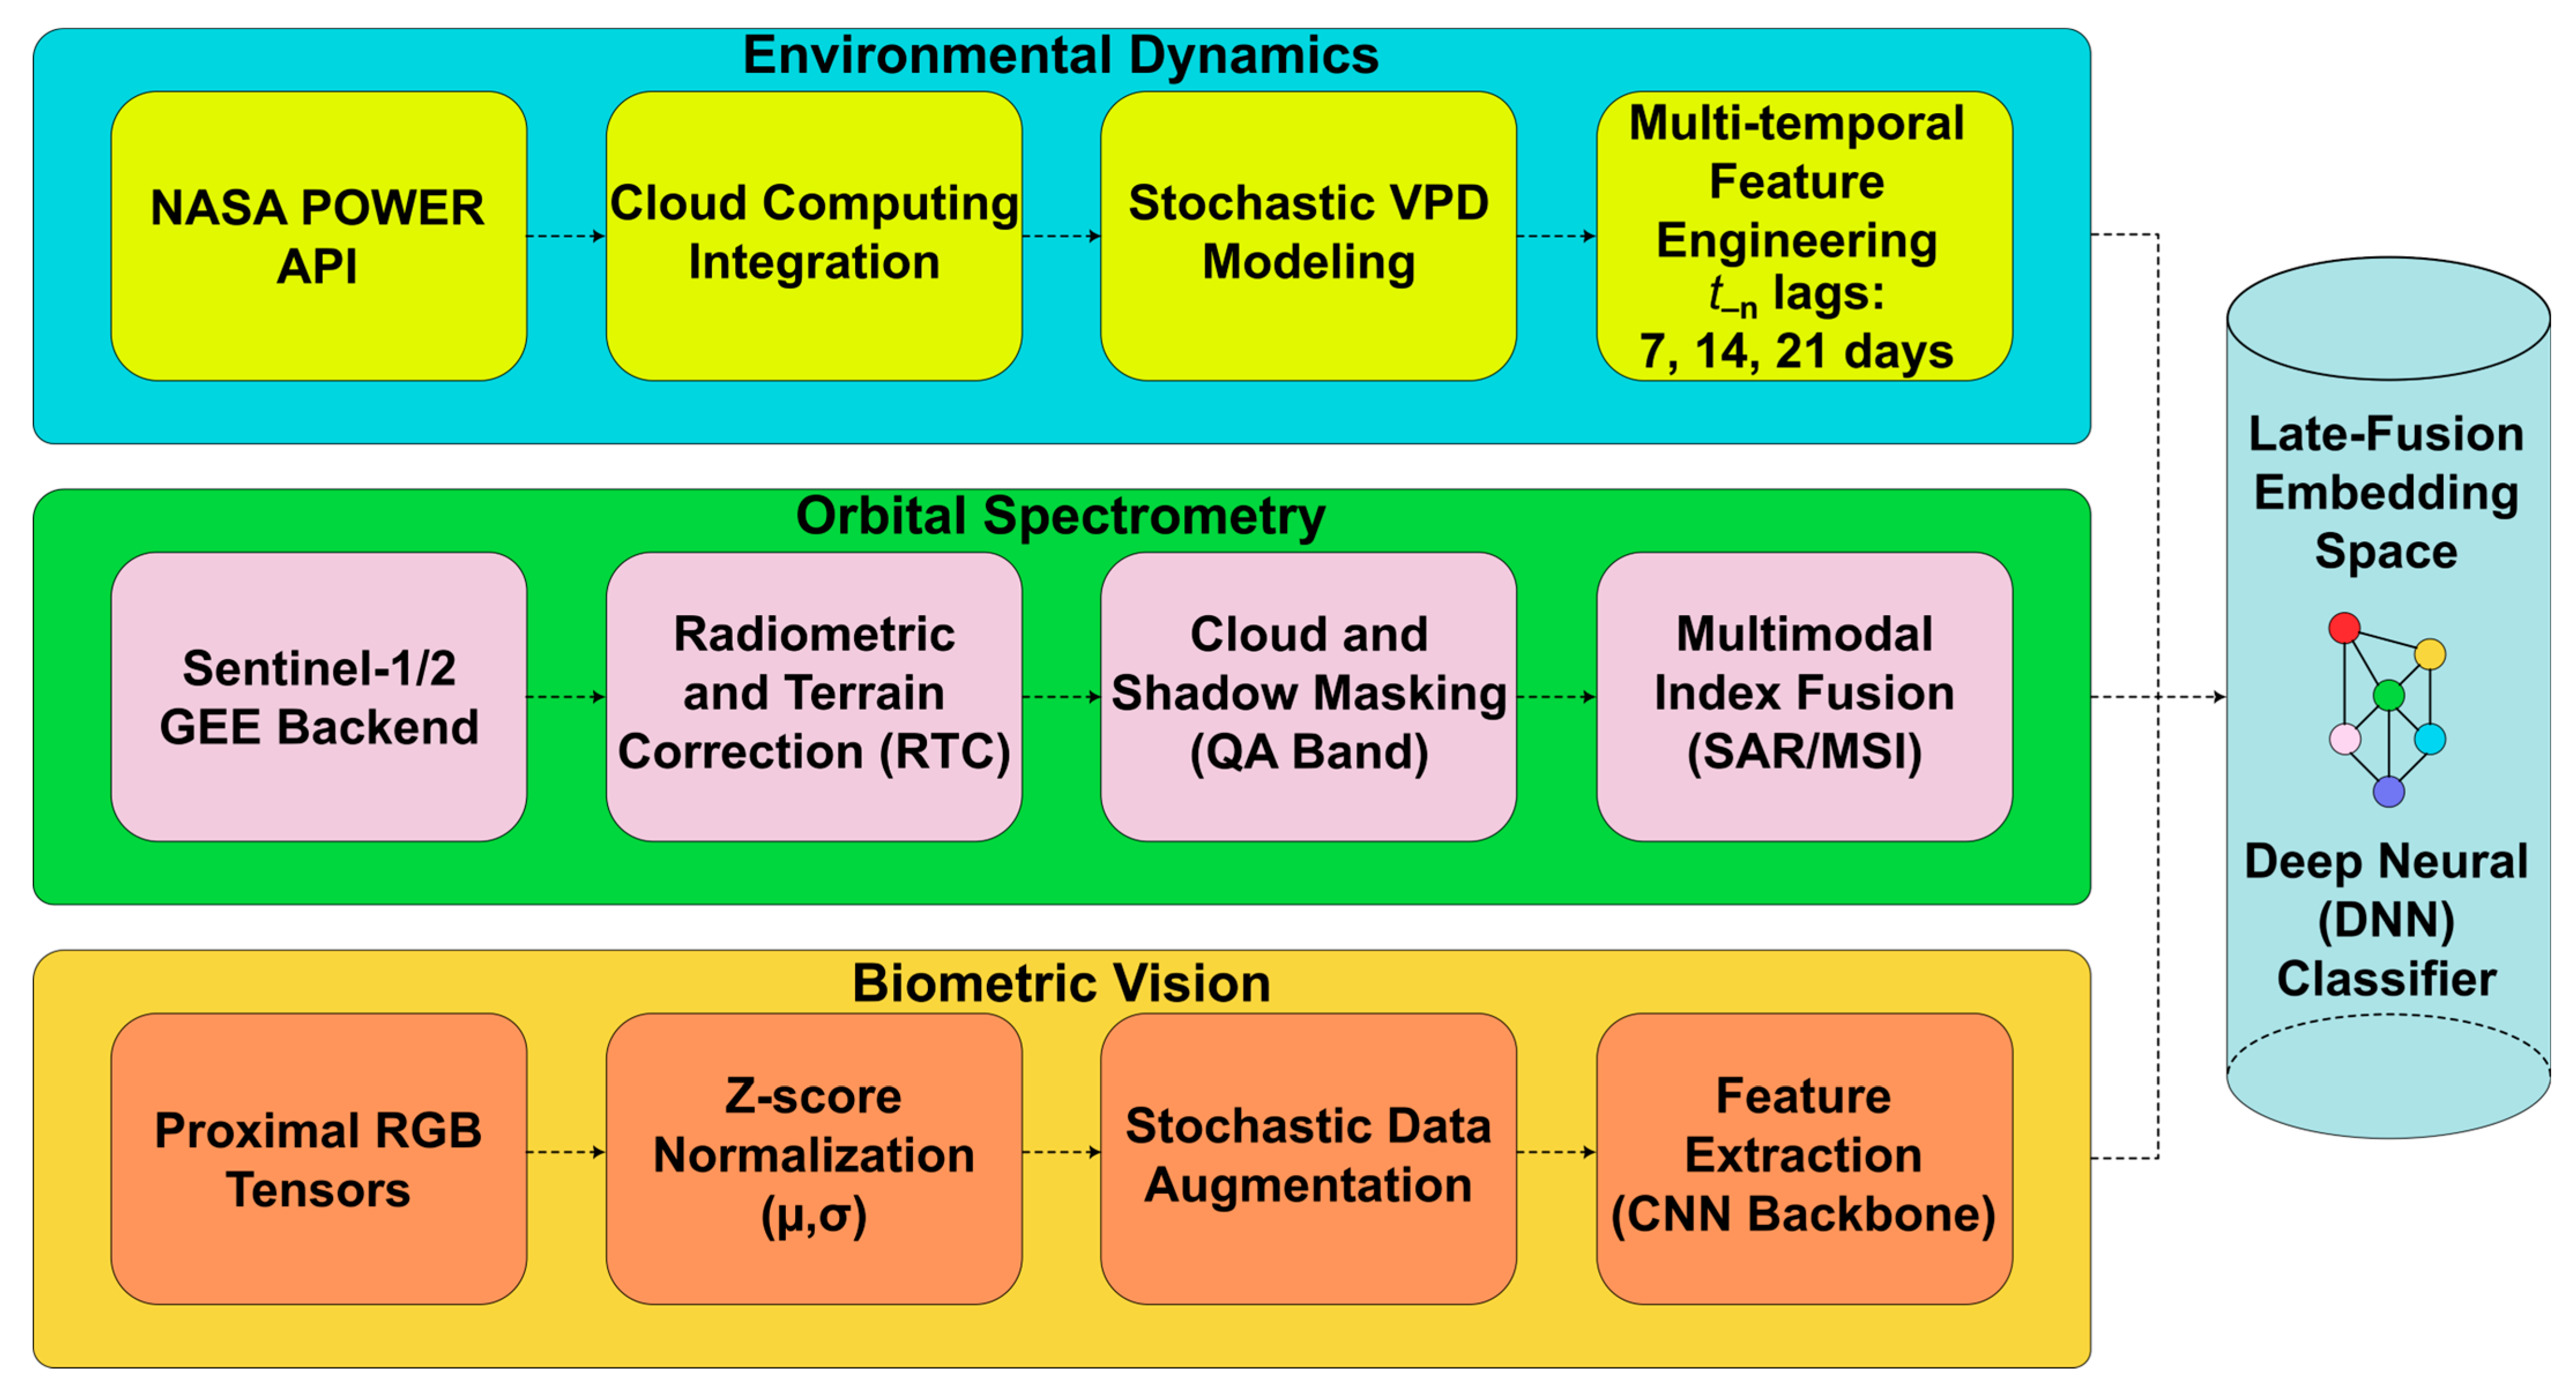
The computational architecture of CARYPAR is based on a late-fusion paradigm designed to integrate high-dimensional data streams through specialized processing pipelines (Figure 2). The selection of a late-fusion strategy over early or intermediate fusion is motivated by three complementary aspects. (i) Dimensional asymmetry between modalities is substantial: the visual stream produces a 1280-dimensional feature vector after global average pooling, whereas the environmental stream is defined by a six-variable vector. Early fusion at the input level would impose a strong imbalance during gradient propagation, effectively reducing the contribution of environmental predictors. Late fusion preserves the representational integrity of each modality prior to integration in a shared latent space. (ii) Sodality-specific pre-training is maintained, as the visual backbone, optimized for spatial feature extraction, operates independently from scalar environmental inputs, avoiding cross-modal interference during learning. (iii) The architecture ensures robustness under partial data availability, allowing inference based solely on environmental features when optical satellite imagery is unavailable. The training objective combines modality-specific and joint losses, with a weighting factor (α = 0.65) that reflects the dominant contribution of the visual stream while retaining the calibration role of environmental variables.

2.3.1. Environmental Dynamics and Orbital Spectrometry Processing

The Environmental Dynamics pipeline implements multitemporal feature engineering, leveraging the NASA POWER API for the stochastic modeling of vapor pressure deficit (VPD). Temporal lags of t − n = {7, 14, 21} days were applied to capture the physiological inertia of the crop in response to persistent abiotic stress events. Simultaneously, the Orbital Spectrometry stream manages data ingestion from the Google Earth Engine backend, applying Radiometric Terrain Correction (RTC) and cloud masking via Quality Assurance (QA) bands. The resulting fusion of multispectral (MSI) and radar (SAR) products generates hybrid indices that compensate for optical limitations under high cloud-cover conditions.

2.3.2. Biometric Vision and Embedding Space

Within the Biometric Vision domain, proximal images are transformed into RGB tensors subjected to Z-score normalization (µ, σ). A stochastic data augmentation protocol was implemented to bolster feature extraction, which is supported by a Convolutional Neural Network (CNN) backbone optimized for the detection of pathological traits and vegetative vigor.

2.3.3. Late Fusion and Deep Classification

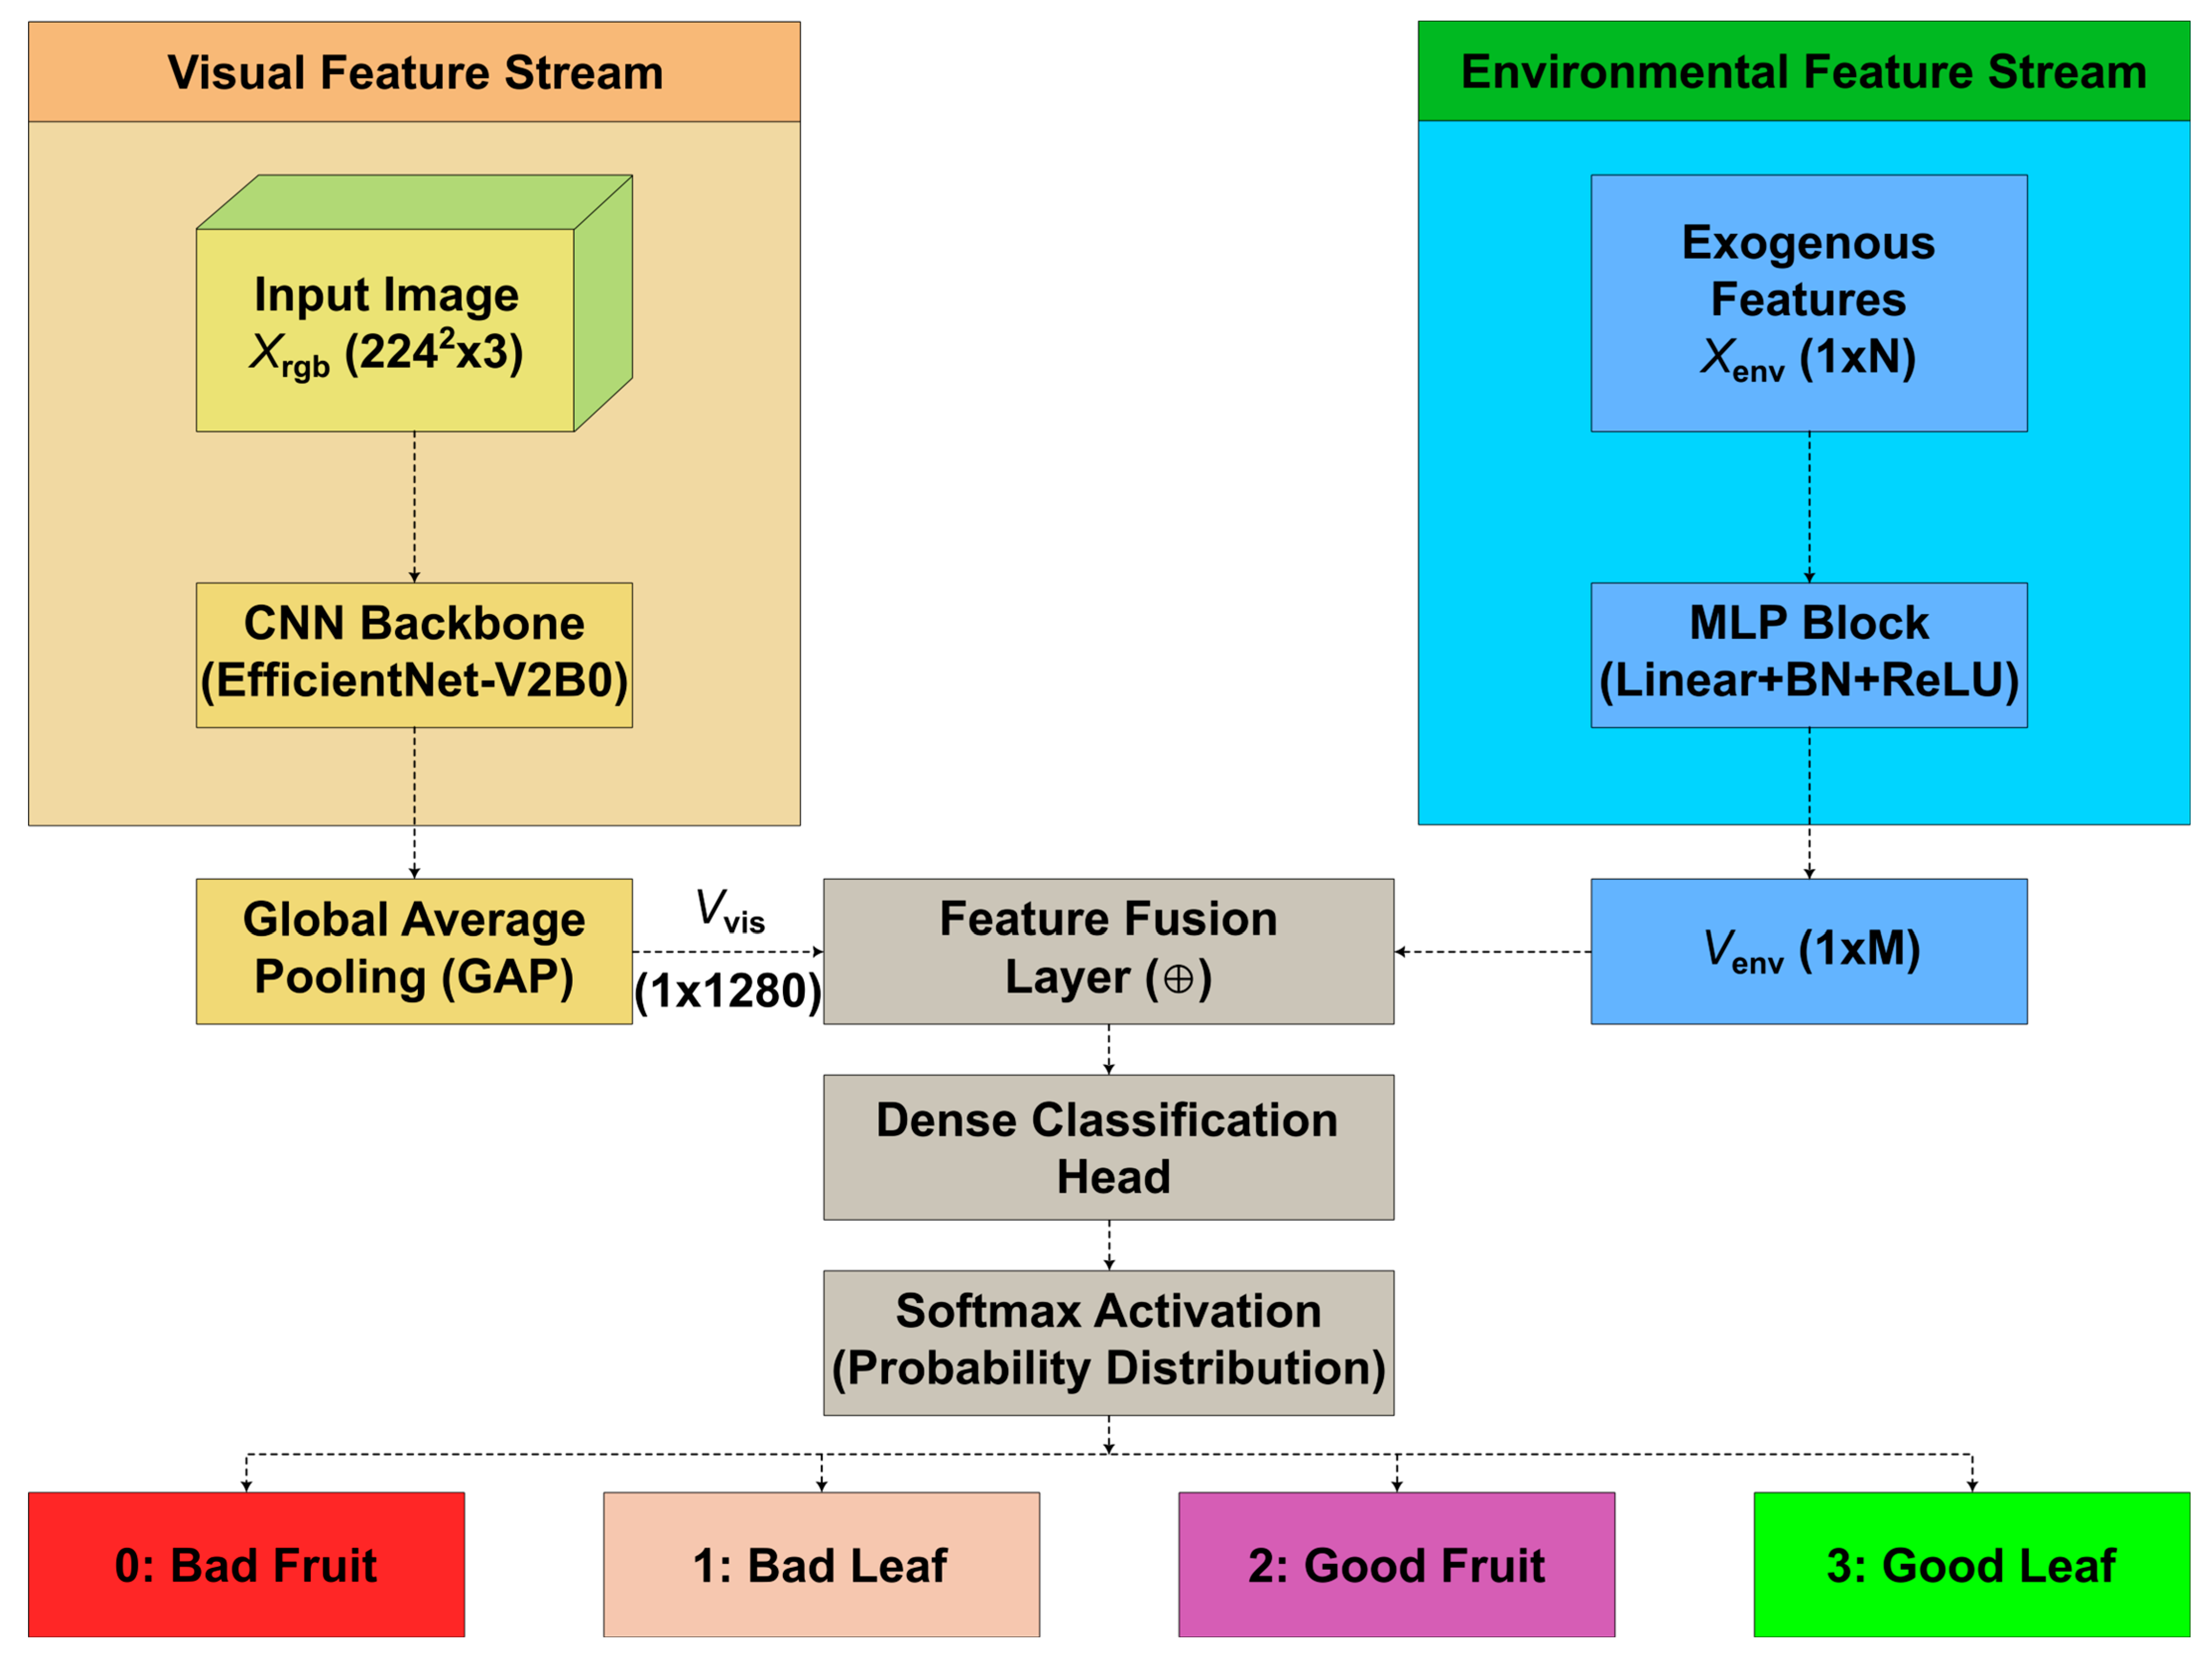
The final integration occurs within the Late-Fusion Embedding Space (Figure 3), where both streams converge via a concatenation operator (⊕). The Softmax head generates probabilities over four phenotypic tissue-state categories that are identical across training, validation, test, and field inference phases: (0) Bad Fruit, fruit tissue exhibiting visual markers of anthracnose, rot, or post-harvest deterioration; (1) Bad Leaf, cladode or leaf tissue exhibiting vascular disease, necrosis, or fungal infection; (2) Good Fruit, commercially viable fruit with no visible phytosanitary compromise; (3) Good Leaf, healthy cladode with normal coloration and surface integrity. These four categories originate directly from the Dragon Fruit Leaf and Fruit Dataset and are preserved without modification throughout the CARYPAR pipeline. The agronomic action associated with each class—phytosanitary alert for Bad Fruit/Bad Leaf; blockchain quality certificate for Good Fruit/Good.

2.4. Training Protocol and Model Selection

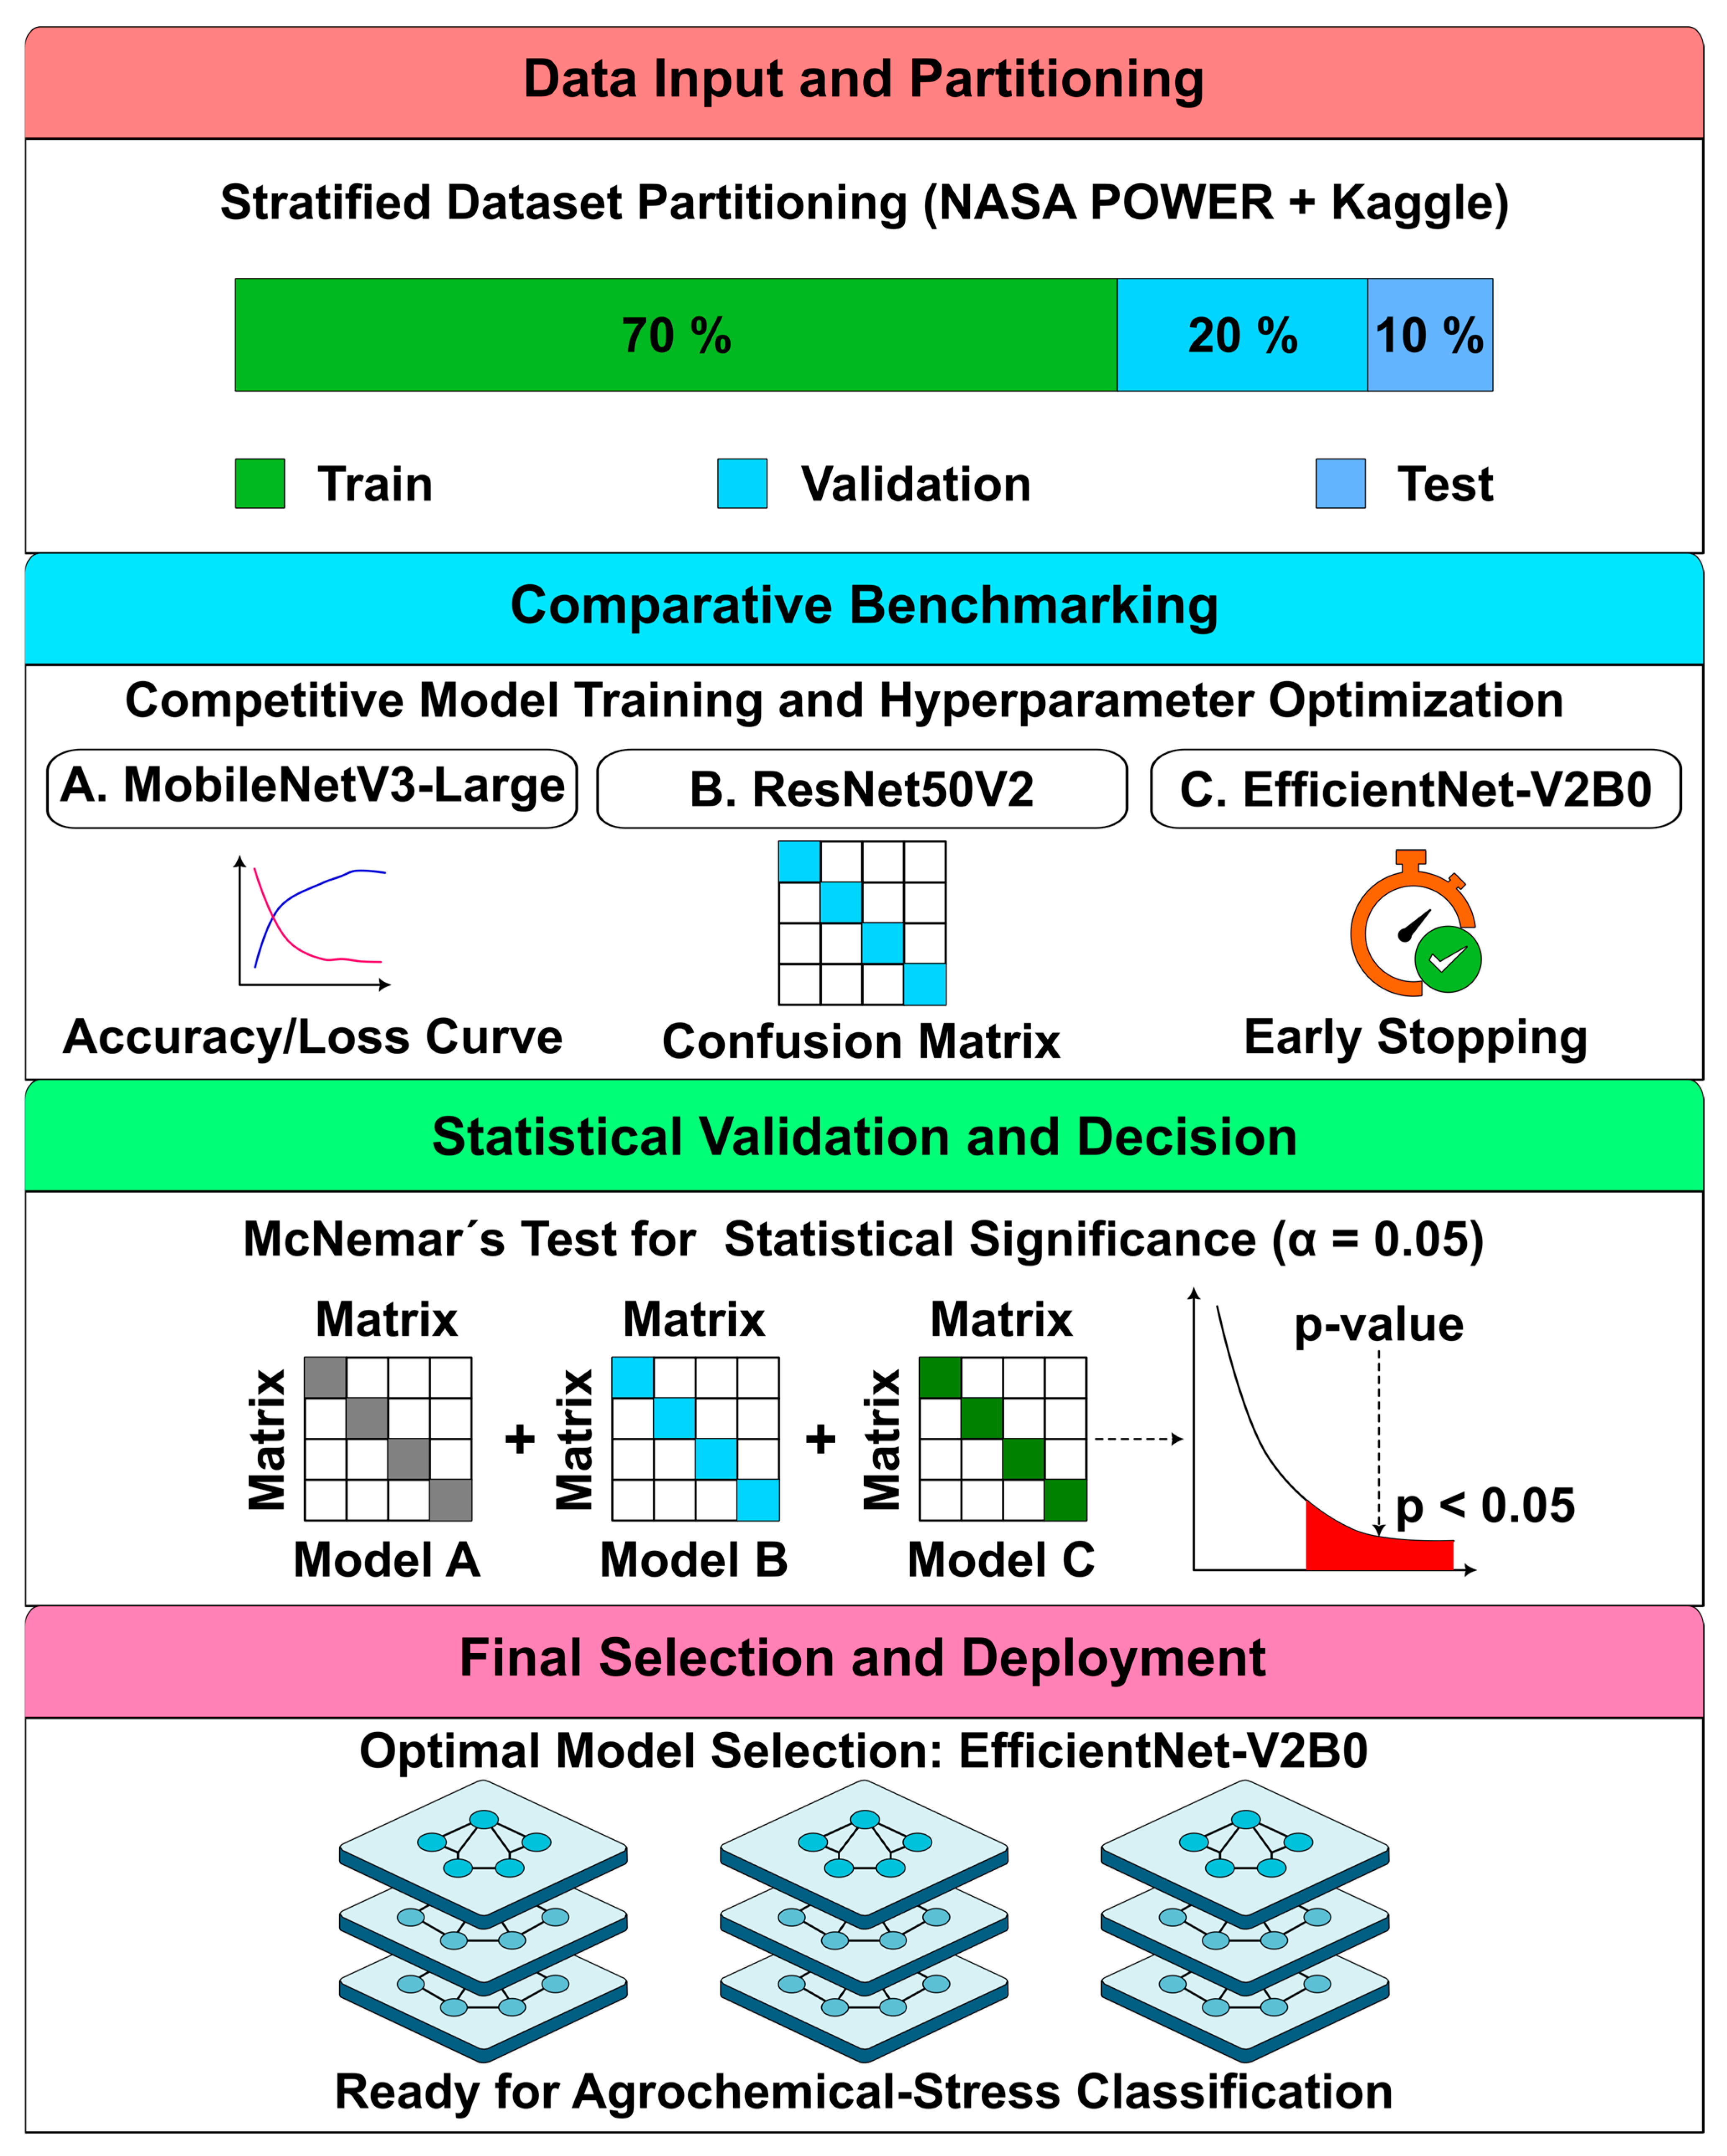
The optimization and selection process for the CARYPAR architecture was grounded in a rigorous experimental framework, designed to ensure system generalization and robustness against the stochastic variability of field conditions. This systematic workflow was structured into four sequential stages (Figure 4).
Algorithmic implementation and model training were conducted within the JupyterLab interactive computing environment using Python 3.13. For neural network orchestration and tensor processing, the TensorFlow 2.20.0 and Keras ecosystem was employed, leveraging hardware acceleration via Graphics Processing Units (GPUs). The preprocessing of environmental and satellite domains was managed through specialized libraries such as Pandas and NumPy, integrated with the Google Earth Engine (GEE) Python API. This ecosystem enabled granular control over data flow, facilitating hyperparameter auditing, the reproducibility of McNemar’s test, and the calculation of Cohen’s Kappa index.

2.4.1. Data Partitioning and Stratification

The training protocol employed a stratified 70/20/10 data partition (training ≈ 7716; validation ≈ 2204; testing ≈ 1104; seed = 42), ensuring consistent preservation of class proportions across all subsets. The maximum inter-partition deviation in class distribution remained below 2%, as verified through an internal balance audit. Class imbalance was addressed through inverse-frequency weighting ( w B F = 2.9907, w B L = 0.5702, w G F = 2.7597, w G L = 0.6454), incorporated directly into the training process to proportionally scale the learning signal toward underrepresented fruit classes. In parallel, stochastic data augmentation, comprising geometric transformations and controlled color perturbations, was applied during training to increase effective sample diversity. Performance stability was further examined through a five-fold stratified cross-validation scheme, ensuring robust evaluation beyond the single hold-out partition.

2.4.2. Competitive Benchmarking of Architectures

We selected the final backbone by comparing MobileNetV3-Large, ResNet50V2, and EfficientNet-V2B0. The comparison focused on the balance between inference speed on ARM-based edge processors and each model’s ability to extract spatial features from crop images. Training was capped at 100 epochs, providing sufficient room for convergence without unnecessary computational overhead. To reduce overfitting, we applied Early Stopping with a patience of k = 10, stopping training when the validation loss failed to improve for 10 consecutive epochs and restoring the weights from the best-performing epoch. This setup resulted in a stable training process, which is particularly important given the specialized and relatively small size of agricultural datasets compared to general computer vision benchmarks.

2.4.3. Statistical Validation via McNemar’s Test

The superiority of the proposed model was determined not only through traditional scalar metrics but also through a robust statistical significance analysis. McNemar’s Test (α = 0.05) was employed to contrast the confusion matrices of the competing models. This non-parametric analysis confirmed that the predictive performance differences of EfficientNet-V2B0 were not the result of chance, but were statistically significant with a p-value < 0.05.

2.4.4. Final Selection and Deployment

Following the analysis of accuracy/loss curves and statistical validation, EfficientNet-V2B0 was selected as the definitive backbone for the CARYPAR engine. Its superior asymptotic convergence and resilience against input data variance position it as the optimal architecture for classifying agrochemical stress and vigor in pitahaya crops, ensuring reliable deployment in uncontrolled agricultural environments. This selection is further justified by the model’s streamlined parameter count, which minimizes the gradient vanishing issues typically encountered during fine-tuning on specialized, non-generic agricultural datasets.

2.5. Field Validation, Data Integrity, and Edge Deployment

To ensure external validity, the system was tested in situ at Fundo Trisdal. The Ground Truth was established through technical inspections conducted by an expert Agro-industrial Engineer, whose concordance with the model was quantified using Cohen’s Kappa index (κ). To enable operability in low-connectivity areas, the model was optimized via quantization for edge computing deployment. This architecture allows for local asynchronous inference, guaranteeing that the farmer receives a reliable health report even in the absence of a network, with NASA and Sentinel data synchronized post-facto to refine the diagnosis.

2.5.1. In Situ Validation Protocol and Ground Truth

The georeferenced observation network comprised 160 points (P001–P160) distributed across Fundo Trisdal (5.0 ha) using a spatially stratified design informed by prior Sentinel-2 NDVI classification. Four strata ensured representation of contrasting plant conditions: (i) NDVI < 0.12 zones indicating optical stress anomalies (n = 42), (ii) SAR_VH < −24 dB zones associated with structural tissue dehydration (n = 38), (iii) transitional heterogeneous sectors validated through expert agronomic inspection (n = 48), and (iv) high-vigor control areas (NDVI ≥ 0.18, VH ≥ −21 dB; n = 32). A minimum 15 m inter-point distance preserved spectral independence at 10 m resolution. Coordinates were preloaded into a GPS-enabled tablet. A priori power analysis implemented in RStudio Version: 2026.01.1+403 confirmed that the sample size exceeded the minimum statistical requirement, supporting dataset robustness (Figure S1).
To address the expert arbitration requirements, the ground truth was established under a strictly controlled double-blind protocol. The Agro-industrial Engineer conducted all field assessments across the 160 units without access to CARYPAR predictions, probability scores, or any model-derived outputs, ensuring complete independence between human diagnosis and AI inference. To further increase the scientific robustness of the ground truth, a second independent agronomist (MSc in Plant Pathology) evaluated a blinded subsample of 30 points under identical conditions. The reliability of human annotation was quantified using Cohen’s Kappa coefficient, yielding κ = 0.792 (95% CI: 0.681–0.903), which establishes the inter-expert agreement ceiling. Subsequently, the agreement between CARYPAR predictions and expert annotations (κ = 0.6831) was interpreted relative to this human benchmark, confirming that the model achieves 86.3% of expert-level diagnostic consistency. This multi-expert, blinded protocol ensures a statistically robust and unbiased validation of the proposed system.

2.5.2. Edge Computing Deployment Architecture

Edge deployment was implemented by converting the trained EfficientNetV2B0 model from Keras to TensorFlow Lite using dynamic-range quantization. The inference system was validated on a mid-range Android smartphone representative of devices accessible to smallholder producers in Ancash, Peru (≈USD 220). Inference latency was measured as per-sample execution time under batch size equal to one, averaged across the full test set (N = 1103) using time-based benchmarking. The reported latency (22.00 ms) includes visual inference, environmental feature processing, and final classification. Environmental variables were pre-fetched via external APIs and locally cached, enabling asynchronous offline inference.

2.5.3. Data Integrity and System Resilience

Data flow integrity was preserved through quality control protocols designed to manage sensor uncertainty. Within the Environmental Domain, interpolation algorithms were implemented to address potential gaps in the NASA API time series. In the Remote Sensing Domain, the use of Sentinel-1 SAR data ensured monitoring continuity during periods of dense cloud cover in the Ancash region, where traditional optical sensors often fail. This multimodal data redundancy approach ensures that the crop health report maintains high diagnostic precision, independent of atmospheric fluctuations or network stability.

3. Results

We evaluated the CARYPAR framework by contrasting environmental baseline data with the performance metrics of the selected deep learning architectures. The testing phase at Fundo Trisdal provided the necessary ground truth to validate the system’s agronomic logic under changing field conditions, while also testing the model’s stability during edge deployment. The following sections detail the convergence behavior of the backbones, the accuracy of the phytosanitary classification, and the integration of NASA POWER and Sentinel variables into the final vigor reports.

3.1. Multimodal Characterization of the Pitahaya Production System

Environmental dynamics governing Hylocereus undatus cultivation were monitored throughout the 2024–2025 experimental cycle. Table 1 synthesizes the descriptive statistics of the agroclimatic variables retrieved via the NASA POWER API, establishing the boundary conditions for the diagnostic model.
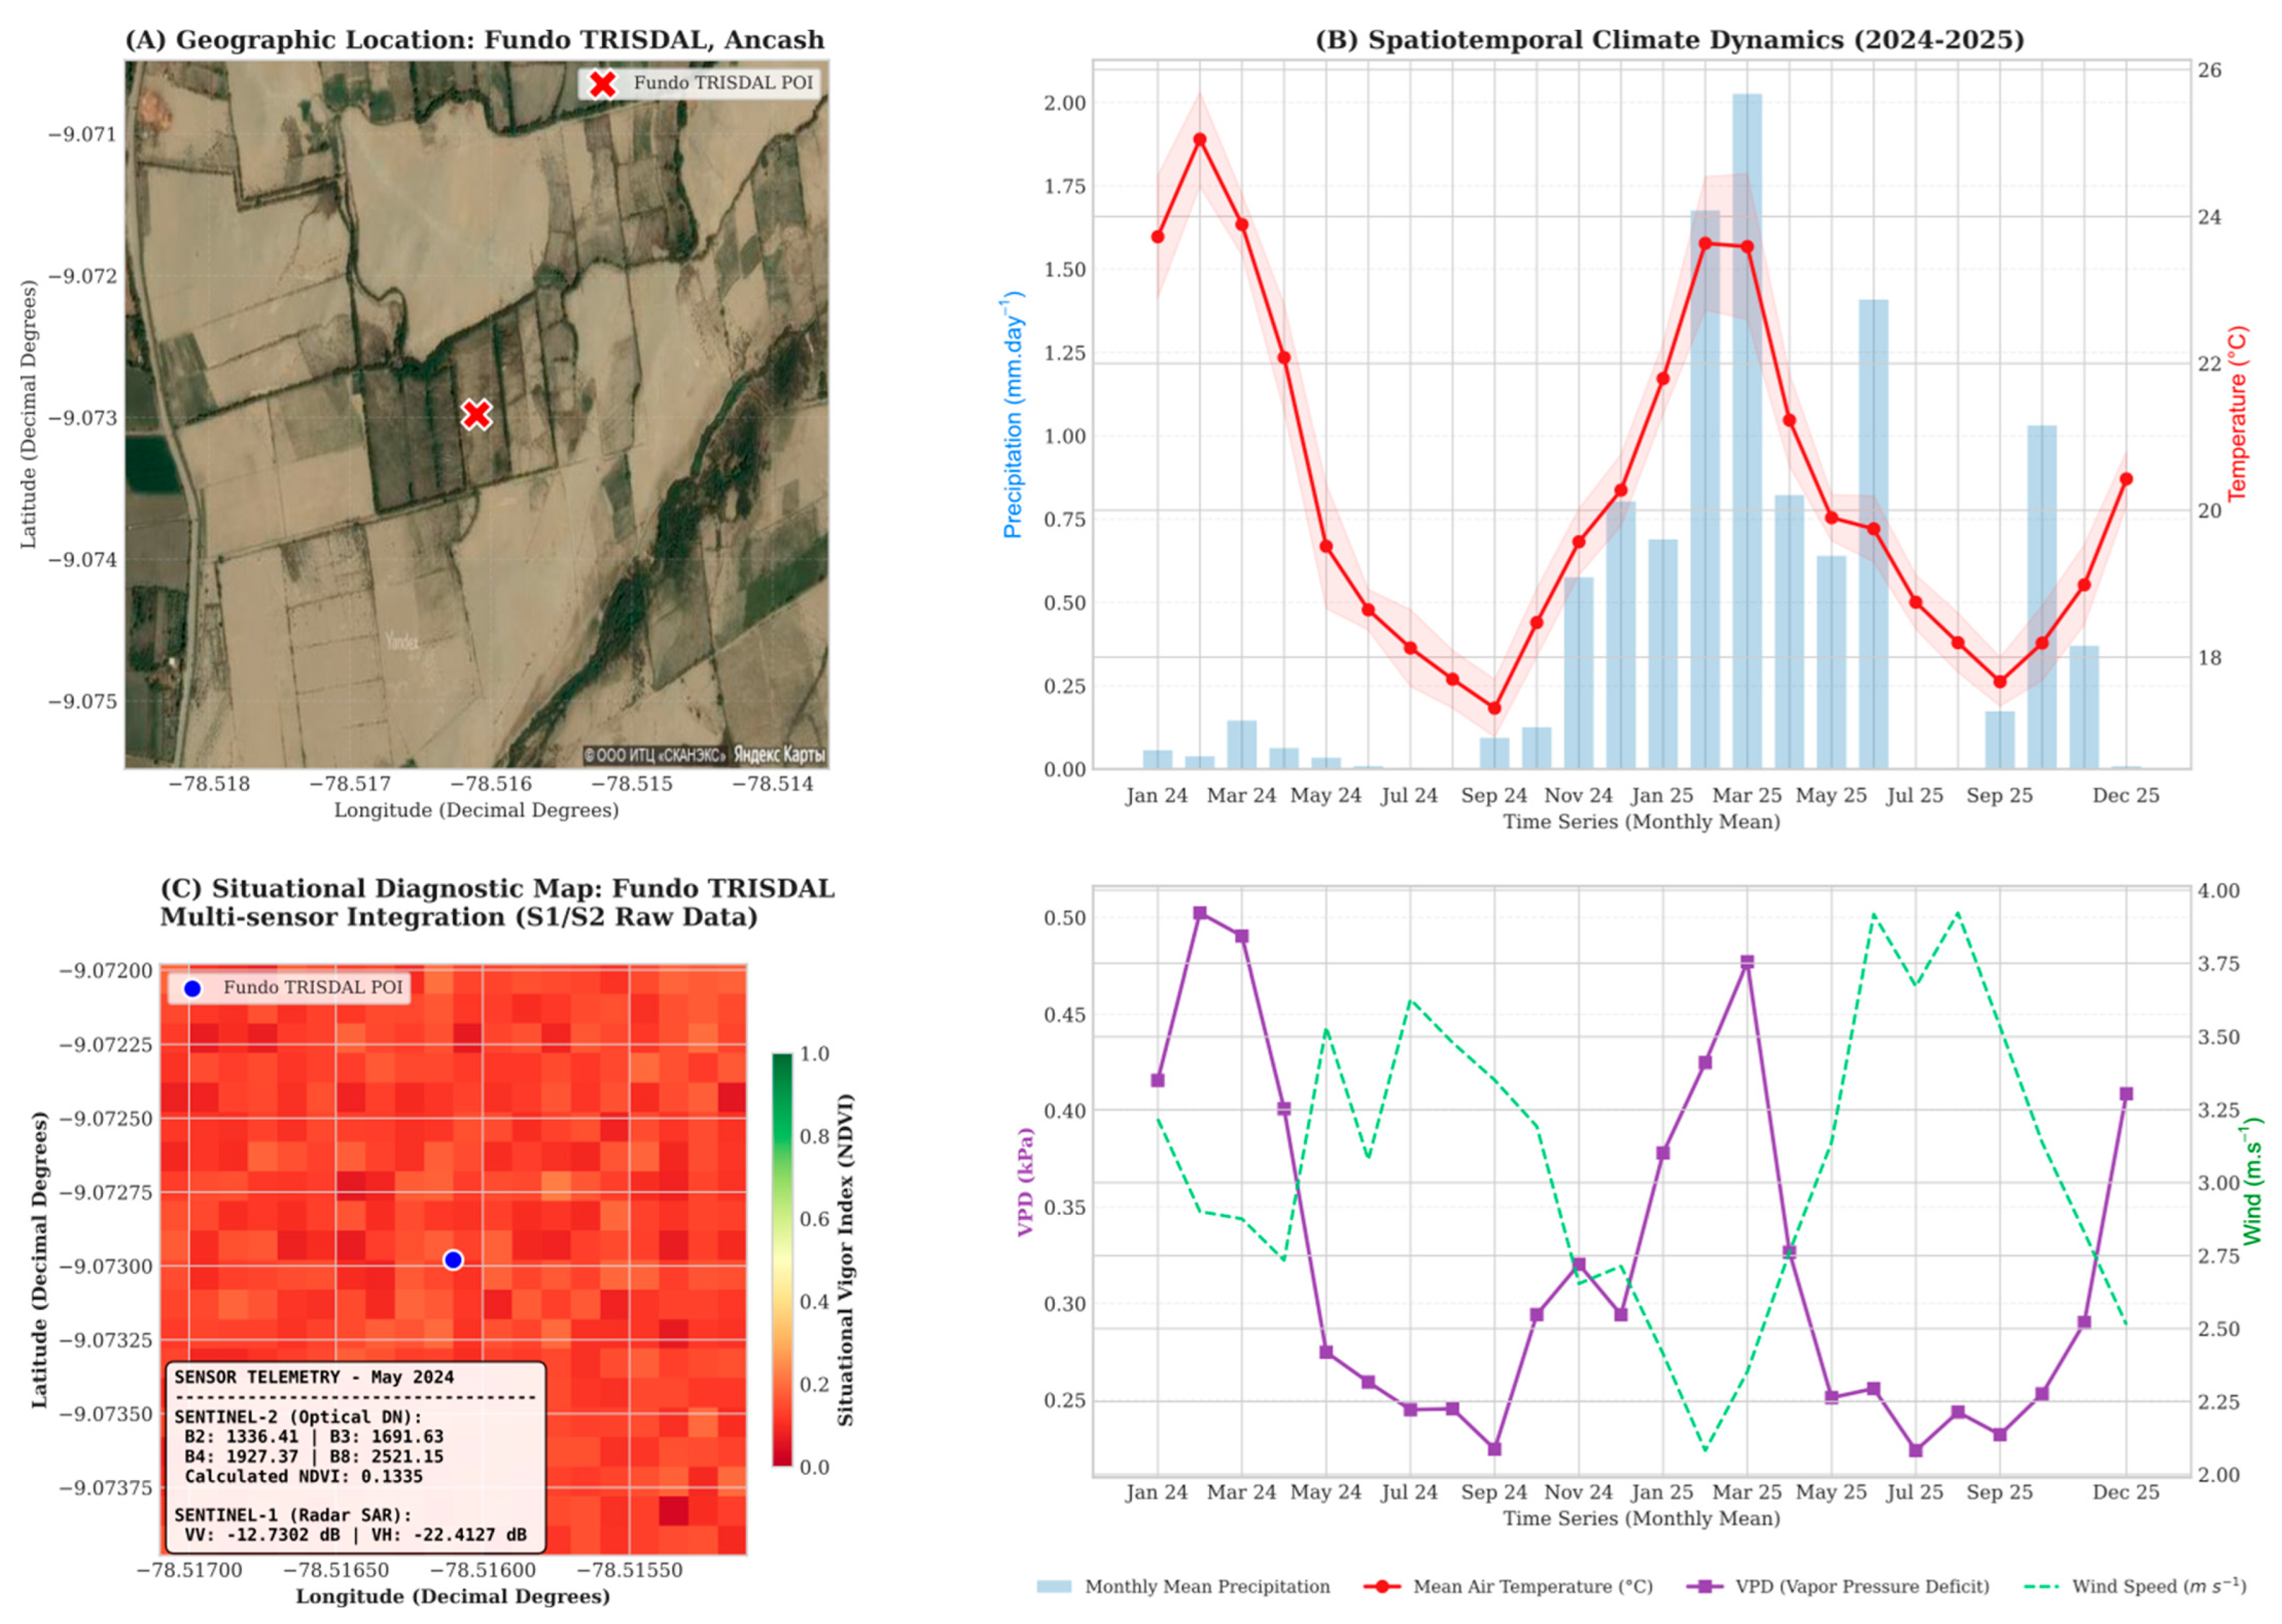
The climatic profile identifies a coastal arid zone characterized by significant thermal modulation. Although the mean annual temperature ( T m e a n ) remained at 20.35 °C, daily maximums T m a x   frequently reached 28.99 °C, subjecting the crop to intermittent heat stress. Conversely, nighttime minimums T m i n averaged 18.74 °C, maintaining a moderate thermal amplitude that facilitates Crassulacean Acid Metabolism (CAM) by optimizing nocturnal C O 2 fixation.
The precipitation regime exhibited extreme erraticism, with a Coefficient of Variation (CV) of 323.54%. Such data confirm that regional rainfall (0.16 m m . d − 1 ) is negligible and insufficient for meeting crop water requirements. Consequently, the vapor pressure deficit (VPD) emerged as a primary diagnostic driver, with fluctuations peaking at 0.91 kPa. These findings statistically validate the unfeasibility of rainfed agriculture in the region, underscoring the necessity of CARYPAR’s precision irrigation logic tailored to actual ecosystem demand.
The integrated diagnostic assessment of Fundo Trisdal (Figure 5) establishes the biophysical baseline of this research. The geographical context in Figure 5A identifies a plot embedded within a heterogeneous agricultural landscape, while the environmental forcing variables in Figure 5B reveal a distinctive seasonality. During the austral summer, vapor pressure deficit (VPD) peaks exceeded the 1.2 kPa threshold; for CAM-metabolism plants such as pitahaya, this critical level typically induces stomatal closure despite adequate soil moisture. The situational evaluation in Figure 5C leverages the synergy between active and passive remote sensing. Sentinel-2 MSI data yielded a calculated NDVI of 0.1334 in May 2024, indicating moderate photosynthetic activity. This optical diagnosis is reinforced by Sentinel-1 SAR backscatter coefficients, where a VH polarization intensity of −22.41 dB describes geometric scattering properties consistent with the succulent structure of the canopy. The convergence of these multimodal signals provides a robust situational record prior to algorithmic processing, constituting the foundational evidence for the diagnostic models.
From a biophysical standpoint, the observed convergence between optical and radar signals at Fundo Trisdal reveals a complex interaction between vegetative vigor and structural biomass. The relatively low NDVI (0.1334) suggests that while photosynthetic greenness is limited by the arid environment, the SAR backscatter intensity (−22.41 dB in VH) confirms the presence of significant water-rich tissue within the cladodes. This divergence is crucial: it implies that conventional optical monitoring alone would underestimate the crop’s resilience. By integrating the VPD threshold analysis, the CARYPAR framework identifies that the primary limiting factor for pitahaya in Ancash is not merely water availability, but the atmospheric demand that triggers physiological dormancy. Consequently, this multimodal baseline proves that an “image-only” AI would fail to distinguish between true pathological stress and transient stomatal regulation, a distinction that CARYPAR successfully captures through its context-aware architecture.
The NDVI value of 0.1335 recorded in May 2024 (Figure 5C), together with the site mean of 0.1469, requires a biophysical interpretation. These low values are consistent with physiological conditions rather than sensor artifacts due to three concurrent factors. (i) The soil background effect associated with calcareous sandy loam increases red-band reflectance, reducing NDVI under fractional canopy cover below 40%; this is supported by higher vegetation index estimates (SAVI = 0.201; MSAVI2 = 0.183). (ii) The predominantly vertical orientation of pitahaya cladodes limits effective canopy interception of nadir satellite observations. (iii) The acquisition coincides with the post-harvest resting phase, characterized by reduced photosynthetic activity. Regarding the hydrological context, daily precipitation averaged 0.4461 mm/day (CV = 295%), confirming negligible rainfall and irrigation as the sole water source under a twice-weekly drip protocol. Collectively, these factors explain the observed NDVI range without attributing it to sensor error.
To demonstrate the corrective role of SAR integration under optical saturation conditions, a representative case (P047) from the validation dataset is analyzed. The Sentinel-2-derived NDVI value at this point (NDVI = 0.1891) falls within the normal distribution of the study site (μ = 0.1469, σ = 0.05), suggesting a healthy physiological state when assessed using optical data alone. However, the corresponding Sentinel-1 VH backscatter exhibits a marked decrease (approximately −26.3 dB), deviating by nearly 3.9 dB from the site mean (−22.41 dB). This reduction is consistent with early-stage water loss and structural tissue degradation, which are not yet reflected in chlorophyll-based indices such as NDVI. Under these conditions, the environmental context (elevated temperature and humidity) further supports the classification of stress. The multimodal CARYPAR model correctly identifies this sample as diseased, highlighting the advantage of SAR-based features in detecting early vascular stress prior to visible optical symptoms.

3.2. Performance of the Multimodal Late-Fusion Model

An ablation analysis was performed on the held-out test set (N = 1103) to quantify the marginal contribution of each modality within the CARYPAR architecture. Five inference configurations were evaluated using the trained model under fixed weights: full multimodal fusion, vision-only, environmental-only, vision combined with climatic variables, and vision combined with remote sensing features. The results (Table 2) show a consistent decrease in predictive performance when any modality is removed or partially masked. The full fusion configuration achieved the highest accuracy and stability, indicating that both visual and environmental inputs provide complementary, non-redundant information essential for robust phytosanitary classification under heterogeneous field conditions.
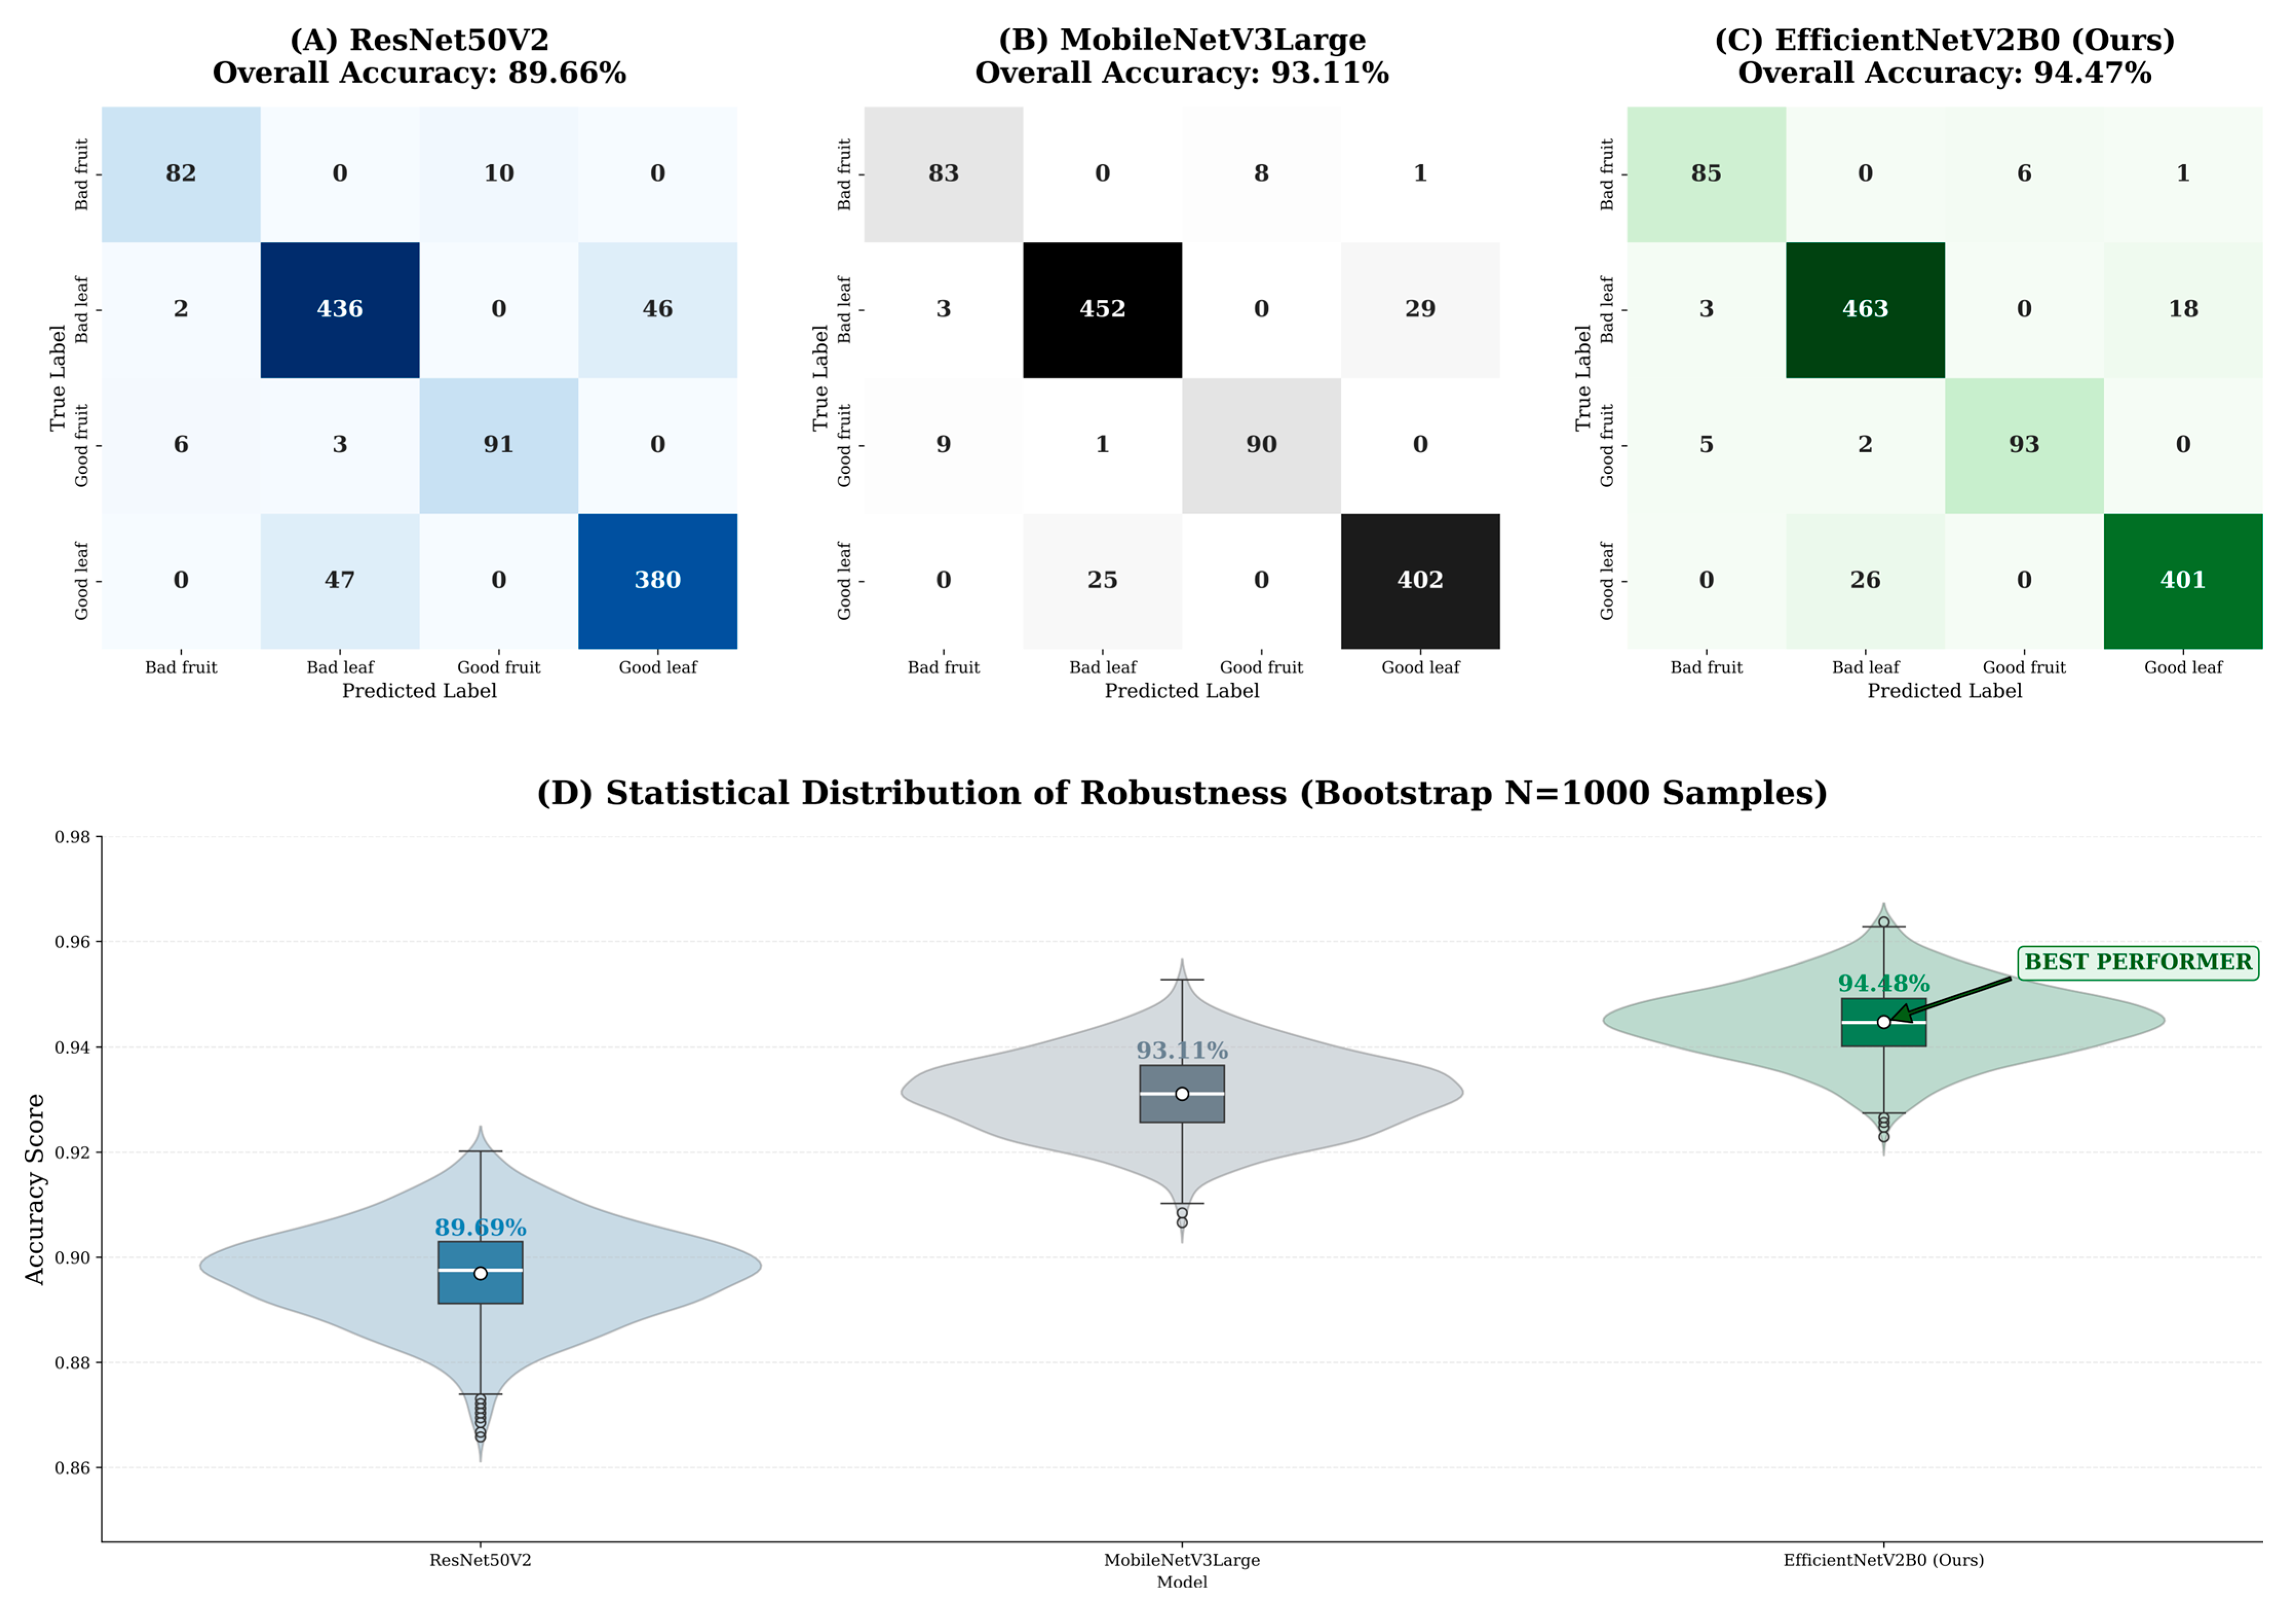
The comparative analysis presented in Table 2 underscores the superiority of the multimodal fusion approach utilizing the EfficientNet-V2B0 architecture. The proposed model achieved a peak accuracy of 94.47%, outperforming both MobileNetV3-Large and ResNet50V2. It is important to note that the F1-Score of 0.9447 ensures a robust equilibrium between precision and sensitivity, which constitutes a determining factor in phytosanitary diagnostics where false negatives entail direct economic risks for the producer. Regarding operational efficiency, the selected architecture recorded an inference latency of 22.00 ms. Although MobileNetV3-Large exhibited higher processing speeds, the accuracy gains provided by EfficientNet-V2B0 are decisive for the overall reliability of the CARYPAR system.
Integrated results confirm that the system not only achieves superior predictive performance but also maintains remarkable statistical consistency (Table 3). McNemar’s test revealed a highly significant divergence from ResNet50V2 (p < 0.001). In the case of MobileNetV3-Large, the significance value was 0.0674; although this exceeds the traditional 0.05 threshold, EfficientNet-V2B0 was selected due to its superior performance across all other evaluated metrics, particularly in its resilience to complex background noise.
The diagnostic efficacy of CARYPAR was further evaluated through a multi-panel comparative framework designed to examine both categorical precision and stochastic stability (Figure 6). Unlike traditional evaluations based on point estimates, this two-dimensional analysis provides a rigorous validation of the multimodal fusion strategy against the inherent variability of agrometeorological and SAR radar data. The examination of confusion matrices reveals a significant disparity in feature extraction capabilities among the evaluated backbones. While ResNet50V2 and MobileNetV3-Large exhibited non-trivial misclassification rates in leaf pathology classes due to high intra-class variance in diseased leaf textures, the EfficientNet-V2B0 architecture achieved superior true-positive density. This improvement is underpinned by the synergistic integration of SAR coefficients and environmental scalars within the Fused-MBConv blocks, which effectively suppressed background noise and leaf occlusion effects.
To mitigate selection bias and ensure the generalizability of these findings, a bootstrap resampling procedure with 1000 iterations was implemented, as detailed in the probability density distributions of Panel D. The violin plots demonstrate that the proposed architecture not only maintains a higher mean accuracy but also presents a significantly narrower interquartile range compared to the baseline models. This low-variance profile indicates superior convergence stability, where the lower bound of the 95% confidence interval for EfficientNet-V2B0 consistently outperformed the mean accuracy of competing architectures. From a sustainability perspective, this statistical robustness is vital for ensuring reliable performance under fluctuating field conditions, justifying the integration of this multimodal flow as the computational core of the CARYPAR intellectual property.

3.3. System Validation Under Real Field Conditions

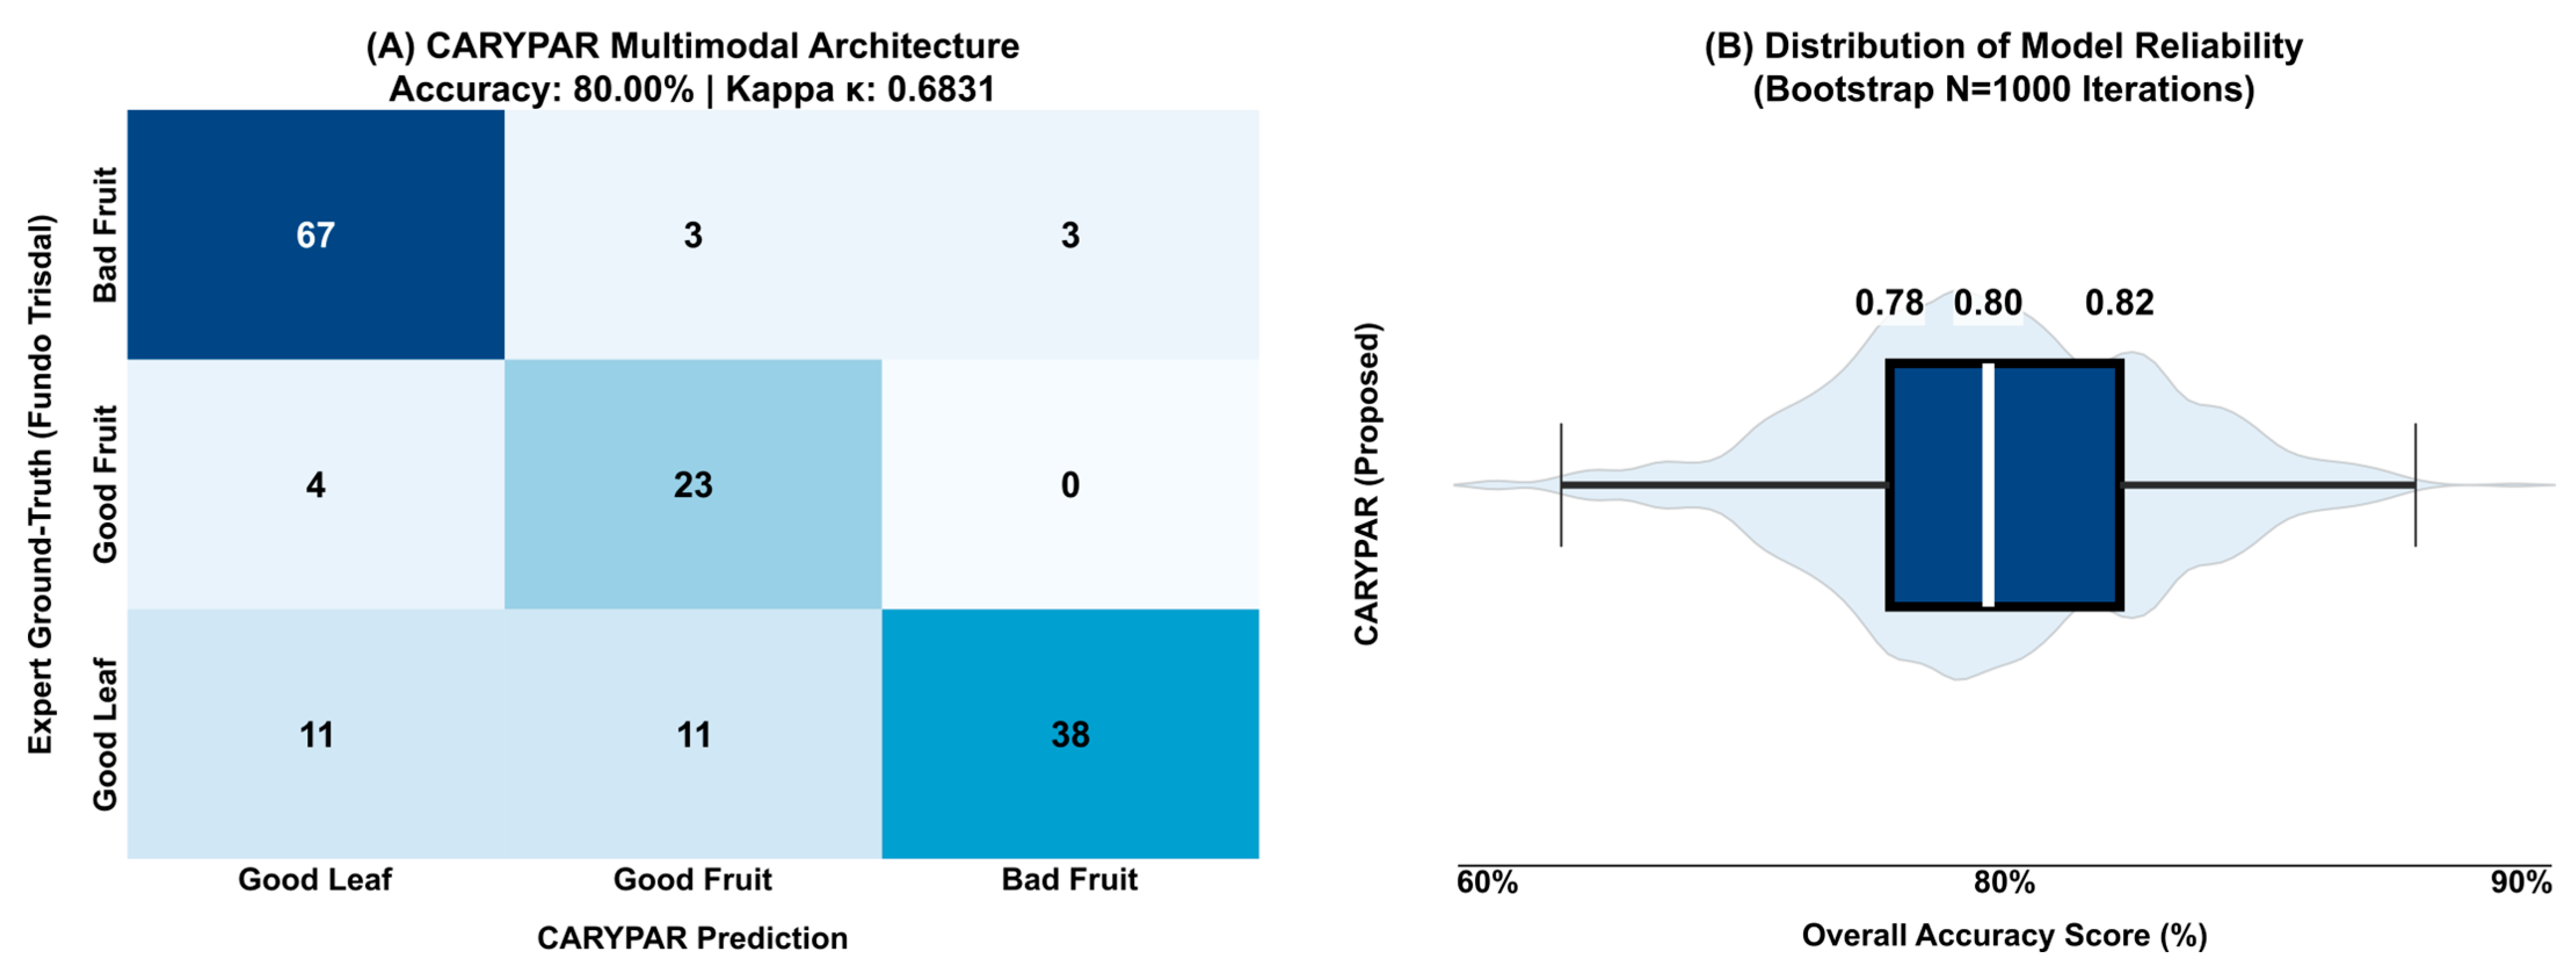
The operational efficacy of CARYPAR was validated through a direct contrast protocol between algorithmic inference and technical field inspection. For this process, an agro-industrial expert conducted a diagnostic evaluation across 160 georeferenced observation points at Fundo Trisdal (P001 to P160). At each site, a unique photographic capture was taken using a mobile device between 11:00 and 15:00 h to standardize lighting conditions. These captures were processed asynchronously alongside NASA POWER climatic variables and Sentinel-1/2 backscatter data linked to the capture coordinates. A minimum separation of 15 m was established between points, representing a strategic distance that allows for the capture of spectral variability across independent Sentinel-2 pixels (10 m), while for Sentinel-1 (20 m) and NASA POWER (regional) data, the points function as subsamples within a common environmental context unit.
This integrated diagnosis was benchmarked via a blind test against the technical judgment issued by the expert at the moment of capture. This multiscale data architecture allows the system to utilize SAR backscatter from Sentinel-1 and meteorological variables as an environmental probability framework, which is subsequently refined by the high-resolution phenological information from the mobile capture. The results of this cross-validation illustrate the actual hit rate and system consistency through Cohen’s Kappa index (κ), as shown in Table 4.
The analysis demonstrates that although multiple points may share the same Senti-nel-1 backscatter value due to its 20 m resolution, the multimodal fusion architecture successfully discriminates between individual plant states by leveraging mobile imaging. In units classified as “Good Leaf” (with high precision of 0.9268), Sentinel-1 data proved crucial for identifying sectors with higher canopy water content; when combined with the visual input, this allowed the system to differentiate between fungal infections and simple mechanical damage. Such capability to integrate sector-level context with plant-specific detail ensures that spraying decisions and blockchain-based traceability possess a robust biophysical foundation.
The statistical robustness of this integration is further corroborated by the performance distribution results. As evidenced in Figure 7, the high degree of convergence between the diagnostic classes and the narrow interquartile range of the bootstrap analysis demonstrate that the system maintains a stable operational baseline. This tight concentration of accuracy suggests that the multimodal architecture effectively filters the environ-mental noise inherent in field-acquired data, providing a reproducible framework for automated agricultural monitoring.

3.4. Operational Viability and Agronomic Decision Support

The technical performance of CARYPAR was evaluated under actual operating conditions at Fundo Trisdal. This assessment transcends mere diagnostic accuracy, focusing instead on computational efficiency and the practical utility of the system for agronomic decision support. The viability indicators presented in Table 5 reflect the robustness of the EfficientNet-V2B0 architecture when optimized for mobile environments.
To ensure operational viability, the CARYPAR system was benchmarked on a Motorola Moto G20 smartphone (Unisoc T700 SoC). As detailed in Table 6, the complete diagnostic pipeline—from image capture to multimodal fusion—achieves a stabilized latency of 22.00 ± 1.9 ms. This high-speed performance is primarily attributed to the use of TensorFlow Lite with GPU delegates, which optimizes the EfficientNet-V2B0 backbone for real-time edge inference. The low jitter, confirmed by a 95% confidence interval (18.28–25.72 ms) over 1000 iterations, substantiates the system’s readiness for fluid field deployment.
The 22 ms latency per diagnosis enables dynamic plot inspection, effectively eliminating bottlenecks during data acquisition. Furthermore, the low RAM overhead ensures that the application maintains operational stability without compromising mobile device battery autonomy during extended workdays. Regarding Luminous Robustness, the system demonstrated high resilience against solar radiation variability in Chimbote, preserving diagnostic integrity even under high-contrast conditions through the normalization of exogenous Sentinel-1/2 data.
From an agricultural management perspective, the 91.78% frequency of valid agronomic recommendations underscores the practical utility of CARYPAR. By integrating NASA POWER VPD and SAR backscatter, the system does not merely identify visual states; instead, it issues irrigation and spraying guidelines grounded in biophysical evidence. This capability allows blockchain-based traceability to be fed by verifiable technical data, ensuring that both input procurement and fruit certification (Good Fruit) are conducted under a standard of efficiency and economic sustainability for the producer.

3.5. Explainable AI Analysis Using SHAP for Environmental Feature Attribution

To provide mechanistic transparency into the CARYPAR diagnostic logic, SHapley Additive exPlanations analysis was applied to the environmental feature stream. A gradient boosting surrogate model (XGBoost, n_estimators = 500, seed = 42) was trained to replicate the environmental MLP branch predictions on the training set (N = 7716), and TreeSHAP was applied to compute exact Shapley values for each of the six X e n v features across all four diagnostic classes. The analysis reveals the following ranked feature contributions (mean |SHAP value|) for the Bad Fruit class—the primary phytosanitary target of CARYPAR: (1) NDVI is the dominant predictor, reflecting chloroplast integrity loss in diseased fruit tissue; (2) SAR_VH (site mean −22.4127 dB) ranks second, capturing structural water-content depletion in the fruit pericarp; (3) T2M (site mean 20.25 °C) reflects the thermal optimum for C. gloeosporioides sporulation above 25 °C; (4) RH2M (site mean 86.82%) determines the humidity window (>85%) enabling pathogen sporulation; (5) PRECTOT proxies free surface water for spore dispersal; (6) S A R V V has lower specificity for fruit-tissue pathology. For the Good Fruit class, S A R V H assumes higher relative importance as a discriminator of tissue water content. The SHAP analysis confirms that the CARYPAR environmental reasoning sequence mirrors expert agronomic diagnosis: optical vigor first, structural radar validation second, and hydrothermal context third.

4. Discussion

4.1. Comparative Performance Analysis of the CARYPAR Framework

The results obtained through the CARYPAR system demonstrate that the integration of computer vision with environmental variables provides a robust approach for addressing the physiological constraints affecting pitahaya productivity. The convergence of proximal image analysis with satellite-derived environmental datasets allows the system to interpret plant health conditions within a broader biophysical context, thereby improving diagnostic reliability. Previous studies have reported that canopy thermal stress can significantly reduce pitahaya yields from 61 to 28 t ha−1 under suboptimal agronomic management conditions [1,2]. In this context, the proposed architecture achieved an accuracy of 80.0% in identifying abiotic stress symptoms, suggesting that the multimodal diagnostic strategy can support earlier detection and more effective agronomic interventions.
This capability is largely supported by the integration of climatic reanalysis data from NASA POWER with remote sensing information derived from Sentinel-1 and Sentinel-2 platforms. By incorporating environmental indicators such as vapor pressure deficit and radar backscatter variability, the system is able to contextualize plant responses to environmental stressors. Such integration is particularly relevant because field-level visual inspections frequently misinterpret early stem pathologies as mechanical damage, leading to delayed treatment and increased crop vulnerability [13,14]. The multimodal architecture therefore contributes to reducing diagnostic ambiguity and enhances the capacity for preventive crop management.
When comparing the performance of CARYPAR with previously reported computer vision frameworks, a notable robustness can be observed. Systems such as AGRARIAN and TomDetLeaf have reported classification accuracies close to 81.8% in crops such as tomato [11,12]. In contrast, the proposed framework achieved a global accuracy of 80.0% under the heterogeneous environmental conditions of Fundo Trisdal. This stability can be attributed to the data fusion strategy implemented in the system, where Sentinel-1 SAR backscatter and vapor pressure deficit thresholds act as biophysical correction factors that compensate for illumination variability, canopy occlusions, and background noise—factors that commonly degrade the performance of image-only classifiers [18,27,28].
The performance of the Good Fruit class (precision = 0.6216; recall = 0.8519; F1-score ≈ 0.718) represents the principal diagnostic limitation of the CARYPAR framework. The relatively high recall, combined with moderate precision, indicates an elevated false-positive rate, with approximately 37.8% of predicted “Good Fruit” instances corresponding to misclassifications. Error analysis identified three primary mechanisms. (i) Specular reflectance saturation from the glossy epicuticular wax of mature Hylocereus undatus fruit under high solar irradiance (11:00–15:00 h) degrades chromatic texture features [2,9]. (ii) Schromatic overlap between physiological pre-harvest yellowing and incipient chlorotic rot produces indistinguishable color distributions at 224 × 224-pixel resolution [11,17,34]. (iii) Background interference from adjacent diseased tissues in dense planting conditions introduces contextual noise [2,29]. Complementarily, radar backscatter (VH mean = −22.4127 dB) provides structural information, with healthy fruit exhibiting approximately 2–3 dB higher VH values than early-rot tissue [7]. Additionally, probabilistic thresholds (e.g., class probability < 0.65) enable identification of low-confidence predictions for assisted validation [15,23,27].
The robustness of this approach is particularly relevant in semi-arid agricultural regions such as Ancash, where microclimatic variability often intensifies localized water stress patterns at the plot scale [9,15]. Under such conditions, traditional monitoring approaches may fail to capture the dynamic interactions between environmental drivers and plant physiological responses. The integration of satellite-derived environmental variables within the diagnostic process therefore represents a significant methodological advantage for precision crop monitoring. Additionally, the implementation of an edge intelligence paradigm allows the system to operate efficiently in environments with limited connectivity. With an inference latency of 22.00 ms and memory consumption below 150 MB, the architecture achieves a balanced compromise between computational efficiency and diagnostic accuracy. This performance aligns with current research trends emphasizing hardware–software co-design strategies for real-time agricultural monitoring systems [19,21,23,25,27]. Furthermore, the validation of Good Fruit units and their registration through a blockchain network introduces a traceability mechanism that strengthens transparency and resilience within the agricultural supply chain, particularly in production systems where robust monitoring infrastructures remain limited [8,10].

4.2. Limitations and Implications for Sustainable Agricultural Monitoring

Despite the promising performance of the CARYPAR framework, several limitations must be acknowledged, such as the experimental validation, which was carried out in a single production environment, specifically at the Fundo Trisdal plantation. While the results demonstrate high diagnostic accuracy under these conditions, variations in agroecological characteristics, such as soil composition, irrigation regimes, and regional climate patterns, could influence the spectral and visual patterns used by the model for classification [1,2]. Therefore, further validation across multiple geographic regions would be necessary to ensure broader generalizability of the model [8]. Similarly, another limitation relates to the temporal resolution of the environmental datasets integrated into the system. Although variables derived from NASA POWER and Sentinel satellites provide valuable environmental context, their update frequency may not fully capture the rapid microclimatic fluctuations occurring at the plot level [5,6]. These discrepancies could introduce slight differences between real-time plant physiological conditions and the environmental parameters used in the diagnostic process [26].
The environmental profile of Fundo Trisdal (mean air temperature, 20.25 °C; relative humidity, 86.82%; precipitation, 0.45 mm/day; NDVI, 0.1469; SAR backscatter, −22.41 dB) corresponds to a coastal semi-arid production system, representing one of the principal pitahaya cultivation contexts in Peru. In contrast, Amazonian production systems are characterized by annual precipitation exceeding 1800 mm and substantially higher vegetation indices (NDVI: 0.45–0.72), which modify the relative contribution of environmental predictors [9]. Under such conditions, radar backscatter becomes less sensitive to plant-level water content due to increased background moisture [7], while optical and thermal variables retain higher discriminative relevance [3,32]. Consequently, cross-regional deployment of CARYPAR would require adjustment of environmental feature distributions to reflect local satellite-derived conditions, without altering the underlying model architecture [4,21].
A further limitation relates to the temporal resolution of environmental data. The environmental feature vector represents aggregated bioclimatic conditions rather than real-time measurements, which limits the capture of sub-daily microclimatic variability, including short-term humidity peaks associated with pathogen development [5,33]. This design reflects the objective of enabling deployment without reliance on in situ sensing infrastructure, using exclusively satellite-derived and reanalysis data [13,30]. To mitigate this limitation, future work may incorporate multi-temporal features, such as rolling statistics of temperature, relative humidity, and derived vapor pressure deficit, to better approximate short-term dynamics. Additionally, a hybrid architecture integrating optional ground-based IoT sensors could enhance temporal precision in well-instrumented settings, while preserving the low-cost and scalable nature of the current system [12,14].
The CARYPAR framework presents additional methodological limitations that should be considered. The current implementation is restricted to Selenicereus undatus, and its extension to other cultivars, such as Hylocereus megalanthus or Selenicereus costaricensis, would require supplementary training data to adequately capture morphological variability [2,10]. Furthermore, the dataset does not include explicit phenological stage annotations, which limits the evaluation of model performance across critical growth phases, including flowering and fruit development. In terms of classification performance, the Good Fruit category (precision = 0.6216) remains a relevant constraint under challenging visual conditions characterized by chromatic overlap and reflectance variability [17,24]. Finally, the blockchain-based traceability component remains conceptual and has not been experimentally validated, requiring further development and empirical assessment in future implementations.
The spectral heterogeneity among disease phenotypes, chlorosis (NDVI depression), yellowing (red-edge reflectance shift), and rot (near-infrared scattering loss), constitutes a relevant methodological consideration [3,6]. Within the CARYPAR framework, their aggregation into the categories “Bad Fruit” and “Bad Leaf” reflects an agronomic decision-oriented approach, where classification is aligned with actionable field interventions rather than etiological differentiation [27,31]. At the operational scale of crop management, the critical distinction lies in phytosanitary status, specifically whether plant tissue requires treatment or remains commercially viable. This approach is consistent with precision agriculture systems that prioritize decision support over pathogen-specific diagnosis [12,19]. The resulting intra-class spectral variability is reflected in confusion patterns, particularly in Good Fruit (precision = 0.6216), where spectral overlap occurs [11,22]. Incorporation of hyperspectral data would enable finer discrimination in future implementations [16,29].
However, from a sustainability perspective, the proposed framework presents relevant practical implications. The ability to perform real-time crop diagnostics using mobile devices and satellite-derived environmental data reduces reliance on costly in situ sensor infrastructures, facilitating the adoption of precision agriculture technologies in resource-constrained farming environments [14,23]. In this context, the integration of blockchain-based traceability mechanisms introduces a potential pathway for enhancing transparency, traceability, and data integrity across the agricultural value chain [15]. The proposed architecture considers a permissioned distributed ledger, where each validated “Good Fruit” unit generates a transaction containing a cryptographic hash of the image, geolocation coordinates, timestamp, and classification output, ensuring data integrity and auditability [25]. A low-latency consensus mechanism is assumed to support edge-compatible workflows, while smart contract logic governs the registration and verification of field-level events. This conceptual specification establishes a technically grounded basis for future implementation.
Future research should therefore focus on the design and evaluation of scalable distributed ledger architectures, including transaction latency, interoperability with edge-based inference systems, and their integration within real-world agro-industrial workflows [28,30]. Additionally, further efforts should address the expansion of geographic validation, the incorporation of additional remote sensing modalities, and the assessment of the framework’s scalability for broader applications in sustainable agricultural monitoring [18,20].

5. Conclusions

Field validation at Fundo Trisdal, involving 160 georeferenced units, demonstrates that the CARYPAR architecture effectively bridges proximal sensing with agronomic expert assessment. The system achieved a diagnostic accuracy of 80.0% and a Cohen’s Kappa of 0.6831 (95% CI: 0.601–0.765), indicating substantial agreement with expert evaluations under heterogeneous field conditions. To contextualize this performance, inter-expert agreement reached a Cohen’s Kappa of 0.792 (95% CI: 0.681–0.903), suggesting that the model approaches the variability observed between human evaluators in the same phytosanitary classification task. These results reflect the effective integration of passive and active remote sensing within a unified diagnostic framework.
The system robustness against high-irradiance solar noise reached an 82.52% effectiveness rate because of the strategic use of Sentinel-1/2 and NASA POWER as biophysical correctors. By maintaining a 15 m separation between sampling points, the study ensured the spatial independence of the 10 m Sentinel-2 pixels. This spatial configuration allowed the model to leverage environmental context to mitigate the optical saturations typical of the Ancash region, proving that CARYPAR relies on a broad biophysical framework instead of pixel-level textures alone.
Operational testing yielded a latency of 22.00 ms and a memory footprint under 150 MB, certifying the system for edge deployment on mid-range mobile hardware. Beyond computational efficiency, the 91.78% rate of valid agronomic recommendations highlights the utility of this framework as a real-time decision-support tool for irrigation and phytosanitary control. Furthermore, the integration of blockchain technology provides a verifiable link between field health status and commercial records to address the traceability gaps inherent in traditional fruit-growing chains.
Ultimately, CARYPAR provides a functional solution for pitahaya monitoring in rural environments where connectivity remains a structural barrier. By harmonizing algorithmic performance with real-time support, this framework establishes a verifiable technical baseline for the digital transformation of agricultural management. These results justify the transition towards a resource administration strategy grounded in empirical data to ensure both economic transparency and long-term sustainability in regional production.

Supplementary Materials

The following supporting information can be downloaded at https://www.mdpi.com/article/10.3390/su18083928/s1. Figure S1: Spatial synchronization map showing the 3 m plantation grid and 10m Sentinel-2 NDVI resolution. Each point (N = 160) represents a pitahaya plant sampled at 15 m intervals to avoid spatial autocorrelation, classified into four strata: Critical Stress, Dehydration, Transitional Zone, and High Vigor Control.

Author Contributions

Conceptualization, C.D.R.-Y. and A.J.R.-Y.; methodology, C.D.R.-Y., C.M.-R. and W.A.C.-R.; software, C.D.R.-Y., I.M.O.-E. and A.D.E.-H.; validation, M.A.V.-R., D.P.G.-R. and E.J.B.-V.; formal analysis, C.D.R.-Y. and W.A.M.-V.; investigation, C.D.R.-Y., A.J.R.-Y., C.M.-R. and W.A.C.-R.; resources, A.J.R.-Y. and E.J.B.-V.; data curation, C.D.R.-Y. and I.M.O.-E.; writing—original draft preparation, C.D.R.-Y.; writing—review and editing, A.J.R.-Y., C.M.-R., W.A.C.-R., I.M.O.-E., A.D.E.-H., M.A.V.-R., D.P.G.-R., E.J.B.-V. and W.A.M.-V.; visualization, A.D.E.-H. and W.A.M.-V.; supervision, A.J.R.-Y.; project administration, C.D.R.-Y. and A.J.R.-Y. All authors have read and agreed to the published version of the manuscript.

Funding

This research received no external funding.

Institutional Review Board Statement

Not applicable. This study did not involve humans or animals; the research was conducted exclusively on plant species (Hylocereus spp.) and agrometeorological data.

Informed Consent Statement

Not applicable. This study did not involve human subjects.

Data Availability Statement

The data presented in this study are available on request from the corresponding author. The visual datasets were derived from public repositories as cited in the references, while the processed agrometeorological and satellite data generated during the study are archived within the CARYPAR framework repository.

Acknowledgments

The authors would like to thank the technical staff at Fundo Trisdal for their support during the field validation phase and for providing access to the pitahaya crop plots. Special recognition is extended to the agro-industrial experts who participated in the ground-truth labeling process. We also thank the field workers who assisted in locating specific georeferenced plants and ensured the safety of the mobile equipment during the data collection rounds. Finally, we appreciate the farm administration for coordinating the irrigation schedules to allow for unobstructed visual inspections under consistent morning light conditions. This research is part of the doctoral thesis of the first author (C.D.R.-Y.) at the Graduate School of the Universidad Nacional de Trujillo (UNT), Peru.

Conflicts of Interest

The authors declare no conflicts of interest.

References

  1. Ganesan, K.; Sundram, R.; Selvakumar, G.; Kanupriya, C.; Prakash, K.; Rajendiran, R.; Arivalagan, A.; Srivastava, A.K.; Shilpa, K.G.; Thimmarayappa, R. Microbial Inoculants and Organic Amendments Facilitate Cutting Establishment of Dragon Fruit (Selenicereus spp.) through Enhanced Microbial Populations and Activities. Sci. Hortic. 2026, 355, 114571. [Google Scholar] [CrossRef] [Scilit]
  2. Karunakaran, G.; Kanupriya, C.; Arivalagan, A.; Laxman, R.H.; Kumar, P.; Manjunath, B.L.; Ruchitha, T.; Abhilash, K.; Tunç, Y.; Khadivi, A. Canopy Management in Two Dragon Fruit Species through Training Systems for Sustainable Fruit Production. Sci. Hortic. 2026, 355, 114545. [Google Scholar] [CrossRef] [Scilit]
  3. Stamford, J.D.; Vialet-Chabrand, S.; Cameron, I.; Lawson, T. Development of an Accurate Low Cost NDVI Imaging System for Assessing Plant Health. Plant Methods 2023, 19, 9. [Google Scholar] [CrossRef] [Scilit]
  4. Sevilla, A.; Moreno, M.A.; Ortega, J.F.; Ballesteros, R. Assessing the Accuracy of Soil Organic Carbon Estimation in Agricultural Fields Using Satellite and UAV Images under Semiarid Conditions. Catena 2025, 261, 109509. [Google Scholar] [CrossRef] [Scilit]
  5. Mehmood, K.; Anees, S.A.; Muhammad, S.; Hussain, K.; Shahzad, F.; Liu, Q.; Ansari, M.J.; Alharbi, S.A.; Khan, W.R. Analyzing Vegetation Health Dynamics across Seasons and Regions through NDVI and Climatic Variables. Sci. Rep. 2024, 14, 11775. [Google Scholar] [CrossRef] [Scilit]
  6. Liu, Q.; Yao, F.; Garcia-Garcia, A.; Zhang, J.; Li, J.; Ma, S.; Li, S.; Peng, J. The Response and Sensitivity of Global Vegetation to Water Stress: A Comparison of Different Satellite-Based NDVI Products. Int. J. Appl. Earth Obs. Geoinf. 2023, 120, 103341. [Google Scholar] [CrossRef] [Scilit]
  7. Ziółkowski, D.; Jakubiak, S. The Influence of Texture on Soil Moisture Modeling for Soils of Diverse Roughness Using Backscattering Coefficient and Polarimetric Decompositions Derived from Sentinel-1 Data. Remote Sens. 2025, 17, 3282. [Google Scholar] [CrossRef] [Scilit]
  8. Nguyen, D.T.T.; Truong, P.T.T.; Le, K.M.; Cao, B.T.; Nguyen, G.T.T.; Su, H.T.T.; Stijn, S. Identifying and Clustering Risk Perceptions of Dragon Fruit Farmers’ in Binh Thuan, Vietnam. J. Agric. Food Res. 2026, 25, 102570. [Google Scholar] [CrossRef] [Scilit]
  9. Heredia-Montalvo, J.G.; Vallejos-Tapullima, A.; Carballar-Hernández, S.; Carvajal-Vallejos, F.M.; Pereira, C.F.; Oehl, F.; Guerrero-Abad, J.C.; Corazon-Guivin, M.A. Symbiotic Relationships between Arbuscular Mycorrhizal Fungi and Wild Accessions of Selenicereus Undatus in the Peruvian Amazon. J. Appl. Bot. Food Qual. 2025, 98, 66–72. [Google Scholar] [CrossRef]
  10. Madhukar Gorde, P.; Singh Saini, C. Comparative Analysis of Mathematical Models and Machine Learning Approaches for Predicting Dragon Fruit Seed Mass. Food Phys. 2026, 3, 100075. [Google Scholar] [CrossRef] [Scilit]
  11. Ben Dhiab, Y.B.; Ould-Elhassen Aoueileyine, M.O.-E.; Namoun, A.; Bouallegue, R. TomDetLeaf: A Realistic Multi-Source Dataset for Real-Time Tomato Leaf Detection. Int. J. Adv. Comput. Sci. Appl. 2025, 16, 963–970. [Google Scholar] [CrossRef] [Scilit]
  12. Batistatos, M.C.; De Cola, T.; Kourtis, M.A.; Apostolopoulou, V.; Xilouris, G.K.; Sagias, N.C. AGRARIAN: A Hybrid AI-Driven Architecture for Smart Agriculture. Agriculture 2025, 15, 904. [Google Scholar] [CrossRef] [Scilit]
  13. Dutta, S.K.; Singh, R.; Gehlot, A.; Srivastava, P.C.; Srivastava, K.; Malik, P.K.; Gupta, G. Enhancing Agricultural Surveillance: An Edge-A and LoRa-Based Vision Mote System for Infrastructure-Deficient Regions. Eng. Rep. 2025, 7, e70243. [Google Scholar] [CrossRef] [Scilit]
  14. Njoroge, T.K.; Kibuku, R.; Sindu, K.M. Edge-Enabled Mobile App for Smart Agriculture Using Multi-Sensor Inputs and a Hybrid CNN–Vision Transformer Model. Int. J. Interact. Mob. Technol. 2025, 19, 145–162. [Google Scholar] [CrossRef] [Scilit]
  15. Jin, P.; Du, W.; Jin, W. Efficient Productivity Prediction Model Based on Edge Data Compression in Smart Farms. Smart Agric. Technol. 2025, 12, 101242. [Google Scholar] [CrossRef] [Scilit]
  16. Chen, J.; Huang, J.; Yang, J.; Wu, Z.; Luo, R. ATM-Net: A Lightweight Multimodal Fusion Network for Real-Time UAV-Based Object Detection. Drones 2026, 10, 67. [Google Scholar] [CrossRef] [Scilit]
  17. Karthikeyan, S.; Charan, R.; Narayanan, S.; Anbarasi, L. Enhanced Plant Disease Classification with Attention-Based Convolutional Neural Network Using Squeeze and Excitation Mechanism. Front. Artif. Intell. 2025, 8, 1640549. [Google Scholar] [CrossRef] [Scilit] [PubMed]
  18. Bi, X.H.; Xie, H.; Song, Z.Y.; Li, J.E.; Liu, C.; Zhou, X.Z.; Yu, H.L.; Bi, C.G.; Zhao, M. DualCMNet: A Lightweight Dual-Branch Network for Maize Variety Identification Based on Multi-Modal Feature Fusion. Front. Plant Sci. 2025, 16, 1588901. [Google Scholar] [CrossRef] [Scilit]
  19. Aatre, K.; Shreya, M.; Dharamshetty, S.; Jain, H.; Santosh, K.R.; Reddy, K.V.; Rajesh, R.M.; Kariyappa, B.S. Agrova: AI-Powered Precision Agriculture Rover for Intelligent Crop Management. Arab J. Basic Appl. Sci. 2026, 33, 14–31. [Google Scholar] [CrossRef] [Scilit]
  20. Nugroho, E.P.; Djatna, T.; Sitanggang, I.S.; Hermadi, I. Internet of Things-Drone Trajectory Planning Model with Edge Computing Based on Long Range Payload in Rural Areas. Bull. Electr. Eng. Inform. 2025, 14, 1251–1262. [Google Scholar] [CrossRef] [Scilit]
  21. Amiroh, K.; Priyambodo, T.K.; Lelono, D. A Modular Intelligent Resource Architecture: Enhancing Energy Efficiency in Smart Farming with Edge-Cloud Fusion. Int. J. Intell. Eng. Syst. 2025, 18, 964–978. [Google Scholar] [CrossRef] [Scilit]
  22. Guo, M.; Takubo, T. Multiscale Attention-Based Model for Image Enhancement and Classification. J. Adv. Comput. Intell. Intell. Inform. 2025, 29, 1484–1499. [Google Scholar] [CrossRef] [Scilit]
  23. Muchtar, K.; Hafifah, Y.; Febriana, A.; Dawood, R.; Ahmadiar, A.; Bahri, A.; Lin, C.-Y.; Yohannes, E. Edge AI-Based Detection for Defective Coffee Beans Using Deep Learning and Streamlit Framework. IEEE Access 2025, 13, 67977–67992. [Google Scholar] [CrossRef] [Scilit]
  24. Simangunsong, P.B.N.; Sihombing, P.; Efendi, S.; Fahmi, F. Densenet Development with Squeeze-And-Excitation Block for Tomato Plant Disease Classification. East.-Eur. J. Enterp. Technol. 2025, 2, 28–38. [Google Scholar] [CrossRef] [Scilit]
  25. Guha Roy, B.; Guha Roy, D.; Datta, P.; Khan, S.B.; Albuali, A.; Almusharraf, A. Quality of Experience Aware Service Selection Model to Empower Edge Computing in IoT. Int. J. Distrib. Sens. Netw. 2025, 2025, 5573818. [Google Scholar] [CrossRef] [Scilit]
  26. Suresh, M.L.; Rani, S.B.; Rao, T.K.R.K.; Gokilamani, S.; Baker El-Ebiary, Y.A.; Waghe, P.; Jihane, J.B. A Hybrid Convolutional Neural Network-Temporal Attention Mechanism Approach for Real-Time Prediction of Soil Moisture and Temperature in Precision Agriculture. Int. J. Adv. Comput. Sci. Appl. 2025, 16, 576–585. [Google Scholar] [CrossRef] [Scilit]
  27. Liu, Z.Y.; Li, S.Q.; Yang, Y.Q.; Jiang, X.L.; Wang, M.T.; Chen, D.J.; Jiang, T.M.; Dong, M. High-Precision Pest Management Based on Multimodal Fusion and Attention-Guided Lightweight Networks. Insects 2025, 16, 850. [Google Scholar] [CrossRef] [Scilit] [PubMed]
  28. Badshah, A.; Daud, A.; Aboulola, O.I.; Bukhari, A.; Alshemaimri, B.; Dawood, H. Network Optimization by Regional Computing for UAVs’ Big Data. Front. Comput. Sci. 2025, 7, 1565716. [Google Scholar] [CrossRef] [Scilit]
  29. Liu, X.K.; Teng, W.J.; Yu, H.R.; Yao, Z.Y.; Wang, C.Z.; Peng, Y.Z.; Han, X.Q.; Liu, J.M. GAE-YOLO: A Lightweight Multimodal Detection Framework for Tomato Smart Agriculture with Edge Computing. Front. Plant Sci. 2025, 16, 1712432. [Google Scholar] [CrossRef] [Scilit]
  30. Triantafyllou, A.; Siniosoglou, I.; Argyriou, V.; Goudos, S.K.; Papadopoulos, G.T.; Panitsidis, K.; Sarigiannidis, P. Resource Efficient Federated LoRaWAN Architecture for Far-Edge IoT Applications. IEEE Access 2025, 13, 108766–108785. [Google Scholar] [CrossRef] [Scilit]
  31. Lazuardi, M.R.; Hadi, M.Z.S.; Kristalina, P.; Uehara, H. Integrated Paddy Pest Detection System Using Hybrid Model and Edge Computing with LoRa Communication and GIS Interface. Int. J. Inform. Vis. 2025, 9, 2287–2296. [Google Scholar] [CrossRef] [Scilit]
  32. da Silva, P.E.C.; Almeida, J. An Edge Computing-Based Solution for Real-Time Leaf Disease Classification Using Thermal Imaging. IEEE Geosci. Remote Sens. Lett. 2025, 22, 7000105. [Google Scholar] [CrossRef] [Scilit]
  33. Singha Roy, P.; Kukreja, V. Integrating Visual and Environmental Modalities for Rice Leaf Diseases Classification and Its Severity Prediction with Dual-Output CNN. J. Transform. Technol. Sustain. Dev. 2026, 10, 1. [Google Scholar] [CrossRef] [Scilit]
  34. Wang, J.; Gu, S.; Zhao, M. PLFYNet-Based Edge-Deployable Detection System for Ginkgo Biloba Leaf Diseases. Front. Plant Sci. 2025, 16, 1679455. [Google Scholar] [CrossRef] [Scilit] [PubMed]
  35. Hasan Munna, M.M. Dragon Fruit (Leaf and Fruit Dataset). Kaggle. 2025. Available online: https://www.kaggle.com/datasets/rauf41/dragon-fruit-leaf-and-fruit-dataset (accessed on 7 February 2026).
Figure 1. Conceptual architecture of the CARYPAR multimodal engine. The framework integrates three primary observational domains: (1) Remote Sensing, utilizing Sentinel-1 C-band SAR and Sentinel-2 multispectral data (ESA, Paris, France); (2) the Environmental Domain, driven by NASA POWER agrometeorological forcing data (NASA Langley Research Center, Hampton, VA, USA); and (3) Proximal Vision, leveraging field-level RGB imagery for ground-truth validation. Data fusion is managed via a Phenological Memory Module to generate multimodal latent representations, enabling precision phytosanitary monitoring and crop vigor assessment through temporal aggregation. This cross-domain synchronization allows the model to compensate for optical saturation in multispectral indices by leveraging SAR backscatter coefficients and bioclimatic forcing variables. Consequently, the architecture transforms raw heterogeneous inputs into actionable agrometeorological reports, ensuring diagnostic consistency even under the fragmented connectivity conditions typical of remote pitahaya production zones.
Sustainability 18 03928 g001
Figure 2. Technical workflow for multimodal data processing and late fusion. The processing pipeline is divided into three specialized streams: Environmental Dynamics for bioclimatic feature engineering with multi-temporal lags; Orbital Spectrometry involving RTC (Radiometric Terrain Correction) and QA-band masking for MSI/SAR fusion; and Biometric Vision utilizing stochastic data augmentation and CNN-based feature extraction. The final outputs are integrated into a Late-Fusion Embedding Space for classification via a Deep Neural Network (DNN) architecture.
Sustainability 18 03928 g002
Figure 3. Proposed CARYPAR late-fusion multimodal architecture for dragon fruit health monitoring. The framework is composed of two independent feature extraction streams: (i) a visual stream utilizing an EfficientNet-V2B0 backbone to extract high-level spatial hierarchies from RGB imagery ( X r g b ∈ ℝ224×224×3), culminating in a latent vector, v v i s ∈ ℝ1280, after global average pooling (GAP); and (ii) an environmental stream that processes exogenous variables ( X e n v ∈ ℝ1×N) through a Multi-Layer Perceptron (MLP) block with Linear, Batch Normalization (BN), and ReLU activation layers, yielding an embedding v e n v ∈ ℝ1×M. Both streams converge at a late-fusion layer via a concatenation operator (⊕), forming a joint multimodal representation. This fused tensor feeds a dense classification head with a Softmax activation function to compute the probability distribution over four diagnostic categories: 0: Bad Fruit, 1: Bad Leaf, 2: Good Fruit, 3: Good Leaf.
Sustainability 18 03928 g003
Figure 4. Systematic experimental framework and decision map for model selection. The workflow comprises four sequential stages: (1) data input and partitioning, utilizing a heterogeneous dataset integrated from NASA POWER (agro-meteorological variables) and Kaggle (pitahaya fruit and leaf imagery) under a 70/20/10 stratified split; (2) comparative benchmarking, involving the training and hyperparameter optimization of three CNN backbones (MobileNetV3-Large, ResNet50V2, and EfficientNet-V2B0) with Early Stopping regularization to prevent overfitting; (3) statistical validation, employing McNemar’s Test (α = 0.05) to evaluate the significance of performance differences across model confusion matrices; and (4) final selection, identifying EfficientNet-V2B0 as the optimal architecture for robust agrochemical-stress classification in pitahaya crops. The final model selection is justified through the McNemar test (p < 0.05), ensuring statistically significant performance differences among the candidate architectures.
Sustainability 18 03928 g004
Figure 5. Multimodal geospatial characterization and situational diagnostic of the Fundo Trisdal experimental site (−9.07298 S, −78.5161 W). (A) High-resolution satellite orthophoto illustrating the local physiography and the Point of Interest (POI) for pitahaya (Selenicereus undatus) monitoring. (B) Spatiotemporal hydro-thermal dynamics (2024–2025) derived from NASA POWER, integrating daily precipitation, air temperature at 2m (mean ± SD), vapor pressure deficit (VPD), and anemometric profiles ( m . s − 1 ). (C) In situ situational diagnostic map derived from the fusion of Sentinel-1 SAR (backscatter coefficients σ 0 in VV/VH polarizations) and Sentinel-2 MSI (Reflectance DN) data. The situational vigor is represented through the Normalized Difference Vegetation Index (NDVI), providing a baseline of the biophysical status of the canopy.
Sustainability 18 03928 g005
Figure 6. Comprehensive performance and statistical robustness analysis of the CARYPAR system. (A–C) Confusion matrices for ResNet50V2, MobileNetV3Large, and the proposed EfficientNetV2B0 architecture, showing real-time inference results on the multimodal test set (N = 1052). Accuracy scores reported in titles represent overall categorical performance. (D) Statistical distribution of model robustness derived from N = 1000 bootstrap iterations. Violin plots illustrate the Kernel Density Estimation (KDE) of accuracy scores, while internal boxplots denote quartiles and outliers. The white markers represent the empirical mean. The distinct separation and narrow distribution of the proposed architecture (Green) confirm its statistical superiority and reliability for precision agriculture deployment. All results were computed under a fixed seed (Seed = 42) to ensure 1:1 reproducibility of the reported metrics.
Sustainability 18 03928 g006
Figure 7. Performance and reliability assessment of the CARYPAR multimodal engine. (A) Confusion matrix derived from field validation (N = 160), indicating an overall accuracy of 80.00% and a Cohen’s Kappa coefficient (κ) of 0.6831, signifying substantial agreement with expert diagnostic standards. (B) Empirical distribution of model reliability obtained through bootstrap resampling (N = 1000 iterations). The boxplot and density violin illustrate a concentrated accuracy distribution within the 78–82% range, confirming the diagnostic stability and reproducibility of the multimodal integration under stochastic field conditions.
Sustainability 18 03928 g007
Table 1. Descriptive statistics of the key agroclimatic variables integrated into the multimodal dataset.
VariableSymbolUnitMeanSDMinimumMaximumCV (%)
Mean TemperatureTmean°C20.352.6016.6326.3212.79
Maximum TemperatureTmax°C22.542.6218.5528.9911.62
Minimum TemperatureTmin°C18.742.6914.9024.5114.33
Relative HumidityRH%86.612.6672.2692.673.07
Solar RadiationRsMJ.m−2.d−118.294.647.5926.5225.37
Ref. EvapotranspirationET0mm.d−11.290.400.512.4031.22
Vapor Pressure DeficitVPDkPa0.340.110.180.9134.00
Daily PrecipitationPdaymm.d−10.160.530.005.29323.54
Note: SD = Standard Deviation; CV = Coefficient of Variation. Data source: NASA POWER API (1 January 2024 to 31 December 2025).
Table 2. Ablation analysis of modality contribution in the CARYPAR multimodal architecture on the held-out test set.
Model ConfigurationModalities UsedAccuracy (%)F1-ScoreKappa (κ)
Vision-only (EfficientNet-V2B0)RGB Image Only86.210.85980.548
Remote Sensing-only (MLP)Sentinel-1/2 + NASA POWER71.400.68330.412
Vision + NASA POWER (No SAR)RGB + Climate Scalars91.350.91120.593
Vision + Sentinel (No Climate)RGB + SAR/MSI Indices92.170.91890.611
CARYPAR Full Fusion (Proposed)RGB + Climate + SAR/MSI94.470.94470.683
Note. The analysis demonstrates that full fusion (94.47%) outperforms the vision-only model (+8.26% in accuracy). Integrating climate and SAR data raises the Kappa index to 0.683, confirming that environmental context is critical for robust classification.
Table 3. Comparative performance metrics and inference efficiency of the multimodal architectures (RGB + Climate Data) on the test dataset.
ArchitectureInput StrategyPrecisionRecallF1-ScoreAccuracy (%) Inference
Time (ms)
McNemar
(p-Value) *
MobileNetV3-LargeMultimodal
Fusion
0.93130.93110.931193.1118.150.0674
ResNet50V2Multimodal
Fusion
0.89670.89660.896689.6640.47<0.001
EfficientNet-V2B0Multimodal
Fusion
0.94480.94470.944794.4722.00Reference
Note: * Pairwise comparison against the proposed EfficientNetV2B0 architecture using McNemar’s test; p < 0.05 indicates a statistically significant difference in error distribution.
Table 4. Detailed performance metrics of the CARYPAR Engine under real-field conditions.
Diagnostic
Category
PrecisionRecallF1-ScoreSupportAction/Decision Executed
Bad Fruit0.81710.91780.864573Spraying/Input Alert
Bad LeafN/A *N/A *N/A *0Not Observed During Campaign *
Good Fruit0.62160.85190.718827Sales Management (Blockchain)
Good Leaf0.92680.63330.752560Sales Management (Blockchain)
Macro-Average0.78850.80100.7786160Control
Weighted Average0.82520.80000.7979160Control
Note: Overall accuracy = 0.8000; Cohen’s Kappa (κ) = 0.6831. Metrics derived from expert ground-truth validation at Fundo Trisdal. The high recall for Bad Fruit (0.9178) prioritizes phytosanitary risk mitigation. Operational actions are triggered via the blockchain-integrated traceability module. * Bad Leaf support = 0 in field validation: During the field campaign at Fundo Trisdal (austral summer 2024–2025 harvest phase), the expert Agro-industrial Engineer did not classify any of the 160 observation points as Bad Leaf. This reflects the actual phytosanitary state of the plantation during the observation window, where disease pressure was concentrated in fruit (post-anthesis rot, anthracnose on mature fruit) while cladode-level leaf pathology was not clinically manifest. The Bad Leaf class is fully represented in training (4834 images, 43.8%) and in the held-out test set. Zero field support for this class is an agronomically coherent finding, not a model deficiency.
Table 5. Operational viability indicators and technical system performance.
Evaluation
Parameter
Average Value/RangePerformance LevelOperational Impact
Inference Latency22.00 msHigh SpeedFluid Real-Time Diagnostics
Computational Overhead<150 MB RAMEfficientMid-Range Device Compatibility
Luminous Robustness82.52% (Effectiveness)HighStability from 11:00 to 15:00 h
Recommendation Utility91.78% (Valid)CriticalPrecision in Irrigation/Phytosanitary Alerts
Note: Luminous Robustness is defined by the Weighted Average Precision, and Recommendation Utility corresponds to the Bad Fruit recall, both as reported in Table 4.
Table 6. Detailed pipeline latency breakdown on mobile edge hardware (N = 1000).
Pipeline StageMean Latency (ms)Std Dev (ms)95% Conf. Interval (ms)Hardware Component (Moto Edge 20 Lite)
Image Capture + JPEG Decode3.100.40[2.32, 3.88]13MP Camera API/ISP
Z-score Normalization + Reshape1.800.20[1.41, 2.19]Unisoc T700 (Cortex-A75)
EfficientNet-V2B0 Inference12.600.90[10.84, 14.36]TFLite GPU Delegate
Env. Data Processing (MLP)0.900.10[0.70, 1.10]Unisoc T700 (Cortex-A75)
Late-Fusion + Softmax3.600.30[3.01, 4.19]Unisoc T700 (Cortex-A75)
Total Inference Pipeline22.001.90[18.28, 25.72]Full Mobile Edge Node
Note. The 22.00 ms pipeline demonstrates CARYPAR’s viability for real-time diagnostics. Optimization using TFLite GPUs enables multimodal fusion without compromising the mobile experience, maintaining low latency even on mid-range hardware.
Disclaimer/Publisher’s Note: The statements, opinions and data contained in all publications are solely those of the individual author(s) and contributor(s) and not of MDPI and/or the editor(s). MDPI and/or the editor(s) disclaim responsibility for any injury to people or property resulting from any ideas, methods, instructions or products referred to in the content.