Article

Enhancing Resilience and Profitability in Electric Construction Machinery Leasing Supply Chain: A Differential Game Analysis of Maintenance and Contract Design

1
School of Economics and Management, University of Science and Technology Beijing, Beijing 100083, China
2
School of Economics and Management, Beijing Institute of Graphic Communication, Beijing 102627, China
3
Interdisciplinary Center, Shandong University, Jinan 250100, China
4
School of Economics and Management, Beijing Jiaotong University, Beijing 100044, China
5
School of Foreign Languages, Peking University, Beijing 100871, China
6
School of Economics and Management, Beijing Forestry University, Beijing 100083, China
*
Authors to whom correspondence should be addressed.
Sustainability 2026, 18(8), 3722; https://doi.org/10.3390/su18083722
Submission received: 10 March 2026 / Revised: 5 April 2026 / Accepted: 7 April 2026 / Published: 9 April 2026

Abstract

The production and leasing of electric construction machinery play a critical role in the low-carbon transition. However, from a multi-cycle dynamic perspective, there is a lack of targeted research on how to enhance electric goodwill and AI-enabled maintenance service levels while maximizing enterprise profits. To fill this gap, this study incorporates AI-enabled O&M effort, R&D technology, AI-enabled maintenance effort, and advertising effort into a long-term dynamic framework to examine optimal decisions for the manufacturer and the lessor. We assume that the information in the leasing supply chain is symmetric, that the marginal profits of the manufacturer and the lessor are fixed parameters, and that the AI-enabled maintenance service effort level and the electric goodwill are taken as state variables. We develop differential game models across four decision cases: centralized (Case C), decentralized (Case D), unilateral cost-sharing contract (Case U), and bilateral cost-sharing contract (Case B). Results demonstrate monotonic state variable trajectories. Both Case U and Case B can achieve supply chain coordination, with the profit-sharing mechanism in Case B proving superior. In addition, the optimal cost-sharing proportion depends on the relative sizes of the manufacturer’s and the lessor’s marginal profits in both Case U and Case B. The AI-enabled maintenance service plays a significant role in enhancing equipment reliability and supply chain resilience. In addition, the impacts of key parameters on optimal decision variables, state variables, profits, and coordination of the leasing supply chain are comprehensively discussed.

1. Introduction

To address the energy crisis and global temperature rise, countries worldwide are actively exploring methods for low-carbon and sustainable development. This requires the joint efforts of all industries to reduce carbon emissions [1,2]. The construction industry plays an important role in achieving low-carbon sustainable development, as it accounts for 40% of global energy consumption and produces approximately one-third of carbon emissions [3,4,5]. In particular, the construction industry in China has higher carbon emissions, reaching up to 50.6% [6]. Therefore, reducing carbon emissions within the construction industry has become an urgent imperative [7]. Reducing carbon emissions in the construction industry spans the entire life cycle of construction activities, including the production of raw materials, transportation, construction, operation, and demolition phases [8,9]. Historically, the raw material production and operational phases have accounted for a substantial portion of emissions. However, with the widespread adoption of energy-efficient and sustainable buildings, the construction phase accounts for 20–50% of lifecycle carbon emissions and is a critical source [10]. Consequently, reducing carbon emissions during the construction phase has garnered increasing attention.
Construction machinery has been recognized as a significant source of carbon emissions during the building construction phase [8], primarily due to its high energy consumption, substantial pollution, and large production volumes. Consequently, it is urgent to address this challenge with new technologies. With tightening emission-reduction regulations and the maturation of electric-vehicle drive technologies, the electrification of construction machinery represents a viable path toward sustainable development in the construction industry [11]. This category primarily includes hybrid and pure electric construction machinery. However, hybrid machinery still relies on fuel engines for power, resulting in carbon emissions that are inconsistent with current stringent environmental policies [12]. In contrast, pure electric construction machinery can achieve zero carbon emissions during operation [12]. Therefore, promoting the use of pure electric construction machinery is a key step toward reducing carbon emissions during construction. In practice, industry leaders such as Caterpillar, Volvo, Zoomlion, XCMG, and Sany have actively manufactured electric construction machinery, including electric excavators, electric loaders, electric dump trucks, electric mixers, and electric pump trucks. Nevertheless, the market share of these electrical products remains relatively low, and research in this area is still limited. Studying and promoting electric construction machinery is, therefore, highly valuable for reducing carbon emissions during construction and supporting the low-carbon, sustainable growth of the construction industry.
Complex operational environments [13], collaborative operations [14], and heavy asset nature are typical characteristics of construction machinery [15]. Compared to traditional fuel-powered construction machinery, electric construction machinery has a limited range and longer charging times, which reduces operational efficiency, while the complex working environment and collaborative operations further exacerbate these issues [16]. Therefore, manufacturers urgently need to increase research and development (R&D) investment to produce electrical products that better meet user needs. However, high R&D costs lead to higher product prices, with electric construction machinery generally priced above traditional fuel-powered equipment [17]. These characteristics require customers to consider not only operational costs but also to comprehensively evaluate the initial purchase cost, product performance, and maintenance services when making decisions [18]. Consequently, if construction companies lack sufficient initial capital or experience in equipment maintenance, their willingness to purchase electric construction machinery will decrease, thereby hindering the low-carbon development of the construction industry. To address this challenge, the leasing model has emerged as a feasible pathway for low-carbon and sustainable development. Leasing electric construction machinery not only alleviates customers’ initial capital constraints and improves equipment utilization rates but also enables lessors to provide professional routine maintenance services [18].
The construction machinery leasing supply chain is characterized by long service cycles, high equipment failure risks, significant demand fluctuations, and a high reliance on maintenance. In recent years, market turbulence, supply disruptions, and unexpected construction delays caused by the COVID-19 pandemic and wars have highlighted the importance of supply chain resilience [19]. Traditional construction machinery leasing and maintenance models excessively focus on short-term costs and profits, neglecting long-term resilience, which leads to frequent service interruptions, low equipment reliability, and an unstable market reputation for electric construction machinery. The application of artificial intelligence provides new pathways to enhance the risk resilience of the new energy construction machinery leasing supply chain. AI-based predictive maintenance [20], real-time monitoring, and intelligent operations can effectively reduce failure rates, shorten response times, and enhance service continuity. For instance, Zoomlion’s subsidiary, Zoomlion Cloud Valley, has developed a new-generation industrial internet platform integrated with AI technology. Customers can interact with the AI digital assistant “AI Xiaogu” to quickly identify faulty equipment and its location, match with maintenance engineers, and dispatch work orders, significantly improving maintenance service efficiency and customer satisfaction. Similarly, Sany Heavy Industry has implemented a 5G and AI-based AR system on its Zambia project to enable remote equipment maintenance, reducing equipment failure rates by 28%. Currently, this system is being used to maintain Sany’s pile drivers, loaders, and excavators. Except for issues requiring factory returns, all other faults can be effectively resolved by the remote system.
Although investment in AI technology can enhance the availability of construction machinery, the resilience of the leasing supply chain, and the market share of leased equipment. The implementation of AI technologies typically requires substantial investment. For instance, in 2022, XCMG HANYUN raised 300 million RMB to support the deployment of AI and big data technologies in manufacturing and supply chain processes. At CES 2026, Caterpillar demonstrated how AI is reshaping the heavy machinery industry with the introduction of its AI assistant and announced its plan to increase investment in digital technologies to 2.5 times the current level by 2030. Furthermore, in 2025, SANY Heavy Industry intensified its efforts to advance electrification and intelligent transformation, with R&D investments reaching 2.162 billion RMB. In April 2024, the construction machinery lessor HuaTie Emergency invested 200 million RMB to establish a wholly owned subsidiary, aiming to strengthen research and application in new-generation information technologies such as AI and build a “platform + service” model. Therefore, high costs have become a key factor restricting the high-quality and intelligent development of electric construction machinery, forcing enterprises to balance profitability with related investments. To address this issue, the Chinese government has introduced subsidy policies, such as promoting the adoption of electric alternatives to replace old fuel-powered construction machinery. However, the incentive effects on manufacturers and lessors have been limited. Therefore, from a supply chain perspective, strengthening collaboration between manufacturers and lessors through contracts can better resolve this issue [21]. Cost-sharing contracts have been proven to be effective for achieving supply chain coordination, particularly in the presence of additional costs. Hence, using cost-sharing contracts to incentivize manufacturers and lessors to invest in related technological and operational costs is a crucial aspect of our study.
In general, greater efforts in the production, leasing, and maintenance of electric construction machinery hold significant practical value. However, most current studies employ qualitative methods and lack exploration of the impact mechanisms of AI on the supply chain. Therefore, our study adopts a quantitative approach to investigate the optimal decision-making and coordination in an AI-driven electric construction machinery leasing supply chain. Focusing on a leasing supply chain consisting of a manufacturer and a lessor, we consider the manufacturer’s investment in R&D technology and AI-enabled operations and maintenance (O&M) effort, as well as the lessor’s investment in advertising effort and AI-enabled maintenance effort. Moreover, the effects of technological and service investments often exhibit a lagged effect. Therefore, multi-period differential game models are developed, including four cases, Case C, Case D, Case U, and Case B, to address the following research questions.
(1)
In four cases, how do the manufacturer and lessor make long-term optimal decisions in the context of low-carbon and digital transformation?
(2)
Compared with Case D, are cost-sharing contracts effective in enhancing the AI-enabled maintenance service level, electric goodwill, market demand, profitability, and supply chain resilience? Moreover, which type of contract is more advantageous, and how should the manufacturer and the lessor choose between the two cost-sharing contracts?
(3)
How do key parameters such as the AI-enabled maintenance effort cost coefficient and electric preference affect decision variables, state variables, and profits?
The rest of our study is organized as follows. Section 2 reviews the related literature. Section 3 describes the problem and presents the key hypotheses. Section 4 develops and solves differential game models for four cases: Case C, Case D, Case U, and Case B. Section 5 compares the results of these cases. Section 6 performs numerical analyses to validate the theoretical models and derive insights. Section 7 presents the conclusions, management implications, limitations, and future research directions.

2. Literature Review

The literature related to our study contains three main streams, namely electric construction machinery, supply chain coordination based on the differential game, and supply chain management driven by AI.

2.1. Electric Construction Machinery

The trend toward decarbonizing the building industry has made electric construction machinery a critical area of research and development [22]. This shift is driven by increasingly stringent environmental regulations and by the high pollution and carbon emissions associated with fuel-powered construction equipment. Recent scholarship has increasingly focused on quantifying the feasibility and environmental benefits of this transition. Yi et al. [23] developed a multicriteria assessment framework integrating data envelopment analysis and the analytic hierarchy process, applying it to Beijing’s construction fleet to project that, by 2030, electrification would reduce the regional average concentration of CO2 by 11.7–56.9%. Trinh et al. [24] reviewed the energy management strategies of hybrid construction machinery, noting that they offer greater advantages than conventional fuel-powered construction machinery in reducing carbon emissions. However, electric construction machinery is more advantageous than hybrid construction machinery in reducing carbon emissions [12].
In addition to research on the environmental feasibility of electric construction machinery, substantial efforts have also been directed towards technological development and system optimization, primarily involving energy storage systems, powertrain configuration, and control strategies. Huang et al. [12,15,16] conducted a series of studies on the mechanical components required for electric construction machinery, including energy storage systems, collaborative systems, and control strategies. They also noted a significant difference in electrification rates. By 2022, the electrification rate of forklifts will exceed 63%, while the electrification rates of electric excavators and loaders are still below 0.1%.
The above research on electric construction machinery provides important references for this paper. However, these studies did not focus on the supply chain operation. Construction machinery is a durable product and exhibits characteristics similar to those of an electric vehicle (new energy vehicle). Therefore, research on the operation of the electric vehicle supply chain has a significant reference value. Most research in this area focuses on electric vehicle supply chain operations under government policy [25,26,27,28], without government policy [29,30], and on electric battery recycling [31,32]. From these studies, we acknowledge that strengthening R&D and advertising investment in electrical products can increase market demand, thereby improving corporate profits. It is also necessary to strengthen cooperation among supply chain members through contractual arrangements to further increase profits for all parties involved.
When initial funds are insufficient, a leasing model can be used for construction machinery [33]. Yin et al. conducted a series of research around the construction machinery leasing supply chain, considering the maintenance effort of the lessor and the value of the industrial Internet platform, and not only studied the leasing supply chain pricing and coordinated decision-making based on the industrial Internet platform [18], but also researched the leasing supply chain coordinated decision-making under the carbon tax policy [34] and the integrated installation-dismantling services [35]. These studies reveal that supply chain leasing is a low-carbon model and that maintenance of construction machinery can increase leasing demand, reduce product production scale, and improve utilization rates. For electric construction machinery that is more expensive than fuel-powered machinery, the leasing model is more practical. Our research employs an artificial intelligence-based maintenance service to enhance maintenance service levels and improve equipment reliability, thereby increasing leasing demand and improving the utilization rate of new energy products. This is a multifaceted approach to achieving low-carbon, sustainable development in the construction machinery industry through the production and leasing of electrical products.

2.2. Supply Chain Coordination Based on the Differential Game

To increase leasing demand for electric equipment and the profitability of upstream and downstream enterprises in the electric construction machinery leasing supply chain, it is effective to design a contract-coordination supply chain. It can address the dilemma of low market share for electric equipment, inadequate maintenance services, and insufficient initial capital in the construction machinery industry’s electrification, greening, and intelligence. At present, there are many studies on supply chain coordination, mainly divided into two lines. One is single-cycle static supply chain coordination [36,37,38], and the other is multi-cycle dynamic supply chain coordination.
Given that the effects of electric drive R&D technology, AI technology, advertising effort, and maintenance effort often exhibit delayed responses, this study investigates them from a multi-cycle dynamic perspective. Regarding the multi-period dynamic supply chain coordination, most of them are studied by using a differential game model, such as Ma et al. [39], who applied a differential game model to study the investment in preservation technology and carbon abatement behaviors of cold chain members from long-term and dynamic perspectives, and designed a bilateral cost-sharing contract to coordinate the supply chain. Some scholars have applied differential game models to introduce government-related carbon policies into supply chain coordination. Wang et al. [40] established differential game models that consider cap-and-trade regulations and consumers’ low-carbon preferences to study the carbon emission reduction decisions of supply chain members under non-cooperation, coop program, and two-way coop contract scenarios. Zhu et al. [41] studied joint emission reduction under mixed carbon policies and CEA by establishing differential game models, and they designed a unilateral cost-sharing contract (UCSC) and a bilateral cost-sharing contract (BCSC) to coordinate the supply chain. Li et al. [42] considered vehicle carbon emission regulations (VCER) and the dual credit policy (DCP) and constructed a differential game model for operational coordination of the fuel vehicle supply chain. Furthermore, with the development of digital technology, Kang et al. [43] explored blockchain technology investment and green production investment strategies in the digital supply chain, and designed unilateral participation and improved bilateral participation to coordinate digital supply chains.

2.3. Supply Chain Management Driven by AI

The convergence of climate crises, political conflicts, and regulatory shifts, such as the European Green Deal, underscores the vulnerabilities inherent in unsustainable supply chains, rendering the development of resilient and green supply chains particularly imperative [44,45]. Furthermore, digital technologies play a facilitative role in promoting low-carbon development, enhancing resilience, and improving supply chain performance [46]. Li et al. [47] have demonstrated that generative artificial intelligence has a positive and significant impact on supply chain performance.
With the continuous development of AI and big data technologies, the application of AI in construction machinery can improve construction safety and efficiency [48]. Data-driven AI technology has been widely used in intelligent construction machinery [49], such as predictive maintenance of construction machinery [50] and real-time detection of on-site construction [51]. Wang et al. [52] revealed that manufacturers can use AI technology to perform predictive maintenance, intelligent diagnostics, customer support services, and other tasks in the after-sales service. AI-enabled supply chain operation management not only plays a positive role in maintenance, but also plays an important role in emission reduction, financing, and customer service. Hussain et al. [53] introduced AI to enhance emission reduction efficiency in the supply chain. AI also has a significant impact on financing preferences [54] and customer service strategies [55] in the e-commerce supply chain. These studies primarily used single-period game models to examine the facilitating effects of AI in various aspects of supply chain management. Mardyana [56] further explored this topic from a multi-period dynamic perspective, establishing differential game models to study optimal investment strategies in sustainable development, customer experience improvement, and AI technology implementation. Our study focuses on AI-enabled maintenance services for electric construction machinery, aimed at enhancing maintenance service levels and demand while improving equipment reliability, supply chain resilience, and sustainability to promote low-carbon development.

2.4. Research Gap

Currently, research in the electric construction machinery emphasizes the importance of manufacturing and leasing. However, there is a lack of studies on the operations of the AI-enabled electric construction machinery leasing supply chain. Due to the complex working environment, the leasing supply chain for electric construction machinery differs from that for electric vehicles, as equipment safety is of paramount importance. Consequently, the maintenance of electric construction machinery is particularly critical, as high-quality maintenance services can enhance equipment availability, supply chain resilience, and sustainability. Moreover, the existing research on the operations of construction machinery leasing supply chains focuses on single-period decision-making. Our research fills the gap in research on dynamic coordination in the AI-enabled electric construction machinery leasing supply chain. Focusing on the supply chain composed of a manufacturer and a lessor, we consider the manufacturer’s investments in R&D and AI-enabled O&M, and the lessor’s investments in advertising and AI-enabled maintenance. Under symmetric information and fixed marginal profits, we treat AI-enabled maintenance service level and electric goodwill as state variables, and develop centralized and decentralized differential game models. We further design unilateral and bilateral cost-sharing contracts to enhance leasing demand and supply chain profitability. By integrating AI, electric drive technology, and contract design into leasing operations, our study advances the construction machinery industry toward intelligence, electrification, sustainability, safety, and profitability.

3. Model Assumption and Description

With frequent abnormal weather caused by increasing carbon emissions, more consumers are turning to environmentally friendly products. The implementation of national low-carbon policies and growing consumer awareness of environmental protection have driven construction machinery manufacturers to develop electrical products. For example, major manufacturers such as Caterpillar, Volvo, Zoomlion, XCMG, and Sany Heavy Industry have been producing electric construction machinery. These manufacturers supply equipment to leasing companies, which in turn lease the machinery to construction firms. The leasing model for electric construction machinery offers a low-carbon approach that reduces capital investment for builders and enhances equipment utilization and maintenance services. We have established a two-tier electric construction machinery leasing supply chain comprising one manufacturer and one leasing company. The upstream manufacturer produces electric construction machinery, invests in R&D of electrical products, and provides AI-enabled O&M services, such as XCMG’s post-sales maintenance services via the Xrea platform, thereby enhancing equipment reliability. To increase leasing demand for electric construction machinery, the lessor not only offers advertising services but also provides AI-enabled maintenance services. For example, United Rentals uses the Spot-r IoT platform to gather real-time data on equipment vibration, temperature, and load, and employs AI algorithms to predict faults 14~21 days in advance, reducing unplanned downtime 80% and enhancing the user experience for the construction party, which in turn strengthens the resilience of the supply chain.
Generally, the manufacturer and the lessor tend to prioritize their own profits. However, the double marginalization problem leads to suboptimal profits for both parties. Through contractual cooperation, this issue can be resolved, leading to a win–win outcome. For example, in 2024, Zhejiang Huatie Emergency Equipment Science & Technology Co., Ltd. (Huatie Emergency), a lessor, signed a cooperation contract with XCMG Fire Safety Equipment Co., Ltd. (XCMG Fire Safety), a manufacturer. On the one hand, the two parties engaged in comprehensive cooperation in capital, market development, intelligence, and product lines, aiming to expand leasing and service for aerial work platforms and other construction machinery, thereby achieving resource complementarity, product quality improvement, and service upgrading. On the other hand, Zhejiang Huatie promised to purchase no less than 7 billion RMB worth of aerial work platforms from XCMG Fire Safety between 2024 and 2026. In return, XCMG Fire Safety will ensure product supply and optimize procurement costs, improve the competitiveness of both parties, and thereby promote their joint sustainable development.
To better reflect the dynamic characteristics of the AI-enabled maintenance service level and the goodwill of electrical products, our study introduces an AI-enabled maintenance service level [39] and electric goodwill [57], and it considers both as state variables simultaneously. The main notations used in our paper and their descriptions are shown in Table 1. Additionally, we make the following assumptions.
Assumption 1. 
The manufacturer needs to invest in improving R&D to develop electric construction machinery favored by consumers, such as high-endurance power battery systems and integrated electric drive systems. This idea aligns with the approach in references [26,58], where the marginal cost of R&D increases as R&D investment intensifies. Currently, most manufacturers are making efforts to apply AI technologies to assist in O&M, such as intelligent maintenance, remote health diagnostics, and condition-based maintenance. Similarly to reference [18], the marginal cost of AI-enabled O&M increases as such effort intensifies. Therefore, we assume that the costs of the manufacturer’s R&D technology investment and AI-enabled O&M are quadratic functions of the R&D technology investment and AI-enabled O&M effort, respectively, that are:
C n = η n 2 M n ( t ) 2
C d = η d 2 M d ( t ) 2
Assumption 2. 
The Lessor employs AI-enabled assistants for routine inspections and maintenance. The marginal cost of AI-enabled maintenance increases with the AI-enabled maintenance effort invested [18]. Additionally, to stimulate leasing demand for electric equipment, the lessor invests in advertising efforts, where the marginal cost of advertising also increases with the intensity of such efforts [58,59,60,61]. Therefore, we assume that the costs of the lessor’s advertising and AI-enabled maintenance are quadratic functions of the advertising effort and AI-enabled maintenance effort, respectively, that are:
C p = ξ p 2 L p ( t ) 2
C k = ξ k 2 L k ( t ) 2
Assumption 3. 
In this study, we consider the AI-enabled maintenance service level of electric construction machinery as a state variable, and its first-order derivative indicates its dynamic change over time t [39,43]. The state variable S(t) is positively related to the manufacturer’s AI-enabled O&M effort and the lessor’s AI-enabled maintenance effort. Over time, the AI-enabled maintenance service level naturally declines due to equipment aging and the obsolescence of AI-enabled maintenance techniques. Therefore, the differential equation describing the AI-enabled maintenance service effort level can be expressed as follows:
S ˙ ( t ) = α M d ( t ) + β L k ( t ) γ S ( t )
where the initial AI-enabled maintenance service effort level is S(0) = S0 ≥ 0.
Assumption 4. 
With growing consumer awareness of low-carbon products, consumers are increasingly favoring green, environmentally friendly options. Since electric construction machinery products have a strong energy-saving and emission-reducing effect during use, more and more consumers are buying them, thereby forming the electric goodwill G(t). Similarly to Zhu et al. [41] and Ma et al. [57], the state variable G(t) is positively correlated with the manufacturer’s R&D technology investment and the lessor’s advertising effort. Moreover, over time, there is a natural decay rate in electric goodwill due to equipment aging, obsolescence of electric R&D technology, and weakening advertising effects. Therefore, the dynamic change process of electric goodwill can be obtained as follows:
G ˙ ( t ) = λ M n ( t ) + μ L p ( t ) ε G ( t )
where the initial electric goodwill is G(0) = G0 ≥ 0.
Assumption 5. 
When using construction machinery, consumers are concerned about the reliability of the equipment, so they consider the AI-enabled maintenance service level to be very important. Therefore, the manufacturer and lessor improve maintenance service levels, which can influence consumer purchasing behavior [34]. Meanwhile, as low-carbon policies are implemented, consumers’ awareness of low-carbon issues is increasing. Moreover, electric construction machinery can not only be environmentally friendly during use but also reduce fuel costs, so the improved perception of electric equipment can translate into actual purchasing behavior, positively affecting market demand [43]. Therefore, the leasing demand can be expressed as:
D ( t ) = D 0 + θ S ( t ) + ω G ( t )
where the leasing demand is D(0) = D0 ≥ 0.
Assumption 6. 
To focus on AI-enabled maintenance services, electric R&D technology and other decisions in the electric construction machinery leasing supply chain in the context of digital transformation and low carbon, this paper does not consider factors such as product price and wholesale price, and assumes that the marginal profit of the manufacturer and the lessor (both constants) are denoted by ΠM and ΠL, respectively [40]. Furthermore, in the infinite time range, information in the leasing supply chain is symmetric, and both the manufacturer and the lessor have the same discount factor ρ(ρ > 0) [61].
In summary, the long-term profit functions of the manufacturer, the lessor, and the supply chain can be obtained as:
P M = 0 e ρ t Π M D ( t ) η d 2 M d ( t )   2 η n 2 M n ( t ) 2 d t
P L = 0 e ρ t Π L D ( t ) ξ k 2 L k ( t )   2 ξ p 2 L p ( t ) 2 d t
P T = 0 e ρ t Π M + Π L D ( t ) η d 2 M d ( t ) 2 η n 2 M n ( t ) 2 ξ k 2 L k ( t )   2 ξ p 2 L p ( t ) 2 d t

4. Differential Game Analysis in Different Cases

Since AI-enabled O&M efforts, R&D technology investment, AI-enabled maintenance efforts, and advertising efforts for electrical products all exhibit multi-cycle dynamics, we develop four cases based on differential games under these assumptions. First, we examine the centralized decision-making case, which represents an idealized scenario. In practice, however, the manufacturer and the lessor typically aim to maximize their respective profits. Next, we analyze the case of decentralized decision-making. Given the double marginalization between the manufacturer and the lessor, we aim to design both unilateral and bilateral cost-sharing contracts to coordinate the supply chain, thereby enhancing the AI-enabled maintenance service level, electric goodwill, and profits within the construction machinery leasing supply chain system. Consequently, we also investigate both unilateral and bilateral cost-sharing decision-making cases.

4.1. Centralized Decision-Making Case (Case C)

In Case C, the manufacturer and the lessor work together as an integrated system to maximize their total profit, and thus the objective function can be expressed as:
max M d , M n , L k , L p P T C = 0 e ρ t Π M + Π L D 0 + θ S + ω G η d 2 M d 2 η n 2 M n 2 ξ k 2 L k 2 ξ p 2 L p 2 d t
Proposition 1. 
In Case C, the optimal equilibrium results are:
(1)
In Case C, the optimal equilibrium strategies of the manufacturer and the lessor are:
M d C * = α θ Π M + Π L η d ρ + γ M n C * = λ ω Π M + Π L η n ρ + ε L k C * = β θ Π M + Π L ξ k ρ + γ L p C * = μ ω Π M + Π L ξ p ρ + ε
(2)
In Case C, the optimal trajectories of the AI-enabled maintenance service level and electric goodwill can be obtained as:
S C * = S C + S 0 S C e γ t G C * = G C + G 0 G C e ε t
where S C = α 2 θ Π M + Π L γ η d ρ + γ + β 2 θ Π M + Π L γ ξ k ρ + γ G C = λ 2 ω Π M + Π L ε η n ρ + ε + μ 2 ω Π M + Π L ε ξ p ρ + ε
S C and G C are the steady states of the AI-enabled maintenance service level and electric goodwill, respectively, as time t tends to positive infinity.
(3)
In Case C, the optimal profit of the supply chain is:
V T C * = t 1 C * S C * + t 2 C * G C * + t 3 C *
where t 1 C * = Π M + Π L θ ρ + γ t 2 C * = Π M + Π L ω ρ + ε t 3 C * = Π M + Π L D 0 ρ + α 2 θ 2 Π M + Π L 2 2 ρ η d ρ + γ 2 + μ 2 ω 2 Π M + Π L 2 2 ρ ξ p ρ + ε 2 + λ 2 ω 2 Π M + Π L 2 2 ρ η n ρ + ε 2 + β 2 θ 2 Π M + Π L 2 2 ρ ξ k ρ + γ 2
The proof is presented in Appendix A.
Case C is an idealized case in which the manufacturer and lessor are treated as a single entity. Through unified resource allocation, this case maximizes overall profit. However, a highly centralized decision-making structure sacrifices the flexibility to respond to localized emergencies—such as a sudden market contraction in a specific region or an accident at a construction site. In this context, supply chain resilience is characterized by weak resistance to disruptions, rendering the system vulnerable to single points of failure that can lead to systemic collapse.

4.2. Decentralized Decision-Making Case (Case D)

In Case D, the manufacturer and the lessor aim to maximize their respective profits through their decisions. The decision-making sequence is as follows: the manufacturer first chooses the AI-enabled O&M effort and R&D technology investments, then the lessor decides on the AI-enabled maintenance effort and advertising effort. The objective functions of both the manufacturer and the lessor are expressed as follows:
max M d , M n P M D = 0 e ρ t Π M D 0 + θ S + ω G η d 2 M d 2 η n 2 M n 2 d t
max L k , L p P L D = 0 e ρ t Π L ( D 0 + θ S + ω G ) ξ k 2 L k 2 ξ p 2 L p 2 d t
Proposition 2. 
In Case D, the optimal equilibrium results are:
(1)
In Case D, the optimal equilibrium strategies of the manufacturer and the lessor are:
M d D * = α θ Π M η d ρ + γ M n D * = λ ω Π M η n ρ + ε L k D * = β θ Π L ξ k ρ + γ L p D * = μ ω Π L ξ p ρ + ε
(2)
In Case D, the optimal trajectories of the AI-enabled maintenance service level and electric goodwill can be obtained as:
S D * = S D + S 0 S D e γ t G D * = G D + G 0 G D e ε t
where S D = α 2 θ Π M γ η d ρ + γ + β 2 θ Π L γ ξ k ρ + γ G D = λ 2 ω Π M ε η n ρ + ε + μ 2 ω Π L ε ξ p ρ + ε
S D and G D are the steady states of the AI-enabled maintenance service level and electric goodwill, respectively, as time t tends to positive infinity.
(3)
In Case D, the optimal profits of the manufacturer, the lessor, and the supply chain are:
V M D * = m 1 D * S D * + m 2 D * G D * + m 3 D *
V L D * = r 1 D * S D * + r 2 D * G D * + r 3 D *
V T D * = m 1 D * + r 1 D * S D * + m 2 D * + r 2 D * G D * + m 3 D * + r 3 D *
where m 1 D * = Π M θ ρ + γ m 2 D * = Π M ω ρ + ε m 3 D * = Π M D 0 ρ + α 2 θ 2 Π M 2 2 ρ η d ρ + γ 2 + λ 2 ω 2 Π M 2 2 ρ η n ρ + ε 2 + β 2 Π M Π L θ 2 ρ ξ k ρ + γ 2 + μ 2 Π M Π L ω 2 ρ ξ p ρ + ε 2 r 1 D * = Π L θ ρ + γ r 2 D * = Π L ω ρ + ε r 3 D * = Π L D 0 ρ + β 2 θ 2 Π L 2 2 ρ ξ k ρ + γ 2 + μ 2 ω 2 Π L 2 2 ρ ξ p ρ + ε 2 + α 2 Π M Π L θ 2 ρ η d ρ + γ 2 + λ 2 Π M Π L ω 2 ρ η n ρ + ε 2
The proof is presented in Appendix A.
In Case D, the manufacturer and lessor only focus on their own profits, which reflects the current reality of many traditional construction machinery leasing markets. The manufacturer, concerned that high R&D and AI-enabled O&M investments may not be recovered from the lessor, tends to reduce costs, leading to poor equipment quality, diminished reliability, and weakened long-term competitiveness. The lessor, in turn, tends to free-ride, expecting the manufacturer to invest more in improving product reliability and after-sales maintenance services, while underinvesting in advertising and routine AI-enabled maintenance. This results in high equipment failure rates and low customer satisfaction. In terms of supply chain resilience, Case D is characterized by insufficient investment and blame-shifting, making the supply chain highly vulnerable when facing disruptions.

4.3. Unilateral Cost-Sharing Contract Decision-Making Case (Case U)

Case C is an idealized situation that is difficult to realize in practice. In practice, Case D is common, but the manufacturer and lessor often face double marginalization. It is necessary to design a contract to coordinate the supply chain and reduce each member’s profit losses, thereby improving the supply chain’s overall profit. Since the lessor’s AI-enabled maintenance and advertising efforts for electric construction machinery products can affect the AI-enabled maintenance service level and electric goodwill, which in turn affect leasing demand. Moreover, large manufacturers often occupy the dominant position in terms of capital and technology. Therefore, the manufacturer can increase the lessor’s motivation to maintain and publicize the construction machinery by sharing the costs of AI-enabled maintenance and advertising. In this way, Case U is introduced.
In Case U, the manufacturer and the lessor form the Stackelberg game. Assuming that the manufacturer acts as a leader and the lessor as a follower, the manufacturer shares the costs of the lessor’s maintenance at a proportion δ 1 ( 0 δ 1 1 ) and the costs of advertising at a proportion δ 2 ( 0 δ 2 1 ). The decision-making sequence is as follows: first, the manufacturer decides on the AI-enabled O&M effort, R&D technology investment, and the proportion. Then the lessor decides on an AI-enabled maintenance effort and an advertising effort. The objective functions of the manufacturer and the lessor can be expressed as follows:
max M d , M n , δ 1 , δ 2 P M U = 0 e ρ t Π M D 0 + θ S + ω G η d 2 M d 2 η n 2 M n 2 δ 1 ξ k 2 L k 2 δ 2 ξ p 2 L p 2 d t
max L k , L p P L U = 0 e ρ t Π L D 0 + θ S + ω G 1 δ 1 ξ k 2 L k 2 1 δ 2 ξ p 2 L p 2 d t
Proposition 3. 
In Case U, the optimal equilibrium results are:
(1)
In Case U, the optimal equilibrium strategies of the manufacturer and the lessor are:
M d U * = α θ Π M η d ρ + γ M n U * = λ ω Π M η n ρ + ε L k U * = β θ 2 Π M + Π L 2 ξ k ρ + γ L p U * = μ ω 2 Π M + Π L 2 ξ p ρ + ε δ 1 U * = 2 Π M Π L 2 Π M + Π L δ 2 U * = 2 Π M Π L 2 Π M + Π L
(2)
In Case U, the optimal trajectories of the AI-enabled maintenance service level and electric goodwill can be obtained as:
S U * = S U + S 0 S U e γ t G U * = G U + G 0 G U e ε t
where S U = α 2 θ Π M γ η d ρ + γ + β 2 θ 2 Π M + Π L 2 γ ξ k ρ + γ G U = λ 2 ω Π M ε η n ρ + ε + μ 2 ω 2 Π M + Π L 2 ε ξ p ρ + ε
S U and G U are the steady states of the AI-enabled maintenance service level and electric goodwill, respectively, as time t tends to positive infinity.
(3)
In Case U, the optimal profits of the manufacturer, the lessor, and the supply chain are:
V M U * = m 1 U * S U * + m 2 U * G U * + m 3 U *
V L U * = r 1 U * S U * + r 2 U * G U * + r 3 U *
V T U * = m 1 U * + r 1 U * S U * + m 2 U * + r 2 U * G U * + m 3 U * + r 3 U *
where m 1 U * = Π M θ ρ + γ m 2 U * = Π M ω ρ + ε m 3 U * = Π M D 0 ρ + α 2 θ 2 Π M 2 2 ρ η d ρ + γ 2 + β 2 2 Π M + Π L 2 θ 2 8 ρ ξ k ρ + γ 2 + λ 2 ω 2 Π M 2 2 ρ η n ρ + ε 2 + μ 2 ω 2 2 Π M + Π L 2 8 ρ ξ p ρ + ε 2 r 1 U * = Π L θ ρ + γ r 2 U * = Π L ω ρ + ε r 3 U * = Π L D 0 ρ + α 2 Π M Π L θ 2 ρ η d ρ + γ 2 + λ 2 Π M Π L ω 2 ρ η n ρ + ε 2 + β 2 θ 2 Π L 2 Π M + Π L 4 ρ ξ k ρ + γ 2 + μ 2 ω 2 Π L 2 Π M + Π L 4 ρ ξ p ρ + ε 2
The proof is presented in Appendix A.
In Case U, the manufacturer incentivizes the lessor to increase advertising and AI-enabled maintenance, which helps expand leasing demand in the market and improve daily maintenance. However, Case U fails to resolve the manufacturer’s own insufficient investment. While such a contract can enhance short-term resilience of the supply chain, it does not address the core incentives of upstream enterprises. Consequently, the supply chain system lacks resilience for long-term development and the ability to cope with product quality issues.

4.4. Bilateral Cost-Sharing Contract Decision-Making Case (Case B)

To further increase the manufacturer’s incentives to invest in AI-enabled O&M and R&D technologies and thereby boost leasing demand, this section designs a bilateral cost-sharing contract. In Case B, the manufacturer shares the lessor’s AI-enabled maintenance costs at a proportion σ 1 ( 0 σ 1 1 ) and advertising costs at a proportion σ 2 ( 0 σ 2 1 ). Meanwhile, the lessor shares the manufacturer’s AI-enabled O&M costs at a proportion τ 1 ( 0 τ 1 1 ) and the R&D technology investment costs at a proportion τ 2 ( 0 τ 2 1 ). The objective functions of the manufacturer and the lessor can be expressed as follows:
P M B = max M d , M n 0 e ρ t Π M D 0 + θ S + ω G 1 τ 1 η d 2 M d 2 1 τ 2 η n 2 M n 2 σ 1 ξ k 2 L k 2 σ 2 ξ p 2 L p 2 d t
P L B = max L k , L p 0 e ρ t Π L D 0 + θ S + ω G 1 σ 1 ξ k 2 L k 2 1 σ 2 ξ p 2 L p 2 τ 1 η d 2 M d 2 τ 2 η n 2 M n 2 d t
Proposition 4. 
In Case B, the optimal equilibrium results are:
(1)
In Case B, the optimal equilibrium strategies of the manufacturer and the lessor are:
M d B * = α θ Π M + Π L η d ρ + γ M n B * = λ ω Π M + Π L η n ρ + ε L k B * = β θ Π M + Π L ξ k ρ + γ L p B * = μ ω Π M + Π L ξ p ρ + ε τ 1 B * = Π L Π M + Π L τ 2 B * = Π L Π M + Π L σ 1 B * = Π M Π M + Π L σ 2 B * = Π M Π M + Π L
(2)
In Case B, the optimal trajectories of the AI-enabled maintenance service level and electric goodwill can be obtained as:
S B * = S B + S 0 S B e γ t G B * = G B + G 0 G B e ε t
where S B = α 2 θ Π M + Π L γ η d ρ + γ + β 2 θ Π M + Π L γ ξ k ρ + γ G B = λ 2 ω Π M + Π L ε η n ρ + ε + μ 2 ω Π M + Π L ε ξ p ρ + ε
S B and G B are the steady states of the AI-enabled maintenance service level and electric goodwill, respectively, as time t tends to positive infinity.
(3)
In Case B, the optimal profits of the manufacturer, the lessor, and the supply chain are:
V M B * = m 1 B * S B * + m 2 B * G B * + m 3 B *
V L B * = r 1 B * S B * + r 2 B * G B * + r 3 B *
V T B * = m 1 B * + r 1 B * S B * + m 2 B * + r 2 B * G B * + m 3 B * + r 3 B *
where m 1 B * = Π M θ ρ + γ m 2 B * = Π M ω ρ + ε m 3 B * = Π M D 0 ρ + α 2 θ 2 Π M Π M + Π L 2 ρ η d ρ + γ 2 + λ 2 ω 2 Π M Π M + Π L 2 ρ η n ρ + ε 2 + β 2 θ 2 Π M Π M + Π L 2 ρ ξ k ρ + γ 2 + μ 2 ω 2 Π M Π M + Π L 2 ρ ξ p ρ + ε 2 r 1 B * = Π L θ ρ + γ r 2 B * = Π L ω ρ + ε r 3 B * = Π L D 0 ρ + α 2 θ 2 Π L Π M + Π L 2 ρ η d ρ + γ 2 + λ 2 ω 2 Π L Π M + Π L 2 ρ η n ρ + ε 2 + β 2 θ 2 Π L Π M + Π L 2 ρ ξ k ρ + γ 2 + μ 2 ω 2 Π L Π M + Π L 2 ρ ξ p ρ + ε 2
The proof is presented in Appendix A.
In Case B, the interests of the manufacturer and the lessor are closely aligned, thereby eliminating the double-marginalization and achieving Pareto optimality. In this case, the supply chain demonstrates the strongest resilience and the highest overall robustness.

5. Comparative Analysis

We compare the optimal equilibrium decisions, the optimal trajectories of state variables, and the optimal profits across the four cases. Furthermore, we examine the influence of key parameters on both decision-making and state variables. Finally, we assess the increase in supply chain profits resulting from the two contracts.

5.1. Comparison of Optimal Equilibrium Strategies

Corollary 1. 
The optimal equilibrium strategies under four cases satisfy:
(1)
M d D * = M d U * < M d B * = M d C * , M n D * = M n U * < M n B * = M n C * ;
(2)
When Π M > Π L / 2 , then L k C * = L k B * > L k U * > L k D * , L p C * = L p B * > L p U * > L p D * ; when Π M Π L / 2 , then L k U * L k D * < L k B * = L k C * , L p U * L p D * < L p B * = L p C * ;
(3)
δ 1 U * = δ 2 U * , σ 1 B * = σ 2 B * , τ 1 B * = τ 2 B * = 1 σ 1 B * = 1 σ 2 B * , δ 1 U * < σ 1 B * , δ 2 U * < σ 2 B * .
The proof is presented in Appendix B.
Corollary 1 shows that the optimal decisions of the manufacturer and the lessor in Case D are always lower than those in Case C, due to the double marginalization effect. Therefore, the cost-sharing contract should be introduced to incentivize supply chain members to actively participate in AI-enabled maintenance services, R&D, and advertising investment. When a unilateral cost-sharing contract is adopted, the manufacturer maintains its optimal decisions because it shares costs with the lessor. However, when the manufacturer’s marginal cost is high enough, the lessor appropriately increases its AI-enabled maintenance and advertising efforts but does not reach Case C. When the bilateral cost-sharing contract is adopted, not only does the lessor increase its AI-enabled maintenance and advertising efforts to the optimal level but the manufacturer also increases its AI-enabled O&M effort and R&D technology investment to the level of Case C. Compared to Case U, Case B yields a higher level of AI-enabled O&M effort from the manufacturer, resulting in greater equipment reliability and enhanced supply chain resilience. In addition, Corollary 1(3) indicates that the proportion of the manufacturer’s shares of the lessor’s maintenance and advertising costs is higher in Case B than in Case U. These findings illustrate that Case B is better than Case U in enhancing the optimal decisions of the manufacturer and the lessor. In Case B, the sum of the manufacturer’s cost-sharing proportion to the lessor and the lessor’s cost-sharing proportion to the manufacturer equals 1, indicating that the two parties’ cost-sharing proportions move in opposite trends. But as long as the proportions sum up to 1, the manufacturer’s and the lessor’s optimal decisions will achieve the optimal level. For both the manufacturer and the lessor, strengthening cooperation through cost sharing can motivate them to be more active in R&D, equipment maintenance, and advertising, thereby increasing the profits of both parties. Correspondingly, the reliability of the equipment and the supply chain resilience are improved. In addition, the optimal cost-sharing rate depends primarily on the relative sizes of the manufacturer’s and the lessor’s marginal profits.
Corollary 2. 
The optimal AI-enabled maintenance service level, electric goodwill, and leasing demand of products under the four cases satisfy:
(1)
When Π M > Π L / 2 , then S C = S B > S U > S D , G C = G B > G U > G D , D C * = D B * > D U * > D D * ;
(2)
When Π M Π L / 2 , then S U S D < S B = S C , G U G D < G B = G C , D U * D D * < D B * = D C * .
The proof is presented in Appendix B.
Corollary 2 compares the leasing demand, the steady-state AI-enabled maintenance service levels, and electric goodwill across the four cases. Combining Propositions 1~4, we find that the AI-enabled maintenance service level and the electric goodwill have similar expressions in four cases. Moreover, the AI-enabled maintenance service level is mainly positively correlated with Md and Lk, and the electric goodwill is mainly positively correlated with Mn and Lp. All maintenance service levels, electric goodwill, and market demand in Case B reached levels comparable to those in Case C. However, the magnitudes of these variables in Cases U and D depend on the relative magnitudes of the manufacturer’s and the lessor’s marginal profits. When Π M > Π L / 2 , the maintenance service level, electric goodwill, and leasing demand are higher in Case U than in Case D; the unilateral cost-sharing contract is valid. Combined with Corollary 1, it can be concluded that Case B is more favorable than Case U for facilitating optimal decisions by the manufacturer and the lessor and for increasing the maintenance service level, electric goodwill, and leasing demand.

5.2. Sensitivity Analysis of the Key Parameters

Corollary 3. 
For the optimal decisions in four cases:
(1)
M d i * α > 0 , M d i * θ > 0 , M d i * Π M > 0 , M d i * η d < 0 , M d i * ρ < 0 , M d i * γ < 0 , M n i * λ > 0 , M n i * ω > 0 , M n i * Π M > 0 , M n i * η n < 0 , M n i * ρ < 0 , M n i * ε < 0 , L k i * β > 0 , L k i * θ > 0 , L k i * Π L > 0 , L k i * ξ k < 0 , L k i * ρ < 0 , L k i * γ < 0 , L p i * μ > 0 , L p i * ω > 0 , L p i * Π L > 0 , L p i * ξ p < 0 , L p i * ρ < 0 , L p i * ε < 0 , where i C , D , U , B ;
(2)
M d j * Π L > 0 , M n j * Π L > 0 , where j C , B ;
(3)
L k l * Π M > 0 , L p l * Π M > 0 , where l C , U , B .
The proof is presented in Appendix B.
Corollary 3 suggests that consumers’ AI-enabled maintenance service preference θ and the parameter α positively affect the manufacturer’s AI-enabled O&M effort, whereas the AI-enabled the manufacturer’s AI-enabled O&M effort, whereas the AI-enabled O&M effort is negatively correlated with the manufacturer’s cost factor ηd, the decay rate γ, and the discount factor ρ. Consumers’ electric preferences ω, and the parameter λ positively affect the manufacturer’s R&D technology investment, whereas the manufacturer’s R&D technology investment is negatively correlated with the manufacturer’s cost factor ηn, the decay rate ε, and the discount factor ρ. Consumers’ maintenance service preference θ, and the parameter β positively impact the lessor’s AI-enabled maintenance effort, whereas the AI-enabled maintenance effort is negatively related to the lessor’s cost factor ξk, the parameters γ and ρ. Consumers’ electric preference ω, and the parameter μ have a positive impact on the lessor’s advertising effort, whereas advertising effort is negatively correlated with the lessor’s cost factor ξp, the parameters ε and ρ. The optimal decisions of the manufacturer and the lessor are not only affected by these parameters but also by the marginal profits, and the impacts are related to the type of decision cases.
In Cases D and U, the manufacturer’s optimal decision is positively correlated with its own marginal profit. However, in Cases B and C, the optimal decision is positively correlated with both the manufacturer’s and the lessor’s marginal profits. In Case D, the lessor’s optimal decision is positively correlated with its own marginal profit. However, the optimal decision is positively correlated with both the manufacturer’s and the lessor’s marginal profits in Cases C, U, and B. These suggest that after adoption of the contract, the optimal decisions of the supply chain members are not only influenced by their own marginal profits, but also positively influenced by the cost-sharer’s marginal profit.
In practice, it is imperative to strengthen environmental protection and publicity on construction safety. Zoomlion serves as an example. At the BICES 2025 exhibition, it adopted the theme “Green, Intelligent Manufacturing, Building a Beautiful World Together” and showcased a variety of electrical products. Among them, the pure electric mixer truck has the characteristics of zero emissions, low noise, and low energy consumption. It was also equipped with an AI-based blind spot detection system, featuring intelligent collision avoidance and fatigue driving warning functions. These features highlight products’ dual advantages in environmental protection and safety. Huatie Emergency, as a lessor, provides another example. It actively promotes green and low-carbon development. Currently, over 90% of its equipment has been electrified. Furthermore, it discloses its low-carbon operation practices through ESG reports, thereby conveying the concept of sustainable development to society.
Corollary 4. 
The optimal trajectories of the AI-enabled maintenance service level and electric goodwill are monotonic, and their monotonicity depends on the relative sizes of the initial and steady state values, respectively.
The proof is presented in Appendix B.
Taking Case C as an example, it can be seen from Equation (13), when S 0 S C < 0 , the optimal trajectory of the AI-enabled maintenance service level S C * increases with time t, converging to the steady-state S C . When S 0 S C > 0 , S C * decreases with time t, converging to the steady-state S C . When S 0 S C = 0 , S C * is a constant. Moreover, when G 0 G C < 0 , the electric goodwill G C * increases with time t, converging to the steady-state G C . When G 0 G C > 0 , G C * decreases with time t, converging to the steady-state G C . When G 0 G C = 0 , G C * is a constant. In other cases, the monotonicity of AI-enabled maintenance service level and that of electric goodwill have a similar trend. Because our assumptions do not account for interactions among state variables and their stochastic fluctuations, the results exhibit monotonic properties. Although the manufacturer and the lessor can make efforts to improve technology and services, such improvements are subject to inherent bottlenecks. This implies that both parties have controllability in jointly enhancing the AI-enabled maintenance service level and the electric goodwill.
Corollary 5. 
For the AI-enabled maintenance service level and electric goodwill in four cases:
(1)
S i α > 0 , S i θ > 0 , S i β > 0 , S i Π M > 0 , S i Π L > 0 , S i γ < 0 , S i η d < 0 , S i ρ < 0 , S i ξ k < 0 , where i C , D , U , B ;
(2)
G j λ > 0 , G j ω > 0 , G j μ > 0 , G j Π M > 0 , G j Π L > 0 , G j ε < 0 , G j η n < 0 , G j ρ < 0 , G j ξ p < 0 , where j C , D , U , B .
The proof is presented in Appendix B.
Similarly to Corollary 3, Corollary 5 focuses on the correlation of AI-enabled maintenance service level and electric goodwill with other parameters. Observing Propositions 1~4, we can obtain that the variations in the AI-enabled maintenance service level and electric goodwill with other key parameters are consistent with the variations in their steady state values with other parameters. Therefore, it is sufficient for us to primarily examine the correlation between the steady-state values and the other parameters. The AI-enabled maintenance service level mainly depends on the AI-enabled O&M effort and AI-enabled maintenance effort, so its correlation is the same as that of M d i * and L k i * . The electric goodwill mainly depends on R&D technology investment and advertising effort, so its correlation is the same with M n j * and L p j * .

5.3. Selection of Contracts

Corollary 6. 
The profits of the whole supply chain in different cases satisfy: when  Π M > Π L / 2 , we have  V T C * = V T B * > V T U * > V T D * .
The proof is presented in Appendix B.
Corollary 6 indicates that the profit of the whole supply chain in Case D is lower than that in Case C. This is due to the double marginal effect in Case D. With the introduction of cost-sharing contracts, both the unilateral cost-sharing contract and the bilateral cost-sharing contract can improve the total profit. In any case, the total profit of the whole supply chain in Case B can be raised to the optimal level under Case C. However, only when Π M > Π L / 2 , the unilateral cost-sharing contract can achieve partial improvement. Although two contracts can improve total profits, the manufacturer and the lessor tend to be more concerned about whether their individual profits have improved or not. So, the specific conditions for the efficient design of contracts will be discussed in Corollary 7.
Corollary 7. 
The conditions for acceptance of the two contracts are: (1) In Case U, when  Π M > Π L / 2 , the unilateral cost-sharing contract is feasible. (2) In Case B, only when the profit redistribution mechanism is used, and the distribution proportion satisfies  χ V M D * / V T B * , 1 V T D * / V T B * , the bilateral cost-sharing contract is feasible.
The proof is presented in Appendix B.
Corollary 7 provides the conditions acceptable to the manufacturer and the lessor for both unilateral and bilateral cost-sharing contracts. In Case U, since the manufacturer unilaterally shares the lessor’s costs, the manufacturer needs to weigh whether the cost sharing yields more revenue. Therefore, when the manufacturer’s marginal profit is high enough, sharing the lessor’s costs will not affect its ultimate profitability. On the contrary, when the manufacturer’s profit is low enough, a unilateral cost-sharing contract will harm its profit, and the contract will not be accepted. Although the unilateral cost-sharing contract can achieve Pareto improvement in the supply chain, it may induce the lessor to free-ride on the manufacturer’s AI-enabled maintenance effort and R&D technology investment, leading to suboptimal overall input and profit. In contrast, a bilateral cost-sharing contract can mitigate the lessor’s free-riding behavior and simultaneously incentivize both the manufacturer and the lessor to make optimal efforts, thereby further increasing the supply chain’s profit. However, it is difficult to obtain an analytical solution to the specific conditions under which the profits of both parties are improved. Therefore, to ensure the feasibility of Case B and simplify the feasible conditions, we design a profit redistribution mechanism. When χ V M D * / V T B * , 1 V T D * / V T B * , the supply chain achieves perfect coordination with the bilateral cost-sharing contract in Case B. In practice, the specific value of the distribution proportion can be determined based on the bargaining power of the manufacturer and the lessor. The two contracts are effective under certain conditions and provide theoretical support for improving the AI-enabled maintenance service level and reputation of electric equipment, and increasing the long-term profits of the manufacturer and the lessor.
Based on Corollaries 1, 2, and 7, practical application cases are introduced for analysis. Case C represents an ideal case, which is difficult to achieve in practice and serves only as a benchmark for cooperation between the manufacturer and lessor. In contrast, Case D is the most prevalent in reality, where the manufacturer and lessor operate without any collaboration. The cooperation between Zoomlion and Fuyang Zhongkang Construction and Installation Engineering Co., Ltd. (Fuyang Zhongkang) provides a practical example of Case U. As a large manufacturer, Zoomlion supplies products to Fuyang Zhongkang at discounted prices. It also helps Fuyang Zhongkang realize an intelligent and shared operational model. This support covers multiple aspects, including products, services, marketing, and brand. And it enhances the operational efficiency of Fuyang Zhongkang (by sharing part of the costs with Zoomlion), reduces the costs of advertising and daily AI-enabled maintenance, expands market demand, and increases the profit of the leasing supply chain. However, Case U fails to address the manufacturer’s insufficient incentive to invest in improving product quality and reliability. As a result, the system lacks long-term resilience.
The cooperation between Huatie Emergency and XCMG Fire Safety can serve as a practical example of Case B. Huatie Emergency ensures product supply and optimizes procurement costs. This reduces the equipment acquisition costs for the lessor and alleviates capital occupancy pressures. As a result, the lessor can allocate more funds to market expansion and AI-enabled maintenance. Huatie Emergency has also established an AI co-modeling alliance with XCMG Fire Safety, jointly contributing model examples, technical support, and AI platforms. By sharing its extensive equipment operation data and leasing scenarios, Huatie Emergency lowers the costs of data collection and validation of equipment operation scenarios for XCMG Fire Safety. These costs are associated with the development of electric equipment and AI-enabled maintenance. In return, XCMG Fire Safety provides professional maintenance technologies and data from the manufacturing side, achieving bidirectional cost and knowledge sharing. Case B represents an optimal strategy for achieving long-term mutual benefits and enhancing the resilience of the leasing supply chain.

6. Numerical Analysis

In this section, we explore the long-term trends in AI-enabled maintenance service level and electric goodwill. We also investigate the effects of key parameters on AI-enabled maintenance service level, electric goodwill, leasing demand, and profits. Moreover, the coordination effects of the two contracts are analyzed, as are variations in the sharing proportion with marginal profits. According to the specific research context of this paper, the parameter values are set as follows: ΠM = 15, ΠL = 10, ηd = 8, ηn = 5, ξk = 7, ξp = 4, α = 0.4, β = 0.5, γ = 0.1, λ = 0.5, μ = 0.6, ε = 0.2, θ = 2, ω = 3, D0 = 15, t = 2, S0 = 5, G0 = 10.

6.1. The Optimal Trajectories of State Variables

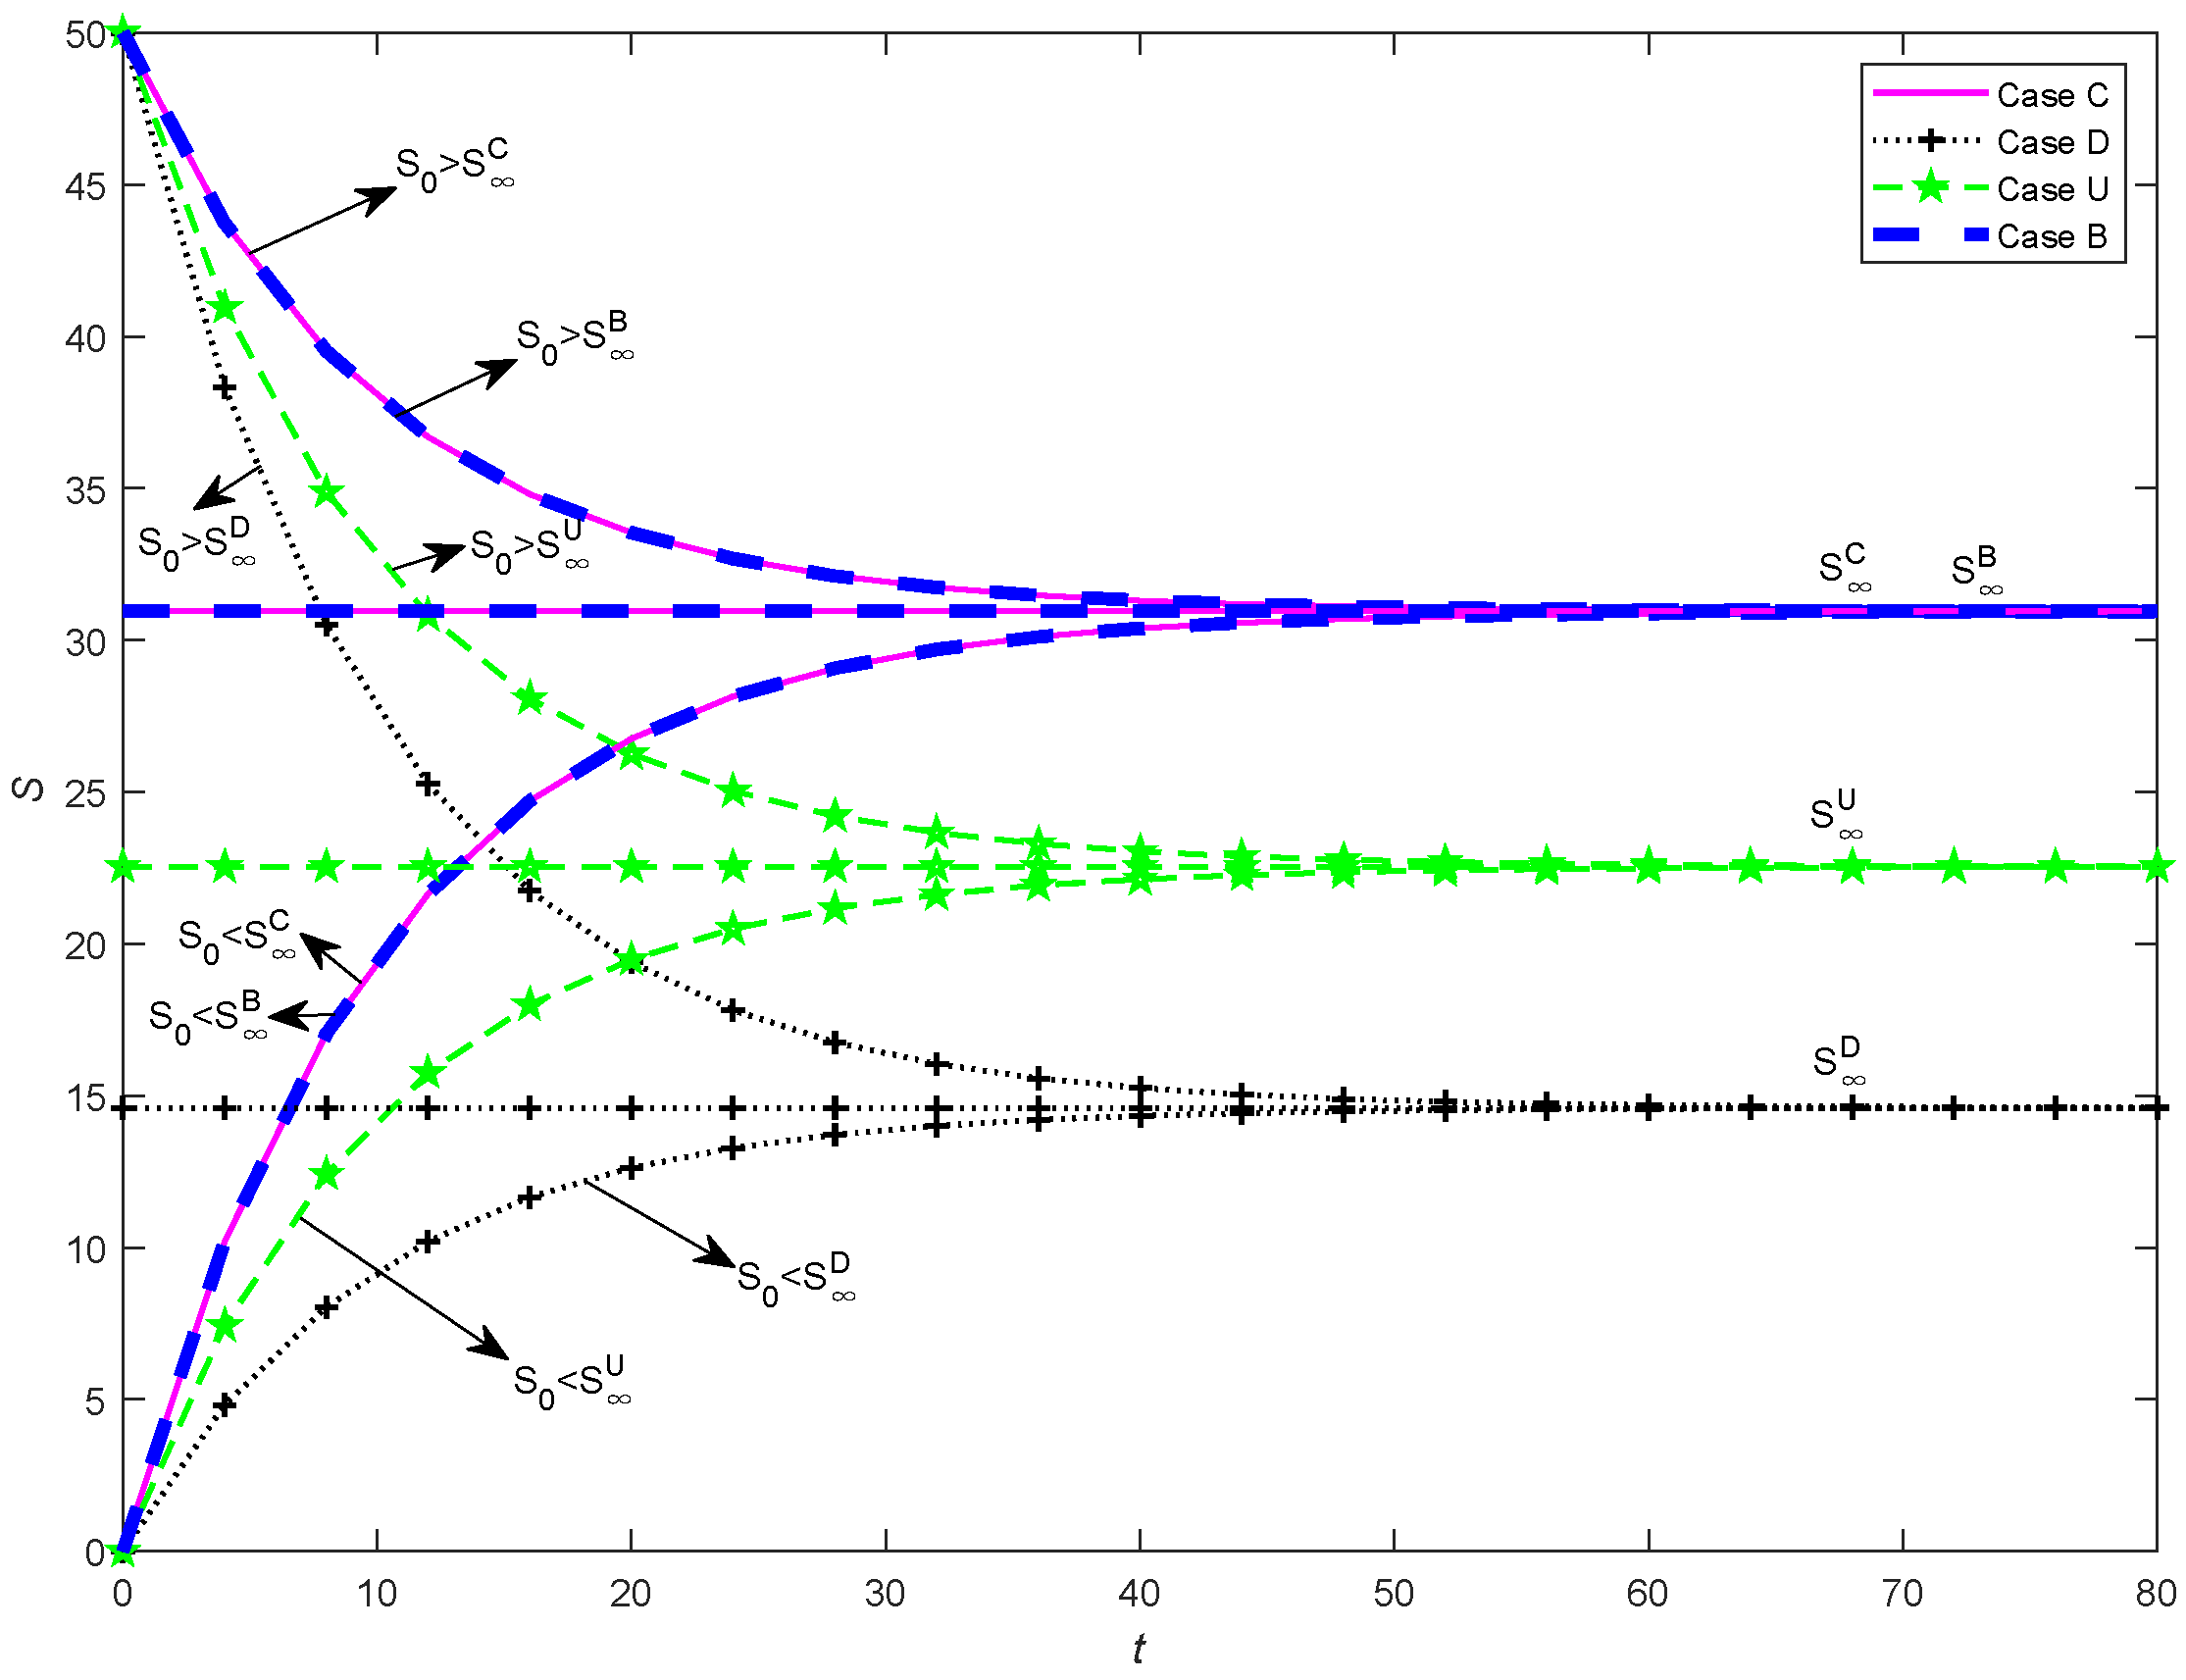
Figure 1 shows the time-evolution trajectories of the AI-enabled maintenance service level for the four cases above. We set the initial AI-enabled maintenance service level S 0 = 0 < S i , S 0 = 50 > S i and S 0 = S i , respectively, where i C , D , U , B . Moreover, the operating time of the electric construction machinery leasing supply chain is set as t ∈ [0, 80].
From Figure 1, we see that the initial value of the AI-enabled maintenance service level does not affect the final steady state, and that a steady state exists in four cases. Moreover, the optimal trajectory of the AI-enabled maintenance service level S i * is monotonic, which coincides with Corollary 4. When S 0 < S i , the optimal trajectory S i * increases with time t, and converges to the steady-state S i . When S 0 > S i , S i * decreases with time t, and converges to the steady-state S i . When S 0 = S i , S i * is a constant. The size relationship between the stable states in the four cases is consistent with the conclusion obtained in Corollary 2, and a robust size relationship is obtained as S C = S B > S U > S D . On the contrary, when Π M < Π L / 2 , the size relationship between the AI-enabled maintenance service level in Case U and Case D changes in the opposite direction. Therefore, when Π M > Π L / 2 , the long-term maintenance service strategy for the electric construction machinery leasing supply chain is feasible. Moreover, both the unilateral cost-sharing contract and the bilateral cost-sharing contract have a positive impact on improving the AI-enabled maintenance service level. But the bilateral cost-sharing contract is more effective than the unilateral cost-sharing contract in improving the AI-enabled maintenance service level.
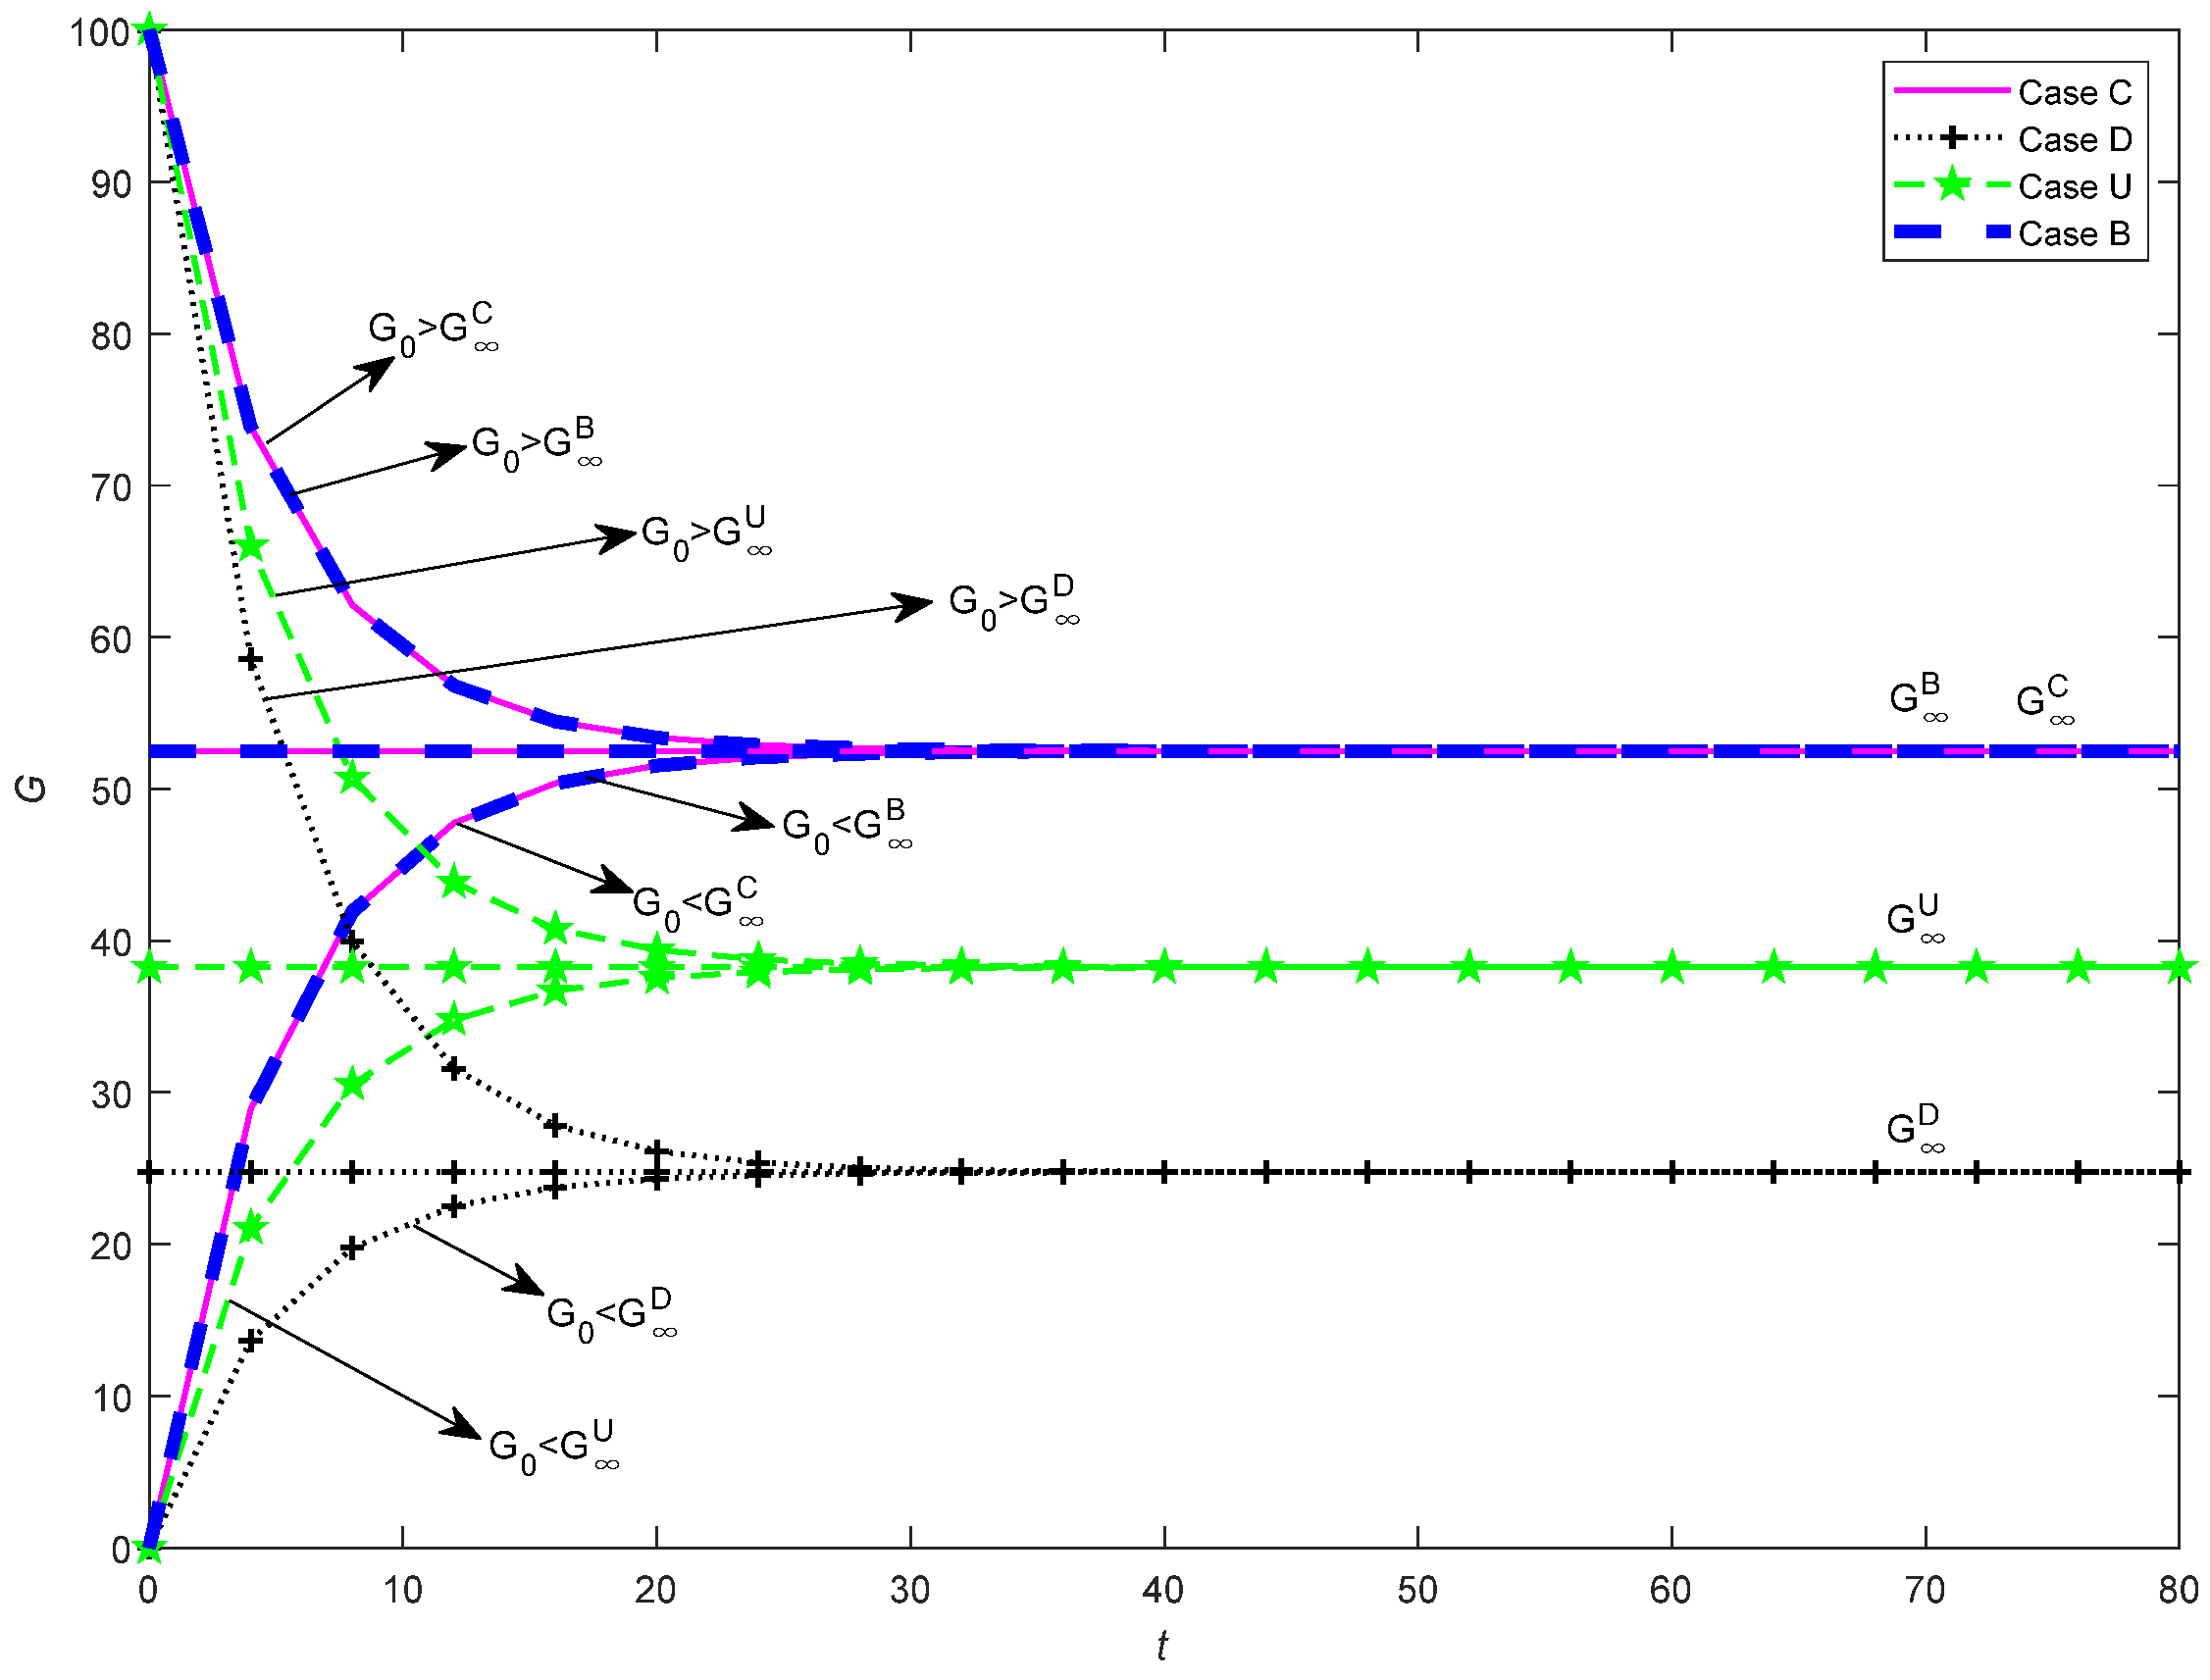
The time trajectories of electric goodwill under four decision cases are given in Figure 2. Similarly to Figure 1, we set the initial electric goodwill G 0 = 0 < G i , G 0 = 100 > G i and G 0 = G i , respectively, where i C , D , U , B . Moreover, the operating time of the electric construction machinery leasing supply chain is still set as t ∈ [0, 80].
Figure 2 illustrates that the optimal trajectories of electric goodwill are monotonic and converge to the same steady-state values in four cases, regardless of their initial conditions, as shown in Corollary 4. When G 0 < G i , the optimal trajectory G i * increases with time t, and converges to the steady-state G i . When G 0 > G i , G i * decreases with time t, and converges to the steady-state G i . When G 0 = G i , G i * is a constant. In addition, when Π M > Π L / 2 and the initial electric goodwill is the same, the trajectories in the four decision cases always satisfy G C * = G B * > G U * > G D * . On the contrary, when Π M < Π L / 2 , the size relationship between electric goodwill in Case U and Case D changes in the opposite direction. Therefore, when Π M > Π L / 2 , the long-term electric goodwill enhancement strategy is feasible. Moreover, both the unilateral cost-sharing contract and the bilateral cost-sharing contract have an enhancing effect on improving the electric goodwill. But the bilateral cost-sharing contract is more effective than the unilateral cost-sharing contract in improving electric goodwill.
Combining Figure 1 and Figure 2, we take the cooperation between Huatie Emergency and XCMG Fire Safety as an example. They jointly established an AI vertical model. Huatie Emergency supplies massive, real leasing operation data, and customer demand information. XCMG Fire Safety provides equipment manufacturing data, operational parameters, and technologies. This collaboration bridges data silos between production and usage ends. Consequently, product iteration, maintenance requirements, and market demand become effectively aligned. This alignment improves the AI-driven maintenance service level. Furthermore, both parties are committed to advancing the green, intelligent, and global development of the construction machinery industry. XCMG Fire Safety has launched an “oil to electricity” conversion program, while Huatie Emergency maintains a high proportion of electric equipment in its fleet. These efforts jointly aim to enhance consumer perception and acceptance of electric machinery.

6.2. The Effect of Key Parameters on S and G

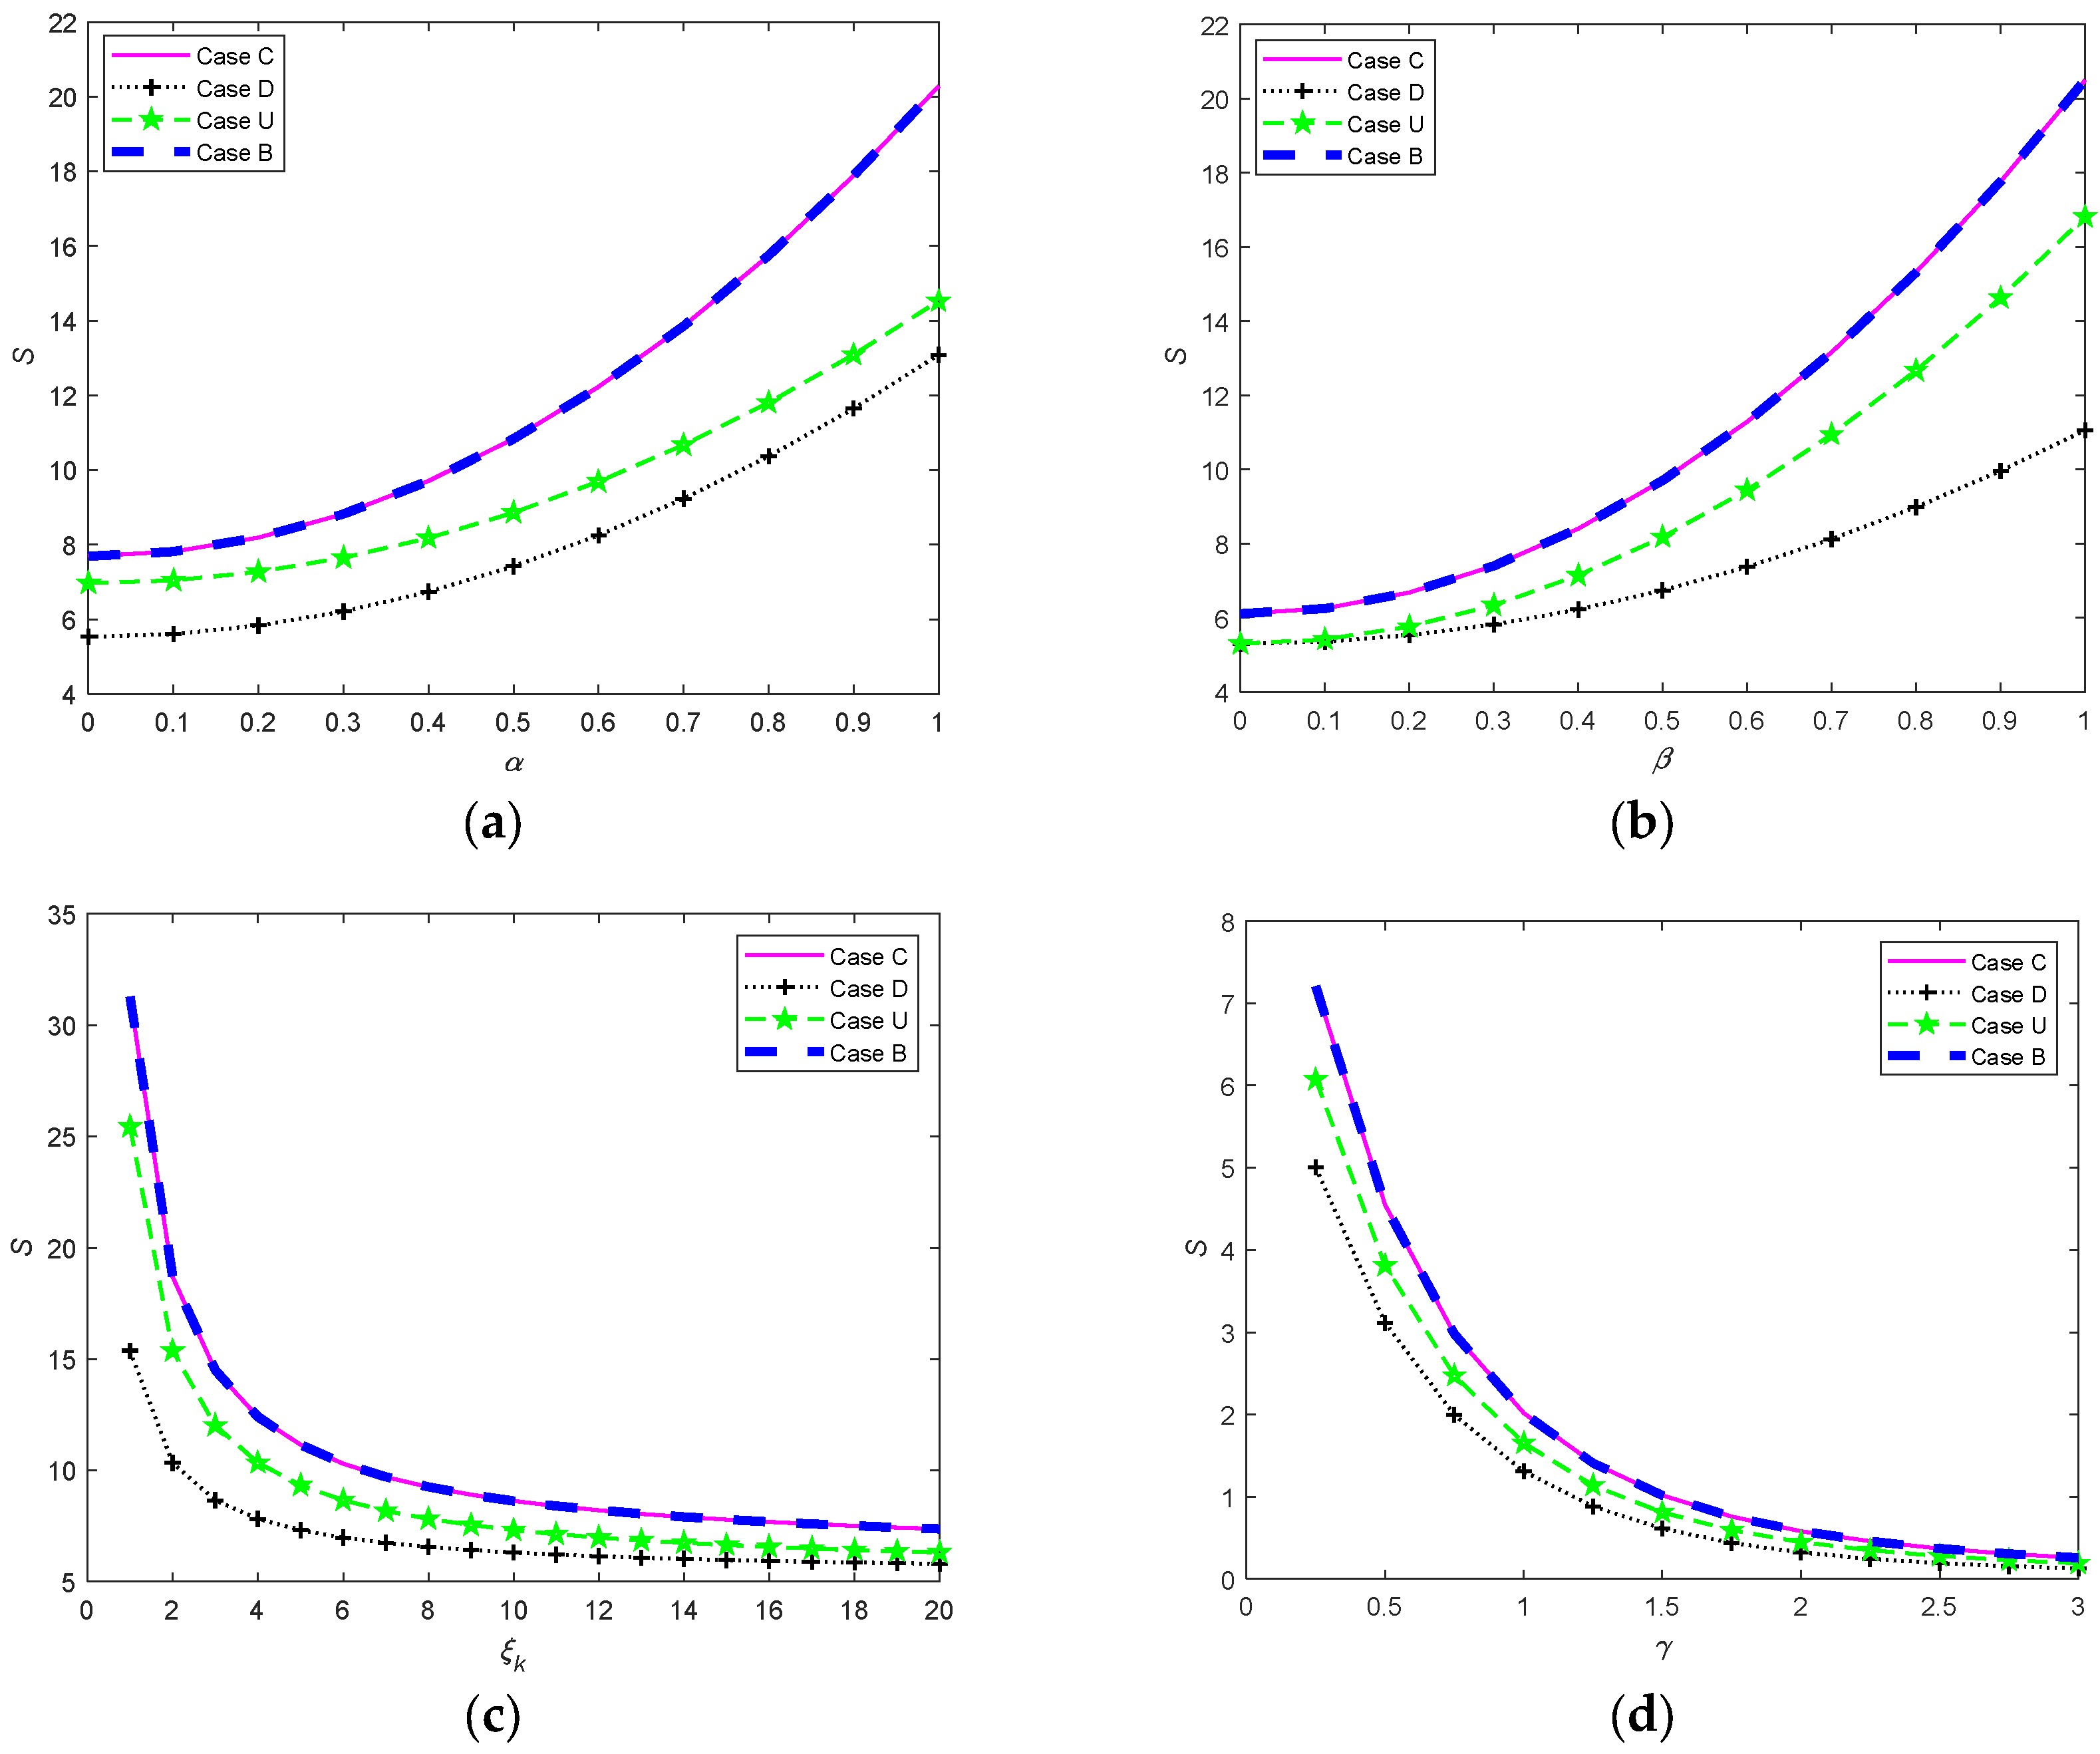
Figure 3 examines the impacts of some parameters on the AI-enabled maintenance service level. As shown in Figure 3a, we can obtain that the AI-enabled maintenance service level increases with increases in the parameter α, and the rate of increase is becoming faster and faster, which suggests that when the AI-enabled O&M effort are more easily converted into the AI-enabled maintenance service level, the better the effect of the leasing supply chain in improving the long-term AI-enabled maintenance service level. Figure 3b shows that the AI-enabled maintenance service level increases with increasing parameter β, indicating that when the AI-enabled maintenance effort is more easily converted into the AI-enabled maintenance service level, there are greater benefits in improving the long-term AI-enabled maintenance service level of the leasing supply chain. Therefore, construction machinery manufacturers such as Sany Heavy Industry, XCMG, and Zoomlion, as well as lessors including Huatie Emergency and United Rentals, are actively investing in AI technologies to enhance maintenance services and reduce equipment failure rates. Initially, in Cases U and D, the AI-enabled maintenance service level is equal; however, as β increases, the improvement in Case U is greater than in Case D. In Case B, the improvement of the long-term AI-enabled maintenance service level in the leasing supply chain is more pronounced.
Figure 3c shows that the AI-enabled maintenance service level decreases with increasing AI-enabled maintenance cost coefficient in four cases, and the manufacturer’s AI-enabled O&M cost coefficient has a similar effect on the AI-enabled maintenance service level. This suggests that the more difficulties the manufacturer faces in investing in AI-enabled maintenance services, and the less the lessor invests in them, the more difficult it is to improve the AI-enabled maintenance service level. Furthermore, investment in maintenance services can be stimulated by reducing the costs of the manufacturer and the lessor, thereby improving the AI-enabled maintenance service level. Consequently, the reliability of the construction machinery is enhanced during the operational phase. Therefore, with the development of AI technology, the cost of technology may decrease, thereby enhancing the resilience and sustainability of the supply chain. From Figure 3d, we know that as the aging of AI-enabled maintenance service-related equipment and the obsolescence of AI technology accelerate (i.e., larger γ), the AI-enabled maintenance service level declines, indicating that the leasing supply chain is less effective for long-term AI-enabled maintenance services.
The traditional approach to equipment maintenance relies heavily on human experience and reaction speed. However, when faced with a wide distribution of equipment units, this approach becomes inadequate. The introduction of AI technology has significantly alleviated these challenges. For instance, XCMG’s HanCloud platform has reduced equipment failure rates by 40%. Zoomlion’s AI expert diagnostic system saves 4200 h of troubleshooting time annually. Huatie Emergency’s Huangfeng Ge AI system has improved the efficiency of its after-sales service by over 30%. Nevertheless, the level of AI technology and the quality of data play decisive roles in determining maintenance performance. In practice, enhanced collaboration between the manufacturer and lessor is crucial—not only to improve the effectiveness of AI-enabled solutions but also to enhance data integrity.
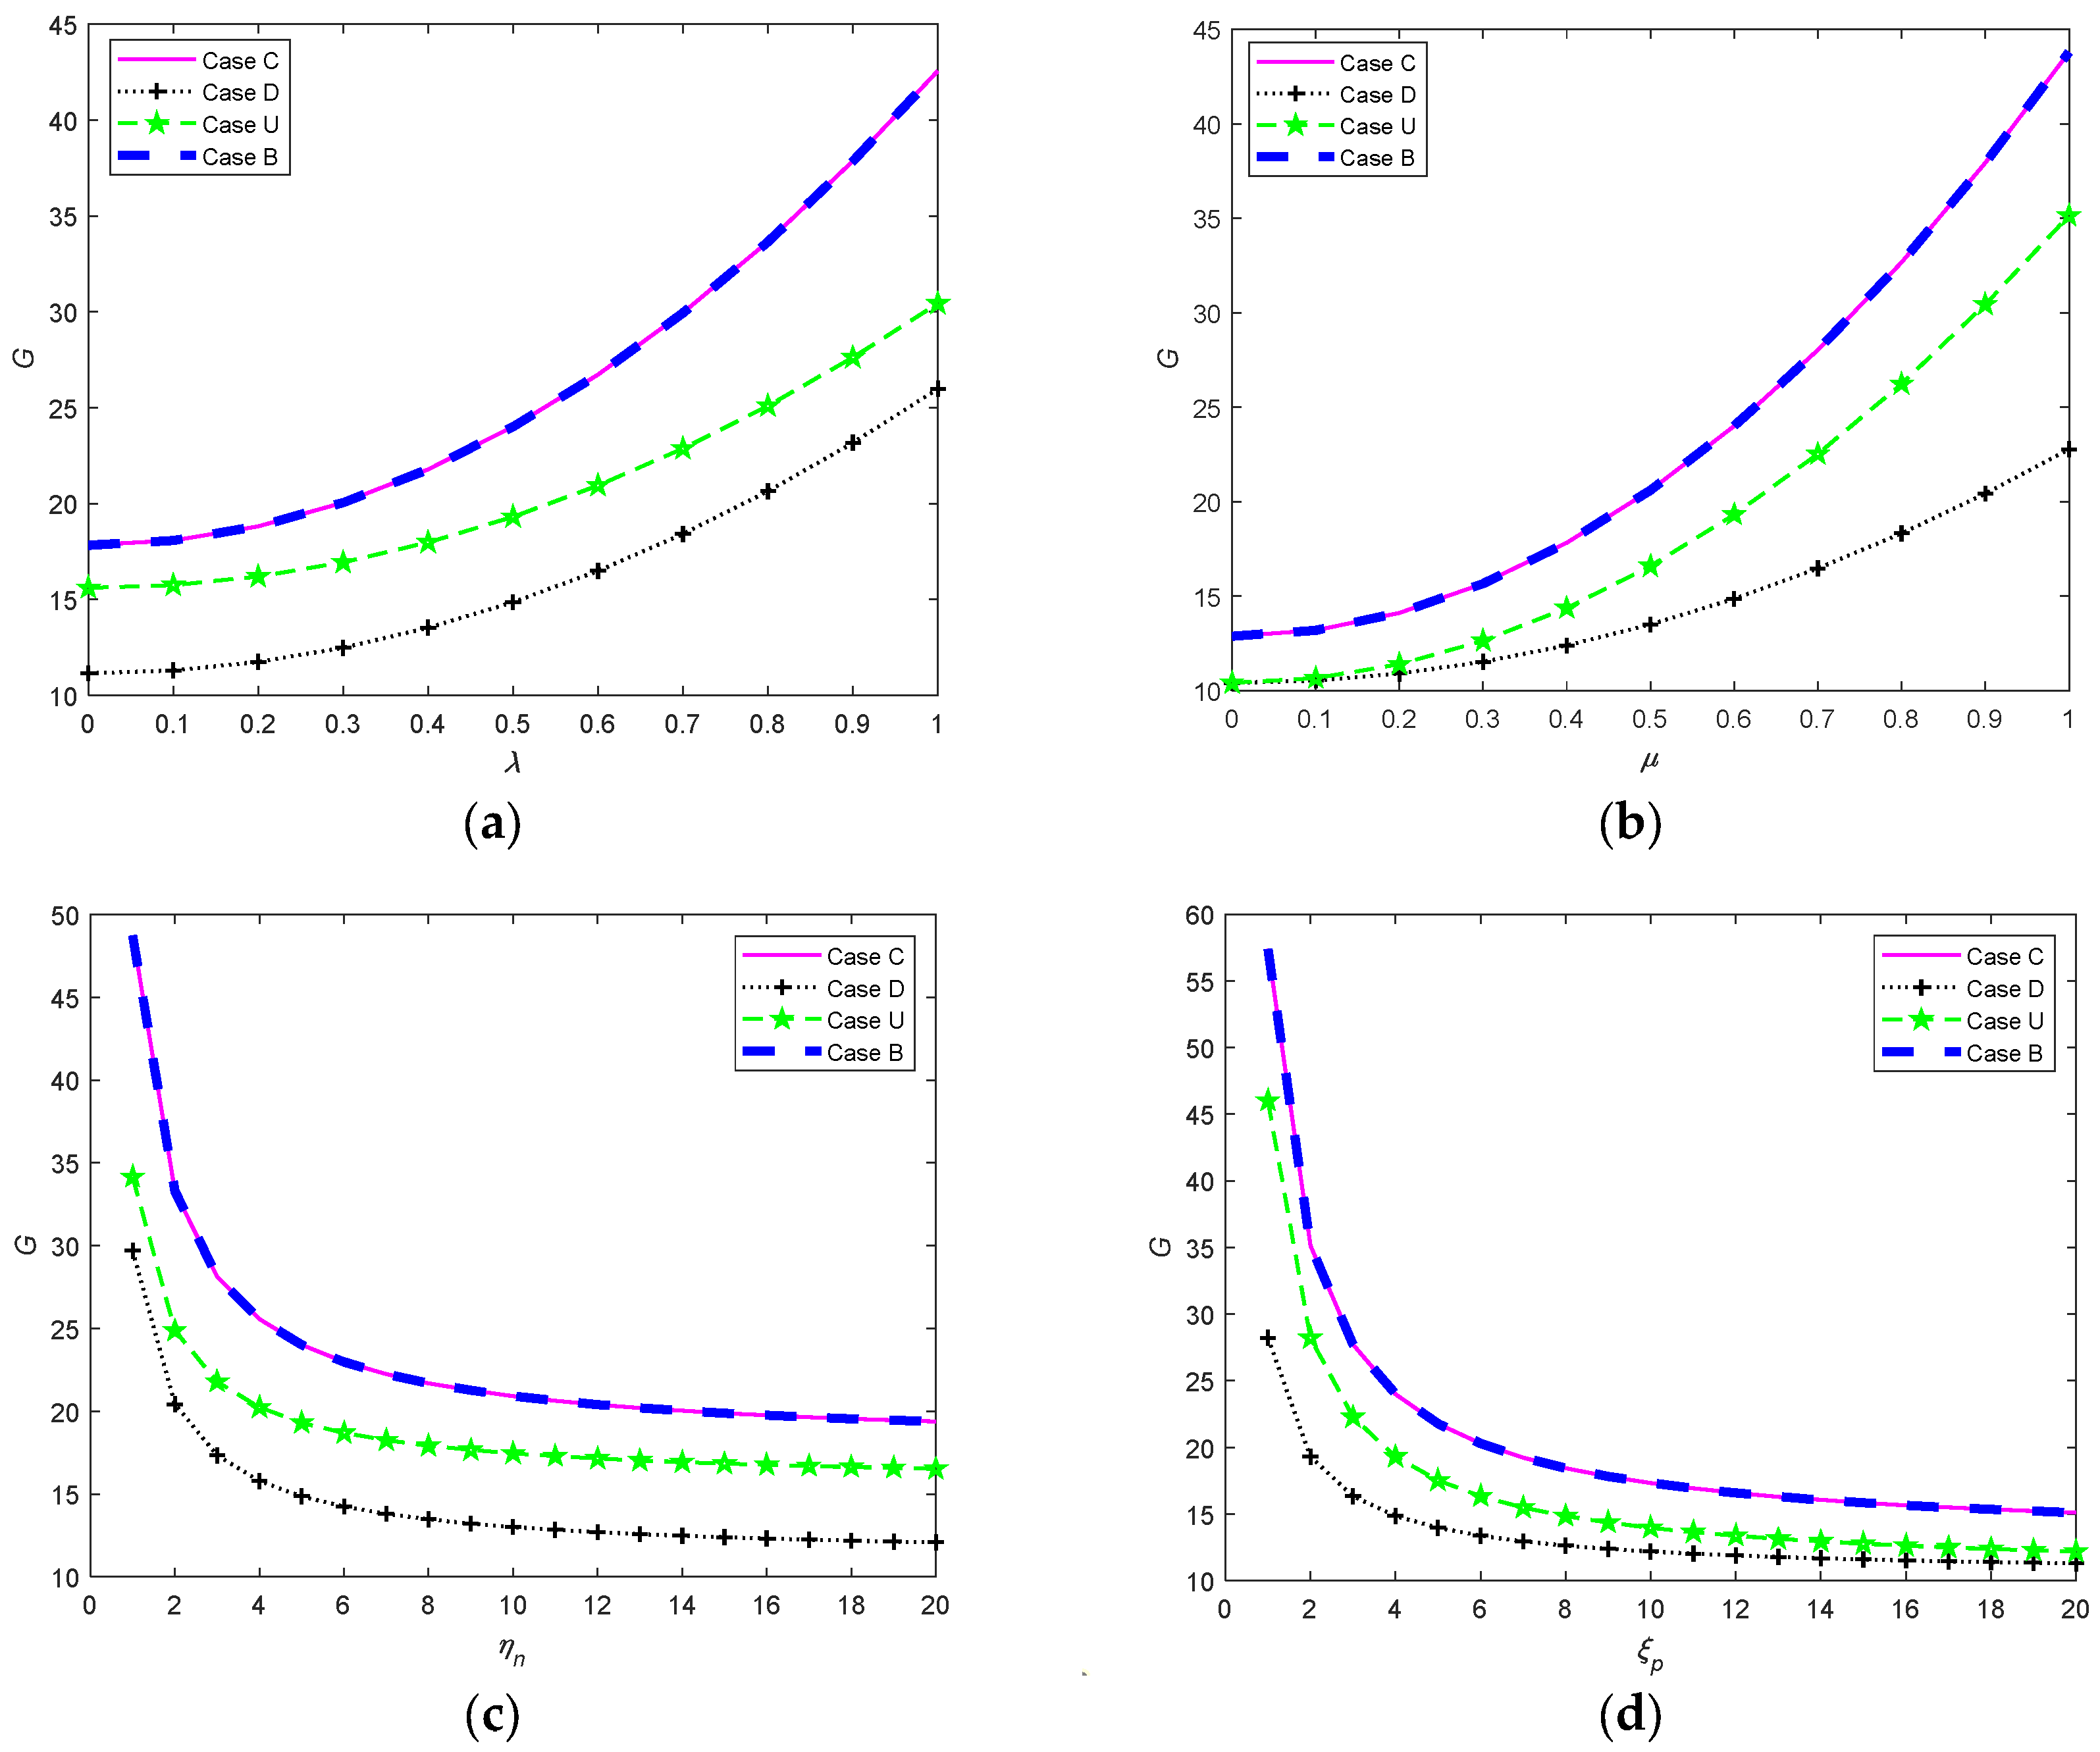
Figure 4 displays the effects of several parameters on electric goodwill. Figure 4a,b illustrates that electric goodwill increases with increasing parameters λ and μ, and the rate of increase becomes increasingly rapid. These findings suggest that when R&D technology and advertising investment are more easily converted into electric goodwill, there are greater advantages to improving long-term electric goodwill. The enhancement of electric goodwill is most significant in Cases B and C. This shows that, in practice, to improve consumer recognition of electric construction machinery in the long run, joint efforts by the manufacturer and the lessor are needed. Not only does the manufacturer need to produce electric equipment with better quality and performance, but the lessor also needs to increase advertising efforts when leasing to consumers. Figure 4c,d demonstrates that the electric goodwill decreases with the increase in parameters ηn and ξp in four cases. These findings indicate that the greater the difficulties the manufacturer faces in R&D investment, and the less it spends on advertising, the harder it is to improve electric goodwill. Moreover, the investment in R&D technology and environmental protection publicity can be stimulated by reducing the costs of the manufacturer and the lessor, thereby improving the electric goodwill of the electric construction machinery leasing supply chain.
In practice, Sany Heavy Industry, in collaboration with Contemporary Amperex Technology Co., Limited (CATL), has developed a specialized battery for mixer trucks, characterized by low degradation, slow capacity fade, and fast charging capability. XCMG has added a new production line for electric machinery and produced a pure electric loader featuring ultra-long endurance. These efforts by the manufacturer to enhance electric equipment contribute to improving their electric goodwill and increasing consumer preference. Meanwhile, Huatie Emergency has adopted an AI application platform for equipment rental, leveraging AI to increase the market share of electric equipment, build a technology-driven, green brand image, and thereby enhance electric equipment goodwill.

6.3. The Effect of Key Parameters on D

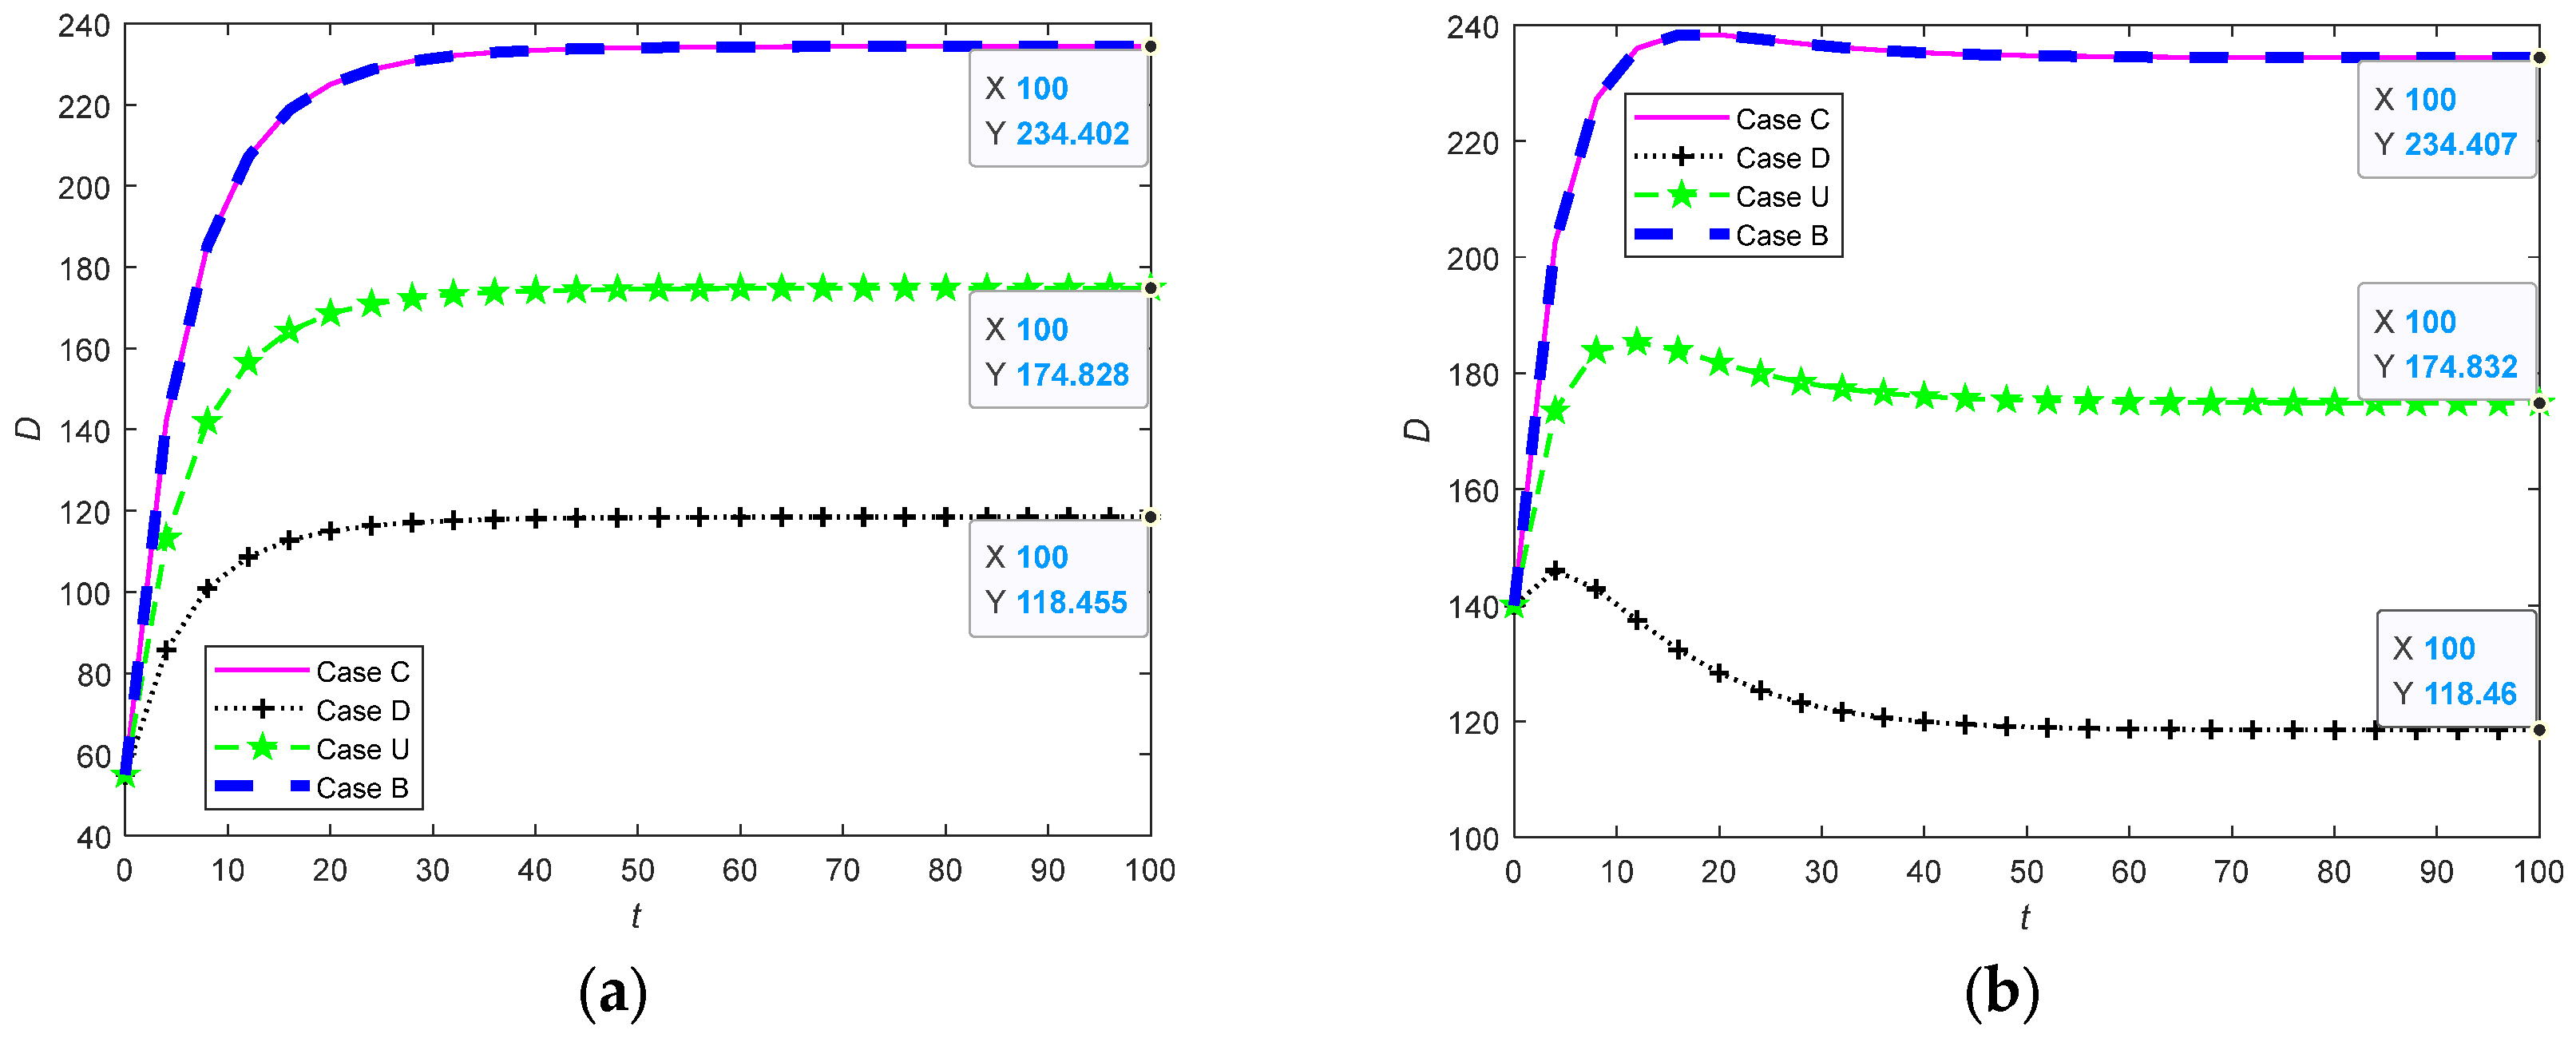
Figure 5 shows the time trajectories of leasing demand for the two state variables with different initial values. Moreover, the operating time of the electric construction machinery leasing supply chain is set as t ∈ [0, 100]. In Figure 5a, we set S 0 = 5 < S i and G 0 = 10 < G i , where i C , D , U , B . However, we set S 0 = 55 > S i and G 0 = 5 < G i in Figure 5b, where i C , D , U , B . Figure 5a demonstrates that leasing demand driven by the combined influence of AI-enabled maintenance service level and electric goodwill increases gradually before stabilizing over time. Since the AI-enabled maintenance service level first decreases and then stabilizes, while the electric goodwill first increases and then stabilizes, leasing demand first increases, then decreases, and finally stabilizes. Although the trajectories of demand over time differ across the four cases in Figure 5a,b, the leasing demand values stabilize in the long run for each decision case.
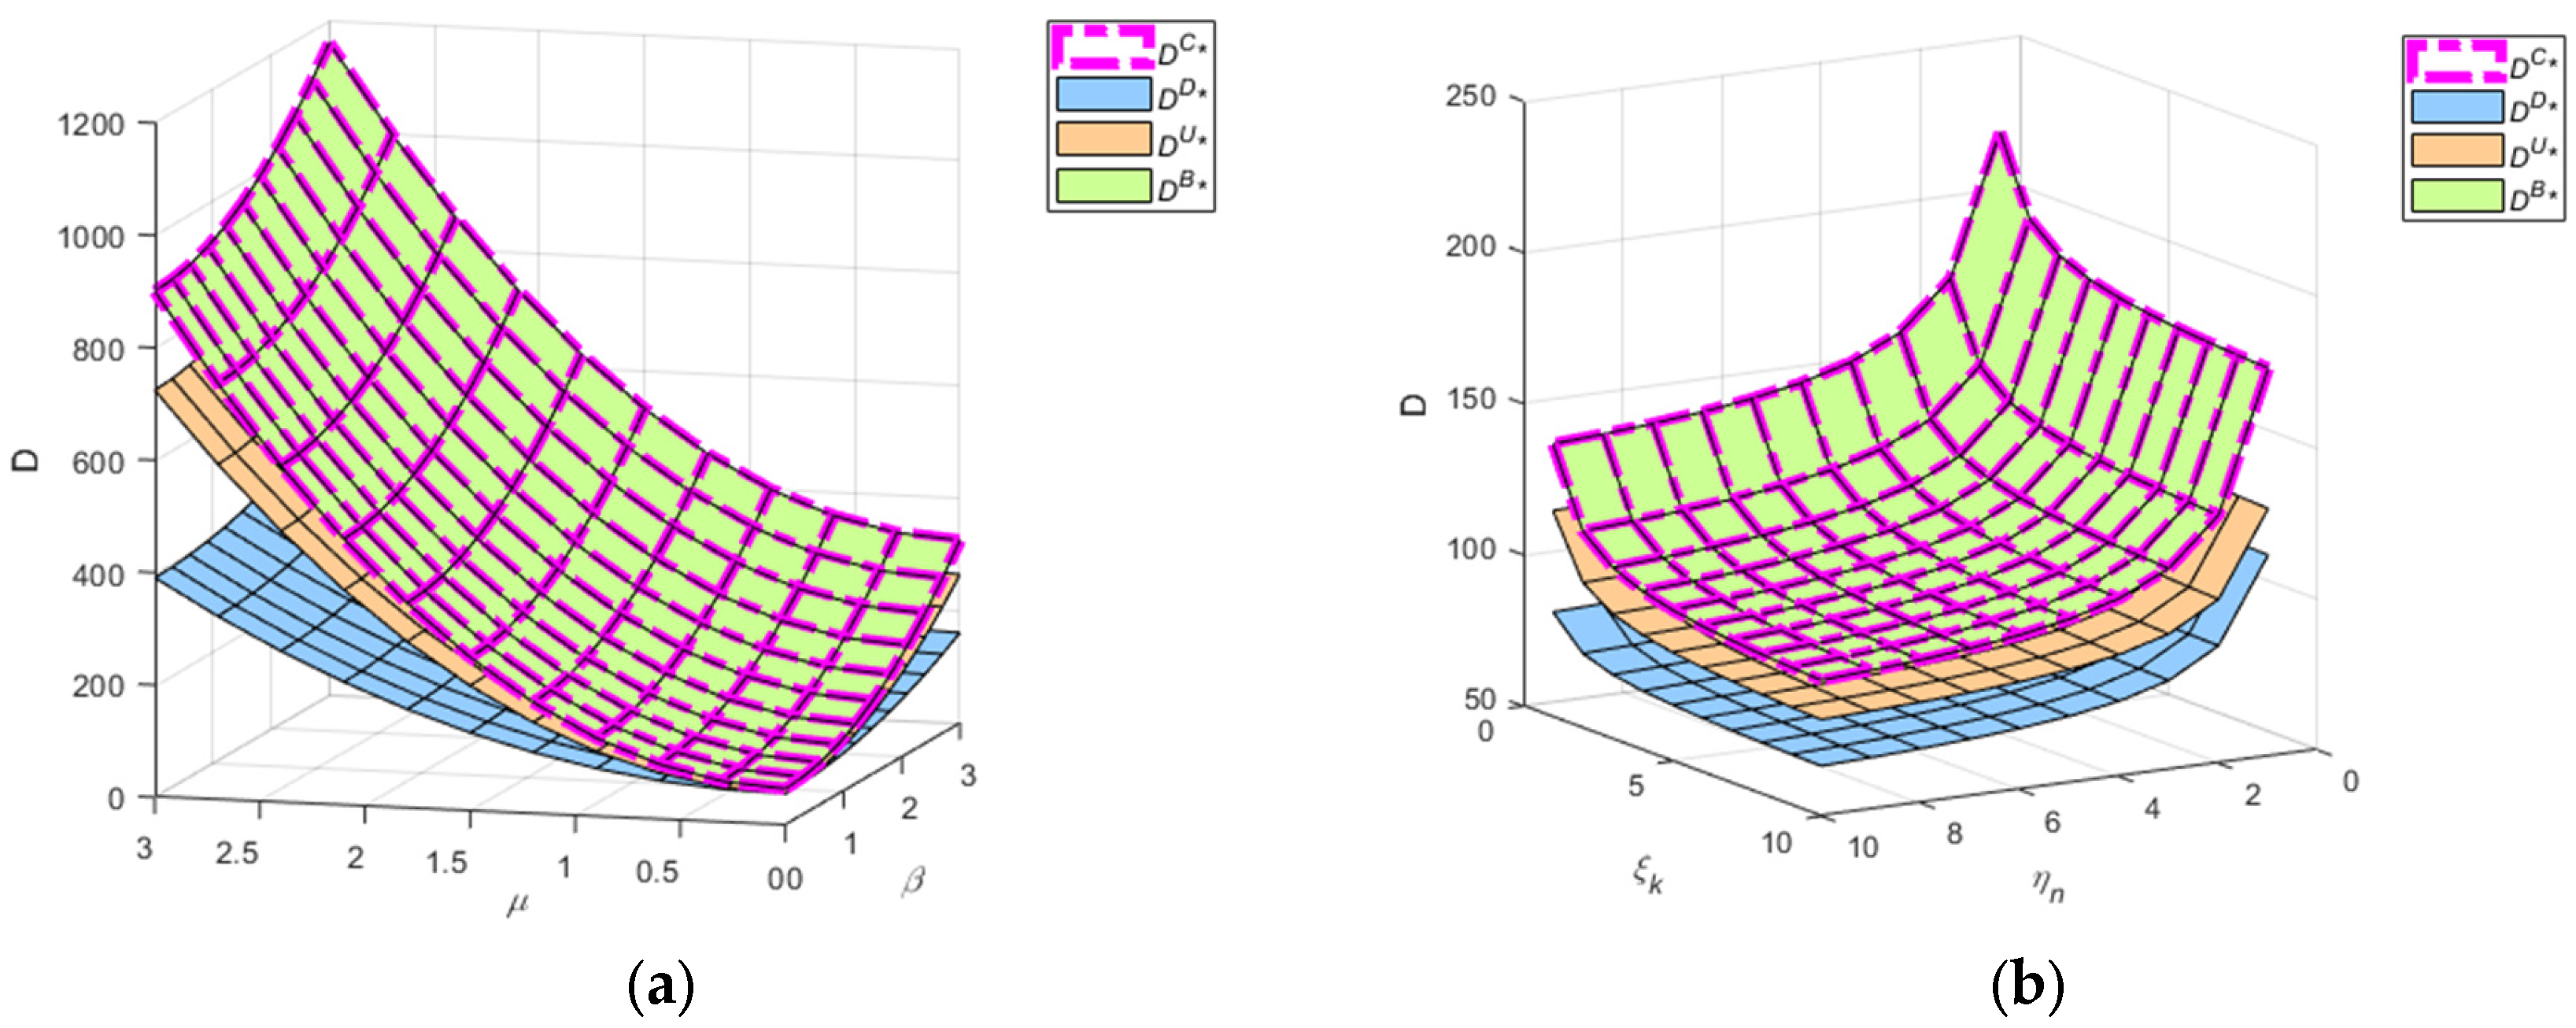
Figure 6 displays the effects of several parameters on leasing demand. Figure 6a shows that demand increases with both β and μ. Figure 6a illustrates that the lessor can improve AI-enabled maintenance and advertising efforts to enhance the AI-enabled maintenance service level and electric goodwill, thereby meeting maintenance service quality perception and environmentally perceived consumer needs, which, in turn, will enhance demand. Figure 6b shows that leasing demand decreases with increasing parameters ηn and ξk under four cases. Figure 6b illustrates that investment in R&D technology and AI-enabled maintenance can be stimulated by cost savings, thereby improving leasing demand. The above results show that increasing leasing demand for electric construction machinery requires joint efforts by upstream and downstream supply chain members to enhance technological innovation and achieve cost savings.
Regarding the enhancement of the AI-enabled maintenance service level and the improvement of the electric goodwill, practical examples have been provided. Moreover, improving these two aspects will help to expand market demand.

6.4. The Effect of Key Parameters on Profits and Cost-Sharing Proportion

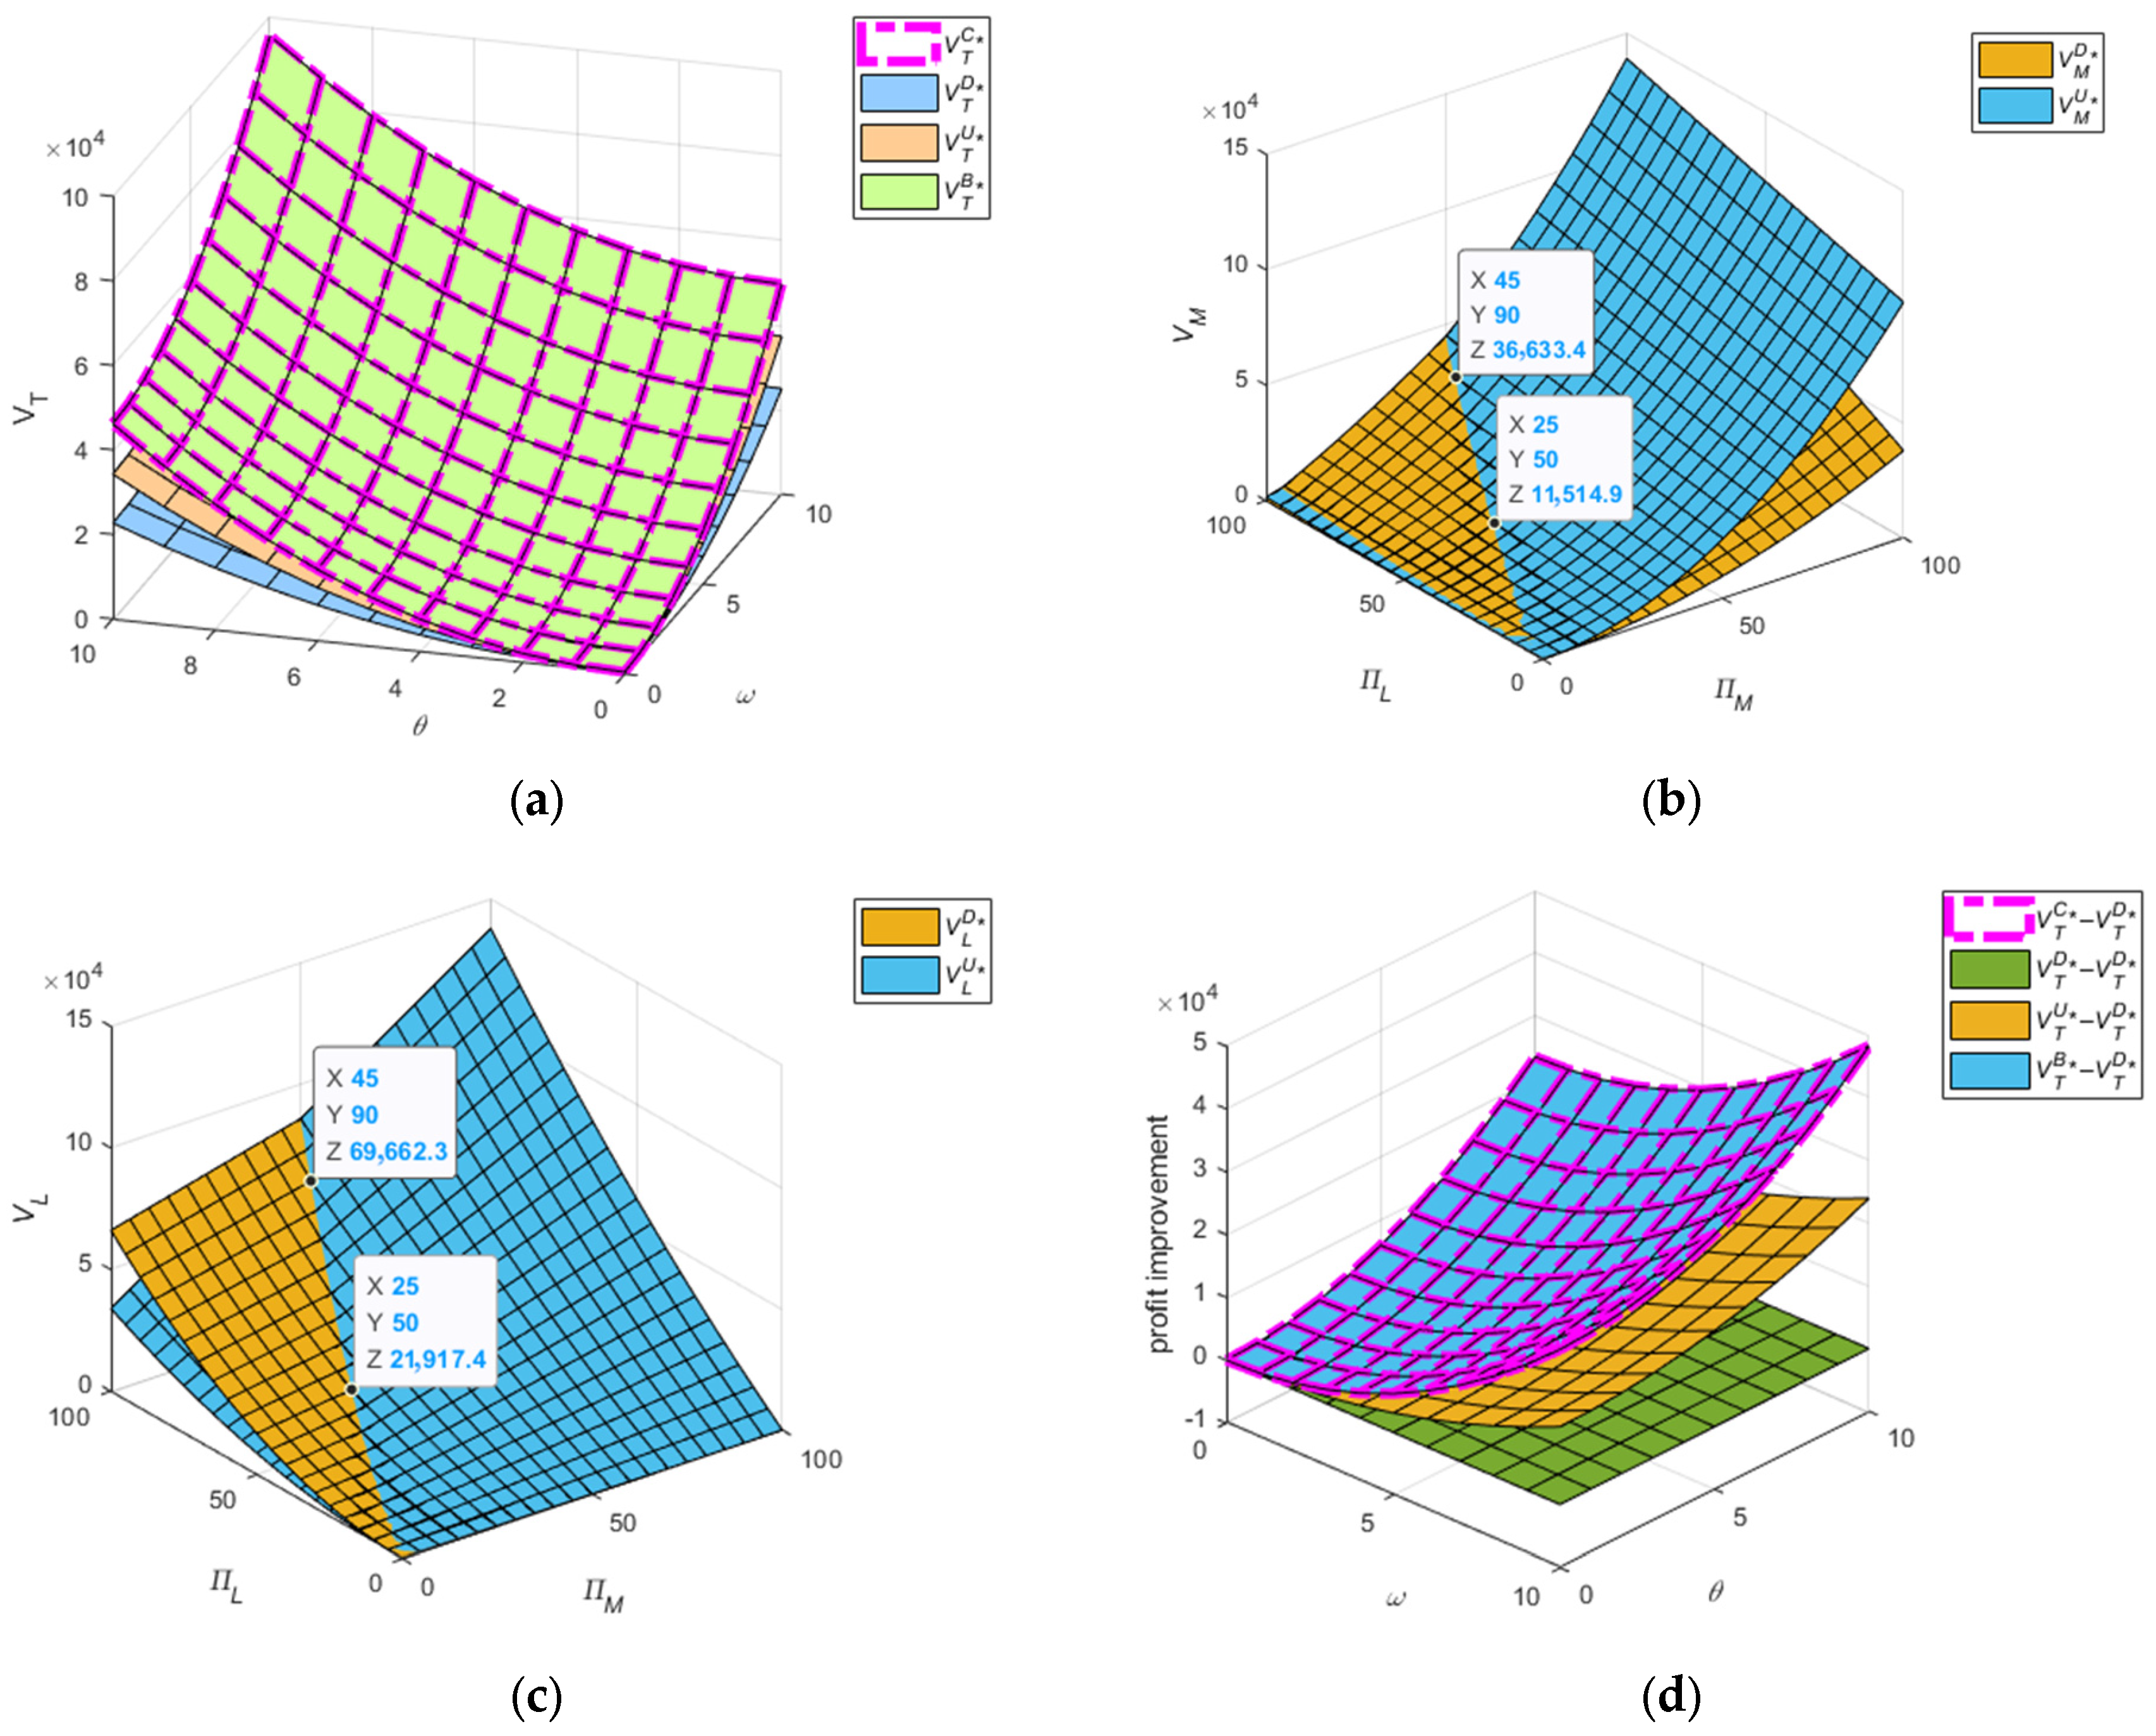
Figure 7 demonstrates the impacts of key parameters on the manufacturer’s profit, the lessor’s profit, the supply chain’s total profit, and the enhancement of total profit. Figure 7a shows that, in all cases, the supply chain’s total profit increases with θ and ω at an increasing rate, and the total profit in Cases U and B is higher than that in Case D. Moreover, the total profit in Case B is equal to that in Case C. These results are consistent with Corollary 6. The results show that in the long run, the cooperation between the manufacturer and the lessor performs well in terms of AI-enabled maintenance service level, electric goodwill, leasing demand, and the supply chain’s total profit. In addition, the realization of Case U and Case B is conditional. The conditions for the effectiveness of a unilateral cost-sharing contract are shown in Figure 7b,c. When Π M > Π L / 2 , both the manufacturer’s and the lessor’s profits in Case U are higher than those in Case D. However, when Π M is very small and Π L is large enough, the manufacturer’s profit in Case U is also higher than that in Case D, but the lessor’s profit does not improve. Therefore, the condition for the effectiveness of a unilateral cost-sharing contract lies in Π M > Π L / 2 , what is consistent with Corollary 7(1). The key to the effectiveness of the bilateral cost-sharing contract in Case B lies in the redistribution of profits, and the redistribution of the additional profits depends on the negotiation power between the manufacturer and the lessor.
From Figure 7a,d, as consumers’ AI-enabled maintenance service and electrical product preferences increase, the supply chain’s total profit improves, and the magnitude of the improvement increases. Therefore, the manufacturer should strengthen innovation in AI-enabled O&M and R&D technology, while the lessor should enhance product maintenance and promotion. Such collaborative efforts will enable electric construction machinery to achieve greater electrification, environmental sustainability, intelligence, and reliability. Figure 7d further shows that Case B outperforms Case U in terms of total supply chain profit. Moreover, the advantage of the bilateral cost-sharing contract becomes increasingly significant as ω and θ increase. Overall, to enhance profitability and promote the production of environmentally friendly electric construction machinery, close collaboration between the manufacturer and the lessor is essential.
Figure 8 shows the cost-sharing proportions between the manufacturer and the lessor in Cases U and B. Figure 8a illustrates that the maintenance cost proportion equals the electric advertising cost proportion allocated by the manufacturer to the lessor in both cases. This suggests that both AI-enabled maintenance and electric advertising efforts are important and should be incentivized equally by the manufacturer. The manufacturer’s cost-sharing proportion in the lessor’s maintenance and advertising costs increases with the manufacturer’s marginal profit and decreases with the lessor’s marginal profit. Figure 8b shows that the lessor’s cost-share proportion in the manufacturer’s AI-enabled maintenance cost and R&D cost decreases with the manufacturer’s marginal profit and increases with the lessor’s marginal profit in Case B. Additionally, as shown in Figure 7b,c, an increase in the marginal profits of the manufacturer and the lessor leads to higher profits for both upstream and downstream supply chain members. Especially in Case B, the increase in marginal profits for any supply chain member will bring significant economic, security, and environmental benefits. Therefore, as supply chain members’ marginal profits increase, they should raise their share of contributions to promote coordination in the electric construction machinery leasing supply chain. At the same time, it has also enhanced the reliability of the equipment and the resilience of the supply chain.
Taking the cooperation between Huatie Emergency and XCMG Fire Safety as an example, the deep collaboration between the two parties in terms of intelligence, capital, and market represents a successful implementation of the bilateral cost-sharing contract concept. Both parties should prioritize investment in digital technologies such as AI during their cooperation. XCMG Fire Safety should balance R&D investment with market promotion, while Huatie Emergency should actively provide product usage data to the manufacturer to facilitate product quality improvement.

7. Conclusions

In the context of low-carbon and digital transformation, our study incorporates AI-enabled O&M effort, R&D technology investment, AI-enabled maintenance effort, and advertising effort into a long-term dynamic framework. Applying differential game theory, this study investigates the dynamic strategies of an electric construction machinery leasing supply chain comprising a manufacturer and a lessor. We develop differential game models for Case C, Case D, Case U, and Case B, compare the optimal results across the four cases, and conduct correlation and numerical analyses. This study provides strategies for members of the construction machinery leasing supply chain to pursue electrification and intelligent development, thereby enhancing long-term profitability and resilience.

7.1. Results and Management Insights

(1)
From a long-term perspective, the optimal trajectories of AI-enabled maintenance service levels and electric goodwill in the electric construction machinery leasing supply chain under four scenarios are monotonic. Their monotonic states depend on the relative sizes of the initial and steady-state values of the state variables, and they ultimately converge to the same stable state in each case. However, because of the overall impact of AI-enabled maintenance service levels and electric goodwill, the market demand trajectories will exhibit different trends but will eventually stabilize. These findings indicate that the long-term optimal decisions for the leasing supply chain are feasible.
(2)
When the manufacturer’s marginal profit exceeds half of the lessor’s marginal profit, it can realize Pareto improvement of the electric construction machinery leasing supply chain in Case U. After adopting the unilateral cost-sharing contract, the lessor increases its AI-enabled maintenance and advertising effort, but the manufacturer’s R&D technology investment and AI-enabled O&M effort remain unchanged.
(3)
In Case B, there always exists a set of optimal cost-sharing parameters that enable the leasing supply chain to achieve the optimal level. However, it is necessary to establish a profit redistribution mechanism so that both the manufacturer and the lessor can increase their profits in Case B, thereby enabling perfect coordination of the electric construction machinery leasing supply chain. At the same time, it also enhances the reliability of the equipment and the resilience of the supply chain.
(4)
From a long-term perspective, the bilateral cost-sharing contract is more favorable than a unilateral cost-sharing contract in terms of improving the AI-enabled maintenance service level, electric goodwill, and profit. However, only when the profit distribution proportion is controlled within V M D * / V T B * , 1 V T D * / V T B * , both the manufacturer and the lessor prefer the bilateral cost-sharing contract. In addition, the optimal cost-sharing proportion depends on the relative size of the manufacturer’s and the lessor’s marginal profits in both Case U and Case B.
(5)
The more challenges the manufacturer faces in investing in AI-enabled O&M and R&D technology, as well as in AI-enabled maintenance and advertising, the harder it becomes to improve the AI maintenance service level and brand reputation. This results in lower market demand and reduced profits for supply chain members. When the AI-enabled O&M effort and the maintenance effort translate more effectively into service levels, the resulting positive impact becomes more pronounced, leading to higher market demand and profits. With the development of AI technology, AI-enabled maintenance techniques enhance the reliability of construction machinery, thereby improving supply chain resilience and sustainability. When R&D technology investment and advertising efforts are more effectively converted into electric goodwill, the resulting enhancement in goodwill boosts market demand and profitability. The more concerned consumers are about environmental and safety issues, the larger the market for AI-enabled electric construction machinery leasing becomes. As a result, both the manufacturer and the lessor see higher profits, and their collaboration becomes more effective. With the faster aging of maintenance service equipment and the increasing obsolescence of AI technology, the long-term effectiveness of AI-enabled maintenance services is declining. When R&D technology becomes outdated, and publicity effects are poor, the electric goodwill will suffer.
In summary, the manufacturer and lessor should transform their traditional manufacturing and business models by leveraging AI to enhance the leasing and maintenance of electric construction machinery. Such efforts will advance intelligence, electrification, environmental sustainability, and reliability within the leasing supply chain. Through cost-sharing contracts, the manufacturer and the lessor can strengthen cooperation, enhance technological innovation, and achieve cost savings, thereby realizing economic growth, environmental improvement, and operational reliability in construction machinery, which in turn promotes social harmony. The government can increase publicity on energy saving, emission reduction, and the safe use of electric construction machinery. This would enhance consumers’ preference for electric equipment and safety awareness, thereby motivating enterprises to produce and maintain electric construction machinery.

7.2. Comparison and Future Work

The monotonicity of state variables and the characteristics of unilateral and bilateral cost-sharing contracts derived in our study are consistent with those described in References [41,43]. However, unlike these references, which incorporate governmental low-carbon policies, our paper focuses on game interactions between enterprises. Moreover, our study considers two state variables, making relationships among various factors more complex than in References [57,60], where only one state variable is involved. Similarly to References [43,57], the pricing factor is not considered. A series of studies by Yin et al. [18,34,35] on the construction machinery leasing supply chain indicates that supply chain profitability can be enhanced by maintenance effort. This mechanism is consistent with the role of AI-enabled maintenance effort in our paper. However, our study incorporates AI-enabled technologies and considers joint maintenance by the manufacturer and lessor, which better aligns with practical construction scenarios. In contrast to Yin’s literature, our study adopts a multi-period dynamic perspective, aligns with the practical electrification and intelligent transformation of construction machinery, and incorporates practical examples. Furthermore, compared with the studies on electric construction machinery by Huang et al. [12,15,16], this paper adopts a quantitative research framework that focuses on the interdependencies between upstream and downstream enterprises in the electric construction machinery leasing supply chain.
Based on comparisons with key relevant literature and construction practice, although our study contributes to a deeper understanding of the operations of the electric construction machinery leasing supply chain, it also has some limitations. First, it focuses on AI-enabled maintenance services and low-carbon operational decisions, assuming fixed marginal profits to simplify the model. An important direction for future research will be to incorporate pricing factors and investigate joint decisions about pricing, AI-enabled maintenance, and low-carbon operations, as such integration would better align with engineering practice. Second, our study does not incorporate government policies into the model. Introducing tax incentives or subsidies (for example, providing subsidies when converting old fuel-powered construction machinery to electric construction machinery) could yield further insights. Third, our study is conducted under the assumption of information symmetry. Therefore, exploring decision-making in leasing supply chains under information asymmetry, where supply chain members possess private information, is a valuable direction for future research.

Author Contributions

Conceptualization, X.C., T.W. and K.G.; methodology, X.C., T.W. and K.G.; software, T.W. and M.L.; formal analysis, X.C., S.L. and Y.C.; investigation, M.L., S.L. and D.G.; writing—original draft preparation, X.C., T.W. and K.G.; writing—review and editing, X.C., T.W., M.L. and D.G.; supervision, X.C. and K.G.; funding acquisition, T.W. All authors have read and agreed to the published version of the manuscript.

Funding

This research was funded by Beijing Social Science Foundation (25BJ03190), National Educational Examination Research Planning Project (GJK2024007), Fundamental Research Funds for the Central Universities (2025SKQLH02), and Project of Beijing Institute of Graphic Communication (Ea202308).

Institutional Review Board Statement

Not applicable.

Informed Consent Statement

Not applicable.

Data Availability Statement

The data are all included in the article.

Conflicts of Interest

The authors declare no conflicts of interest.

Appendix A

Proof of Proposition 1. 
According to the optimal control theory, the optimal function of the supply chain’s profit at time t can be expressed as
P T C M d , M n , L k , L p = e ρ t V T C S , G
For any S ≥ 0 and G ≥ 0, V T C S , G satisfies the Hamilton–Jacobi–Bellman equation, that is
ρ V T C S , G = max M d , M n , L k , L p Π M + Π L D 0 + θ S + ω G η d 2 M d 2 η n 2 M n 2 ξ k 2 L k 2 ξ p 2 L p 2 + V T S C α M d + β L k γ S + V T G C λ M n + μ L p ε G
Equation (A2) is a joint concave function on M d , M n , L k and L p . Therefore, according to the right of the equation, the first-order conditions can be obtained as
M d = α V T S C η d
M n = λ V T S C η n
L k = β V T S C ξ k
L p = μ V T S C ξ p
Substituting (A3)~(A6) into (A2), we can obtain
ρ V T C S , G = Π M + Π L θ γ V T S C S + Π M + Π L ω ε V T G C G + Π M + Π L D 0 + V T S C 2 2 α 2 η d + β 2 ξ k + V T G C 2 2 λ 2 η n + μ 2 ξ p
According to the structural characteristics of Equation (A7), we presume that V T C S , G is a linear function of S and G. Therefore, we assume that V T C S , G = t 1 S + t 2 G + t 3 , where t 1 , t 2 , are constants. Further, we can obtain V T S C = t 1 , V T G C = t 2 .
Substituting V T C S , G and its first-order bias on S and G Equation (A7), then comparing the coefficients, we can obtain
ρ t 1 = Π M + Π L θ γ t 1 ρ t 2 = Π M + Π L ω ε t 2 ρ t 3 = Π M + Π L D 0 + t 1 2 2 α 2 η d + β 2 ξ k + t 2 2 2 λ 2 η n + μ 2 ξ p
Solving the system of equations, we can obtain t 1 C * , t 2 C * , t 3 C * , then we can obtain V T S C * and V T G C * . Substituting V T S C * and V T G C * into (A3)~(A6), we can obtain the optimal equilibrium strategies of the manufacturer and the lessor shown in (12). Then substituting M d C * and L k C * into (5), we can obtain S C * . Substituting M n C * and L p C * into (6), we can obtain G C * , and then obtain the leasing demand of products D C * . Moreover, the optimal profit V T C *  of the supply chain system can be obtained. □
Proof of Proposition 2.  
According to the optimal control theory, the optimal function of the manufacturer’s profit at time t can be expressed as
P M D M d , M n = e ρ t V M D S , G
For any S ≥ 0 and G ≥ 0, V M D S , G satisfies the HJB equation, that is
ρ V M D S , G = max M d , M n Π M D 0 + θ S + ω G η d 2 M d 2 η n 2 M n 2 + V M S D α M d + β L k γ S + V M G D λ M n + μ L p ε G
Equation (A10) is a joint concave function on M d and M n . Therefore, according to the first-order conditions with respect to M d and M n , we can achieve these
M d = α V M S D η d
M n = λ V M G D η n
Similarly, the optimal function of the lessor’s profit at time t is
P L D L k , L p = e ρ t V L D S , G
For any S ≥ 0 and G ≥ 0, V L D S , G satisfies the HJB equation, that is
ρ V L D S , G = max L k , L p Π L D 0 + θ S + ω G ξ k 2 L k 2 ξ p 2 L p 2 + V L S D α M d + β L k γ S + V L G D λ M n + μ L p ε G
Equation (A14) is a joint concave function on L k and L p . Therefore, according to the first-order conditions with respect to L k and L p , we can obtain
L k = β V L S D ξ k
L p = μ V L G D ξ p
Substituting (A11), (A12), (A15) and (A16) into (A10) and (A14), we can obtain
ρ V M D S , G = Π M θ γ V M S D S + Π M ω ε V M G D G + Π M D 0 + α 2 V M S D 2 2 η d + λ 2 V M G D 2 2 η n + β 2 V M S D V L S D ξ k + μ 2 V M G D V L G D ξ p
ρ V L D S , G = Π L θ γ V L S D S + Π L ω ε V L G D G + Π L D 0 + β 2 V L S D 2 2 ξ k + μ 2 V L G D 2 2 ξ p + α 2 V M S D V L S D η d + λ 2 V M G D V L G D η n
According to the structural characteristics of Equations (A17) and (A18), we presume that both V M D S , G and V L D S , G are linear functions of S and G. Therefore, V M D S , G and V L D S , G can be assumed as
V M D S , G = m 1 S + m 2 G + m 3 V L D S , G = r 1 S + r 2 G + r 3
where m 1 , m 2 , m 3 , r 1 , r 2 , r 3 are constants. Further, we can obtain V M S D = m 1 , V M G D = m 2 , V L S D = r 1 , V L G D = r 2 .
Substituting V M D S , G , V L D S , G and their first-order bias on S and G into (A17) and (A18). Then, comparing the coefficients, we can obtain
ρ m 1 = Π M θ γ m 1 ρ m 2 = Π M ω ε m 2 ρ m 3 = Π M D 0 + α 2 m 1 2 2 η d + λ 2 m 2 2 2 η n + β 2 m 1 r 1 ξ k + μ 2 m 2 r 2 ξ p ρ r 1 = Π L θ γ r 1 ρ r 2 = Π L ω ε r 2 ρ r 3 = Π L D 0 + β 2 r 1 2 2 ξ k + μ 2 r 2 2 2 ξ p + α 2 m 1 r 1 η d + λ 2 m 2 r 2 η n
Solving the (A20), we can obtain m 1 D * , m 2 D * , m 3 D * , r 1 D * , r 2 D * , r 3 D * , then we can obtain V M S D * , V M G D * , V L S D * , V L G D * . Substituting V M S D * , V M G D * , V L S D * , V L G D * into (A11), (A12), (A15) and (A16), we can obtain the optimal equilibrium strategies of the manufacturer and the lessor shown in (17). Then, substituting M d D * and L k D * into (5), we can obtain S D * . Substituting M n D * and L p D * into (6), we can obtain G D * , and then obtain the leasing demand of products D D * . Moreover, we can obtain the optimal profits of the manufacturer, the lessor, and the supply chain V M D * , V L D * , V T D * . □
Proof of Proposition 3.  
We apply the inverse solution method to solve the proposition. According to the optimal control theory, for any S ≥ 0 and G ≥ 0, V L U S , G satisfies the HJB equation, that is
ρ V L U S , G = max L k , L p Π L D 0 + θ S + ω G 1 δ 1 ξ k 2 L k 2 1 δ 2 ξ p 2 L p 2 + V L S U α M d + β L k γ S + V L G U λ M n + μ L p ε G
Equation (A21) is a joint concave function on L k and L p . Therefore, according to the first-order conditions with respect to L k and L p , we can obtain
L k = β V L S U ξ k 1 δ 1
L p = μ V L G U ξ p 1 δ 2
Similarly, for any S ≥ 0 and G ≥ 0, V M U S , G satisfies the HJB equation, that is
ρ V M U S , G = max M d , M n , δ 1 , δ 2 Π M D 0 + θ S + ω G η d 2 M d 2 η n 2 M n 2 δ 1 ξ k 2 L k 2 δ 2 ξ p 2 L p 2 + V M S U α M d + β L k γ S + V M G U λ M n + μ L p ε G
Substituting (A22) and (A23) into (A24), and then, according to the first-order conditions, we can obtain
M d = α V M S U η d
M n = λ V M G U η n
δ 1 = 2 V M S U V L S U 2 V M S U + V L S U
δ 2 = 2 V M G U V L G U 2 V M G U + V L G U
Substituting (A22), (A23), (A25)~(A28) into (A21) and (A24), we can obtain
ρ V M U S , G = Π M θ γ V M S U S + Π M ω ε V M G U G + Π M D 0 + α 2 V M S U 2 2 η d + β 2 V M S U 2 2 ξ k + λ 2 V M G U 2 2 η n + μ 2 V M G U 2 2 ξ p + β 2 V L S U 2 8 ξ k + β 2 V M S U V L S U 2 ξ k + μ 2 V L G U 2 8 ξ p + μ 2 V M G U V L G U 2 ξ p
ρ V L U S , G = Π L θ γ V L S U S + Π L ω ε V L G U G + Π L D 0 + β 2 V L S U 2 4 ξ k + μ 2 V L G U 2 4 ξ p + V M S U V L S U 2 α 2 ξ k + β 2 η d 2 η d ξ k + V M G U V L G U 2 λ 2 ξ p + μ 2 η n 2 η n ξ p
According to the structural characteristics of (A29) and (A30), we presume that both V M U S , G and V L U S , G are linear functions of S and G. Therefore, V M U S , G and V L U S , G can be assumed as
V M U S , G = m 1 S + m 2 G + m 3 V L U S , G = r 1 S + r 2 G + r 3
where m 1 , m 2 , m 3 , r 1 , r 2 , r 3 are constants. Further, we can obtain V M S U = m 1 , V M G U = m 2 , V L S U = r 1 , V L G U = r 2 .
Substituting V M U S , G , V L U S , G  and their first-order bias on S and G into (A29) and (A30), then comparing the coefficients, we can obtain
ρ m 1 = Π M θ γ m 1 ρ m 2 = Π M ω ε m 2 ρ m 3 = Π M D 0 + α 2 m 1 2 2 η d + β 2 m 1 2 2 ξ k + λ 2 m 2 2 2 η n + μ 2 m 2 2 2 ξ p + β 2 r 1 2 8 ξ k + β 2 m 1 r 1 2 ξ k + μ 2 r 2 2 8 ξ p + μ 2 m 2 r 2 2 ξ p ρ r 1 = Π L θ γ r 1 ρ r 2 = Π L ω ε r 2 ρ r 3 = Π L D 0 + β 2 r 1 2 4 ξ k + μ 2 r 2 2 4 ξ p + m 1 r 1 2 α 2 ξ k + β 2 η d 2 η d ξ k + m 2 r 2 2 λ 2 ξ p + μ 2 η n 2 η n ξ p
Solving the (A32), we can obtain m 1 U * , m 2 U * , m 3 U * , r 1 U * , r 2 U * , r 3 U * , then we can obtain V M S U * , V M G U * , V L S U * , V L G U * . Substituting V M S U * , V M G U * , V L S U * , V L G U * into (A22), (A23), (A25)~(A28), we can obtain the optimal equilibrium strategies of the manufacturer and the lessor shown in (24). Then substituting M d U * and L k U * into (5), we can obtain S U * . Substituting M n U * and L p U * into (6), we can obtain G U * , and then obtain the leasing demand of products D U * . Moreover, we can obtain the optimal profits of the manufacturer, the lessor, and the supply chain V M U * , V L U * , V T U * . □
Proof of Proposition 4.  
According to the optimal control theory, for any S ≥ 0 and G ≥ 0, V M B S , G satisfies the HJB equation, that is
ρ V M B S , G = max M d , M n Π M D 0 + θ S + ω G 1 τ 1 η d 2 M d 2 1 τ 2 η n 2 M n 2 σ 1 ξ k 2 L k 2 σ 2 ξ p 2 L p 2 + V M S B α M d + β L k γ S + V M G B λ M n + μ L p ε G
Equation (A33) is a joint concave function on M d and M n . Therefore, according to the first-order conditions with respect to M d and M n , we can achieve these
M d = α V M S B η d 1 τ 1
M n = λ V M G B η n 1 τ 2
Similarly, for any S ≥ 0 and G ≥ 0, V L B S , G satisfies the HJB equation, that is
ρ V L B S , G = max L k , L p Π L D 0 + θ S + ω G 1 σ 1 ξ k 2 L k 2 1 σ 2 ξ p 2 L p 2 τ 1 η d 2 M d 2 τ 2 η n 2 M n 2 + V L S B α M d + β L k γ S + V L g B λ M n + μ L p ε G
According to the first-order conditions, we can obtain
L k = β V L S B ξ k 1 σ 1
L p = μ V L g B ξ p 1 σ 2
To enable supply chain coordination, we make M d = M d C * , M n = M n C * , L k = L k C * , L p = L p C * , and then solve them, we can obtain
δ 1 = 1 ρ + γ V L S B θ Π M + Π L
δ 2 = 1 ρ + ε V L S B ω Π M + Π L
τ 1 = 1 ρ + γ V M S B θ Π M + Π L
τ 2 = 1 ρ + ε V M G B ω Π M + Π L
Substituting (A34), (A35), (A37)~(A42) into (A33) and (A36), we can obtain
ρ V M B S , G = Π M θ γ V M S B S + Π M ω ε V M G B G + Π M D 0 β 2 θ 2 Π M + Π L 2 2 ξ k ρ + γ 2 μ 2 ω 2 Π M + Π L 2 2 ξ p ρ + ε 2 + β 2 θ Π M + Π L V L S B 2 ξ k ρ + γ + μ 2 ω Π M + Π L V L G B 2 ξ p ρ + ε + θ V M S B Π M + Π L 2 β 2 η d + α 2 ξ k 2 ξ k η d ρ + γ + ω V M G B Π M + Π L 2 μ 2 η n + λ 2 ξ p 2 ξ p η n ρ + ε  
ρ V M B S , G = Π M θ γ V M S B S + Π M ω ε V M G B G + Π M D 0 β 2 θ 2 Π M + Π L 2 2 ξ k ρ + γ 2 μ 2 ω 2 Π M + Π L 2 2 ξ p ρ + ε 2 + β 2 θ Π M + Π L V L S B 2 ξ k ρ + γ + μ 2 ω Π M + Π L V L G B 2 ξ p ρ + ε + θ V M S B Π M + Π L 2 β 2 η d + α 2 ξ k 2 ξ k η d ρ + γ + ω V M G B Π M + Π L 2 μ 2 η n + λ 2 ξ p 2 ξ p η n ρ + ε    
According to the structural characteristics of (A43) and (A44), we presume that both V M B S , G and V L B S , G are linear functions of S and G. Therefore, V M B S , G and V L B S , G can be assumed as
V M B S , G = m 1 S + m 2 G + m 3 V L B S , G = r 1 S + r 2 G + r 3
where m 1 , m 2 , m 3 , r 1 , r 2 , r 3 are constants. Moreover, we can obtain V M S B = m 1 , V M G B = m 2 , V L S B = r 1 , V L G B = r 2 .
Substituting V M B S , G , V L B S , G  and their first-order bias on S and G into (A43) and (A44), then comparing the coefficients, we can obtain
ρ m 1 = Π M θ γ m 1 ρ m 2 = Π M ω ε m 2 ρ m 3 = Π M D 0 β 2 θ 2 Π M + Π L 2 2 ξ k ρ + γ 2 μ 2 ω 2 Π M + Π L 2 2 ξ p ρ + ε 2 + β 2 θ Π M + Π L r 1 2 ξ k ρ + γ + μ 2 ω Π M + Π L r 2 2 ξ p ρ + ε + θ m 1 Π M + Π L 2 β 2 η d + α 2 ξ k 2 ξ k η d ρ + γ + ω m 2 Π M + Π L 2 μ 2 η n + λ 2 ξ p 2 ξ p η n ρ + ε ρ r 1 = Π L θ γ r 1 ρ r 2 = Π L ω ε r 2 ρ r 3 = Π L D 0 + β 2 θ r 1 Π M + Π L 2 ρ + γ ξ k + μ 2 ω r 2 Π M + Π L 2 ρ + ε ξ p + α 2 θ 2 r 1 + m 1 Π M + Π L 2 ρ + γ η d α 2 θ 2 Π M + Π L 2 2 ρ + γ 2 η d + λ 2 ω 2 r 2 + m 2 Π M + Π L 2 ρ + ε η n λ 2 ω 2 Π M + Π L 2 2 ρ + ε 2 η n
Solving the (A46), we can obtain m 1 B * , m 2 B * , m 3 B * , r 1 B * , r 2 B * , r 3 B * , then we can obtain V M S B * , V M G B * , V L S B * , V L G B * . Substituting V M S B * , V M G B * , V L S B * , V L G B * into (A34), (A35), (A37)~(A42), we can obtain the optimal equilibrium strategies of the manufacturer and the lessor shown in (31). Then substituting M d B * and L k B * into (5), we can obtain S B * . Substituting M n B * and L p B * into (6), we can obtain G B * , and then obtain the leasing demand of products D B * . Moreover, we can obtain the optimal profits of the manufacturer, the lessor, and the supply chain V M B * , V L B * , V T B * . □

Appendix B

Proof of Corollary 1.  
(1) From Equations (12), (17), (24) and (31), we have M d D * = M d U * , M d B * = M d C * , M n D * = M n U * , M d B * = M d C * . In addition, we obtain M d B * M d U * = α θ Π L / η d ρ + γ > 0 , M n B * M n U * = λ ω Π L / η n ρ + ε > 0 . Therefore,  M d U * < M d B * , M n U * < M n B * .
(2) From Equations (12), (17), (24) and (31), we have L k B * = L k C * , L p B * = L p C * . In addition, we obtain L k B * L k U * = β θ Π L / 2 ξ k ρ + γ > 0 , L k B * L k D * = β θ Π M / ξ k ρ + γ > 0 , L p B * L p U * = μ ω Π L / 2 ξ p ρ + ε > 0 , L p B * L p D * = μ ω Π M / ξ p ρ + ε > 0 , so L k B * > L k U * , L k B * > L k D * , L p B * > L p U * , L p B * > L p D * . Similarly, we have L k U * L k D * = β θ 2 Π M Π L / 2 ξ k ρ + γ , L p U * L p D * = μ ω 2 Π M Π L / 2 ξ p ρ + ε . So, when Π M > Π L / 2 , then L k U * > L k D * , L p U * > L p D * . And if Π M Π L / 2 , L k U * L k D * , L p U * L p D * . In summary, when  Π M > Π L / 2 , then  L k C * = L k B * > L k U * > L k D * , L p C * = L p B * > L p U * > L p D * ; when  Π M Π L / 2 , then  L k U * L k D * < L k B * = L k C * , L p U * L p D * < L p B * = L p C * .
(3) From Equations (24) and (31), we have δ 1 U * = δ 2 U * , σ 1 B * = σ 2 B * , τ 1 B * = τ 2 B * = 1 σ 1 B * = 1 σ 2 B * . In addition, we obtain δ 1 U * σ 1 B * = Π L 2 / 2 Π M + Π L Π M + Π L < 0 , δ 2 U * σ 2 B * = Π L 2 / 2 Π M + Π L Π M + Π L < 0 . Therefore, we have δ 1 U * < σ 1 B * , δ 2 U * < σ 2 B * . □
Proof of Corollary 2. 
Similarly to the proof of Corollary 1, Corollary 2 can be proved by subtracting the corresponding values of the AI-enabled maintenance service level, electric goodwill, and leasing demand under different cases and comparing the resulting differences with zero. □
Proof of Corollary 3. 
From Propositions 1~4, we have
M d C * / α = M d B * / α = θ Π M + Π L / η d ρ + γ > 0 ,
M d D * / α = M d U * / α = θ Π M / η d ρ + γ > 0 ,
M d C * / θ = M d B * / θ = α Π M + Π L / η d ρ + γ > 0 ,
M d D * / θ = M d U * / θ = α Π M / η d ρ + γ > 0 ,
Therefore, M d i * / α > 0 , M d i * / θ > 0 , where i C , D , U , B . Similarly, we can also prove the correlation of the optimal decision with other parameters, which will not be listed here in detail. □
Proof of Corollary 4. 
Observing the forms of Equations (13), (18), (25) and (32), the proof can be easily obtained. □
Proof of Corollary 5. 
From Propositions 1~4, we have
S C / α = S B / α = 2 α θ Π M + Π L / γ η d ρ + γ > 0 ,
S D / α = S U / α = 2 α θ Π M / γ η d ρ + γ > 0 ,
S C / θ = S B / θ = α 2 Π M + Π L / γ η d ρ + γ + β 2 Π M + Π L / γ ξ k ρ + γ > 0 ,
S U / θ = α 2 Π M / γ η d ρ + γ + β 2 2 Π M + Π L / 2 γ ξ k ρ + γ > 0 ,
S D / θ = α 2 Π M / γ η d ρ + γ + β 2 Π L / γ ξ k ρ + γ > 0 .
Therefore, S C / α > 0 , S C / θ > 0 , where i C , D , U , B . Similarly, we can also prove the correlation of the steady states of maintenance service level and electric goodwill with other relevant parameters, which will not be listed here in detail. □
Proof of Corollary 6. 
From Propositions 1~4, we can obtain that
V T C * V T D * = Π M + Π L θ ρ + γ S C * S D * + Π M + Π L ω ρ + ε G C * G D * + α 2 θ 2 Π L 2 2 ρ η d ρ + γ 2 + λ 2 ω 2 Π L 2 2 ρ η n ρ + ε 2 + β 2 θ 2 Π M 2 2 ρ ξ k ρ + γ 2 + μ 2 ω 2 Π M 2 2 ρ ξ p ρ + ε 2
V T C * V T U * = Π M + Π L θ ρ + γ S C * S U * + Π M + Π L ω ρ + ε G C * G U * + α 2 Π L 2 θ 2 2 ρ η d ρ + γ 2 + β 2 Π L 2 θ 2 8 ρ ξ k ρ + γ 2 + μ 2 ω 2 Π L 2 8 ρ ξ p ρ + ε 2 + λ 2 Π L 2 ω 2 2 ρ η n ρ + ε 2
V T U * V T D * = Π M + Π L θ ρ + γ S U * S D * + Π M + Π L ω ρ + ε G U * G D * + β 2 θ 2 4 Π M 2 Π L 2 8 ρ ξ k ρ + γ 2 + μ 2 ω 2 4 Π M 2 Π L 2 8 ρ ξ p ρ + ε 2
Combining Propositions 1~4, we know that when Π M > Π L / 2 , V T C * = V T B * > V T U * > V T D * . □
Proof of Corollary 7. 
(1) From Propositions 2 and 3, we can obtain that
V M U * V M D * = Π M θ ρ + γ S U * S D * + Π M ω ρ + ε G U * G D * + β 2 2 Π M Π L 2 θ 2 8 ρ ξ k ρ + γ 2 + μ 2 2 Π M Π L 2 ω 2 8 ρ ξ p ρ + ε 2
V L U * V L D * = Π L θ ρ + γ S U * S D * + Π L ω ρ + ε G U * G D * + β 2 θ 2 Π L 2 Π M Π L 4 ρ ξ k ρ + γ 2 + μ 2 ω 2 Π L 2 Π M Π L 4 ρ ξ p ρ + ε 2
We also know when Π M > Π L / 2 , then S U > S D , G U > G D . So, we can obtain that, when Π M > Π L / 2 , we have V M U * > V M D * , V L U * > V L D * . Therefore, when Π M > Π L / 2 , the unilateral cost-sharing contract is feasible.
(2) From Propositions 2 and 4, we can obtain that
V M B * V M D * = Π M θ ρ + γ S B * S D * + Π M ω ρ + ε G B * G D * + α 2 θ 2 Π M Π L 2 ρ η d ρ + γ 2 + λ 2 ω 2 Π M Π L 2 ρ η n ρ + ε 2 + β 2 θ 2 Π M Π M Π L 2 ρ ξ k ρ + γ 2 + μ 2 ω 2 Π M Π M Π L 2 ρ ξ p ρ + ε 2
V L B * V L D * = Π L θ ρ + γ S B * S D * + Π L ω ρ + ε G B * G D * + α 2 θ 2 Π L Π L Π M 2 ρ η d ρ + γ 2 + λ 2 ω 2 Π L Π L Π M 2 ρ η n ρ + ε 2 + β 2 θ 2 Π M Π L 2 ρ ξ k ρ + γ 2 + μ 2 ω 2 Π M Π L 2 ρ ξ p ρ + ε 2
Based on the above two formulas, it is difficult to determine the conditions of V M B * V M D * 0 or V L B * V L D * 0 . To ensure that both the manufacturer and the lessor benefit from the bilateral cost-sharing contract in Case B, we need to further improve the bilateral cost-sharing contract. According to Corollary 7, we can see V T C * = V T B * . Although it is unknown whether the respective profits of the manufacturer and the lessor are higher than the profits of decentralized decision, it is certain that the total profit of the whole supply chain is improved in Case B and reaches the total profit in the centralized decision. Therefore, we add a profit redistribution mechanism to Case B. In Case B, we assume that the profit redistribution proportion of the manufacturer is χ ( 0 < χ < 1 ) , and the lessor receives the remaining profit. Through the profit redistribution mechanism, the manufacturer’s and the lessor’s profits are V M B * = χ V T B * and V L B * = 1 χ V T B * . To ensure that the bilateral cost-sharing contract is effective, it is necessary to make χ V T B * V M D * and  1 χ V T B * V L D * . By solving these two inequalities, we can obtain χ V M D * / V T B * , 1 V T D * / V T B * ; then, the bilateral cost-sharing contract is feasible. □

References

  1. Kang, K.; Tan, B.Q. Carbon emission reduction investment in sustainable supply chains under cap-and-trade regulation: An evolutionary game-theoretical perspective. Expert Syst. Appl. 2023, 227, 120335. [Google Scholar] [CrossRef]
  2. Li, C.Z.; Tam, V.W.; Ma, M.X.; Wen, S. Carbon emission analysis and multi-objective optimization of modular integrated construction using petri net simulation. Energy Build. 2025, 339, 115784. [Google Scholar] [CrossRef]
  3. Lai, K.E.; Rahiman, N.A.; Othman, N.; Ali, K.N.; Lim, Y.W.; Moayedi, F.; Dzahir, M.A.M. Quantification process of carbon emissions in the construction industry. Energy Build. 2023, 289, 113025. [Google Scholar] [CrossRef]
  4. Li, D.; Huang, G.; Zhang, G.; Wang, J. Driving factors of total carbon emissions from the construction industry in Jiangsu Province, China. J. Clean. Prod. 2020, 276, 123179. [Google Scholar] [CrossRef]
  5. Li, L.J.; Chen, K.H. Quantitative assessment of carbon dioxide emissions in construction projects: A case study in Shenzhen. J. Clean. Prod. 2017, 141, 394–408. [Google Scholar] [CrossRef]
  6. Yang, L.; Chen, H.Y. Research on factors influencing total carbon emissions of construction based on structural equation modeling: A case study from China. Build. Environ. 2025, 275, 112396. [Google Scholar] [CrossRef]
  7. Zhao, Y.Y.; Li, C.Z.; Shen, G.Q.; Teng, Y.; Wu, H.Q.; Liu, R.S. Managing carbon emissions in construction: Current status and emerging trends. Renew. Sust. Energy Rev. 2025, 211, 115237. [Google Scholar] [CrossRef]
  8. Liu, Z.S.; Li, M.T.; Wang, J.J.; Ji, W.Y. A hybrid simulation modelling approach for construction carbon emissions based on digital twins. J. Clean. Prod. 2025, 522, 146329. [Google Scholar] [CrossRef]
  9. Shu, Z.; Zhou, Y.L.; Liu, W.H.; Li, H.; Li, Z.; Hu, Q.F. Multi-objective optimization approach for timber-concrete hybrid shear wall building structures considering construction cost and carbon emissions. Structures 2025, 78, 109221. [Google Scholar] [CrossRef]
  10. Aurangzeb, I.; Yoon, J.H. Artificial intelligence- and blockchain-enabled carbon emissions ledger system (AB-CELS) for sustainable construction processes. Automat. Constr. 2025, 176, 106286. [Google Scholar] [CrossRef]
  11. Schmidt, J.R.; Cheein, F.A. Assessment of power consumption of electric machinery in agricultural tasks for enhancing the route planning problem. Comput. Electron. Agr. 2019, 163, 104868. [Google Scholar] [CrossRef]
  12. Huang, X.H.; Yan, W.B.; Cao, H.J.; Chen, S.J.; Tao, G.B.; Zhang, J. Prospects for purely electric construction machinery: Mechanical components, control strategies and typical machines. Automat. Constr. 2024, 164, 105477. [Google Scholar] [CrossRef]
  13. Zhang, H.X.; Wang, F.; Xu, B.; Fiebig, W. Extending battery lifetime for electric wheel loaders with electric-hydraulic hybrid powertrain. Energy 2022, 261, 125190. [Google Scholar] [CrossRef]
  14. Wang, F.; Wen, Q.Y.; Xu, X.Z.; Xu, B.; Sun, Z.X. Site Operation Strategy for Wheel Loader/Truck Loading and Transportation Cycle. IEEE Trans. Veh. Technol. 2021, 70, 4129–4138. [Google Scholar] [CrossRef]
  15. Huang, X.H.; Huang, Q.; Cao, H.J.; Wang, Q.Y.; Yan, W.B.; Cao, L. Battery capacity selection for electric construction machinery considering variable operating conditions and multiple interest claims. Energy 2023, 275, 127454. [Google Scholar] [CrossRef]
  16. Huang, X.H.; Yan, W.B.; Tao, G.B.; Chen, S.J.; Cao, H.J. Energy-efficient configuration and scheduling framework for electric construction machinery collaboration systems. Automat. Constr. 2024, 168, 105808. [Google Scholar] [CrossRef]
  17. Zhao, J.H.; Ke, R.; Xu, Z.; Shi, J. Pricing and coordination of automotive supply chain for incorporating efficient charging facilities. Energy Rep. 2022, 8, 13814–13823. [Google Scholar] [CrossRef]
  18. Yin, J.; Fang, Y.F.; Zhang, H.X.; Wang, T.T. Pricing and Coordination for the Leasing and Recycling of Construction Machinery in a Supply Chain Based on Industrial Internet Platform. Buildings 2023, 13, 1685. [Google Scholar] [CrossRef]
  19. Singh, S.; Misra, S.C.; Singh, G. Adaptive supplier selection framework for sustainable and resilient additive manufacturing supply chains. J. Ind. Inf. Integr. 2025, 47, 100882. [Google Scholar] [CrossRef]
  20. Ni, H.P.; Liu, C.Y.; Paul, F.; Chong, W.O.; Chou, J.S. Enhancing supply chain resilience and efficiency of HVAC systems in semiconductor manufacturing facilities using graph-based large multimodal models. Appl. Energy 2025, 398, 126420. [Google Scholar] [CrossRef]
  21. Taleizadeh, A.A.; Tavana, M.; Sadeghi, R.; Abedsoltan, H. A knowledge-driven pricing model for supply chain coordination under correlated demand. Expert Syst. Appl. 2026, 310, 131290. [Google Scholar] [CrossRef]
  22. Zheng, W.J.; Lin, T.L.; Li, Z.S.; Wang, D.; Chen, Q.H.; Ren, H.L.; Fu, S.J.; Miao, C.; Fu, X.R. Transformer-based energy-saving method for intelligent identification of electric construction machinery working cycle stage. Energy 2025, 341, 139353. [Google Scholar] [CrossRef]
  23. Yi, H.W.; Cui, Y.Y.; Li, H.; Huang, G.H.; Liu, K.Y.; Qu, L.Z.; Yan, J.; Nie, L.; Xue, Y.F. Assessing the feasibility and environmental benefits of electrifying construction machinery in Beijing, China. J. Environ. Sci. 2026, 159, 374–382. [Google Scholar] [CrossRef] [PubMed]
  24. Trinh, H.A.; Truong, H.V.A.; Do, T.C.; Nguyen, M.H.; Phan, V.D.; Ahn, K.K. Optimization-based energy management strategies for hybrid construction machinery: A review. Energy Rep. 2022, 8, 6035–6057. [Google Scholar] [CrossRef]
  25. Sun, Y.-F.; Zhang, Y.-J.; Su, B. Impact of government subsidy on the optimal R&D and advertising investment in the cooperative supply chain of new energy vehicles. Energy Policy 2022, 164, 112885. [Google Scholar] [CrossRef]
  26. Yi, Y.; Zhang, M.; Zhang, A.; Li, Y. Can “dual credit” replace “subsidies” successfully? -based on analysis of vehicle supply chain decisions under the digital transformation of technology. Energy Econ. 2024, 130, 107303. [Google Scholar] [CrossRef]
  27. Zhang, H.; Chun, W.; Yuan, X.-M.; Liu, W.; Chou, M.C. The governance of irresponsible new energy vehicle members considering differentiated subsidies. Sustain. Cities Soc. 2024, 104, 105289. [Google Scholar] [CrossRef]
  28. Zhao, J.-H.; Zeng, D.-L.; Che, L.-P.; Zhou, T.-W.; Hu, J.-Y. Research on the profit change of new energy vehicle closed-loop supply chain members based on government subsidies. Environ. Technol. Innov. 2020, 19, 100937. [Google Scholar] [CrossRef]
  29. Dong, W.; Shao, C.; Li, X.; Zhu, D.; Zhou, Q.; Wang, X. Integrated planning method of green hydrogen supply chain for hydrogen fuel cell vehicles. Int. J. Hydrogen Energy 2023, 48, 18385–18397. [Google Scholar] [CrossRef]
  30. Hajiaghaei-Keshteli, M.; Rahmanifar, G.; Mohammadi, M.; Gholian-Jouybari, F.; Klemes, J.J.; Zahmatkesh, S.; Bokhari, A.; Fusco, G.; Colombaroni, C. Designing a multi-period dynamic electric vehicle production-routing problem in a supply chain considering energy consumption. J. Clean. Prod. 2023, 421, 138471. [Google Scholar] [CrossRef]
  31. Feng, Z.; Li, F.; Tan, C. Supplier development or supplier integration? Equilibrium analysis in competing electric vehicle supply chains with power battery recycling. Expert Syst. Appl. 2024, 238, 121519. [Google Scholar] [CrossRef]
  32. Zhang, W.; Zhu, L.; Liu, X.; Wang, W.; Song, H. Optimal strategies in electric vehicle battery closed-loop supply chain considering government subsidies and echelon utilization. J. Energy Storage 2024, 99, 113341. [Google Scholar] [CrossRef]
  33. Zhang, W.; Bi, C.; Yang, F. Purchasing or leasing? Equipment upgrades for a capital-constrained manufacturer. J. Environ. Manag. 2025, 373, 123635. [Google Scholar] [CrossRef] [PubMed]
  34. Yin, J.; Fang, Y.; Zhang, H.; Wang, T.; Cai, S. Pricing and Coordinating the Lease-Oriented Closed-Loop Supply Chain for Construction Machinery in the Era of Carbon Tax. Buildings 2023, 13, 2145. [Google Scholar] [CrossRef]
  35. Yin, J.; Chen, H.; Zhang, J.; Wang, T.; Cai, S. Coordinating Construction Machinery Leasing Supply Chains Under Integrated Installation-Dismantling Services: A Game-Theoretic Approach with Profit-Cost Sharing Contracts. Buildings 2025, 15, 1217. [Google Scholar] [CrossRef]
  36. Ren, F.; Hu, B. Decisions and coordination in low-carbon supply chains with a wholesale price constraint under government subsidies. Int. J. Prod. Econ. 2024, 277, 109407. [Google Scholar] [CrossRef]
  37. Wang, J.H.; Cai, X.Y. Research on Decision-Making and Coordination of Closed-Loop Supply Chain Under Green and Low-Carbon Perspective. Sustainability 2024, 16, 10591. [Google Scholar] [CrossRef]
  38. Zhang, M.; Yi, Y.; Fu, A.; Li, Y. Optimal investment and coordination strategies for digital technology adoption in a dual-channel supply chain. Comput. Ind. Eng. 2024, 193, 110289. [Google Scholar] [CrossRef]
  39. Ma, X.; Zhao, Y.; Luo, Q.; Bai, Q. Preservation technology investment and carbon abatement strategies in a supplier-retailer cold chain based on a differential game. Comput. Ind. Eng. 2022, 172, 108540. [Google Scholar] [CrossRef]
  40. Wang, Y.; Xu, X.; Zhu, Q. Carbon emission reduction decisions of supply chain members under cap-and-trade regulations: A differential game analysis. Comput. Ind. Eng. 2021, 162, 107711. [Google Scholar] [CrossRef]
  41. Zhu, C.; Xi, X.; Goh, M. Differential game analysis of joint emission reduction decisions under mixed carbon policies and CEA. J. Environ. Manag. 2024, 358, 120913. [Google Scholar] [CrossRef]
  42. Li, C.; Yi, Y.; Zhang, A.; Chen, B. Fuel consumption-reduction investment decisions and coordination contracts in fuel vehicle supply chains: A dynamic analysis. Energy Econ. 2023, 125, 106799. [Google Scholar] [CrossRef]
  43. Kang, Y.; Dong, P.; Ju, Y.; Zhang, T. Differential game theoretic analysis of the blockchain technology investment and carbon reduction strategy in digital supply chain with government intervention. Comput. Ind. Eng. 2024, 189, 109953. [Google Scholar] [CrossRef]
  44. Kholaif, M.; Gu, W.; Tang, X.M.; Salama, W.H. Post-emergencies opportunities for green supply chain management and urban supply chains’ robustness; the moderating influence of blockchains as a sustainable urban resources management technique. J. Clean. Prod. 2024, 475, 143646. [Google Scholar] [CrossRef]
  45. Wang, S.; Zhu, D.L.; Liu, C.; Li, Y.R. A differential game approach to the low-carbon chains considering the role of shareholding. Environ. Dev. Sustain. 2024, 26, 31577–31600. [Google Scholar] [CrossRef]
  46. Sun, L.C.; Xu, X.J. The role of digital enablement in linking low-carbon practices to supply chain resilience and performance. Int. J. Logist. Res. Appl. 2025, 1–20. [Google Scholar] [CrossRef]
  47. Li, L.X.; Liu, Y.Q.; Jin, Y.; Cheng, T.C.E.; Zhang, Q.J. Generative AI-enabled supply chain management: The critical role of coordination and dynamism. Int. J. Prod. Econ. 2024, 277, 109388. [Google Scholar] [CrossRef]
  48. Liang, K.; Zhao, J.H.; Zhang, Z.Q.; Guan, W.; Pan, M.Z.; Li, M.T. Data-driven AI algorithms for construction machinery. Automat. Constr. 2024, 167, 105648. [Google Scholar] [CrossRef]
  49. Zheng, Z.; Wang, F.; Gong, G.; Yang, H.; Han, D. Intelligent technologies for construction machinery using data-driven methods. Automat. Constr. 2023, 147, 104711. [Google Scholar] [CrossRef]
  50. Thoppil, N.M.; Vasu, V.; Rao, C.S.P. Deep Learning Algorithms for Machinery Health Prognostics Using Time-Series Data: A Review. J. Vib. Eng. Technol. 2021, 9, 1123–1145. [Google Scholar] [CrossRef]
  51. Yu, Y.; Umer, W.; Yang, X.; Antwi-Afari, M.F. Posture-related data collection methods for construction workers: A review. Automat. Constr. 2021, 124, 103538. [Google Scholar] [CrossRef]
  52. Wang, Y.Y.; Gao, J.H.; Cheng, T.C.E.; Jin, M.Z.; Yue, X.H.; Wang, H.J. Is it necessary for the supply chain to implement artificial intelligence-driven sales services at both the front-end and back-end stages? Transp. Res. Part E Logist. Transp. Rev. 2025, 194, 103923. [Google Scholar] [CrossRef]
  53. Hussain, J.; Lee, C.-C.; Lev, B. Optimizing AI-based emission reduction efficiency and subsidies in supply chain management: A sensitivity-based approach with duopoly game dynamics. J. Clean. Prod. 2025, 494, 144991. [Google Scholar] [CrossRef]
  54. Yao, X.; Li, X.; Mangla, S.K.; Song, M. Roles of AI: Financing selection for regretful SMEs in e-commerce supply chains. Transp. Res. Part E Logist. Transp. Rev. 2024, 189, 103649. [Google Scholar] [CrossRef]
  55. He, P.; Wang, T.-Y.; Mardani, A.; Wang, X.-J.; Chen, Z.-S. Selling mode selection and AI service strategy in an E-commerce platform supply chain. Comput. Ind. Eng. 2024, 197, 110560. [Google Scholar] [CrossRef]
  56. Mardyana, R.; Mahata, G.C. Implementations of AI technology and profit-sharing contract for sustainability development and customer experience improvement: A differential game approach. Expert Syst. Appl. 2025, 275, 126920. [Google Scholar] [CrossRef]
  57. Ma, D.; Hu, J.; Yao, F. Big data empowering low-carbon smart tourism study on low-carbon tourism O2O supply chain considering consumer behaviors and corporate altruistic preferences. Comput. Ind. Eng. 2021, 153, 107061. [Google Scholar] [CrossRef]
  58. Long, J.; Wang, F. Complexity of a two-stage R&D game within a cluster supply chain considering vertical R&D spillovers, effective information, and government subsidies. Math. Comput. Simul. 2024, 221, 606–621. [Google Scholar]
  59. Li, L.F.; Wu, J.Y.; Zhu, M.T.; Wang, M.C.; Li, Y.Y. Stochastic Differential Games of Carbon Emission Reduction in the Four-Tier Supply Chain System Based on Reference Low-Carbon Level. Sustainability 2024, 16, 8674. [Google Scholar] [CrossRef]
  60. Ma, D.; Hu, J. The optimal combination between blockchain and sales format in an internet platform-based closed-loop supply chain. Int. J. Prod. Econ. 2022, 254, 108633. [Google Scholar] [CrossRef]
  61. Tu, J.; Gao, F.; Huang, M. Dynamic quality and advertising strategies in product-harm crises: The role of supply chain power structure. Comput. Ind. Eng. 2024, 192, 110243. [Google Scholar] [CrossRef]
Figure 1. Time trajectories of AI-enabled maintenance service level under different cases.
Sustainability 18 03722 g001
Figure 2. Time trajectories of AI-enabled maintenance service level under different cases.
Sustainability 18 03722 g002
Figure 3. The impacts of key parameters on maintenance service level. (a) The impact of α on S; (b) The impact of β on S; (c) The impact of ξk on S; (d) The impact of γ on S.
Sustainability 18 03722 g003
Figure 4. The impacts of key parameters on electric goodwill. (a) The impact of λ on G; (b) The impact of μ on G; (c) The impact of ηn on G; (d) The impact of ξp on G.
Sustainability 18 03722 g004
Figure 5. Time trajectories of leasing demand under different cases. (a) When S0 = 5 and G0 = 10; (b) When S0 = 55 and G0 = 5.
Sustainability 18 03722 g005
Figure 6. The impacts of key parameters on leasing demand. (a) The impact of β and μ on D; (b) The impact of ηn and ξk on D.
Sustainability 18 03722 g006
Figure 7. The impacts of key parameters on profit. (a) The impact of θ and ω on total profit; (b) The impact of ΠM and ΠL on manufacturer’s profit; (c) The impact of ΠM and ΠL on lessor’s profit; (d) The advantages of contracts in enhancing profits.
Sustainability 18 03722 g007
Figure 8. The impacts of key parameters on the cost-sharing proportion. (a) The impact of ΠM and ΠL on cost-sharing proportion in Case U and Case B; (b) The impact of ΠM and ΠL on cost-sharing proportion in Case B.
Sustainability 18 03722 g008
Table 1. Notations and Descriptions.
NotationsDescriptions
Decision variables
Mn(t), Md(t) The manufacturer’s R&D technology investment and AI-enabled O&M effort for electric construction machinery, respectively
Lp(t), Lk(t) The lessor’s advertising effort and AI-enabled maintenance effort for electric construction machinery, respectively
δ1(t), δ2(t)AI-enabled maintenance effort cost-sharing proportion and advertising effort cost-sharing proportion of the manufacturer in Case U, respectively, 0 ≤ δ1(t) ≤ 1, 0 ≤ δ2(t) ≤ 1
σ1(t), σ2(t)AI-enabled maintenance effort cost-sharing proportion and advertising effort cost-sharing proportion of the manufacturer in Case B, respectively, 0 ≤ σ1(t) ≤ 1, 0 ≤ σ2(t) ≤ 1
τ1(t), τ2(t)AI-enabled O&M effort cost-sharing proportion and R&D technology investment cost-sharing proportion in Case B, respectively, 0 ≤ τ1(t) ≤ 1, 0 ≤ τ2(t) ≤ 1
State variables
S(t), G(t)AI-enabled maintenance service level and electric goodwill at time t, respectively
Other parameters
D(t)Leasing demand of electric construction machinery at time t
ΠM, ΠLThe marginal profits of the manufacturer and the lessor, respectively, ΠM > 0, ΠL > 0
Cn, CdCosts of the manufacturer’s R&D technology investment and AI-enabled O&M effort, respectively
Cp, CkCosts of the lessor’s advertising and AI-enabled maintenance, respectively
ηn, ηdCost coefficients of the manufacturer’s R&D technology investment and AI-enabled O&M effort, respectively, ηn > 0, ηd > 0
ξp, ξkCost coefficients of the lessor’s advertising effort and AI-enabled maintenance effort, respectively, ξp > 0, ξk > 0
αSensitivity of the AI-enabled maintenance service level to the AI-enabled O&M effort, α > 0
βSensitivity of the AI-enabled maintenance service level to the AI-enabled maintenance effort, β > 0
γDecay rate of the AI-enabled maintenance service level, γ > 0
λSensitivity of the electric goodwill to the R&D technology investment, λ > 0
μSensitivity of the electric goodwill to the advertising effort, μ > 0
εDecay rate of the electric goodwill, ε > 0
θSensitivity of the leasing demand to the AI-enabled maintenance service level, θ > 0
ωSensitivity of the leasing demand to the electric goodwill, ω > 0
χThe manufacturer’s profit-sharing proportion in Case B
PM, PL, PTObjective functions of the manufacturer, the lessor, and the whole supply chain, respectively
VM, VL, VTThe optimal profits of the manufacturer, the lessor, and the whole supply chain, respectively
Disclaimer/Publisher’s Note: The statements, opinions and data contained in all publications are solely those of the individual author(s) and contributor(s) and not of MDPI and/or the editor(s). MDPI and/or the editor(s) disclaim responsibility for any injury to people or property resulting from any ideas, methods, instructions or products referred to in the content.