1. Introduction
Growing environmental problems necessitate more rational use of available resources and the development of innovative solutions to achieve sustainability. In recent years, there has been growing concern about rapid climate change and loss of biodiversity. These phenomena are closely related to the development of business activities and the degradation of natural resources, land, and ecosystems. Soil, air, and water pollution are directly related to the use of outdated technology and equipment, low energy efficiency, and insufficient investment in the maintenance and replacement of resources. To encourage the transition to a sustainable economy and to solve major environmental and social challenges, multi-level efforts are necessary. The aim is to have a modern economic system based on environmental protection, which encourages economic entities and policymakers to look beyond economic efficiency and prioritize more efficient resource use.
Given the need to balance economic growth with the conservation of natural resources [
1], sustainable development is a globally important solution. The concept of sustainable development, which includes not only the economic but also the social and environmental dimensions, has begun to attract increasing attention. It is important to integrate environmental resilience, economic growth, and social inclusion to protect the interests of the present and ensure the well-being of future generations [
2].
The first steps are being taken toward sustainable development, and the concept of the circular economy (CE) has emerged as an effective instrument in this transition. The concept of CE, which appeared in the 1960s, was developed as a viable alternative to the linear model and is increasingly accepted by scientists and practitioners [
3]. It is based on the principle of “take–use–reuse”, which aims to extend the life of products and use waste as a useful resource. The goal is to reduce the negative environmental impact of production and consumption. The application of the CE concept contributes to the structural changes needed to implement sustainability initiatives [
4].
The linear economic system, which remains dominant, extracts resources from the environment and disposes of them after processing and use [
5], while CE asks how primary resources can be replaced with recycled materials or components that can be reused [
6].
The transition to a CE means accepting major changes in production and consumption systems and investing significant effort in innovation activities, technological, organizational, and systemic [
7]. CE is expected to bring numerous benefits, both environmental and economic. CE represents an innovative economy that includes greater technological development, better materials, a new workforce, energy efficiency, etc. [
8]. Job creation and employment should be a very important social and economic contribution [
9]. As the macroeconomic impact of the new economic model can be very significant, it is gaining popularity among business leaders and policymakers.
However, according to European Union data, only 7.2% of the global economy is circular [
10], so policymakers are working intensively to provide a solid basis for this shift. The European Commission adopted the first European Union CE Action Plan in December 2015 [
11], which sets priorities for sustainable economic development. The continuation of this path is the adoption of the European Green Deal in 2019, which represents a guideline for the EU to become a “modern, resource-efficient and competitive economy” [
12]. The aim of the EU’s transition to a CE is to reduce pressure on natural resources, create sustainable growth and jobs, achieve climate neutrality, and halt biodiversity loss, in line with the Green Deal [
13]. A year later, a new CE action plan was adopted [
14]. The new action plan aims to embrace circular practices throughout the entire product life cycle—from the way products are designed to ensuring that waste is prevented after use.
Furthermore, the Circular Economy Act is expected to be adopted in 2026 [
15], building on the second CE Action Plan. As the EU’s dependence on imports of strategic resources is significant, the Act, which puts resource scarcity, growing waste, and global competitiveness at the forefront, will help transform current environmental challenges into strategic opportunities [
15]. The CE implies less use of natural resources and reduced dependence on imports, but also an opportunity to increase competitiveness, create new jobs, and generate business opportunities [
16]. The Circular Economy Act will be an instrument of competitiveness, unlike previous action plans that were part of environmental protection policy. This law emphasizes the role of the CE in combating the challenges of economic security, the ecological crisis, and industrial competitiveness [
15]. The successful implementation of the CE in the European Union (EU) depends on effective, harmonized policies among member states.
Since the CE can be applied across many areas and should affect the environment, economy, and society, these impacts need to be monitored and measured. It is important to record the impacts achieved at both the micro and macro levels, a task that can be challenging. The degree of development and diversity in the application of the CE can be seen in the movement of the basic indicators measuring its success. With the Action Plan for the CE from 2015 [
11], the European Commission established a framework for systematic monitoring of results and progress in this area. Since then, this plan has been a basic instrument for analyzing and comparing the performance of member states. By further improving the methodology, the EU introduced new indicators covering the priority areas of the CE, in accordance with the goals of the 2020 Action Plan [
13].
The volume of literature that follows the progress of the CE is growing. In their research paper [
17], the authors use clustering methods to rank EU countries by CE development levels. Refs. [
18,
19] apply the multi-criteria methodology and composite indicators to get national rankings. Although there are papers that address the ranking of EU countries based on achieved CE performance, gaps remain. Unlike existing research, this paper presents an integrated approach combining cluster analysis and MCDM. The applied methodology first categorizes EU countries into clusters, then applies MCDM to rank them within each cluster, thereby ensuring greater comparability. In this way, the paper presents an innovative approach to ranking the circularity of EU countries using selected indicators: (i) private investment related to CE sectors; (ii) persons employed in CE sectors; and (iii) gross value added as a percentage of GDP. The advantages of the PROMETHEE method in the context of circular economy indicators are reflected in its flexibility and its ability to handle preference functions and indifference thresholds. A large number of papers do not account for the heterogeneity among the countries included in the analysis. Also, most of the existing literature relies on isolated environmental indicators to monitor progress; however, there remains a gap in comparing socio-economic performance across EU countries, which this paper seeks to fill using the selected indicators.
Based on the above, the research aims to analyze and compare various aspects of CE implementation across EU countries using PROMETHEE and the cluster approach. The focus of the research was the classification of EU countries by the degree of progress in implementing the CE concept. The analysis is based on the CE indicators proposed by the European Commission and covers all EU member states.
In line with the main objective, this paper starts from the following questions:
The structure of the article is as follows: after the introduction,
Section 2 provides an overview of the literature review and empirical background.
Section 3 describes the materials and methods used in this research paper.
Section 4 presents clustering and MCDM ranking results.
Section 5 presents the research results, while
Section 6 highlights the conclusions and implications for future research.
2. Literature Review
The development of the CE in EU member states can be viewed through the lens of the institutional and economic context, taking into account the ecological modernisation approach, which emphasises the possibility of harmonising economic development and environmental protection through technological and institutional changes [
20]. In this paper, the focus is on three indicators: private investments in sectors of the CE, the number of employees in those sectors, and the gross value added they generate. This enables an assessment of the dynamics and economic importance of the CE sector and sets the basis for further analysis in the next part of the research.
The CE should primarily bring environmental benefits to systems that are ready for this transition (reductions in greenhouse gas emissions, raw material consumption, and waste) [
21]. Investments in the sustainable economy sector and employment of the workforce in secondary raw materials are key drivers of CE principle adoption.
But in addition to environmental benefits, the transition to a new economic system is also seen as an opportunity to achieve economic gains. The goal is to answer, from a macro-level perspective, how selected indicators contribute to national competitiveness. The mentioned indicators were chosen to compare the economic effects of the transition, not only the environmental ones. Private investments provide the capital needed to implement new technologies and circular business models. Monitoring gross value added helps in understanding the contribution of the transition to the CE to the competitiveness of national economies. At the same time, the employment indicator contributes to understanding its socio-economic effects.
The CE could be a significant driver of job creation and economic growth [
22]. The CE seeks to change the traditional use of resources to improve environmental and social performance through reduced resource consumption and improved waste management, and to achieve a positive impact on financial performance [
23]. Thus, higher economic growth is expected through a combination of increased revenues from circular activities and lower production costs resulting from more efficient, productive use of resources [
8,
24].
Numerous studies in the literature [
25,
26] have examined the impact of the CE or its indicators on economic growth. The results indicate interdependence, and most studies confirm that CE indicators affect economic growth. The transition to a CE, with effects such as reduced resource extraction and waste minimization, is expected to bring potentially significant positive consequences for economic growth or overall employment, or at least not to produce negative effects [
22]. Such effects can be expected at the level of the overall economy [
27], but this does not necessarily mean that the CE will produce positive effects in all its parts; some countries, sectors, or areas may benefit more than others [
22]. These different effects indicate that the implementation of CE practices may not be equally successful in all EU countries. Some researchers [
28] indicate that the development of circular business in the EU member states is closely linked to the degree of digitalisation and the level of investment in research and innovation [
29]. However, the successful implementation of circular business models depends not only on technological factors but also on the institutional and social capacities that enable their effective implementation. Some researchers [
30] found that Northern and Western Europe, led by Germany and Sweden, show a high level of circular economy deployment, supported by strong innovation ecosystems. In contrast, the Eastern and Southern regions face structural problems, including weak institutions and limited R&D activity. Additionally, results from selected EU case studies conducted by some authors [
31] show that obstacles to CE implementation vary with countries’ levels of development. In Romania, the main problems are inadequate investment, limited access to modern technologies, low public involvement in pro-environmental actions, and insufficient infrastructure and resources. In Poland, challenges related to regional disparities and slower policy implementation are more pronounced, while the Netherlands faces challenges in improving efficiency and further system development. According to [
32], the main challenges in implementing the circular economy in the EU are cultural barriers, including low consumer interest and awareness, as well as caution in business culture. These barriers are also influenced by market barriers, which arise from insufficiently coordinated state interventions needed to accelerate the transition to circular models. Although these findings are based on a limited number of cases, they point to differences between less developed and developed member states.
In the study [
26], it was shown that environmental efficiency indicators, such as efficient use of materials and recycling, positively affect GDP growth in EU countries. These findings support the theory that economies that optimize resource use and reduce waste through recycling can simultaneously achieve economic growth and improve environmental sustainability. Similar results were confirmed by [
33], which noted that innovative approaches to environmental efficiency, including the use of secondary raw materials and improvements in technological processes, contribute to increased GDP. Some authors [
34] investigated the connection between GDP and the application of circular practices, such as waste recycling and the use of renewable materials. Their analysis shows that eco-efficiency not only reduces pressure on natural resources and environmental burdens but also supports economic growth, confirming the mutual benefits of circular innovation for the economy and the environment. Using panel data from the EU Monitoring Framework and the World Bank database covering the 27 EU countries from 2000 to 2021, some authors [
35] have examined the impact of CE indicators on GDP per capita. Based on the correlation results, the research indicated a strong positive relationship between CE development and GDP per capita.
Monitoring the gross value added as a percentage of GDP generated by CE sectors helps to understand the economic transition to a new model, as well as the long-term economic impact and growth potential of the CE sector. A higher gross value added indicates that CE sectors contribute significantly to GDP, that the economy is more oriented towards sustainability, and that circular practices are more integrated into the economic structure [
36]. Based on gross value added, policymakers can assess the extent to which the transition to CE contributes to economic development and resilience [
37].
Private investment and gross value added in CE sectors encourage innovation and the development of the infrastructure necessary to implement circular practices. Although private investment and gross value added in sectors related to the CE (recycling, repair and reuse, rental and leasing) grew by 36% and 15% in real terms between 2010 and 2023, it is estimated that there are significantly higher investment needs to implement the transition to a CE in the EU successfully [
38].
Private investment in sectors linked to the CE is known to be a key driver of its implementation, financing recycling processes, eco-design, the adoption of renewable energy sources, energy accessibility, and waste reduction [
39]. It is necessary to analyze private investments in CE sectors better to understand their importance for the transition to CE models. Greater investments should result in more circular products, services, and jobs [
37]. Countries characterized by greater economic complexity are notable for having greater investments in eco-innovation, which in turn enhances their capacity to implement circular practices [
40,
41].
Some authors [
42] have found that private investments in circular technologies and in improving resource productivity are key factors with positive and significant effects on the growth and development of gross value added in the environmental goods and services (EGSS) sector. According to the European Environment Agency [
38], private capital invested in CE infrastructure has grown steadily in recent years, leading to a positive trend in gross value added in the EGSS sector. Empirical findings show that investments in circular technologies significantly improve productivity and generate additional economic value across related sectors of the economy [
43]. Some researchers [
44] used panel regression (OLS with robust errors) on a sample of 27 EU countries over the period 2010–2022 to examine the determinants of the use of circular materials. They concluded that there is a positive, moderate relationship between the level of private investment and the use of circular materials, with Germany and France making rapid progress in adopting the CE.
In addition, new investments in more efficient processes, whether from public spending or private savings, can spur job creation, leading to higher aggregate incomes, additional consumption, and higher aggregate output [
22]. The CE has great potential for job creation, due to the need for new professions, the so-called “circular” or “green jobs”. Green jobs are activities aimed at measuring, preventing, limiting, minimizing, or correcting ecological problems [
45]. While green jobs encompass a wide range of jobs that contribute to environmental protection, circular jobs include all occupations that directly or indirectly support the CE [
46]. Direct circular jobs include activities that close material cycles, such as repair, renewable energy, and waste management, while jobs that support these processes include education, design, leasing, and digital technologies. Indirect circular jobs are found in sectors that do not directly participate in circular activities but support the implementation of CE strategies, for example, in logistics, information services, and the public sector [
46]. Eurostat’s indicator—persons employed in CE sectors tracks employment in these sectors (% of total employment and as full-time equivalent—FTE), providing quantitative insight into the CE and clearly distinguishing these jobs from the broader category of green jobs. According to some authors [
47], circular jobs are measured by the number of full-time equivalent (FTE) employees and by their share of total employment in the recycling, repair, reuse, and rental sectors.
Based on an analysis of a sample of 10,392 EU28 companies that implemented at least one CE-related activity, some authors [
48] found that CE-focused actions, energy efficiency, and waste reduction are positively correlated with employment in the green economy. At the same time, it was found that material reuse and redesign practices are particularly significant, as they contribute not only to a higher likelihood of green employment but also to an increase in the total number of green jobs [
48]. Using multilevel logistic regression, some authors [
49] (p. 69) have found that companies that implement resource-efficiency actions are more likely to employ workers in green jobs.
The activities promoted by the CE (repair, regeneration and recycling) are often more labor-intensive than linear processes [
9], which results in the creation of new jobs that also require new skills [
50], such as technical repair skills, knowledge of materials, reverse logistics management, etc. Green business sectors require workers to acquire new skills and actively participate in the constant development and adaptation of companies. These changes are happening rapidly and bring numerous challenges. If employees are not adequately trained or their competencies do not align with market needs, their efficiency declines, leading to reduced productivity and a slowdown in organizational development [
51]. The CE can create local jobs at different skill levels, thereby increasing opportunities for social integration and cohesion [
11]. In addition to the impact of this transition on the creation of new jobs in industries directly related to the CE, such as recycling, repair, and remanufacturing, there is also a need for labor in related areas, such as sustainability consulting services [
52]. To successfully transition from a linear to a CE, which also entails reallocating workers from linear to circular sectors, an adequate approach to acquiring new skills and implementing related policy measures is needed [
9].
The CE Action Plan estimates that 700,000 new jobs will be created between 2015 and 2030 through new activities, and that over 420,000 jobs have already been created between 2015 and 2021 [
53]. Countries that are more advanced in implementing circular policies have seen an increase in employment, especially among small and medium-sized enterprises [
42].
Employment in sectors such as waste management, recycling, and resource recovery in the EU is a significant indicator of the practical application of CE principles [
54]. The number of people employed in these areas not only illuminates the extent to which circular practices are integrated into the economy but also indicates the potential for job creation and workforce skill development. At the same time, this indicator reflects the economy’s transition from linear to circular models, in which priorities focus on the efficient use of resources, recycling, and the sustainable management of materials [
54].
The Eurobarometer survey [
55] focusing on small and medium-sized enterprises in Europe examined, among other issues, how many of these enterprises employ people in green jobs. A “green job” is defined in the survey as a job “directly dealing with information, technologies or materials that preserve or restore the quality of the environment” and generally requires specialized skills, knowledge, or experience. The data show that fewer than four in ten small and medium-sized enterprises have employees working in green jobs [
55].
As [
56] argues, the transition to a CE can change the labor market, both through the creation of new jobs and through job displacement, closures, or redefinition. Although some jobs in traditional industries may disappear, the CE creates new opportunities through roles that are often more localized and less susceptible to automation. This primarily refers to jobs in areas such as waste management, recycling, regeneration, repair services, and circular design [
57]. The European Commission and the Directorate-General for Environment also indicate that negative effects are likely in certain sectors (e.g., construction, consumer electronics, and agriculture), which is why CE policies should be implemented alongside other appropriate policies to ensure social acceptability [
58]. The new conditions lay the groundwork for retraining and upskilling the workforce, so that job losses in resource-intensive industries can be offset by employment in circular activities [
59].
Also, for a successful transition to a CE, sustainable innovations that lead to both environmental and economic growth play a significant role [
60,
61,
62]. The CE encourages research and innovation activities in all economic sectors [
21]. Research and development (R&D) activities play a crucial role in transforming economic policies towards greater efficiency and establishing a model based on the principles of the CE [
63] (p. 412). R&D and technological progress are crucial to achieving a green economy [
64]. In the context of a CE, R&D activities include generating scientific knowledge on energy-efficient processes for energy production, distribution, and consumption, as well as protecting the environment [
65]. Green R&D plays a key role in transforming traditional socio-technical systems—often characterised by insufficient environmental awareness into models driven by the values of environmental and social responsibility [
66]. According to [
67], environmental regulations stimulate innovation, which results in increased competitiveness and economic growth. Technological innovations in key areas of the CE, such as recycling and secondary raw materials, are a significant factor in both the development of the CE and the increase in the gross added value generated by CE sectors.
Interaction Between Private Investment Related to CE Sectors, Persons Employed in CE Sectors, and Gross Value Added
The transition to a CE entails profound structural changes in economic systems, accompanied by shifts in various economic indicators. Private investment and gross value added in CE sectors demonstrate their economic importance, highlighting the key role of attracting private capital in the expansion and establishment of the CE [
68]. Investments in innovative technologies, infrastructure, and skills development not only improve the sector’s productivity but also open up new employment opportunities, creating a virtuous circle between economic performance and labour development.
Some authors [
36] analysed the development of CE indicators in EU countries, with a particular focus on private investment, gross value added, and employment. Their research shows that countries with more developed CE systems tend to record higher levels of private investment, gross value added, and employment in the recycling and secondary raw materials sectors, indicating a strong structural link among these indicators. Some researchers [
69], in a quantitative analysis of 28 EU member states, found a negative relationship between private investments in the CE and GDP growth during that period. This is mainly due to difficulties in attracting private investment, stemming from unfavourable economic and political conditions that reduce investment efficiency and limit their contribution to overall economic activity.
Ref. [
70] has found a negative effect of unemployment on investment in a CE in the short and long run, while GDP per capita negatively influenced private investment. Findings from [
71] show that private investment and gross value added grow faster than employment, indicating that although investment stimulates economic activity, job growth in the recycling and waste management sectors may be slower due to technological improvements and higher productivity. Ref. [
44] indicates that countries that invest more private funds in CE activities also have a higher level of implementation of circular material flows. This economic dynamic is associated with both better economic performance and greater employment potential in resource-efficient sectors. Some empirical research results [
72] indicate that higher private investment and gross value added growth in CE sectors are associated with lower unemployment rates in European countries. This suggests that investment in circular activities can play an important role in strengthening the labor market.
Technological innovations, which are key to improving circular processes (e.g., advanced recycling technologies and automation), can reduce the need for labour in certain activities. Technological revolutions are historically associated with the replacement of existing jobs and skills, which is often described as technological unemployment [
73]. Automation, which involves using modern technology to perform tasks with minimal human intervention, is increasingly linked to the development of a circular economy, which aims to reduce resource use. With advances in machine capabilities and algorithms, human labor is being replaced in specific tasks, especially in production, transportation, and data processing. These processes can lead to a decrease in the need for labor and an increase in unemployment, but at the same time, they contribute to more efficient resource use.
In addition to the positive effects of the CE on employment, the literature also indicates opposing effects of technological development on the labour market in this sector. Recent empirical research [
74], covering 18 countries with the highest robot adoption between 2006 and 2019, shows that increased use of industrial robots in sectors related to the circular economy can significantly reduce employment opportunities, affecting both male and female workers. At the same time, the adoption of robots has a positive effect on wages, indicating that technological investments increase labor productivity but reduce the demand for human labor in circular economy activities. Some researchers [
75] argue that technologies related to renewable energy, as well as sectors such as recycling and energy and resource efficiency, have greater positive effects on employment. In contrast, technologies at the end of the production chain often reduce the number of jobs, as automation and the intensive use of advanced technologies replace human labour. Ref. [
76] points out that automation, technological progress, and improved material recyclability may reduce the expected labor intensity of recycling activities. Ref. [
77] highlighted that although circular activities such as recycling, repair, and reuse are typically labour-intensive, the introduction of automation and digital technologies can reduce labour intensity in these activities.
All mentioned contradictions indicate that simply ranking countries based on individual indicators can be unreliable. Therefore, to capture the multidimensional and sometimes conflicting relationships among private investments, employment, and contributions to GDP in CE sectors, it is necessary to use advanced multi-criteria decision-making methods, such as the PROMETHEE method.
3. Materials and Methods
Monitoring progress through appropriate performance indicators is a challenging task, almost as complex as achieving the full implementation of CE principles in different countries. In accordance with the claims in [
78], research on indicators and metrics for measuring the degree of implementation of CE strategies remains in a relatively early stage of development. Circularity indicators are a key tool for monitoring progress in the transition to a CE model, as they encourage different actors at all levels to start implementing it [
79]. Their application in assessing circularity performance is essential for improving the model and evaluating its practical feasibility [
80]. The lack of standardized indicators for measuring progress in circularity leads to contradictions and misunderstandings, making it difficult to implement CE strategies. At the same time, the absence of a single indicator framework hinders the consistent application and improvement of circular practices across countries, companies, and products [
81]. The indicators proposed by the European Commission aim to assess and monitor progress in implementing CE strategies, as defined in the 2015 EU CE Action Plan [
82]. These indicators measure four key areas related to the different phases of the CE, such as: (a) production and consumption, (b) waste management, (c) secondary raw materials, and (d) competitiveness and innovation.
The analysis utilised data from EU Member States based on three performance indicators from the last available five-years average values in EUROSTAT database denoted as P1, P2, and P3, representing structural, dynamic, and performance dimensions of governance quality: Private investment and gross added value related to CE sectors (P1) [
83], Persons employed in CE sectors (P2) [
84] and Gross value added in percentage of GDP at current prices (P3) [
85]. These indicators form a composite representation of systemic capacity in the European governance landscape. The selection of P1–P3 is theoretically grounded in capturing complementary dimensions (structural, dynamic, performance) of CE systems, ensuring parsimony while avoiding multicollinearity and redundancy inherent in broader EU indicator sets. Additional indicators, such as circular material use rate and waste generation, were excluded due to their high correlation with P3 and limited cross-country comparability, which could distort clustering stability. The focus is on explanatory clarity rather than indicator proliferation. A key limitation of this study concerns the availability of data for certain countries during the five years analyzed. In cases where complete observations were not available for specific years, the earliest year in the period with a full set of data was used as the relevant year. The earliest complete observation was used only for countries with missing recent data, ensuring consistency without relying on imputation. This approach is conservative and may slightly understate recent improvements in the dynamic indicator (P2), as it does not fully capture the latest growth trends. However, this does not significantly affect the results. The analysis is based on relative comparisons within clusters, rather than absolute values, and the differences between countries remain sufficiently pronounced. Moreover, robustness and sensitivity checks confirm the stability of both cluster composition and PROMETHEE rankings. Such inconsistencies often arise due to differences in administrative practices, statistical processing procedures, and delays in data dissemination by national statistical offices. Moreover, variations in calculation methodologies, interpolation techniques, and subsequent harmonization with international reporting standards must be considered when conducting such analyses. These issues were carefully taken into account in the present study. Before implementing multivariate or multi-criteria methods, all variables were standardised to ensure comparability and to remove scale-related distortions. Therefore, Visual PROMETHEE (Preference Ranking Organization Method for Enrichment Evaluations) Academic has been used to rank countries within clusters, accounting for the V-shaped preference function with an indifference threshold [
86]. The values of the thresholds q (indifference) and p (preference) used for each indicator, where q (indifference threshold) represents the maximum difference considered negligible between two alternatives (0.25σ for each indicator), and p (preference threshold) represents the minimum difference at which strict preference is established (0.75σ for each indicator). Sensitivity analysis was conducted using alternative threshold specifications for both the indifference (q) and preference (p) parameters. The results show only marginal variations in ranks, primarily involving adjacent positions, while the overall hierarchy of countries and leading performers within each cluster remains unchanged. This indicates that the preference structure is stable and not sensitive to specific threshold choices. Importantly, no systematic shifts or reversals were observed, confirming that the PROMETHEE outcomes are driven by the underlying data structure rather than by parameter calibration. Consequently, the selected threshold values provide a reliable and robust representation of decision-maker preferences without introducing asymmetry. The main purpose of the presented research is not merely to display the relative positions of EU countries, but to identify statistically coherent groups of countries with similar multidimensional CE profiles, and then to compare countries within homogeneous groups rather than across the full heterogeneous sample. This is precisely why clustering is needed. The three indicators were selected due to their established relevance in assessing cross-country institutional performance. Structural indicators (P1 and P3) reflect stable institutional attributes with low short-term variability, whereas the dynamic indicator (P2) captures transformation and adaptability, both of which are crucial for evaluating modern governance systems. The inclusion of both structural and dynamic dimensions ensures a multi-faceted, theoretically grounded evaluation framework [
87]. Even with only three indicators, the sample remains highly heterogeneous. The research explicitly states that EU countries differ substantially in structural, dynamic, and performance-related dimensions, and that this heterogeneity can distort direct comparison across the whole sample.
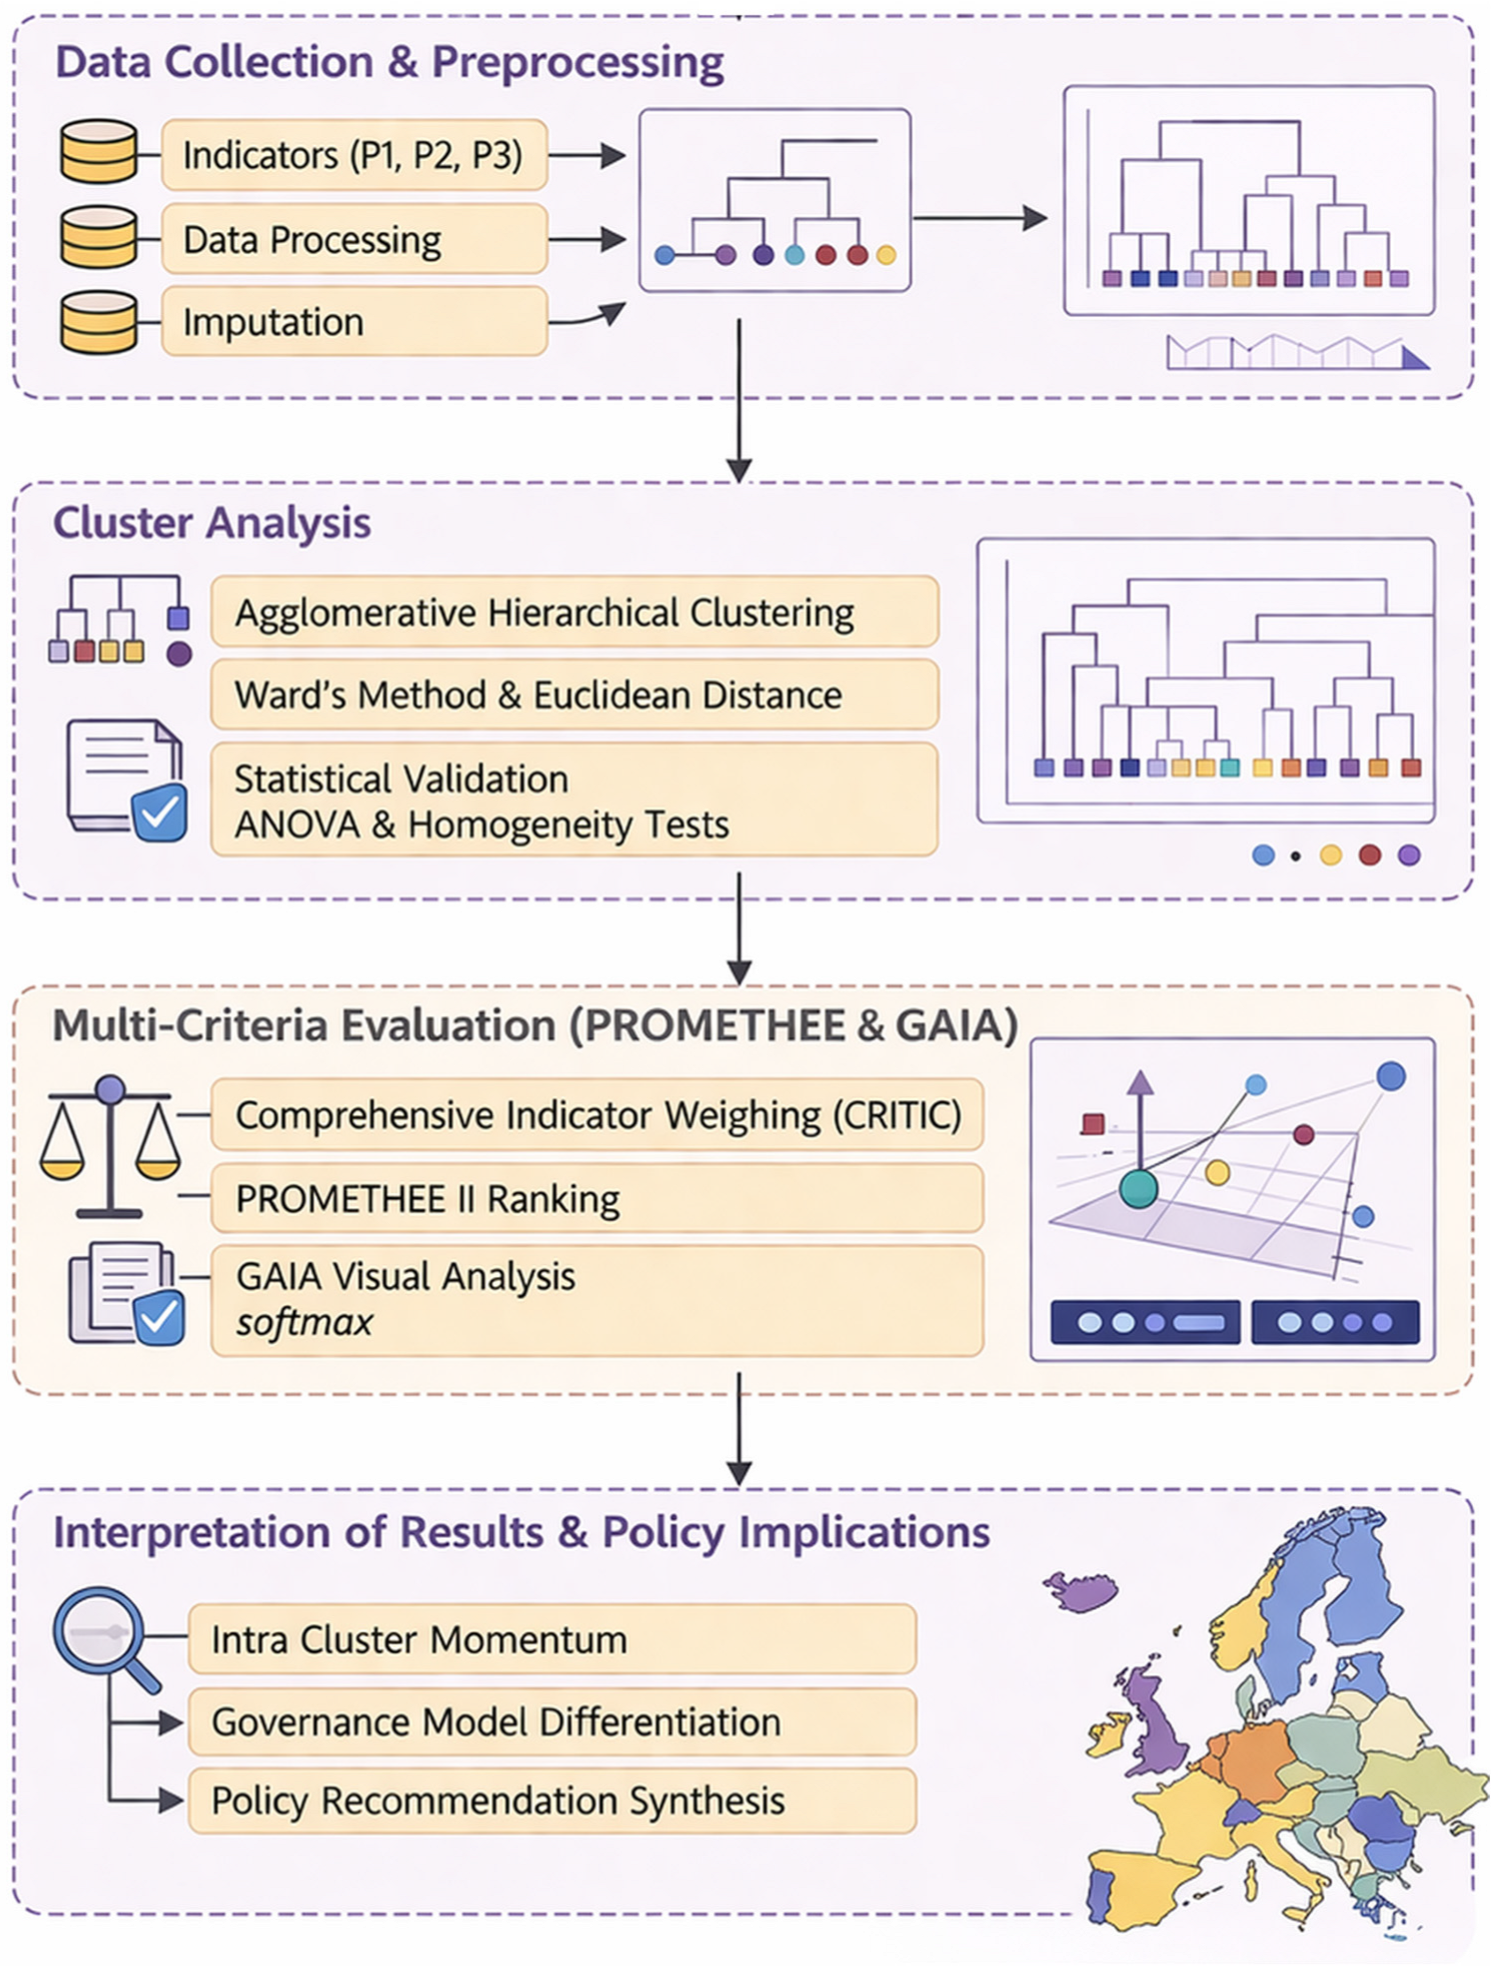
The methodological framework applied in this study (
Figure 1) follows the hierarchical agglomerative clustering procedure consistent with established SPSS 26.0 standards. To group EU countries into internally homogeneous clusters, Agglomerative Hierarchical Clustering (AHC) was applied using the Ward’s minimum variance method and Euclidean distance as the dissimilarity measure. Although the study uses three indicators, clustering remains necessary because the objective is not merely visual inspection of country positions, but the identification of statistically coherent groups of countries with similar multidimensional CE profiles. This grouping reduces heterogeneity in the full EU sample and provides a more appropriate basis for subsequent within-cluster PROMETHEE comparisons. Ward’s method was selected for its ability to generate compact, spherical clusters and its frequent use in governance, economic, and social science research, where homogeneity within groups is analytically important [
17]. The hierarchical clustering procedure begins by treating each country as a separate cluster, then iteratively merging pairs of clusters to minimise the total within-cluster sum of squares. Ward’s method was selected as the linkage criterion due to its capacity to minimise within-cluster variance while maximising between-cluster separation. This method is particularly suitable for socio-economic datasets involving structurally correlated indicators, as it ensures coherent grouping based on collective multidimensional similarity. Euclidean distance served as the dissimilarity measure, enabling the calculation of squared distances, which are frequently employed in policy-oriented comparative studies [
88]. Hierarchical clustering with Ward’s method and Euclidean distance not only captures proximity but also minimizes within-cluster variance and maximizes between-cluster separation, thereby producing compact and interpretable groups. In the manuscript, the five-cluster solution was not chosen based on visual inspection alone, but rather on the agglomeration process and validation tests. Moreover, ANOVA confirms that all three indicators differ significantly across clusters, while Levene’s test indicates acceptable homogeneity of variance. This means the groups are not merely visual impressions, but statistically meaningful partitions.
The analytical process consisted of several key steps. First, three indicators (P1, P2, P3) representing structural, performance, and efficiency dimensions were extracted for 27 EU member states. Second, the agglomeration schedule was computed, documenting the sequential merging of clusters and enabling the identification of structural jumps that typically guide decisions on cluster retention. Finally, cluster validation was conducted using ANOVA and Levene’s tests, which confirmed that inter-cluster variance was statistically significant and that the assumptions of homogeneity were met. Together, these steps constitute a rigorous clustering methodology aligned with best practices in quantitative comparative research.
A five-cluster solution was selected based on interpretability criteria, dendrogram inspection, and the need to preserve meaningful regional patterns observed in EU governance literature. Clusters represent coherent country groups with shared structural and dynamic characteristics, thereby providing an appropriate foundation for subsequent PROMETHEE and GAIA analyses, which were performed separately within each cluster to minimise preference distortion caused by extreme outliers [
89]. The CRITIC method was employed to derive objective weights for the three indicators. CRITIC assigns higher weights to criteria that simultaneously exhibit high variability (dispersion) and low redundancy (correlation) with other criteria, capturing the intrinsic informational contribution of each indicator [
90].
The integration of PROMETHEE II with the CRITIC weighting method provides a robust multi-criteria decision-making framework suitable for evaluating the relative performance of EU member states across complex structural, performance, and transformation-related indicators [
91]. The CRITIC procedure is particularly appropriate in this analysis, as it derives criterion weights intrinsically from the statistical properties of the data, avoiding subjective or politically influenced weighting schemes. Given the asymmetry in variance and the relatively high intercorrelation between several indicators, especially between structural variables (P1, P3), the CRITIC method assigns a disproportionately higher weight to the dynamic indicator P2, reflecting both its informational independence and its substantive role in capturing the contemporary transformation capacity of European governance systems. The elevated weight assigned to P2 is not based on an a priori normative preference, but arises endogenously from the CRITIC method, driven by its higher variance and informational contribution. Additionally, a supplementary analysis using equal weighting yields consistent ranking patterns, demonstrating that the results are not methodologically inconsistent with the weighting scheme. Rather, they reflect inherent multidimensional differences among countries, with P2 serving as the primary discriminator of transition dynamics. PROMETHEE subsequently transforms these weighted indicators into pairwise preference flows, enabling the identification of internal hierarchies within each previously identified cluster of states. The process is complemented by GAIA, a geometric representation of the decision problem, which provides a reduced-dimensionality view of how alternatives relate to each criterion and to the aggregated preference structure embodied in the decision axis. Whereas PROMETHEE provides numerical rankings, GAIA provides conceptual insight into the structural alignment of countries, revealing whether the relative advantages of each state stem from dynamic reform capacity, structural quality, or balanced profiles.
4. Results
The results should be understood as reflecting the dynamics of the circular economy transition, rather than the absolute level of its structural maturity. In this context, the analysis captures the intensity, direction, and responsiveness of change processes, especially through the dynamic indicator, rather than the total level of development achieved over time. As a result, higher rankings indicate a stronger capacity for transformation and momentum, not necessarily a more advanced or fully developed circular economy system. This distinction is crucial for accurately interpreting the findings, as it separates short- to medium-term adaptability and policy effectiveness from long-term structural maturity. The results of this analysis are divided into two parts. The first part presents the cluster analysis, which aims to provide insight into the similarities and differences among the analyzed countries and to identify their mutual relationships based on the selected indicators. In the second part, countries are ranked within each cluster to assess the extent to which specific countries are dominant and exhibit leadership characteristics within the existing configuration. Countries are grouped into the same cluster because they exhibit similar profiles across the three CE indicators observed, not because they necessarily share the same historical or political background. Broader institutional or developmental explanations are used only as contextual interpretation after the statistical grouping is established.
4.1. Clustering Results
The hierarchical cluster analysis produced a five-cluster configuration that captures a highly stratified landscape of structural, dynamic, and performance-related characteristics among EU member states [
92]. Namely, the agglomeration schedule obtained from Ward’s hierarchical clustering procedure reveals a pronounced increase in the fusion coefficient between stages 23 and 24. The agglomeration coefficient increases from 0.020669 to 0.032092, representing the first substantial jump in cluster heterogeneity (
Table 1). According to standard hierarchical clustering diagnostics, the optimal number of clusters corresponds to the stage immediately preceding this increase. Consequently, the five-cluster solution was retained as the most appropriate representation of the EU countries based on the circular economy indicators.
This configuration is statistically validated through robust ANOVA and homogeneity tests, but its deeper significance emerges when interpreted in light of the broader political and economic trajectories of European states. The clusters map onto recognisable developmental paths, institutional models, and strategic orientations that distinguish the EU’s contemporary governance architecture [
93]. The descriptive statistics (
Table 2) represent substantial heterogeneity across the five clusters, demonstrating that the hierarchical model successfully partitions EU member states into structurally coherent groups. Cluster 1, composed primarily of Baltic states and Croatia, exhibits the highest mean P2 value (0.044), confirming its profile as the most dynamically adaptive and innovation-oriented cluster. Its comparatively elevated P1 and P3 values further support the notion of a flexible institutional environment that supports rapid structural change. Cluster 2, containing only Ireland, stands out with extraordinarily high P1 (0.039) and P3 (0.034) values. This single-unit cluster reflects a structurally exceptional configuration, characterised by a high degree of openness, foreign investment intensity, and capacity for institutional absorption. Its isolation is consistent with well-established evidence of Ireland’s atypical growth model within the EU. Cluster 3, consisting solely of Malta, suggests balanced institutional, performance, and efficiency capabilities. Its statistical profile confirms Malta’s unique developmental position as a microstate with high levels of systemic agility [
94]. The single-country clusters are especially important to explain. For Ireland, the reason for isolation is empirical and straightforward because it has extraordinarily high P1 and P3 values relative to the rest of the sample. The research already notes that Ireland stands out because of its unusually strong private investment-to-gross value added profile and its high gross value added share, which makes it sufficiently dissimilar to all other countries that Ward’s method leaves it as a singleton. So Ireland is “special” not in a vague political sense, but because its CE sector profile is structurally exceptional in the observed data. For Malta, the pattern is different. Malta is not isolated because of a single extreme value, as in Ireland, but because it presents a more balanced yet still distinctive combination across all three indicators. The cluster analysis characterizes Malta as a case of balanced institutional, performance, and efficiency capabilities. Methodologically, this means Malta does not fit neatly into the dynamic profile of Cluster 1, the structurally exceptional profile of Ireland, the low-dynamic profile of Cluster 4, or the modal mid-range profile of Cluster 5. Its uniqueness lies in the specific combination, not just the magnitude, of P1, P2, and P3. In contrast, Cluster 4 comprises more mature Western and Northern EU states that exhibit moderate P1 and P3 values and the lowest P2 mean in the dataset (0.014). This pattern suggests institutional continuity but reduced dynamism or innovation velocity, consistent with theories of administrative inertia in long-established governance systems. The emergence of Ireland and Malta as single-country clusters is an inherent result of the hierarchical clustering process and reflects their statistical distinctiveness in the multidimensional indicator space. Ward’s method is specifically designed to minimize within-cluster variance. Therefore, isolating such observations helps preserve the internal coherence of the remaining clusters. Additional robustness checks confirm that the composition and interpretation of the remaining clusters remain unchanged, indicating that the presence of the aforementioned single-country clusters does not distort but rather enhances the validity of the clustering solution. Finally, Cluster 5, the largest cluster with fourteen member states, reflects the modal centre of the EU. For Cluster 5, the countries form the largest and most heterogeneous group because they occupy the middle of the EU distribution. The research describes this cluster as the “modal centre” of the EU, where P2 values are moderate, and P1 and P3 averages are comparatively lower. In other words, these countries are grouped because none of them exhibits the extreme dynamic profile of Cluster 1 or the exceptional structural profile of Ireland and Malta. They represent the broad middle range of CE sector performance. Its moderate P2 values and comparatively low P1 and P3 averages position it as the statistical benchmark for “typical” EU performance. These countries exhibit neither the high adaptability of Cluster 1 nor the structural sophistication of Ireland, but instead represent a stable middle profile suitable for incremental reform strategies.
This observation reflects a base effect rather than poor circular economy performance. The indicator P2 measures employment in circular economy sectors, which tend to grow more rapidly in countries that are still expanding their circular economy activities. In mature economies such as Denmark or Sweden, the circular economy sector is already relatively developed, and employment growth is therefore less pronounced. Consequently, the indicator captures dynamic expansion rather than the absolute maturity of circular economy systems. Countries such as Estonia or Croatia show stronger values because they are currently experiencing faster structural transformation in these sectors. To clarify this point, we emphasize in the revised manuscript that the proposed ranking reflects the intensity of transformation and governance responsiveness, rather than the absolute level of circular economy development. The higher ranking of Poland and Hungary in Cluster 5 reflects their stronger dynamic performance in circular economy employment (P2), combined with moderate levels of investment and value added (P1 and P3). In contrast, countries such as France and Luxembourg show relatively stable structural performance but weaker dynamic expansion in circular economy employment. Therefore, the ranking does not indicate that Poland or Hungary has already achieved a more advanced circular economy, but rather that they currently exhibit stronger momentum in the transition process. The governance scores reflect the capacity of national policy frameworks to mobilize economic actors toward circular activities. For example, Croatia’s strong performance in P2 indicates rapid expansion of employment in circular economy sectors, suggesting effective policy incentives and institutional responsiveness. In contrast, countries such as Germany exhibit a more mature and stable circular economy structure where growth rates are naturally slower. Therefore, the results should be interpreted as indicating different transition trajectories rather than differences in long-term sustainability performance.
The validity of the cluster structure derived from Ward’s hierarchical clustering was assessed using one-way ANOVA and Levene’s test of homogeneity of variance across the three criteria. The ANOVA results indicate that all three indicators, P1, P2, and P3, differ significantly across clusters at the
p < 0.001 level. This confirms that the clusters represent statistically meaningful partitions of the data rather than arbitrary groupings. In particular, P2 exhibits the highest F-value (F = 39.43), demonstrating that the dynamic indicator contributes most to inter-cluster differentiation, consistent with the CRITIC-derived weighting scheme and with the geometric pattern observed in the GAIA plane. Levene’s test yielded non-significant results for all indicators (
p > 0.33), suggesting that the assumption of homogeneity of variance is satisfied. This supports the reliability of the ANOVA outcomes and indicates that cluster differences reflect genuine structural variation rather than artefacts of unequal dispersion [
63]. The combination of significant ANOVA results and non-significant Levene statistics (
Table 3) provides strong evidence of cluster stability and discriminant validity, reinforcing the analytical soundness of the hierarchical clustering stage.
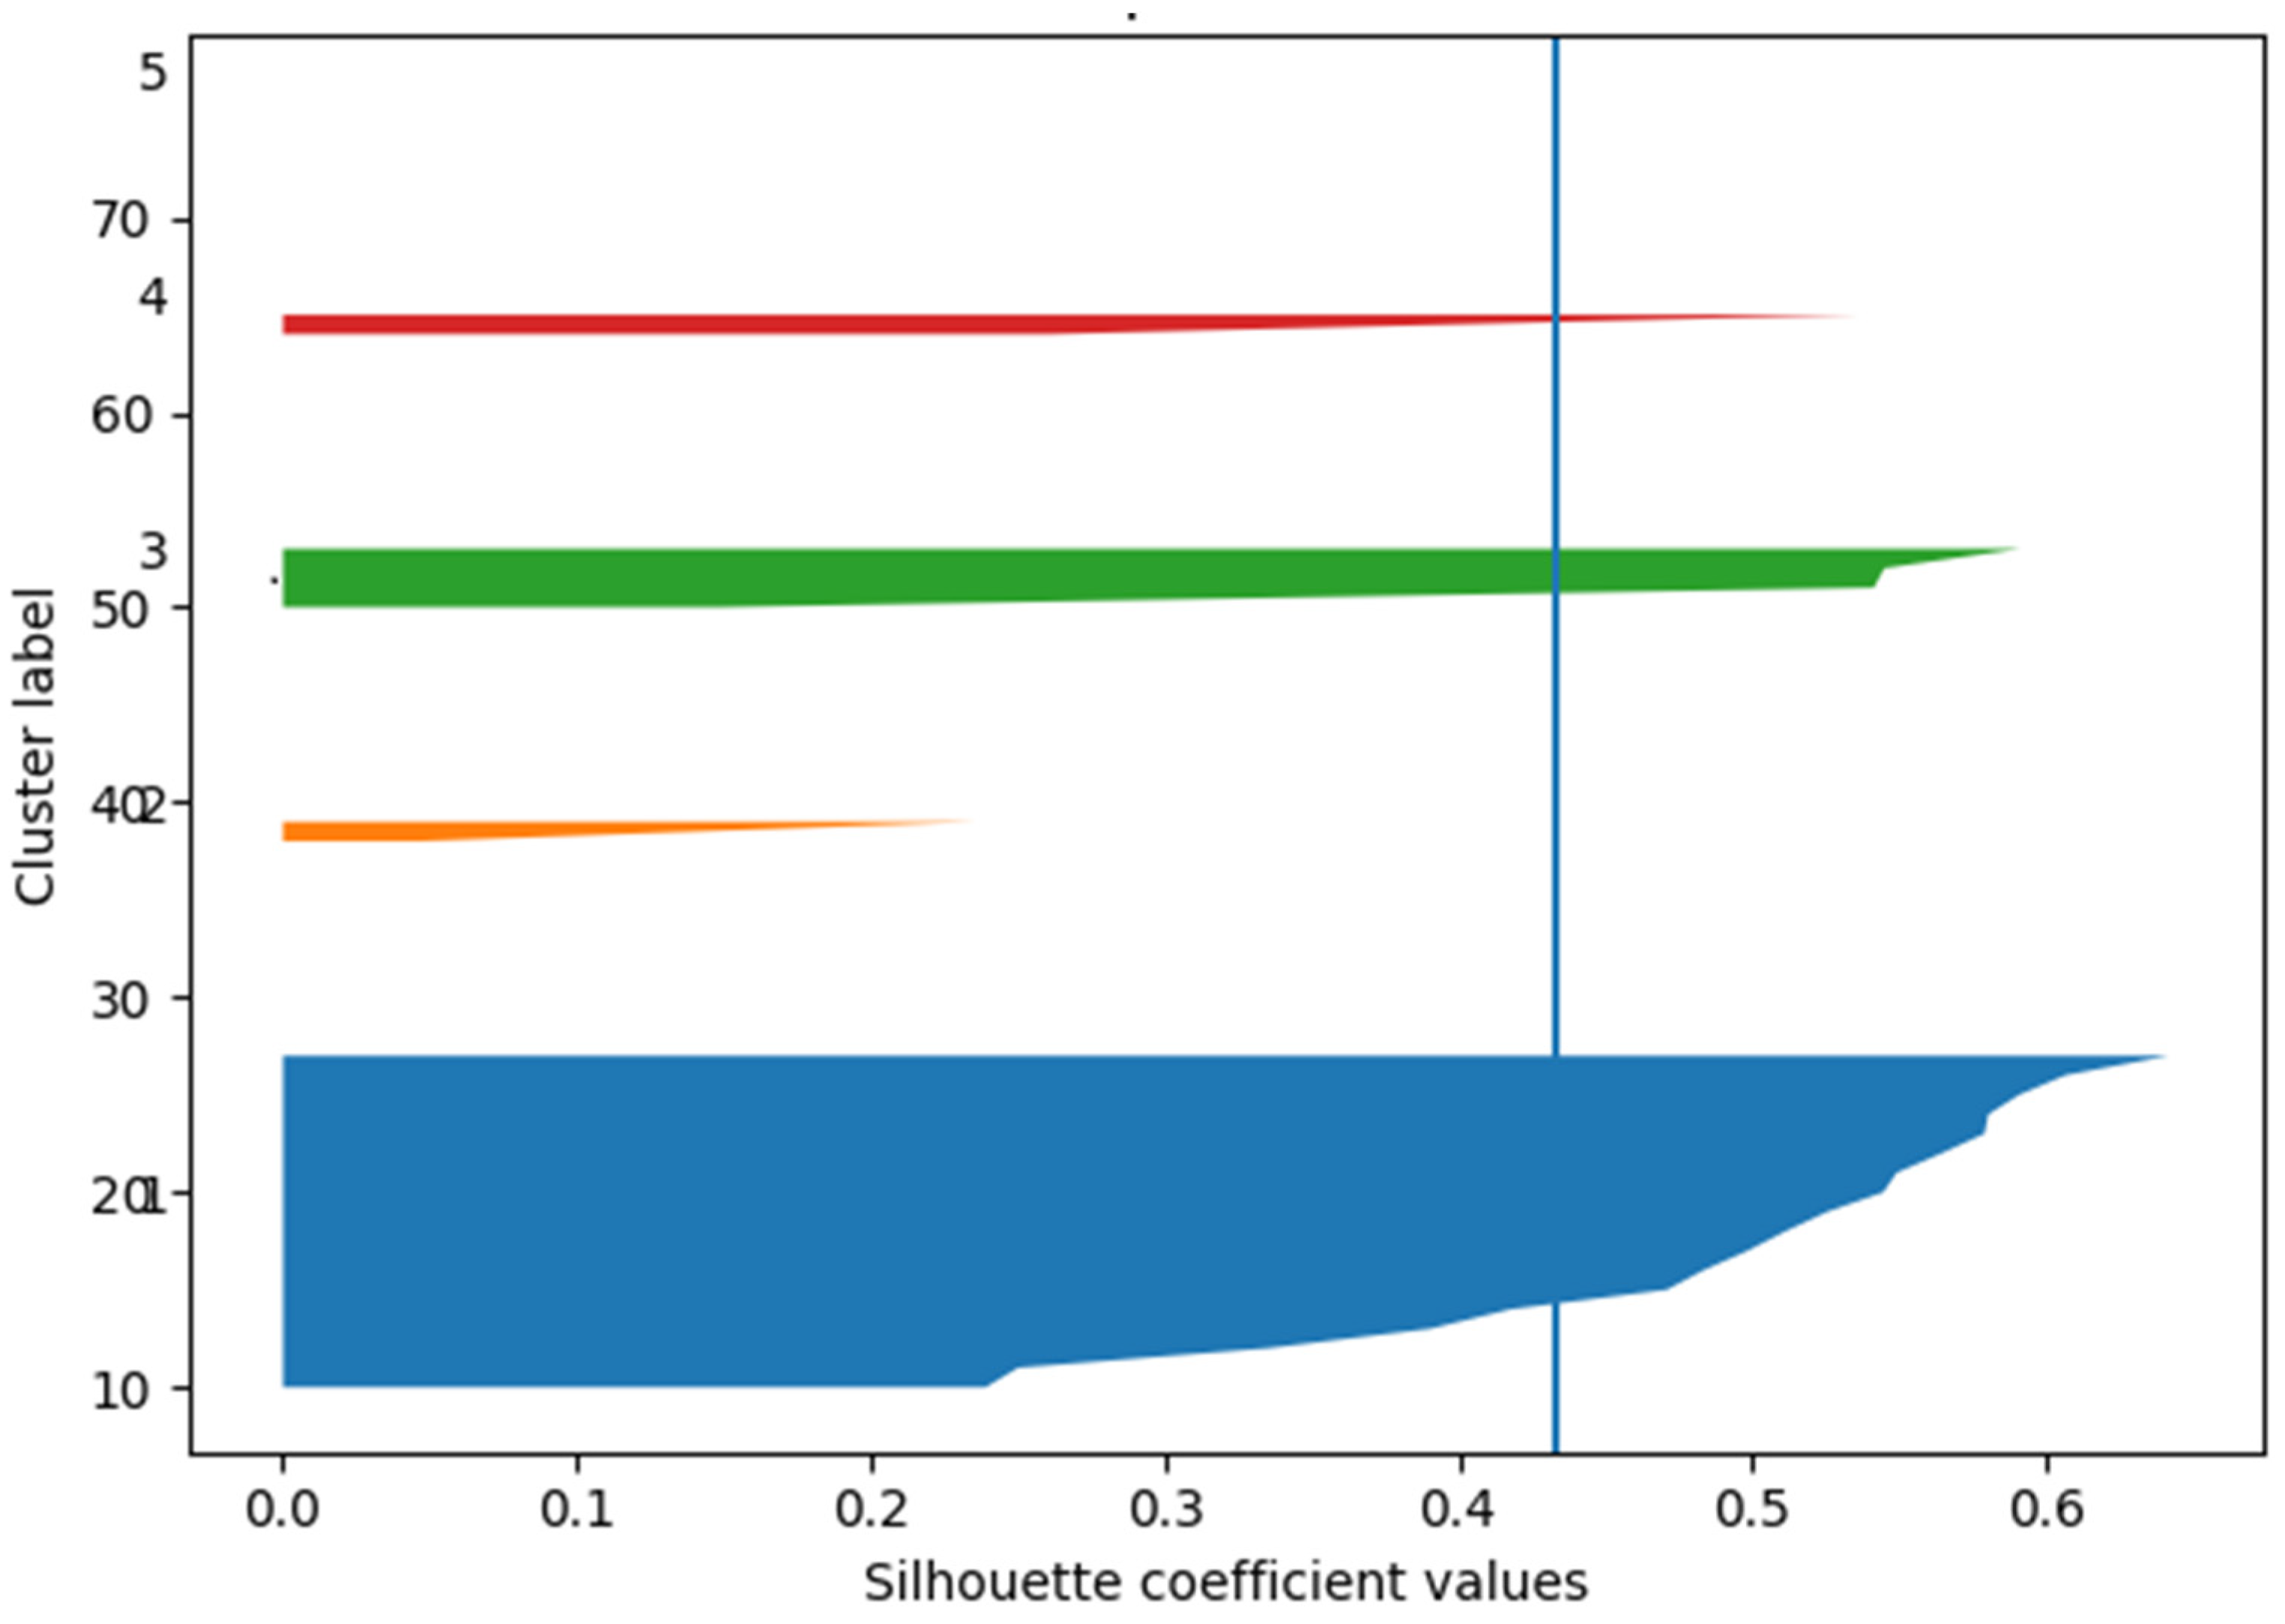
The silhouette analysis confirms the validity of the five-cluster solution. The Silhouette coefficient was used to assess cluster quality at both the individual and group levels. For each country
i, the silhouette value
si is defined as:
where
ai is the average distance between
i and all other points in the same cluster, and
bi is the minimum average distance between i and points in the nearest neighboring cluster. The average silhouette width equals 0.433, indicating a reasonably strong clustering structure (
Figure 2). Most countries exhibit positive silhouette values, indicating that they are appropriately grouped with similar countries and sufficiently separated from neighboring clusters. The Silhouette method was applied to assess the internal cohesion and external separation of clusters.
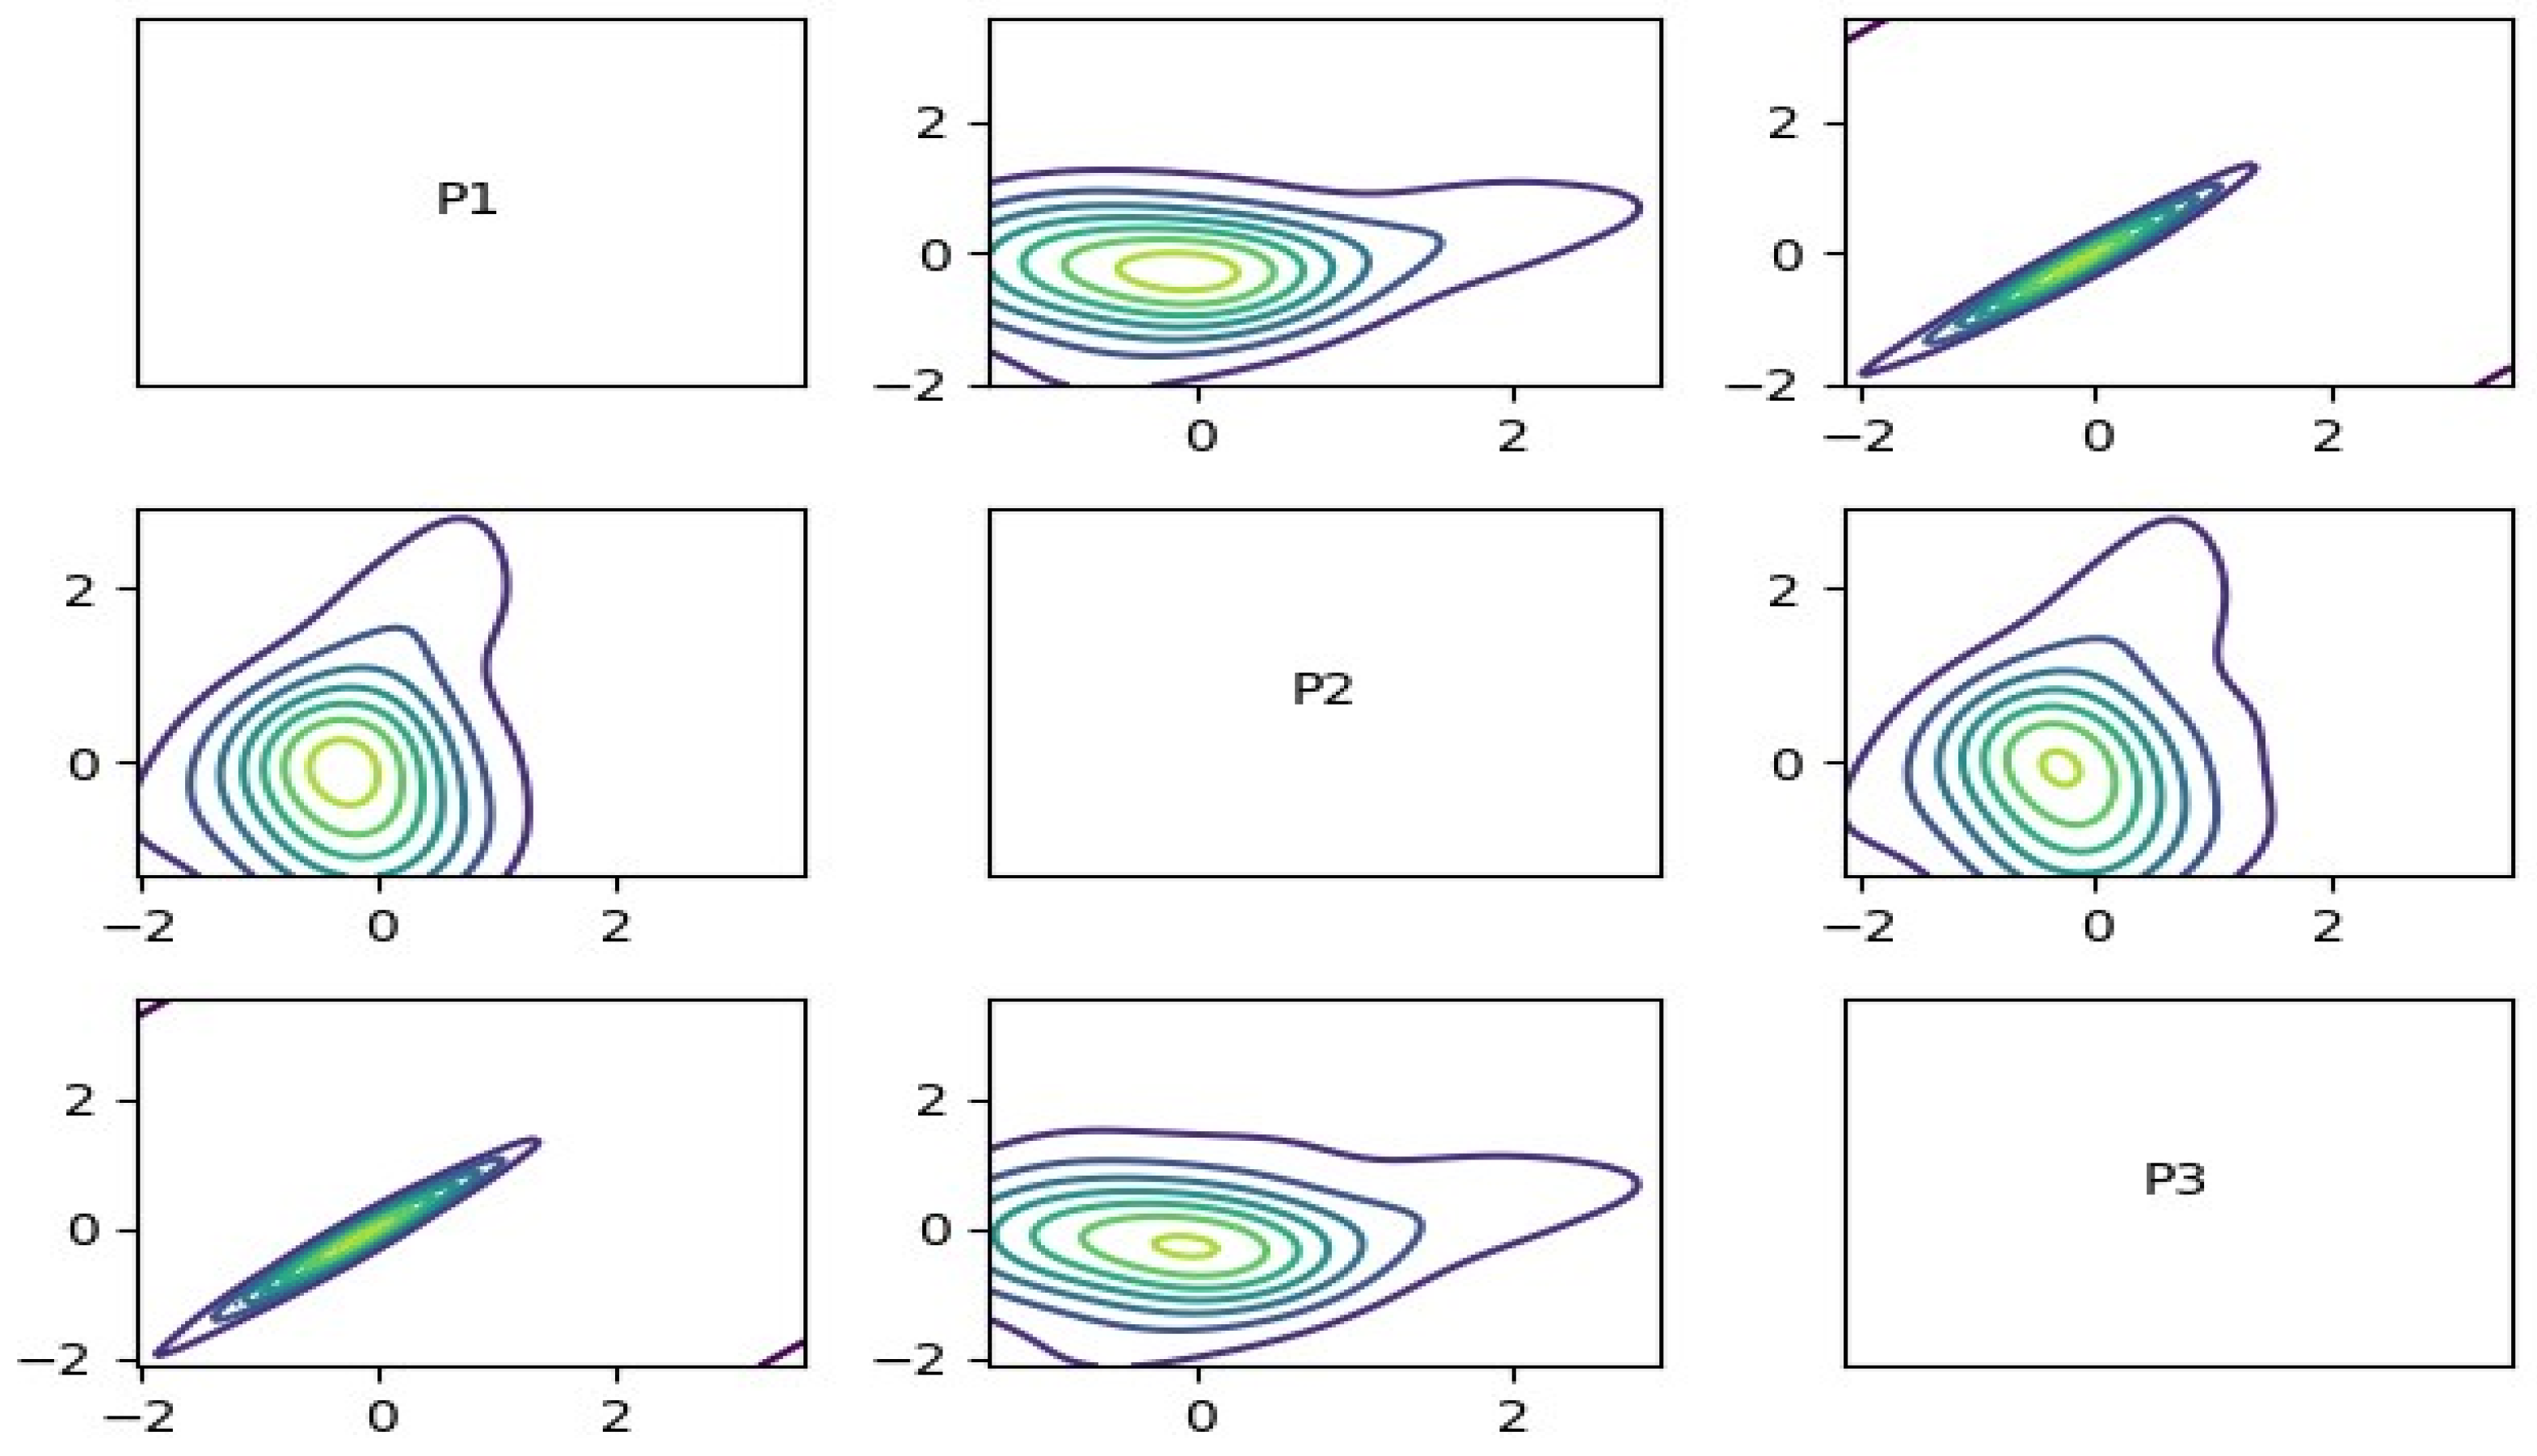
The density matrix visualizes pairwise relationships among the circular economy indicators. Distinct density regions correspond to clusters identified by the hierarchical clustering procedure, highlighting the data’s multidimensional distribution and supporting the presence of heterogeneous circular economy performance patterns among EU countries (
Figure 3).
4.2. MCDM Ranking Result
The Visual PROMETHEE Academic results demonstrate that states within each hierarchical cluster, although sharing certain structural or developmental similarities, still exhibit substantial internal variation once multi-criteria preferences are applied. The dominance of Estonia and Croatia in Cluster 1 reflects their strong dynamic capacities, operationalised by consistently high P2 scores that are even more pronounced under the CRITIC weighting scheme. PROMETHEE flow analysis (
Table 4) reveals a high outgoing preference intensity for these states, indicating broad superiority over their regional peers [
89]. Lithuania and Latvia exhibit more moderate profiles, reflecting transitional successes that are not yet consolidated across all criteria. Cluster 4 is particularly interesting. Germany, although often treated as a structural anchor state of the EU, also outperforms its peers significantly in a multi-criteria comparison, even when dynamic variables are weighted most heavily. This suggests that Germany’s structural advantages remain sufficiently influential to generate strong preference flows even when transformation capacity is emphasised. Conversely, Sweden, Denmark, and Belgium, often considered governance leaders, are penalised by their weaker alignment with dynamic indicators, resulting in lower net flows despite their high structural quality. PROMETHEE therefore highlights an important distinction between structural excellence and dynamic adaptability. Cluster 5 contains the largest internal heterogeneity, which is reflected in the dispersion of φ-net flows. Poland and Hungary emerge as the strongest performers within this cluster, not because of superior structural indicators, but due to above-average dynamic capacity and a favourable combination of moderate performance and independence across criteria. At the lower end of the ranking, Greece and Romania exhibit very unfavourable net flows, suggesting that deficits in both structural and dynamic dimensions significantly reduce their preference intensity relative to other member states.
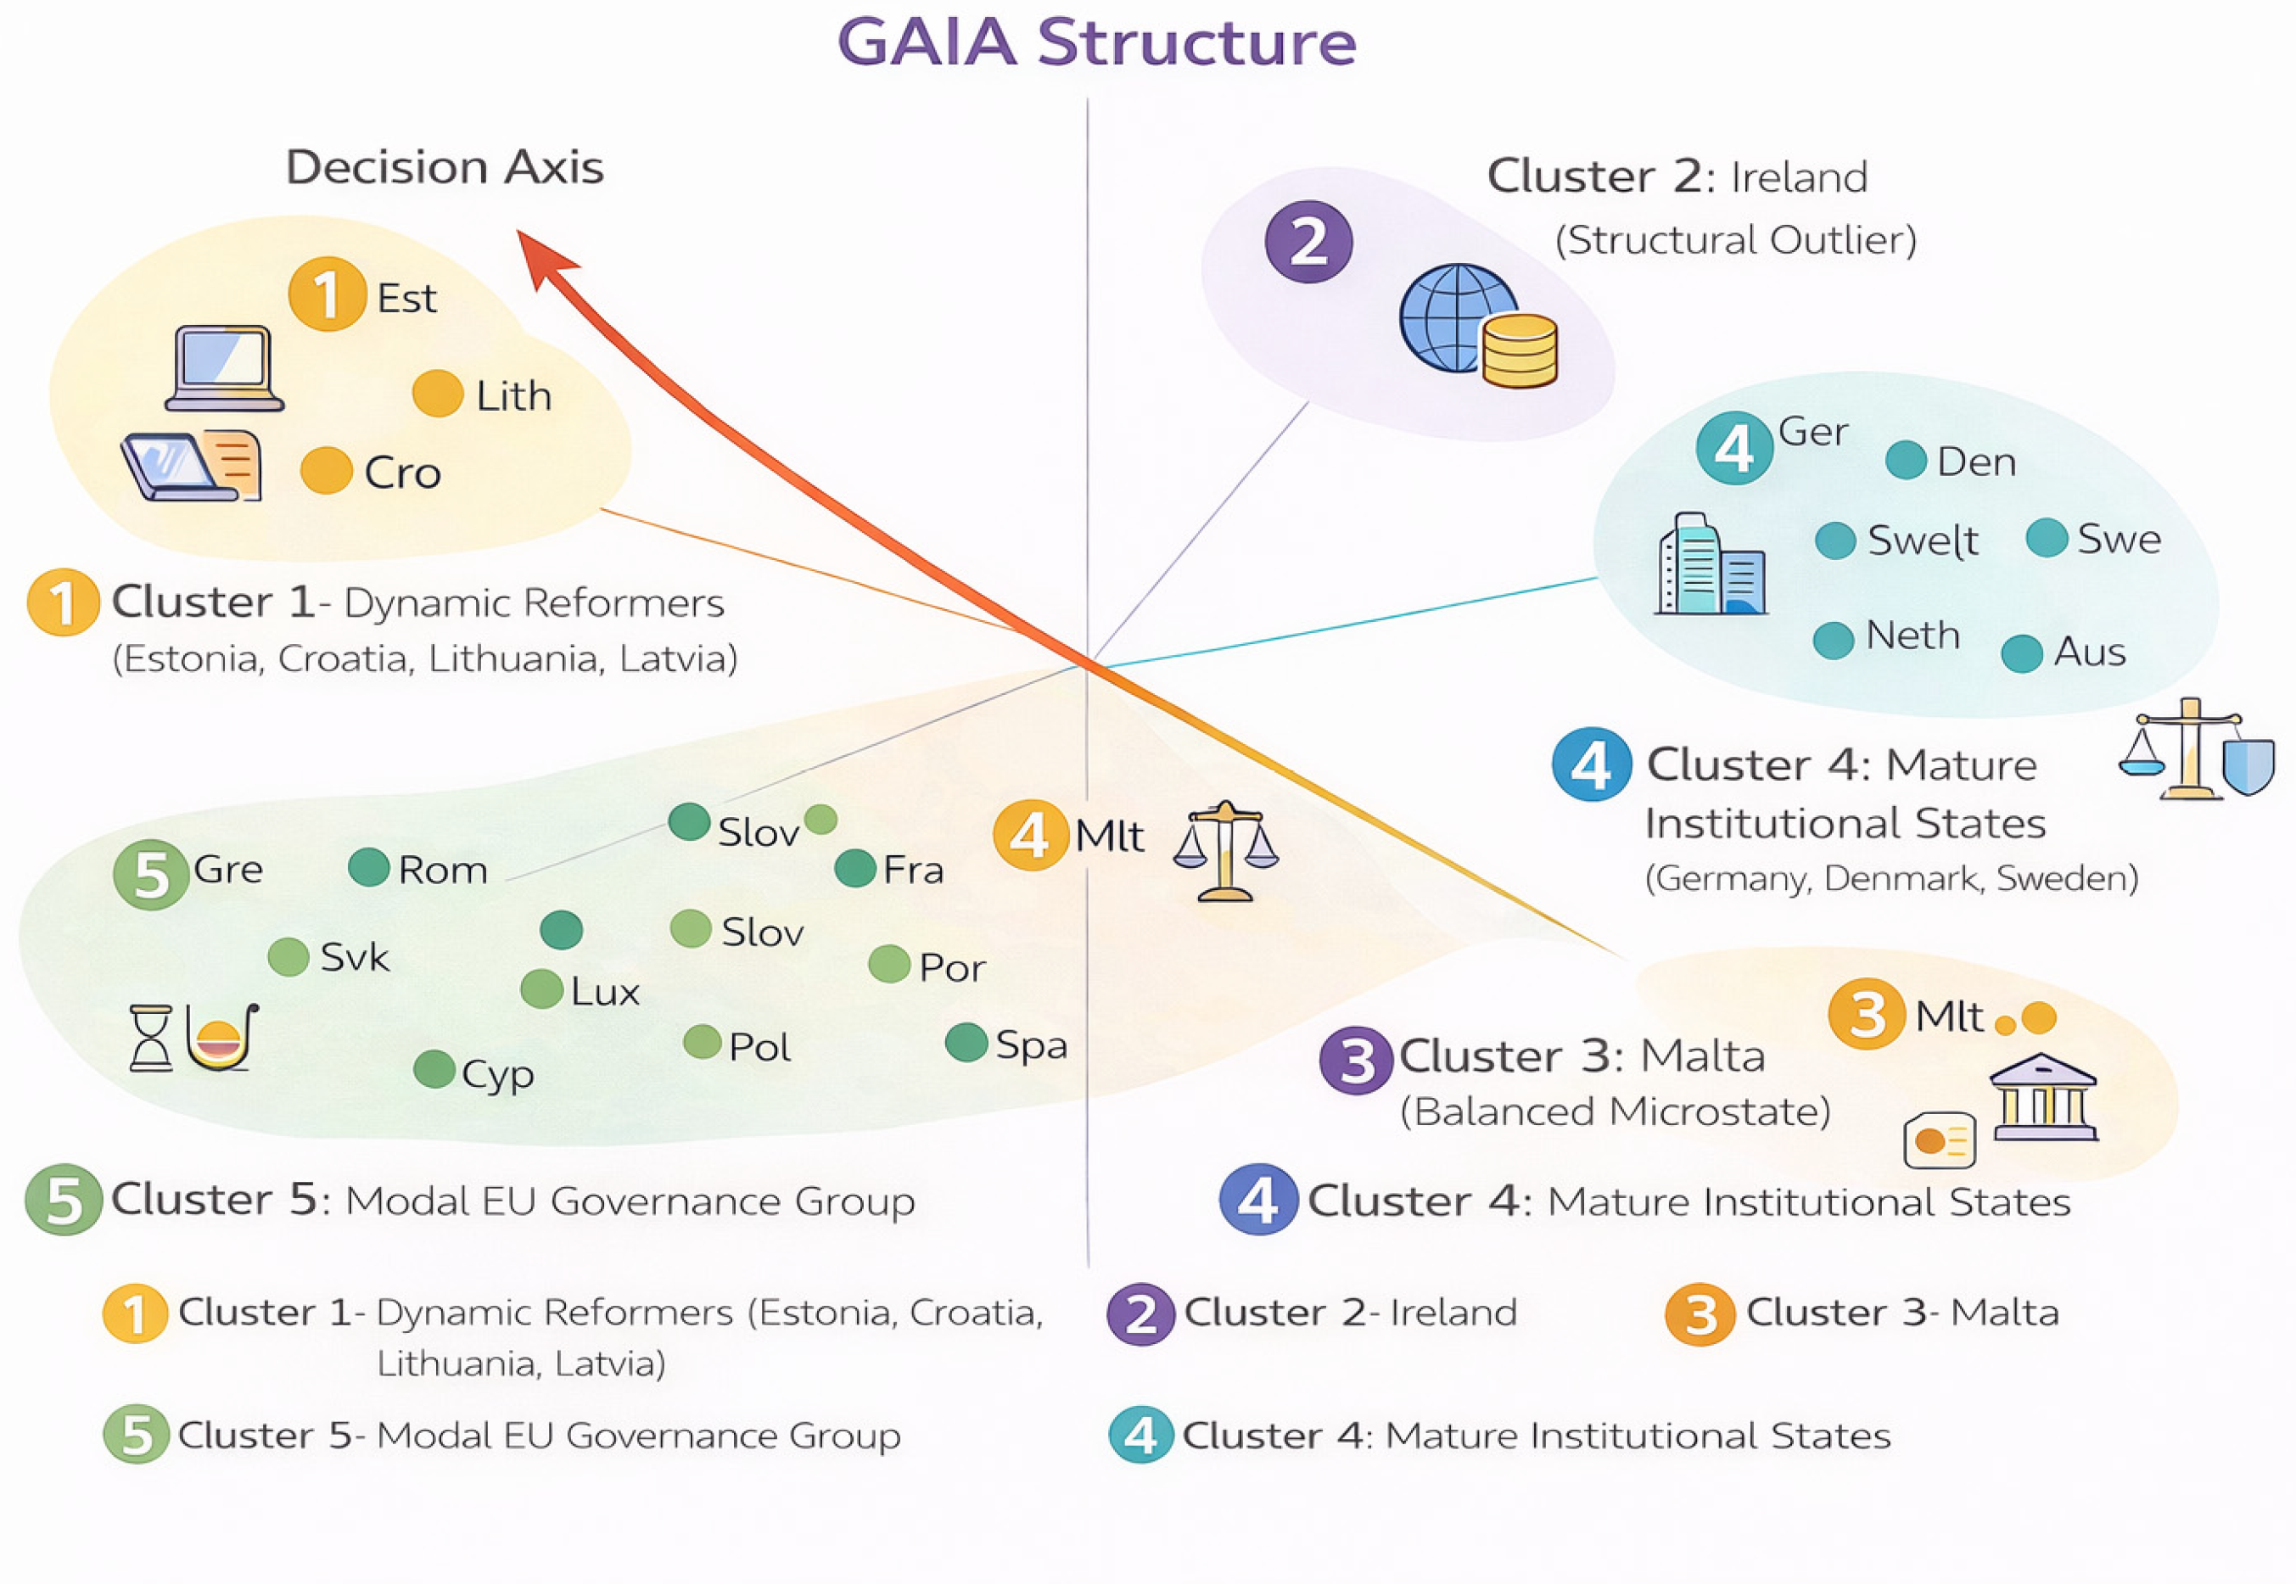
PROMETHEE II was employed to obtain a complete ranking of countries within each cluster based on net preference flows, ensuring consistency with GAIA visualisation and facilitating comparative interpretation. The GAIA plane (
Figure 2) provides a geometric interpretation of the multi-criteria evaluation, projecting univariate flows into a two-dimensional space that preserves most of the variance in the preference structure. The direction and magnitude of the criterion vectors convey the discriminatory power of each indicator [
95]. P2 consistently forms the longest vector across clusters, indicating that it contributes most to variation in country profiles. In contrast, P1 and P3 are shorter and nearly collinear, revealing redundancy and a strong correlation. The decision axis, formed by projecting the CRITIC weight vector onto the GAIA plane, expresses the direction of the most preferred combination of criteria under the specified weighting scheme. Countries located near the “red decision arrow” direction (left upper quadrant) (
Figure 4), which represents the multi-criteria ideal, have strong dynamic capacity combined with structurally favourable conditions [
87,
96]. In Cluster 1, Estonia lies closest to, reflecting an optimal alignment with the weighted preference model. Croatia follows, with a slightly more moderate projection, while Lithuania and Latvia fall closer to the origin, indicating intermediate profiles. In Cluster 4, the GAIA plane reveals a compact but differentiated configuration. Germany aligns moderately, whereas Sweden, Belgium, and Denmark appear orthogonal to the decision axis, indicating that their governance profiles emphasize dimensions less valued under the current weighting scheme. This geometric divergence illustrates why these states exhibit relatively low φ-net flows despite being high-income democracies with stable institutions.
Since the retained variance exceeds the commonly recommended threshold of 60–70%, the two-dimensional representation provides a reliable approximation of the multidimensional decision space. In this model, the GAIA projection retains 79.1% of the total information contained in the decision problem. The super GAIA plane synthesises the entire EU landscape. Here, the structural outliers (Ireland, Malta) appear far from both the centroid of most other countries, reaffirming their unique governance models. By contrast, the dynamic states (Estonia, Croatia, Baltics) cluster near, signifying strong alignment with contemporary EU transformation criteria. The modal cluster displays a wide spread, with Poland and Hungary near the decision axis, while Greece and Romania diverge sharply, illustrating performance deficits reflected in negative net flows. While the average silhouette coefficient (0.433) indicates moderate cohesion, this value aligns with expectations for heterogeneous socio-economic data, where perfectly separated clusters are seldom seen. Importantly, clustering robustness is not judged solely on the silhouette metric. The solution is supported by multiple complementary validation methods, including statistically significant inter-cluster differences (ANOVA), confirmed homogeneity of variance (Levene’s test), and consistent separation patterns in the multidimensional space. Additionally, the high variance explained by the GAIA projection (79.1%) shows that the underlying structure of the decision space is well maintained, reinforcing the reliability of the clustering despite moderate silhouette scores.
The sensitivity analysis shows that only minor rank shifts occur, and the relative structure of the rankings remains stable (
Table 5). The leading countries in each cluster remain unchanged under equal weighting. This confirms that the PROMETHEE results are not solely driven by the higher CRITIC weight assigned to P2, but rather reflect the combined influence of all three indicators. The CRITIC method is preferable to equal weighting because it derives weights from the data’s informational content, assigning greater importance to indicators that exhibit higher variability and lower redundancy with other criteria. In this study, this is methodologically appropriate because P2 provides the strongest discriminatory power across countries. In contrast, equal weighting would impose an arbitrary assumption that all indicators contribute equally, regardless of their empirical capacity to differentiate national circular economy profiles. To assess the robustness of the multi-criteria evaluation, a sensitivity analysis was conducted by recalculating the PROMETHEE ranking under an alternative weighting scheme where all indicators were assigned equal weights. The comparison between the CRITIC-derived weights and the equal-weight scenario shows only minor changes in country rankings, while the overall cluster structure and leading countries remain stable. This confirms that a single indicator does not drive the results but reflects a consistent multidimensional pattern of circular economy performance. Therefore, the combined CRITIC-PROMETHEE framework provides a robust evaluation of the dynamics of the circular economy transition across EU countries. In Cluster 5, only minor fluctuations are observed. Poland and Hungary switch positions, with Hungary moving from second to first place (+1) and Poland dropping from first to second (−1). Importantly, these changes are small and do not affect the overall interpretation of cluster leadership. Instead, they suggest that the two countries have closely similar performance profiles, with slight differences in indicator composition becoming more noticeable when weights are adjusted. The lack of significant ranking shifts across both clusters confirms the robustness of the PROMETHEE II results, showing that the identified hierarchy is driven by underlying structural differences rather than the weighting scheme. This is a key validation step in multi-criteria decision analysis, as it decreases the risk of methodological bias.
From a methodological standpoint, the CRITIC weighting approach provides a more objective basis for evaluation compared to equal weighting. Unlike arbitrary or uniform weight assignment, CRITIC incorporates both the dispersion (contrast intensity) of each indicator and its correlations with other criteria, thereby emphasising indicators that contribute the most unique (non-redundant) information to the decision problem. In this context, the relatively higher weight assigned to indicator P2 does not reflect subjective prioritisation but rather its empirical significance in differentiating circular economy transition patterns across EU countries.
Compared with equal weighting, CRITIC offers a more objective weighting scheme because it incorporates both the contrast intensity of each indicator and its correlation structure with the remaining criteria. Therefore, the higher weight assigned to P2 does not reflect subjective preference but rather reflects that this indicator contributes the most non-redundant information for distinguishing circular economy transition patterns across EU countries.
5. Discussion
The combined application of hierarchical clustering, CRITIC weighting, PROMETHEE ranking, and GAIA visualisation creates a highly heterogeneous governance landscape within the EU. This heterogeneity is not merely quantitative but reflects qualitatively distinct developmental trajectories, institutional logics, and strategic orientations among member states. The model identifies statistically significant differences in multidimensional performance between countries. Institutional explanations are applied cautiously as interpretive extensions consistent with existing EU governance research. This approach preserves methodological robustness by distinguishing data-driven findings from contextual interpretation, while still providing valuable insights into the broader governance effects of circular economy transition patterns. The five-cluster configuration underscores that the EU is not a convergence-based system progressing uniformly toward an integrated governance frontier. Rather, it displays differentiated pathways characterised by asymmetries in structural stability, dynamic reform capacity, institutional performance, and adaptability to contemporary global challenges [
97]. A central insight emerging from the analysis is that structural excellence and dynamic capacity operate as partially independent dimensions of governance performance. Countries may score highly on one dimension while lagging on another, resulting in unique multi-criteria profiles. Ireland and Malta exemplify this through their isolated positions as single-member clusters. Ireland’s hyper-internationalised economic structure, combined with exceptionally strong institutional performance, translates into an outlier profile unmatched across Europe.
In contrast, Malta demonstrates balanced but consistently high performance across all indicators, supported by features typical of successful microstate governance: agile institutions, compact bureaucratic structures, and rapid policy implementation. These two cases highlight that “excellence” in the EU arises from fundamentally different institutional architectures: one based on large-scale global integration, the other on small-state agility. Cluster 1 presents a contrasting pattern. Estonia, Croatia, Lithuania, and Latvia embody a dynamic transformation model driven by ambitious digitalisation agendas, rapid institutional reforms, and increasing adaptability. Their positions in the GAIA plane illustrate a strong alignment with the decision axis dominated by the dynamic indicator P2. These countries do not yet rival Western European states in structural depth, but they excel in responsiveness and innovation, characteristics that are increasingly central to modern governance. Estonia stands out as a paradigmatic digital state, while Croatia’s rapid convergence reflects the effectiveness of post-accession institutional investment. The Baltic states’ collective trajectory underscores how digital governance and agile institutional design can enable smaller states to overcome structural legacies and compete effectively in the broader European system.
Cluster 4, composed primarily of long-established Western European democracies, demonstrates the persistence of the traditional European governance model, characterised by structural stability, legal-institutional maturity, and consistent administrative performance. Yet, this stability paradoxically becomes a source of relative disadvantage under dynamic weighting schemes. Although Germany remains the internal leader of this cluster, combining structural depth with moderate transformation capacity, other traditionally high-performing states, such as Sweden, Denmark, and Finland, appear penalized in PROMETHEE rankings. Cluster 5, representing the modal group of EU countries, demonstrates the broadest internal heterogeneity, capturing Southern European states, Central European reformers, and structurally stable Western micro-states. Countries like Poland and Hungary outperform their cluster peers due to strong reform dynamics and targeted economic strategies, despite structural weaknesses. Meanwhile, countries such as France, Slovakia, Luxembourg, and Portugal remain structurally sound but struggle to keep pace with the dynamic reforms necessary to stay competitive. At the lower end, Greece and Romania exhibit persistent structural vulnerabilities, limited administrative capacity, and slower convergence toward EU governance standards. Cluster 5 thus illustrates the unevenness of governance consolidation within the Union and highlights the divergence between reformist momentum and institutional constraints. The fact that countries like Romania and Bulgaria consistently appear in similar clusters across different studies is not a coincidence due to methodology. Still, it reflects ongoing structural and governance traits captured by the chosen indicators (P1, P2, P3). These countries show a relatively stable multidimensional profile, marked by lower investment in circular economy sectors (P1), limited growth in circular employment (P2), and weaker value added in circular activities (P3). Since clustering methods group countries based on similarities across these dimensions, such structural consistency naturally results in repeated clustering outcomes, regardless of the specific method used. This idea is supported by [
98], who report similar grouping patterns for Eastern European countries, confirming that these results reflect persistent governance structures and development paths, rather than artifacts of statistical modeling. Therefore, the stability of clustering should be seen as evidence of path-dependent EU governance dynamics, where countries follow relatively stable transition paths shaped by institutional capacity, economic structure, and policy effectiveness. For Cluster 1 countries like Estonia, which already show strong dynamic performance, the right path is not capacity building but strategic consolidation and scaling. This includes further strengthening innovation-driven and digital governance mechanisms (P2), expanding high-value circular activities to improve structural indicators (P1 and P3), and acting as policy leaders within the EU by sharing best practices and promoting convergence among member states. Thus, the framework clearly distinguishes between catch-up governance models (Cluster 5) and frontier governance models (Cluster 1), offering not only a diagnostic classification but also a policy-guiding roadmap for the circular economy transition within the EU governance system.
These results also carry important implications for EU policy coordination. Uniform governance benchmarks may fail to capture the systemic diversity revealed here; differentiated support mechanisms, tailored reform pathways, and dynamic performance criteria may be more appropriate in driving convergence and resilience across the Union. As the EU continues to face growing geopolitical, technological, and economic pressures, understanding and strategically leveraging these pressures is crucial. This differentiated governance landscape becomes essential for designing effective cohesion, recovery, and digital transition policies. Although the study provides a rigorous multi-method assessment of governance performance across EU member states, several limitations must be acknowledged. First, the reliance on three indicators oversimplifies the multidimensional nature of governance, underscoring the need for future research that incorporates broader economic, administrative, and social variables. Second, the cross-sectional design precludes analysis of temporal evolution, making longitudinal PROMETHEE-GAIA models a promising avenue for capturing reform dynamics and institutional trajectories. The clustering solution, while statistically validated, is sensitive to methodological choices. Also, alternative algorithms and resampling-based stability tests could enhance robustness [
99]. On the other hand, CRITIC weighting, although objective, reflects statistical rather than normative priorities, and future work should compare statistical weights with policy-driven or stakeholder-derived schemes. PROMETHEE’s outcomes depend on chosen preference functions, indicating the value of testing alternative specifications and conducting sensitivity analyses. Additionally, GAIA reduces dimensionality, which may obscure latent structures, motivating exploration of nonlinear visualisation techniques such as t-SNE or UMAP. Unlike non-linear methods, which are mainly exploratory and can distort global distances to emphasize local structures, GAIA preserves the overall preference relationships, the criterion weights derived from the CRITIC method, and the interpretation of the decision axis, all of which are vital for policy-focused analysis. Additionally, GAIA provides direct insights into the relative contributions and interactions of criteria, facilitating the interpretation of trade-offs among indicators. Importantly, the robustness of GAIA in this study relies not only on the retained variance (79.1%) but also on multiple validation procedures. These include silhouette analysis (average silhouette score of 0.433), which confirms meaningful cluster separation. ANOVA results demonstrate inter-cluster differences; Levene’s test confirms homogeneity of variances; and density matrix visualization reveals consistent multidimensional patterns that align with the identified clusters. The GAIA method is inherently connected to PROMETHEE, offering a geometric representation of preference flows that directly reflect criterion weights, trade-offs, and the decision axis, ensuring complete consistency between ranking results and their visual interpretation. Collectively, these findings illustrate that GAIA provides a methodologically robust and decision-consistent representation, making it more suitable than non-linear alternatives for this study. In contrast, t-SNE and UMAP are primarily exploratory techniques that focus on local similarity structures and may distort global distances and relationships, limiting their usefulness in multi-criteria decision-making contexts where interpretability and preservation of preference structures are essential. The findings are EU-specific, and comparative studies across OECD or non-EU regions could reveal whether the identified governance typologies generalise beyond Europe. The current model excludes political variables such as regime characteristics, party dynamics, and public trust, which future research could integrate to better explain governance patterns. Incorporating crisis-response indicators, pandemic management, energy resilience, or cybersecurity may provide deeper insight into adaptive governance capacity. Finally, expanding this framework into predictive modelling could help anticipate which countries are likely to shift clusters as their structural and dynamic conditions evolve.
6. Conclusions
The results obtained using the CRITIC-PROMETHEE-GAIA model clearly confirm that EU governance systems do not converge toward a single, homogeneous model but instead evolve through diverse, differentiated governance pathways. The clustering analysis identifies distinct governance regimes across member states. At the same time, the PROMETHEE-GAIA results show that dynamic governance capacity (P2), which captures adaptability, institutional responsiveness, and the ability to mobilize economic actors, plays a dominant role in shaping performance outcomes. This is further confirmed by the alignment of the decision axis in the GAIA plane. Consequently, the findings support the idea that contemporary EU governance is increasingly characterized by transformation capability rather than purely structural maturity, reflecting a multi-speed governance architecture within the Union. The PROMETHEE-GAIA results suggest that European governance models are evolving along two distinct pathways. The first pathway is characterised by high structural maturity but limited dynamic adaptability. States such as Sweden and Belgium exemplify this pattern, maintaining strong performance across structural indicators but showing limited capacity for transformation in areas such as digitalisation, regulatory innovation, and public-sector agility. The second pathway, exemplified by Estonia and Croatia, is characterised by rapid transformation dynamics that compensate for lower historical structural endowments. This duality implies that EU governance frameworks should adopt a differentiated approach to capacity-building and benchmarking, rather than imposing uniform performance expectations across the Union. The low ranking of Romania and Greece reflects deficiencies across both structural and dynamic indicators, particularly in the dynamic dimension (P2), which captures the expansion of employment in circular economy sectors. Therefore, policy recommendations must go beyond general improvements in administrative capacity to focus on targeted circular economy interventions. Specifically, these countries should prioritize increasing private investment (P1) in circular economy infrastructure, such as recycling systems, repair networks, and resource-recovery facilities. Furthermore, Romania and Greece should stimulate job creation in circular sectors (P2) through targeted labor market policies, incentives for green enterprises, and support for SMEs engaged in recycling and reuse. Additionally, strengthening the contribution of circular sectors to the economy by improving gross value added (P3) through innovation, technological upgrading, and integration into EU circular value chains also has a strong impact on policy. The results clearly indicate that improving only structural conditions is insufficient. Instead, a simultaneous strengthening of the capacity for dynamic transformation is required. This interpretation is fully consistent with the PROMETHEE ranking and the GAIA visualization, in which these countries are positioned far from the decision axis, reflecting weak alignment with the preferred multidimensional profile of circular economy development.
For highly dynamic states, the primary challenge is sustaining a transformational process while expanding structural robustness, especially in long-term institutional stability and administrative capacity. For structurally mature but less dynamic states, policy recommendations include stimulating experimentation in digital governance, reducing administrative rigidity, and fostering agile regulatory environments that can support next-generation technological and economic transitions. For low-performing states such as Greece and Romania, the policy agenda must address foundational structural efficiency, administrative capacity, and regulatory quality, combined with targeted EU-level support for dynamic reforms. The integrated CRITIC-PROMETHEE-GAIA approach, combined with hierarchical clustering and validated through silhouette analysis and density matrix visualization, provides a robust and scalable framework for monitoring circular economy transition performance across countries. The robustness of the results is confirmed through multiple validation procedures, including statistically significant ANOVA results, acceptable homogeneity of variance (Levene’s test), a silhouette coefficient of 0.433 indicating meaningful cluster separation, and consistent patterns observed in the density matrix. Additionally, sensitivity analysis demonstrates that the ranking remains stable under alternative weighting schemes, confirming that no single indicator drives the results and that the results reflect a consistent multidimensional structure. Therefore, this framework can be used not only for cross-sectional comparisons but also as a longitudinal monitoring tool to track progress, identify structural gaps, and support evidence-based policymaking in the circular economy domain. It provides policymakers with a systematic method for evaluating both structural readiness and transformation dynamics, which are essential for achieving sustainable and resilient economic systems within the European Union.
7. Practical Implications
The analysis presented in this research points to several key policy implications for improving governance performance across the EU and the implementation of CE measures. First of all, statistical agencies should improve the completeness and timeliness of data publication. Relevant indicators, such as Private investment and gross added value related to CE sectors (i), Persons employed in CE sectors (ii), and Gross value added as a percentage of GDP at current prices (iii), exist, but are not available for all years. This makes it difficult to continuously monitor trends and make decisions, which can slow down the effective transition toward a CE.
Second, as member states pursue different development paths, EU institutions should ensure cross-sectoral policy coordination and adopt more flexible, efficient approaches. To achieve balanced CE development across the EU, strengthening collaborative networks could help reduce disparities. Regional disparities in the implementation of the CE are linked to levels of economic development and the availability of investment resources. They show how complex the transition to a sustainable economic model is in the EU. To reduce these differences, it is necessary to develop tailored public policies, ensure adequate financing, and encourage cooperation among member states. Investments in infrastructure, education, and new technologies are key to strengthening and unifying the CE across the EU. Policies aimed at developing the CE should take into account regional differences among EU member states and encourage the development of new knowledge and skills in the labour market needed to carry out CE activities. Education systems and labour market policies should encourage the development of new skills needed for CE activities, especially in segments such as recycling technologies and repair services.
Countries with strong institutions should accelerate the modernisation of administrative processes and digitalisation to implement CE strategies and remain competitive more effectively. Countries with weak capacities should receive targeted EU support, including technical assistance, knowledge sharing, and initiatives to strengthen the efficiency of governance and implementation of CE policies. Strategic cooperation between countries could significantly accelerate CE progress, and governments should promote stronger collaboration among public institutions, business, and civil society.
Low-performing states such as Greece and Romania face structural weaknesses and limited sector capacity. To improve the CE performance in those countries, retraining and training programs are necessary. These programs should develop skills in recycling, reuse, and secondary materials management. This increases workforce flexibility and reduces existing gaps. Aligning workforce development with sectoral transformation can significantly help reduce structural constraints and improve the overall performance of these countries within the cluster. Further improving sectoral dynamism is possible through cross-sector skill transfer initiatives, and more effective policy implementation can be supported by financial investment in innovation and workforce development.