Article

Evaluating Fare Structure with Best–Worst Method for Improving Sustainable Transit Operations: Istanbul Metro Example


by
Ömer Murat Urhan
* and
Mustafa Gürsoy
Department of Civil Engineering, Yildiz Technical University, Istanbul 34220, Türkiye
*
Author to whom correspondence should be addressed.
Sustainability 2026, 18(8), 3715; https://doi.org/10.3390/su18083715
Submission received: 3 March 2026 / Revised: 29 March 2026 / Accepted: 2 April 2026 / Published: 9 April 2026

Abstract

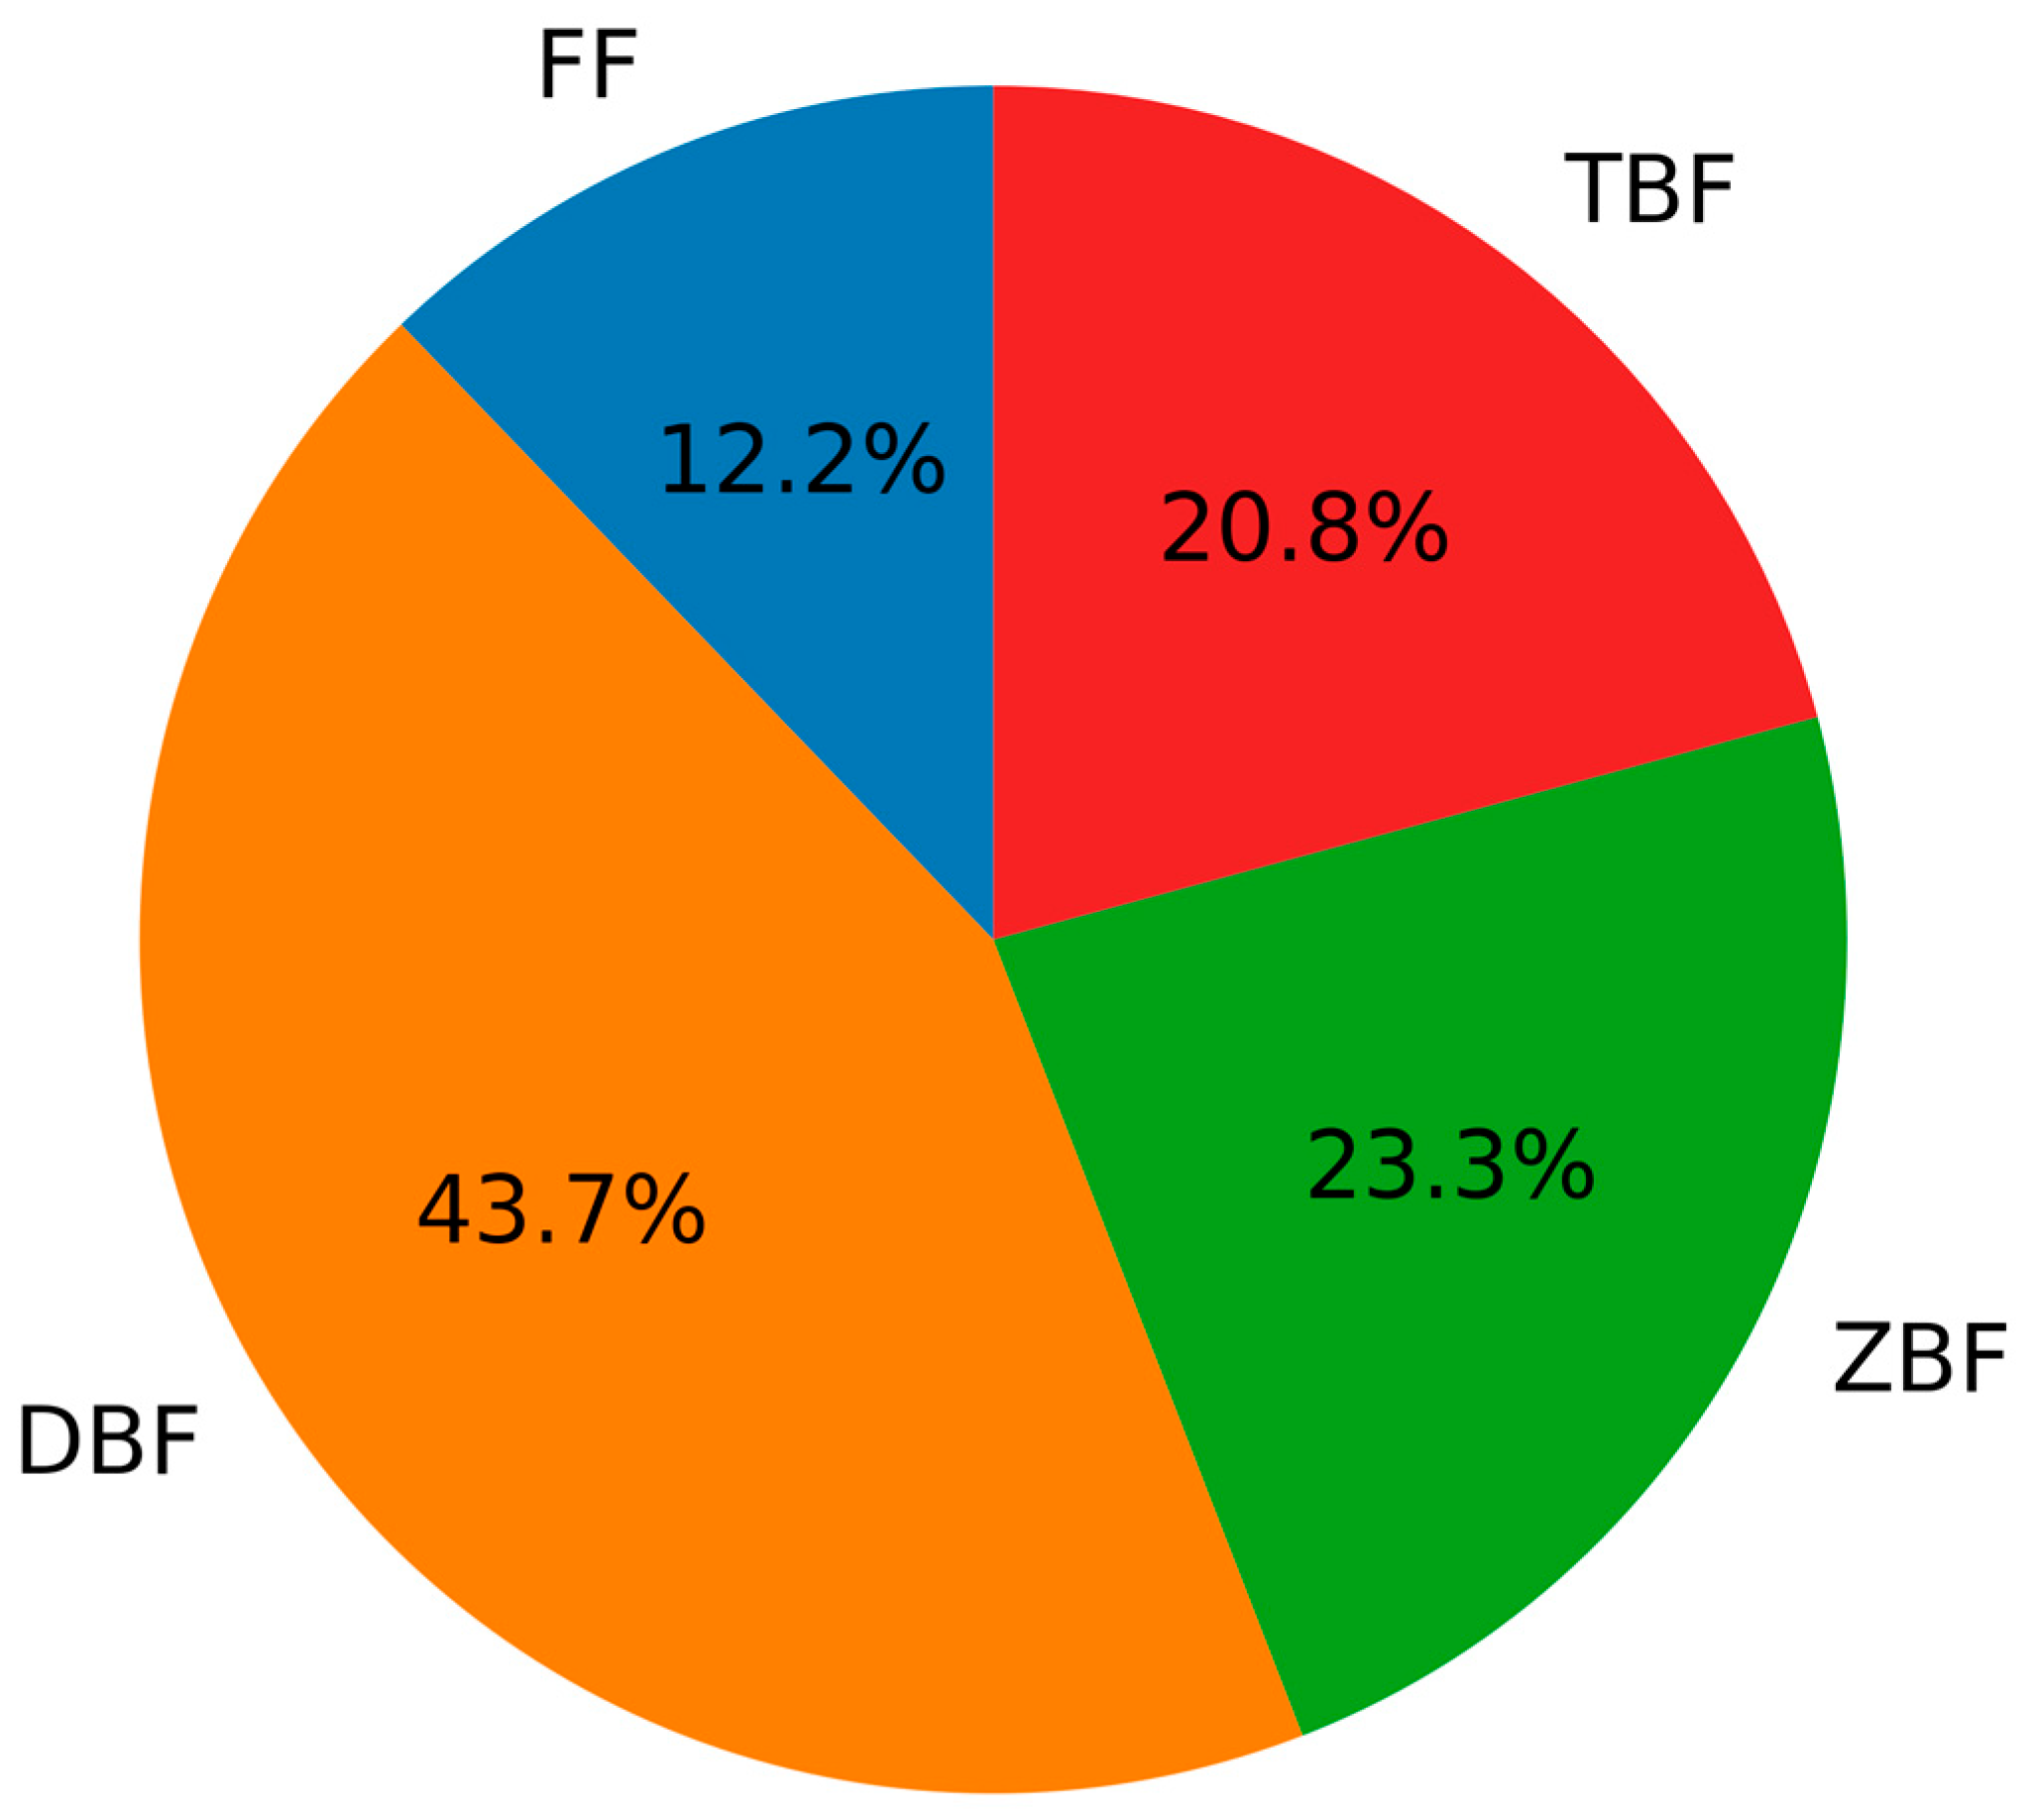
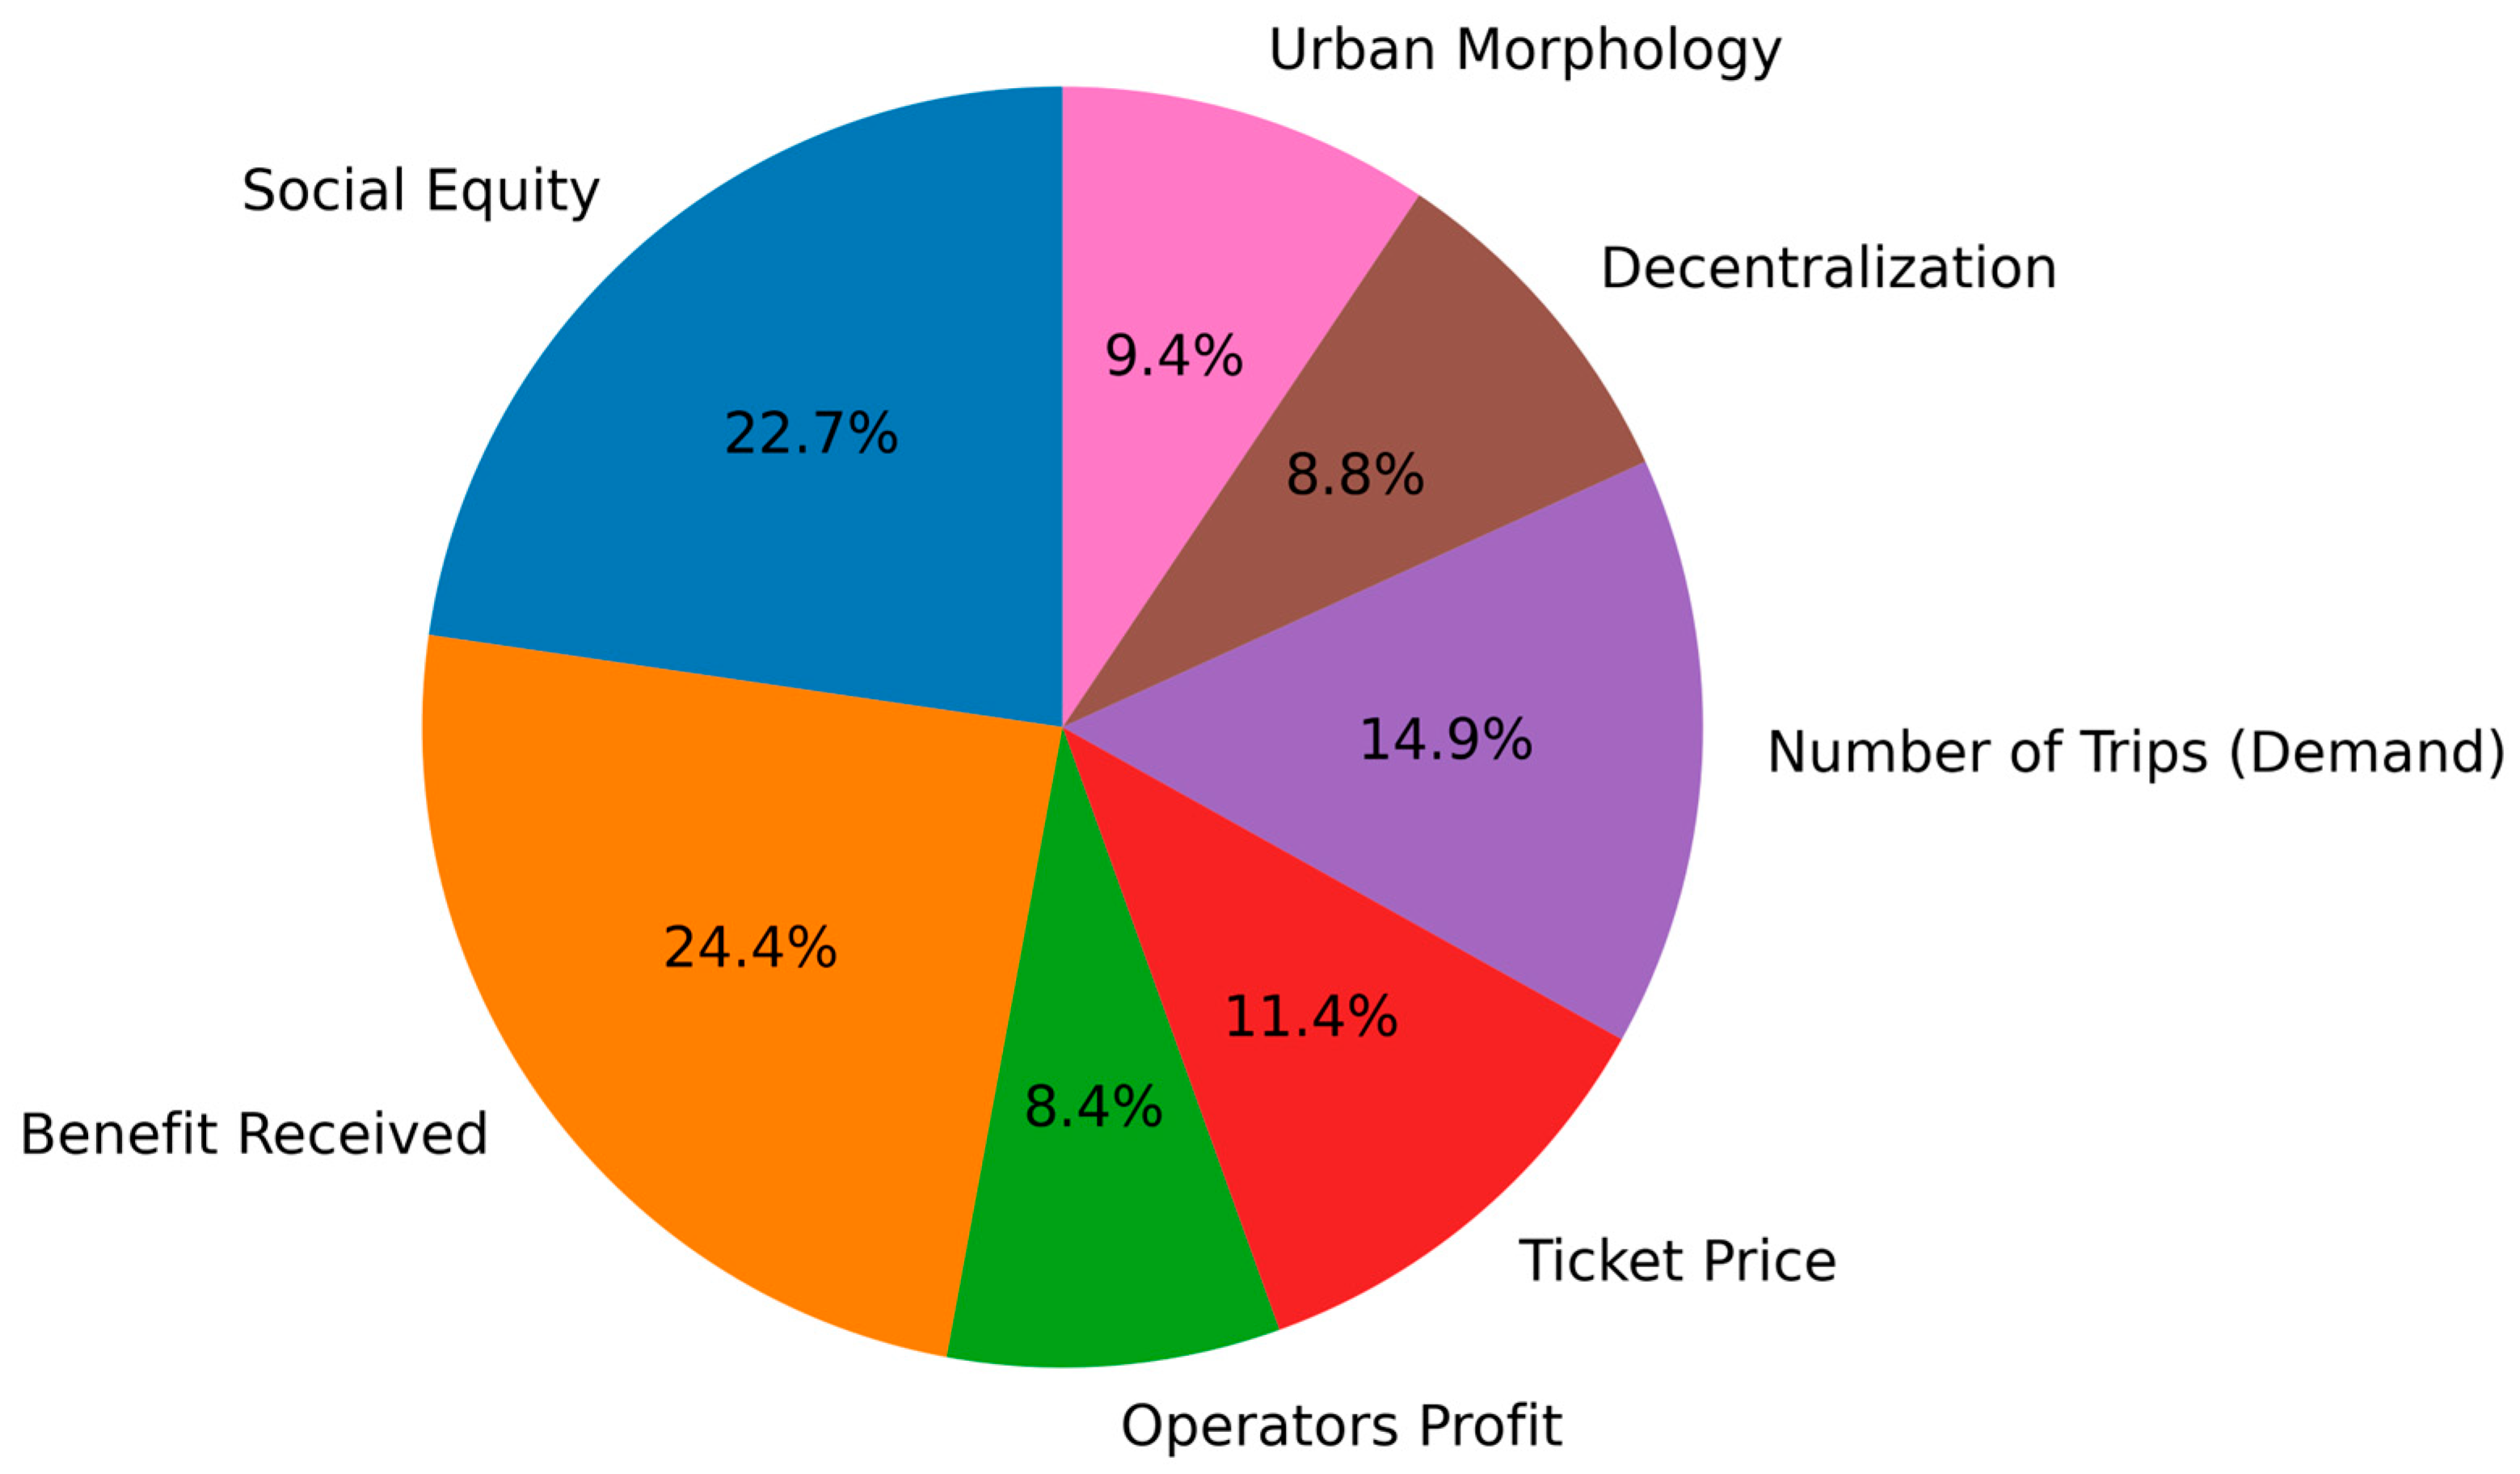
Public transportation (PT) is key to breaking the vicious cycle of private vehicles, a critical sustainability challenge in developing countries. The increase in population raises the number of private cars, and this trend continues. PT plays a vital role in reducing car use, traffic congestion, and environmental pollution. Fare is crucial to the system’s ability to encourage passengers to use PT. It affects mobility, the quality of life, and the sustainability of the system. This study aims to examine Istanbul’s optimal fare system using the BWM (Best–Worst Method) for PT fare for the first time. Furthermore, it is the first study to compare fare structures and criteria for Istanbul, Europe’s second-largest city, where transportation affects quality of life. The most frequently used fare structures and criteria in the literature and practice were weighted by experts using BWM surveys for the Istanbul Metro. The results show that distance-based fare (DBF) (43.7%) is the best fare structure, while flat fare (FF) (12.2%) is the weakest. For the criteria weightings, benefit received (24.4%) and social equity (22.7%) are seen as superior. Finally, the impact of the criterion on the fare structure was demonstrated through analysis, and its importance for experts in evaluating PT was highlighted.

1. Introduction

In urban areas where the population increases day by day, the importance of transportation planning and decisions also increases. Since these plans and decisions affect not only passengers and operators but also the entire city, they need to be considered by administrations from many perspectives [1]. The plans can change where cities will grow, where they will generate profit, which areas they will develop, and which areas will lose their attractiveness. For this reason, plans and projects in the field of transportation should be long-term and based on a wide range of sources and accurate data.
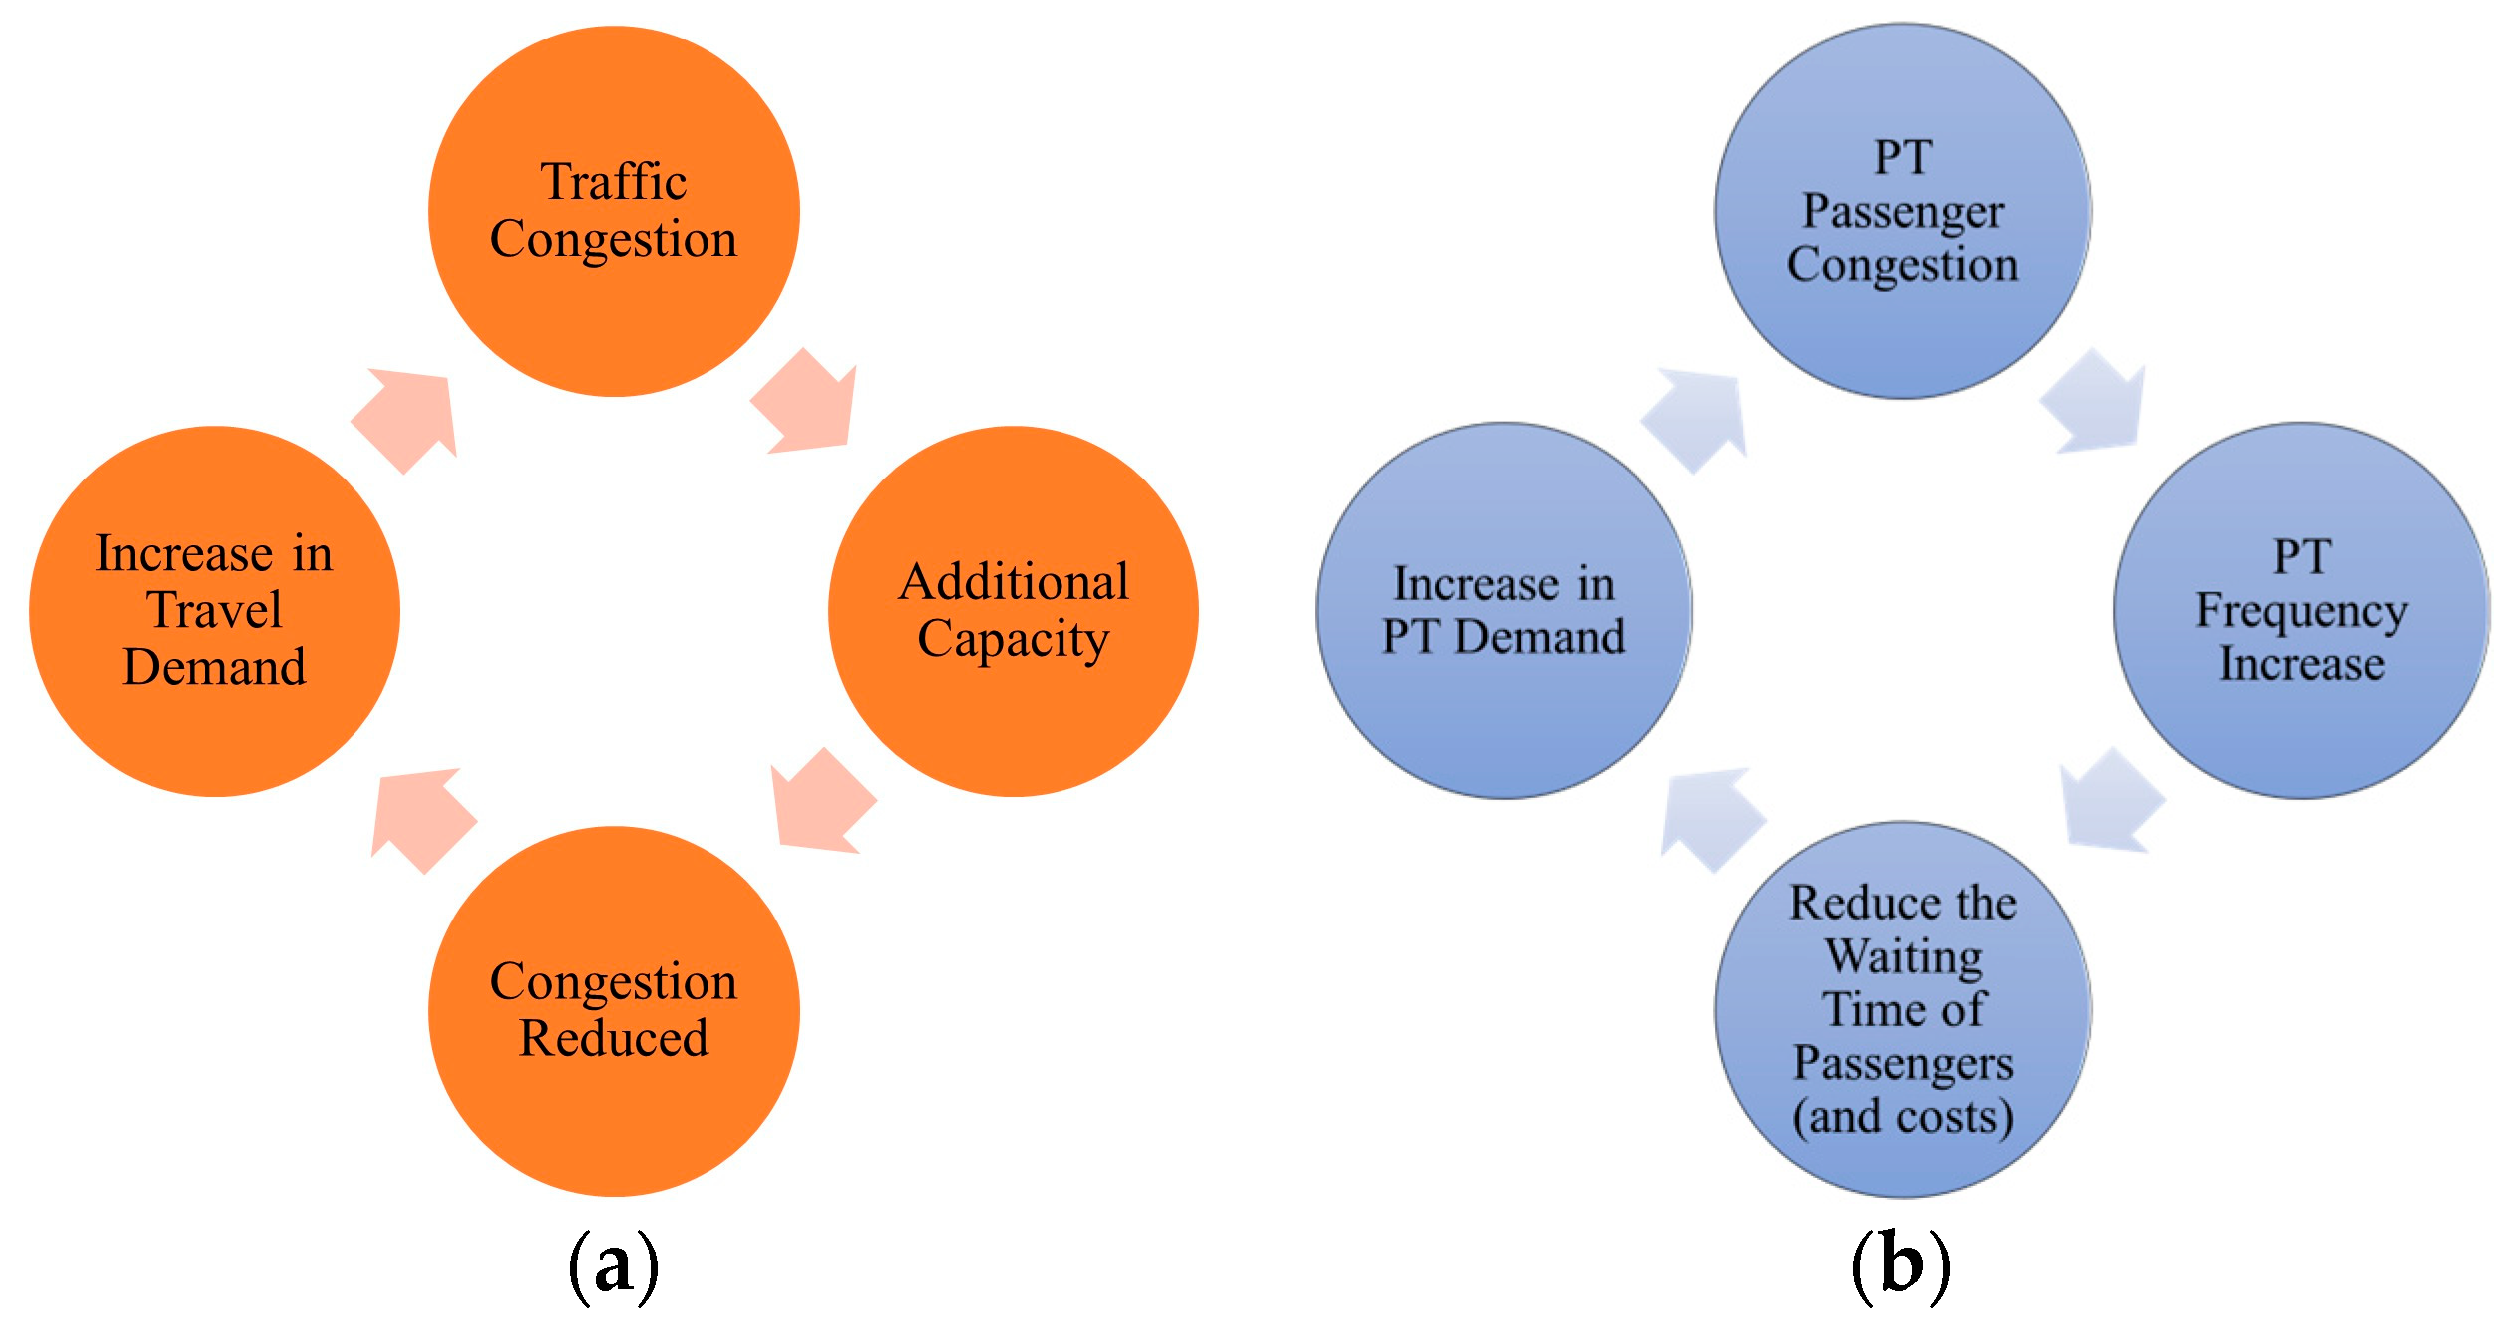
In modern urban structures, despite high levels of travel demand, the traditional transportation approach, dependent on cars, creates a vicious cycle. This vicious cycle is explained in Figure 1. The increase in demand causes traffic congestion due to limited road capacity. Local and central governments implement solutions such as building new roads or widening existing ones to increase capacity and eliminate congestion. These solutions reduce traffic congestion for a short period, and this reduction, by making that route a preferred option for other travelers, leads to increased demand for that route again. As a result of this increase in demand, congestion begins to occur on the newly built road intended as a solution, and the vicious cycle starts all over again [1].
In Traffic in Towns, the author argues that this vicious cycle should be broken in modern cities. Buchanan emphasizes that the car is an expensive mode of transportation and, therefore, different systems should be developed in cities with populations over 100,000 [1]. One of the main recommendations to break the vicious cycle is to focus on rail systems. Vivier et al. reported that public transport (PT) users, on average, consume one-quarter as much energy per passenger-kilometer as private cars. Still, increasing congestion on urban roads and highways in many cities has led to greater investment in car-oriented infrastructure, while relatively few cities have prioritized investments in PT [2].
H. Mohring emphasizes that this vicious cycle will not occur with an increase in demand for PT and rail systems. An increase in demand creates a positive externality. It is known in the literature as the Mohring effect. The Mohring effect is the observation that if the frequency of a transit service (e.g., trains per hour) increases with demand, then a rise in demand reduces passengers’ waiting times at stations. Because waiting time is part of the costs of transportation, the Mohring effect implies increasing returns for scheduled urban transport services [3]. Returns to scale refers to the proportionality of output changes in response to changes in all inputs, with increasing returns to scale occurring when output increases more than proportionally to an equal increase in all inputs.
For example, passengers arrive at a bus stop at random intervals, while the bus arrives twice per hour. The average waiting time is 15 min (30/2 = 15). If the number of passengers per hour increases to justify four buses per hour, then the average waiting time falls to 7.5 min. The presence of additional users reduces the cost for existing passengers. This anti-congestion effect is opposite to Buchanan’s usual road congestion effect, where an increase in the number of users decreases the speed and the level of service (LOS) of the other users [3]. As the number of passengers arriving from outside the system increases, the average cost per passenger will gradually decrease [4]. Mohring argued that rail transit can shift passengers’ travel behavior by inducing a modal shift, thereby generating a traffic diversion effect. By reducing reliance on private cars and taxis, rail systems help improve air quality by lowering emissions [5]. From the user’s perspective, this virtuous cycle is explained below (Figure 1).
From the operator’s perspective, the situation is different. In PT design, service providers face conflicting objectives. Users want to reduce waiting time (more frequent service). Decreases in headway (time between arrivals) can only be achieved by increasing the fleet size and/or vehicle speed, both of which increase the operator’s cost. Understandably, the operator seeks to minimize departures to reduce costs [6]. So, how should PT fare be determined? In this case, tailored solutions should be applied for PT fares.
To find a tailored solution for the city of Istanbul, it is necessary to understand the reason for fare reconstruction. The farebox recovery ratio (FRR) of Metro Istanbul, defined as the share of operating costs covered by passenger revenues, is reported in the Strategic Plan as 68.41% for 2021, 78.23% for 2022, and 75.92% for 2023, with a target of 77.50% set for 2024 [5]. The operating deficit, defined as the proportion of operating costs not covered by fare revenues, was 31.59% in 2021, 21.77% in 2022, 24.08% in 2023, and projected at 22.50% in 2024 [5].
Globally, high FRRs are observed in Hong Kong (~107%), Singapore (~101%), and Taipei (~88%), while European systems range from ~30% to ~94%, and North American metros typically achieve 30–40%. The London Underground exceeds 129%. Istanbul’s ratio is moderate, higher than many North American and some European systems, but below top-performing Asian and UK metros [4,5]. In addition to cost recovery, understanding the distribution of trip lengths provides further insight into passenger travel behavior and system usage patterns. According to 2025 data for the Istanbul Metro, long-distance trips—defined as journeys of six or more stations—account for 31.7% of all trips. Among short-distance trips, the most frequent journey length is three stations, whereas for long-distance trips, seven stations are the most common [5].
Section 2 covers PT and fare in the literature. The most commonly used fare decision criteria and fare structures, both in the literature and in practice, are explained in detail. Section 3 discusses data and methodology. Istanbul and the Istanbul Metro are mentioned in this section. A definition for the Best–Worst Method (BWM) and its application in the study are then explained. Section 4 presents the results of the study. This section also includes mathematical and statistical analyses. Section 5, the Discussion, presents the study’s results and other outputs and provides expert opinions on the Istanbul Metro’s fares.

2. Conceptual Review

Fares constitute the core of PT, playing a crucial role in shaping ridership patterns and the financial sustainability of transit agencies [7]. When decision-makers aim for a more sustainable city based on PT, an optimal fare strategy can create more compact cities, reduce carbon emissions and maintenance costs, thereby significantly improving sustainability [8].

2.1. Fares and Subsidies

PT capacity was extended in many cities and severely subsidized to attract car drivers [9]. Another reason to subsidize is to improve the mobility of low-income [10]. Except in some Asian cities, PT services provided worldwide are financed by local budget revenues. Substantial subsidies are provided to those who benefit from PT services. The positive externalities, such as providing general mobility, facilitating access to employment and education opportunities, creating a sustainable urban structure, and reducing pollution and congestion levels caused by car use, are important reasons for subsidization. However, when the budget constraints and borrowing problems experienced by local governments are considered, the old fare structures are not working [9]. An efficient fare structure, coupled with good service quality, can encourage demand and increase revenue [6]. But many PT agencies increase fares when faced with a budget shortfall [7].
Deakin and Harvey argued the need to be aware of the equity implications of fare change policies. They noted that “transportation fare increases are especially a concern for low-income people who have a limited ability to ‘choose’ to pay the higher costs and hence would be priced out of routine use of certain high-cost travel options” [11]. Governments want low PT fares to guarantee the mobility of low-income users who cannot afford other means of transport [4].

2.2. Fare and Elasticity

Fare elasticity of demand is the percentage change in demand for a service because of a 1% change in its fare. Elasticity establishes the relationship between fare and demand. Revenue is the sum of all the fares paid by passengers. Fare elasticity measures the responsiveness of quantity demanded to a change in fare and is defined as the percentage change in quantity demanded per 1% change in fare [12].
Mayworm found that demand is inelastic with respect to fare [13]; fare increases have increased revenues but slightly decreased ridership. Thus, while transit properties have moved toward one of their goals through such actions, they have moved away from others, including increasing ridership and better service [14]. By comparing revenue, ridership, passenger miles traveled, and consumer benefits associated with fare structures, Ling found that the optimal fare should depend on the elasticity of demand [15]. For Cummings, the ridership is not reactive to fare changes [16]. Voith found that the elasticity of demand (with respect to fares) is twice as great in the long run as it is in the short run [17]. Harris et al. developed a fare elasticity model to predict the ridership and revenue impacts of proposed fare changes [18]. Passengers are more sensitive to changes in travel time than to the PT fares. They are more sensitive to waiting time, access/egress time, and, finally, in-vehicle time. Furthermore, commuters are less sensitive to costs and more sensitive to in-vehicle time compared to non-work users [19]. Under both distance-based fare (DBF) and flat-fare (FF), the elasticity factor plays a significant role in determining fare levels and demand. As fare elasticity increases, social welfare declines, and deficits are more likely to arise under conditions of low fares and weak demand [20].

2.3. Fare Structure

NTU (Associação Nacional das Empresas de Transportes Urbanos) highlights that the fare structure is pivotal to PT policies, as it significantly affects passengers’ socio-economic outcomes, land-use patterns, and the sustainability of transport systems [21]. Differentiated fare structures are a fruitful tool for demand management [22].
The most prominent fare structures in theory and practice are given below:
  • Flat fare (FF) does not vary based on any factor. All passengers pay the same fare.
  • Distance-based fare (DBF) determined by the distance or the number of stations crossed.
  • Time-based fare (TBF) determined by when the trip is made.
  • Zone-based fare (ZBF) determined by where the trip is made, and no zones crossed.

2.3.1. Flat Fare (FF)

FF is an application for a fixed fare regardless of the distance, time, or zone traveled. The advantages of FF are simplicity, understandability, marketability, ease of collection, cost-effectiveness in implementation and administration, and minimal fare evasion [23]. Fare evasion is the act of traveling without payment or paying less than the fare.
For example, the FF structures in Washington, D.C., Paris, London, and Barcelona were thought to reduce barriers to PT use and increase ridership [24].
Fare increases will cause a loss of riders on FF. In addition to overpricing short trips, FF ignores the revenue potential of longer trips, which might well be priced higher without discouraging riders [14]. Researchers have criticized FF as unjust [25] because short-haul passengers seriously subsidize long-haulers [26]. Therefore, the FF system is well-suited to centralized cities and short-distance trips [8].

2.3.2. Distance-Based Fare (DBF)

DBF aims to charge travelers of longer distances more because they use the system more. Vehicles operating on longer routes incur higher maintenance and operational costs. Implementing distance-based fares ensures fairness by charging passengers proportionally to the distance traveled. The Utah Transit Authority (UTA) is considering a DBF structure to increase ridership and overall farebox revenue [27]. Since PT operating costs are linked to route length, this approach is more advantageous for authorities on longer routes with higher operating expenses [28].
Raising fares for long-distance passengers can encourage a shift toward less sustainable transport modes. Therefore, the spatial disparities in the social benefits of DBF must be carefully assessed to allow comparison with associated economic and environmental costs [27]. The downside is the difficulty of implementation and administration; it may require special equipment (refund devices for stations) [23].
The DBFs in Taipei, Taiwan [29]; Seoul, South Korea; Hong Kong; and Israel [30] have achieved the goal of increasing ridership and revenue, reflecting their strength in fairness and dominance over other modes [24].

2.3.3. Time-Based Fare (TBF)

TBF operators vary fares by time of day, typically charging higher fares during peak hours and lower fares during off-peak hours [31]. Higher fares are intended to balance the higher costs of providing service during peak hours [26], shift passengers from peak hours to other hours, or increase ridership and revenue [32]. In theory, TBF should increase ridership. TBF can be understood, in a sense, as a congestion-related fare adjustment.
When PT demand reaches its peak, the user’s sensitivity to fares decreases, and users are willing to pay higher fares. In addition, PT service costs also increase at this peak. Fare differentiation can also be applied on a day–night, weekday–weekend, or seasonal basis. When a city has traffic congestion, TBF is not an advantageous choice. If PT fares increase during peak hours, users may be more willing to use their cars [33].

2.3.4. Zone-Based Fare (ZBF)

ZBF is a structure that can be used in large, zone-divided cities, such as London or Paris. In ZBF, the fare does not depend on the distance traveled but on whether the journey crosses into a different zone. Passengers who remain within the same zone pay the standard fare, while those crossing into another zone pay an additional transition fare on top of the standard fare. A limitation of ZBF is that differing zone fares can encourage urban decentralization [28].
As Simic et al. emphasize, all PT fare structures can produce different results, especially depending on the area. FF can provide more benefits for small cities. ZBF is suitable for cities that have zones. DBF can demonstrate its benefits in cities divided into groups that travel long and short distances. In addition, the point that most researchers agree on is the advantages of DBF [28].
Table 1 presents the advantages and disadvantages of fare structures. Seven evaluation criteria are defined in the next chapter. Studies from the literature were used to determine the most appropriate criteria for Istanbul.

2.4. Fare Structure Assessing Criteria

According to the literature review, the seven most commonly used fare structure assessing criteria are social equity, benefit received, operator profit, ticket price, number of trips, decentralization, and urban morphology. Although not used as criteria in this study, ability to pay, operator cost/revenue, maximum profitability, complexity, passenger control, implementation difficulty, long trips, payment types, implementation costs, Gini coefficient, train headway, and social welfare are mentioned in the literature.

2.4.1. Social Equity

Nuworsoo proposed three equity criteria for PT fares: (1) the level of service received, reflected by distance, number of zones, or total travel time; (2) the cost of delivering the service; and (3) their ability to pay, based on income or wealth [7,20].
Equity is divided into two types: horizontal and vertical equity. Horizontal equity requires equal distribution of investments, benefits, and costs among members of society. In PT, it means a passenger pays as much as they would to use the system. Vertical equity requires the distribution of costs and/or benefits according to users’ service needs or payment capacities [12]. In this work, social equity criteria are applied vertically, and benefit-received criteria horizontally.
The social equity criterion has been underrepresented in PT research and practice, or represented inconsistently (varying by region) [27,34]. A fare system is considered less fair if low-income users are charged more relative to higher-income users, as this violates the principle of equity [31]. Transportation policies are vertically equitable when they favor disadvantaged and underserved groups [35].
In 2023, the ratio of monthly pass to average monthly net income in cities around the world was investigated [36]. The results showed that Istanbul ranked first in Europe and second in the world. São Paulo (14.3%), Istanbul (7.5%), and London (7.4%) were in the top three. The fact that the proportion of income allocated to PT is so high indicates that Istanbul needs to take steps towards social equality. The literature review revealed that social equality was used twice as a criterion in this field.

2.4.2. Benefit Received

The benefits-received criterion holds that users should pay for transit in proportion to the benefits they receive from their trips (horizontal equity). It implies that people should “get what they pay for and pay for what they get” unless subsidies are specifically justified [37]. For example, a PT planner adopting this perspective would seek to distribute the burdens and benefits of a project evenly throughout the community. However, one problem with horizontal equity is that it fails to adequately account for existing social inequalities [38].
Since overall passenger benefit and satisfaction vary across fare structures, it would be most appropriate to choose the option that maximizes total passenger benefit. The literature revealed that the benefit received was used as a criterion five times in this field.

2.4.3. Operators’ Profit

Since operating costs often exceed ticket revenue, fixed subsidies should be considered to maintain the operator’s financial viability [39]. In designing a PT, the operator must decide on the LOS to provide and the fare. To establish a financially sustainable system, social welfare or profit must be maximized. When costs exceed revenues, the aim will be to minimize the subsidy amount. In achieving these goals, designing a PT with an appropriate LOS and fare structure is important [40].
The process of establishing and subsequently modifying fares is inherently complex. It requires difficult trade-offs, as it seeks to balance fairness for the populations served with the need to generate adequate revenue for the operator [20]. The literature review revealed that operators’ profit was used as a criterion four times in this field.

2.4.4. Ticket Price

Considering the population’s average income, the administrator should aim to balance fares and mobility costs for users [23]. Increasing ticket fares will encourage short-distance PT passengers to switch to walking and cycling, and long-distance passengers to switch to cars and taxis. In this case, the number of PT passengers and operating revenues may decrease [41]. The literature review revealed that ticket price was used twice as a criterion in this field.

2.4.5. Number of Trips (Demand)

Passengers will reduce the number of trips when they consider the fare suboptimal and increase the number of trips when they consider the fare optimal. The cost of the service offered, and the cost–benefit ratio are the main reasons for the increase in the number of trips [23]. Matas et al. argued that short-distance travelers subsidize long-distance travelers at Barcelona’s flat fare [19]. According to Donnelly, the main objectives of TBF are to increase passenger numbers and revenue [32]. In previous work, long-distance trips in FF, short-distance trips in DBF, and non-peak-hour trips in TBF will be encouraged, and the number of these trips will increase [19]. The literature review revealed that the number of trips was used as a criterion in this field four times.

2.4.6. Decentralization

PT in decentralized areas is less efficient than in dense areas, and operating costs are also higher. Nevertheless, a system that increases the burden on those who must wait in longer lines may encourage them to choose a home closer to their workplace and social surroundings [8]. The concentration of urban areas offers advantages for both PT and overall quality of life. When centralization-oriented fare structures such as DBF or ZBF are implemented, people tend to reside closer to their workplaces and social surroundings. This results in shorter travel distances, more efficient route networks, and lower vehicle operating costs. Therefore, fare systems that encourage urban centralization can be considered more advantageous [28]. The decentralization criterion also overlaps with TOD (Transit-Oriented Development). The literature review revealed that decentralization was used twice as a criterion in this field.

2.4.7. Urban Morphology

PT fares will differ across cities with different urban morphologies. ZBF may be appropriate for cities divided into regions with distinct characteristics, FF for single-centered cities, and DBF for cities with an east–west (or north–south) direction [15]. The literature review revealed that urban morphology has not been used as a criterion for PT fares. It was introduced to the literature with this study.

2.5. Fare Collection

Having established the criteria for evaluating fare structures, it is also important to consider the technological systems that enable their practical implementation and analysis. In recent decades, smart cards and automated fare collection (AFC) systems have become widely adopted in PT networks worldwide. These systems allow transit agencies to efficiently manage fare payments while simultaneously generating large-scale and detailed datasets on passenger travel behavior. Compared to traditional ticketing systems, smart card data provides valuable information such as boarding locations, travel times, and passenger demand patterns.
Consequently, smart card data have been widely utilized in the literature for various applications, including passenger flow analysis, travel demand estimation, and service planning. For instance, Lee et al. [42] proposed a passenger-to-train assignment approach based solely on smart card data, demonstrating the potential of such datasets for understanding passenger distribution within transit systems. Similarly, Zhou et al. [43] analyzed subway smart card data from Beijing to model heterogeneity in passenger preferences, highlighting AFC data’s ability to capture behavioral differences among transit users. These studies indicate that smart card systems not only improve operational efficiency in fare collection but also provide a powerful data source for transport planning and policy evaluation. While both contribute valuable insights into travel behavior and operational patterns, this study diverges by centering on fare structures and criteria. Specifically, it integrates travel data with a BWM to assess and rank fare components that influence system performance and equity in the Istanbul Metro context. The emphasis on fare system design and the assessment of evaluation criteria differentiates the present research from the broader literature on smart card data analytics and transit fare policy.
Although a substantial body of research has examined fare structures and fare policies, several important gaps remain in the literature. Previous studies have predominantly focused on specific dimensions such as demand elasticity, revenue impact, or equity. However, comprehensive frameworks that simultaneously evaluate fare structures across multiple criteria remain limited. Aspects such as passenger benefits, operator financial sustainability, travel demand effects, and spatial characteristics of urban systems are rarely assessed within an integrated evaluation framework.
Furthermore, while smart card and automated fare collection data have significantly expanded the possibilities for analyzing passenger travel behavior, most studies using these datasets focus primarily on mobility pattern analysis rather than on designing and evaluating fare structures. Consequently, the relationship between fare system design and the criteria used to assess their performance remains insufficiently explored.
To address these gaps, this study develops a multi-criteria evaluation framework (BWM) for comparing fare structures and criteria. The proposed approach incorporates economic, social, and operational criteria, including social equity, benefit received, operator profit, ticket price, travel demand, decentralization, and urban morphology. By integrating these criteria into a structured decision-making framework, the study contributes to the literature by providing a comprehensive approach for assessing fare structures and supporting more sustainable fare policies.

3. Data and Methodology

Istanbul has experienced significant growth in land use and population over the last five decades. With this growth, Istanbul is now Europe’s most populous metropolis. Beyond its population of around 16 million, the ratio of young and working people in the population is also high. For the reasons stated above, the transportation structure has become complicated, and traffic and transportation problems have become the most important issues in Istanbul, with traffic jams every day and millions of dollars of lost time and fuel costs, ultimately leading to people become worse off regarding their quality of life [5].
De Gruyter et al. showed that Eastern Europe has higher overall performance in PT sustainability measures. In the study, eight cities were given in the Eastern European group, and the largest of these cities is Istanbul [44]. However, there are no studies in the literature that comprehensively examine PT fares in Istanbul. This study was prepared to address a gap in the literature on Istanbul.

3.1. Transportation in Istanbul

According to the TomTom Traffic Index Report 2024, the Istanbul metropolitan area ranks fifth in Europe and 19th in the world, with a congestion level of 39% (meaning that, on average, journey times across that area’s road network were 39% greater than when traffic is free-flowing). Other metrics of the Traffic Index for Istanbul:
  • Average travel time per 10 km = 18 min 51 s;
  • Time lost per year during rush hours (average time lost due to being stuck in traffic) = 80 h = 3.3 days [45].
Agglomeration and congestion cause traffic jams across Istanbul, costing more than $1.7 billion annually. Traffic jams have become a critical, time-consuming problem across Istanbul due to a lack of infrastructure to meet demand from rapid growth [46,47].

3.1.1. Public Transport in Istanbul

As of 2026, Metrobus (Bus Rapid Transit), Marmaray (commuter rail), metro (11 lines), tram (5 lines), funicular (2 lines), cable car (2 lines), buses, minibusses, taxi minibusses, and ferries are operated in Istanbul PT. Metrobus, Marmaray, M11 (metro line of Turkish State Railways Transport-TCDD), and some bus–minibus lines in Istanbul operate with DBF; some bus lines operate with ZBF; and the remaining lines operate with FF.

3.1.2. Ticket Types in Istanbul

In Istanbul, the two most frequently used transit card options are: Istanbulkart and Mavi (Blue) Kart. There are four different Istanbulkart options for passengers (sorted in descending order of fare): Full fare, the student 30+ card (for students who have reached the age of 30), the social card (for Teachers and people aged 60+), and the student card.
The Blue Card is a monthly card. Full fare, the student 30+ card, the social card, and the student card are types of Blue Cards.
All mothers (have children between 0 and 4 years), members of the press, police, veterans, veterans’ families, the security service class, disabled people, soldiers, national athletes, mukhtars, martyrs’ families, TUİK (TurkStat) personnel use Free Istanbulkart.
An electronic ticket is another option. Passengers can buy single-, two-, three-, four-, five-, or ten-use passes in the form of paper tickets (not a card). The last option is bank cards. Passengers can use their credit and debit bank cards at PT in Istanbul.

3.1.3. Istanbul Metro Data

The Istanbul Metro is a rail network that serves Istanbul. Except for the M11 line, which is operated by TCDD, the system is operated by Metro Istanbul (company), a public enterprise of the Istanbul Metropolitan Municipality (IBB). There is a 380.70 km urban rail system operating in all of Istanbul. Metro Istanbul serves over 3 million passengers every day, with 18 lines in the system, totaling 241.35 km. Istanbul in 2025:
  • According to a recent urban mobility report, 48% of daily trips were made by PT;
  • Rail systems account for 20.59% of all trips;
  • Metro İstanbul accounts for 10% of all trips;
  • The number of trips made by the Istanbul Metro (M lines) 7.4% of the total trips [48].
Metro Istanbul accounts for 63.8% of the total trips made by all rail systems and Metrobus in Istanbul. The number of trips made by the Istanbul Metro is 47.6% of the total trips made by all rail systems and Metrobus in Istanbul [48]. The oldest part of the metro is the M1, which opened in 1989. As of 2026, the system had 11 lines and 159 stations in service, with 36 more under construction [48]. At 243.3 km, the Istanbul Metro network is the fourth-longest in Europe as of 2026. Because of Istanbul’s unique geography and the Bosporus Strait, its European and Asian metros do not connect directly. The two parts of the city are linked through the Marmaray commuter rail line. In addition to the Marmaray, the metro connects to the F1, Tünel (F2), F3, and F4 funicular lines, as well as to the Istanbul Tram, Metrobus, and cable car networks.
Average metro trips in Istanbul cover approximately 5.5 stations and last about 18.5 min. The average total travel time, including access to the metro station and the time required to reach the destination, is approximately 50 min. On average, each passenger makes more than one transfer per trip (1.42 transfers) to complete a journey [5,48,49].
Approximately 67.4% of all metro trips in Istanbul occur during the morning and evening peak hours. Trips made between the morning peak and midday period, during midday, and at night account for the remaining 32.6% of total trips. The passenger density values for these metro lines are presented in Table 2 [5,48,49]. Peak passenger demand for each metro was estimated using the passengers per hour per direction (PPHPD) metric.
Average daily ridership data obtained from the 2024 statistics of Metro Istanbul [5,48]. Since 67.4% of trips occur during peak hours, peak demand was distributed across six peak hours and two travel directions to estimate PPHPD:
P P H P D = D a i l y   R i d e r s h i p × 0.674 6 × 2
Capacity utilization was then calculated by comparing the estimated PPHPD values with a reference metro capacity of 60,000 passengers per hour per direction. The results show that the M2 line has the highest peak demand, followed by M1, M4, and M5, while newer lines such as M8 and M9 currently operate at lower utilization levels [5,48].
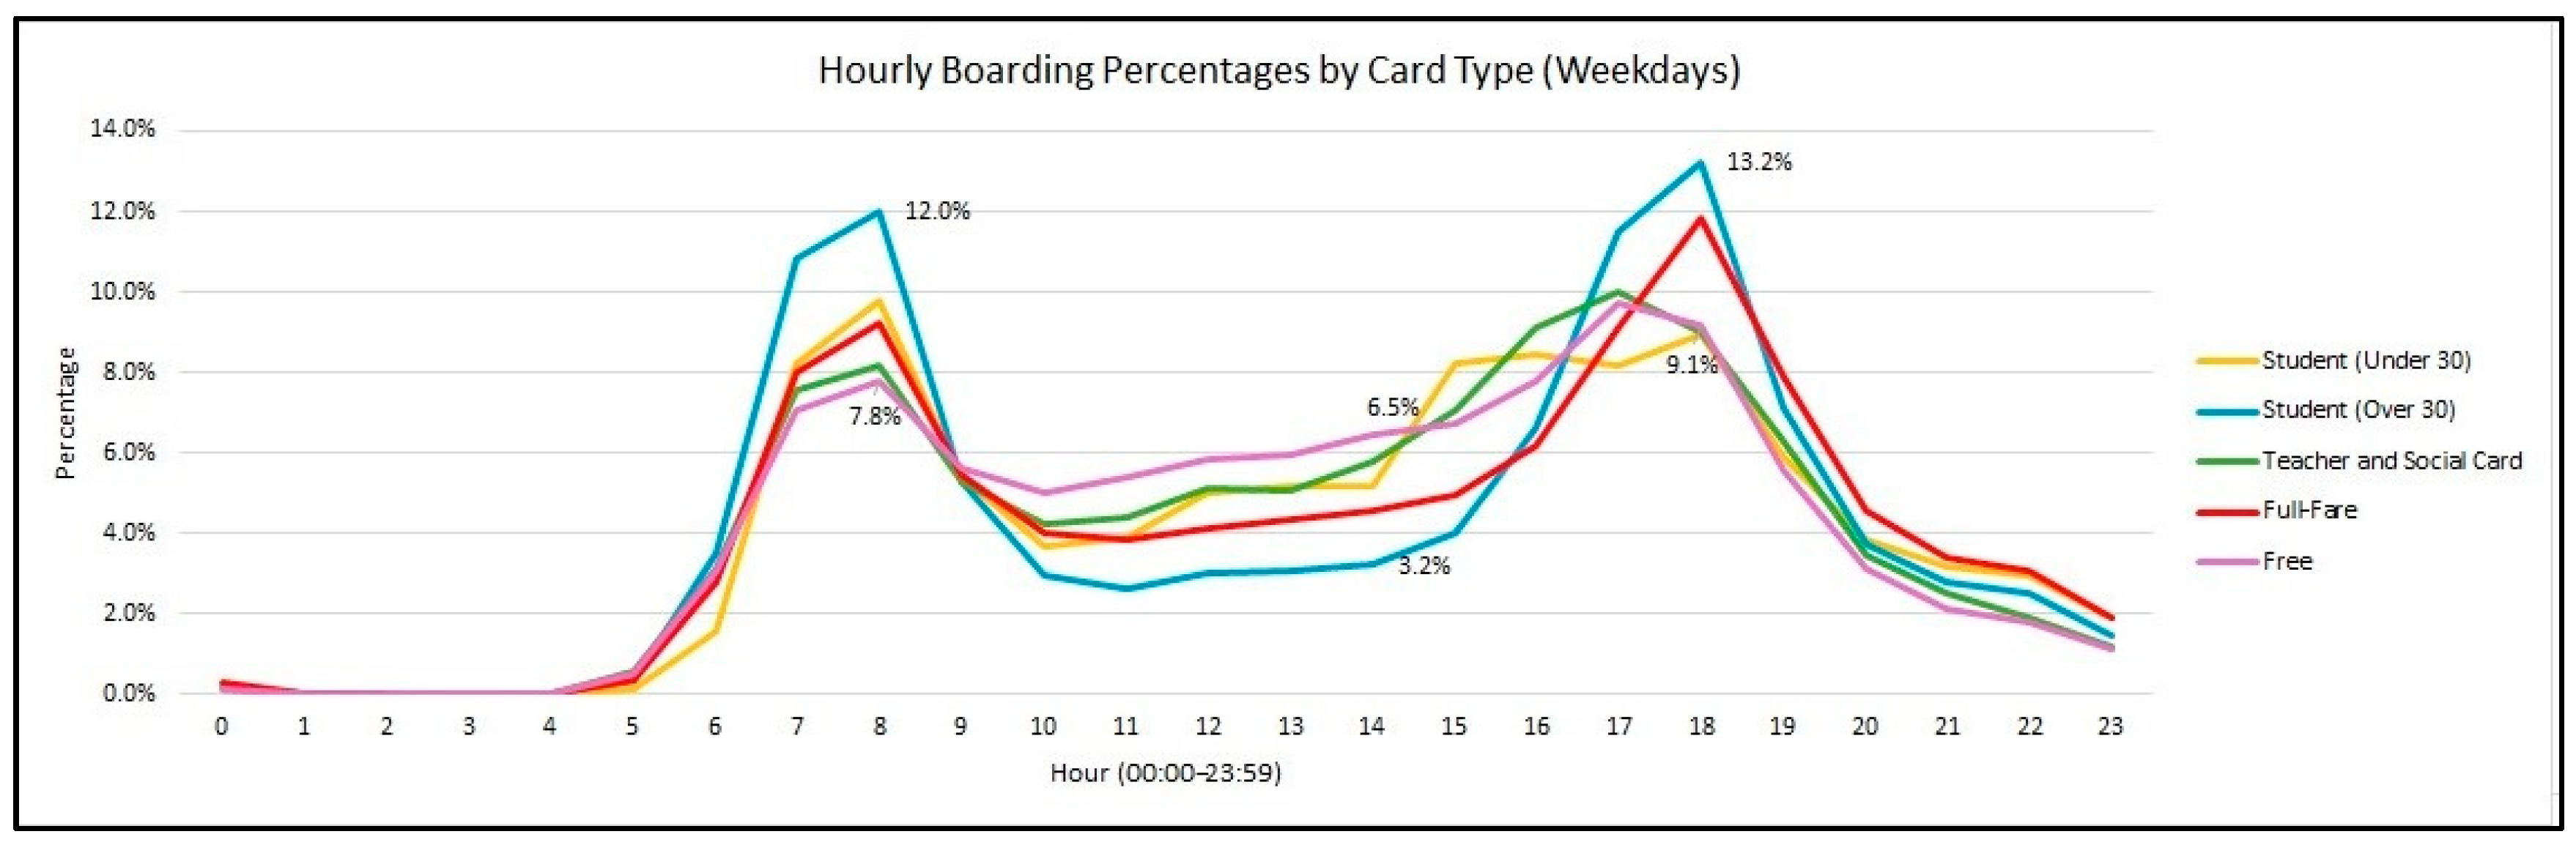
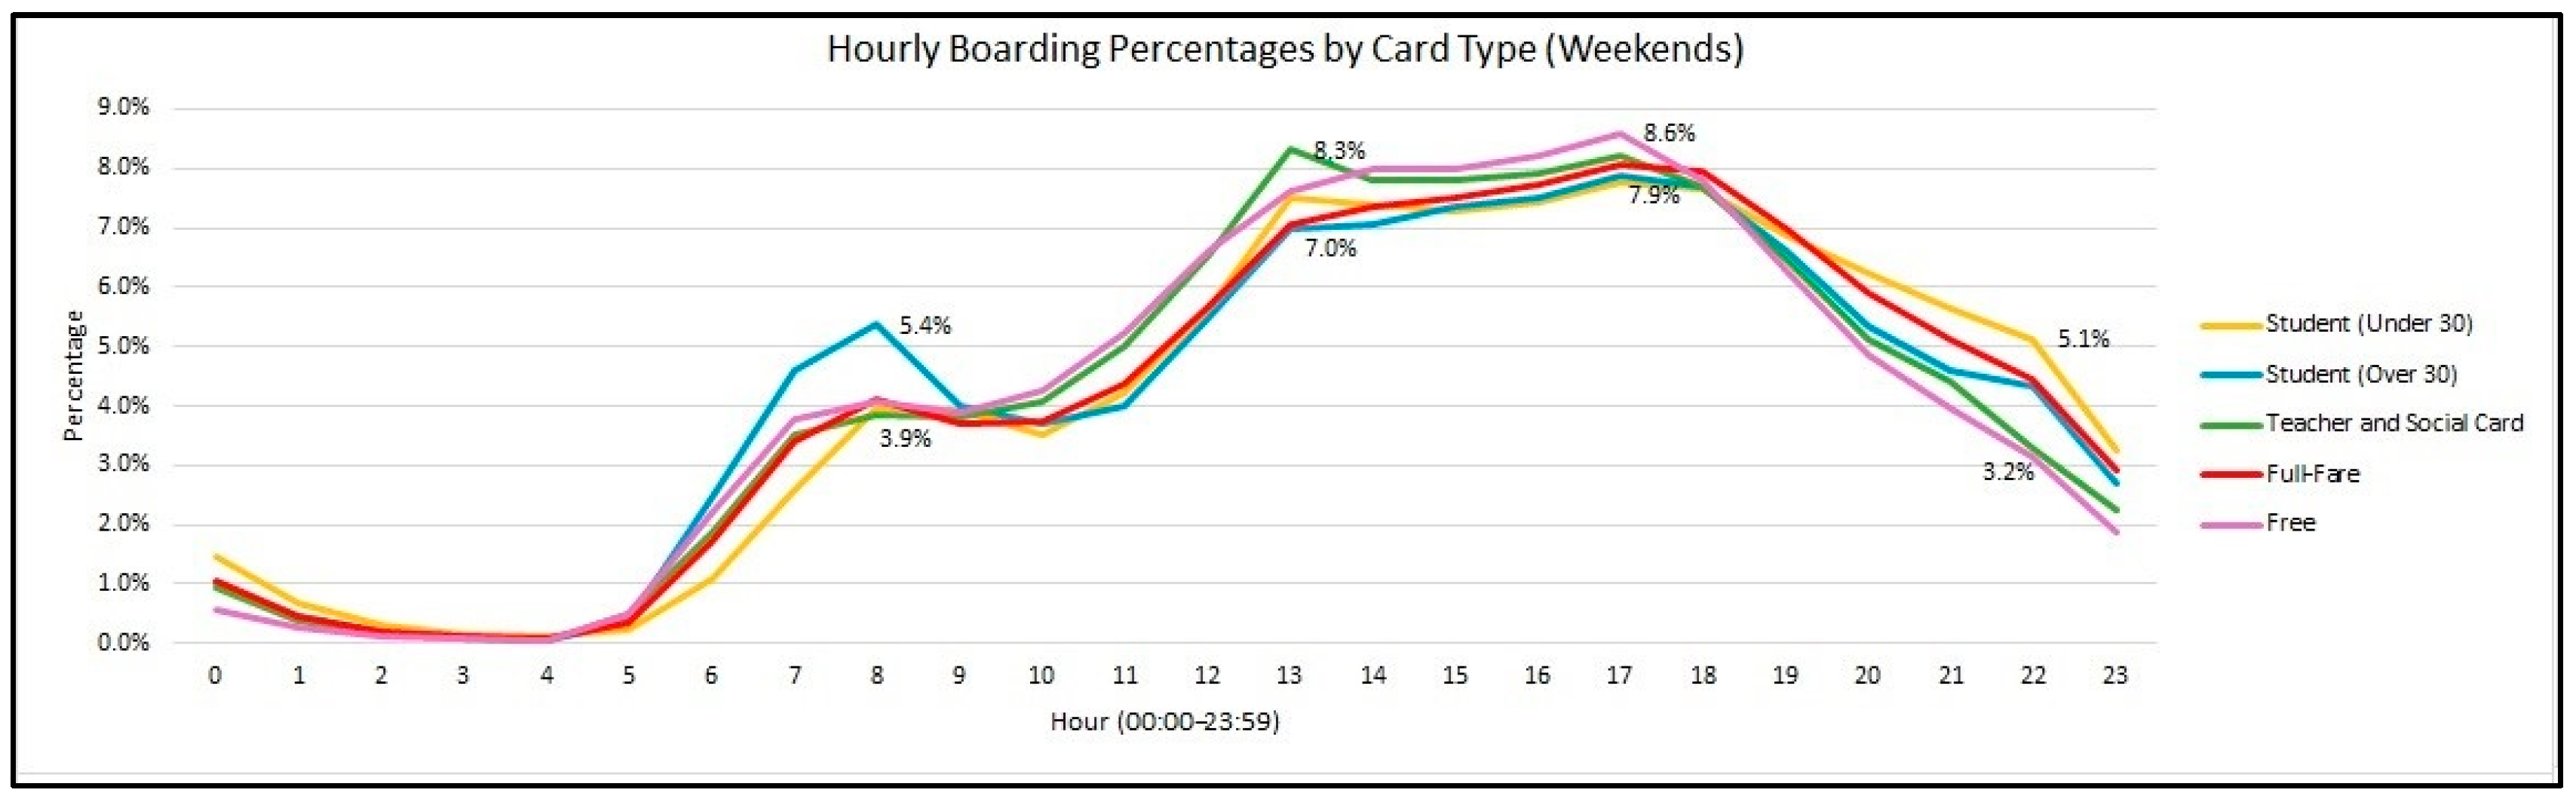
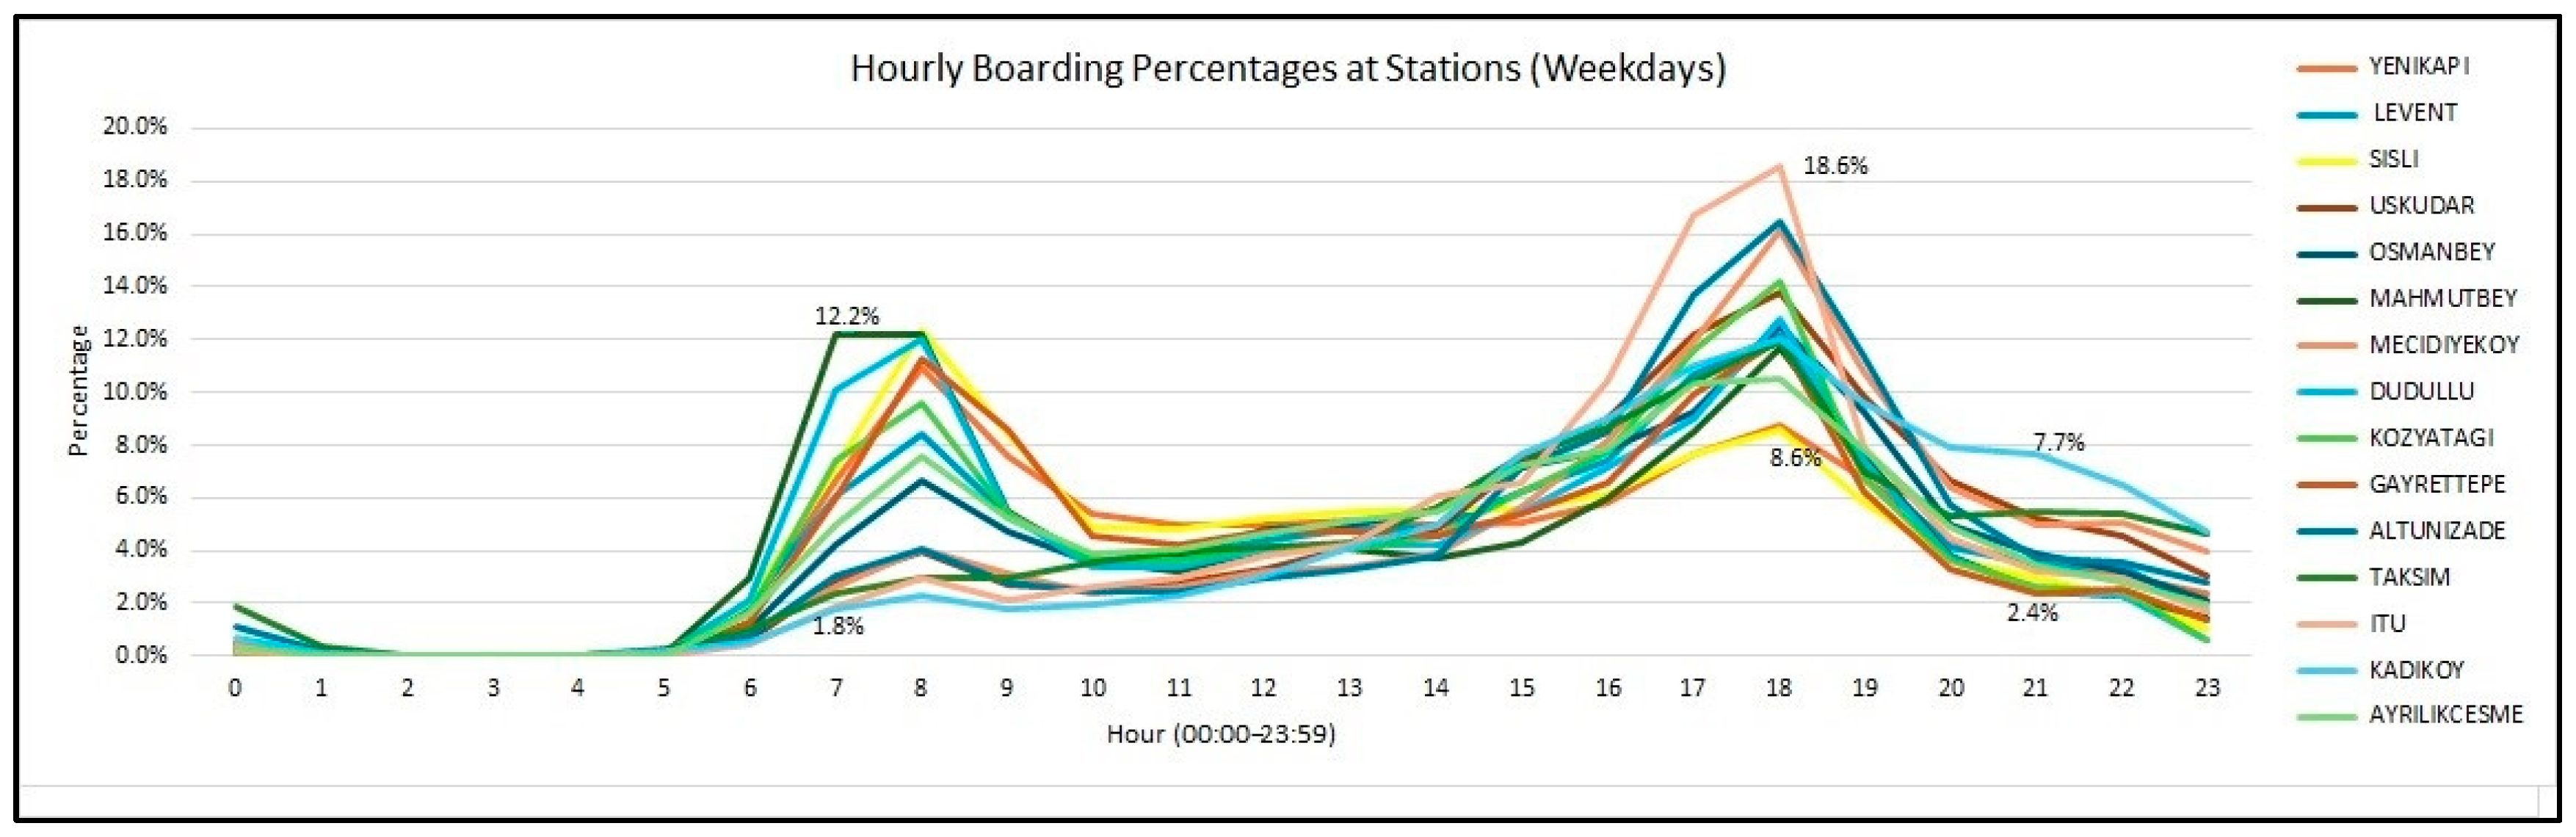
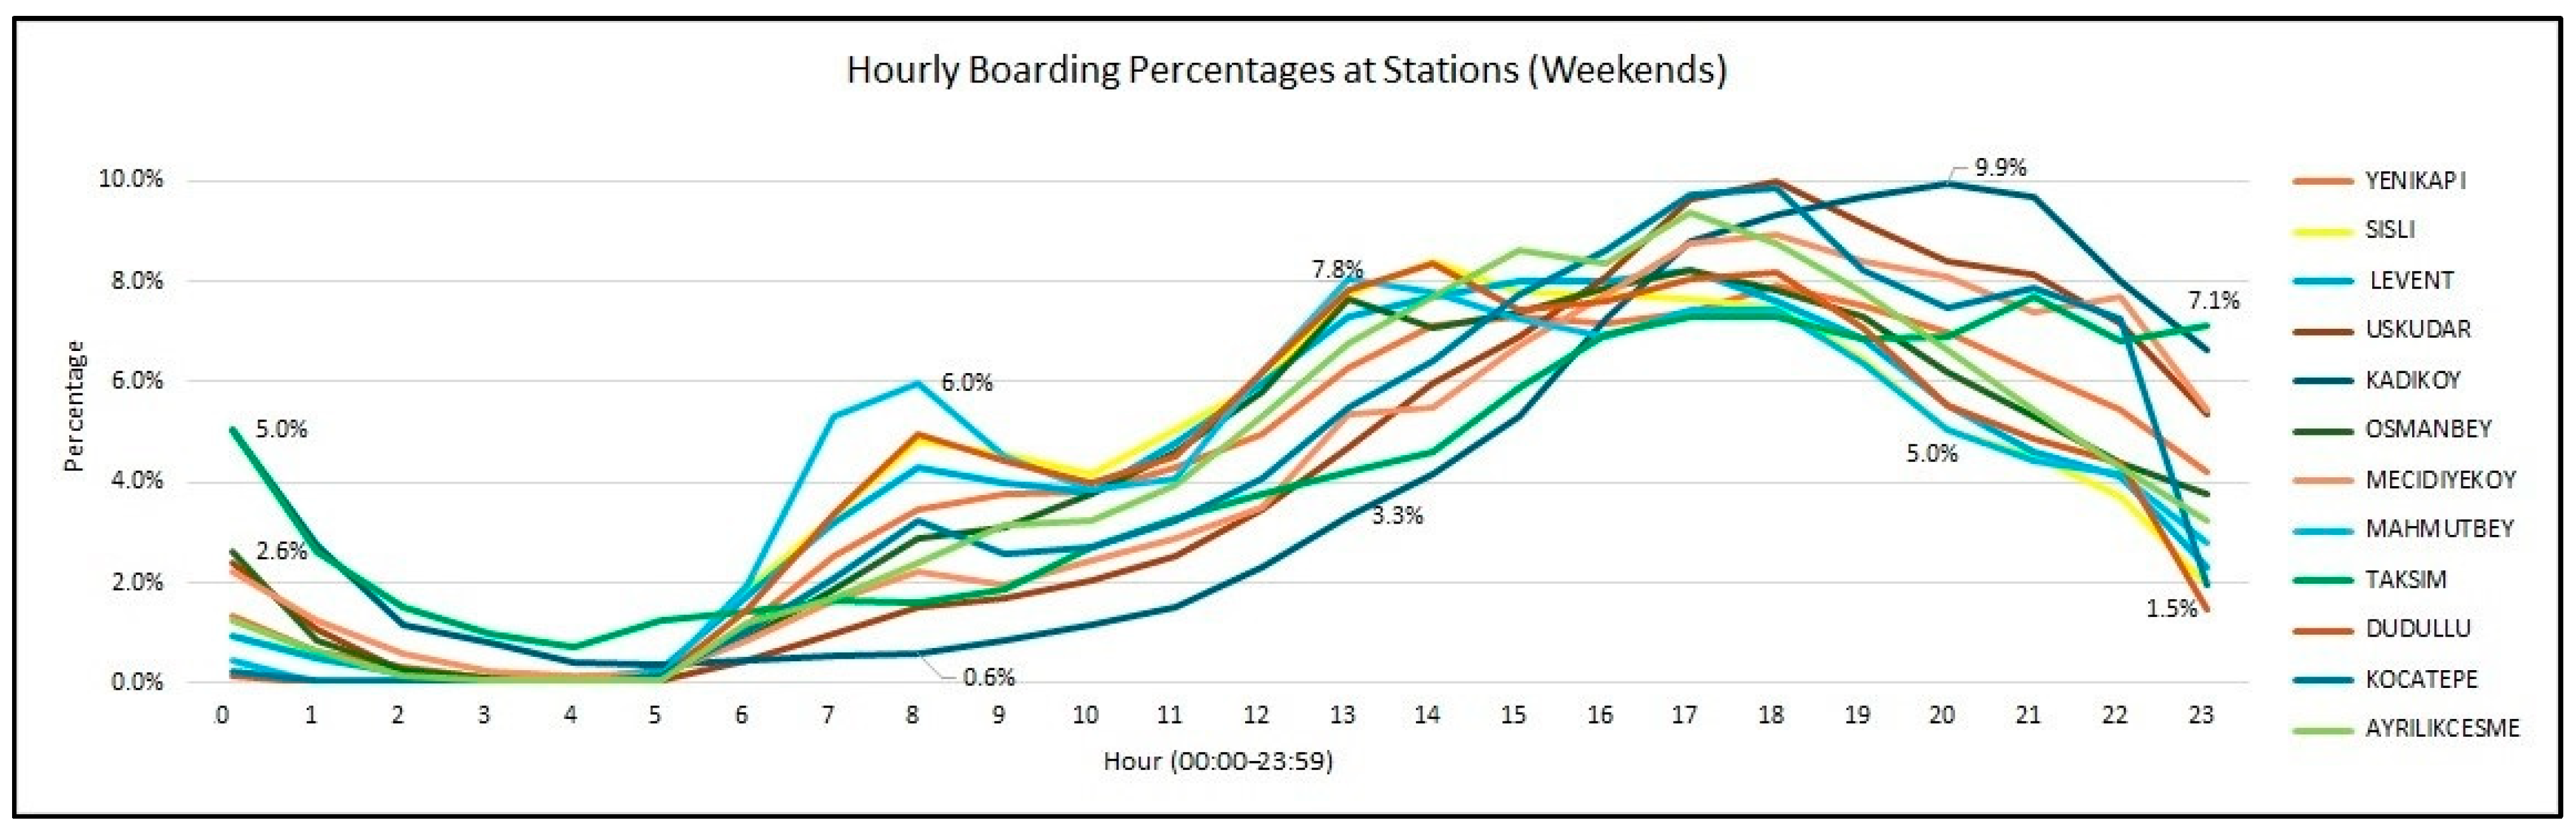
To analyze trips on the Istanbul Metro, data on the week with the most travel in 2024 was obtained from BELBİM (Electronic Money and Payment Services Inc., a subsidiary of IBB- İstanbul/Türkiye). First, only rows related to the Istanbul Metro (M lines) were filtered from the data. Then, the accuracy of this weekly data was checked. This was done by determining whether the card type, transition category, and transition type data were consistent. For example, if a data row shows a card type inconsistent with the transition category (e.g., a student card when the transition category is full fare), this indicates an error. The controls revealed that the data were entirely consistent. Finally, the results of the analyses performed in Excel are presented. Data for the Istanbul Metro (M lines) alone were visualized and presented below (Figure 2 and Figure 3 displays the card type chart, and Figure 4 and Figure 5 display the station charts for weekdays and weekends).
As seen in Figure 2, weekday travel rates are highest between 07:00–08:30 and 17:00–19:00. This indicates that travel for work and education is high. Students Over 30 appear to be distinct from the others. Most of this group works while continuing their education. Consequently, the rate of travel at the beginning of the workday (07:00–08:00) and at the end of the workday (17:00–18:00) is higher (12% and 13.2%) in this group. The lower travel rate (3.2%) during the middle of the workday (10:00–15:00) is another indicator that this group is working.
The full-fare group’s rate of travel at the end of the workday (18:00) is as high as that of the Student-Over-30 group. Because most of this group consists of employees. A massive portion of the Student-Under-30 group travels solely for educational purposes. Since the end times of school vary depending on their educational level, return trip start times are equally distributed between 15:00 and 18:00. It is no surprise that the group with the highest rate (6.5%) of daytime travel is Free, as most of this consists of retirees and those over 65 who are not working.
Figure 3 shows that weekend travel is concentrated between 13:00 and 18:00. Because most weekend passengers were off work, these trips occurred during the morning and evening rush hours, rather than during the busy hours when they had time to leisure. The weekend card type difference was not as significant as on weekdays. Only the Student-Over-30 group differed (5.4%) due to the Saturday morning commute (7:00–8:00).
Figure 4 visualizes the boarding percentages of the most frequently used stations on weekdays. Consistent with the card type graph, boarding is also concentrated between 07:00–08:30 and 17:00–19:00 for work and school trips. The reason for the early hours of 06:30–07:30 at Mahmutbey (12.2%) is the high number of blue-collar workers who begin their journeys there. The morning at Dudullu station is caused by the same reason.
Boarding at ITU is near its minimum (1.8%) in the morning, but between 17:00 and 18:00 it is busier (18.6%) than at any other station. Students at Istanbul Technical University board at different stations in the morning, often using the ITU station after their classes finish, and begin their journeys. The reason for the congestion (7.7%) at Kadıköy station until 22:00 is that people spending time in the area for leisure and business tend to board later than at other stations and to reach different parts of the city.
As can be seen from Figure 5, weekend station boarding times exhibit a greater distribution than weekdays. Even on weekends, Mahmutbey station is busier (6%) between 06:30 and 09:00 due to the high number of blue-collar commuters. Kadıköy and Taksim stations are used by local and international tourists for weekend leisure, so these areas are also different from other stations. These two stations experience their quietest hours between 03:00 and 10:00. Kadıköy station’s peak hours are between 17:00 and 22:00. The fact that these two stations remain busy (5%) until 01:00 indicates that these areas are popular weekend-evening leisure destinations.
For a more technical comparison, we interviewed many experts to gather their opinions on fare structure and criteria. For this reason, proposed using BWM to derive a ranking based on fare structure and criteria. The features of Istanbul, along with insights from the literature review, guided the selection of the BWM and, accordingly, the determination of the criteria. To the best of the authors’ knowledge, there were no empirical studies on PT fare structures and decision criteria for Istanbul.

3.2. Best–Worst Method (BWM)

In this study, the BWM, a novel and handy MCDM (multiple criteria decision-making) method, was used for the first time in this context. The previous use of AHP (Analytic Hierarchy Process) and MABAC (Multi-Attributive Border Approximation Area Comparison) reveals that MCDM is suitable for achieving the intended goals and objectives on PT fare [23,28].
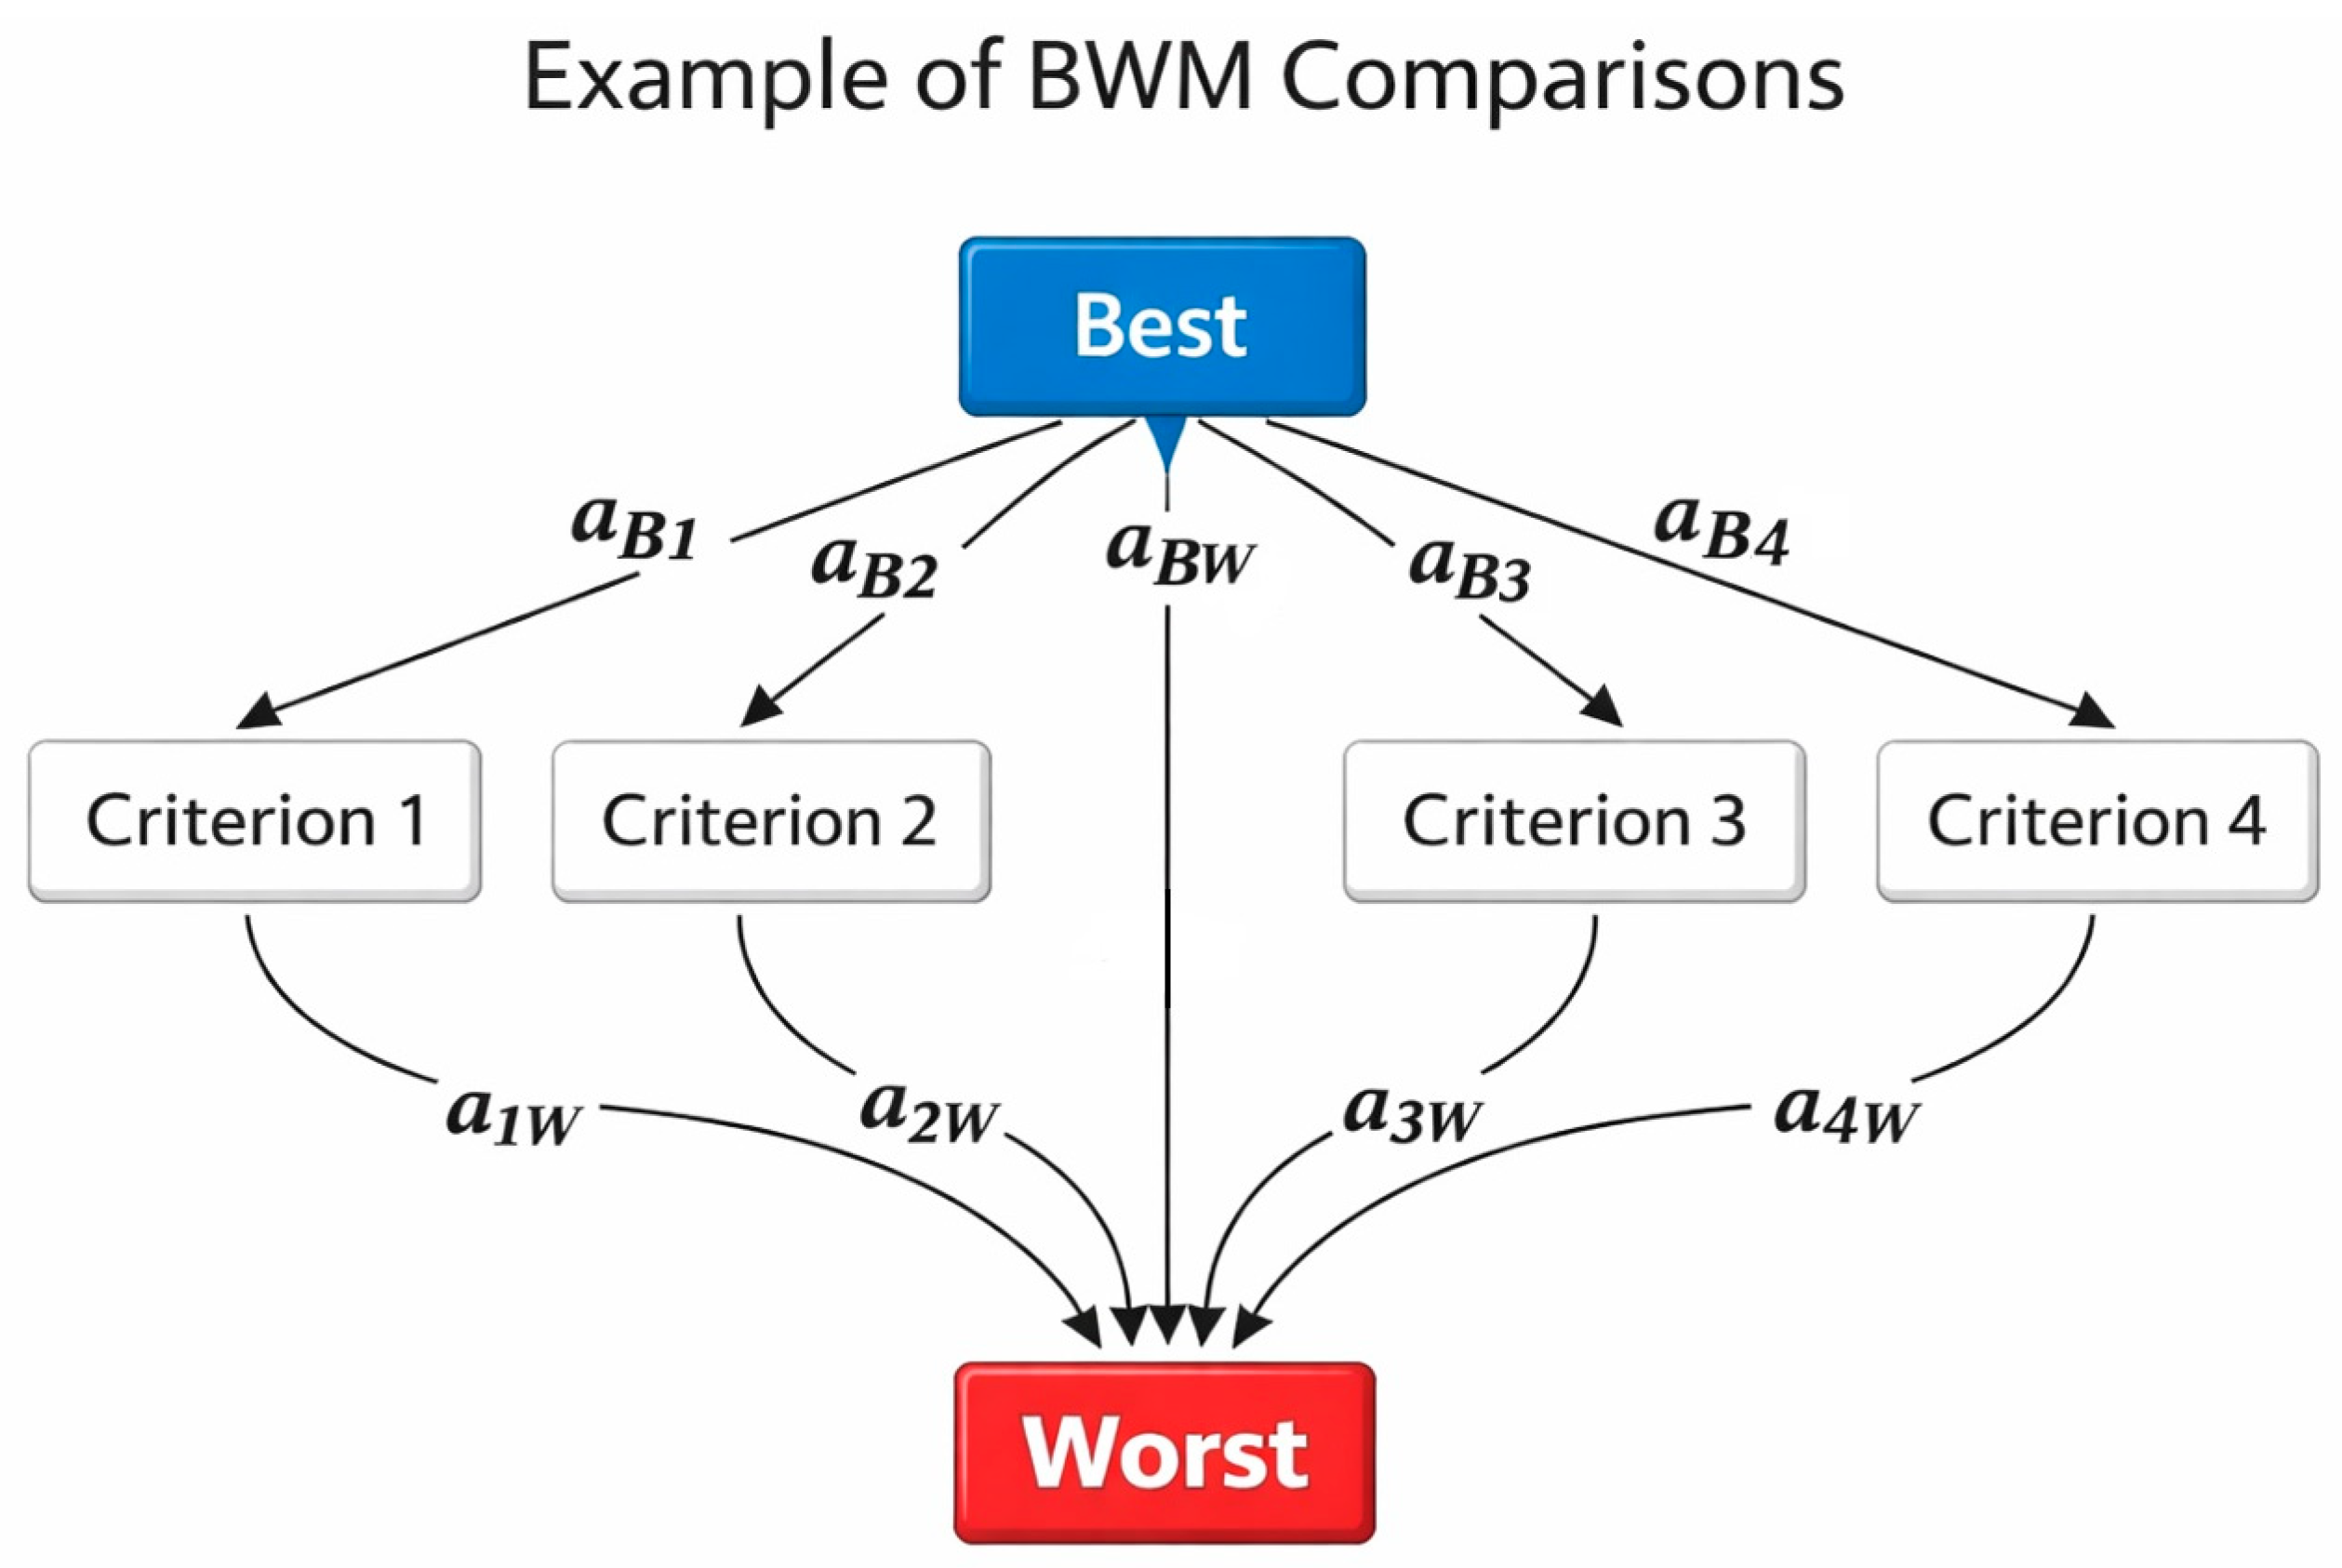
The linear BWM model determines the importance and weights of the criteria and alternatives. The BWM requires fewer comparisons than other MCDM tools; the final weights obtained from the BWM are highly trustworthy, and the comparisons are more coherent than those in full matrix-based methods. Eventually, BWM is well known for its simplicity, as comparisons are made using only numbers from 1 to 9. This provides a clear advantage to other MCDM methods that require comparison matrices with integers as well as with fractional numbers [50,51]. So, this study provides additional evidence of the method’s usability for evaluating technology and its effectiveness in assessing PT fares. Figure 6 visualizes examples of BWM Comparisons. The linear model of the BWM [51] is composed of five steps:
  • Step 1
The expert chooses the set of decision criteria. These criteria {c1, c2, c3, …} are the relevant ones for making a decision.
  • Step 2
The expert chooses the best (e.g., the most important) and the worst (e.g., the least important) criteria in each of the clusters or categories of factors. At this step, no comparison with other criteria is required.
  • Step 3
The expert must define the best criterion relative to the other criteria within the same group. This is done using scores between 1 and 9, where 1 indicates equal importance and 9 indicates high importance. The Best-to-Other vector would be something like AB (best) = (aB1, aB2, …, aBn), where aBj refers to the selection of the best criterion B (best) over the criterion j.
  • Step 4
The expert must define the choice of all criteria relative to the worst criterion using a number between 1 and 9. This means the Others-to-Worst vector would be AW (worst) = (a1W, a2W, …, anW), where ajW is the preference of criterion j over the worst criterion W (worst).
  • Step 5
Find the optimal weights for all (𝓌1*, 𝓌2* … 𝓌n*). The optimal weight for the criteria is the one in which, for each pair 𝓌B/𝓌j and 𝓌j/𝓌W, we have 𝓌B/𝓌j = aBj and 𝓌j/𝓌W = ajW. To satisfy these conditions for all j, we should find a solution where the maximum absolute differences {|𝓌B − aBj𝓌j| and |𝓌j − ajWWW|}.
For Rezaei, by minimizing the maximum of the set of {|𝓌B − aBj𝓌j|, |𝓌j − ajWWW|} the formulation to find the solution becomes:
min maxj {|𝓌B − aBj𝓌j|, |𝓌j − ajW𝓌W|}
s.t:
∑ wj = 1
𝓌j ≥ 0, for all j
This can be translated into the following linear programming problem:
min ζ L
s.t:
|𝓌B −aBj𝓌j| ≤ ζ L, for all j
|𝓌j − ajW𝓌W| ≤ ζ L, for all j
∑ 𝓌j = 1
𝓌j ≥ 0, for all j
A linear problem has a unique solution, including the optimal weights (w1*, w2*, …, wn*) and the consistency ratio ζ*. The closer zero * is, the higher the level of consistency of the model, and the more dependable the data used for the analysis [51].
To determine the set of decision criteria (Step 1), first assessed the factors (social equity, benefit received, operator profit, ticket price, number of trips, decentralization, and urban morphology) and structures (flat fare (FF), distance-based fare (DBF), time-based fare (TBF), zone-based fare (ZBF)) selected with analysis of the literature.
Then, they conducted a survey to collect data for applying the BWM (Steps 2 to 5). The survey was conducted using Microsoft® Excel® for Microsoft 365 MSO (Version 2603 Build 16.0.19822.20086) 32-bit. Microsoft® Excel® Solver add-in used to calculate the weights in the BWM model for the entire analysis [51].
The survey was distributed to more than 150 experts in the field, reaching researchers and practitioners alike, including academics, operators, and government officials with extensive knowledge of PT fare systems. Academics were considered knowledgeable if they had published on PT topics or had at least ten years of experience in the field. Similarly, operators and officials were regarded as experts if they had at least 10 years of professional experience in related areas. Potential participants meeting these criteria were identified through universities, operator websites, and PT-related organizations. As a result, a total of 22 experts from Türkiye were selected, including 5 practitioners (such as engineers, planners, and managers), 17 academics from well-established universities, and a department head. Of the 17 academics, 4 hold the title of Professor, 5 are Associate Professors, and 8 are PhDs, all of whom are actively working at universities in Türkiye. Among the 5 practitioners in the field, 2 hold PhD degrees. These experts are employed at Metro İstanbul, IBB, and the Ministry of Transport and Infrastructure of the Republic of Türkiye.
The experts completed the questionnaire (Appendix A) in Excel (Solver add-in). The questionnaires were designed so that, after responses, a consistency ratio was calculated to determine whether any revisions to the judgments were required due to inconsistency. When the Consistency Ratio exceeded 0.10 [52], the experts were asked to revise their responses to reduce it. A total of 22 experts received the same questionnaire, regardless of the group they were assigned to, and conducted the same analysis for each criterion and structure.

4. Results

The first result emerging from the experts’ criteria weightings was the superiority of benefit received (24.4%) and social equity (22.7%). These two criteria represent horizontal and vertical equity, respectively. The experts emphasized that the dominance of these two criteria highlights the importance of equality in PT policy. The least important criteria were operator profit (8.4%), decentralization (8.8%), and urban morphology (9.4%). The limited influence of these three criteria suggests that experts adopt a passenger-centric perspective in PT. Although the number of trips (14.9%) and ticket price (11.4%) showed high values, they were still less influential than the broader benefit received and social equity criteria.
Experts chose DBF (43.7%) as the most superior fare structure, while FF (12.2%) was the weakest. This preference was likely influenced by the benefit-received criteria—namely, that passengers pay according to their level of use—which is one of the main advantages of DBF over FF. ZBF (23.3%) and TBF (20.8%) outperformed FF, but they were far from DBF. While ZBF and TBF implement fare differentiation and offer benefits based on certain criteria, their relationship with the benefit-received criterion is not as strong as that of DBF. The results are given in Table 3.
As shown in Table 3, DBF is the most suitable fare structure for the Istanbul Metro. DBF is followed by ZBF, TBF, and FF. The clear dominance of DBF, social equity, and benefit received responses indicates a strong consensus among experts. Twenty out of twenty-two experts identified DBF as the most appropriate fare structure, while TBF and ZBF were each selected by only one expert. Ten experts assigned the highest weight to the benefit received criterion, whereas eight selected social equity. Apart from these two criteria, only two experts gave the highest weight to the number of trips criterion. The fact that these experts—who were not in communication with one another—arrived at such a high level of agreement enhanced the reliability of the results.
When only academics’ responses are considered, the highest-weight fare structure remains DBF (43.5%), and the most important criterion is benefit received (25.5%). When only the responses of operators and public-sector practitioners are considered, the highest-weighted fare structure is still DBF (44.5%), while the most important criterion is social equity (24.7%). In transit fare policy, academics typically prioritize the benefit-received principle, emphasizing alignment between fares and the services consumed, whereas public-sector practitioners emphasize social equity, reflecting the need to ensure affordability, accessibility, and inclusivity across diverse population groups.
There are several reasons why expert opinion is in favor of DBF:
  • PT plays an essential role in shifting the demand from cars to sustainable modes and decreasing congestion in cities like Istanbul. But TBF may push users to use private cars due to high fares during peak hours. Considering Istanbul’s congestion problem mentioned in the previous sections, TBF may not be beneficial for passengers.
  • FF is an easy-to-implement, cheap, and simple solution for the operator. It is also easy for passengers to understand and control. It is the optimal solution for cities with a single center that are not large enough. However, FF is an effortless way out. In cities where the number of trips increases and distances grow longer (especially in linear cities like Istanbul), it is essential to evaluate a more customized fare structure such as DBF.
  • It was observed that Istanbul operators’ profits decreased due to increases in operating costs, due to the addition of new lines to the end of the metro lines operated with FF in the city in recent years. For example, the first stage of M4 (Kadıköy-Sabiha Gökçen Airport) was completed in 2012 and is in service, with 16 stations along a 21.7 km line between Kadıköy and Kartal. With the second stage, the line was extended from Kartal to Tavşantepe, and with the opening of the third stage in 2022, access from Tavşantepe to Sabiha Gökçen Airport was provided. With the third stage, the length of the line increased to 33.5 km and the no. of stations to 23. With the extensions made, the length of the line (and operating costs) increased, but the 1–2-station travel fare was still the same as the 22–23-station travel fare. As emphasized, this is unfair for both the operator and the passenger. When DBF is implemented, passengers will pay according to the number of stations, and injustice will be eliminated.
  • In Istanbul, the operating income only covers 30–35% of the monthly fixed expenditure [53]. The situation is similar for the Istanbul Metro [54]. In this case, as in most major cities worldwide (except for good examples in East Asia), operations can continue thanks to subsidies. However, the difference between operating income and expenses widens every year, and the subsidies also increase. Li et al. show that DBF can increase operator revenue by 5.88% [55]. DBF, which is applied to convenient fare levels after a thorough analysis of journeys, will attract those who prefer different modes for short distances with its affordable fares. Also, it will charge much higher fares for long-distance travelers. As a result, operating income will increase, and the need for subsidies will decrease.
From Table 3, it is concluded that social equity and benefit received are the most dominant decision criteria. It is seen that the other five criteria (operator profit, ticket price, number of trips (demand), decentralization, and urban morphology) are far from them. There are reasons why expert opinion is in favor of these two criteria:
  • In Istanbul and similar cities, urban renewal and rising land values in the city center are leading to new housing areas in the suburbs. This increase in land values in the center is driving up housing costs. Residents, especially low-income residents, are moving away from the center and settling in the less-accessible city periphery [56]. This leads to difficulties in accessing urban services for low-income individuals, increased transportation costs, longer travel times, etc.: in other words, transportation poverty. For this group, where private vehicle ownership rates are low, PT is the only option. In this respect, investments in PT are a useful tool for ensuring social equity.
  • In this study, social equity criteria are used in the sense of vertical, and Benefit Received criteria are used in the sense of horizontal equity. It is dramatic that experts vastly outperform the other five criteria on these two equality criteria. With these assessments, they prioritize passenger interests over operator interests for PT. This can be interpreted as a reflection of the problem of social inequality in Istanbul.
  • Istanbul has the highest income inequality in Türkiye. Income inequality is calculated by comparing the income of the lowest 20% with that of the highest 20%. The wider the gap between the highest and lowest income groups, the greater the income inequality. While the richest 20% of Türkiye’s population accounts for 47.6% of the total income, the lowest 20% receives only 6.1%. According to this, in 2018, the income of the richest 20 percent in Türkiye was 7.8 times that of the poorest 20%. Based on TÜİK data, the highest income inequality by province was in Istanbul (8.6) [57]. This data strongly emphasizes the importance of social equality in Istanbul. Developing policies in this direction will reduce social and economic inequalities.
  • The distribution of card types across income groups provides important insights into the socio-economic characteristics of Istanbul Metro users. Monthly Mavikart (student and full-fare) and teacher and social cards are predominantly used by higher-income households, suggesting that frequent PT usage and monthly fare products are more common among economically stable groups. In contrast, free cards, particularly the 65+ and disabled cards, exhibit relatively higher shares among lower- and middle-income groups, highlighting the redistributive role of socially targeted fare policies. These findings demonstrate that fare differentiation and card-type structures serve as key policy instruments to improve transport equity, enabling vulnerable or mobility-dependent groups to maintain access to urban transit services. Consequently, analyzing card-type usage patterns alongside household income levels provides a useful framework for evaluating the equity performance of fare systems.
  • The spatial relationship between income distribution and the metro in Istanbul reveals an important dimension of transport equity. High-income districts are primarily concentrated along central and coastal areas such as Beşiktaş, Şişli, Sarıyer, Kadıköy, and Bakırköy, where metro accessibility is relatively strong due to the presence of major corridors including M1, M2, and M4. The M2 line, which serves as the main north–south urban corridor, has the highest passenger demand and accessibility, while M1 and M4 also serve dense urban areas with relatively high ridership. Middle-income districts, such as Ümraniye, Ataşehir, Maltepe, and Bahçelievler, are served by expanding metro corridors, including M5, M7, and M8, which improve accessibility between peripheral residential areas and the urban core. In contrast, lower-income districts located mainly on the western and northwestern periphery, such as Bağcılar, Esenler, and Gaziosmanpaşa, have historically experienced limited rail access, although recent infrastructure investments, such as M3, M7, and M9, have significantly improved connectivity. Overall, the analysis suggests that the expansion of the metro network from M1 to M9 plays a critical role in reducing spatial inequalities in PT accessibility and contributes to the broader objective of enhancing social equity in urban mobility.
  • In modern cities, accessible and convenient travel should be considered a fundamental right for all citizens. Therefore, operators are required to ensure a minimum level of service to guarantee this right [58]. Those with incomes high enough to afford a private car can choose not to use PT. Those without a private car have only two options: PT and taxi. Istanbul has been plagued by a long-standing taxi shortage. In Istanbul, there is only one car for every three people; PT is the only option for millions. Experts recommend providing this service to low-income residents, who have no other option but PT, at a fare proportional to their budget. Higher-income residents, if charged according to their budgets, would pay more per trip than others. This, of course, carries the risk that high-income passengers using PT will opt for their private vehicles instead.
  • The benefit received criterion implies that passengers pay in proportion to the benefits they receive from PT. It is no surprise that experts chose DBF as the superior fare structure when they chose the benefit received criterion as the superior decision criterion. Paying for the distance (or number of stations) traveled in DBF can be interpreted as an application of the benefit received criterion.
It has previously been emphasized that the average Istanbul Metro trip covers approximately 5.5 stations. An example given below for additional analysis is to connect the preferred fare structure to actual passenger impacts:
As of 2026, a single full-fare Istanbulkart ride costs 42 ₺ in İstanbul. The M4 line has 23 stations, and under the current FF system, a passenger traveling one station or all 23 pays the same 42 ₺. Under a DBF system that considers benefit received, fares could be structured as follows:
1–5 stations: 25 ₺;
6–10 stations: 35 ₺;
11–15 stations: 40 ₺;
16–20 stations: 45 ₺;
21–23 stations: 55 ₺ (as of March 2026 1 USD = 44.3 ₺ and 1 EUR = 51.5 ₺).
Let us consider a low-income passenger who boards at M4 Kartal station every morning and evening. Suppose the passenger works at the hospital located at Hastane–Adliye station on weekdays and spends time near Pendik station on weekends. Under the 42 ₺ FF system, assuming a round trip each day, the passenger’s weekly travel cost would be
42 × 2 × 7 = 588 ₺.
Under DBF, none of the passengers’ trips exceed 5 stations, so each trip costs 25 ₺. Therefore, the weekly travel cost under DBF would be
25 × 2 × 7 = 350 ₺.
Let us also assume a high-income passenger residing near Kurtköy station. This passenger commutes on weekdays to Ayrılık Çeşmesi station, where they work, and goes to Kadıköy station for weekend leisure trips. Under the FF scheme, this passenger’s weekly metro travel costs remain unchanged from the previously calculated amount.
42 × 2 × 7 = 588 ₺.
However, under the DBF scheme, since the number of stations traveled exceeds 21, the total of weekday and weekend fares would be:
55 × 2 × 7 = 770 TL.
These examples demonstrate that, under DBF, regular users pay less when boarding from stations closer to the line’s center than from terminal (last) stations. This may create a behavioral incentive for passengers to avoid residing at the ends of the line. Such an effect could help prevent decentralization and reduce the need for costly line extensions—such as the M4 line—thereby limiting increases in operator costs.
This approach ensures passengers pay in proportion to the benefit they receive. Although benefit received and social equity are presented separately in our study, improving benefit received inherently contributes to social equity.

4.1. Statistical Analysis for Expert Surveys

In statistical analysis, several tests are employed to examine the characteristics and relationships within datasets. The answer to the question, “What is the advantage of reaching this conclusion?” is that it helps understand this meaning and surveys well, plan next steps correctly, and create patterns. Analyzing data can give a comprehensive understanding of experts. Since numbers alone do not mean much, examining and evaluating the data can reveal patterns that enable meaningful decisions. The pie chart representation of the expert survey results is presented in Figure 7 and Figure 8.
To investigate whether there is a significant difference between the mean importance scores of the sub-dimensions, firstly, decide on the analysis method to use. Since an expert answers more than one criterion, a repeated-measures method should be used. If the data in the sub-dimensions satisfy the assumption of normality, a paired-samples analysis of variance can be performed; otherwise, the Friedman test can be used as an alternative. The Kolmogorov–Smirnov test is commonly used to determine whether a dataset follows a specified distribution, although its sensitivity to sample size may affect its reliability (Table 4).
The analysis revealed that only the sub-dimensions DBF, SE, BR, OP, TP, and DEC followed a normal distribution. Since not all sub-dimensions were normally distributed, the Friedman test was applied for comparison. The Friedman test is a non-parametric method used to identify differences among three or more related groups when parametric assumptions are not satisfied, but it does not specify which groups differ without post hoc analysis.

4.1.1. Fare Structure Analysis

The Friedman test was used to identify differences between the sub-dimensions of fare structures (Table 5).
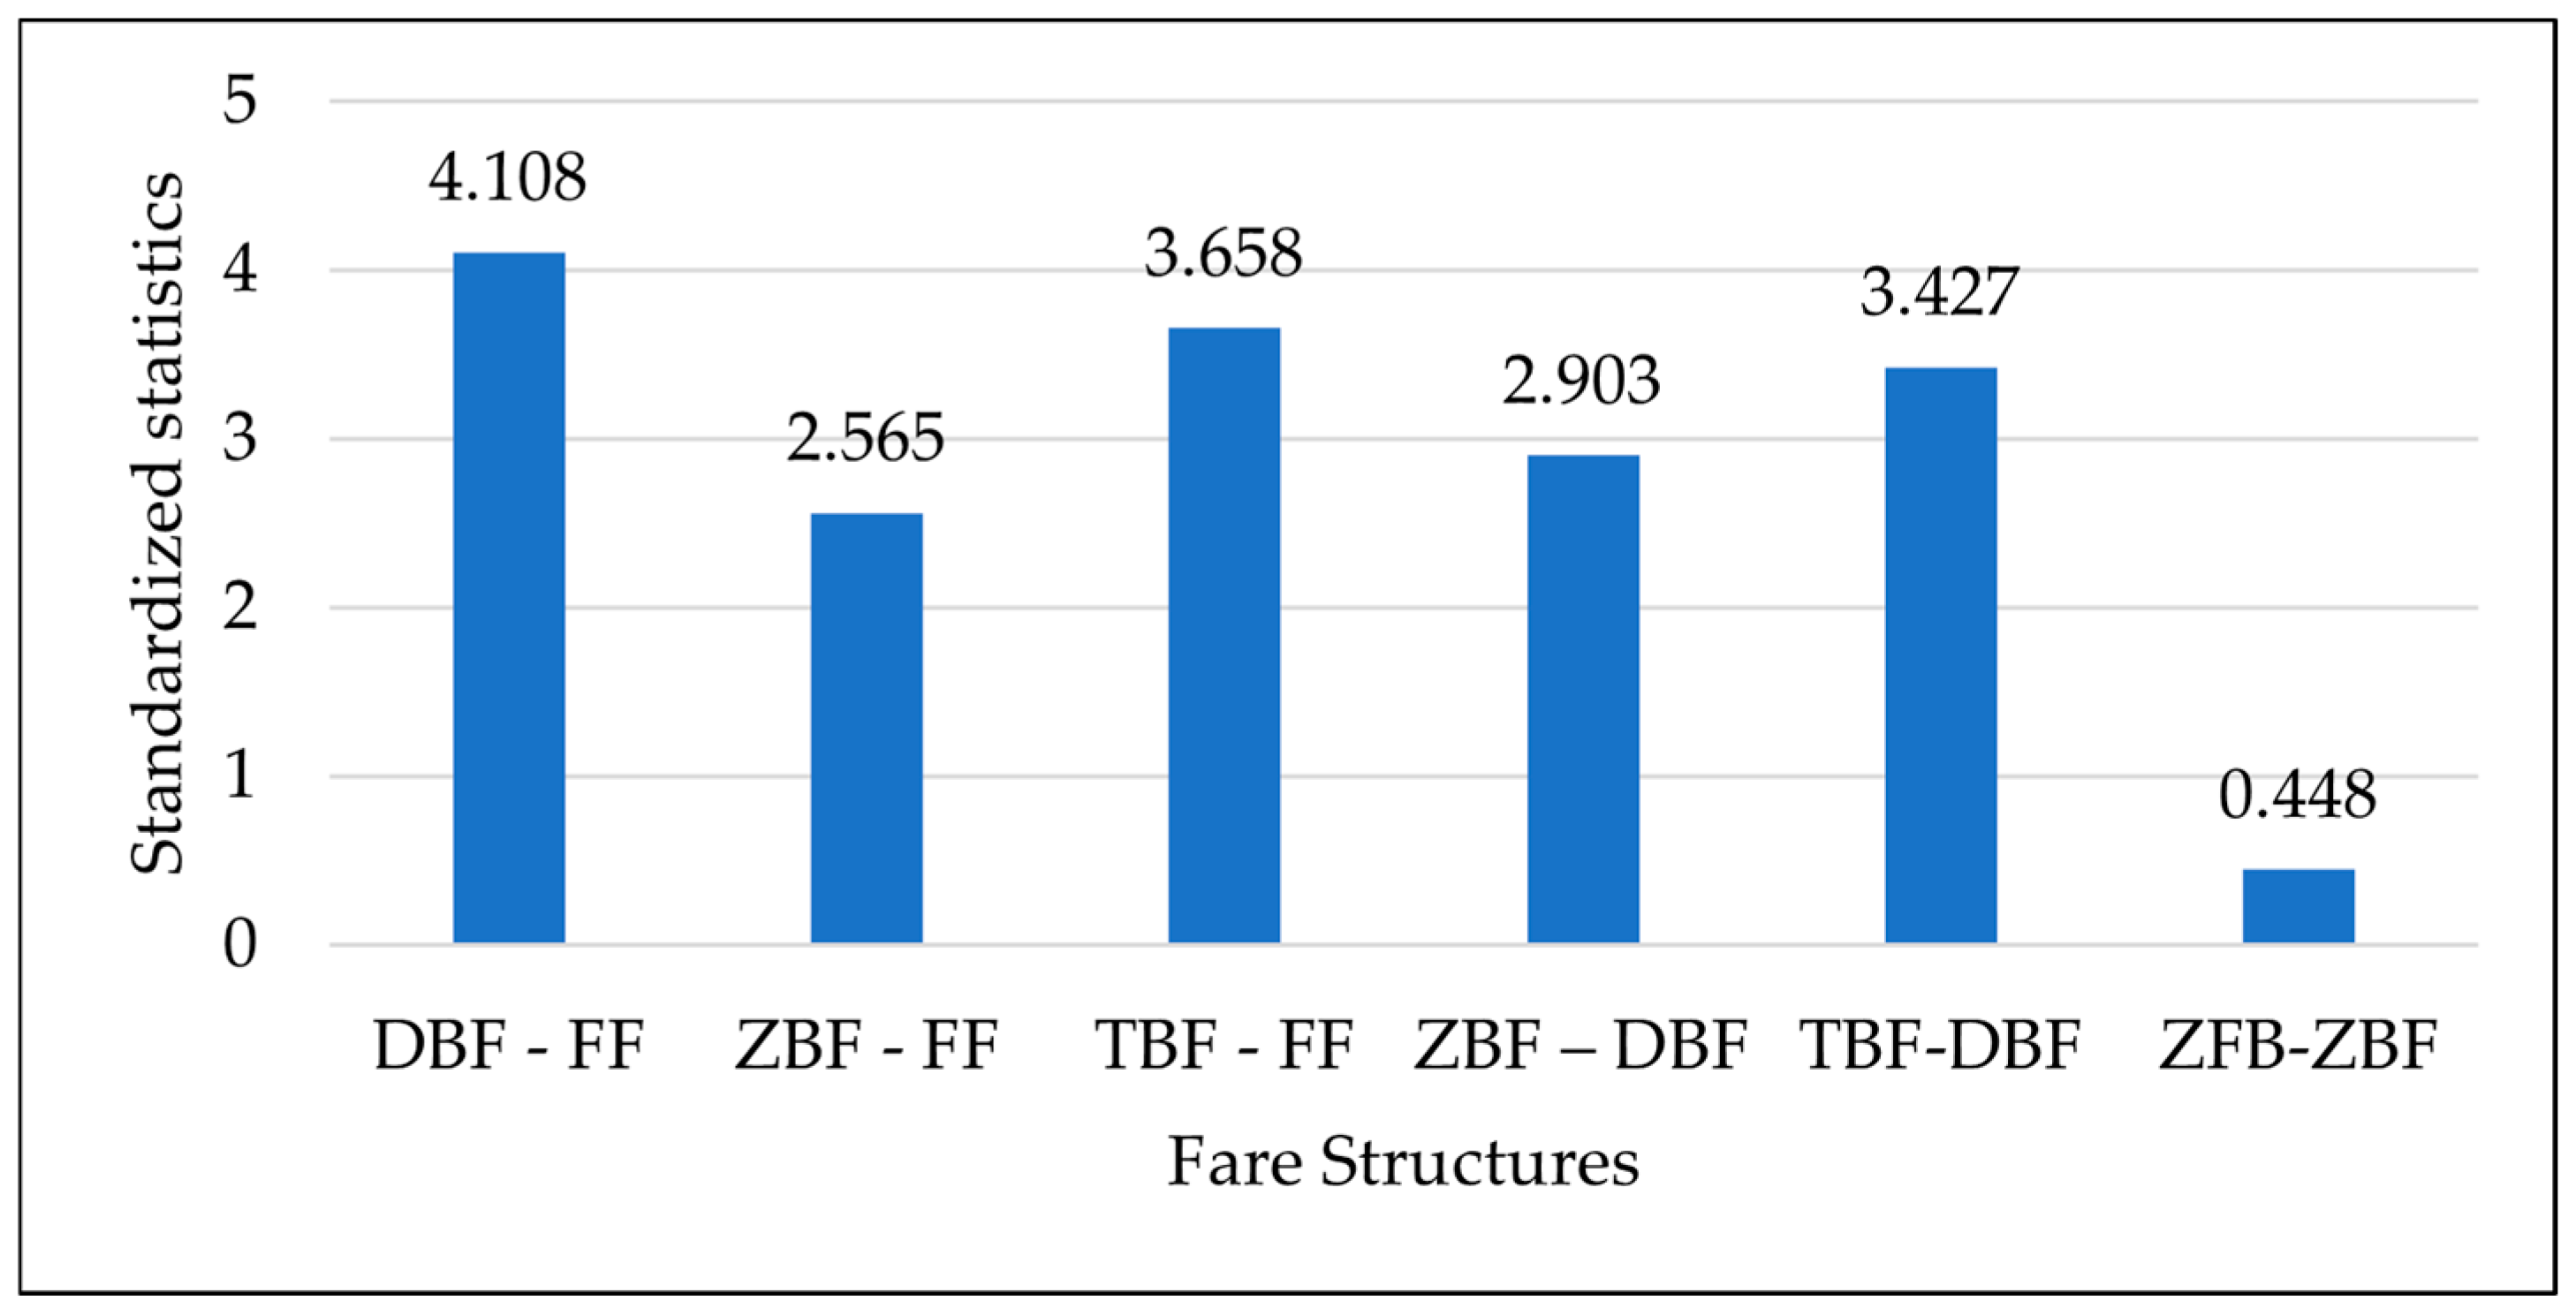
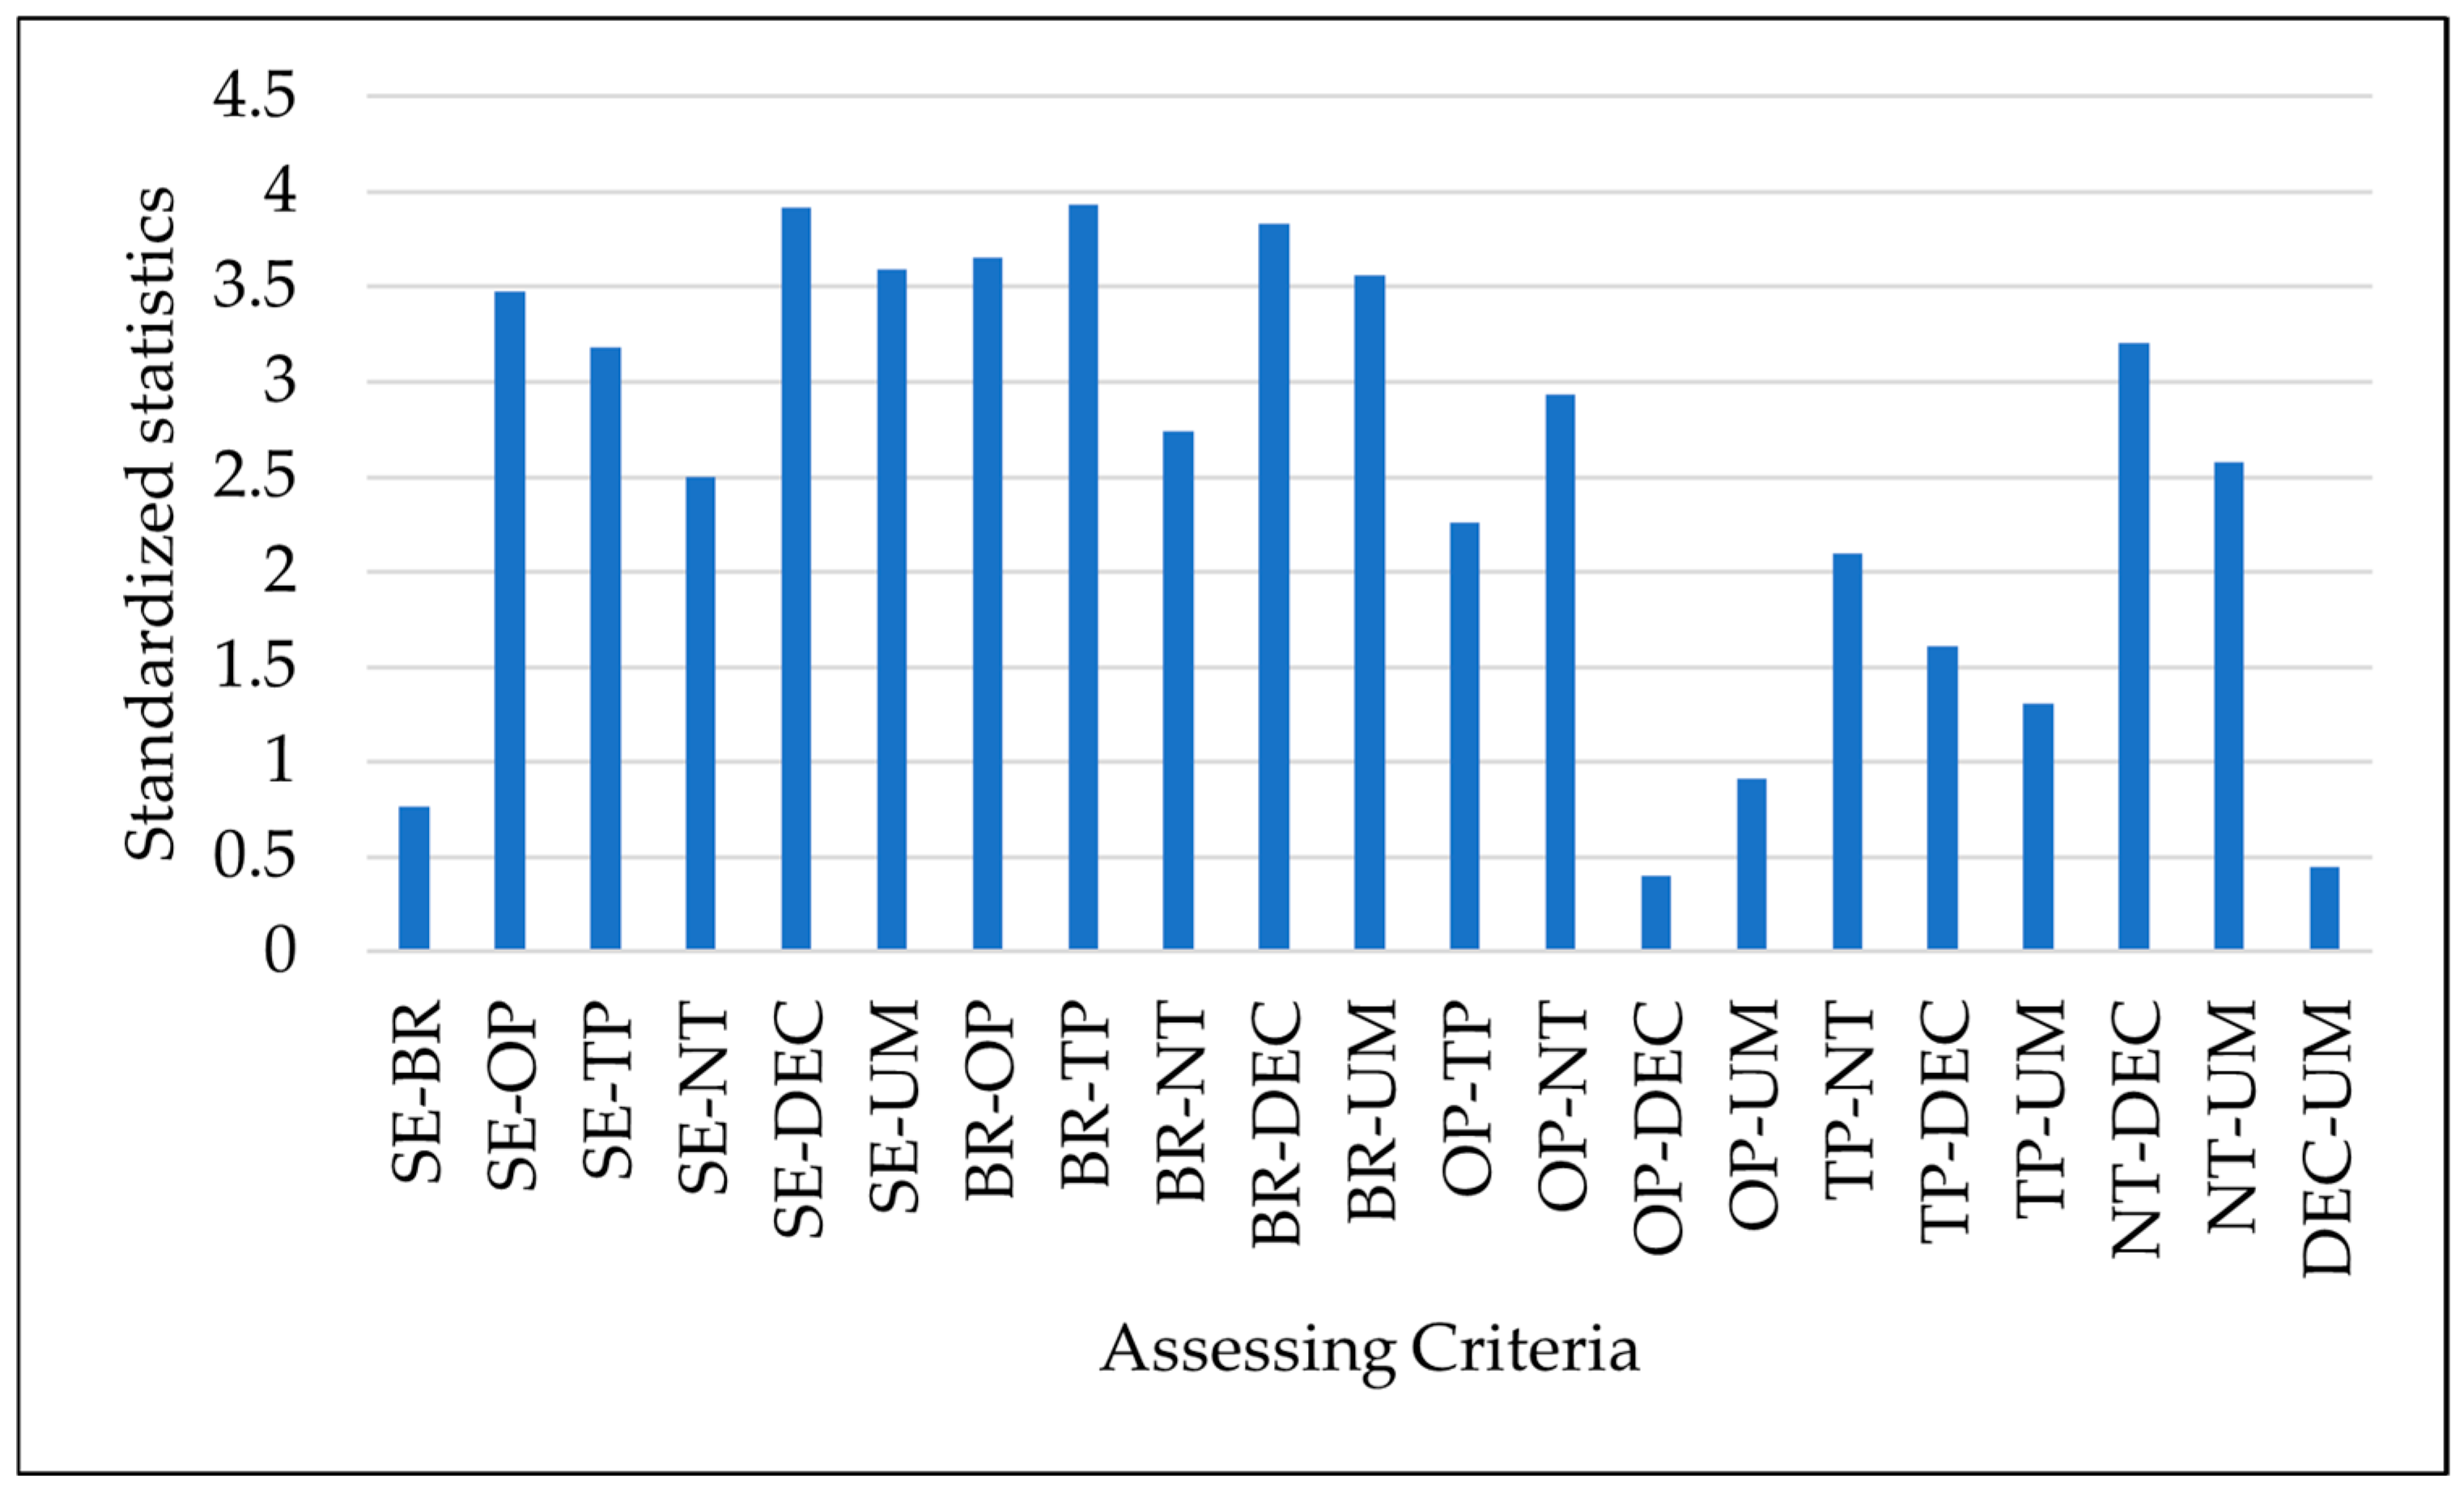
Since p = 0.00 < 0.05, the Friedman test revealed that the sub-dimensions had significantly different rates of significance. To determine which groups showed this difference, Wilcoxon signed-rank tests (Table 6 and Figure 9) were performed. This test is designed for situations where the t-test assumptions, particularly regarding metric data and normality, are not met. It is especially functional for ranked or ordinal data. It provides a great alternative for analyzing repeated-measures or paired observations without assuming normality, though it may be less powerful under normality.
Since the significance levels of the tests were less than 0.05, it was statistically determined that FF was less significant than the other three sub-dimensions. DBF is superior to TBF and ZBF.

4.1.2. Assessing Criteria Analysis

Differences between the sub-dimensions of the assessing criteria were investigated using the Friedman test (Table 7).
Since p = 0.00 < 0.05, the Friedman test revealed that the sub-dimensions of the assessment criteria had significantly different significance levels. To determine which groups showed this difference, Wilcoxon rank-sum tests (Table 8 and Figure 10) were performed.
When the Friedman test and Wilcoxon pairwise comparison results are considered together, a holistic structure emerges in which experts significantly differentiate among variables. According to the Friedman test, there is a significant difference in the mean rankings of the variables (χ2 = 63.570; p < 0.001).
The Wilcoxon results elaborate on the general ranking revealed by the Friedman test, highlighting which pairs of variables showed significant differences. The lack of a significant difference between social equity and benefit received (p = 0.443) indicates consistency with their high rankings in the Friedman table. Conversely, the significant differences between these two variables and most other variables support their perceived higher position in the eyes of the experts. The fact that operator profit differs significantly from other variables, but not from decentralization and urban morphology, is consistent with their close, low rankings in the Friedman test. Similarly, the moderate differences between ticket price and number of trips align with their mid-level positions in the Friedman ranking.
Overall, when the two tests are considered together, it is concluded that experts give the highest importance to social and user-oriented variables (social equity and benefit received), while they perceive economic and spatial planning-oriented variables (operator profit, decentralization, urban morphology) as having lower priority. These findings suggest that social and passenger-centric approaches are decisive for experts, while structural elements such as profit and spatial arrangement are considered less important.

4.1.3. Comparison Between Fare Structures and Assessing Criteria

To compare fare structures and assess criteria, the common variances of the sub-dimensions were calculated for each criterion, and a paired-samples t-test was used to test whether they differed. Based on the test results (Table 9 and Table 10 and Figure 11), it can be determined which system exhibits a sharper or more even distribution.
In statistics, Spearman’s rank correlation coefficient measures the strength of the relationship between two sets of ranked data, ranging from −1 to 1. It is useful when only ranks are available, but it indicates only association, not causation.
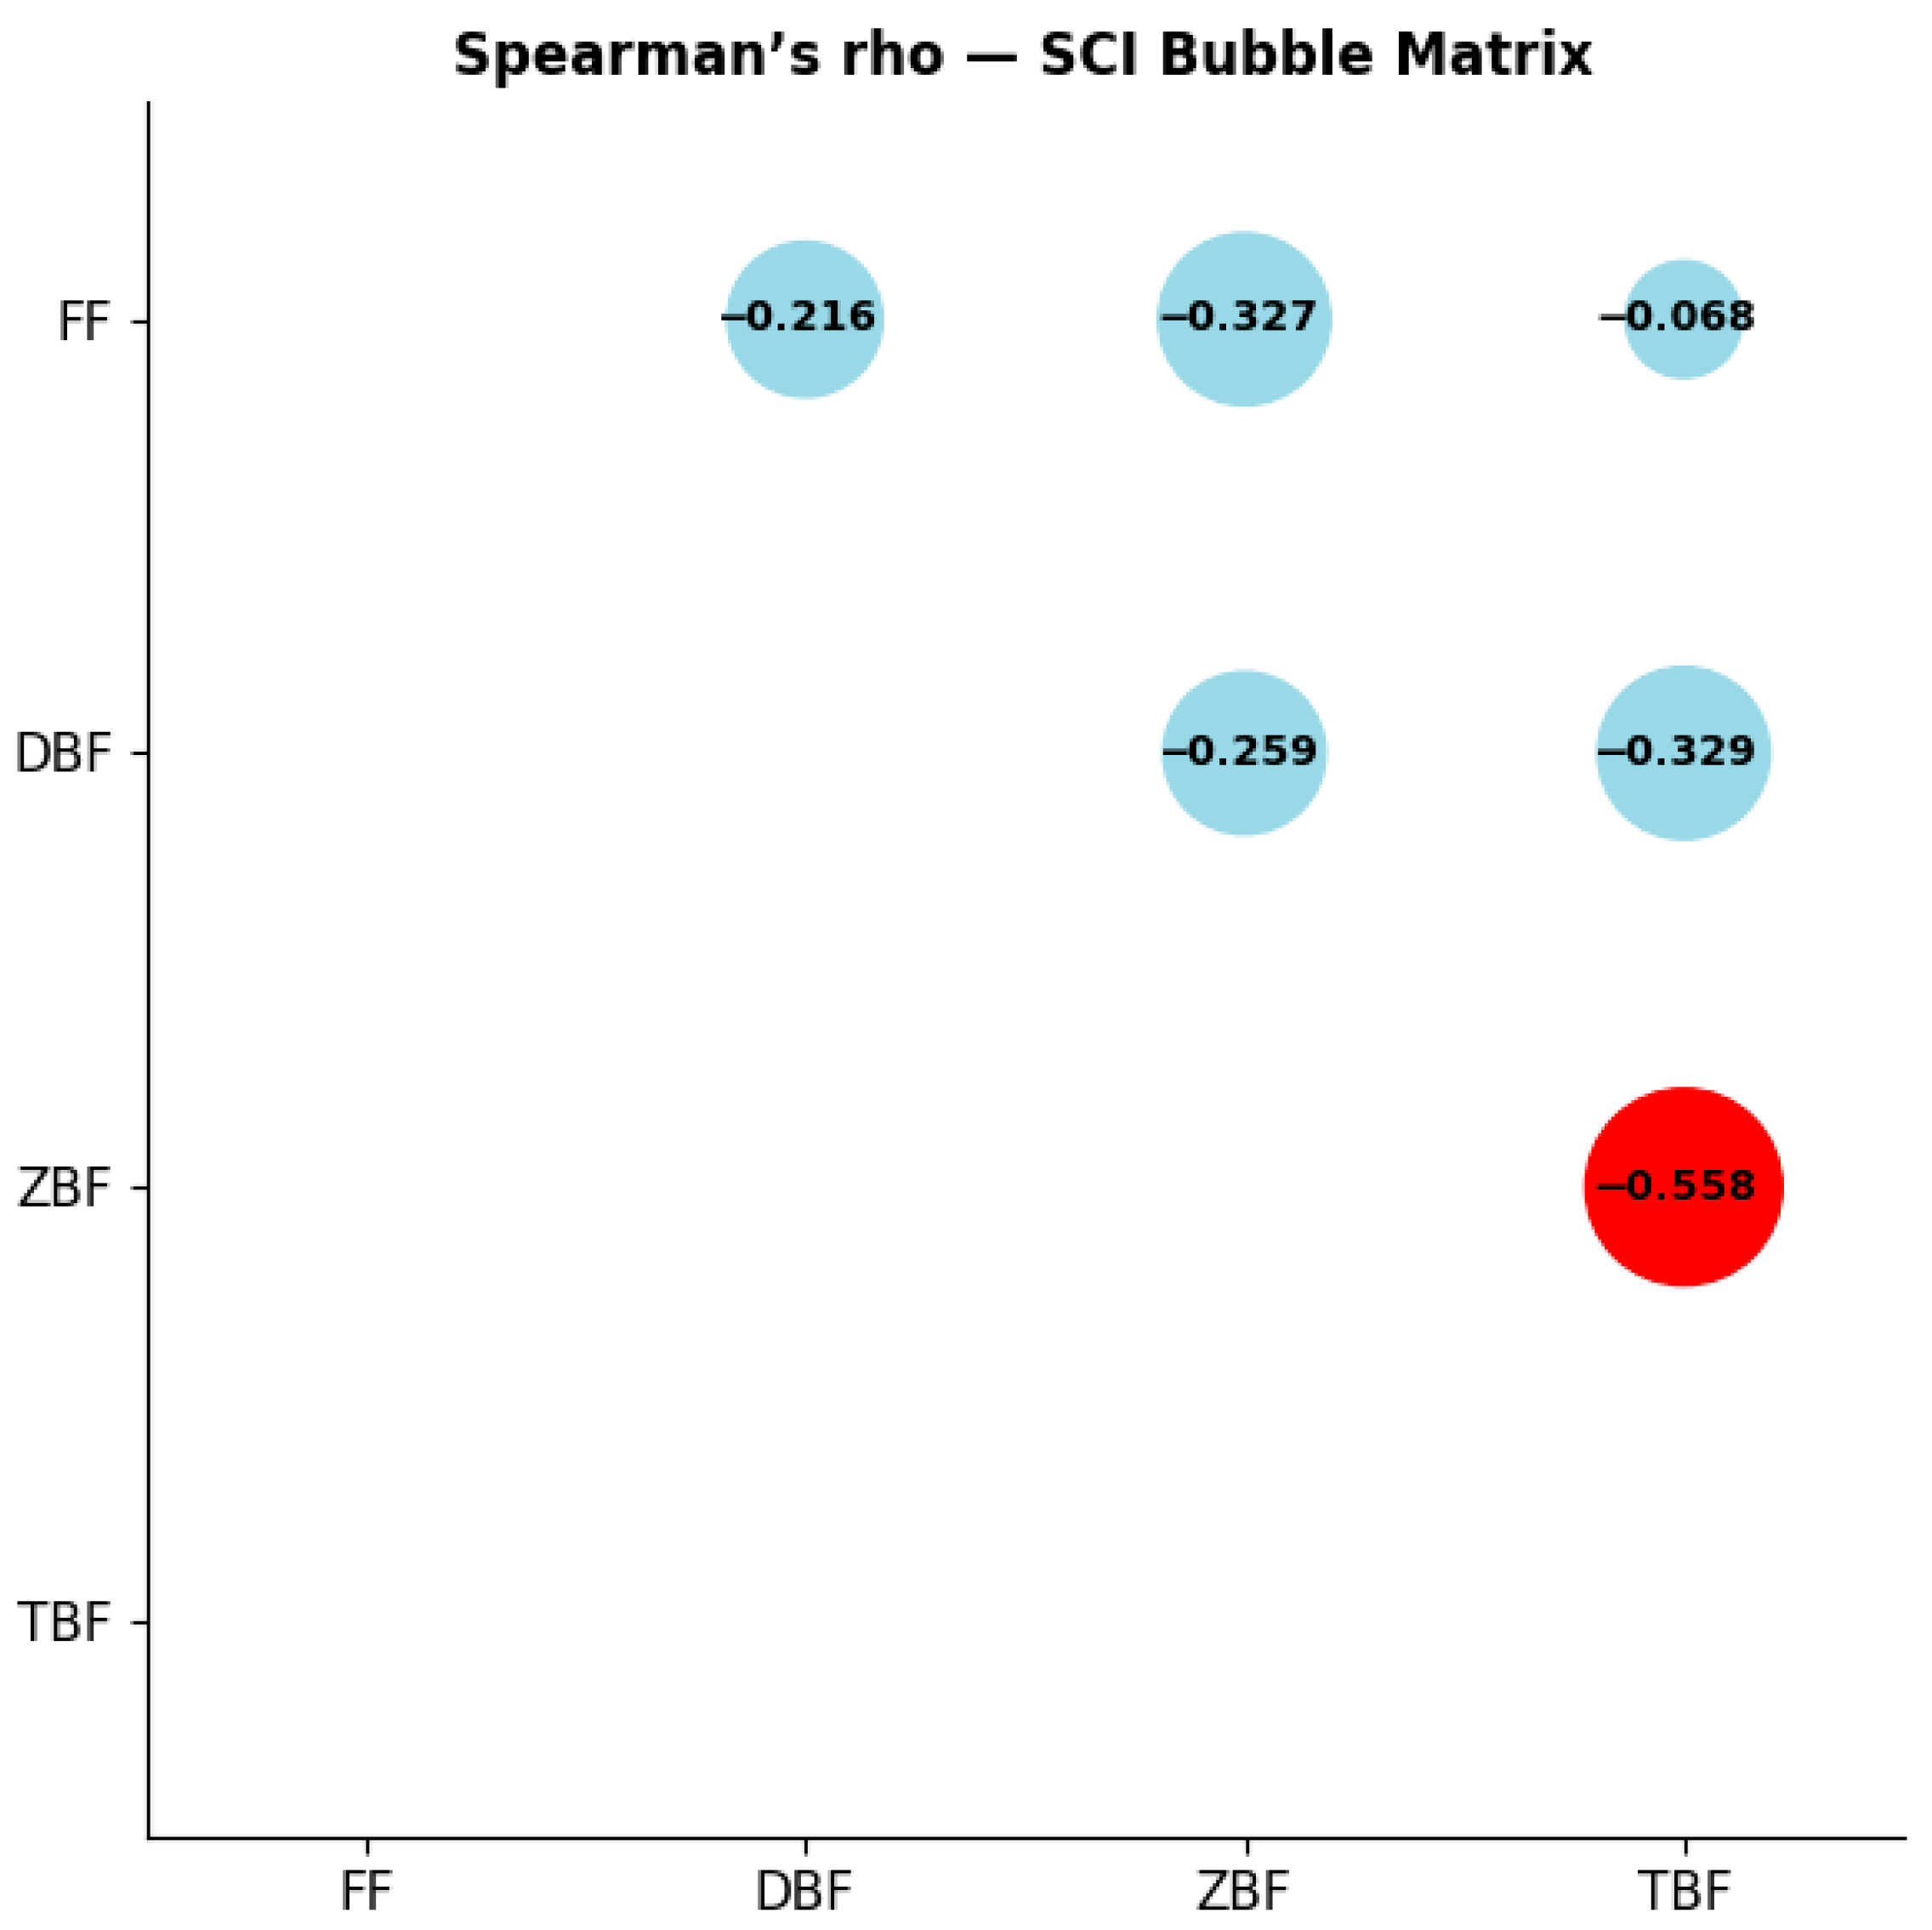
Due to the non-normal distribution of the variables, the Spearman method, which is suitable for capturing non-linear and rank-based relationships, was applied to assess the relationships between the variables. According to the test result, a moderately negative correlation (−0.558) was found between TBF and ZBF (Table 11 and Figure 12).
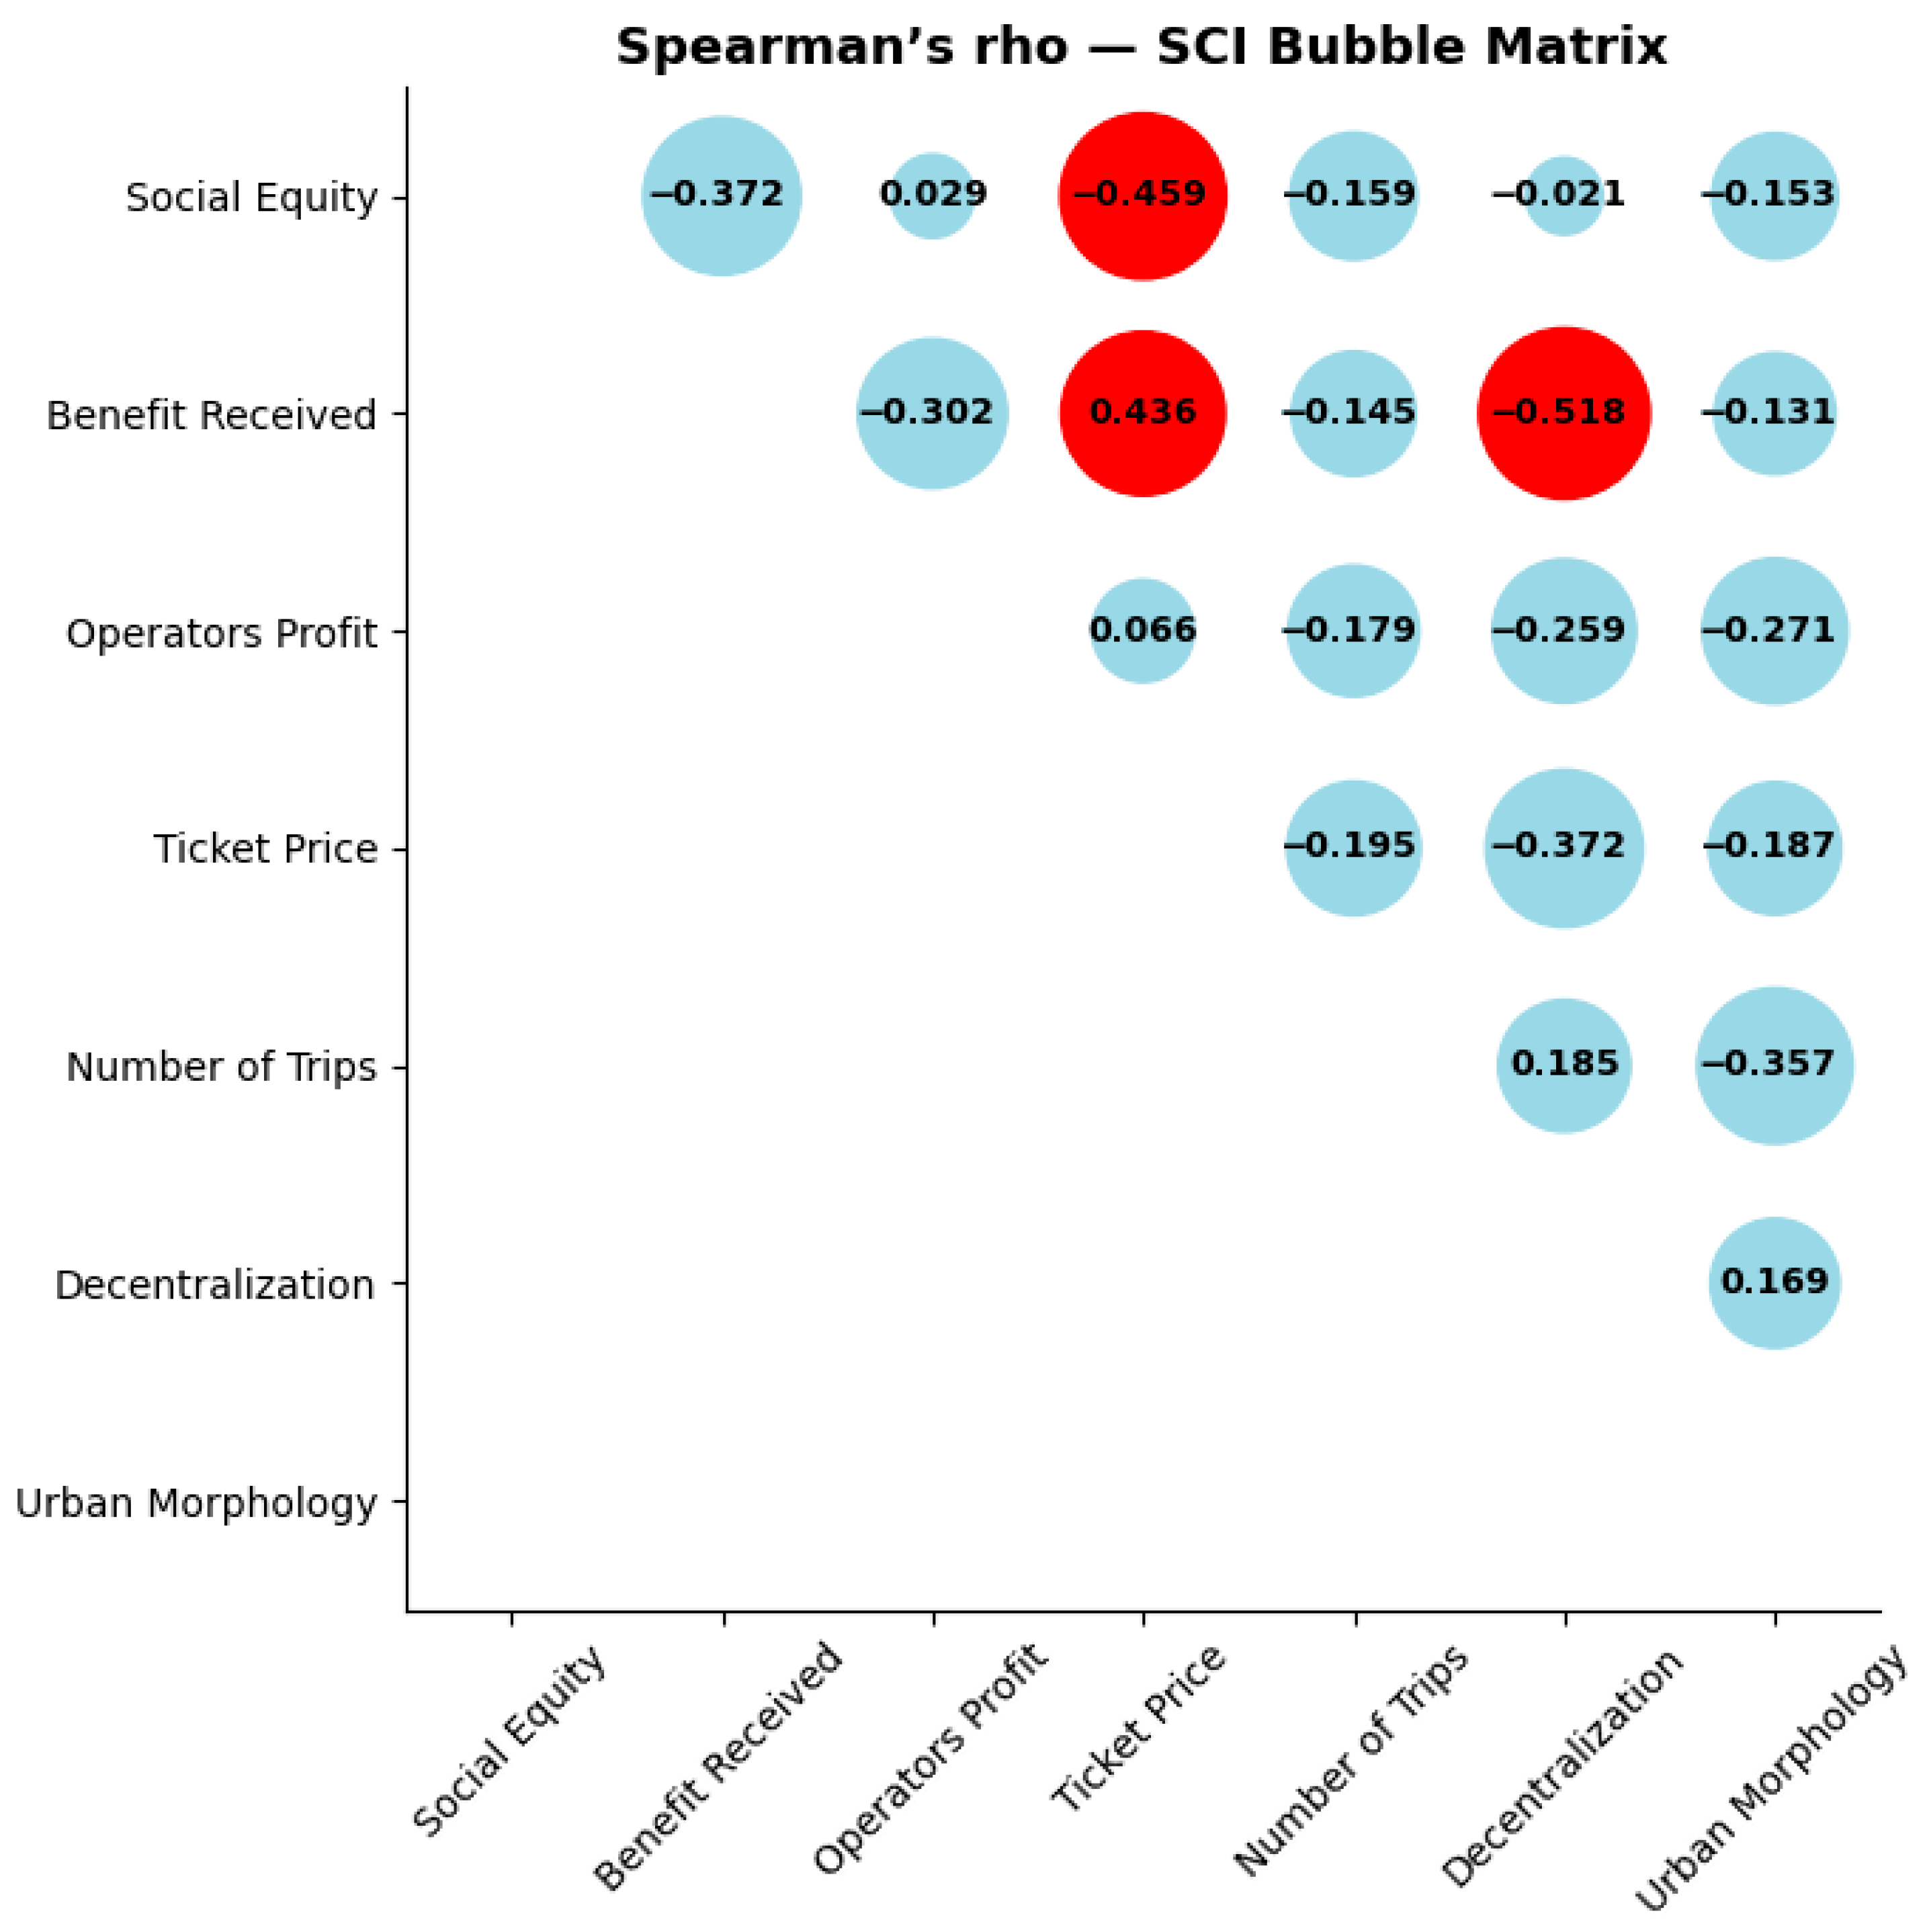
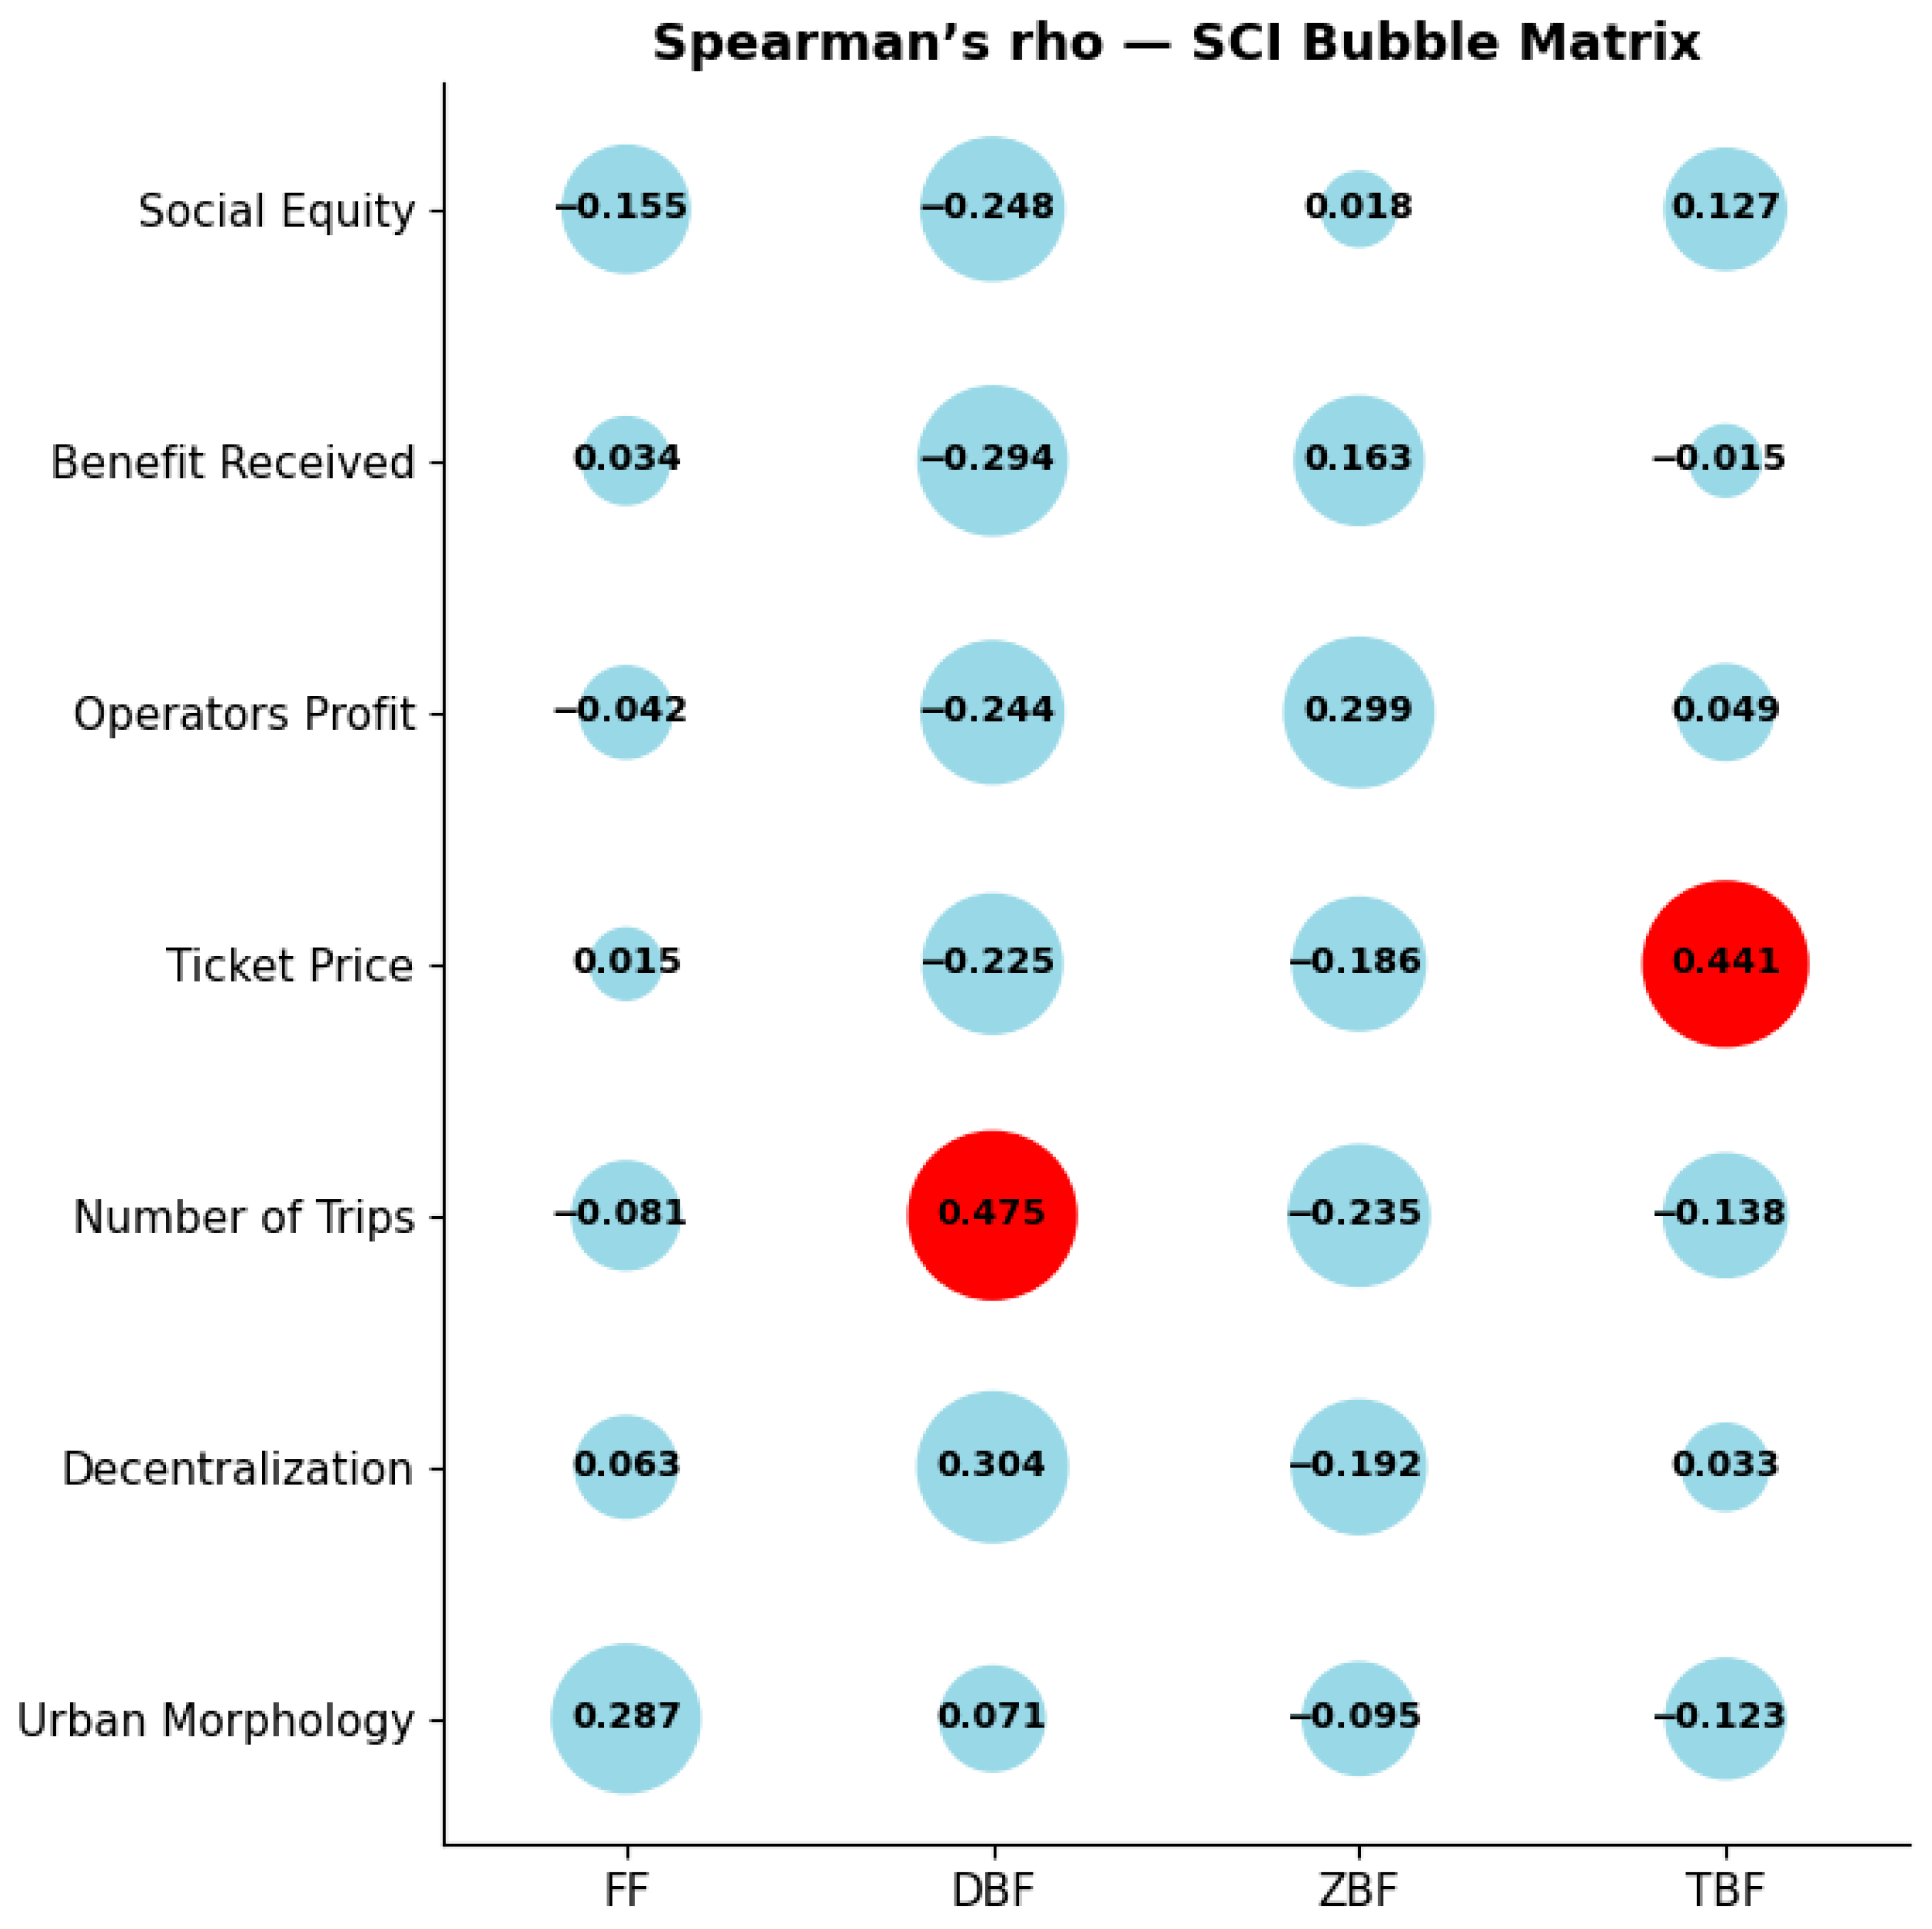
Spearman’s correlation analysis for the assessed criteria shows that the relationships between the variables are weak, and only a few are statistically significant. Spearman’s correlation analysis among the sub-dimensions reveals no significant relationships between most variables. This suggests that experts’ perceptions of the variables are independent of each other, or at least not very strongly so. However, a few significant relationships are noteworthy (Table 12 and Figure 13).
Spearman correlation analysis revealed three significant relationships. First, there is a moderately negative relationship between social equity and ticket price (rho = −0.459; p = 0.032). This result indicates that as the perception of social justice increases, the importance given to ticket price decreases. Second, a positive and significant relationship was found between passenger benefit and ticket price (rho = 0.436; p = 0.043). Accordingly, as the benefit increases, the importance given to ticket prices also increases; it is understood that if a passenger receives sufficient benefit, they may accept an increase in the fare they pay. Third, a moderately negative and significant relationship was found between benefit received and decentralization (rho = −0.518; p = 0.014). The findings show that as the importance given to passenger benefit increases, the importance of decentralization decreases, and passengers perceive more centralized, accessible transportation systems as more beneficial.

4.2. Sensitivity Analysis for Expert Surveys

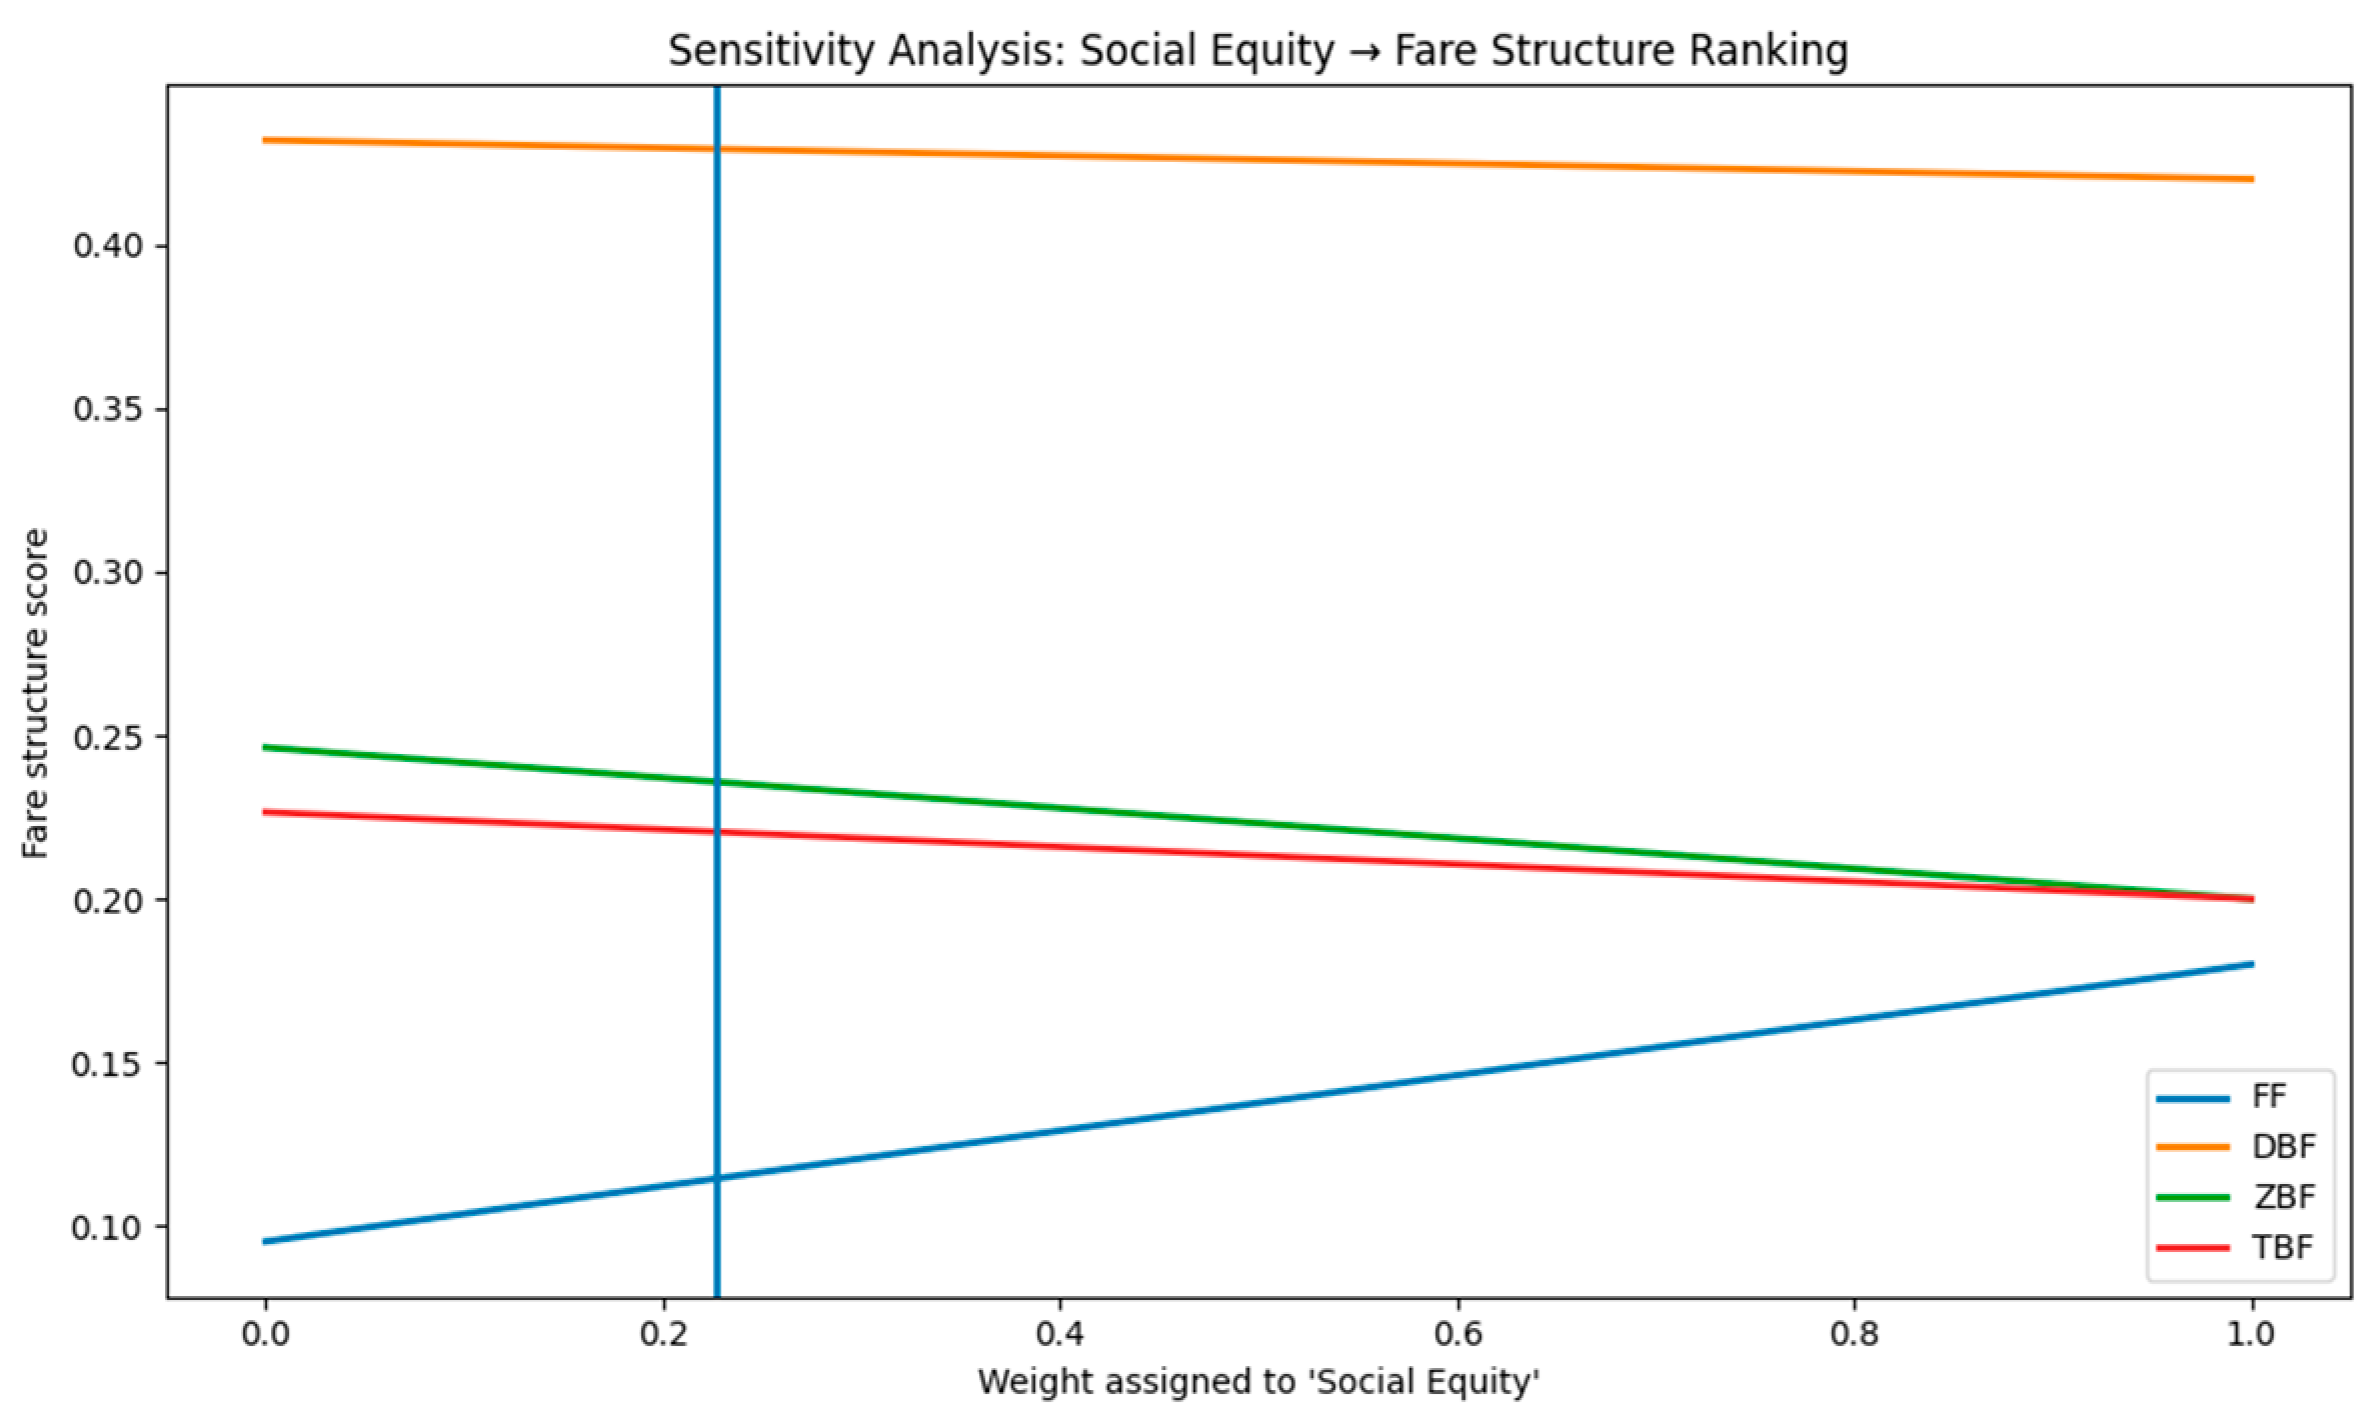
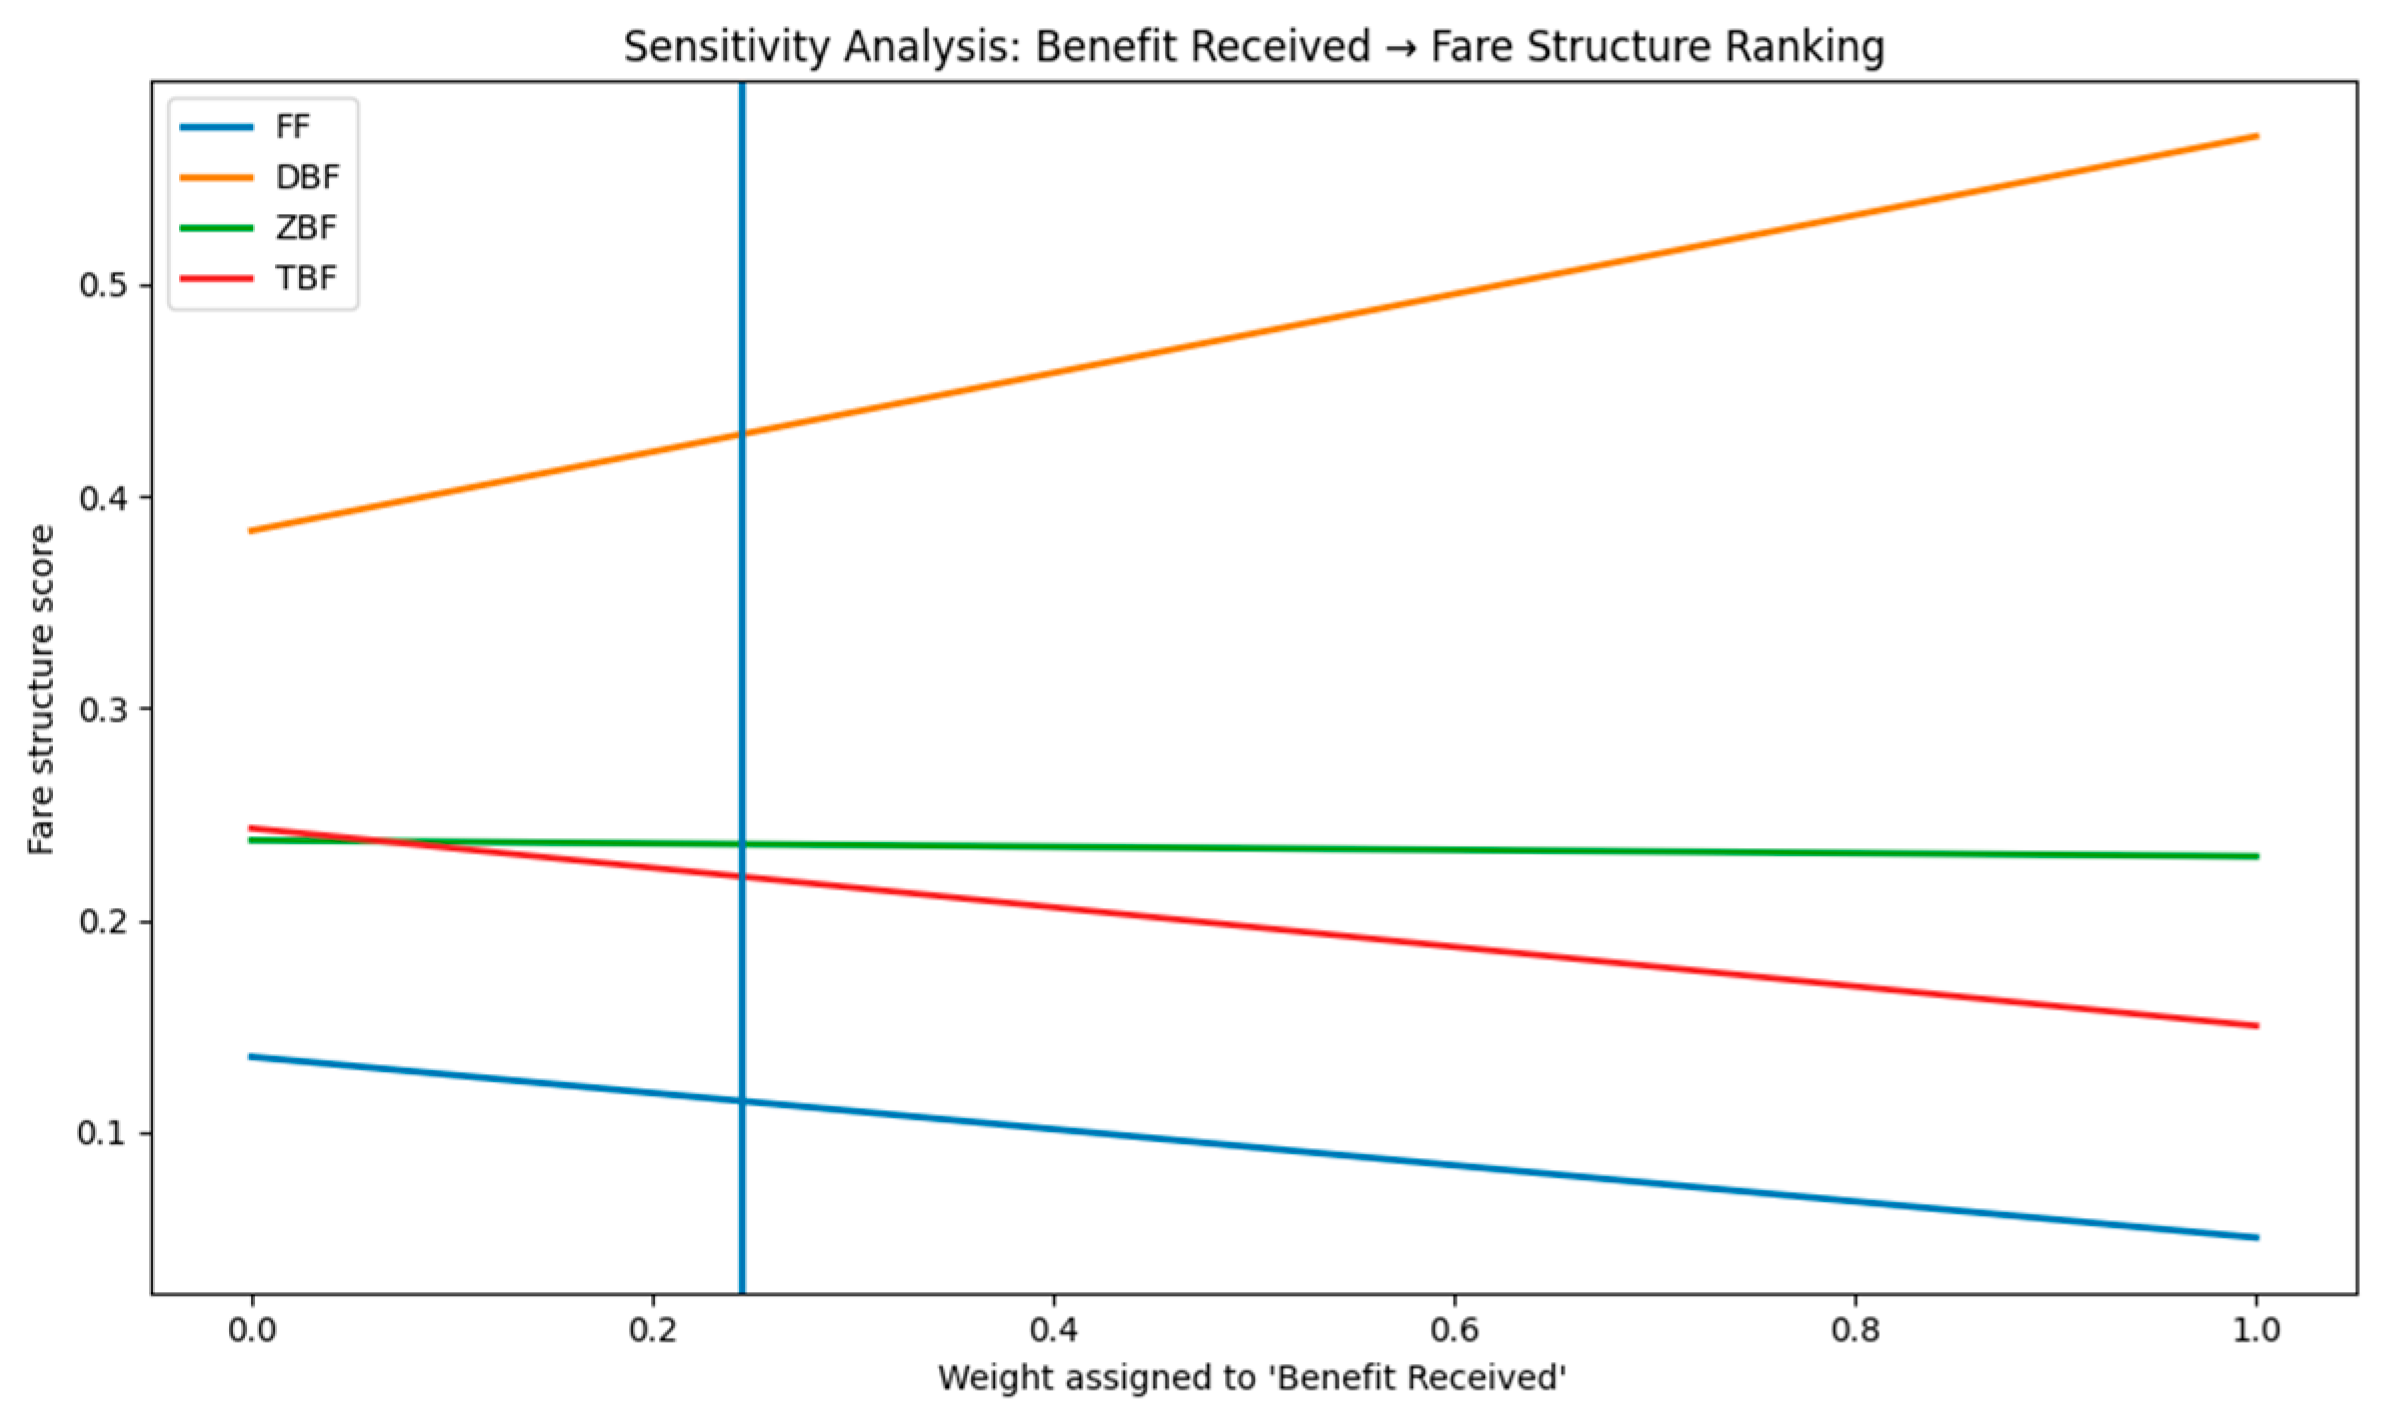
Sensitivity analysis is an essential step in MCDM models to evaluate the robustness of the results to possible variations in the criteria weights. In this study, assumption-based sensitivity analysis was conducted to investigate how continuous changes in individual criteria weights affect the ranking of the fare structure alternatives. Each criterion weight was gradually varied within the interval [0, 1], while the remaining criterion weights were proportionally rescaled to maintain the unit-sum normalization constraint. This procedure enables the identification of stability regions and potential crossover points among the alternatives. The results provide insights into the robustness of the proposed evaluation framework and reveal how different policy priorities may influence the relative performance of the fare structure options. Consequently, the sensitivity analysis supports a more comprehensive understanding of the decision-making process and enhances the reliability of the results obtained under alternative weighting scenarios (Figure 14, Figure 15 and Figure 16).
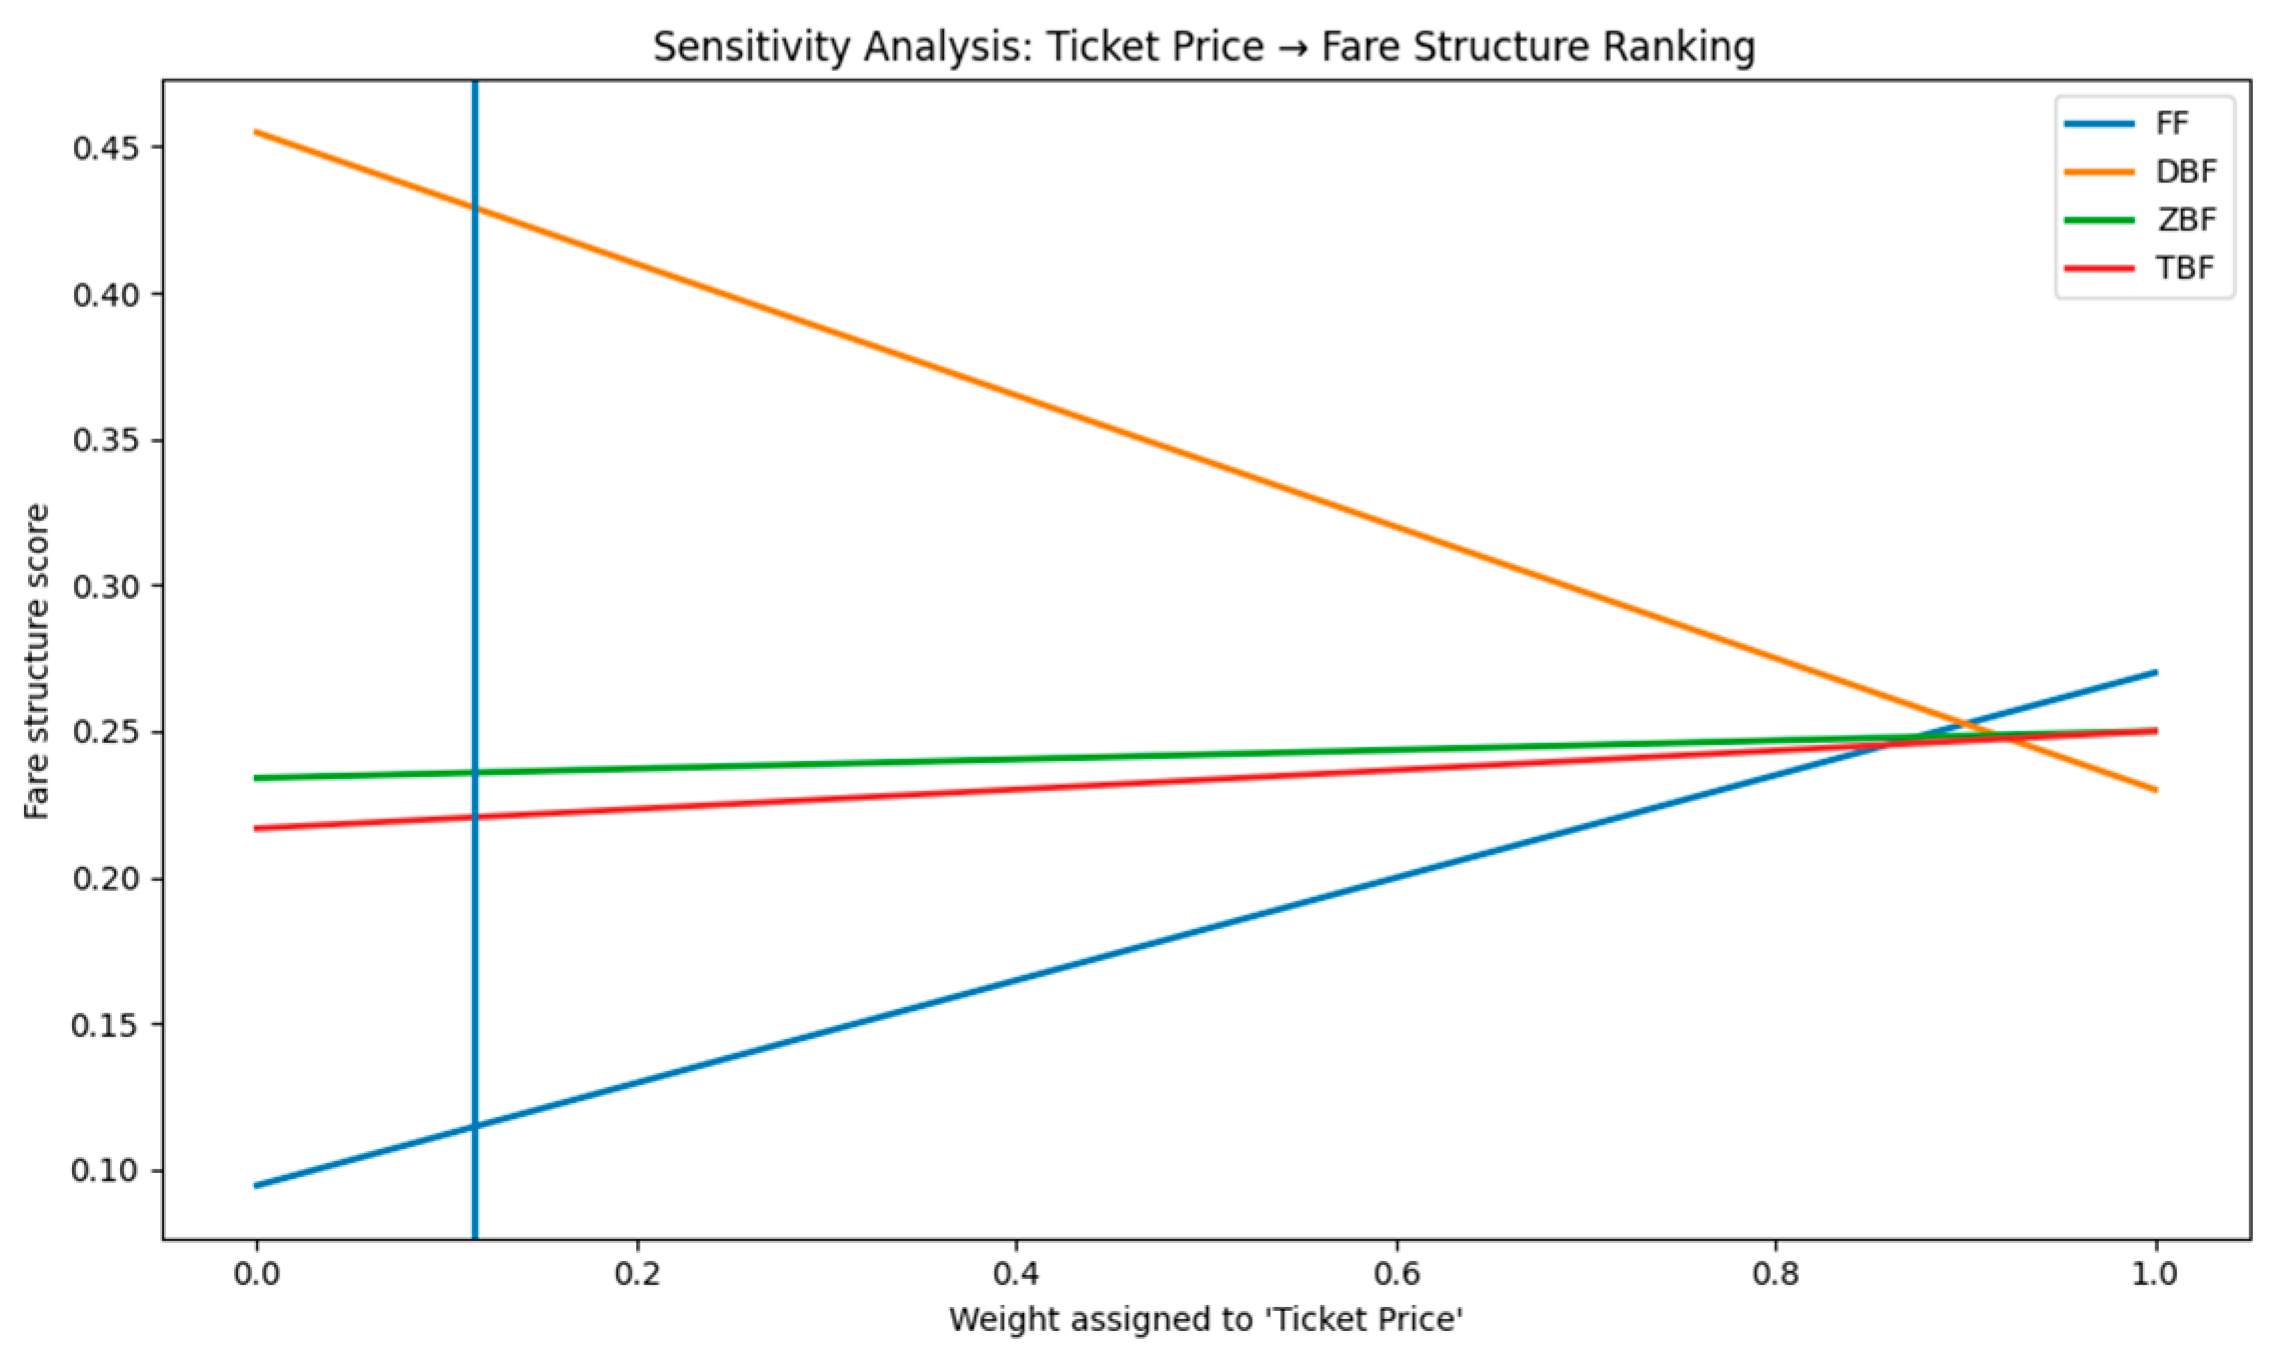
In Figure 14, Figure 15 and Figure 16, the vertical blue line marks the baseline value of the criterion. When this value is increased or decreased along the x-axis, the relative importance and ranking of the fare systems vary accordingly. The sensitivity analysis demonstrates that the ranking of fare structures is stable under most weighting configurations (Figure 14 and Figure 15).
The DBF consistently performs as the most robust option across a broad range of weight variations. However, when ticket price (Figure 16) becomes the dominant criterion (after it reaches an importance of 90%), the FF gains competitiveness and may surpass DBF. Findings highlight the importance of policy priorities in fare system evaluation and confirm that different planning objectives may lead to different preferred fare structures.
Based on the expert evaluations and the criteria adopted in this study, the DBF is identified as the most appropriate fare structure among the alternatives considered.

5. Discussion

Rapid urbanization has intensified the need for PT systems that ensure economic feasibility, ecological sustainability, and social equity. Conventional fare frameworks primarily prioritize economic performance, often neglecting wider social and environmental implications [59]. This study surveys a region’s optimal fare system with BWM for PT fare for the first time. Moreover, it is the first study to compare PT fare structures and criteria for Istanbul. The main objective of this study is to evaluate the best fare system for the Istanbul Metro. To apply the BWM, a survey was conducted among transportation experts, transportation operators, academia, and government officials.
According to BWM’s findings, social equity and benefit received are the most important criteria, with 22.7% and 24.4%. DBF is the most suitable option for the Istanbul Metro, while FF is the least suitable. Analysis of expert surveys revealed that:
  • A positive and meaningful relationship was found between the ticket price criteria and TBF. In other words, experts favoring time-based fare differentiation regarded ticket prices as important, with higher fares during peak hours and lower fares during off-peak periods.
  • Another positive and meaningful relationship emerged between the number of trips criterion and DBF. As stated in this and previous studies, DBF has a remarkable potential to increase the number of trips, especially short trips (due to its low fare).
The sensitivity analysis highlights the strong influence of the Ticket Price criterion on fare structure. While DBF performs best under balanced weighting, the results indicate that when the importance assigned to ticket price is very high, the FF system becomes more competitive and may surpass DBF. This shift can be explained by FF’s simpler fare structure, which generally offers more predictable and potentially lower fares, particularly for longer-distance trips. In contrast, DBF reflects the distance traveled and may lead to higher ticket prices for certain passenger groups.
It is important to note that many of the findings here reflect a common planning approach in developing countries, where short-term, populist measures often take priority over long-term, technically informed solutions. Comprehensively restructuring transportation within metropolitan areas, creating diverse development and employment poles, and establishing new networks will help resolve the existing issues of an overly centralized system prone to frequent operational disruptions.
Designing a fare system tailored to the region’s specific characteristics is important for enhancing population mobility and promoting regional development. Istanbul is notable for its lack of, or inadequate, rail systems on the city’s peripheries, its planned bus system, and its high fares (relative to average salaries). These barriers force a big portion of passengers to rely on multiple routes and modes of PT, forcing them to pay multiple fares for their daily commute.
One reason for these problems is the lack of cooperation between Istanbul’s local and central administrations. Most major metropolitan areas have multiple administrations, often with conflicting political interests, making the full integration of the network and fare system highly challenging. This limits population mobility and hampers regional development. The outcomes of coordinated efforts presented as outputs for the city of Istanbul, analyzed in this study, demonstrate what can be accomplished through careful and rational planning. This study presents findings that highlight the significance of both vertical and horizontal equity in PT fares. Although the FF used in the Istanbul Metro is easy to understand and implement, modern, holistic, and tailored solutions are needed for cities of this scale.
This study has several limitations that should be acknowledged. First, the BWM analysis was conducted with a relatively limited number of experts (n = 22). Although such sample sizes are commonly considered acceptable in expert-based MCDM approaches, the results may still reflect the perspectives of the selected expert group. Second, the analysis focuses specifically on Istanbul’s PT system. Since fare structures and PT characteristics vary across cities due to differences in urban form, governance structures, and travel behavior, the findings may not be directly generalizable to other contexts.
Beyond the limitations related to the expert sample size and the city-specific scope of the analysis, future research could extend the present study in several directions. First, passenger surveys conducted by transit operators or independent researchers could be incorporated to obtain more detailed information on passengers’ socio-economic characteristics. Integrating this data into fare policy analyses would enable a more comprehensive understanding of how different passenger groups respond to alternative fare structures. Second, future studies could combine survey data with smart card and automated fare-collection datasets to analyze passenger travel behavior in greater detail. Such integration would provide valuable insights into travel demand patterns and the behavioral impacts of fare policies. Finally, comparative analyses across different cities could further improve the generalizability of the findings and help identify how variations in urban structure, governance, and public transport systems influence the performance of alternative fare structures. These approaches could support the development of more equitable and efficient fare systems, including targeted discount policies for specific passenger groups such as students, elderly passengers, and other disadvantaged populations.

Author Contributions

Ö.M.U. and M.G.: Research planning, conceptualization, and methodology. Ö.M.U.: Data analysis and preparation of the initial manuscript based on his thesis. Ö.M.U.: Preparation of the original paper, drafting of content, editing, analysis. M.G.: Supervision, guidance throughout the study, and critical review of the manuscript. All authors have read and agreed to the published version of the manuscript.

Funding

This research received no external funding.

Institutional Review Board Statement

The study was conducted in accordance with the Declaration of Helsinki, and approved by the Ethics Committee of YILDIZ TECHNICAL UNIVERSITY SOCIAL AND HUMAN SCIENCES RESEARCH ETHICS COMMITTEE (Report No: 20250404491 and date of approval: 3 April 2025).

Informed Consent Statement

Verbal informed consent was obtained from all subjects involved in the study.

Data Availability Statement

The original contributions presented in this study are included in the article. Further inquiries can be directed to the corresponding author.

Conflicts of Interest

The authors declare no conflicts of interest.

Abbreviations

The following abbreviations are used in this manuscript:
PTPublic transportation
BWMBest–Worst Method
DBFDistance-Based Fare
FFFlat Fare
FRRFarebox Recovery Ratio
AFCAutomatic Fare Collection
ZBFZone-Based Fare
TBFTime-Based Fare
LOSLevel of service
NTUAssociação Nacional das Empresas de Transportes Urbanos
UTAUtah Transit Authority
TODTransit-Oriented Development
TUİKTurkish Statistical Institute
IBBIstanbul Metropolitan Municipality
MCDMMultiple-criteria decision making
AHPAnalytic Hierarchy Process
MABACMulti-Attributive Border Approximation Area Comparison
BELBİMElectronic Money and Payment Services Inc.

Appendix A

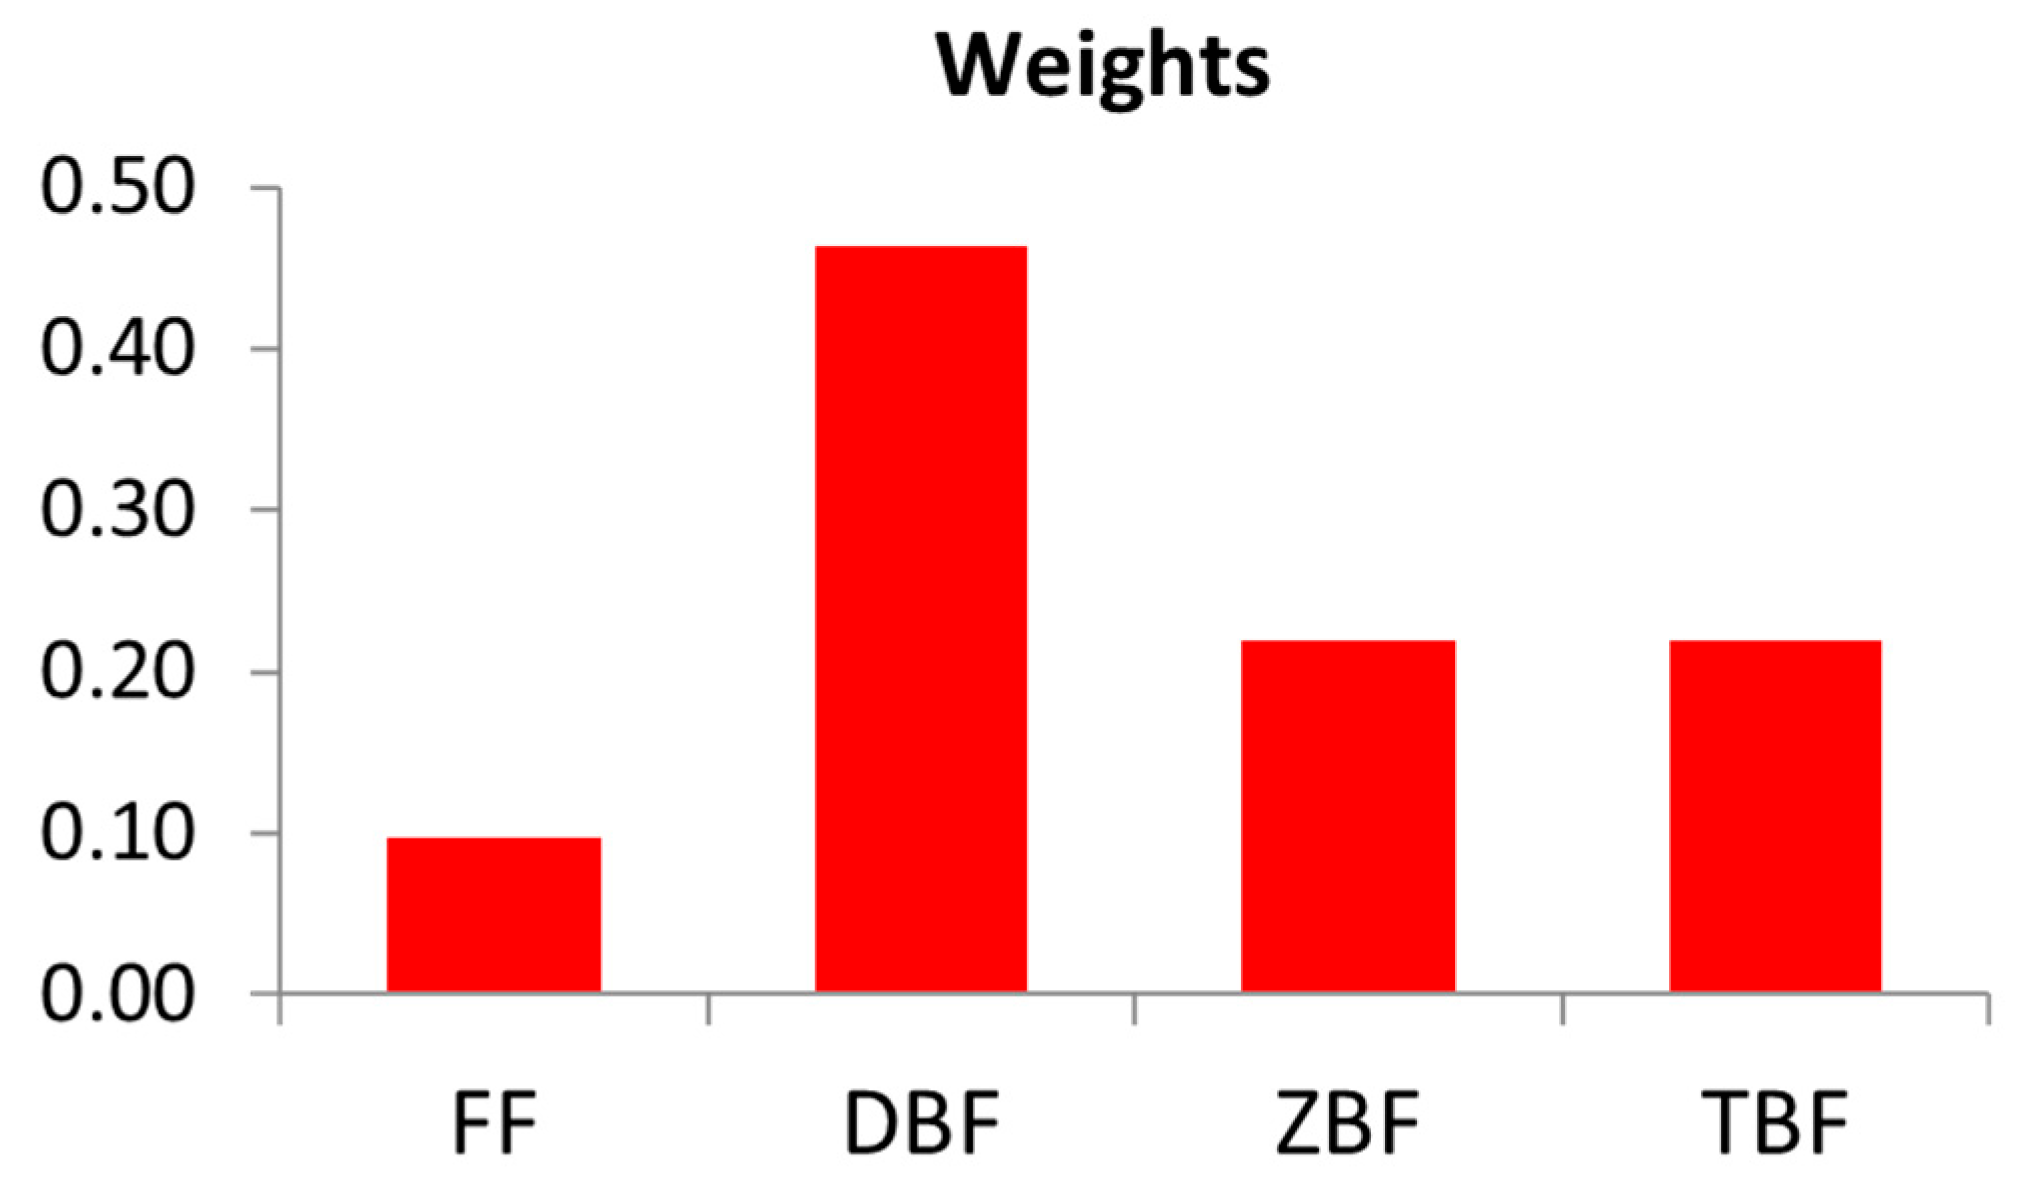
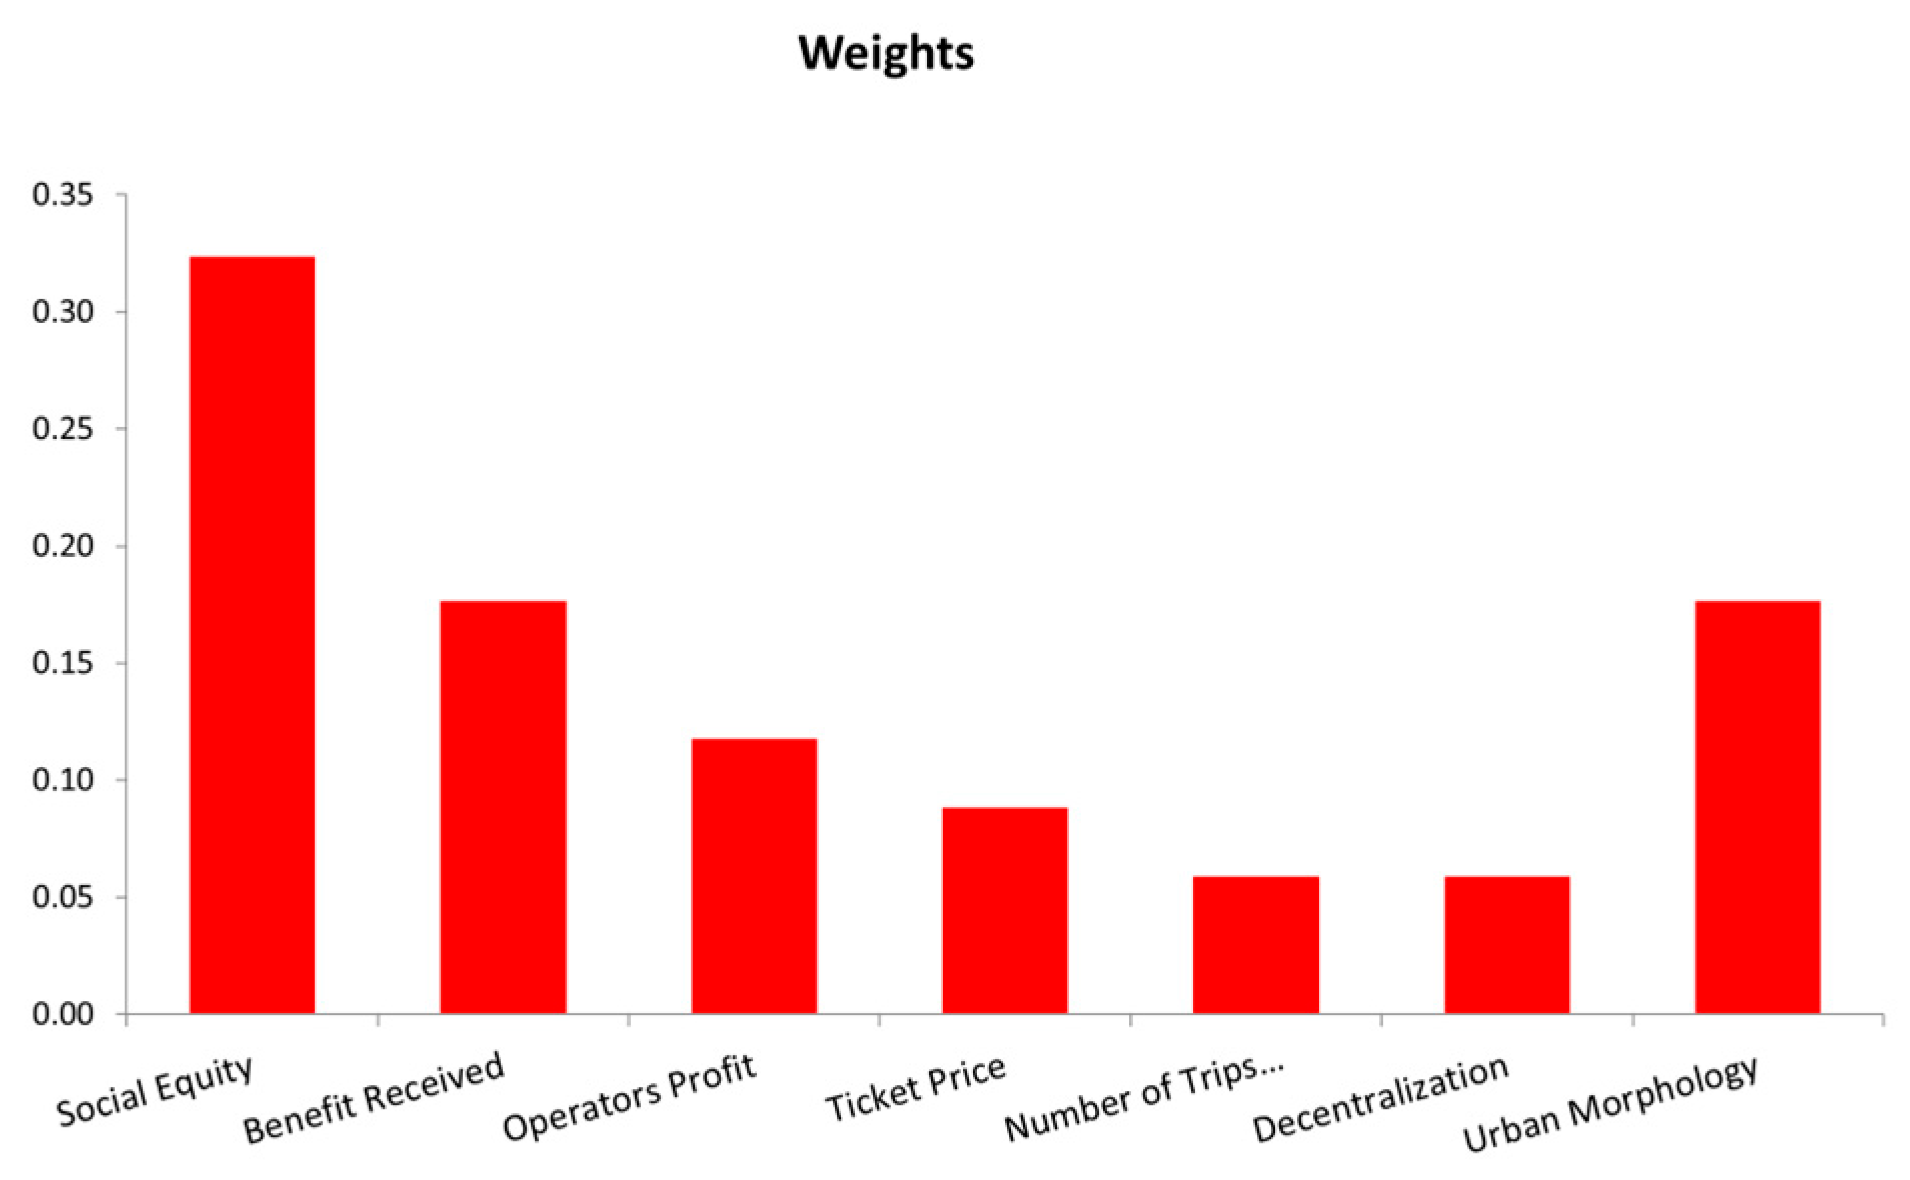
Examples of the BWM tables completed and submitted by twenty-two experts for Fare Structure (Figure A1) and Criteria (Figure A2) are presented below. If the Consistency Ratio is less than 0.1 as a result of the expert evaluations, the final values in the “Weights” graph are used as the expert’s responses. If the Consistency Ratio exceeds 0.1, the expert may revise their responses to bring it below 0.1 and control their final answer.
Table A1. Example of Fare Structure BWM Expert Survey Form.
Structure 1Structure 2Structure 3Structure 4
Name of StructureFFDBFZBFTBF
BestDBF
WorstFF
How many times better is “The Best” than The Others?FFDBFZBFTBF
DBF5122
How many times worse is “The Worst” than The Others?FF
FF1
DBF5
ZBF2
TBF2
WeightsFFDBFZBFTBF
0.100.460.220.22
Consistency Ratio (ζ)0.024
Figure A1. Example of Fare Structure BWM Expert Survey Form Result.
Sustainability 18 03715 g0a1
Table A2. Example of Assessing Criteria BWM Expert Survey Form.
Critera 1Critera 2Critera 3Critera 4Critera 5Critera 6Critera 7
Name of CriteriaSocial EquityBenefit ReceivedOperator ProfitTicket PriceNumber of Trips
(Demand)
DecentralizationUrban Morphology
BestSocial Equity
WorstDecentralization
How many times better is “The Best” than The Others?Social EquityBenefit ReceivedOperator ProfitTicket PriceNumber of Trips
(Demand)
DecentralizationUrban Morphology
Social Equity1234562
How many times worse is “The Worst” than The Others?Decentralization
Social Equity6
Benefit Received3
Operator Profit2
Ticket Price2
Number of Trips (Demand)1
Decentralization1
Urban Morphology3
WeightsSocial EquityBenefit
Received
Operator ProfitTicket PriceNumber of Trips
(Demand)
DecentralizationUrban Morphology
0.320.180.120.090.060.060.18
Consistency Ratio (ζ)0.03
Figure A2. Example of Assessing Criteria BWM Expert Survey Form Result.
Sustainability 18 03715 g0a2

References

  1. Buchanan, C. Traffic in Towns; Ministry of Transport: London, UK, 1963.
  2. Vivier, J.; Kenworthy, J.R.; Laube, F. Millennium Cities Database for Sustainable Mobility: Analyses and Recommendations; ISTP: Brussels, Belgium, 2001. [Google Scholar]
  3. Mohring, H. Optimization and scale economies in urban bus transportation. Am. Econ. Rev. 1972, 62, 591–604. [Google Scholar]
  4. De Borger, B.; Proost, S. The political economy of public transport pricing and supply decisions. Econ. Transp. 2015, 4, 95–109. [Google Scholar] [CrossRef]
  5. Metro Istanbul. Strategic Plan 2021–2025 (Revised Version). 2024. Available online: https://www.metro.istanbul/Content/assets/uploaded/stratejik%20plan2021-2025_guncel.pdf (accessed on 7 June 2025).
  6. Tsai, F.M.; Chien, S.I.J.; Spasovic, L.N. Optimizing distance-based fares and headway of an intercity transportation system with elastic demand. Transp. Res. Rec. 2008, 2089, 101–109. [Google Scholar] [CrossRef]
  7. Nuworsoo, C.; Golub, A.; Deakin, E. Analyzing equity impacts of transit fare changes. Eval. Program Plan. 2009, 32, 360–368. [Google Scholar] [CrossRef]
  8. Gokasar, I.; Karakurt, A.; Kuvvetli, Y.; Deveci, M.; Delen, D.; Pamucar, D. Correction: Sustainable regional rail system pricing using a machine learning-based optimization approach. Ann. Oper. Res. 2024, 332, 1315–1316. [Google Scholar]
  9. Kilani, M.; Proost, S.; Van der Loo, S. Road pricing and public transport pricing reform in Paris. Econ. Transp. 2014, 3, 175–187. [Google Scholar] [CrossRef]
  10. Bondemark, A.; Andersson, H.; Wretstrand, A.; Brundell-Freij, K. Is it expensive to be poor? Public transport in Sweden. Transportation 2021, 48, 2709–2734. [Google Scholar] [CrossRef]
  11. Deakin, E.; Harvey, G. Transportation Pricing Strategies for California; California Air Resources Board: Sacramento, CA, USA, 1996.
  12. Bandegani, M.; Akbarzadeh, M. Evaluation of horizontal equity under a distance-based transit fare structure. J. Public Transp. 2016, 19, 161–172. [Google Scholar] [CrossRef]
  13. Mayworm, P.D.; Laao, A.M.; McEnroe, J.M. Patronage Impacts of Changes in Transit Fares and Services; UMTA: Washington, DC, USA, 1980. [Google Scholar]
  14. Daskin, M.S.; Schofer, J.L.; Haghani, A.E. Designing and evaluating distance-based and zone fares. Transp. Res. Part B 1988, 22, 25–44. [Google Scholar] [CrossRef]
  15. Ling, J.H. Transit fare differentials: A theoretical analysis. J. Adv. Transp. 1998, 32, 297–314. [Google Scholar] [CrossRef]
  16. Cummings, C.P.; Fairhurst, M.; Labelle, S.; Stuart, D. Market segmentation of transit fare elasticities. Transp. Q. 1989, 43, 407–420. [Google Scholar]
  17. Voith, R. Fares, service levels, and demographics. J. Urban Econ. 1997, 41, 176–197. [Google Scholar] [CrossRef]
  18. Harris, A.E.; Thomas, R.; Boyle, D. Fare elasticity model. Transp. Res. Rec. 1999, 1669, 123–128. [Google Scholar] [CrossRef]
  19. Matas, A.; Raymond, J.-L.; Ruiz, A. Economic and distributional effects of different fare schemes. Transp. Res. Part A 2020, 138, 1–14. [Google Scholar]
  20. Wang, S.; Liu, Y.; Corcoran, J. Equity of public transport costs before and after a fare policy reform. Transp. Res. Part A 2021, 144, 104–118. [Google Scholar]
  21. NTU. Novas Tendências em Política Tarifária; NTU: Brasília, Brazil, 2005. [Google Scholar]
  22. Wang, Z.J.; Li, X.H.; Chen, F. Impact evaluation of a mass transit fare change. Transp. Res. Part A 2015, 77, 213–224. [Google Scholar] [CrossRef]
  23. Nassi, C.D.; Costa, F.C.D.C. Analytic hierarchy process for fare systems. Res. Transp. Econ. 2012, 36, 50–62. [Google Scholar] [CrossRef]
  24. Liu, Y.; Wang, S.; Xie, B. Effects of public transport fare policy change. Transp. Policy 2019, 76, 78–89. [Google Scholar] [CrossRef]
  25. Liu, Z.; Wang, S.; Zhou, B.; Cheng, Q. Robust optimization of distance-based tolls. Transp. Res. Part C 2017, 79, 58–72. [Google Scholar] [CrossRef]
  26. Cervero, R. Transit pricing research: A review and synthesis. Transportation 1990, 17, 117–139. [Google Scholar] [CrossRef]
  27. Farber, S.; Bartholomew, K.; Li, X.; Páez, A.; Habib, K.M.N. Assessing social equity in distance-based transit fares. Transp. Res. Part A 2014, 67, 291–303. [Google Scholar]
  28. Simic, V.; Gokasar, I.; Deveci, M.; Karakurt, A. Type-2 neutrosophic model for pricing system selection. Socio-Econ. Plan. Sci. 2022, 80, 101157. [Google Scholar] [CrossRef]
  29. Chung, Y.S.; Chiou, Y.C. Willingness-to-pay for a bus fare reform. Transp. Res. Part A 2017, 95, 289–304. [Google Scholar]
  30. Sharaby, N.; Shiftan, Y. Fare integration and transit ridership. Transp. Policy 2012, 21, 63–70. [Google Scholar] [CrossRef]
  31. Brown, A.E. Fair fares? Equity impacts in Los Angeles. Case Stud. Transp. Policy 2018, 6, 765–773. [Google Scholar] [CrossRef]
  32. Donnelly, R.M.; Ong, P.M.; Gelb, P.M. Evaluation of the Denver RTD off-peak free fare transit demonstration. Transp. Res. Part A 1980, 16A. [Google Scholar]
  33. Benk, S.; Akdemir, T. Pricing strategies in public transport services. Ekon. Bilim. Derg. 2010, 2, 131–138. [Google Scholar]
  34. Beyazit, E. Evaluating social justice in transport. Transp. Rev. 2011, 31, 117–134. [Google Scholar] [CrossRef]
  35. Guo, Y.; Chen, Z.; Stuart, A.; Li, X.; Zhang, Y. Systematic overview of transportation equity. Transp. Res. Interdiscip. Perspect. 2020, 4, 100091. [Google Scholar] [CrossRef]
  36. Picodi. Public Transport Fares in Big Cities. 2023. Available online: https://www.picodi.com/us/bargain-hunting/public-transport-2023 (accessed on 24 December 2025).
  37. Litman, T.M. Evaluating transportation equity. ITE J. 2022, 92, 43–49. [Google Scholar]
  38. Camporeale, R.; Caggiani, L.; Ottomanelli, M. Horizontal and vertical equity modeling. Transp. Res. Part A 2019, 125, 184–206. [Google Scholar]
  39. Borndörfer, R.; Karbstein, M.; Pfetsch, M.E. Fare planning models. Discret. Appl. Math. 2012, 160, 2591–2605. [Google Scholar] [CrossRef]
  40. Tsai, F.M.; Chien, S.; Wei, C.H. Joint optimization of temporal headway and differential fare. J. Transp. Eng. 2013, 139, 30–39. [Google Scholar] [CrossRef]
  41. Ballou, D.P.; Mohan, L. Decision model for evaluating transit pricing policies. Transp. Res. Part A 1981, 15, 125–138. [Google Scholar] [CrossRef]
  42. Lee, E.H.; Kim, J.; Park, S. Passenger to Train Assignment Using Only Smart Card Data. Transp. Res. Rec. 2026, 2675. [Google Scholar] [CrossRef]
  43. Zhou, H.; Wang, Y.; Hancock, T.; Choudhury, C.; Palma Araneda, D.; Hou, M.; Wang, Y. Modelling the Heterogeneity in Preferences of Subway Passengers Utilizing Smart Card Data from Beijing. Transp. Res. Part A Policy Pract. 2026, 205, 104887. [Google Scholar] [CrossRef]
  44. De Gruyter, C.; Currie, G.; Rose, G. Sustainability measures of urban public transport. Sustainability 2017, 9, 43. [Google Scholar] [CrossRef]
  45. TomTom. TomTom Traffic Index Ranking 2024. 2025. Available online: https://www.tomtom.com/traffic-index/ranking/ (accessed on 8 June 2025).
  46. Kaya, A.; Koç, M. Over-agglomeration effects on sustainable development: Istanbul case. Sustainability 2018, 11, 135. [Google Scholar] [CrossRef]
  47. Batur, İ.; Koç, M. Travel demand management case study in Istanbul. Cities 2017, 69, 20–35. [Google Scholar] [CrossRef]
  48. Metro Istanbul. Metro Istanbul Lines. 2025. Available online: https://www.metro.istanbul/Hatlarimiz/TumHatlarimiz (accessed on 7 June 2025).
  49. BELBİM. TCDD–IETT–Metro Istanbul Travel Data Details (27 May–2 June 2024); BELBİM: Istanbul, Türkiye, 2025. [Google Scholar]
  50. Rezaei, J. Best-worst multi-criteria decision-making method. Omega 2015, 53, 49–57. [Google Scholar] [CrossRef]
  51. Rezaei, J. Best-worst multi-criteria decision-making method: Linear model. Omega 2016, 64, 126–130. [Google Scholar] [CrossRef]
  52. Saaty, T.L. How to make a decision: The analytic hierarchy process. Eur. J. Oper. Res. 1990, 48, 9–26. [Google Scholar] [CrossRef]
  53. IETT. Activity Report 2024. 2025. Available online: https://iett.istanbul/BBImages/Slider/Image/i%CC%87ett-genel-mu%CC%88du%CC%88rlu%CC%88g%CC%86u%CC%88_2024-faaliyet-raporu-1.pdf (accessed on 7 June 2025).
  54. Metro Istanbul. Activity Report 2024. 2025. Available online: https://www.metro.istanbul/Content/assets/uploaded/2024_faaliyet_raporu.pdf (accessed on 7 June 2025).
  55. Li, N.; Mao, B.; Huang, J.; Wen, F.; Xu, G. Fare structure optimization of intercity railway. IET Intell. Transp. Syst. 2025, 19, e70041. [Google Scholar] [CrossRef]
  56. Istanbul Transport Poverty Workshop. From Transportation Poverty to Inclusive Transportation Systems; TÜBİTAK Project No. 120K152; Istanbul Transport Poverty Workshop: Istanbul, Türkiye, 2021. [Google Scholar]
  57. Euronews. Türkiye’nin Yoksulluk ve Gelir Dağılımı Eşitsizliği Haritası. 2019. Available online: https://tr.euronews.com/2019/09/23/a-dan-z-ye-turkiye-nin-yoksulluk-ve-gelir-dagilimi-esitsizligi-haritasi (accessed on 6 September 2025).
  58. Yun, J. Strategies for improving sustainability of fare-free policy for the elderly. Sustainability 2023, 15, 14678. [Google Scholar] [CrossRef]
  59. Eriskin, E. Collaborative game-theoretic optimization of public transport fare policies. Sustainability 2024, 16, 11199. [Google Scholar] [CrossRef]
Figure 1. The vicious cycle of the car-oriented transportation approach (a) and the virtuous cycle of the PT approach (b).
Sustainability 18 03715 g001
Figure 2. Hourly boarding percentages by card type—weekdays [49].
Sustainability 18 03715 g002
Figure 3. Hourly boarding percentages by card type—weekends [49].
Sustainability 18 03715 g003
Figure 4. Hourly boarding percentages at busiest stations—weekdays [49].
Sustainability 18 03715 g004
Figure 5. Hourly boarding percentages at busiest stations—weekends [49].
Sustainability 18 03715 g005
Figure 6. Example of BWM comparisons [51].
Sustainability 18 03715 g006
Figure 7. Visual presentation of fare structure weighting.
Sustainability 18 03715 g007
Figure 8. Visual presentation of fare structure assessing criteria weighting.
Sustainability 18 03715 g008
Figure 9. Wilcoxon signed-rank test results (Fare Structure standardized statistics).
Sustainability 18 03715 g009
Figure 10. Wilcoxon signed-rank test results (Assessing Criteria Standardized statistics).
Sustainability 18 03715 g010
Figure 11. Correlation analysis between sub-dimensions of fare structures (Spearman’s rho).
Sustainability 18 03715 g011
Figure 12. Correlation analysis between sub-dimensions to assess criteria (Spearman’s rho).
Sustainability 18 03715 g012
Figure 13. Correlation analysis between sub-dimensions of FS and AC (Spearman’s rho).
Sustainability 18 03715 g013
Figure 14. Sensitivity analysis: social equity effect on fare structure weight.
Sustainability 18 03715 g014
Figure 15. Sensitivity analysis: benefit received effect on fare structure weight.
Sustainability 18 03715 g015
Figure 16. Sensitivity analysis: ticket price effect on fare structure weight.
Sustainability 18 03715 g016
Table 1. Advantages and disadvantages of structures [23].
Fare Structure TypeAdvantagesDisadvantages
Flat Fare (FF)Easiest to understand.It places an unfair burden on those making short trips.
Simplest and cheapest toA fare increase will cause the greatest loss of riders.
implement and administer.It places an unfair burden on those making short trips.
Distance-Based Fare (DBF)It should make the biggest revenue.Difficult to use.
Considered equitable; longer tripHard to implement and oversee.
Time-Based Fare (TBF)Should increase ridership.Possibility of fraudulent behavior.
Allows management of fleet usage through shift to off-peak.Could necessitate new equipment.
Zone-Based Fare (ZBF)On long PT lines, traveling to more zones allows higher fares to help cover operating costs.When zone fares vary, it may encourage urban decentralization. Decentralization extends service distances, raising operator costs and fares.
Table 2. Peak passenger demand and capacity utilization of the Istanbul metro [5,48].
Metro LineAvg. Daily
Ridership (2024 Data)
Estimated PPHPDReference
Capacity (PPHPD)
Capacity
Utilization (%)
M1357.11620.05860.00033.4%
M2445.76325.03760.00041.7%
M3138.8217.79760.00013.0%
M4299.65916.83160.00028.1%
M5292.94516.45460.00027.4%
M616.46992560.0001.5%
M7218.54512.27560.00020.5%
M862.9253.53460.0005.9%
M949.8732.80160.0004.7%
Table 3. Expert survey results.
Fare Structure WeightingFare Structure Assessing Criteria Weighting
ExpertsFFDBFZBFTBFSocial EquityBenefit ReceivedOperator ProfitTicket PriceNumber of Trips (Demand)DecentralizationUrban Morphology
Expert 113.5%27.0%51.4%8.1%18.5%32.6%5.6%12.4%12.4%9.3%9.3%
Expert 211.8%25.7%7.4%55.1%20.9%34.9%5.6%20.9%7.0%6.0%4.7%
Expert 325.9%43.2%4.9%25.9%31.8%19.1%3.2%7.6%12.7%12.7%12.7%
Expert 410.8%40.5%24.3%24.3%33.8%22.3%14.9%11.2%8.9%3.3%5.6%
Expert 57.2%56.2%13.0%23.6%24.3%24.3%5.4%16.2%12.1%9.7%8.1%
Expert 614.0%45.3%16.3%24.4%6.4%8.0%27.5%16.0%27.5%10.7%3.8%
Expert 711.8%41.2%41.2%5.9%20.2%34.6%10.1%10.1%13.5%4.8%6.7%
Expert 86.7%26.2%49.7%17.4%33.7%19.4%9.7%7.8%12.9%12.9%3.6%
Expert 99.1%24.2%21.2%45.5%20.7%35.2%4.8%13.8%10.3%6.9%8.3%
Expert 106.8%63.2%12.0%18.0%23.1%11.0%2.2%5.5%27.5%16.5%14.3%
Expert 1112.6%57.7%21.0%8.7%15.0%11.8%11.8%7.1%5.4%17.7%31.3%
Expert 1222.6%41.9%12.9%22.6%24.5%24.5%5.5%9.1%13.6%9.1%13.6%
Expert 136.5%16.3%55.4%21.7%32.4%17.6%11.8%8.8%5.9%5.9%17.6%
Expert 145.3%54.3%20.2%20.2%13.8%34.4%8.3%13.8%20.7%3.1%5.9%
Expert 1510.3%46.6%17.2%25.9%4.1%35.3%8.4%13.9%20.9%10.5%7.0%
Expert 167.4%48.5%17.6%26.5%29.0%16.1%10.8%10.8%16.1%10.8%6.5%
Expert 175.2%56.4%21.9%16.4%34.4%20.7%8.3%6.9%20.7%5.9%3.1%
Expert 1811.4%55.4%26.9%6.3%24.6%25.3%2.8%5.1%25.3%11.9%5.1%
Expert 1922.2%44.4%11.1%22.2%34.2%16.5%9.7%13.0%13.0%5.9%7.8%
Expert 2027.0%51.4%13.5%8.1%16.8%32.1%6.1%11.2%16.8%5.6%11.2%
Expert 219.1%50.0%27.3%13.6%17.4%28.6%4.5%17.4%11.6%8.7%11.6%
Expert 2210.3%46.6%25.9%17.2%19.3%32.4%7.7%12.9%12.9%5.3%9.6%
Average Weights12.20%43.70%23.30%20.80%22.70%24.40%8.40%11.40%14.90%8.80%9.40%
Table 4. Normality tests.
Kolmogorov–Smirnov a
StatisticNSig.
FF. Flat Fare0.209220.014 c
DBF. Distance-Based Fare0.188220.041 c
ZBF. Zone-Based Fare0.212220.011 c
TBF. Time-Based Fare0.236220.003 c
SE. Social Equity0.130220.200 c,d
BR. Benefit Received0.172220.090 c
OP. Operator Profit0.167220.114 c
TP. Ticket Price0.086220.200 c,d
NT. Number of Trips
(Demand)
0.207220.015 c
DEC. Decentralization0.169220.100 c
UM. Urban Morphology0.187220.043 c
a. Test distribution is normal. c. Lilliefors significance correction. d. This is a lower bound of true significance.
Table 5. Friedman test results (Fare Structure).
Mean RankChi-SquareSig.
FF1.5233,0560.000
DBF3.70
ZBF 2.43
TBF 2.34
Table 6. Wilcoxon signed-rank test results (Fare Structure).
StatisticSeStandardized StatisticsSig.
DBF-FF253,00030,7964.1080.000
ZBF-FF205,50030,7942.5650.010
TBF-FF161,00024,8343.6580.008
ZBF–DBF32,00028,7622.9030.004
TBF-DBF21,00030,7883.4270.001
TFB-ZBF93,00026,7650.4480.654
Table 7. Friedman test results (Assessing Criteria).
Mean RankChi-SquareSig.
SE. Social Equity5.7763,5700.000
BR. Benefit Received6.00
OP. Operator Profit2.52
TP. Ticket Price3.73
NT. Number of Trips (Demand)4.57
DEC. Decentralization2.68
UM. Urban Morphology2.73
Table 8. Wilcoxon signed-rank test results.
StatisticSeStandardized
Statistics
Sig.
SE-BR114,00024,7790.7670.443
SE-OP19,50030,7903.4750.001
SE-TP16,00024,8273.1820.001
SE-NT38,00026,7702.5030.012
SE-DEC600030,7883.9140.000
SE-UM16,00030,7903.5890.000
BR-OP10,50028,7583.6510.000
BR-TP550030,7653.9330.000
BR-NT27,00024,8422.7370.006
BR-DEC850030,7923.8320.000
BR-UM13,00028,7603.5640.000
OP-TP165,50026,7392.2630.024
OP-NT201,50028,7342.9330.003
OP-DEC105,00024,7990.4030.687
OP-UM154,50030,7470.9110.362
TP-NT147,00024,7872.0980.036
TP-DEC62,00026,7091.6100.107
TP-UM70,00026,6881.3110.190
NT-DEC15,50024,8223.2030.001
NT-UM31,00024,8342.5770.010
DEC-UM117,00026,6880.4500.653
Table 9. Results of paired-sample t-test for comparison of fare structure-assessing criteria.
MeanNStd.
Deviation
Std. Error MeanCorrelationSig.tSig.
(2-Tailed)
FS0.1834220.036310.007740.0260.90810,9310.000
AC0.0951220.011940.00255
Table 10. Correlation analysis between sub-dimensions of fare structures.
DBFZBFTBF
FFSpearman’s rho−0.216−0.327−0.068
Sig0.3350.1380.762
DBFSpearman’s rho −0.259−0.329
Sig 0.2450.135
ZBFSpearman’s rho −0.558
Sig 0.007
Table 11. Correlation analysis between sub-dimensions of assessed criteria.
Benefit
Received
Operator ProfitTicket PriceNumber of TripsDecentralizationUrban
Morphology
Social EquitySpearman’s rho−0.3720.029−0.459−0.159−0.021−0.153
Sig0.0880.8970.0320.4780.9280.496
Benefit ReceivedSpearman’s rho −0.3020.436−0.145−0.518−0.131
Sig 0.1720.0430.5210.0140.560
Operator ProfitSpearman’s rho 0.066−0.179−0.259−0.271
Sig 0.7700.4260.2450.223
Ticket PriceSpearman’s rho −0.195−0.372−0.187
Sig 0.3830.0880.405
Number of TripsSpearman’s rho 0.185−0.357
Sig 0.4090.103
DecentralizationSpearman’s rho 0.169
Sig 0.453
Table 12. Correlation analysis between sub-dimensions of fare structures—assessed criteria.
FFDBFZBFTBF
Social Equityrho−0.155−0.2480.0180.127
Sig0.4920.2650.9380.573
Benefit Receivedrho0.034−0.2940.163−0.015
Sig0.8800.1850.4680.946
Operator Profitrho−0.042−0.2440.2990.049
Sig0.8520.2740.1770.829
Ticket Pricerho0.015−0.225−0.1860.441
Sig0.9460.3150.4070.040
Number of Tripsrho−0.0810.475 −0.235−0.138
Sig0.7210.0250.2920.540
Decentralizationrho0.0630.304−0.1920.033
Sig0.7800.1690.3930.885
Urban Morphologyrho0.2870.071−0.095−0.123
Sig0.1950.7540.6730.587
Disclaimer/Publisher’s Note: The statements, opinions and data contained in all publications are solely those of the individual author(s) and contributor(s) and not of MDPI and/or the editor(s). MDPI and/or the editor(s) disclaim responsibility for any injury to people or property resulting from any ideas, methods, instructions or products referred to in the content.