
Modeling the Land-Use-Driven Energy Consumption Nexus in Shaanxi Province, China: A Digital Approach Integrating Machine Learning and Spatial Simulation


Abstract
1. Introduction
2. Literature Review
3. Materials and Methods
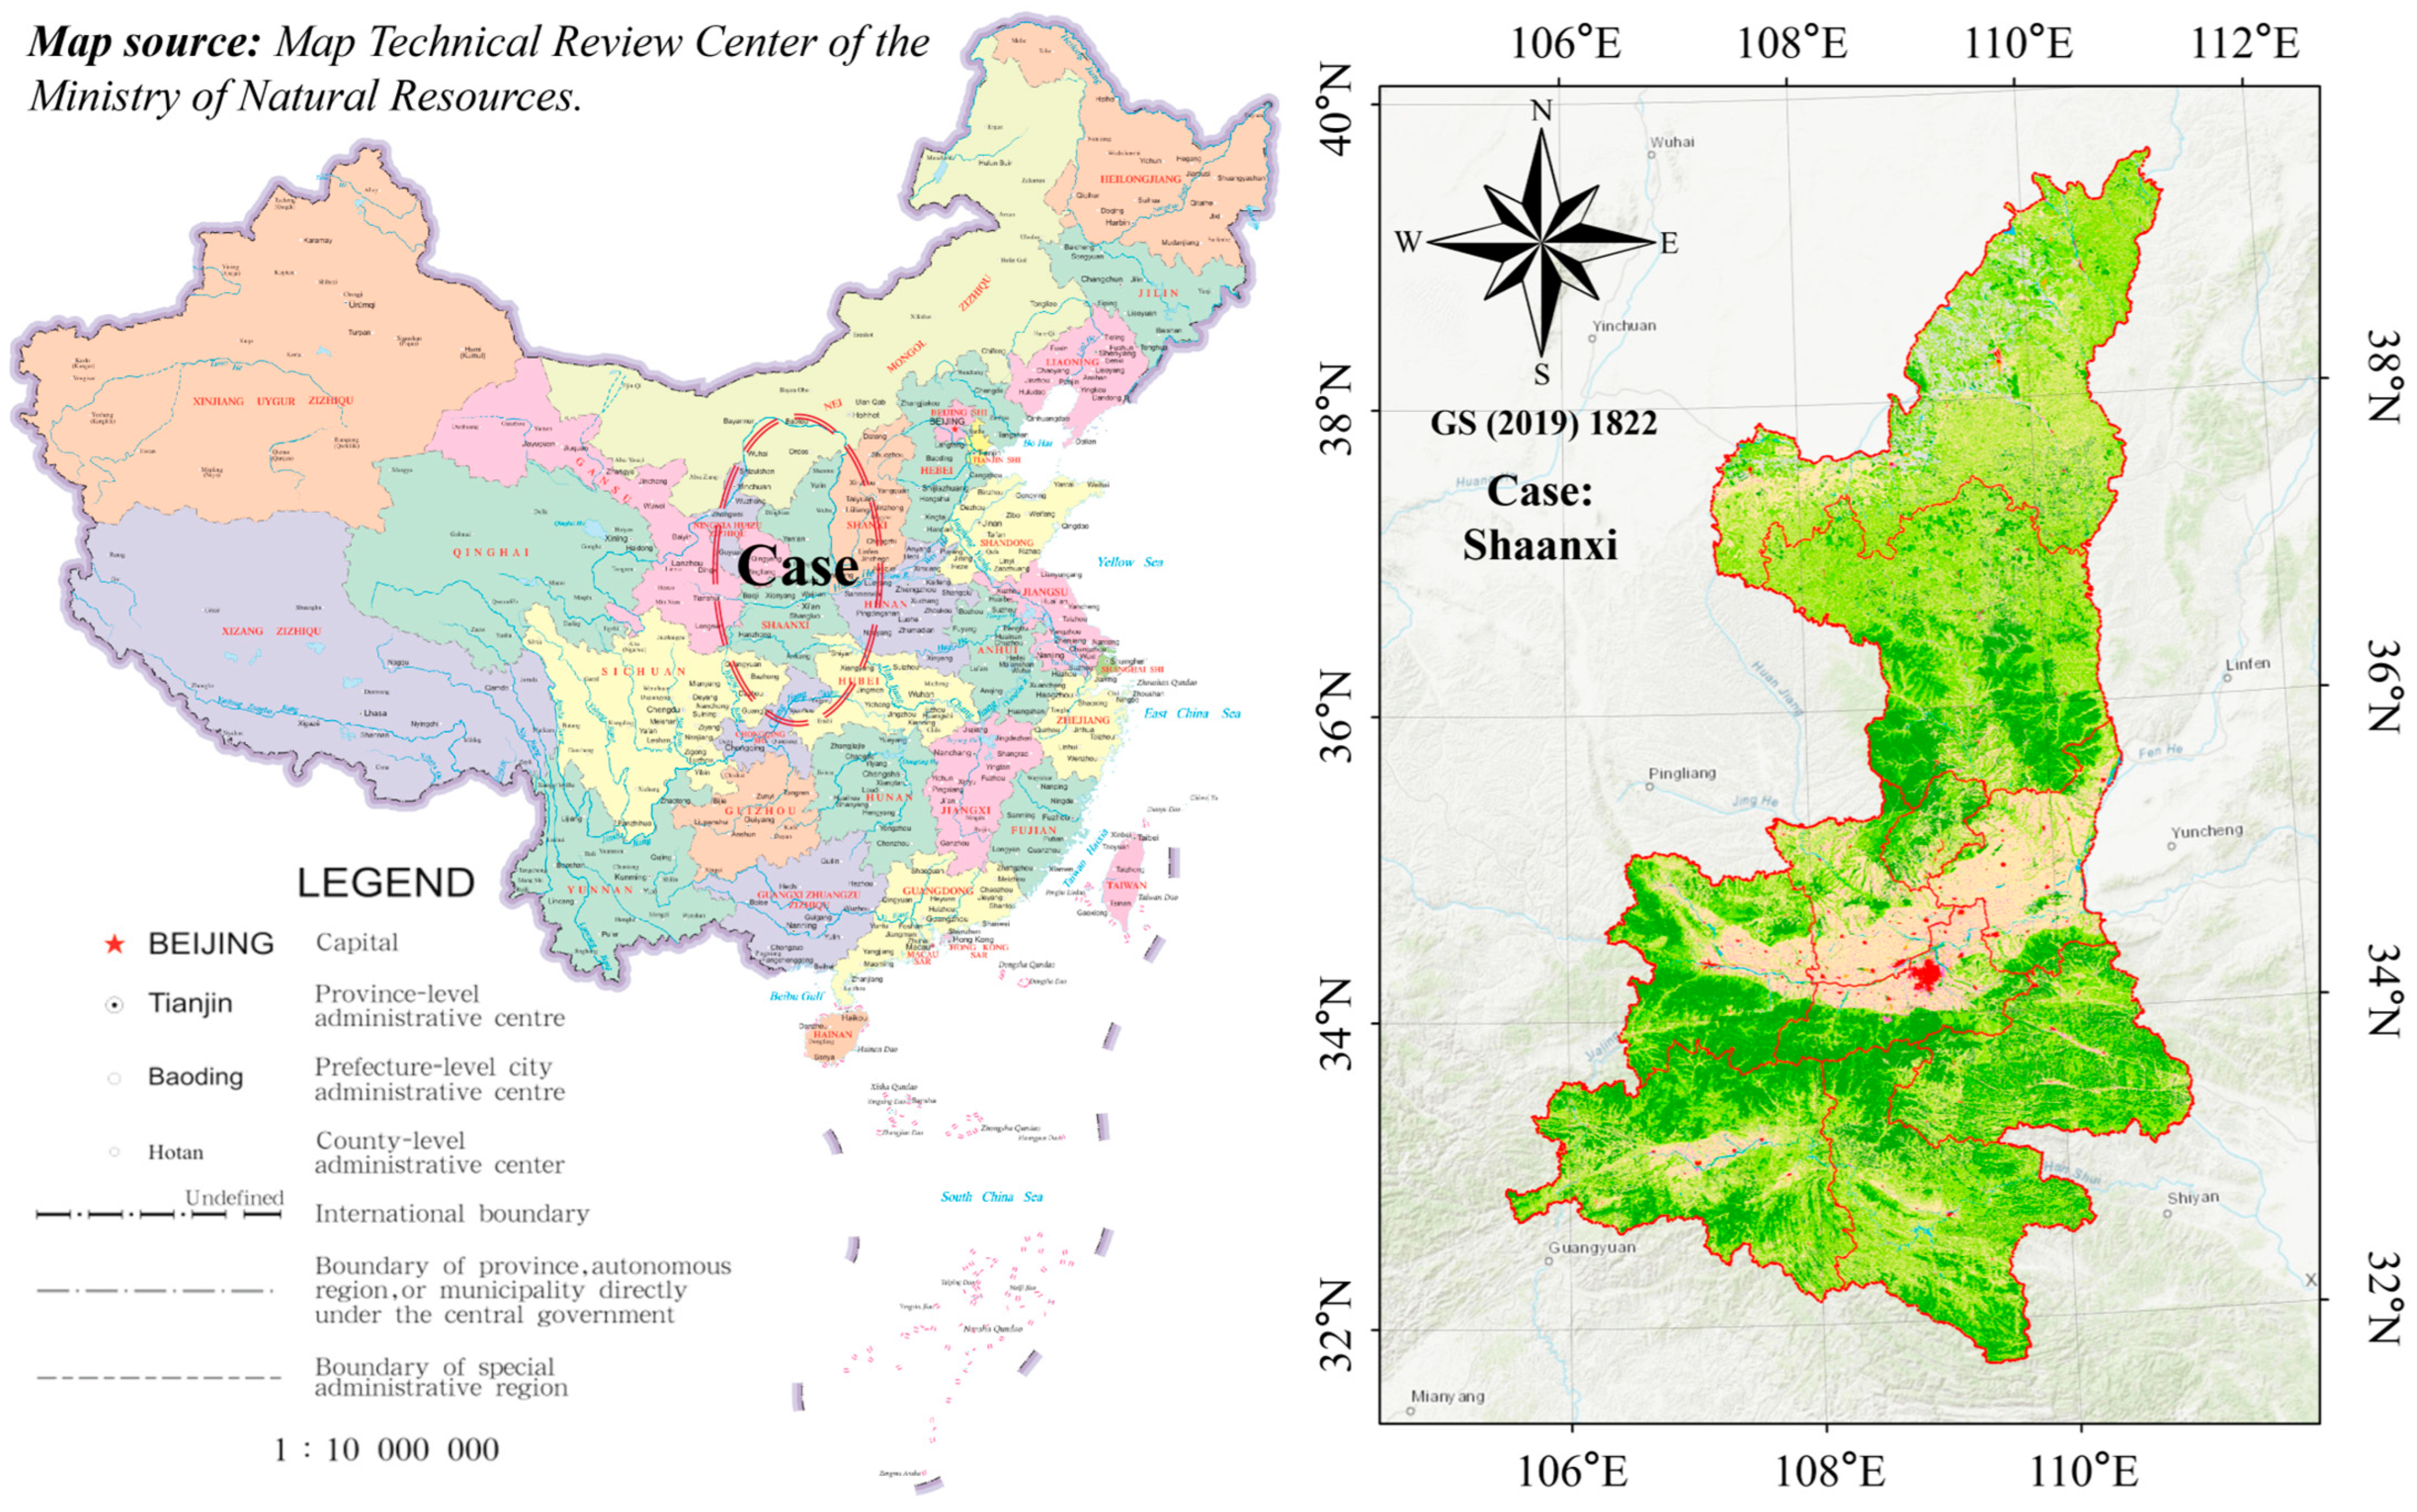
3.1. Site
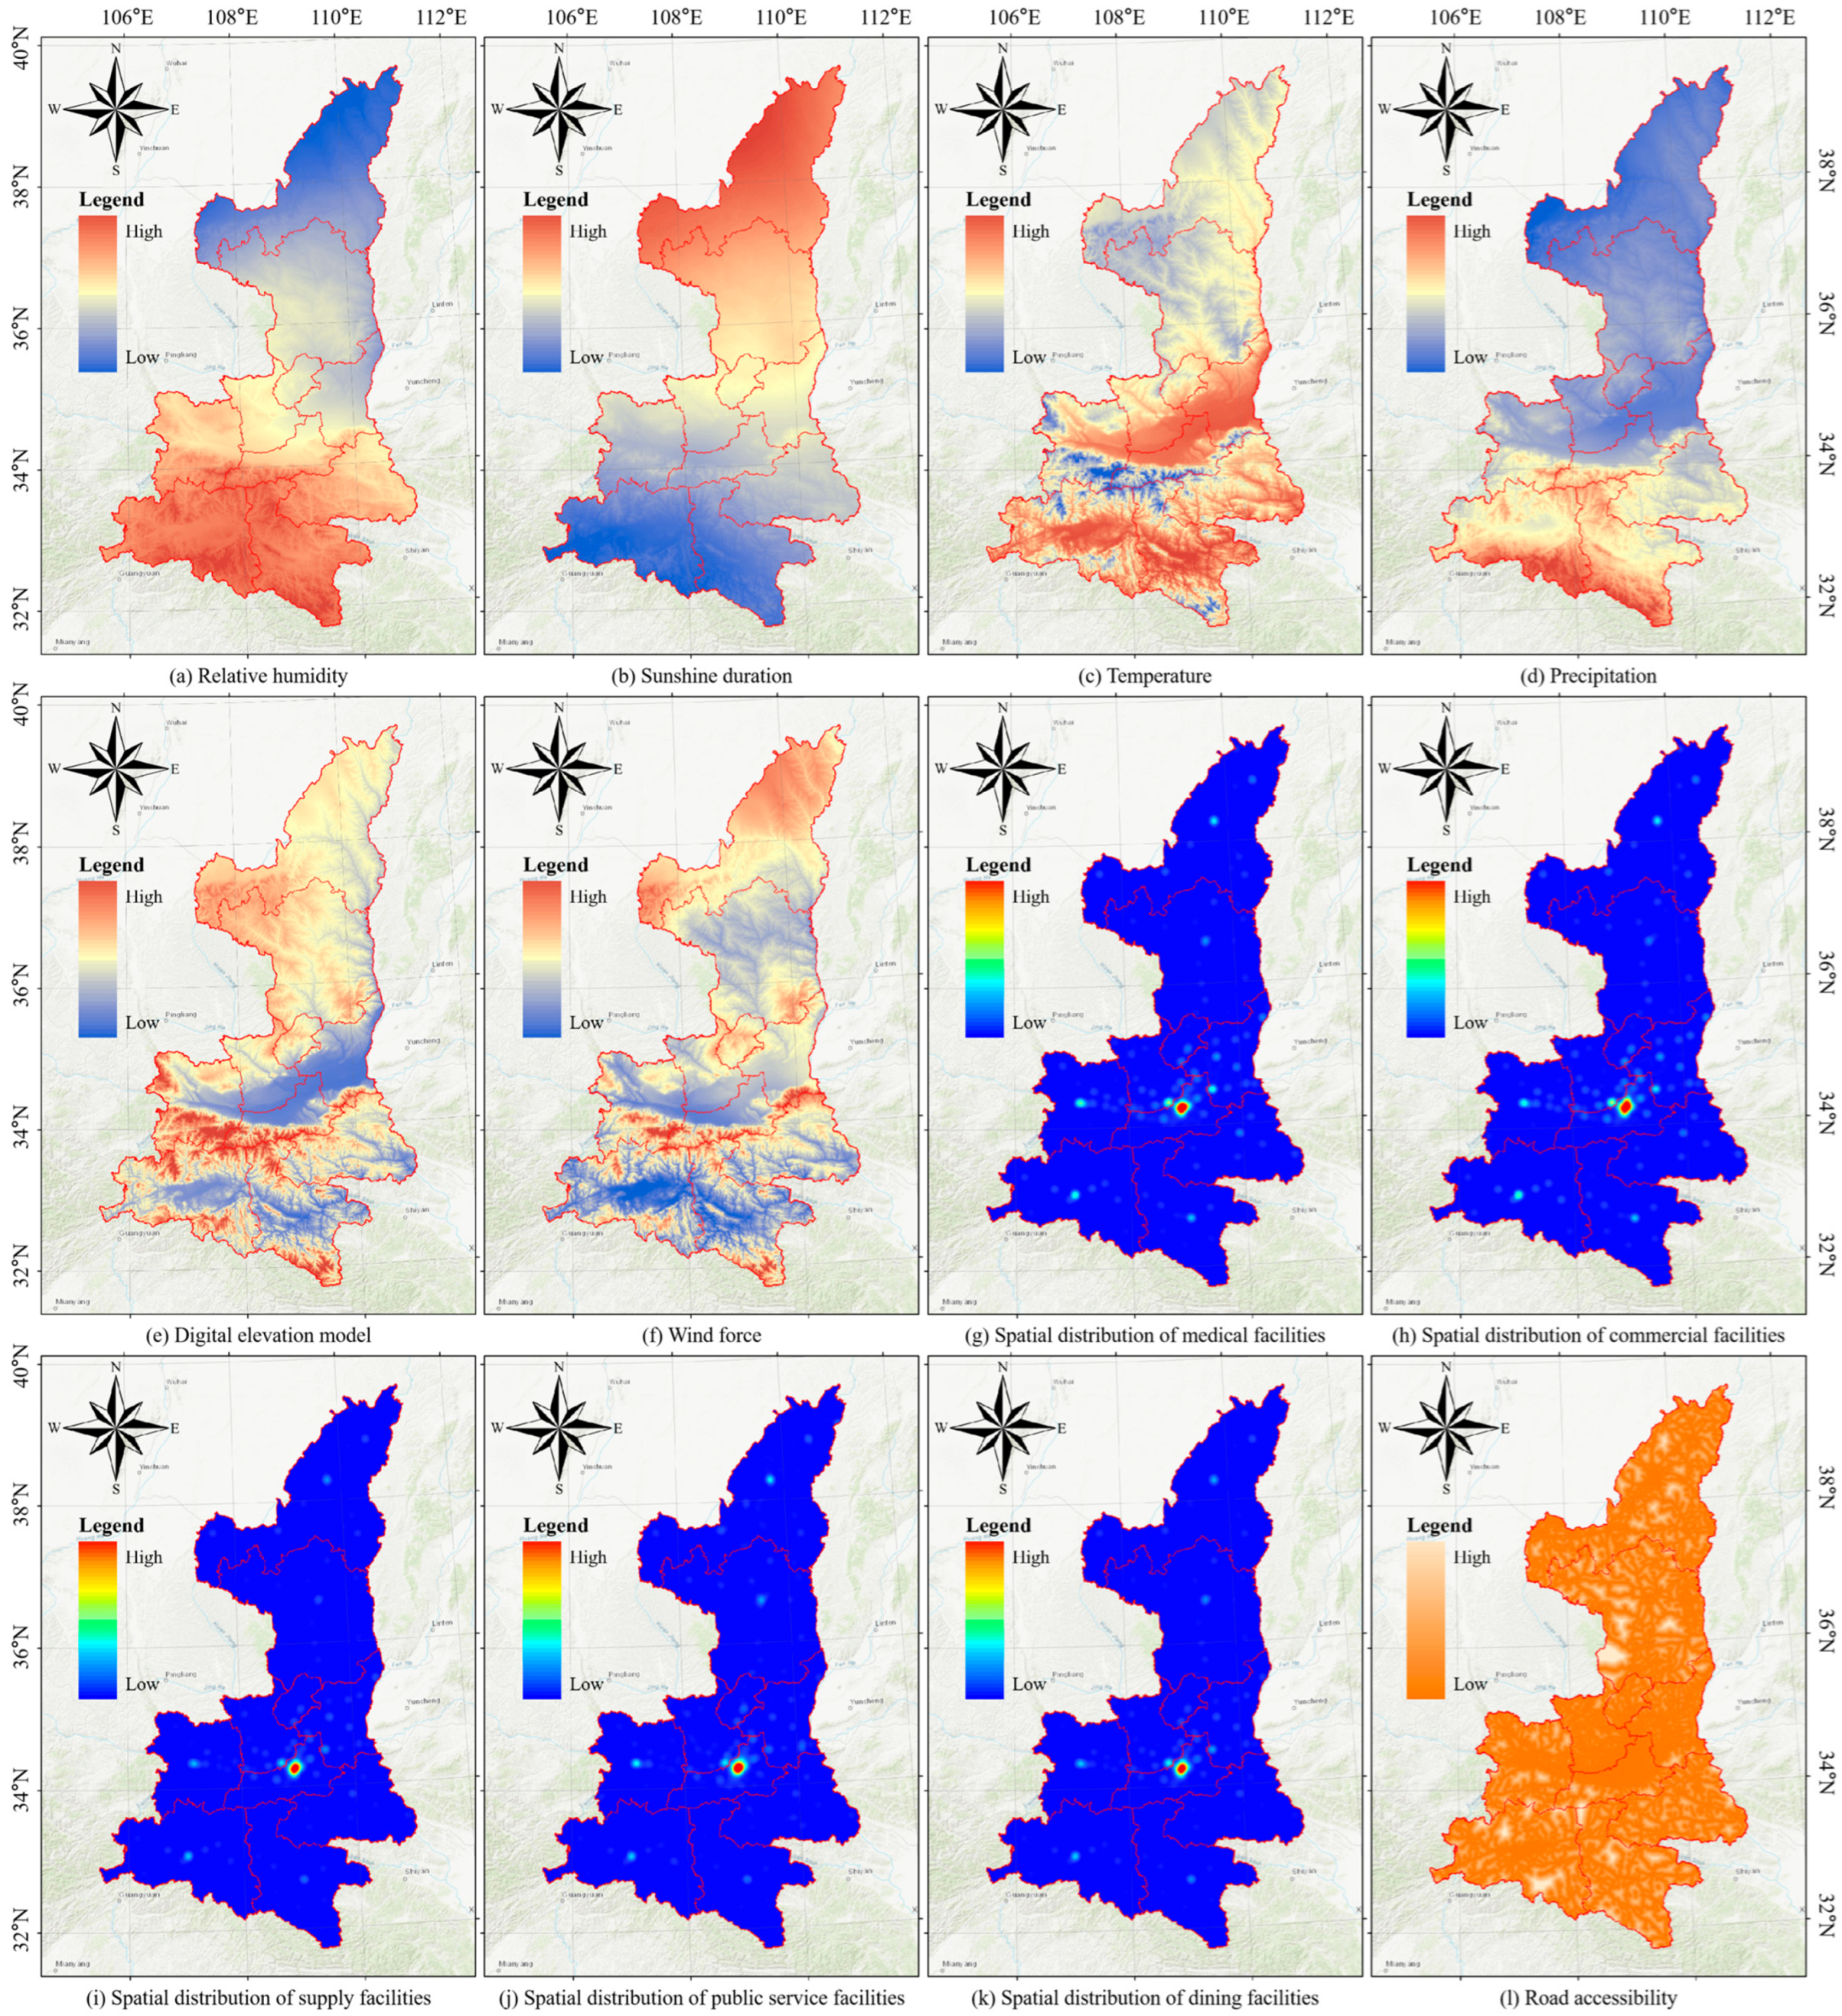
3.2. Materials
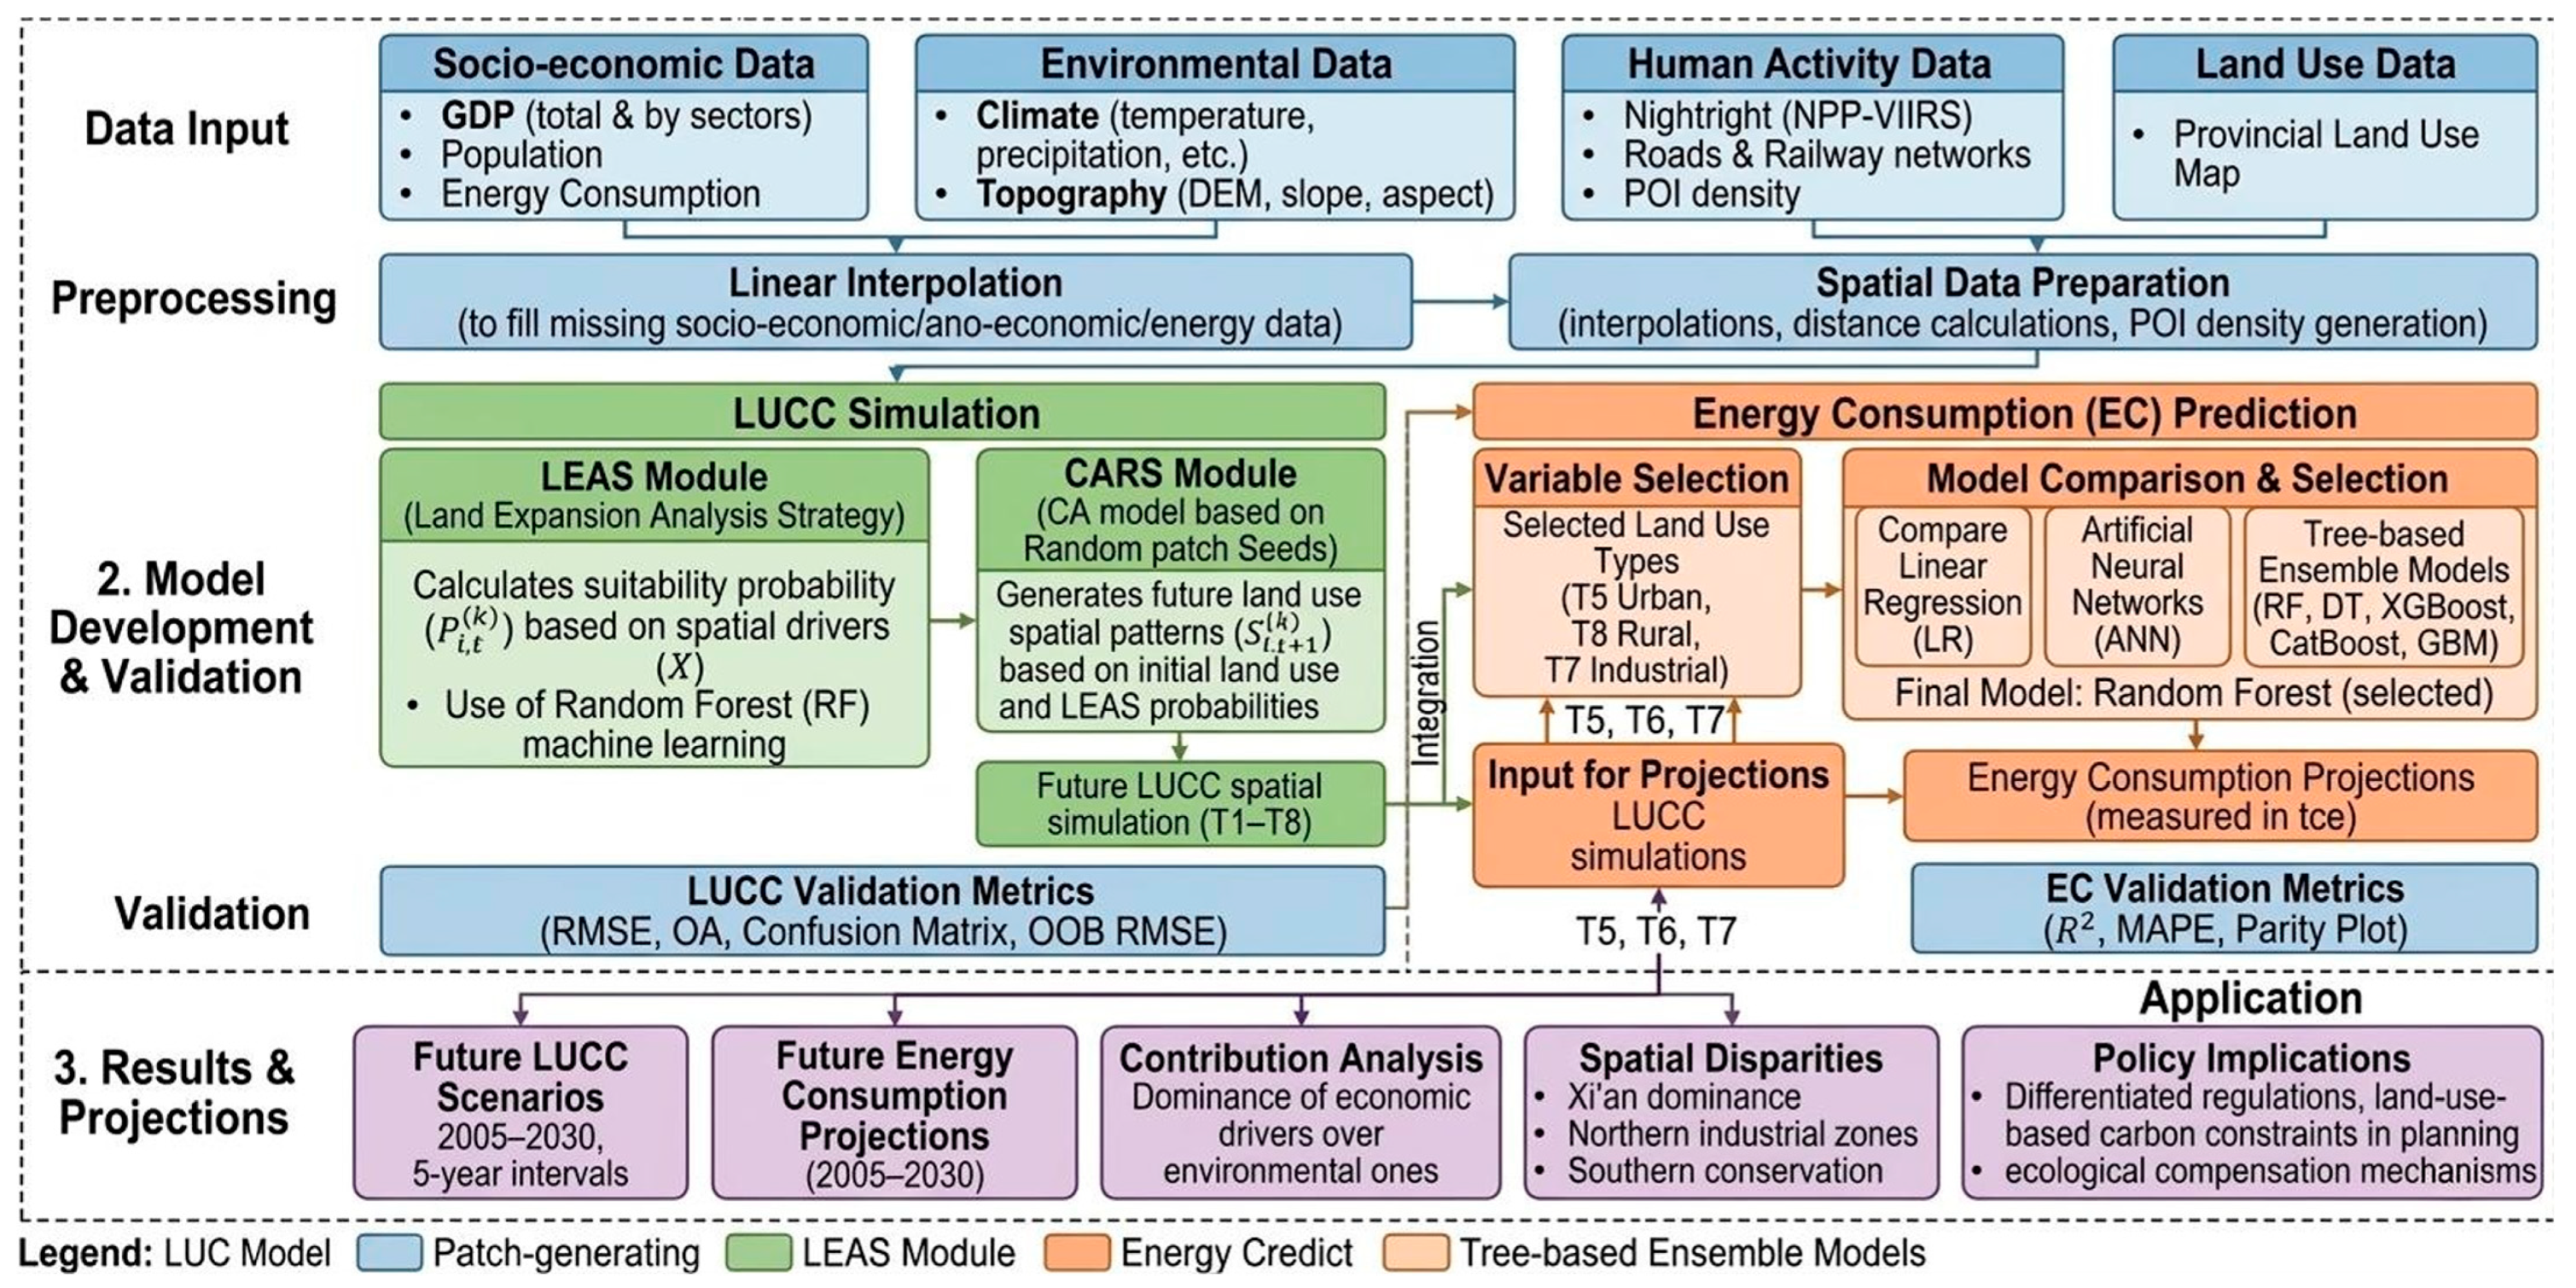
3.3. Methods
4. Model Validations
4.1. Regional Modeling Site
4.2. Model and Variable Selection
4.3. Land Use Simulation
5. Results
5.1. Contribution of Land Use Expansion
5.2. Land Use Prediction
- (1)
- Implementing urban growth boundaries around Xi’an to preserve remaining croplands;
- (2)
- Developing circular economy strategies for northern industrial areas;
- (3)
- Strengthening payments for ecosystem services in southern conservation zones.
5.3. Prediction of Energy Consumption
6. Discussion
6.1. Digital Decision-Support Systems as an Evidentiary Basis for Carbon Compliance
6.2. Integrating Spatial Simulation into the Statutory Planning Framework
6.3. Addressing Structural Path Dependency Through Spatially Differentiated Regulation
6.4. Contribution and Uncertainty
7. Conclusions
Author Contributions
Funding
Institutional Review Board Statement
Informed Consent Statement
Data Availability Statement
Conflicts of Interest
References
- Lee, H.; Calvin, K.; Dasgupta, D.; Krinner, G.; Mukherji, A.; Thorne, P.; Trisos, C.; Romero, J.; Aldunce, P.; Barrett, K.; et al. Climate Change 2023 Synthesis Report; AR6SYR; Intergovernmental Panel on Climate Change: Geneva, Switzerland, 2023; Available online: https://www.ipcc.ch/report/ar6/syr/ (accessed on 16 February 2026).
- Birol, F.; Camera, F.L.; Schweinfest, S.; Papathanasiou, D.; Neira, M.; Govindarajalu, C.; Takada, M. Tracking SDG7: The Energy Progress Report 2024; International Energy Agency (IEA): Paris, France, 2024; Available online: https://www.iea.org/reports/tracking-sdg7-the-energy-progress-report-2024 (accessed on 16 February 2026).
- Liu, L.; Hu, X.; Li, L.; Sun, Z.; Zhang, Q. Understanding China’s agricultural non-carbon-dioxide greenhouse gas emissions: Subnational insights and global trade dynamics. Environ. Impact Assess. Rev. 2024, 106, 107487. [Google Scholar] [CrossRef]
- Pörtner, H.; Roberts, D.C.; Adams, H.; Adelekan, I.; Adler, C.; Adrian, R.; Aldunce, P.; Ali, E.; Begum, R.A.; Bednar-Friedl, B.; et al. Climate Change 2022: Impacts, Adaptation and Vulnerability; AR6WG2; Intergovernmental Panel on Climate Change: Geneva, Switzerland, 2023; Available online: https://www.ipcc.ch/report/ar6/wg2/ (accessed on 16 February 2026).
- Li, L.; Huang, X.; Yang, H. Optimizing land use patterns to improve the contribution of land use planning to carbon neutrality target. Land Use Pol. 2023, 135, 106959. [Google Scholar] [CrossRef]
- Pan, H.; Qi, L.; Zhang, Z.; Yan, J. Kinetic energy harvesting technologies for applications in land transportation: A comprehensive review. Appl. Energy 2021, 286, 116518. [Google Scholar] [CrossRef]
- Luo, H.; Li, Y.; Gao, X.; Meng, X.; Yang, X.; Yan, J. Carbon emission prediction model of prefecture-level administrative region: A land-use-based case study of Xi’an city, China. Appl. Energy 2023, 348, 121488. [Google Scholar] [CrossRef]
- Zhou, Y.; Chen, M.; Tang, Z.; Mei, Z. Urbanization, land use change, and carbon emissions: Quantitative assessments for city-level carbon emissions in Beijing-Tianjin-Hebei region. Sust. Cities Soc. 2021, 66, 102701. [Google Scholar] [CrossRef]
- Li, W.; Chen, Z.; Li, M.; Zhang, H.; Li, M.; Qiu, X.; Zhou, C. Carbon emission and economic development trade-offs for optimizing land-use allocation in the Yangtze River Delta, China. Ecol. Indic. 2023, 147, 109950. [Google Scholar] [CrossRef]
- Gasparatos, A.; Doll, C.N.H.; Esteban, M.; Ahmed, A.; Olang, T.A. Renewable energy and biodiversity: Implications for transitioning to a Green Economy. Renew. Sustain. Energy Rev. 2017, 70, 161–184. [Google Scholar] [CrossRef]
- Luo, H.; Liu, Z.; Li, Y.; Meng, X.; Yang, X. Characterizing and predicting carbon emissions from an emerging land use perspective: A comprehensive review. Urban Clim. 2024, 58, 102141. [Google Scholar] [CrossRef]
- Sun, Y.; Li, Y.; Wang, R.; Ma, R. Modelling potential land suitability of large-scale wind energy development using explainable machine learning techniques: Applications for China, USA and EU. Energy Conv. Manag. 2024, 302, 118131. [Google Scholar] [CrossRef]
- Park, G.; Kim, D. Spatial analysis of Urban land use impact on new solar photovoltaic capacity: A case study of South Korea. Energy Policy 2025, 199, 114545. [Google Scholar] [CrossRef]
- Fumo, N.; Rafe Biswas, M.A. Regression analysis for prediction of residential energy consumption. Renew. Sustain. Energy Rev. 2015, 47, 332–343. [Google Scholar] [CrossRef]
- He, C.; Duan, H.; Liu, Y. A neural network grey model based on dynamical system characteristics and its application in predicting carbon emissions and energy consumption in China. Expert Syst. Appl. 2025, 266, 126101. [Google Scholar] [CrossRef]
- Ma, X.; He, Q.; Li, W.; Wu, W. Time-delayed fractional grey Bernoulli model with independent fractional orders for fossil energy consumption forecasting. Eng. Appl. Artif. Intell. 2025, 155, 110942. [Google Scholar] [CrossRef]
- Li, Y.; Bai, X.; Liu, B. Forecasting clean energy generation volume in China with a novel fractional Time-Delay polynomial discrete grey model. Energy Build. 2022, 271, 112305. [Google Scholar] [CrossRef]
- Yang, H.; Ran, M.; Zhuang, C. Prediction of Building Electricity Consumption Based on Joinpoint−Multiple Linear Regression. Energies 2022, 15, 8543. [Google Scholar] [CrossRef]
- Sennefelder, R.M.; Martín-Clemente, R.; González-Carvajal, R. Energy Consumption Prediction of Electric City Buses Using Multiple Linear Regression. Energies 2023, 16, 4365. [Google Scholar] [CrossRef]
- Yin, Q.; Han, C.; Li, A.; Liu, X.; Liu, Y. A Review of Research on Building Energy Consumption Prediction Models Based on Artificial Neural Networks. Sustainability 2024, 16, 7805. [Google Scholar] [CrossRef]
- Luo, X.; Yan, R.; Xu, L.; Wang, S. Accuracy and applicability of ship’s fuel consumption prediction models: A comprehensive comparative analysis. Energy 2024, 310, 133187. [Google Scholar] [CrossRef]
- Lee, H.; Kim, D.; Gu, J.-H. Prediction of Food Factory Energy Consumption Using MLP and SVR Algorithms. Energies 2023, 16, 1550. [Google Scholar] [CrossRef]
- Kang, Y.; Jianshu, W.; Zhihua, L.; Xiao, K. An energy consumption prediction model for electric buses based on extreme gradient boosting fusion algorithm. Int. J. Green Energy 2025, 22, 2504–2517. [Google Scholar] [CrossRef]
- Ma, C.; Pan, S.; Cui, T.; Liu, Y.; Cui, Y.; Wang, H.; Wan, T. Energy consumption prediction for office buildings: Performance evaluation and application of ensemble machine learning techniques. J. Build. Eng. 2025, 102, 112021. [Google Scholar] [CrossRef]
- Luo, H.; Li, Y.; Zhang, Y.; Song, X.; Gao, X.; Luo, X.; Meng, X.; Yang, X.; Liu, Z.; Yan, J. Land–energy–population Nexus: A systemic framework for per capita energy consumption characterization and prediction toward land use structure optimization. Appl. Energy 2025, 402, 126874. [Google Scholar] [CrossRef]
- Shams Amiri, S.; Mueller, M.; Hoque, S. Investigating the application of a commercial and residential energy consumption prediction model for urban Planning scenarios with Machine Learning and Shapley Additive explanation methods. Energy Build. 2023, 287, 112965. [Google Scholar] [CrossRef]
- Eskandari, H.; Saadatmand, H.; Ramzan, M.; Mousapour, M. Innovative framework for accurate and transparent forecasting of energy consumption: A fusion of feature selection and interpretable machine learning. Appl. Energy 2024, 366, 123314. [Google Scholar] [CrossRef]
- Li, H.; Kayae, A. Predicting energy consumption in Mexico: Integrating environmental, economic, and energy data with machine learning techniques for sustainable development. Energy 2025, 324, 135992. [Google Scholar] [CrossRef]
- Kumar, S.; Shukla, A.K.; Muhuri, P.K.; Lohani, Q.M.D. CO2 emission based GDP prediction using intuitionistic fuzzy transfer learning. Ecol. Inform. 2023, 77, 102206. [Google Scholar] [CrossRef]
- Zhang, Z.; Fu, S.; Li, J.; Qiu, Y.; Shi, Z.; Sun, Y. Spatiotemporal Analysis and Prediction of Carbon Emissions from Energy Consumption in China through Nighttime Light Remote Sensing. Remote Sens. 2024, 16, 23. [Google Scholar] [CrossRef]
- Dong, B.; Zhang, R.; Li, S.; Ye, Y.; Huang, C. A meta-analysis for the nighttime light remote sensing data applied in urban research: Key topics, hotspot study areas and new trends. Sci. Remote Sens. 2025, 11, 100186. [Google Scholar] [CrossRef]
- Wang, C.; Wang, J.; Ma, L.; Jia, M.; Chen, J.; Shao, Z.; Chen, N. Prediction Modeling and Driving Factor Analysis of Spatial Distribution of CO2 Emissions from Urban Land in the Yangtze River Economic Belt, China. Land 2024, 13, 1433. [Google Scholar] [CrossRef]
- Rao, A.; Kumar, S.; Karim, S. Accelerating renewables: Unveiling the role of green energy markets. Appl. Energy 2024, 366, 123286. [Google Scholar] [CrossRef]
- Nazir, M.U.; Li, J. Forecasting of electricity consumption in Pakistan based on integrating machine learning algorithms and Monte Carlo simulation. Electr. Eng. 2025, 107, 7539–7559. [Google Scholar] [CrossRef]
- Abbasian Hamedani, E.; Talebi, S. Modeling and long-term forecasting of CO2 emissions in Asia: An optimized Artificial Neural Network approach with consideration of renewable energy scenarios. Energy Convers. Manag. X 2025, 26, 101030. [Google Scholar] [CrossRef]
- Hoxha, J.; Çodur, M.Y.; Mustafaraj, E.; Kanj, H.; El Masri, A. Prediction of transportation energy demand in Türkiye using stacking ensemble models: Methodology and comparative analysis. Appl. Energy 2023, 350, 121765. [Google Scholar] [CrossRef]
- Ke, Y.; Zhou, L.; Zhu, M.; Yang, Y.; Fan, R.; Ma, X. Scenario Prediction of Carbon Emission Peak of Urban Residential Buildings in China’s Coastal Region: A Case of Fujian Province. Sustainability 2023, 15, 2456. [Google Scholar] [CrossRef]
- Li, W.; Zhang, S.; Lu, C. Exploration of China’s net CO2 emissions evolutionary pathways by 2060 in the context of carbon neutrality. Sci. Total Environ. 2022, 831, 154909. [Google Scholar] [CrossRef]
- Song, S.; Leng, H.; Guo, R. Multi-Agent-Based Model for the Urban Macro-Level Impact Factors of Building Energy Consumption on Different Types of Land. Land 2022, 11, 1986. [Google Scholar] [CrossRef]
- Kamoona, A.; Song, H.; Keshavarzian, K.; Levy, K.; Jalili, M.; Wilkinson, R.; Yu, X.; McGrath, B.; Meegahapola, L. Machine learning based energy demand prediction. Energy Rep. 2023, 9, 171–176. [Google Scholar] [CrossRef]
- Luo, H.; Li, Y.; Zhang, Y.; Gao, X.; Liu, Z.; Meng, X.; Yang, X. Spatiotemporal big data-driven suitability assessment and high-efficiency utilization of renewable electricity consumption in China. Energy Conv. Manag. 2026, 352, 120982. [Google Scholar] [CrossRef]
- Ramírez-Aguilar, E.A.; Sailor, D.J.; Wentz, E.A. Household, sociodemographic, building and land cover factors affecting residential summer electricity consumption: A systematic statistical study in Phoenix, AZ. Energy 2024, 313, 133819. [Google Scholar] [CrossRef]
- Zhao, J.; Wu, J.; Fotedar, S.; Li, Z.; Liu, P. Fleet availability analysis and prediction for shared e-scooters: An energy perspective. Transp. Res. Part D Transp. Environ. 2024, 136, 104425. [Google Scholar] [CrossRef]
- Maki, S.; Fujii, M.; Fujita, T.; Shiraishi, Y.; Ashina, S.; Gomi, K.; Sun, L.; Budi Nugroho, S.; Nakano, R.; Osawa, T.; et al. A deep reinforced learning spatiotemporal energy demand estimation system using deep learning and electricity demand monitoring data. Appl. Energy 2022, 324, 119652. [Google Scholar] [CrossRef]
- Falchetta, G.; Kasamba, C.; Parkinson, S.C. Monitoring hydropower reliability in Malawi with satellite data and machine learning. Environ. Res. Lett. 2020, 15, 014011. [Google Scholar] [CrossRef]
- Yang, T.; Yao, W.; Lei, T.; Cao, J.; Dewancker, B.J. Study on the impact of land-sea distribution on future building energy consumption in Chinese cities under the background of climate change. Energy Build. 2025, 332, 115434. [Google Scholar] [CrossRef]
- Lee, R.; Kim, D.; Yoon, J.; Kang, E.; Cho, H.; Kim, J. Development and calibration of apartment building energy model based on architectural and energy consumption characteristics. Renew. Sustain. Energy Rev. 2024, 206, 114874. [Google Scholar] [CrossRef]
- Zhou, X.; Huang, Z.; Scheuer, B.; Wang, H.; Zhou, G.; Liu, Y. High-resolution estimation of building energy consumption at the city level. Energy 2023, 275, 127476. [Google Scholar] [CrossRef]
- Zhang, S.; Chen, L.; Xu, L.; Wang, Z. GeoBEM: A geospatial computing empowered framework for urban-scale building energy modeling. Sust. Cities Soc. 2025, 121, 106203. [Google Scholar] [CrossRef]
- Proque, A.L.; dos Santos, G.F.; Betarelli Junior, A.A.; Larson, W.D. Effects of land use and transportation policies on the spatial distribution of urban energy consumption in Brazil. Energy Econ. 2020, 90, 104864. [Google Scholar] [CrossRef]
- Rith, M.; Fillone, A.; Biona, J.B.M. The impact of socioeconomic characteristics and land use patterns on household vehicle ownership and energy consumption in an urban area with insufficient public transport service—A case study of metro Manila. J. Transp. Geogr. 2019, 79, 102484. [Google Scholar] [CrossRef]
- Yiran, G.A.B.; Ablo, A.D.; Asem, F.E. Urbanisation and domestic energy trends: Analysis of household energy consumption patterns in relation to land-use change in peri-urban Accra, Ghana. Land Use Pol. 2020, 99, 105047. [Google Scholar] [CrossRef]
- Abulibdeh, A.; Pirasteh, S.; Mafi-Gholami, D.; Kucukvar, M.; Onat, N.C.; Zaidan, E. Unveiling the Nexus Between Land Use, Land Surface Temperature, and Carbon Footprint: A Multi-Scale Analysis of Building Energy Consumption in Arid Urban Areas. Earth Syst. Environ. 2025, 9, 2563–2601. [Google Scholar] [CrossRef]
- Luo, H.; Wang, C.; Li, C.; Meng, X.; Yang, X.; Tan, Q. Multi-scale carbon emission characterization and prediction based on land use and interpretable machine learning model: A case study of the Yangtze River Delta Region, China. Appl. Energy 2024, 360, 122819. [Google Scholar] [CrossRef]
- National Bureau of Statistics. Statistical Bulletin of the National Economic and Social Development of the People’s Republic of China in 2024; National Bureau of Statistics: Beijing, China, 2024. Available online: https://www.stats.gov.cn/sj/zxfb/202502/t20250228_1958817.html (accessed on 16 February 2026).
- Shaanxi Bureau of Statistics. Shaanxi Statistical Yearbook; China Statistics Press: Shaanxi, China, 2024. Available online: https://tjj.shaanxi.gov.cn/upload/2022/zl/index.htm (accessed on 16 February 2026).
- Li, C.; Sampene, A.K.; Agyeman, F.O.; Brenya, R.; Wiredu, J. The role of green finance and energy innovation in neutralizing environmental pollution: Empirical evidence from the MINT economies. J. Environ. Manag. 2022, 317, 115500. [Google Scholar] [CrossRef] [PubMed]
- National Bureau of Statistics of China. China Energy Statistical Yearbook 2024; China Statistics Press: Beijing, China, 2024. Available online: https://www.stats.gov.cn/sj/ndsj/2024/indexch.htm (accessed on 16 February 2026).
- Xu, X. Monthly Spatial Interpolation Data Set of Meteorological Elements in China. 2023. Available online: https://www.resdc.cn/DOI/ (accessed on 16 February 2026).
- Zhang, W.; Lin, Z.; Liu, X. Short-term offshore wind power forecasting—A hybrid model based on Discrete Wavelet Transform (DWT), Seasonal Autoregressive Integrated Moving Average (SARIMA), and deep-learning-based Long Short-Term Memory (LSTM). Renew. Energy 2022, 185, 611–628. [Google Scholar] [CrossRef]
- Yao, Y.; Liu, X.; Li, X.; Liu, P.; Hong, Y.; Zhang, Y.; Mai, K. Simulating urban land-use changes at a large scale by integrating dynamic land parcel subdivision and vector-based cellular automata. Int. J. Geogr. Inf. Sci. 2017, 31, 2452–2479. [Google Scholar] [CrossRef]
- Liu, X.; Liang, X.; Li, X.; Xu, X.; Ou, J.; Chen, Y.; Li, S.; Wang, S.; Pei, F. A future land use simulation model (FLUS) for simulating multiple land use scenarios by coupling human and natural effects. Landsc. Urban Plan. 2017, 168, 94–116. [Google Scholar] [CrossRef]
- Liang, X.; Guan, Q.; Clarke, K.C.; Liu, S.; Wang, B.; Yao, Y. Understanding the drivers of sustainable land expansion using a patch-generating land use simulation (PLUS) model: A case study in Wuhan, China. Comput. Environ. Urban Syst. 2021, 85, 101569. [Google Scholar] [CrossRef]
- Mardani, A.; Streimikiene, D.; Nilashi, M.; Arias Aranda, D.; Loganathan, N.; Jusoh, A. Energy Consumption, Economic Growth, and CO2 Emissions in G20 Countries: Application of Adaptive Neuro-Fuzzy Inference System. Energies 2018, 11, 2771. [Google Scholar] [CrossRef]
- Chen, H.; Li, C.; Liu, J.; Xu, R. Navigating digital frontiers: The impact of China’s cybersecurity law on corporate digital innovation. Int. Rev. Financ. Anal. 2025, 103, 104182. [Google Scholar] [CrossRef]
- Fang, Z.; Xue, S.; Cheng, C.; Zhou, Q.; Ali, M.; Xu, R.; Xu, J.; Ding, T.; Wang, J.; Huang, Z.; et al. Framework of land use planning for an energy producing city of Northwest China based on water-energy-food nexus. J. Clean. Prod. 2024, 451, 142126. [Google Scholar] [CrossRef]


| Reference | Region | Research Objective | Methodology | Key Findings |
|---|---|---|---|---|
| [50] | Brazil, Germany | To evaluate the impact of compact urban planning on building thermal energy demand. | Spatial morphology analysis and GIS-based energy modeling. | Demonstrated that high-density residential areas can reduce seasonal heating demand by 15–20% by lowering the surface-to-volume ratio. |
| [51] | Manila, Philippines | To explore the role of Transit-Oriented Development (TOD) in suppressing regional transport energy consumption. | Integrated Land-Use/Transport Interaction (LUTI) models and regression analysis. | Found that a 10% increase in land-use mix reduces per capita Vehicle Miles Traveled and associated energy consumption by approximately 6.5%. |
| [52] | Accra, Ghana | To analyze the long-term energy lock-in caused by industrial land expansion during rapid industrialization. | Land-use change analysis and System Dynamics (SD) modeling. | Revealed that unbalanced industrial zone siting leads to “geographic structural lock-in,” significantly increasing regional transmission and distribution losses. |
| [53] | Qatar | To study the impact of land fragmentation on the energy efficiency of public facilities in an aging society. | Remote sensing monitoring and spatial autocorrelation models. | Indicated that “fragmented” land-use patterns lead to a decline in the unit energy efficiency of municipal infrastructure and public services. |
| [54] | China (Yangtze River Delta) | To investigate the non-linear relationship between industrial land-use intensity and carbon emission efficiency. | Random Forest (RF) and spatial econometric models. | Confirmed an “Inverted U-shaped” relationship between industrial land intensity and carbon efficiency, significantly moderated by government land-leasing policies. |
Disclaimer/Publisher’s Note: The statements, opinions and data contained in all publications are solely those of the individual author(s) and contributor(s) and not of MDPI and/or the editor(s). MDPI and/or the editor(s) disclaim responsibility for any injury to people or property resulting from any ideas, methods, instructions or products referred to in the content. |
© 2026 by the authors. Licensee MDPI, Basel, Switzerland. This article is an open access article distributed under the terms and conditions of the Creative Commons Attribution (CC BY) license.
Share and Cite
Liu, L.; Yang, X. Modeling the Land-Use-Driven Energy Consumption Nexus in Shaanxi Province, China: A Digital Approach Integrating Machine Learning and Spatial Simulation. Sustainability 2026, 18, 3709. https://doi.org/10.3390/su18083709
Liu L, Yang X. Modeling the Land-Use-Driven Energy Consumption Nexus in Shaanxi Province, China: A Digital Approach Integrating Machine Learning and Spatial Simulation. Sustainability. 2026; 18(8):3709. https://doi.org/10.3390/su18083709
Chicago/Turabian StyleLiu, Longxin, and Xiaohu Yang. 2026. "Modeling the Land-Use-Driven Energy Consumption Nexus in Shaanxi Province, China: A Digital Approach Integrating Machine Learning and Spatial Simulation" Sustainability 18, no. 8: 3709. https://doi.org/10.3390/su18083709
APA StyleLiu, L., & Yang, X. (2026). Modeling the Land-Use-Driven Energy Consumption Nexus in Shaanxi Province, China: A Digital Approach Integrating Machine Learning and Spatial Simulation. Sustainability, 18(8), 3709. https://doi.org/10.3390/su18083709