Article

The Impact of Environmental Assessment on Corporate Financialization

1
School of Economics and Management, Wuhan University, Wuhan 430072, China
2
School of Finance and Economics, Wuhan College, Wuhan 430212, China
*
Author to whom correspondence should be addressed.
Sustainability 2026, 18(8), 3697; https://doi.org/10.3390/su18083697
Submission received: 21 February 2026 / Revised: 29 March 2026 / Accepted: 30 March 2026 / Published: 9 April 2026

Abstract

This study examines the impact of environmental assessment on corporate financialization in China. Using panel data of A-share listed firms from 2008 to 2023, we exploit the staggered implementation of the Natural Resource Asset Audit for Leading Cadres as a quasi-natural experiment and employ a difference-in-differences (DID) model to identify the causal effects. The empirical results show that environmental assessment significantly promotes corporate financialization, and the findings remain robust after a series of robustness and endogeneity tests. Further analysis reveals that the policy reduces firms’ financing constraints, thereby encouraging a shift in resources from real investment to financial assets. Moreover, regional financial development and corporate digital transformation positively moderate this relationship, while the effect is more pronounced in eastern regions and among smaller firms.

1. Introduction

In recent years, the strengthening of environmental governance has become a defining feature of the global transition toward sustainable development [1]. As governments pursue carbon neutrality and green transformation, environmental assessment (EA)—specifically referring to the performance evaluations and accountability systems imposed on local government officials—has emerged as a distinct institutional mechanism for internalizing environmental externalities [2]. While traditional environmental regulation (ER) typically focuses on direct legal mandates, emissions standards, or pollution taxes applied to firms, EA operates by embedding ecological performance into the career promotion and evaluation criteria of policymakers [3]. By shifting the incentives of local authorities, EA creates a top-down transmission of regulatory pressure that reshapes the institutional environment in which firms operate. This evolution raises an important question: how does this specific form of government-oriented environmental assessment influence firms’ financial decision-making, particularly their tendency toward financialization?
Corporate financialization—the increasing reliance of non-financial firms on financial investments—has become a prominent feature of modern corporate behavior. While moderate financialization can enhance liquidity management and improve short-term returns, excessive engagement in financial activities may crowd out productive investment, weaken innovation incentives, and undermine long-term competitiveness [4]. Recent firm-level evidence highlights the scale and dynamics of this phenomenon in China. According to data from the CSMAR database, the median ratio of financial assets to total assets among Chinese non-financial listed firms rose steadily over the past decade, reaching around 17% in 2022—nearly ten percentage points higher than its trough in 2011. Meanwhile, the proportion of profits derived from financial activities fluctuated markedly between approximately 3% and 21% over the same period, suggesting that financial returns remain an important yet volatile component of corporate earnings [5]. These figures illustrate the growing weight of financial activities in firms’ balance sheets and underscore the need to understand how institutional factors, such as environmental assessment, shape corporate financialization behavior.
Existing research on corporate financialization has primarily focused on macroeconomic and institutional determinants such as financial liberalization [6], corporate governance [7], and monetary policy [8]. In the field of environmental economics, while a substantial body of literature has examined the effects of environmental regulation (ER) on innovation [9], productivity [10], and firm value [11], these studies largely view environmental policy as a direct cost-inducing or incentive-based constraint on firms. However, little attention has been paid to the financial consequences of environmental assessment (EA) as an accountability mechanism. Unlike standard regulations, EA influences firms indirectly through intensified local supervision and potential shifts in resource allocation by local governments. This gap is particularly relevant in emerging economies, where environmental policies and financial markets are evolving simultaneously. This study investigates the effect of environmental assessment on corporate financialization using panel data of Chinese A-share listed firms from 2008 to 2023. We exploit the staggered implementation of China’s Natural Resource Asset Audit for Leading Cadres (NRAA)—a representative quasi-natural experiment of environmental accountability reform—and employ a difference-in-differences (DID) approach to identify the causal impact. By distinguishing EA from broader environmental regulations, this setting provides a unique opportunity to examine how the strengthening of government-led evaluation mechanisms affects firms’ capital allocation between financial and real assets.
This study advances the analytical discourse by positioning Environmental Assessment as a structural shift in governance logic, distinct from the conventional “cost-compliance” models prevalent in environmental economics. While existing literature often views environmental mandates as direct operational burdens that induce productivity trade-offs, our framework highlights a “governance-induced reallocation” mechanism. By explicitly comparing our findings with the traditional “Porter Hypothesis” and “Resource-Based View,” we demonstrate that EA operates not through direct cost-push but by internalizing ecological externalities into the career incentives of local officials. This perspective reveals a critical theoretical tension: while improved institutional accountability reduces information asymmetry and signals policy stability, it simultaneously reshapes the risk appetite of firms, leading to a strategic pivot toward financial assets—a phenomenon that challenges the assumption that enhanced green governance linearly promotes real-sector green investment.
The conceptual and methodological novelty of this work lies in its granular synthesis of institutional reform and corporate capital structure. Unlike closely related models that treat environmental policy as a monolithic constraint, our study isolates the indirect signaling effect of EA, identifying the “financing constraint alleviation” as a double-edged sword. Methodologically, by leveraging the Natural Resource Asset Audit (NRAA) as a quasi-natural experiment, we provide a more focused statement on the causality between top-down accountability and the “de-realization” of corporate assets. Our analysis further refines the current understanding by identifying regional financial depth and corporate digital maturity as critical catalysts that accelerate this financialization process. This synthesis offers a more nuanced explanation for the heterogeneous responses of firms to environmental audits, providing a theoretical advantage in explaining why firms in high-marketization environments may prioritize financial liquidity over long-term productive transformation in the face of regulatory shifts.
This paper contributes to the literature in three ways. First, it conceptualizes and tests environmental assessment as a novel institutional determinant of corporate financialization, distinguishing its indirect governance effects from the direct impact of traditional environmental regulations. Second, it extends existing studies on the economic consequences of environmental policy by focusing on firms’ financial behavior rather than traditional outcomes such as innovation or pollution reduction. Third, it provides new empirical evidence from an emerging market context, offering insights into how institutional accountability reforms can influence financial stability and resource allocation efficiency.

2. Theoretical Analysis and Research Hypothesis

2.1. The Direct Impact of Environmental Assessment on Corporate Financialization

From the perspective of institutional economics and corporate resource allocation theory, environmental assessment reshapes firms’ investment incentives by altering the regulatory environment and the relative returns of different asset allocations. When environmental objectives are embedded into the performance evaluation of government officials, regulatory pressure is transmitted from the public sector to firms through strengthened supervision and policy enforcement. This institutional change increases the expected costs and risks associated with traditional production activities, thereby affecting firms’ strategic choices regarding capital allocation.
First, environmental assessment raises compliance costs and operational uncertainty for firms. Stricter environmental performance requirements compel enterprises to invest more resources in pollution control, environmental governance, and green technological upgrades. These additional expenditures increase short-term financial pressure and may reduce the expected returns of real-sector investment. Under such circumstances, firms tend to seek alternative channels to stabilize earnings and manage risk. Prior research suggests that environmental regulation can increase firms’ precautionary financial behavior and cash-related asset holdings as a response to regulatory uncertainty [12]. In this context, financial asset investment provides firms with a flexible tool for liquidity management and income smoothing, making financialization a rational strategy for coping with regulatory shocks.
Second, environmental assessment strengthens government intervention and policy signaling in the market, which may indirectly alter firms’ investment structures. To improve ecological performance evaluations, local governments often intensify environmental supervision and raise regulatory thresholds for pollution-intensive or resource-dependent enterprises [2]. This process can crowd out productive investment by increasing regulatory costs and tightening access to financing for environmentally risky projects. At the same time, financial assets—characterized by higher liquidity and relatively stable short-term returns—become an attractive alternative for firms seeking to maintain profitability and financial flexibility.
Moreover, environmental assessment may influence the allocation of credit resources within the financial system. As financial institutions increasingly incorporate environmental risk into lending decisions, firms exposed to stricter environmental scrutiny may face adjustments in credit availability and borrowing conditions. In response to these institutional changes, firms may rebalance their asset portfolios by allocating a greater proportion of resources to financial investments, which can help preserve liquidity and diversify income sources in an uncertain regulatory environment.
Taken together, environmental assessment modifies the institutional constraints and incentive structure faced by firms, increasing compliance costs, regulatory uncertainty, and investment risk in the real economy. These factors collectively encourage firms to adjust their capital allocation strategies and expand financial asset holdings as a risk-management and profit-stabilization mechanism. Accordingly, the following hypothesis is proposed:
H1. 
Environmental assessment promotes the degree of corporate financialization.

2.2. Financing Constraint Mechanism

Environmental assessment can influence corporate financialization by alleviating firms’ financing constraints. The strengthening of environmental accountability systems enhances information disclosure and environmental transparency, improving the credibility and reputation of compliant firms in the capital market [13]. As local governments and financial institutions increasingly incorporate environmental performance into credit evaluation frameworks, firms with strong environmental compliance are more likely to obtain preferential access to bank loans, credit guarantees, and policy-based green finance [14]. This improved financing environment effectively reduces the external financing costs and liquidity pressures faced by such firms.
With fewer financing constraints, firms have greater flexibility in capital allocation. On one hand, improved access to external funds allows firms to expand their financial investments as a means of optimizing asset portfolios and enhancing short-term profitability. On the other hand, environmental assessment signals policy support for green development, which encourages firms to hold more financial assets—such as green bonds or other low-risk instruments—to balance returns and risks within a changing regulatory environment [15]. Thus, the easing of financing constraints serves as a key mechanism through which environmental assessment promotes corporate financialization. In summary, environmental assessment facilitates the flow of credit toward environmentally responsible firms, mitigates information asymmetry, and lowers financing frictions. These effects collectively enable enterprises to reallocate capital from constrained real investments toward financial assets [16], thereby increasing their degree of financialization.
H2. 
Environmental assessment promotes corporate financialization by reducing firms’ financing constraints.

2.3. Regional Financial Development as a Positive Moderating Effect

The level of regional financial development plays a crucial moderating role in shaping the impact of environmental assessment on corporate financialization. Well-developed financial markets provide more diversified financial instruments, efficient capital allocation mechanisms, and a mature institutional environment that enhances firms’ ability to respond to policy incentives [17]. In regions with advanced financial systems, the transmission of environmental assessment effects is more efficient because financial institutions are better equipped to evaluate environmental information, incorporate it into risk assessments, and allocate credit accordingly.
Specifically, when financial markets are more developed, environmental assessment can more effectively reduce firms’ financing constraints by improving the transparency and credibility of environmental performance. Financial institutions in such regions tend to reward environmentally responsible firms with easier access to loans, lower borrowing costs, and broader investment opportunities [18]. This favorable financing environment enhances firms’ liquidity and risk tolerance, encouraging them to expand their financial asset holdings and engage more actively in financial activities.
Conversely, in regions with underdeveloped financial systems, the information transmission mechanism is weaker, and the responsiveness of financial institutions to environmental policies is limited. Under such conditions, the potential credit benefits of environmental assessment are less likely to materialize, diminishing its impact on firms’ financialization behavior. Therefore, regional financial development amplifies the effect of environmental assessment on corporate financialization by improving credit allocation efficiency and strengthening the linkage between environmental governance and financial resource flows.
H3. 
The promoting effect of environmental assessment on corporate financialization is stronger in regions with higher levels of financial development.

2.4. Digitalization Level of Firms as a Positive Moderating Effect

Corporate digitalization enhances the information processing, data management, and risk control capabilities of firms [19], thereby strengthening the transmission channel through which environmental assessment influences financialization. Digital transformation improves firms’ ability to collect, analyze, and disclose environmental and operational information, which not only enhances transparency but also builds credibility with external investors and financial institutions. As a result, firms with higher levels of digitalization are better positioned to convert environmental assessment advantages into financing benefits and financial resource reallocation.
From the perspective of information asymmetry, digitalization mitigates financing frictions by facilitating real-time disclosure of environmental performance and operational data, which reduces the uncertainty perceived by creditors and investors [20]. Financial institutions, in turn, are more willing to provide credit and investment to digitally advanced and environmentally compliant firms. This improved access to financing relaxes capital constraints, enabling firms to allocate more funds toward financial assets while maintaining sustainable real operations.
Moreover, digital technologies—such as big data analytics, artificial intelligence, and blockchain—allow firms to integrate environmental management into strategic decision-making and investment planning. This integration helps firms to identify profitable financial opportunities that align with environmental goals, thereby magnifying the positive link between environmental accountability and financialization. Therefore, corporate digitalization acts as a positive moderator [21], amplifying the extent to which environmental assessment promotes corporate financialization by improving information efficiency and capital market responsiveness.
H4. 
The promoting effect of environmental assessment on corporate financialization is stronger for firms with higher levels of digitalization.

3. Research Design

3.1. Data Sources

The empirical analysis in this study is based on an unbalanced panel dataset of Chinese A-share listed firms from 2008 to 2023. Firm-level financial and governance data are primarily obtained from the CSMAR and Wind databases, while province-level macroeconomic indicators are collected from various issues of the China Statistical Yearbook and provincial statistical yearbooks. All financial variables are winsorized at the 1st and 99th percentiles to mitigate the influence of outliers. Consistent with prior literature, firms in the financial sector and those labeled as ST or ST* are excluded to ensure the comparability of results.
The sample period begins in 2008 to align with the availability and consistency of firm-level data following the implementation of new accounting standards and ends in 2023 to capture the most recent period of China’s environmental governance reforms. This time frame also allows for sufficient pre- and post-treatment observations to conduct the difference-in-differences (DID) analysis based on the staggered implementation of the environmental accountability pilot programs.

3.2. Introduction to Models and Variables

3.2.1. Model Construction

To examine the impact of the policy on corporate financialization, this study employs a difference-in-differences (DID) framework and further extends the analysis by incorporating mechanism and moderating effect models.
The baseline model investigates the average treatment effect of the staggered policy implementation (2015–2017) on firms’ financialization level:
F i n i t = α + β D I D i t + γ C o n t r o l s i t + μ i + λ t + ε i t
where F i n i t represents the degree of financialization of firm i in year t , and D I D i t denotes the treatment status. C o n t r o l s i t includes firm-level covariates. Firm fixed effects (μi) and year fixed effects ( λ t ) are included to control for time-invariant firm characteristics and common temporal shocks. Standard errors are clustered at the firm level. This approach accounts for potential serial correlation within firms over time. Given the large degree of firm-level heterogeneity in our sample of A-share listed companies, firm-level clustering provides a more granular control for intra-group correlation. Moreover, the inclusion of firm fixed effects already absorbs time-invariant province-specific characteristics, ensuring the robustness of our statistical inference.
To explore the transmission channel, the analysis introduces financing constraints (SA index) as a potential mediating variable. The mechanism is tested using the following two-step model:
S A i t = α + β D I D i t + γ C o n t r o l s i t + μ i + λ t + ε i t
F i n i t = α + β D I D i t + θ S A i t + γ C o n t r o l s i t + μ i + λ t + ε i t
To further explore contextual influences, the analysis tests whether the effects of environmental assessment are moderated by regional financial development ( F i n L e v i t ) and firms’ digital transformation levels ( D i g T r a n s i t ):
F i n i t = α + β D I D i t + ϕ F i n L e v i t + δ ( D I D i t × F i n L e v i t ) + γ C o n t r o l s i t + μ i + λ t + ε i t
F i n i t = α + β D I D i t + ϕ D i g T r a n s i t + δ ( D I D i t × D i g T r a n s i t ) + γ C o n t r o l s i t + μ i + λ t + ε i t
The coefficients on the interaction terms ( δ ) capture whether the influence of environmental assessment on corporate financialization is strengthened by higher regional financial development or greater digital transformation within firms.

3.2.2. Dependent Variable: Corporate Financialization ( F i n i t )

Corporate financialization ( F i n i t ) refers to the increasing tendency of non-financial firms to allocate resources toward financial assets and financial activities rather than traditional productive investment. In the existing literature, corporate financialization is generally understood as a shift in firms’ asset allocation and profit sources toward financial markets, reflecting the growing role of financial motives in corporate decision-making. This phenomenon has attracted considerable attention in studies of corporate finance and political economy because excessive financialization may crowd out real investment, weaken innovation incentives, and alter firms’ long-term development strategies.
Existing studies have proposed several approaches to measuring corporate financialization. One common approach focuses on the income structure, measuring the share of financial income in total profits in order to capture firms’ reliance on financial returns. Another widely used approach is based on the asset structure, which evaluates the proportion of financial assets held by firms relative to their total assets. Compared with income-based indicators, asset-based measures better reflect firms’ long-term investment orientation and strategic asset allocation decisions, as they are less affected by temporary fluctuations in financial returns.
Following a large body of empirical research, this study adopts the asset-based approach and measures corporate financialization by the ratio of a firm’s financial assets to its total assets. Financial assets include trading financial assets, derivative financial assets, loans and advances granted, available-for-sale financial assets, held-to-maturity investments, and investment properties, among others. This measure captures the extent to which firms reallocate capital from real-sector activities to financial investments and reflects the structural importance of financial assets in corporate balance sheets. A higher value of Fin therefore indicates a stronger tendency for firms to engage in financial investment activities relative to productive operations. This measure has been commonly used in the literature [22,23,24,25].

3.2.3. Independent Variable ( D I D i t )

The key independent variable, D I D i t , captures the policy shock generated by the implementation of the Natural Resource Asset Auditing of Departing Officials (NRAA) pilot program. This program, jointly launched by the General Offices of the CPC Central Committee and the State Council, was implemented in several batches across different provinces during 2015–2017. The policy represents an important institutional reform that incorporated environmental accountability into the performance evaluation system of local officials. By linking ecological outcomes with political promotion incentives, the reform significantly strengthened government oversight of environmental governance and increased the intensity of environmental assessment faced by local firms.
This staggered implementation provides a suitable quasi-natural experimental setting for identifying the causal impact of environmental assessment on corporate behavior. Importantly, the selection and timing of the NRAA pilot program were determined by central government policy arrangements rather than by individual firms’ characteristics or financial decisions. As a result, the policy variation can be regarded as largely exogenous to firm-level financialization behavior, which helps mitigate concerns regarding reverse causality or self-selection bias.
Within the difference-in-differences (DID) framework, firms located in provinces participating in the NRAA pilot are assigned to the treatment group, while firms located in non-pilot provinces serve as the control group. The variable D I D i t equals 1 for firms in pilot provinces in and after the year when the policy was implemented, and 0 otherwise. This staggered rollout generates both cross-regional and intertemporal variation in environmental assessment intensity, allowing us to compare the changes in corporate financialization between treated and untreated firms before and after the policy intervention.
To further strengthen the credibility of the identification strategy, the empirical model incorporates firm and year fixed effects to control for time-invariant firm characteristics and common macroeconomic shocks. In addition, the validity of the DID design is examined through several robustness checks, including a parallel trends test, placebo tests, and an instrumental variable approach. Together, these strategies enhance the reliability of the causal interpretation of the estimated effects.

3.2.4. Mechanism and Moderating Variables

The mechanism variable in this study is financing constraints ( S A i t ), measured using the SA index proposed by Hadlock and Pierce [26]. The SA index is derived from firm size and firm age, with smaller and younger firms typically facing greater financing difficulties. A lower S A i t value indicates looser financing constraints. This measure captures firms’ access to external capital and serves to test whether environmental assessment influences corporate financialization by alleviating financing constraints.
The first moderating variable is the regional financial development level ( F i n L e v i t ), measured by the ratio of the total loan balance of financial institutions to the regional gross domestic product (GDP). This indicator reflects the depth of financial intermediation and the accessibility of financial resources within a province. A higher F i n L e v i t suggests a more developed financial market and a more supportive financing environment for enterprises, which may strengthen the transmission from environmental assessment to corporate financialization.
The second moderating variable is the degree of corporate digital transformation ( D i g T r a n s i t ), constructed using a text-analysis approach following Zhen [27]. Specifically, we calculate the frequency of 139 digitalization-related keywords extracted from firms’ annual reports, covering three major dimensions: technological infrastructure, organizational empowerment, and digital application. A higher D i g T r a n s i t value indicates a greater level of digital transformation, which enhances information processing and disclosure, thereby amplifying the effect of environmental assessment on financialization.

3.2.5. Control Variables

To control for firm-level heterogeneity, this study includes several variables commonly used in the literature on corporate financialization. Firm size ( S i z e i t ) is measured as the natural logarithm of total assets; leverage ( L e v i t ) as the ratio of total liabilities to total assets; and board independence ( I n d e p i t ) as the proportion of independent directors on the board. D u a l i t is a dummy variable equal to 1 if the CEO simultaneously serves as the board chair, and 0 otherwise. We also control for P o l l u t e i t , indicating whether a firm belongs to a pollution-intensive industry; F i x e d i t , the ratio of fixed assets to total assets; I n t a n g i b l e i t , the ratio of intangible assets to total assets; and L i s t A g e i t , the number of years since the firm’s IPO.
All continuous variables are winsorized at the 1st and 99th percentiles to mitigate the influence of outliers. The regressions include year and firm fixed effects to control for unobserved time- and firm-specific factors. Standard errors are clustered at the firm level to address serial correlation within firms over time.
Descriptive statistics are in Table 1.

4. Empirical Results Analysis

4.1. Baseline Results Analysis

Table 2 reports the baseline regression results examining the impact of environmental assessment on corporate financialization. Column (1) presents the results without control variables, while Column (2) includes firm-level controls. Across both specifications, the coefficient of D I D i t remains significantly positive at the 1% level, indicating that the implementation of China’s environmental accountability reform has significantly promoted corporate financialization. The reported R-squared values (around 0.65) represent the within R-squared, which is primarily driven by the inclusion of high-dimensional firm and year fixed effects that capture a significant portion of the systematic variance in corporate financial decisions.
Regarding the economic magnitude, the coefficient of 0.008 in Column (2) suggests that, after controlling for other factors, the implementation of the environmental assessment policy leads to an average increase of 0.8 percentage points in the ratio of financial assets to total assets for the treated firms. Given that the sample mean of corporate financialization ( F i n i t ) is approximately 4.7% (as shown in the descriptive statistics), this policy effect represents an 17.02% increase (0.008/0.047) relative to the average level of financialization. Furthermore, a one-standard-deviation increase in the D I D i t variable is associated with a 5.6% standard deviation increase in financialization. These results indicate that the impact of environmental assessment is not only statistically significant but also economically meaningful in reshaping firms’ asset allocation strategies.
Regarding the control variables, several factors significantly influence corporate financialization. Specifically, firm size ( S i z e i t ), leverage ( L e v i t ), and investment in real assets ( F i x e d i t and I n t a n g i b l e i t ) are negatively and significantly correlated with financialization at the 1% level, suggesting that larger, highly leveraged firms or those with heavy physical capital tend to allocate fewer resources to financial assets. Conversely, listing age ( L i s t A g e i t ) shows a significantly positive coefficient, indicating that more established firms may have a higher propensity for financial investment
These findings confirm that environmental assessment policies have encouraged firms to reallocate resources toward financial assets, supporting the hypothesis that strengthened environmental accountability contributes to higher levels of corporate financialization. This is consistent with the conclusions drawn by other researchers [28,29].

4.2. Robustness Tests

4.2.1. Parallel Trends Test (Event Study)

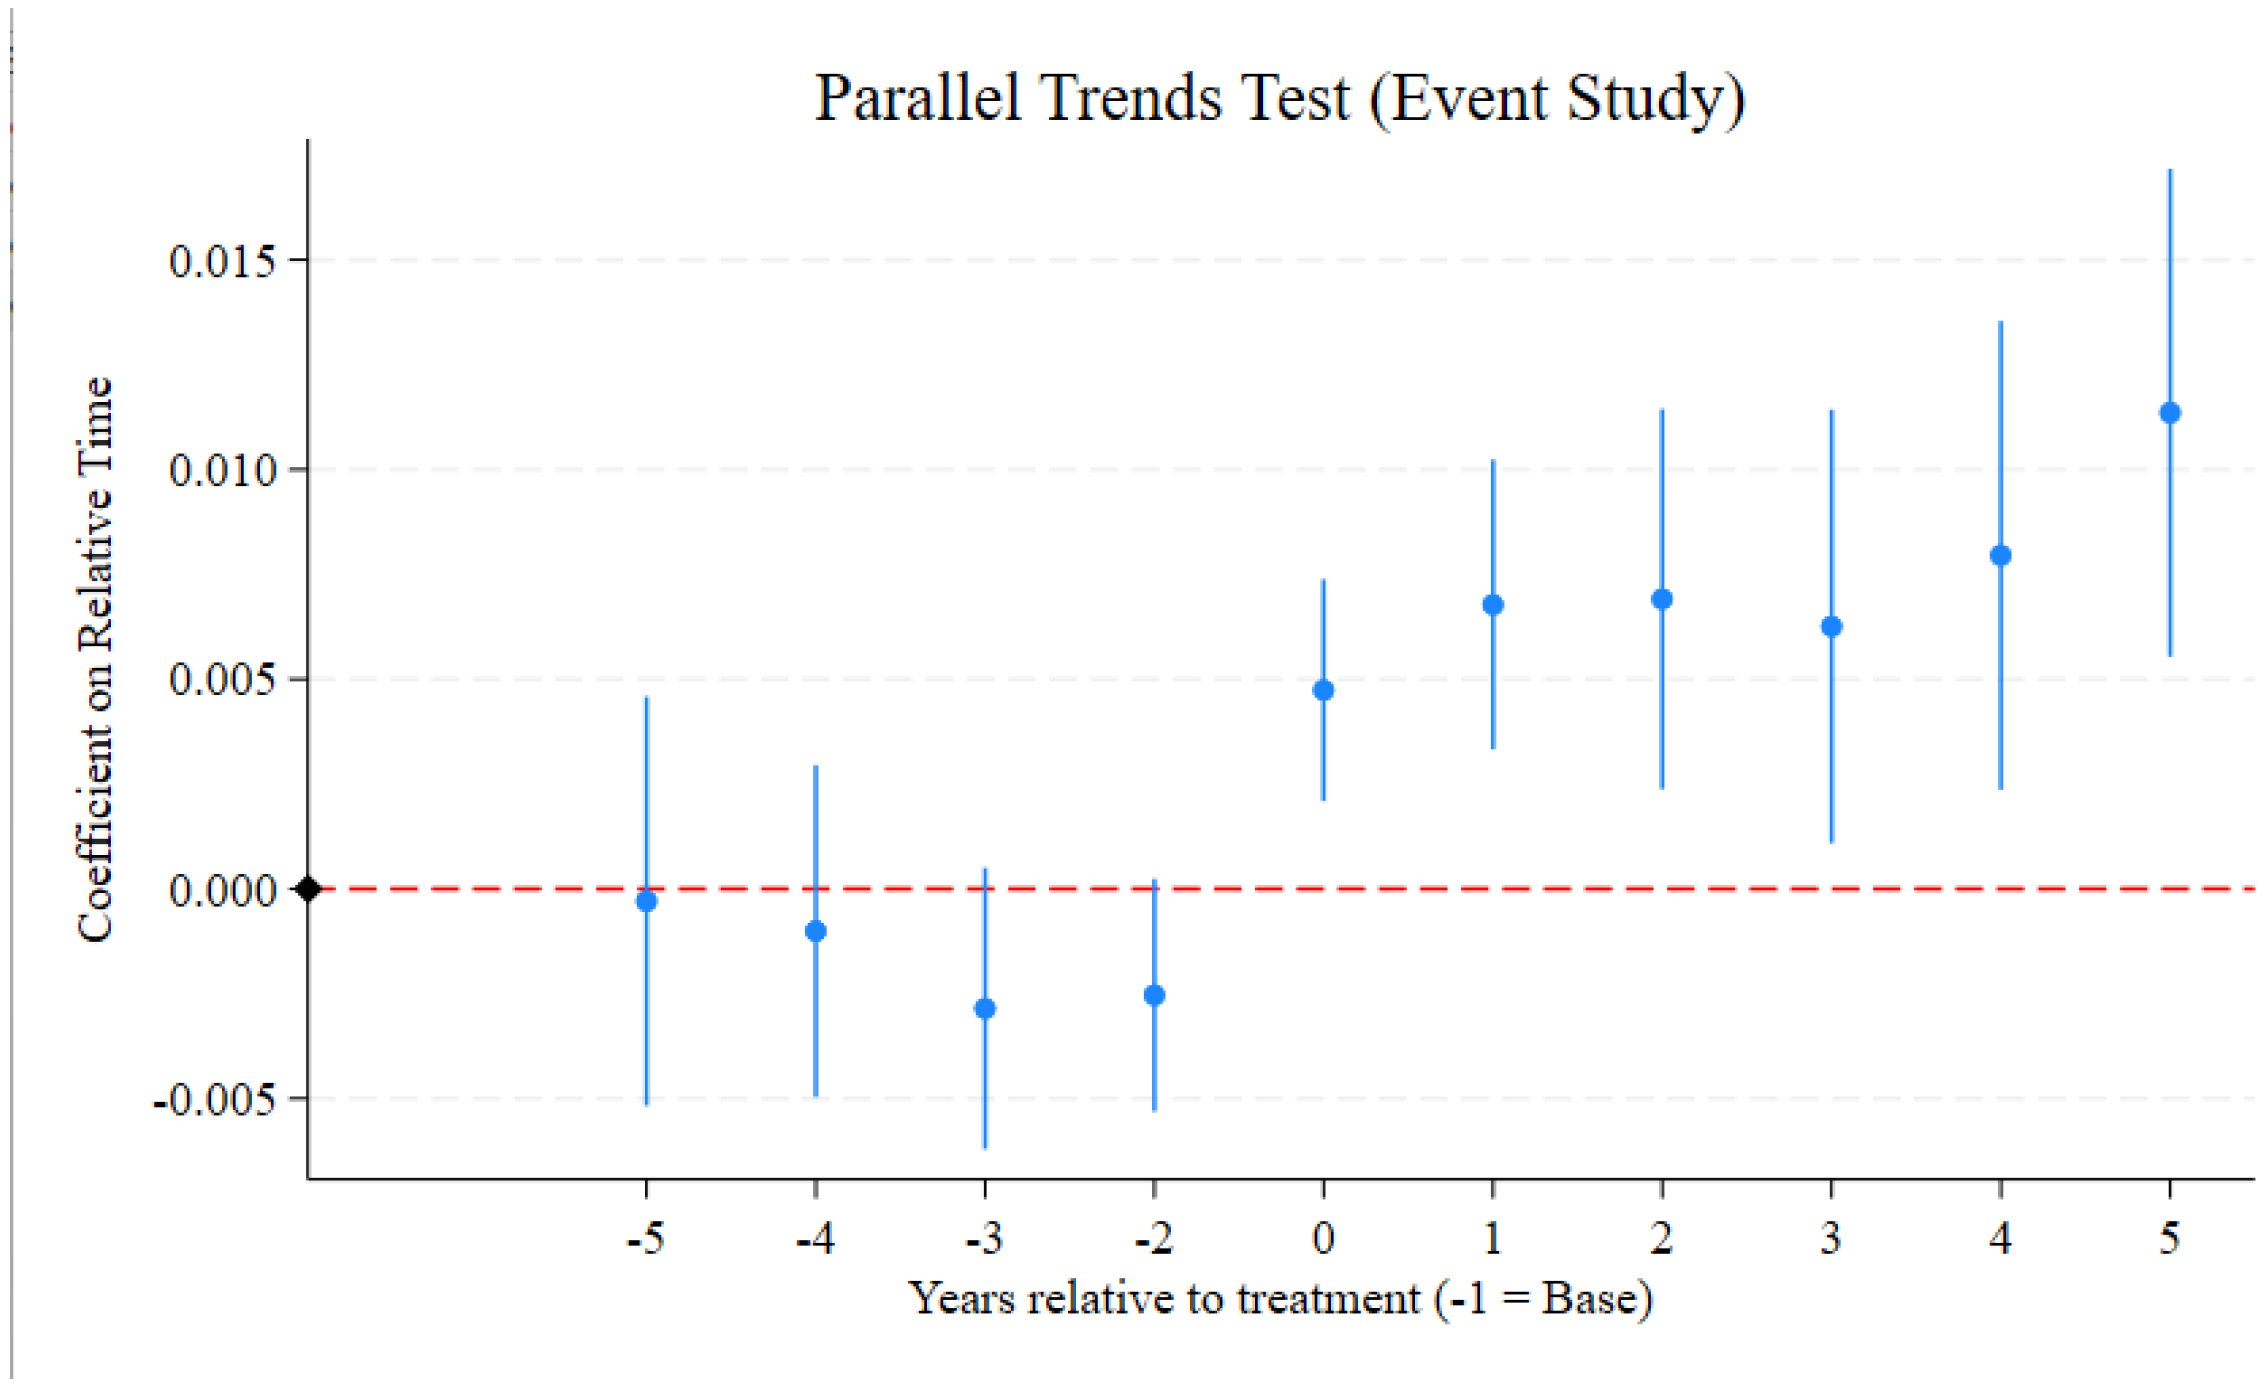
The validity of the staggered Difference-in-Differences (DID) estimation hinges on the parallel trends assumption, which requires that, absent the policy intervention, the average outcomes of the treatment and control groups would have followed similar paths. To verify this for the environmental assessment policy, we conducted an event study by estimating the dynamic effects from five years before to five years after the policy implementation (with the year prior to the treatment, t − 1, as the base year). To maintain sufficient sample size at the window tails, we follow the standard practice of binning observations beyond the five-year horizon into the Pre-5 and Post-5 indicators, respectively.
As depicted in Figure 1, the estimated coefficients for the pre-treatment periods (years −5 to −2) are statistically insignificant, with their 95% confidence intervals consistently encompassing zero. To further rigorously validate this assumption, we conducted a joint significance test on all pre-treatment coefficients (Pre-5 to Pre-2). The resulting F-statistic failed to reject the null hypothesis (p > 0.1), statistically confirming that the treatment and control groups exhibited no significant differential trends in corporate financialization prior to the policy’s implementation. Therefore, the parallel trends assumption is satisfied, validating the causal identification strategy of the DID model.
Furthermore, the coefficients become positive and statistically significant in the year of treatment (t = 0) and subsequent years. Specifically, the policy effect shows an upward trajectory over time, with the magnitude of the coefficients increasing through the end of the observation window (t + 5). This suggests that the impact of environmental accountability on corporate financialization is not a temporary shock but a persistent and cumulative structural shift in firms’ capital allocation behavior.

4.2.2. Placebo Test

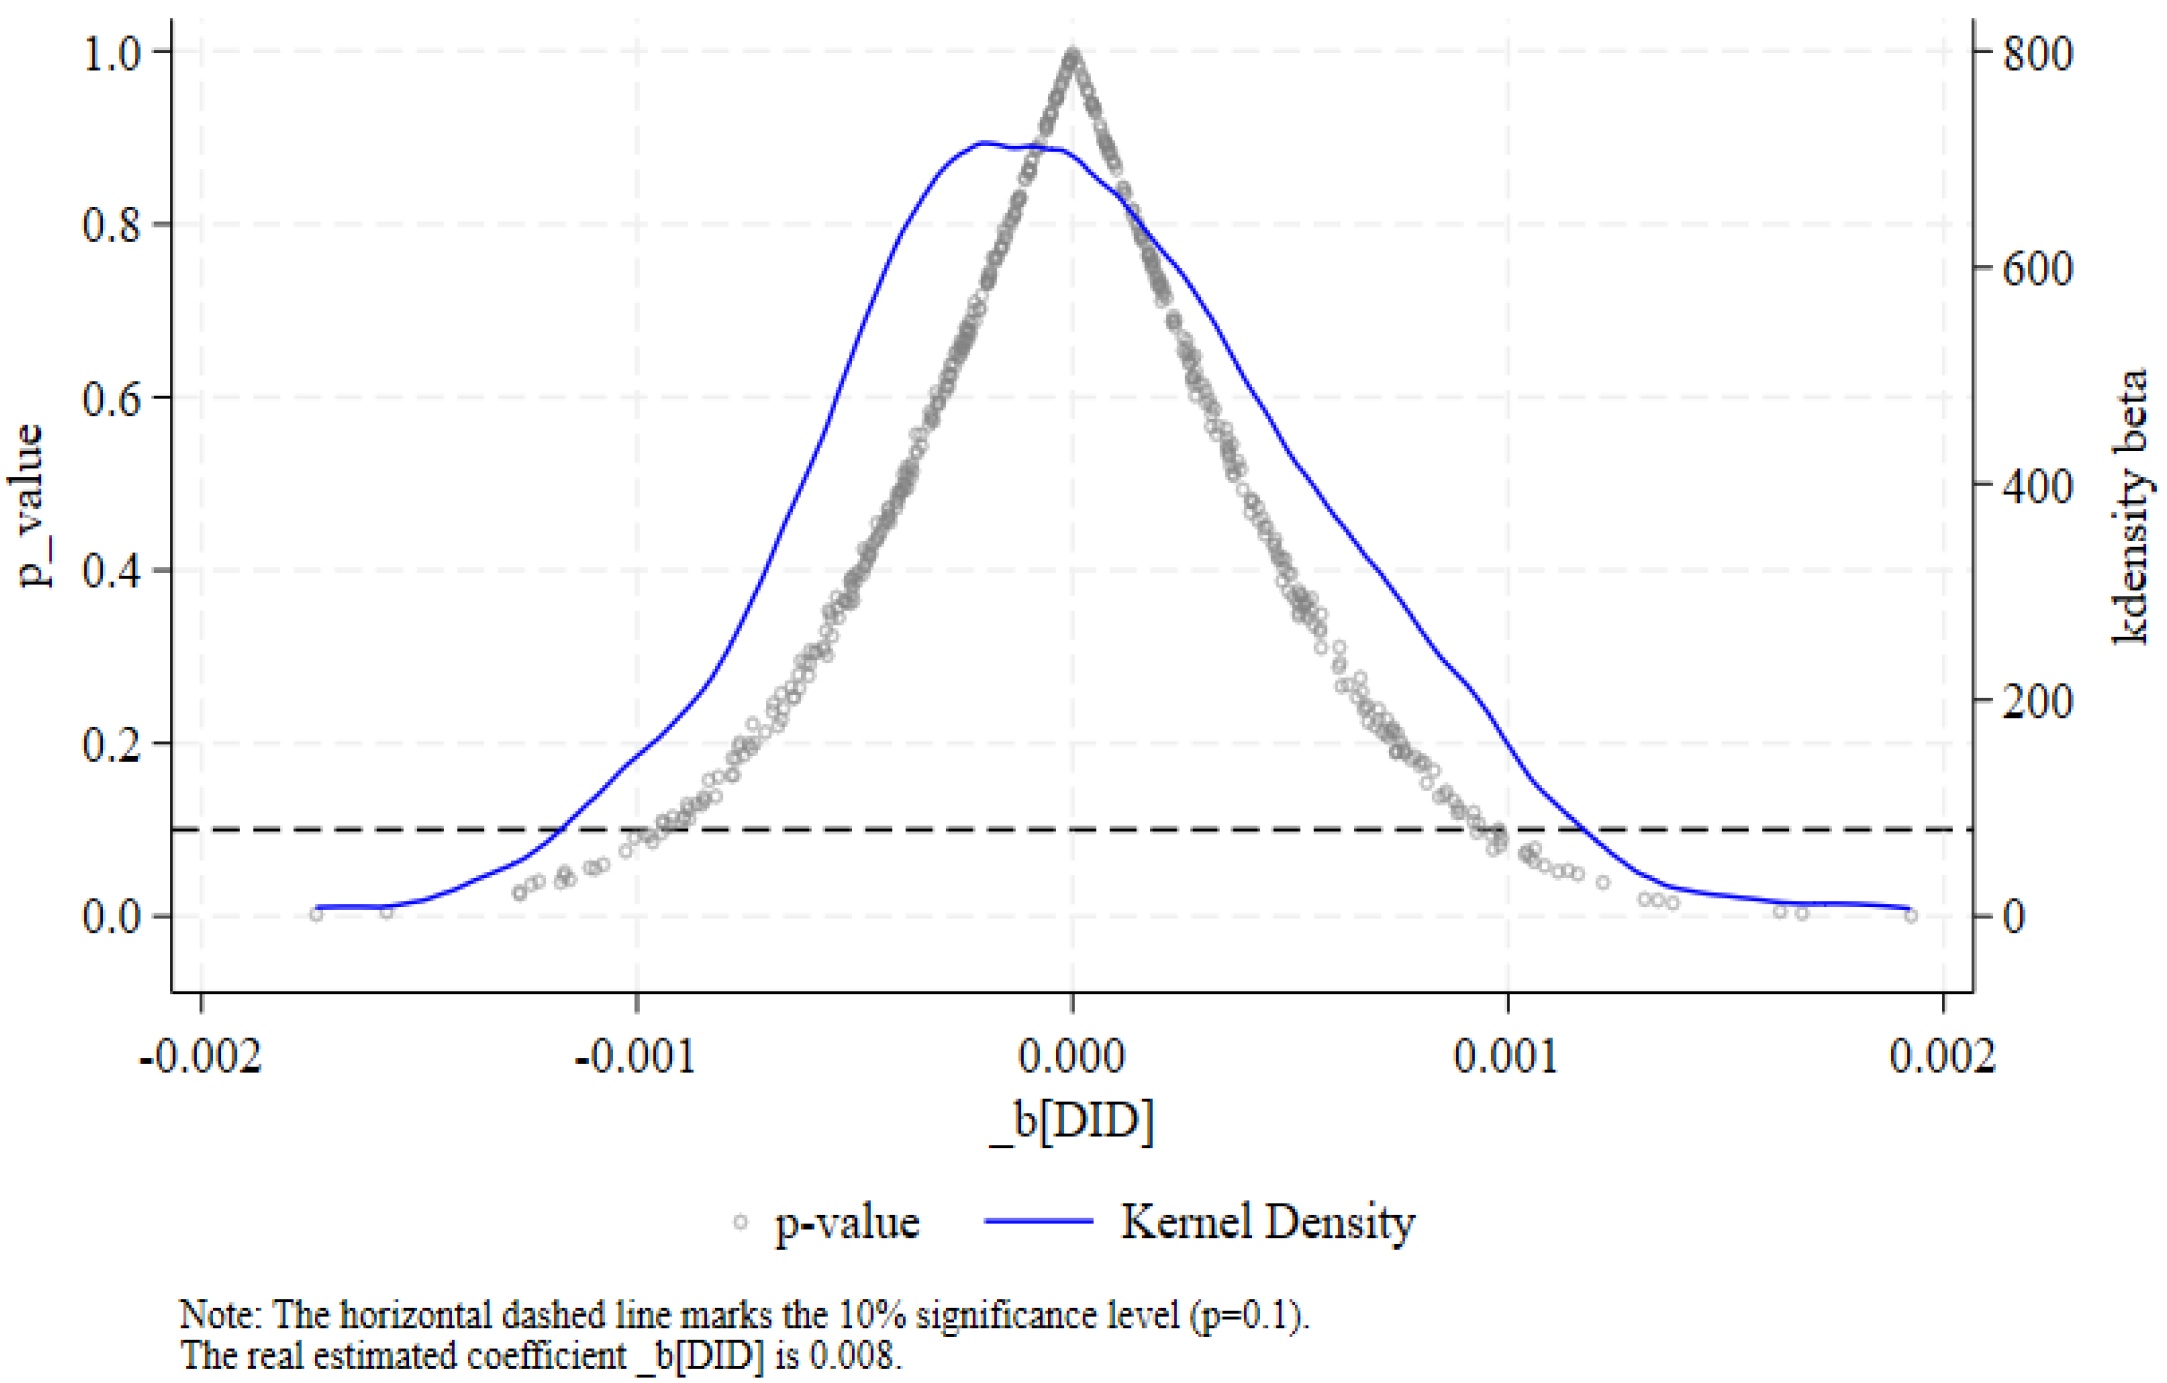
To enhance the robustness of our findings, we conducted a placebo test by constructing a falsified treatment variable through 500 random sampling iterations. We randomly selected the same number of provinces that were actually treated and designated them as a pseudo-treatment group to construct a placebo dummy. Figure 2 illustrates that the distribution of the 500 estimated placebo coefficients is tightly clustered around zero. Furthermore, the p-values for the majority of these coefficients are statistically insignificant. Crucially, the true estimated coefficient lies far outside this null distribution. This outcome confirms that the promotion of corporate financialization is genuinely attributable to the environmental assessment policy and not to unobserved factors, thus supporting the robustness of our conclusions.

4.2.3. Instrumental Variable Approach

To further address potential endogeneity concerns, this study employs an instrumental variable (IV) approach. Specifically, we use E P I n s z t , an indicator of whether the central government conducted environmental inspections in a firm’s province z during a given year t , as an instrument for DID. The rationale is that central environmental inspections are exogenous to individual firms’ financialization behavior but highly correlated with the intensity of environmental assessment at the regional level, thereby satisfying both relevance and exogeneity conditions.
Table 3 reports the results of the two-stage IV estimation. The first-stage regression in Column (1) shows that E P I n s z t is significantly and positively associated with D I D i t at the 1% level, confirming the instrument’s strong explanatory power. The second-stage regression in Column (2) indicates that the coefficient of D I D i t remains significantly positive at the 5% level, suggesting that environmental assessment continues to exert a robust promoting effect on corporate financialization after accounting for potential endogeneity.
Overall, these IV results are consistent with the baseline estimations, reinforcing the conclusion that the staggered implementation of China’s environmental accountability reforms significantly enhances firms’ financialization, and that the observed relationship is unlikely to be driven by omitted variable bias or reverse causality.

4.2.4. PSM-DID Regression

To mitigate potential sample selection bias and ensure that the treatment and control groups are comparable prior to the policy intervention, this study employs a propensity score matching difference-in-differences (PSM-DID) approach. Specifically, we perform a year-by-year 1:1 nearest-neighbor matching with a caliper of 0.01 to pair treated firms with control firms that exhibit similar characteristics. The propensity scores are estimated using a logit model, incorporating all control variables used in the baseline regression—including firm size, leverage, profitability, and growth—as matching covariates. Following the matching procedure, we restrict the analysis to observations within the common support domain to ensure the validity of the counterfactual groups.
To verify the quality of the matching, we conducted a balance test to examine whether significant differences exist between the treated and control groups after matching. The results (available upon request) indicate that the standardized biases of all covariates were reduced to less than 5%, and the t-tests failed to reject the null hypothesis of no systematic differences between the two groups, confirming the effectiveness of the PSM procedure.
As shown in Table 4, the estimated coefficient of $DID$ remains significantly positive at the 1% level after matching. Specifically, the coefficient is 0.009 (p < 0.01), suggesting that firms in regions subject to the environmental accountability reform exhibit higher levels of financialization even after controlling for pre-treatment differences. These findings indicate that the positive effect of environmental assessment on corporate financialization is not driven by sample selection bias, further reinforcing the reliability and robustness of the baseline conclusions.

4.2.5. Other Robustness Checks

To ensure that the baseline findings are not driven by specific sample periods or model specifications, several additional robustness tests are conducted. Columns (1) and (2) of Table 5 restrict the sample period to years before 2020 to exclude potential distortions caused by the COVID-19 pandemic. The coefficient of D I D i t remains significantly positive at the 1% level, indicating that the positive relationship between environmental assessment and corporate financialization is not affected by the pandemic period.
Columns (3) and (4) further incorporate city fixed effects to control for unobserved heterogeneity at the regional level. The estimated coefficients of D I D i t remain positive and highly significant, consistent with the main results. These robustness checks collectively confirm the stability and reliability of the empirical conclusions.
Furthermore, to address potential estimation bias in the staggered DID setting, we re-estimate the model using the doubly robust estimator. As shown in Column (5) of Table 5, the aggregate ATT remains significantly positive at 0.009 (p < 0.01), confirming that our results are robust to heterogeneous treatment effects and staggered timing bias.

4.3. Mechanism Analysis

4.3.1. Testing of Financing Constraint Mechanisms

To further explore the transmission channel through which environmental assessment affects corporate financialization, this study examines whether the policy operates by alleviating firms’ financing constraints. Environmental assessment may influence firms’ access to external capital by improving environmental information disclosure and strengthening the credibility of environmentally compliant firms. When environmental performance becomes an important component of government evaluation and financial institutions increasingly incorporate environmental indicators into credit assessment, firms with better environmental compliance are more likely to gain improved access to bank loans and other financing channels. As a result, the financing frictions faced by firms may be alleviated, which in turn affects their capital allocation decisions.
To test this mechanism, we employ the SA index as a proxy for financing constraints. A lower S A i t value indicates looser financing constraints. Following the standard mediation analysis framework, we first regress the financing constraint variable ( S A i t ) on the policy variable ( D I D i t ), and then include S A i t in the baseline financialization regression.
Column (1) of Table 6 reports the first-stage results, where the coefficient of D I D i t is significantly negative at the 1% level. This finding suggests that the implementation of environmental assessment policies significantly reduces firms’ financing constraints. One possible explanation is that the strengthening of environmental governance improves firms’ transparency and policy credibility, thereby facilitating access to external financing.
Column (2) presents the second-stage regression results. After introducing the SA index into the financialization equation, the coefficient of S A i t is significantly negative at the 1% level, indicating that firms facing fewer financing constraints tend to hold a higher proportion of financial assets. In other words, improved financing conditions provide firms with greater liquidity and capital flexibility, allowing them to allocate more resources toward financial investments in pursuit of short-term returns or portfolio diversification.
Furthermore, the coefficient of D I D i t remains positive and significant after controlling for the SA index, but its magnitude decreases compared with the baseline regression. This pattern indicates the presence of a partial mediation effect, suggesting that environmental assessment promotes corporate financialization partly through the alleviation of financing constraints [29]. Overall, these results support the proposed mechanism that environmental assessment improves firms’ financing environment, which subsequently increases their ability and incentive to allocate resources to financial assets.

4.3.2. Test of Moderating Effect

To examine the moderating mechanisms through which the policy influences corporate financialization, this section introduces interaction terms between the policy variable ( D I D i t ) and two moderators: regional financial development ( F i n L e v i t ) and firms’ digital transformation ( D i g T r a n s i t ).
As shown in Table 7, the coefficient of D I D i t   ×   F i n L e v i t is significantly positive at the 1% level, indicating that higher levels of regional financial development strengthen the positive impact of environmental regulation on corporate financialization. This suggests that a more developed financial system provides better financial access and flexibility, thereby amplifying the effect of policy implementation.
Similarly, the coefficient of D I D i t   ×   D i g T r a n s i t is also significantly positive at the 1% level, suggesting that firms with a higher degree of digital transformation experience a stronger policy effect. Digital transformation may enhance firms’ information management and operational efficiency, enabling them to better utilize financial resources in adapting to regulatory pressures.

4.4. Heterogeneity Analysis

4.4.1. Regional Heterogeneity

To explore whether the policy effect varies across regions with different levels of economic development, the sample is divided into two groups: the eastern region and the non-eastern region. As reported in Table 8, the coefficient of D I D i t remains significantly positive in both groups, but the magnitude of the effect is larger and more statistically significant in the eastern region. This indicates that the impact of environmental regulation on corporate financialization is stronger in economically developed areas.
The likely explanation is that firms in the eastern region generally possess more mature financial systems, higher institutional quality, and better access to financial resources, which facilitate a more pronounced financialization response to environmental policies. In contrast, firms in less-developed regions may face financing constraints or institutional frictions that weaken the policy transmission effect.

4.4.2. Firm Heterogeneity

To further investigate firm-level differences, this section classifies firms based on their size. Specifically, the sample is divided into two groups—large and small firms—based on the median value of total assets (Size) within the same industry and year. As shown in Table 9, the D I D i t coefficient is significantly positive in both large and small firms, but the effect is notably stronger for smaller firms.
This finding suggests that smaller firms are more sensitive to environmental regulation in terms of financialization adjustment. One possible reason is that small firms, facing tighter resource constraints and limited environmental management capacity, may rely more on financial investments to buffer regulatory shocks. Conversely, large firms tend to have more diversified operations and better financing channels, which mitigate the influence of environmental regulation on their financialization behavior.

5. Conclusions and Policy Implications

5.1. Conclusions

This study examines the impact of China’s environmental assessment reforms on corporate financialization by exploiting the staggered implementation of the Natural Resource Asset Auditing of Departing Officials (NRAA) as a quasi-natural experiment. Using a difference-in-differences (DID) framework and panel data of Chinese A-share listed firms from 2008 to 2023, the empirical results show that environmental assessment significantly increases the level of corporate financialization. This finding remains robust after a series of robustness and endogeneity tests. Further mechanism analysis indicates that environmental assessment alleviates firms’ financing constraints, which in turn encourages firms to reallocate capital toward financial assets. In addition, the effect is heterogeneous across different contexts: the promoting effect of environmental assessment on corporate financialization is stronger in regions with higher levels of financial development and among firms with greater digital transformation. The heterogeneity analysis further reveals that the effect is more pronounced for firms located in eastern regions and for smaller firms.
This study contributes to the existing literature in several ways. First, it extends the literature on the economic consequences of environmental governance by demonstrating that environmental assessment can significantly influence firms’ financial behavior. While previous studies primarily focus on the effects of environmental regulation on innovation, productivity, or pollution reduction, this paper highlights an important but relatively underexplored dimension—the impact of environmental governance on corporate financialization. Second, this study contributes to the growing literature on corporate financialization by identifying environmental assessment as a new institutional driver that shapes firms’ asset allocation decisions. Third, by exploiting the staggered implementation of China’s environmental accountability reform as a quasi-natural experiment, this study provides new causal evidence on how environmental governance policies influence firms’ financial strategies in an emerging market context.

5.2. Policy Recommendations

Based on the empirical findings, this study offers the following structured recommendations for policymakers, practitioners, and regulators to mitigate the unintended “crowding-out” effect on real investment and to ensure that environmental governance aligns with financial stability.
First, policymakers should implement a “coordinated-governance” framework to balance environmental objectives with industrial vitality. Our findings suggest that while environmental assessment strengthens accountability, it may unintentionally drive firms toward speculative financial activities. Therefore, environmental audits should not be conducted in isolation. Regulators should coordinate environmental accountability with industrial subsidies and tax incentives specifically targeted at green technological innovation. By reducing the relative risk of long-term green projects compared to short-term financial assets, authorities can guide the liquidity released by improved institutional governance back into the real economy.
Second, financial regulators must strengthen targeted oversight of capital flows following environmental disclosures. Since the alleviation of financing constraints is a primary mechanism driving financialization, financial institutions should enhance their “green credit” monitoring systems. Rather than merely providing credit based on a firm’s environmental compliance signals, banks and investors should implement post-loan tracking to ensure that funds are utilized for sustainable production upgrades rather than being diverted into high-yield financial instruments. This is particularly crucial in regions with high financial development, where the temptation for financial arbitrage is more pronounced.
Third, practitioners and planners should leverage digital transformation as a dual-purpose tool for transparency and efficiency. Given that digital maturity moderates the relationship between assessment and financialization, firms should be encouraged to integrate digital technologies into their environmental management systems. For practitioners, this means moving beyond “word-frequency” disclosure toward real-time, data-driven environmental reporting. For regulators, promoting digital infrastructure can help monitor firm-level capital allocation in real-time, allowing for early intervention when excessive financialization risks arise.
Fourth, a localized and differentiated approach is essential for global jurisdictions. For international regulators, such as those in Europe and other Asian economies implementing similar green governance frameworks (e.g., ESG mandates or resource audits), our results suggest that a staggered, trial-and-error implementation—akin to the NRAA pilot—is superior to a “one-size-fits-all” shock. European regulators should be particularly mindful of shifting risk–return profiles that may drive capital toward financial assets in limited-alternative markets. We suggest that environmental governance in these contexts must be coupled with targeted financial oversight to prevent the “greening” of the public sector from inadvertently catalyzing the “financialization” of the private sector.


Author Contributions

Conceptualization, R.A.; methodology, R.A.; formal analysis, R.A.; resources, R.A.; data curation, R.A.; writing—original draft preparation, R.A.; writing—review and editing, R.A. and J.Z.; supervision, J.Z. All authors have read and agreed to the published version of the manuscript.

Funding

This research received no external funding.

Institutional Review Board Statement

Not applicable.

Informed Consent Statement

Not applicable.

Data Availability Statement

The original contributions presented in this study are included in the article. Further inquiries can be directed to the corresponding author.

Conflicts of Interest

The authors declare no conflicts of interest.

References

  1. Atta, N.; Sharifi, A. A review of the knowledge structure and trends in research on the interlinkages between the rule of law and environmental sustainability. Sustain. Dev. 2025, 33, 2216–2249. [Google Scholar] [CrossRef]
  2. Shen, L.; Fan, R.; Wang, Y.; Cheng, E. Invisible economy, performance assessment of local governments, and environmental regulation in China. Environ. Sci. Pollut. Res. 2023, 1–18. [Google Scholar] [CrossRef] [PubMed]
  3. Guo, S.; Yang, Y.; Neng, L. How the environmental credit evaluation system affects corporate pollution emissions: Evidence from China. J. Environ. Manag. 2025, 373, 123643. [Google Scholar] [CrossRef]
  4. Chen, S.; Nie, B.; Huang, X. Nonlinear Impact of Corporate Financialization on Sustainable Development Ability: Evidence from Listed Companies in China. Sustainability 2024, 16, 3402. [Google Scholar] [CrossRef]
  5. Tudi, T.; Wu, J.; Chen, M.; Jeon, B.N. Does foreign demand affect corporate financialization? Some evidence from China. Emerg. Mark. Rev. 2025, 65, 101232. [Google Scholar] [CrossRef]
  6. Yang, B.; Chen, F. The financialization of nonfinancial companies in China: A macroeconomic perspective. Financ. Res. Lett. 2023, 53, 103407. [Google Scholar] [CrossRef]
  7. Cao, C.; Zhang, Y. A study of the impact of staggered boards on corporate financialization: From the perspective of board gov-ernance. Front. Psychol. 2024, 15, 1377948. [Google Scholar] [CrossRef]
  8. Cloyne, J.; Ferreira, C.; Froemel, M.; Surico, P. Monetary policy, corporate finance, and investment. J. Eur. Econ. Assoc. 2023, 21, 2586–2634. [Google Scholar] [CrossRef]
  9. Iqbal, U.; Nadeem, M.; Gull, A.A.; Kayani, U.N. Environmental innovation and firm value: The moderating role of organiza-tional capital. J. Environ. Manag. 2022, 316, 115253. [Google Scholar] [CrossRef]
  10. Shan, Z.; Han, X.; Zhang, Z. Environmental regulation and firm productivity: Evidence from China’s new energy industry. Eurasian Bus. Rev. 2025, 15, 871–906. [Google Scholar] [CrossRef]
  11. Yang, Y.; Ding, L.; Li, Y. Environmental regulation improves the firm performance in the paper industry in China. Singap. Econ. Rev. 2021, 70, 1895–1926. [Google Scholar] [CrossRef]
  12. Zhang, C.; Cheng, J. Environmental regulation and corporate cash holdings: Evidence from China’s new environmental pro-tection law. Front. Environ. Sci. 2022, 10, 835301. [Google Scholar] [CrossRef]
  13. Botosan, C.A. Disclosure Level and the Cost of Equity Capital. Account. Rev. 1997, 72, 323–349. [Google Scholar] [CrossRef]
  14. Petersen, M.A.; Rajan, R.G. The Benefits of Lending Relationships: Evidence from Small Business Data. J. Financ. 1994, 49, 3–37. [Google Scholar] [CrossRef]
  15. Acharya, V.V.; Almeida, H.; Campello, M. Is Cash Negative Debt? A Hedging Perspective on Corporate Financial Policies. J. Financ. Intermediation 2007, 16, 515–554. [Google Scholar] [CrossRef]
  16. Hadlock, C.J.; Pierce, J.R. New Evidence on Measuring Financial Constraints: Moving Beyond the KZ Index. Rev. Financ. Stud. 2010, 23, 1909–1940. [Google Scholar] [CrossRef]
  17. Levine, R. Financial Development and Economic Growth: Views and Agenda. J. Econ. Lit. 1997, 35, 688–726. [Google Scholar]
  18. Beck, T.; Demirgüç-Kunt, A.; Maksimovic, V. Financial and Legal Constraints to Growth: Does Firm Size Matter? J. Financ. 2005, 60, 137–177. [Google Scholar] [CrossRef]
  19. Sun, G.; Ling, Z.; Li, Y.; Xie, C. Artificial intelligence and financial fraud. Pac.-Basin Financ. J. 2025, 93, 102830. [Google Scholar] [CrossRef]
  20. Berg, T.; Burg, V.; Gombović, A.; Puri, M. On the Rise of FinTechs: Credit Scoring Using Digital Footprints. Rev. Financ. Stud. 2020, 33, 2845–2897. [Google Scholar] [CrossRef]
  21. Almeida, H.; Campello, M.; Weisbach, M.S. The Cash Flow Sensitivity of Cash. J. Financ. 2004, 59, 1777–1804. [Google Scholar] [CrossRef]
  22. Orhangazi, Ö. Financialisation and capital accumulation in the non-financial corporate sector: A theoretical and empirical in-vestigation on the US economy: 1973–2003. Camb. J. Econ. 2008, 32, 863–886. [Google Scholar] [CrossRef]
  23. Gulen, H.; Ion, M. Policy uncertainty and corporate investment. Rev. Financ. Stud. 2016, 29, 523–564. [Google Scholar] [CrossRef]
  24. Kim, H.; Kung, H. The asset redeployability channel: How uncertainty affects corporate investment. Rev. Financ. Stud. 2017, 30, 245–280. [Google Scholar] [CrossRef]
  25. Jin, X.M.; Mai, Y.; Cheung, A.W.K. Corporate financialization and fixed investment rate: Evidence from China. Financ. Res. Lett. 2022, 48, 102898. [Google Scholar] [CrossRef]
  26. Zhen, H.; Wang, X.; Fang, H. Administrative protection of intellectual property and firms’ digital transformation. Econ. Res. J. 2023, 58, 62–79. [Google Scholar]
  27. Liu, X.; Liu, F. Environmental regulation and corporate financial asset allocation: A natural experiment from the new environmental protection law in China. Financ. Res. Lett. 2022, 47, 102974. [Google Scholar] [CrossRef]
  28. Zhou, Z.; Xu, L.; Guo, P.; Ai, H. Environmental regulation and corporate financialization: Insight from Blue Sky Protection Campaign in China. Environ. Sci. Pollut. Res. 2023, 30, 54993–55008. [Google Scholar] [CrossRef]
  29. Tao, L.; Chen, L.; Li, K. Corporate Financialization, Financing Constraints, and Environmental Investment. Sustainability 2021, 13, 14040. [Google Scholar] [CrossRef]
Figure 1. Parallel Trend Test. The solid dots are the estimated coefficients, and the two ends of the lines represent the 5th and 95th confidence level for estimated coefficients.
Sustainability 18 03697 g001
Figure 2. Placebo test chart.
Sustainability 18 03697 g002
Table 1. Descriptive statistics.
VariablesMeanSdMinMaxCount
F i n i t 0.050.090.000.4746,346
D I D i t 0.440.500.001.0046,346
S i z e i t 22.141.3019.7826.1946,346
L e v i t 0.420.210.050.8946,346
I n d e p i t 0.380.050.310.5746,346
D u a l i t 0.300.460.001.0046,346
P o l l u t e i t 0.220.420.001.0046,346
F i x e d i t 0.210.160.000.6946,346
I n t a n g i b l e i t 0.040.050.000.3246,346
L i s t A g e i t 2.010.950.003.3746,346
F i n L e v i t 1.610.480.712.6346,346
D i g T r a n s i t 21.3645.350.00277.0046,346
S A i t −3.820.27−4.52−3.1346,346
E P I n s z t 0.200.400.001.0046,346
E a s t i t 0.710.450.001.0046,346
Table 2. Baseline Regression Analysis.
(1)(2)
F i n i t F i n i t
D I D i t 0.007 ***0.008 ***
(0.002)(0.002)
S i z e i t −0.008 ***
(0.001)
L e v i t −0.043 ***
(0.005)
I n d e p i t −0.009
(0.012)
D u a l i t −0.001
(0.001)
P o l l u t e i t 0.003
(0.004)
F i x e d i t −0.071 ***
(0.006)
I n t a n g i b l e i t −0.136 ***
(0.017)
L i s t A g e i t 0.022 ***
(0.002)
Constant0.046 ***0.228 ***
(0.001)(0.032)
Year FEYesYes
Firm FEYesYes
Observations46,34646,346
R-sq0.6400.653
adj. R-sq0.5970.610
Standard errors in parentheses; *** p < 0.01.
Table 3. Instrumental variable test results.
(1)(2)
First StageSecond Stage
D I D i t F i n i t
E P I n s z t 0.028 ***
(0.002)
D I D i t 0.008 **
(0.004)
ControlYesYes
Year FEYesYes
Firm FEYesYes
R-squared0.7990.737
Observations46,34646,346
Standard errors in parentheses; ** p < 0.05, *** p < 0.01.
Table 4. PSM-DID regression results.
(1)(2)
Before MatchingAfter Matching
F i n i t F i n i t
D I D i t 0.008 ***0.009 ***
(0.002)(0.002)
ControlYesYes
Year FEYesYes
Firm FEYesYes
R-squared0.6530.603
Observations46,34632,813
Standard errors in parentheses; *** p < 0.01.
Table 5. Other Robustness Checks Results.
(1)(2)(3)(4)(5)
F i n i t F i n i t F i n i t F i n i t F i n i t
D I D i t 0.005 ***0.006 ***0.007 ***0.007 ***0.009 ***
(0.002)(0.002)(0.002)(0.002)(0.002)
ControlNoYesNoYesYes
Constant0.032 ***0.188 ***0.046 ***0.070 ***0.052 *
(0.000)(0.034)(0.001)(0.018)(0.009)
Year FEYesYesYesYesYes
Firm FEYesYesYesYesYes
City FENoNoYesYesNo
R-squared0.6260.6360.1590.2180.652
Observations29,59728,94246,34646,34646,346
Standard errors in parentheses; * p < 0.1, *** p < 0.01.
Table 6. Mechanism Analysis (SA).
(1)(2)
S A i t F i n i t
D I D i t −0.119 ***0.016 ***
(−0.005)(−0.002)
S A i t −0.028 ***
(−0.003)
ControlYesYes
Constant−4.023 ***−0.090 ***
(−0.09)(−0.022)
Year FEYesYes
Firm FEYesYes
R-squared0.2670.118
Observations46,34646,346
Standard errors in parentheses; *** p < 0.01.
Table 7. Results of the Moderation Effect Test.
(1)(2)
F i n i t F i n i t
D I D i t −0.0040.006 ***
(0.005)(0.002)
F i n L e v i t 0.001
(0.004)
D I D i t × F i n L e v i t 0.008 ***
(0.003)
D i g T r a n s i t −0.001 **
(0.000)
D I D i t × D i g T r a n s i t 0.001 ***
(0.000)
ControlYesYes
Constant0.227 ***0.234 ***
(0.032)(0.032)
Year FEYesYes
Firm FEYesYes
R-squared0.6530.653
Observations46,34646,346
Standard errors in parentheses; ** p < 0.05, *** p < 0.01.
Table 8. Heterogeneity Analysis (Regional).
(1)(2)
F i n i t
Eastern RegionNon-Eastern Region
D I D i t 0.011 ***0.006 *
(0.002)(0.003)
ControlYesYes
Constant0.278 ***0.157 ***
(0.041)(0.051)
Year FEYesYes
Firm FEYesYes
R-squared0.6530.651
Observations32,93313,413
Standard errors in parentheses; * p < 0.1, *** p < 0.01.
Table 9. Heterogeneity Analysis (Firm).
(1)(2)
F i n i t
Large SizeSmall Size
D I D i t 0.004 *0.012 ***
(0.002)(0.003)
ControlYesYes
Constant0.230 ***0.274 ***
(0.052)(0.059)
Year FEYesYes
Firm FEYesYes
R-squared0.7330.676
Observations23,33523,011
Standard errors in parentheses; * p < 0.1, *** p < 0.01.
Disclaimer/Publisher’s Note: The statements, opinions and data contained in all publications are solely those of the individual author(s) and contributor(s) and not of MDPI and/or the editor(s). MDPI and/or the editor(s) disclaim responsibility for any injury to people or property resulting from any ideas, methods, instructions or products referred to in the content.