

How Green Value Co-Creation and Perceived Greenwashing Affect Customer Brand Advocacy in Vietnam’s Tourism Industry


Abstract
1. Introduction
2. Materials and Methods
2.1. Materials
2.1.1. Green Value Co-Creation Behavior
2.1.2. Perceived Green Empowerment
2.1.3. Experience Value
2.1.4. Satisfaction
2.1.5. Brand Advocacy
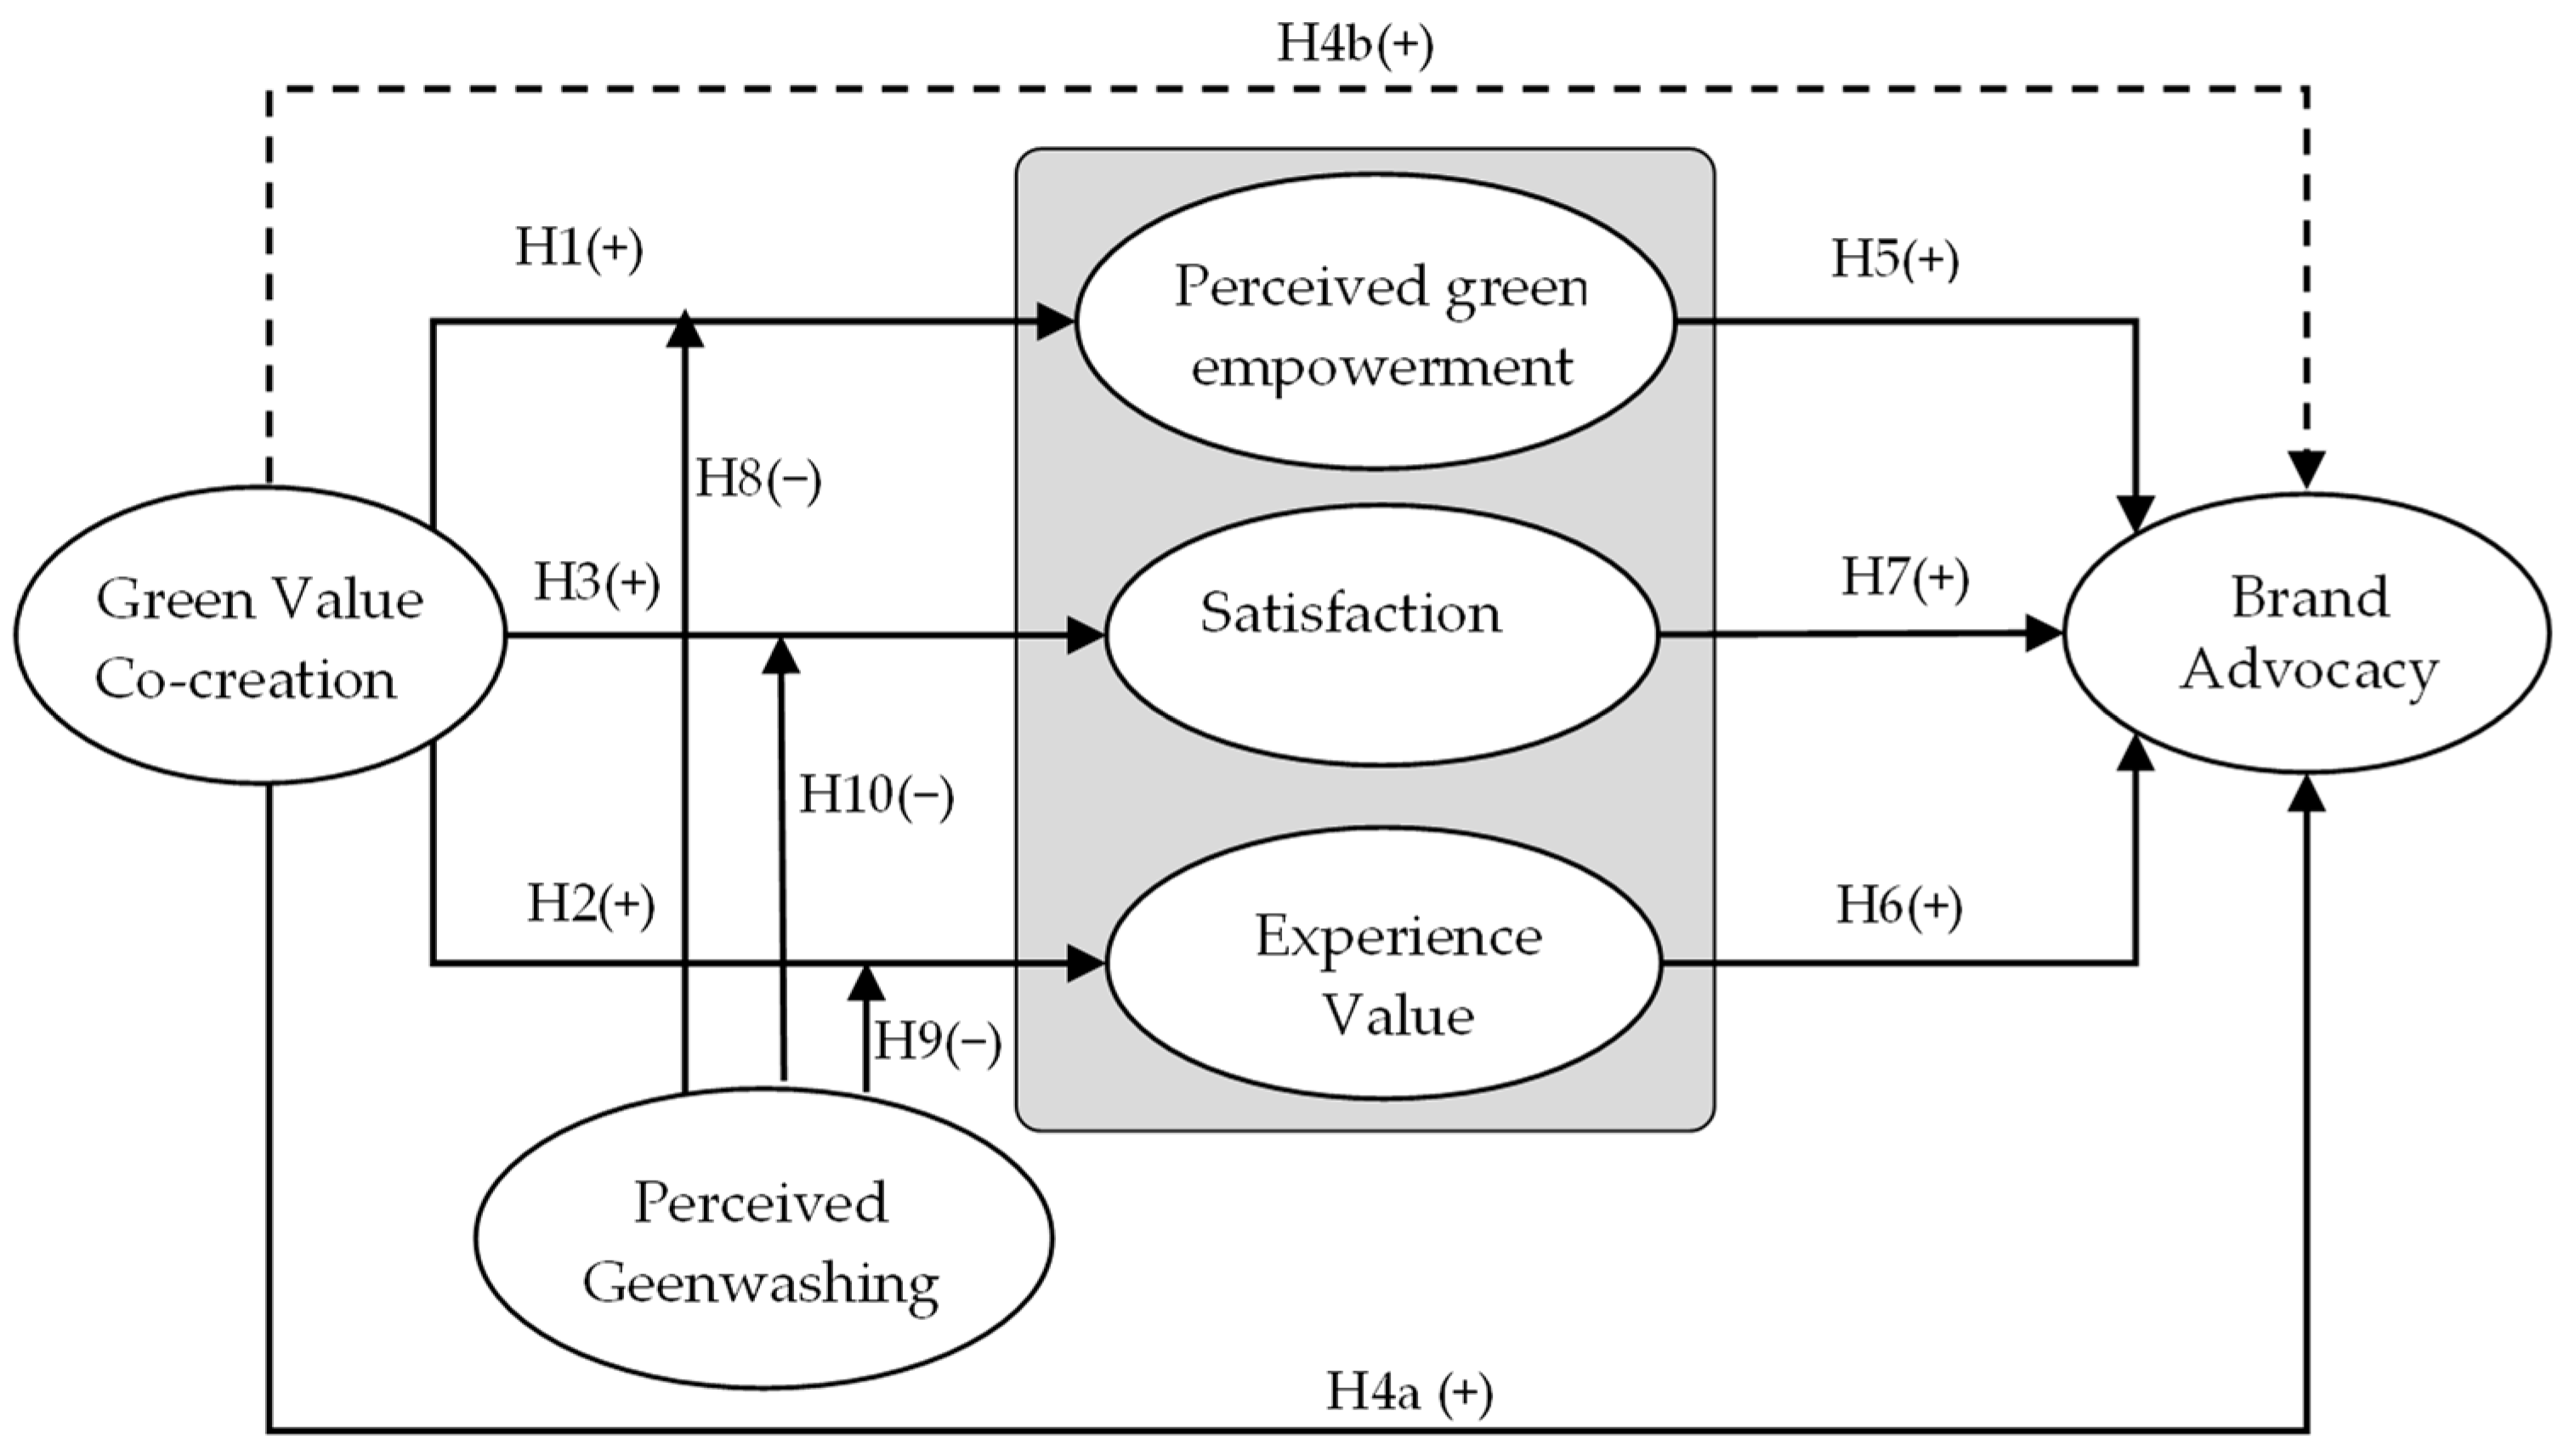
2.1.6. Relationships Between Green Value Co-Creation, Perceived Green Empowerment, Experience Value, Satisfaction and Brand Advocacy
2.1.7. Greenwashing and Its Moderating Role
2.2. Research Methodology
2.2.1. Research Context
2.2.2. Data Collection and Research Sample
2.2.3. Variable Measurement and Regression Method
3. Results
4. Discussion
5. Conclusions
Author Contributions
Funding
Institutional Review Board Statement
Informed Consent Statement
Data Availability Statement
Conflicts of Interest
References
- Normann, R.; Ramirez, R. From value chain to value constellation: Designing interactive strategy. Harv. Bus. Rev. 1993, 71, 65–77. [Google Scholar]
- Hoyer, W.D.; Chandy, R.; Dorotic, M.; Krafft, M.; Singh, S.S. Consumer cocreation in new product development. J. Serv. Res. 2010, 13, 283–296. [Google Scholar] [CrossRef]
- Chathoth, P.; Altinay, L.; Harrington, R.J.; Okumus, F.; Chan, E.S. Co-production versus co-creation: A process based continuum in the hotel service context. Int. J. Hosp. Manag. 2013, 32, 11–20. [Google Scholar] [CrossRef]
- Vargo, S.L.; Lusch, R.F. Evolving to a new dominant logic for marketing. J. Mark. 2004, 68, 1–17. [Google Scholar] [CrossRef]
- Solakis, K.; Katsoni, V.; Mahmoud, A.B.; Grigoriou, N. Factors affecting value co-creation through artificial intelligence in tourism: A general literature review. J. Tour. Futures 2022, 10, 116–130. [Google Scholar] [CrossRef]
- Füller, J.; Bilgram, V. The moderating effect of personal features on the consequences of an enjoyable co-creation experience. J. Prod. Brand Manag. 2017, 26, 386–401. [Google Scholar] [CrossRef]
- Lusch, R.F.; Vargo, S.L. Service-dominant logic: Reactions, reflections and refinements. Mark. Theory 2006, 6, 281–288. [Google Scholar] [CrossRef]
- Payne, A.F.; Storbacka, K.; Frow, P. Managing the co-creation of value. J. Acad. Mark. Sci. 2008, 36, 83–96. [Google Scholar] [CrossRef]
- Antón, C.; Camarero, C.; Garrido, M.-J. Exploring the experience value of museum visitors as a co-creation process. Curr. Issues Tour. 2018, 21, 1406–1425. [Google Scholar] [CrossRef]
- World Travel & Tourism Council. WTTC Unveils World-First Global Travel & Tourism Climate Footprint Data. 2022. Available online: https://wttc.org/news/wttc-unveils-industry-leading-and-ground-breaking-global-travel-and-tourism-sustainability-data (accessed on 2 March 2026).
- Circular Ecology. The Carbon Emissions of Staying in a Hotel. 2022. Available online: https://circularecology.com/news/the-carbon-emissions-of-staying-in-a-hotel (accessed on 2 March 2026).
- Alliance, S.H. Water Stewardship for Hotel Companies. 2022. Available online: https://sustainablehospitalityalliance.org/wp-content/uploads/2020/06/Water-Stewardship-for-Hotel-Companies-2018.pdf (accessed on 2 March 2026).
- Greenview. Green Lodging Trends Report 2022. Available online: https://greenview.sg/resources/green-lodging-trends-report/ (accessed on 2 March 2026).
- Prahalad, C.K.; Ramaswamy, V. Co-creating unique value with customers. Strategy Leadersh. 2004, 32, 4–9. [Google Scholar] [CrossRef]
- Vargo, S.L.; Lusch, R.F. Institutions and axioms: An extension and update of service-dominant logic. J. Acad. Mark. Sci. 2016, 44, 5–23. [Google Scholar] [CrossRef]
- Lyu, J.; Cao, K.; Yang, S. The impact of value co-creation behavior on customers’ experiences with and loyalty to P2P accommodations. Front. Psychol. 2022, 13, 988318. [Google Scholar] [CrossRef]
- Prebensen, N.K.; Kim, H.; Uysal, M. Cocreation as moderator between the experience value and satisfaction relationship. J. Travel Res. 2016, 55, 934–945. [Google Scholar] [CrossRef]
- Assiouras, I.; Skourtis, G.; Giannopoulos, A.; Buhalis, D.; Koniordos, M. Value co-creation and customer citizenship behavior. Ann. Tour. Res. 2019, 78, 102742. [Google Scholar] [CrossRef]
- Guo, Y.; Wang, L.; Yang, Q. Do corporate environmental ethics influence firms’ green practice? The mediating role of green innovation and the moderating role of personal ties. J. Clean. Prod. 2020, 266, 122054. [Google Scholar] [CrossRef]
- Laud, G.; Karpen, I.O. Value co-creation behaviour-role of embeddedness and outcome considerations. J. Serv. Theory Pract. 2017, 27, 778–807. [Google Scholar] [CrossRef]
- Yi, Y.; Gong, T. Customer value co-creation behavior: Scale development and validation. J. Bus. Res. 2013, 66, 1279–1284. [Google Scholar] [CrossRef]
- Ramani, G.; Kumar, V. Interaction orientation and firm performance. J. Mark. 2008, 72, 27–45. [Google Scholar] [CrossRef]
- Alshibly, H.; Chiong, R. Customer empowerment: Does it influence electronic government success? A citizen-centric perspective. Electron. Commer. Res. Appl. 2015, 14, 393–404. [Google Scholar] [CrossRef]
- Xie, L.; Li, D.; Keh, H.T. Customer participation and well-being: The roles of service experience, customer empowerment and social support. J. Serv. Theory Pract. 2020, 30, 557–584. [Google Scholar] [CrossRef]
- Han, X.; Fang, S.; Xie, L.; Yang, J. Service fairness and customer satisfaction: Mediating role of customer psychological empowerment. J. Contemp. Mark. Sci. 2019, 2, 50–62. [Google Scholar] [CrossRef]
- Auh, S.; Menguc, B.; Katsikeas, C.S.; Jung, Y.S. When does customer participation matter? An empirical investigation of the role of customer empowerment in the customer participation-performance link. J. Mark. Res. 2019, 56, 1012–1033. [Google Scholar] [CrossRef]
- Verhoef, P.C.; Lemon, K.N.; Parasuraman, A.; Roggeveen, A.; Tsiros, M.; Schlesinger, L.A. Customer experience creation: Determinants, dynamics and management strategies. J. Retail. 2009, 85, 31–41. [Google Scholar] [CrossRef]
- Nadeem, W.; Tan, T.M.; Tajvidi, M.; Hajli, N. How do experiences enhance brand relationship performance and value co-creation in social commerce? The role of consumer engagement and self brand-connection. Technol. Forecast. Soc. Change 2021, 171, 120952. [Google Scholar] [CrossRef]
- Zhang, Y.; Liu, Y.; Tao, W. The Influence of Tourists’ Online Value Co-creation Behavior on Consumer-Brand Relationship Quality: The Moderating Effect of Altruism. Front. Psychol. 2022, 13, 950546. [Google Scholar] [CrossRef]
- Cheng, H.; Liu, Q.; Bi, J.-W. Perceived crowding and festival experience: The moderating effect of visitor-to-visitor interaction. Tour. Manag. Perspect. 2021, 40, 100888. [Google Scholar] [CrossRef]
- Varshneya, G.; Das, G. Experiential value: Multi-item scale development and validation. J. Retail. Consum. Serv. 2017, 34, 48–57. [Google Scholar] [CrossRef]
- Bitner, M.J.; Hubbert, A.R. Encounter satisfaction versus overall satisfaction versus quality. In Service Quality: New Directions in Theory and Practice; Sage Publications: Thousand Oaks, CA, USA, 1994; pp. 72–94. [Google Scholar]
- Reid, M. IMC-performance relationship: Further insight and evidence from the Australian marketplace. Int. J. Advert. 2003, 22, 227–248. [Google Scholar] [CrossRef]
- Hennig-Thurau, T. Customer orientation of service employees: Its impact on customer satisfaction, commitment, and retention. Int. J. Serv. Ind. Manag. 2004, 15, 460–478. [Google Scholar] [CrossRef]
- East, R.; Hammond, K.; Lomax, W. Measuring the impact of positive and negative word of mouth on brand purchase probability. Int. J. Res. Mark. 2008, 25, 215–224. [Google Scholar] [CrossRef]
- Rini, E.; Sembiring, B. The effect of customer engagement and brand advocacy on brand value co-creation. In Proceedings of the 19th International Symposium on Management (INSYMA 2022), Surabaya, Indonesia, 23–24 March 2022. [Google Scholar]
- Khamwon, A.; Masri, P. Brand experience, brand love, and brand advocacy: A case of premium smartphone. Int. J. Technol. Manag. Inf. Syst. 2020, 2, 21–26. [Google Scholar]
- Ahmadi, A.; Ataei, A. Emotional attachment: A bridge between brand reputation and brand advocacy. Asia-Pac. J. Bus. Adm. 2024, 16, 1–20. [Google Scholar] [CrossRef]
- Jillapalli, R.K.; Wilcox, J.B. Professor brand advocacy: Do brand relationships matter? J. Mark. Educ. 2010, 32, 328–340. [Google Scholar] [CrossRef]
- Walz, A.M.; Celuch, K.G. The effect of retailer communication on customer advocacy: The moderating role of trust. J. Consum. Satisf. Dissatisf. Complain. Behav. 2010, 23, 95–110. [Google Scholar]
- Schultz, D.E.; Bailey, S.E. Customer/brand loyalty in an interactive marketplace. J. Advert. Res. 2000, 40, 1–12. [Google Scholar] [CrossRef]
- Sride, P.; Pounglek, W. The Influence of Service Quality, Brand Trust, and Customer Satisfaction Affecting Brand Advocacy of Government Hospitals in Bangkok. J. Bus. Innov. Sustain. (JBIS) 2025, 20. [Google Scholar] [CrossRef]
- Wilk, V.; Soutar, G.N.; Harrigan, P. Online brand advocacy (OBA): The development of a multiple item scale. J. Prod. Brand Manag. 2020, 29, 415–429. [Google Scholar] [CrossRef]
- Melancon, J.P.; Noble, S.M.; Noble, C.H. Managing rewards to enhance relational worth. J. Acad. Mark. Sci. 2011, 39, 341–362. [Google Scholar] [CrossRef]
- Speer, P.W.; Peterson, N.A.; Armstead, T.L.; Allen, C.T. The influence of participation, gender and organizational sense of community on psychological empowerment: The moderating effects of income. Am. J. Community Psychol. 2013, 51, 103–113. [Google Scholar] [CrossRef] [PubMed]
- Zimmerman, M.A.; Rappaport, J. Citizen participation, perceived control, and psychological empowerment. Am. J. Community Psychol. 1988, 16, 725–750. [Google Scholar] [CrossRef] [PubMed]
- Cermak, D.S.; File, K.M.; Prince, R.A. Customer participation in service specification and delivery. J. Appl. Bus. Res. 1994, 10, 90. [Google Scholar] [CrossRef]
- Tchorek, G.; Brzozowski, M.; Dziewanowska, K.; Allen, A.; Kozioł, W.; Kurtyka, M.; Targowski, F. Social capital and value co-creation: The case of a polish car sharing company. Sustainability 2020, 12, 4713. [Google Scholar] [CrossRef]
- Bu, Q.; Jin, Y.; Li, Z. How does a customer prefer community or brand? The impacts of customer experience on customer loyalty based on the perspective of value co-creation. J. Contemp. Mark. Sci. 2020, 3, 281–302. [Google Scholar] [CrossRef]
- Dong, B.; Sivakumar, K. Customer participation in services: Domain, scope, and boundaries. J. Acad. Mark. Sci. 2017, 45, 944–965. [Google Scholar] [CrossRef]
- Chan, K.W.; Yim, C.K.; Lam, S.S. Is customer participation in value creation a double-edged sword? Evidence from professional financial services across cultures. J. Mark. 2010, 74, 48–64. [Google Scholar] [CrossRef]
- Woratschek, H.; Horbel, C.; Popp, B. Determining customer satisfaction and loyalty from a value co-creation perspective. Serv. Ind. J. 2020, 40, 777–799. [Google Scholar] [CrossRef]
- Barnes, S.J.; Vidgen, R.T. Technology socialness and Web site satisfaction. Technol. Forecast. Soc. Change 2014, 89, 12–25. [Google Scholar] [CrossRef]
- Lee, D. Strategies for technology-driven service encounters for patient experience satisfaction in hospitals. Technol. Forecast. Soc. Change 2018, 137, 118–127. [Google Scholar] [CrossRef]
- Harrigan, P.; Roy, S.K.; Chen, T. Do value cocreation and engagement drive brand evangelism? Mark. Intell. Plan. 2021, 39, 345–360. [Google Scholar] [CrossRef]
- Bilro, R.G.; Loureiro, S.M.C. I am feeling so good! Motivations for interacting in online brand communities. J. Res. Interact. Mark. 2023, 17, 61–77. [Google Scholar] [CrossRef]
- Opata, C.N.; Xiao, W.; Nusenu, A.A.; Tetteh, S.; Asante Boadi, E. The impact of value co-creation on satisfaction and loyalty: The moderating effect of price fairness (empirical study of automobile customers in Ghana). Total Qual. Manag. Bus. Excell. 2021, 32, 1167–1181. [Google Scholar] [CrossRef]
- Chen, S.C.; Raab, C.; Tanford, S. Antecedents of mandatory customer participation in service encounters: An empirical study. Int. J. Hosp. Manag. 2015, 46, 65–75. [Google Scholar] [CrossRef]
- Füller, J.; Mühlbacher, H.; Matzler, K.; Jawecki, G. Consumer empowerment through internet-based co-creation. J. Manag. Inf. Syst. 2009, 26, 71–102. [Google Scholar] [CrossRef]
- Bendapudi, N.; Leone, R.P. Psychological implications of customer participation in co-production. J. Mark. 2003, 67, 14–28. [Google Scholar] [CrossRef]
- Merlo, O.; Eisingerich, A.B.; Auh, S. Why customer participation matters. MIT Sloan Manag. Rev. 2013, 54, 81–87. [Google Scholar]
- Rehman, S.U.; Shafiq, M. Role of brand experience in building brand loyalty: Mediating role of brand trust and brand commitment. South Asian Rev. Bus. Adm. Stud. (SABAS) 2019, 1, 41–56. [Google Scholar]
- Sommakettarin, A.; Khamwon, A. Service quality, customer experience quality, customer satisfaction and brand advocacy. Int. J. Bus. Econ. 2020, 2, 31–37. [Google Scholar]
- Bhati, R.; Verma, H.V. Antecedents of customer brand advocacy: A meta-analysis of the empirical evidence. J. Res. Interact. Mark. 2020, 14, 153–172. [Google Scholar] [CrossRef]
- Delmas, M.A.; Burbano, V.C. The drivers of greenwashing. Calif. Manag. Rev. 2011, 54, 64–87. [Google Scholar] [CrossRef]
- Parguel, B.; Benoit-Moreau, F.; Russell, C.A. Can evoking nature in advertising mislead consumers? The power of ‘executional greenwashing’. Int. J. Advert. 2015, 34, 107–134. [Google Scholar] [CrossRef]
- Lyon, T.P.; Maxwell, J.W. Greenwash: Corporate environmental disclosure under threat of audit. J. Econ. Manag. Strategy 2011, 20, 3–41. [Google Scholar] [CrossRef]
- Nyilasy, G.; Gangadharbatla, H.; Paladino, A. Perceived greenwashing: The interactive effects of green advertising and corporate environmental performance on consumer reactions. J. Bus. Ethics 2014, 125, 693–707. [Google Scholar] [CrossRef]
- Wagner, T.; Lutz, R.J.; Weitz, B.A. Corporate hypocrisy: Overcoming the threat of inconsistent corporate social responsibility perceptions. J. Mark. 2009, 73, 77–91. [Google Scholar] [CrossRef]
- Ioannou, I.; Kassinis, G.; Papagiannakis, G. The impact of perceived greenwashing on customer satisfaction and the contingent role of capability reputation. J. Bus. Ethics 2023, 185, 333–347. [Google Scholar] [CrossRef]
- Hair, J.F. Multivariate Data Analysis, 7th ed.; Pearson: London, UK, 2009. [Google Scholar]
- Tabachnick, B.G.; Fidell, L.S.; Ullman, J.B. Using Multivariate Statistics; Pearson: Boston, MA, USA, 2007; Volume 5. [Google Scholar]
- Baumgartner, H.; Homburg, C. Applications of structural equation modeling in marketing and consumer research: A review. Int. J. Res. Mark. 2014, 13, 139–161. [Google Scholar] [CrossRef]
- Cheung, F.Y.M.; To, W.M. A customer-dominant logic on service recovery and customer satisfaction. Manag. Decis. 2016, 54, 2524–2543. [Google Scholar] [CrossRef]
- Senan, N.A.M.; Al-Kahtani, S.M.; Alanazi, I.D.; AbdAlatti, A.; Alshadadi, M.A.; Alhebri, A.; Mohammad, R.A. Unveiling the linkages between greenwashing, brand hate, and negative consumer behavior: The moderating effect of environmental concern. Discov. Sustain. 2025, 6, 446. [Google Scholar] [CrossRef]


| N = 246 | |||
|---|---|---|---|
| Frequency | Percentage | ||
| Gender | Male | 118 | 47.9 |
| Female | 128 | 52.0 | |
| Age | Under 25 years old | 15 | 6.1 |
| 25–34 years old | 74 | 30.1 | |
| 35–49 years old | 109 | 44.3 | |
| 50–64 years old | 37 | 15.0 | |
| Over 65 years old | 11 | 4.5 | |
| Income (per month) | Under $500 | 5 | 2.0 |
| $500–$999 | 37 | 15.0 | |
| $1000–$1499 | 62 | 25.2 | |
| $1500–$1999 | 74 | 30.1 | |
| $2000–$2499 | 49 | 19.9 | |
| Over $2500 | 19 | 7.7 | |
| Highest level of education | High school or below | 71 | 28.9 |
| Bachelor’s degree | 110 | 44.7 | |
| Postgraduate (Master’s, Doctorate) | 65 | 26.4 | |
| Type of customer | International | 139 | 56.5 |
| Domestic | 107 | 43.5 | |
| Customer of hotels | 165 | 67.1 | |
| Customer of travel agencies | 81 | 32.9 | |
| Construct/Items | Sources | |
|---|---|---|
| GVC | Green value co-creation behavior | Yi and Gong [21] |
| GVC1 | I search for information about the company’s green practices | |
| GVC2 | I share information with staff so they can complete their green practice tasks | |
| GVC3 | I follow the company’s green practice guidelines and rules. | |
| GVC4 | I provide information and suggestions to improve the company’s green practices | |
| GVC5 | I assist other guests with green practices if they need help | |
| PGE | Perceived green empowerment | Auh et al. [26] |
| PGE 1 | I am very well aware of the ways in which my participation in the company’s green practices is benefiting the company | |
| PGE 2 | The company cares about my participation in the company’s green practices | |
| PGE 3 | My participation in the company’s green practices is very important to the company | |
| PGE 4 | The company appreciates my participation in the company’s green practices | |
| PGE 5 | The company values my participation in the company’s green practices | |
| STF | Satisfaction | Hennig-Thurau [34] |
| STF1 | I am fully satisfied with the company. | |
| STF2 | The company always fulfils my expectations. | |
| STF3 | The company has never disappointed me so far. | |
| STF4 | My experience with the company is excellent. | |
| STF5 | The company is a good one to have experience with its service | |
| EV | Experience value | Varshneya and Das [31] |
| EV1 | I experience high-quality, time-saving, and convenient green services | |
| EV2 | I derive enjoyment, pleasure, and escapism from green experiences | |
| EV3 | I gain improved status, esteem, and social approval through green choices | |
| EV4 | I maintain high trust and privacy in green commitments | |
| BA | Brand advocacy | Melancon et al. [44] |
| BA1 | I try to get my friends and family to buy the company’s products and services | |
| BA2 | I seldom miss an opportunity to tell others good things about the company | |
| BA3 | I would defend the organization to others if I heard someone speaking poorly about the company | |
| GW | Perceived greenwashing | Nyilasy et al. [68] |
| GW1 | The company omits or hides important information to make green claims sound better than they are | |
| GW2 | The company is misleadingly literal about its environmental attributes | |
| GW3 | The company is visually or graphically misleading about its environmental attributes | |
| GW4 | The company exaggerates the reality of its green features |
| Construct/Items | Cronbach’s Alpha | Corrected Item–Total Correlation | Factor Loadings |
|---|---|---|---|
| GVC | 0.839 | ||
| GVC1 | 0.727 | 0.876 | |
| GVC2 | 0.662 | 0.758 | |
| GVC3 | 0.698 | 0.859 | |
| GVC4 | 0.505 | 0.653 | |
| GVC5 | 0.628 | 0.680 | |
| PGE | 0.834 | ||
| PGE 1 | 0.700 | 0.792 | |
| PGE 2 | 0.629 | 0.821 | |
| PGE 3 | 0.684 | 0.765 | |
| PGE 4 | 0.576 | 0.747 | |
| PGE 5 | 0.579 | 0.693 | |
| STF | 0.848 | ||
| STF1 | 0.613 | 0.681 | |
| STF2 | 0.671 | 0.801 | |
| STF3 | 0.648 | 0.748 | |
| STF4 | 0.670 | 0.830 | |
| STF5 | 0.687 | 0.852 | |
| EV | 0.788 | ||
| EV1 | 0.624 | 0.766 | |
| EV2 | 0.620 | 0.787 | |
| EV3 | 0.523 | 0.674 | |
| EV4 | 0.646 | 0.854 | |
| BA | 0.718 | ||
| BA1 | 0.528 | 0.642 | |
| BA2 | 0.557 | 0.825 | |
| BA3 | 0.527 | 0.842 |
| Hypotheses | Relationships | Standardized Regression | p-Value | Conclusion | |
|---|---|---|---|---|---|
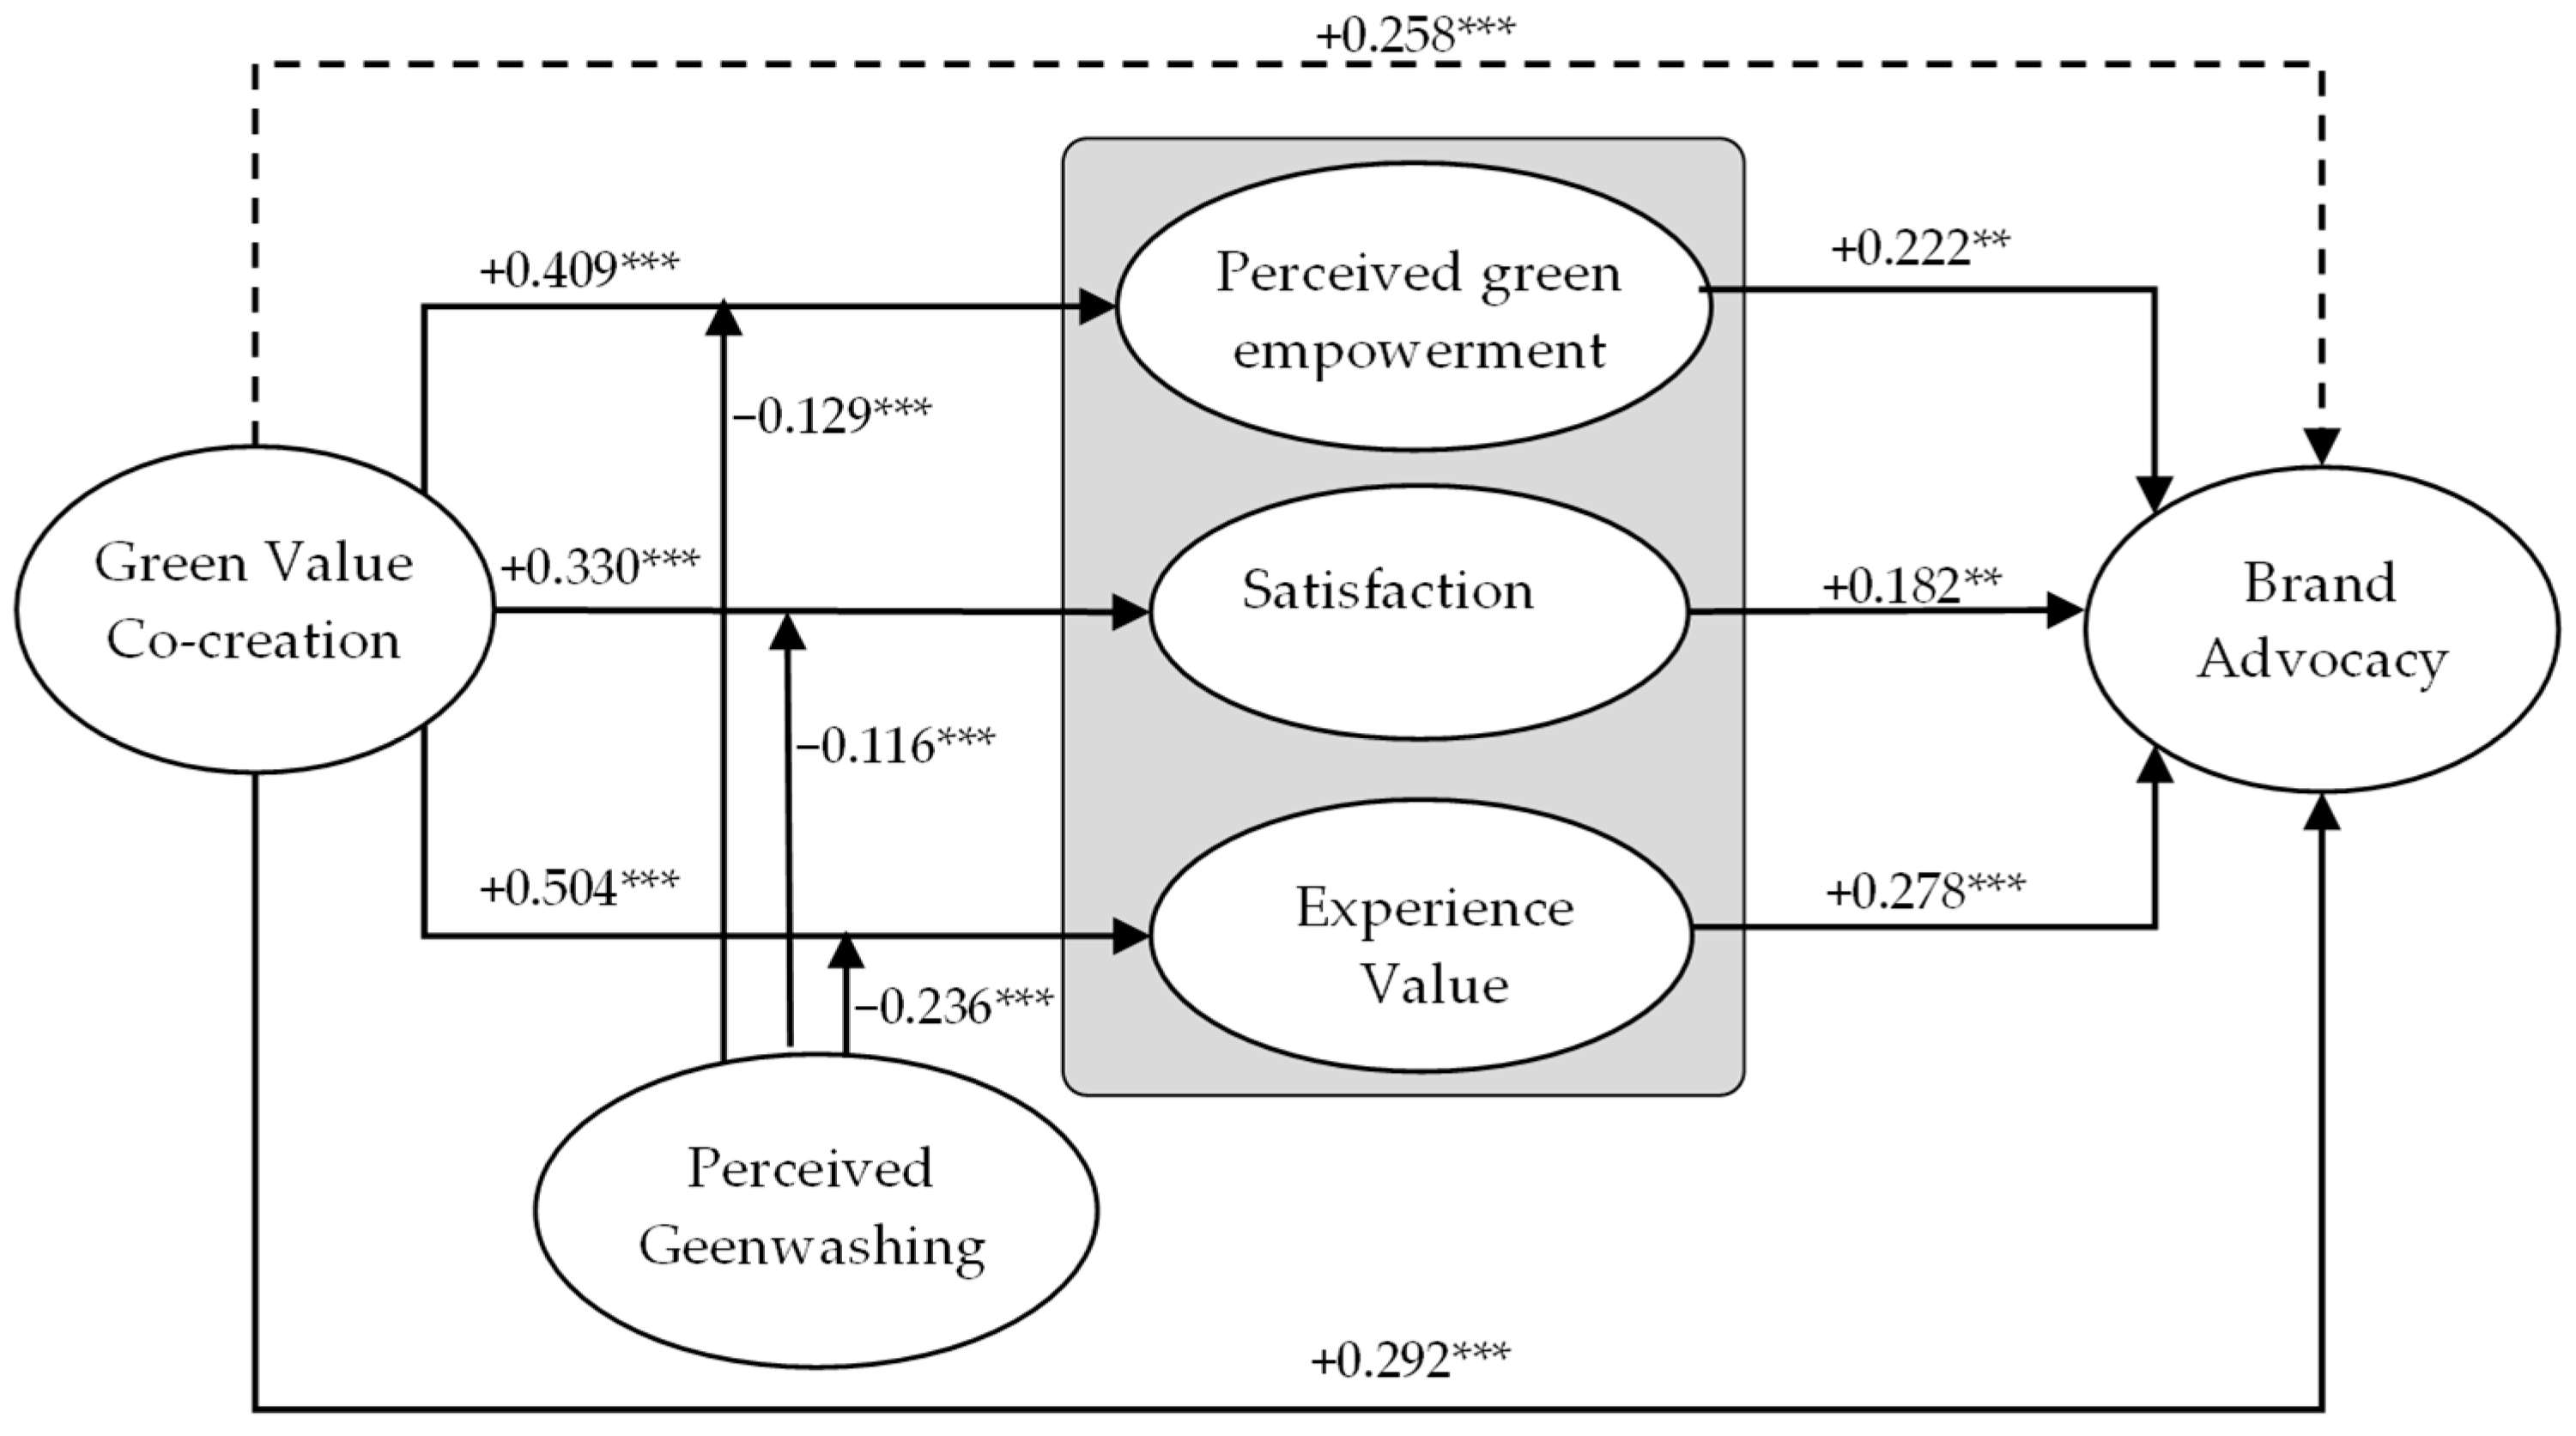
| H1 | GVC → PGE | Direct | 0.409 | 0.000 | Support |
| H2 | GVC → EV | Direct | 0.504 | 0.000 | Support |
| H3 | GVC → STF | Direct | 0.330 | 0.000 | Support |
| H4a | GVC → BA | Direct | 0.292 | 0.009 | Support |
| H4b | GVC → BA | Indirect | 0.258 | 0.001 | Support |
| GVC → BA | Total | 0.551 | 0.003 | - | |
| H5 | PGE → BA | Direct | 0.222 | 0.013 | Support |
| H6 | EV → BA | Direct | 0.278 | 0.006 | Support |
| H7 | STF → BA | Direct | 0.182 | 0.032 | Support |
| Hypotheses | Original Sample | p Values | Conclusion |
|---|---|---|---|
| H8: ZPGE ← INT | −0.129 | 0.001 | Supported |
| H9: ZEV ← INT | −0.236 | 0.001 | Supported |
| H10: ZSTF ← INT | −0.116 | 0.001 | Supported |
Disclaimer/Publisher’s Note: The statements, opinions and data contained in all publications are solely those of the individual author(s) and contributor(s) and not of MDPI and/or the editor(s). MDPI and/or the editor(s) disclaim responsibility for any injury to people or property resulting from any ideas, methods, instructions or products referred to in the content. |
© 2026 by the authors. Licensee MDPI, Basel, Switzerland. This article is an open access article distributed under the terms and conditions of the Creative Commons Attribution (CC BY) license.
Share and Cite
Nguyen, N.T.H.; Tran, H.T.B.; Duong, N.T.H.; Duong, H.H. How Green Value Co-Creation and Perceived Greenwashing Affect Customer Brand Advocacy in Vietnam’s Tourism Industry. Sustainability 2026, 18, 3660. https://doi.org/10.3390/su18083660
Nguyen NTH, Tran HTB, Duong NTH, Duong HH. How Green Value Co-Creation and Perceived Greenwashing Affect Customer Brand Advocacy in Vietnam’s Tourism Industry. Sustainability. 2026; 18(8):3660. https://doi.org/10.3390/su18083660
Chicago/Turabian StyleNguyen, Ngan Thi Huyen, Hang Thi Bich Tran, Nhung Thi Hong Duong, and Hanh Hong Duong. 2026. "How Green Value Co-Creation and Perceived Greenwashing Affect Customer Brand Advocacy in Vietnam’s Tourism Industry" Sustainability 18, no. 8: 3660. https://doi.org/10.3390/su18083660
APA StyleNguyen, N. T. H., Tran, H. T. B., Duong, N. T. H., & Duong, H. H. (2026). How Green Value Co-Creation and Perceived Greenwashing Affect Customer Brand Advocacy in Vietnam’s Tourism Industry. Sustainability, 18(8), 3660. https://doi.org/10.3390/su18083660